Embed Size (px)
Citation preview
Cost, Performance and Maturity of Electricity Storage Technologies Course No: R05-002
Credit: 5 PDH
Mark Rossow, PhD, PE, Retired
Continuing Education and Development, Inc. 9 Greyridge Farm Court Stony Point, NY 10980 P: (877) 322-5800 F: (877) 322-4774 [email protected]

Introduction to the Study Guide
The Study Guide for the present course consists of excerpts (primarily Chapter 2, “Electricity
Storage Technologies: Cost, Performance, and Maturity”) from the “DOE/EPRI Electricity
Storage Handbook in Collaboration with NRECA,” February 2015.
The entire Handbook can be downloaded by clicking on this link, but the present course is based
solely on the material in Chapter 2.
DOE/EPRI Electricity Storage Handbook in Collaboration with NRECA
Glossary
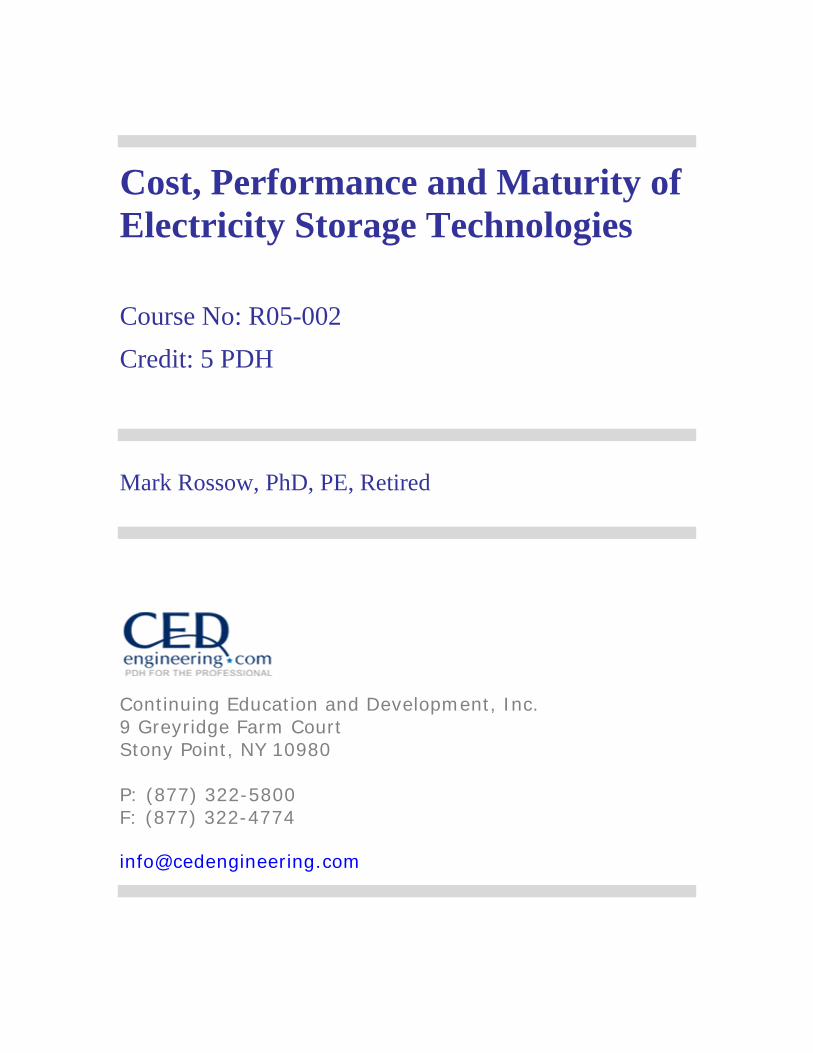
GLOSSARY
– A –AC alternating current ACE area control error AEP American Electric Power AFUDC Allowance for Funds Used During Construction AGC automatic generation control ARRA American Recovery and Reinvestment Act of 2009 AS ancillary service
– B –BPA Bonneville Power Authority
– C –CAES compressed air energy storage CAISO California Independent System Operator Calculator Lifecycle Analysis Calculator (EPRI) CCGT Combined-cycle gas turbine CES Community Energy Storage CESA California Energy Storage Alliance CO2 carbon dioxide CONE cost of new entry Co-op(s) Rural electric cooperative(s) CPUC California Public Utility Commission CT combustion turbine
– D –DAS Data Acquisition System dc direct current DESS Distributed Energy Storage System DETL Distributed Energy Technologies Laboratory DOD depth of discharge DOE U.S. Department of Energy $/kW-month dollars per kilowatt per month DR demand response DSA Dynamic Security Assessment DSCR Debt Service Coverage Ratio
– E –EES Electric Energy Storage EESAT Electrical Energy Storage Applications and Technologies EMC electromagnetic compatibility EPRI Electric Power Research Institute ERCOT Electric Reliability Council of Texas ESA Electricity Storage Association
xix Rev. 1, February 2015
DOE/EPRI Electricity Storage Handbook in Collaboration with NRECA
Glossary
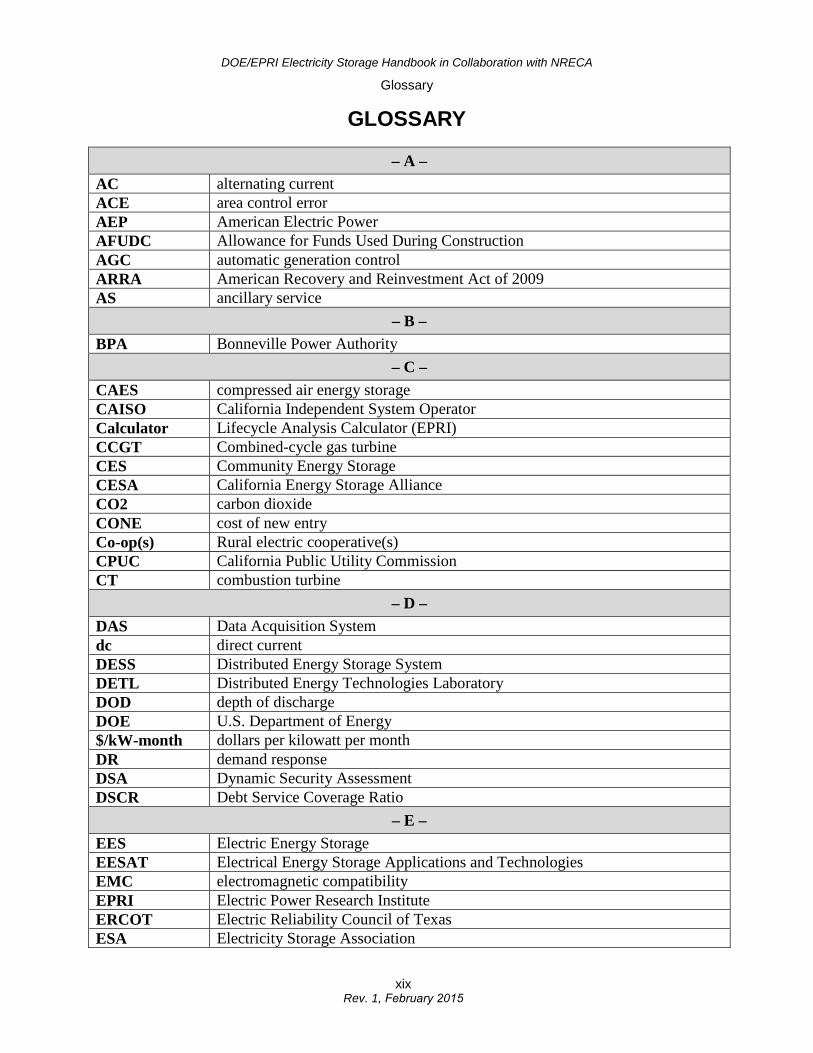
ESAL Energy Storage Analysis Laboratory ESCO energy service company ESCT Energy Storage Computational Tool ESIF Energy Systems Integration Facility ESPTL Energy Storage Performance Test Laboratory ESS Energy Storage Systems or Electricity Storage Systems ESTF Energy Storage Test Facility ESTP Energy Storage Test Pad ESVT Energy Storage Valuation Tool ETT Electric Transmission Texas EV Electric Vehicle
– F –Fe-Cr Iron-chromium FERC Federal Energy Regulatory Commission
– G –G & T generation and transmission GE General Electric GHG greenhouse gas GST Grid Storage Technologies GW gigawatts
– H–H-APU Hybrid Ancillary Power Unit Handbook Electricity Storage Handbook HCEI Hawaii Clean Energy Initiative hr hour Hz hertz
– I –IDC Interest During Construction ILZRO International Lead Zinc Research Organization IPP Independent Power Producer IR infrared ISO Independent System Operator ISO-NE Independent System Operator – New England IOU Investor Owned Utility
– J –JCP&L Jersey Central Power and Light Company
– K –KIUC Kauai Island Utility Cooperative kW kilowatt kWh kilowatt hour
xx Rev. 1, February 2015

DOE/EPRI Electricity Storage Handbook in Collaboration with NRECA
Glossary
– L –LA lead-acid LCOE levelized cost of energy Li lithium LMP locational marginal pricing LSEs load-serving entities
– M –MMBtu one million Btu Muni municipal electric utility MVAR mega volt-ampere reactive MW megawatt MWh megawatt hour
– N –Na sodium Na2S5 sodium pentasulfide NaCl salt NaAlCl4 sodium ion conductive salt NaS sodium sulfur NAS™ registered trademark for NGK Insulators, Ltd. sodium sulfur batter NEC National Electrical Code NEDO New Energy Development Organization NERC North American Electric Reliability Council NESC National Electric Safety Code NETL National Energy Technology Laboratory Ni nickel NiCl2 nickel chloride NIST National Institute of Standards and Technology NISTIR National Institute of Standards and Technology Interagency Report NiMH nickel metal-hydride NOx nitrogen oxides NPV Net Present Value NRECA National Rural Electric Cooperative Association NREL National Renewable Energy Laboratory NYISO New York Independent System Operator NYSERDA New York State Energy and Development Authority
– O –O & M Operations and Maintenance OE (DOE) Office of Electricity Delivery and Energy Reliability OEM original equipment manufacturer OIR
– P –PbO2 lead dioxide
xxi Rev. 1, February 2015
DOE/EPRI Electricity Storage Handbook in Collaboration with NRECA
Glossary
PCS power conversion system or power conditioning system PCT Patent Cooperation Treaty PG&E Pacific Gas and Electric PEV plug-in electric vehicle PHEV plug-in hybrid electric vehicle PHES pumped hydroelectric energy storage PJM PJM Interconnection, LLC PNM Public Service Company of New Mexico PNNL Pacific Northwest National Laboratory PQ power quality PREPA Puerto Rico Electric Power Authority PSLF Positive Sequence Load Flow PUC Public Utility Commission PV photovoltaic Pb-acid Lead Acid Battery
– Q –No “Q” terms
– R –R&D research and development Redox reduction and oxidation RFI Request for Information RFP Request for Proposals RFQ Request for Quote RPS Renewable Portfolio Standards RTO Regional Transmission Organization
– S –SCADA Supervisory Control and Data Acquisition SCE Southern California Edison SCR Selective Catalytic Reduction SDG&E San Diego Gas and Electric SGIP Self-generating Incentive Program SMD Standard Market Design SNL Sandia National Laboratories
– T –T&D transmission and distribution TCOS transmission cost of service TEPCO Tokyo Electric Power Company TESA Texas Energy Storage Alliance TIEC Texas Industrial Energy Consumers TOU time of use TPC total plant cost TSP Tehachapi Wind Energy Storage TVA Tennessee Valley Authority
xxii Rev. 1, February 2015
DOE/EPRI Electricity Storage Handbook in Collaboration with NRECA
Glossary
– U –UBG Utility Battery Groups UPS uninterruptible power supply
– V–V volts VAR reactive power and volt-ampere reactive VLA vented lead-acid VPS VRB Power Systems VRLA valve regulated lead-acid
W – WACC weighted average cost of capital WECC Western Electric Coordinating Council
– X –No “X” terms
– Y –No “Y” terms
– Z –ZnBr2 zinc bromine
xxiii Rev. 1, February 2015
DOE/EPRI Electricity Storage Handbook in Collaboration with NRECA
Energy Storage 101
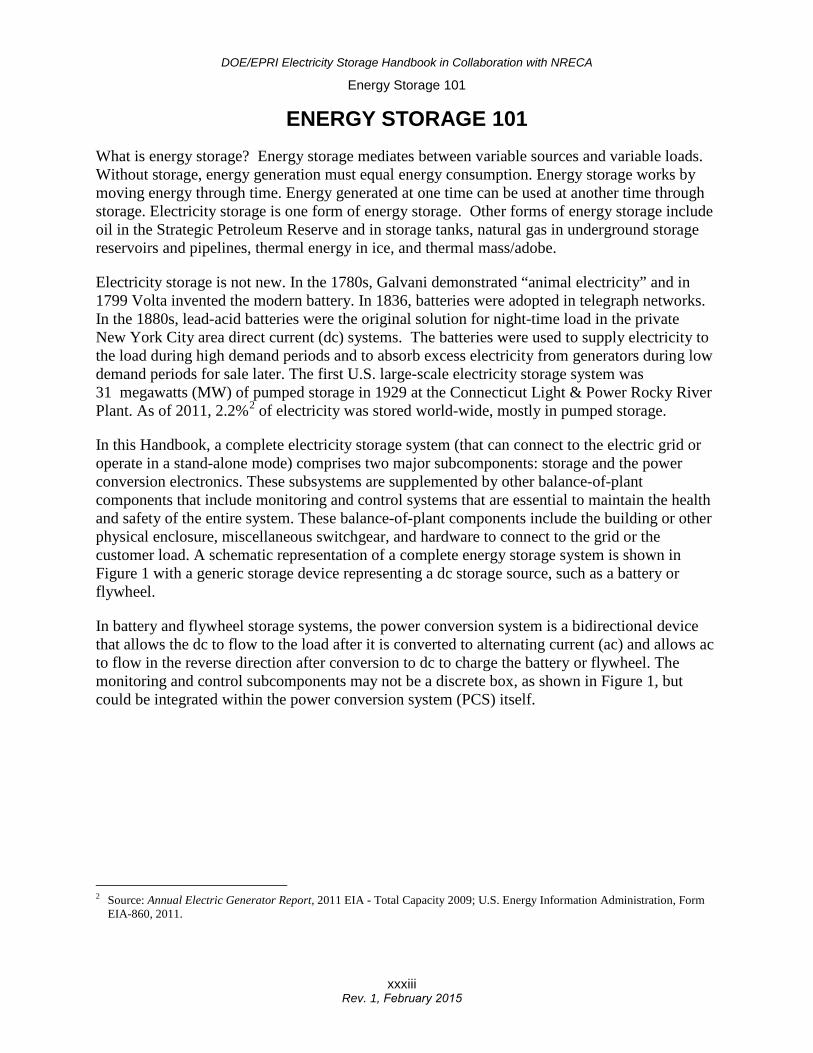
ENERGY STORAGE 101 What is energy storage? Energy storage mediates between variable sources and variable loads. Without storage, energy generation must equal energy consumption. Energy storage works by moving energy through time. Energy generated at one time can be used at another time through storage. Electricity storage is one form of energy storage. Other forms of energy storage include oil in the Strategic Petroleum Reserve and in storage tanks, natural gas in underground storage reservoirs and pipelines, thermal energy in ice, and thermal mass/adobe.
Electricity storage is not new. In the 1780s, Galvani demonstrated “animal electricity” and in 1799 Volta invented the modern battery. In 1836, batteries were adopted in telegraph networks. In the 1880s, lead-acid batteries were the original solution for night-time load in the private New York City area direct current (dc) systems. The batteries were used to supply electricity to the load during high demand periods and to absorb excess electricity from generators during low demand periods for sale later. The first U.S. large-scale electricity storage system was 31 megawatts (MW) of pumped storage in 1929 at the Connecticut Light & Power Rocky River Plant. As of 2011, 2.2%2 of electricity was stored world-wide, mostly in pumped storage.
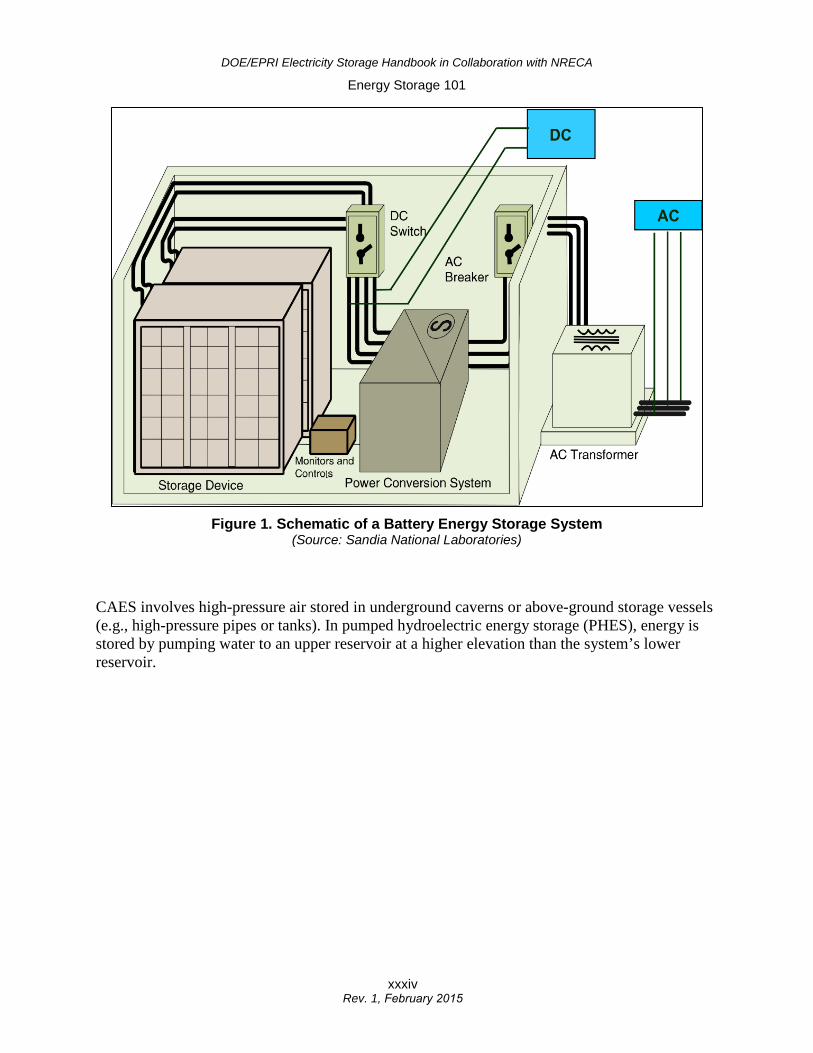
In this Handbook, a complete electricity storage system (that can connect to the electric grid or operate in a stand-alone mode) comprises two major subcomponents: storage and the power conversion electronics. These subsystems are supplemented by other balance-of-plant components that include monitoring and control systems that are essential to maintain the health and safety of the entire system. These balance-of-plant components include the building or other physical enclosure, miscellaneous switchgear, and hardware to connect to the grid or the customer load. A schematic representation of a complete energy storage system is shown in Figure 1 with a generic storage device representing a dc storage source, such as a battery or flywheel.
In battery and flywheel storage systems, the power conversion system is a bidirectional device that allows the dc to flow to the load after it is converted to alternating current (ac) and allows ac to flow in the reverse direction after conversion to dc to charge the battery or flywheel. The monitoring and control subcomponents may not be a discrete box, as shown in Figure 1, but could be integrated within the power conversion system (PCS) itself.
2 Source: Annual Electric Generator Report, 2011 EIA - Total Capacity 2009; U.S. Energy Information Administration, Form EIA-860, 2011.
xxxiii Rev. 1, February 2015
DOE/EPRI Electricity Storage Handbook in Collaboration with NRECA
Energy Storage 101
Figure 1. Schematic of a Battery Energy Storage System (Source: Sandia National Laboratories)
CAES involves high-pressure air stored in underground caverns or above-ground storage vessels (e.g., high-pressure pipes or tanks). In pumped hydroelectric energy storage (PHES), energy is stored by pumping water to an upper reservoir at a higher elevation than the system’s lower reservoir.
xxxiv Rev. 1, February 2015
DOE/EPRI Electricity Storage Handbook in Collaboration with NRECA
Chapter 2. Electricity Storage Technologies: Cost, Performance, and Maturity
CHAPTER 2. ELECTRICITY STORAGE TECHNOLOGIES: COST, PERFORMANCE, AND MATURITY
2.1 Introduction This chapter presents a review of the currently available and emerging electricity storage technologies that are anticipated to be available within the next two to three years. Emerging technologies still in the early research and development (R&D) development stage are noted in the last section of this chapter but are not reviewed in detail. The sections in this chapter are organized by technology and provide a snapshot of the status, trends in deployment, data sheets on performance, and design features. Estimates of life-cycle costs for each technology are also provided, along with the key assumptions. More detailed cost breakdowns for each technology and the cost metrics are provided in Appendix B.
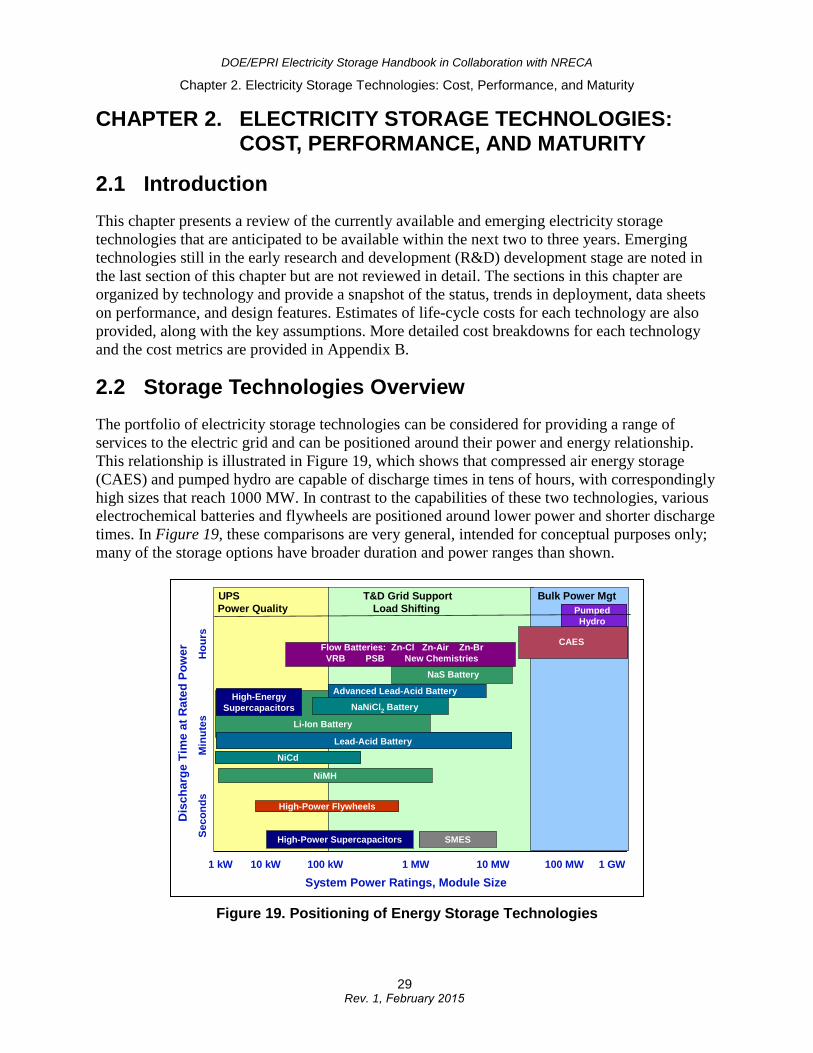
2.2 Storage Technologies Overview The portfolio of electricity storage technologies can be considered for providing a range of services to the electric grid and can be positioned around their power and energy relationship. This relationship is illustrated in Figure 19, which shows that compressed air energy storage (CAES) and pumped hydro are capable of discharge times in tens of hours, with correspondingly high sizes that reach 1000 MW. In contrast to the capabilities of these two technologies, various electrochemical batteries and flywheels are positioned around lower power and shorter discharge times. In Figure 19, these comparisons are very general, intended for conceptual purposes only; many of the storage options have broader duration and power ranges than shown.
Figure 19. Positioning of Energy Storage Technologies
Flow Batteries: Zn-Cl Zn-Air Zn-Br VRB PSB New Chemistries
NaS Battery
Li-Ion Battery
NiCd
NiMH
High-Power Flywheels
SMESHigh-Power Supercapacitors
1 kW 10 kW 100 kW 1 MW 10 MW 100 MW 1 GW
High-Energy Supercapacitors NaNiCl2 Battery
System Power Ratings, Module Size
Dis
char
ge T
ime
at R
ated
Pow
erSe
cond
s
M
inut
es
H
ours
UPS T&D Grid Support Bulk Power Mgt Power Quality Load Shifting Pumped
Hydro
CAES
Advanced Lead-Acid Battery
Lead-Acid Battery
29 Rev. 1, February 2015
DOE/EPRI Electricity Storage Handbook in Collaboration with NRECA
Chapter 2. Electricity Storage Technologies: Cost, Performance, and Maturity
Traditionally, economies of scale have dictated that pumped hydro be sized for storage times that exceed 8 to 10 hours – necessary to amortize the cost of large storage reservoirs, dams, and civil engineering work that are integral to this technology. For example, Rocky Mountain Hydroelectric Plant, the last pumped storage plant built in the United States, has over 10 hours of storage capacity and is rated at 1095 MW. Similarly, CAES requires developing large underground (naturally occurring or man-made caverns) or large steel above-ground storage reservoirs to store the compressed air. In contrast to these large sizes, flywheels and the family of batteries cluster in the lower end of the discharge duration spectrum, ranging from a few seconds to 6 hours (delivered by sodium sulfur battery systems and potentially certain flow battery systems).
Storing hot or cold fluids or phase change materials provides the basis for various thermal storage technologies that provide cooling for buildings or electricity generation. Some examples of thermal storage technologies are briefly discussed below but this version of the Handbook does not specifically include the performance characteristics or system costs of these technologies.
Ice and chilled water storage is effectively used in large and medium sized commercial buildings to reduce refrigerated air conditioning loads and is widely applied in Leadership in Energy and Environmental Design (LEED)21 certified buildings. Ice or chilled water is made and stored in large indoor or outdoor tanks using low-priced off-peak energy at night. Cooling loops running through the ice or chilled water tanks extract the cold during daytime hours to provide cooling to the building and displace the compressor and chiller motor electric loads during peak cooling hours This is a cost saving strategy for the utility or co-op customer and offers a demand-side load management strategy for the serving utility.
Alternatively, large area solar collectors can heat salts or other organic oils and store these at temperatures sufficiently high to generate steam when needed to drive turbine generators to make electricity. These systems are usually economic above several hundred megawatts, with storage times exceeding 6 to 8 hours. The size of the solar collectors and storage tank capacity determines the storage times that the system can support.
Using the Storage System Cost Information in this section comes from Appendix B and two EPRI research reports.22,23 All costs shown are in 2012 dollars and do not reflect regional cost differences across the United States. Storage system costs have a “power” and an “energy” component. The power cost component is the cost of the power conditioning system and its auxiliaries, that determines the kW or MW capability of that particular storage system, and contributes to the $/kW component of the system cost. The energy component is the cost of the storage components – battery, flywheel, or the upper reservoir capacity in pumped hydro and
21 LEED is a green building certification program that recognizes best-in-class building strategies and practices administered by The U.S. Green Building Council.
22 Energy Storage Technology and Application-Cost and Performance Data Base, EPRI ID: 1024279, EPRI, Palo Alto, CA, November 2012.
23 Electricity Energy Storage Technology Options 2012 System Cost Benchmarking, EPRI ID: 1026462, EPRI, Palo Alto, CA, December 2012.
30 Rev. 1, February 2015
DOE/EPRI Electricity Storage Handbook in Collaboration with NRECA
Chapter 2. Electricity Storage Technologies: Cost, Performance, and Maturity
related aux – that determines the kWh or MWh capability of the same system and contributes to the $/kWh of the system cost. The total cost of any storage system is the sum of these components and is specific to that system size, in MW and MWh, and is not linearly scalable in most cases due to the modularity of system’s design as offered by that particular system vendor. For example, if a particular system vendor offers a 4 MW/8 MWh system, then its cost in $/MW and $/MWh cannot be linearly extrapolated to a 6 MW/8 MWh system unless that or another system vendor offers such a system. However, the unit costs in $/MW or $/MWh would be the same for multiples of the 4 MW/8 MWh system.
Each storage technology described in this chapter also has system cost estimates presented in a uniformly similar bar chart format: present value installed cost, $/kW; levelized cost of energy in $/MWh and levelized cost of capacity, $/kW-yr. The information summarized in these charts is derived from the detailed cost database presented in Appendix B and interconnection equipment costs shown in Appendix D.
More than fifty original equipment manufacturers (OEMs), power electronics system providers, and system integrators were surveyed and asked to provide performance, cost, and O&M data for energy systems they could offer for various uses of storage. Reference electrical one-line diagrams and installation assessments were drawn for each use considered and are provided in Appendix D. Vendor responses to this survey provided the basis for the information in the data sheets provided in the subsequent sections. An iterative approach was used to review scope of supply, cost data, and operation and performance data. Given the lack of credible O&M data for some technologies, proxies were developed to estimate fixed, variable, and periodic battery replacement costs shown in affordably.
Given that certain energy storage technologies are still in the R&D stage and have not been fully developed or have not been demonstrated in the specifically intended service, process and project contingencies costs were added to develop installed costs, given the uncertainty in those cases.
Installed cost estimates were developed for the specific services and are presented per kilowatt of discharge capacity installed ($/kW installed). Levelized cost of energy (LCOE) or lifecycle cost estimates are expressed per kilowatt-hour ($/kWh) of delivered energy and per kW of discharge capacity ($/kW-yr). For technology screening-level studies, these cost estimates are conceptual estimates that will differ from site-specific project estimates for the following reasons:
Project estimates are more detailed and based on site-specific conditions and use cases. Individual companies’ design bases may vary. Actual owner costs as well as site-specific costs in project estimates are generally higher. Site-specific requirements, such as transportation, labor, interconnection, and permitting, also have an impact.
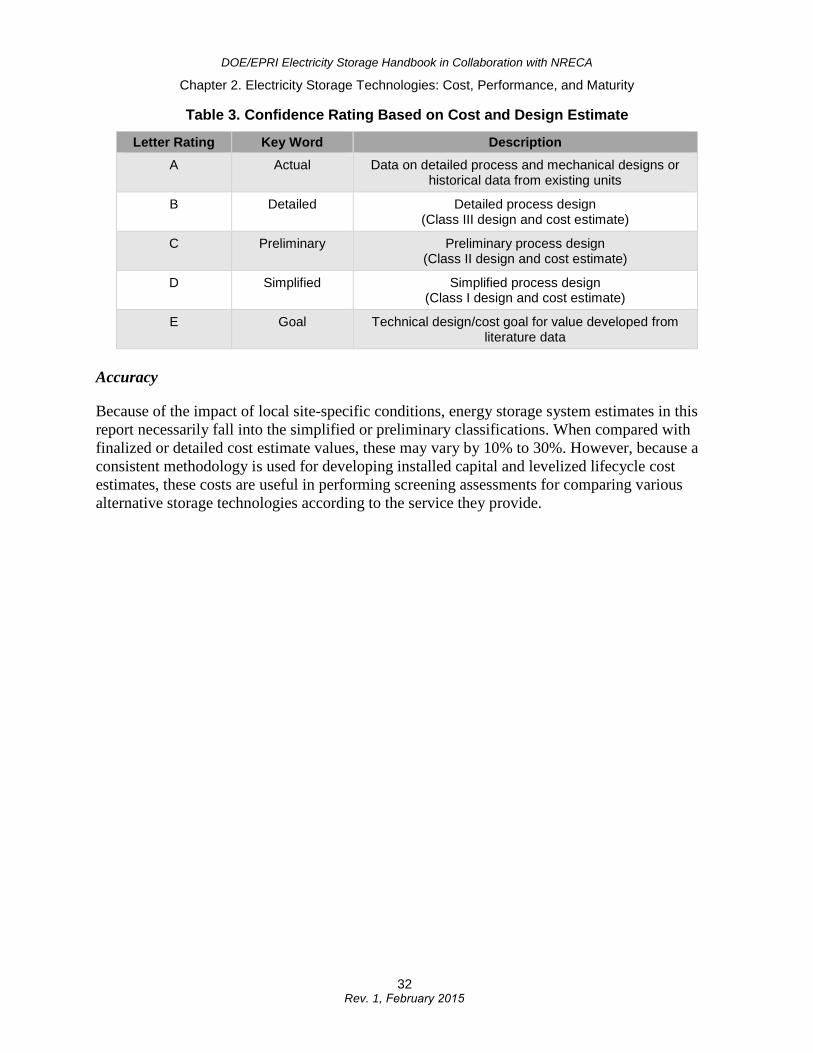
As presented in Table 3, a rating system is used to define an overall confidence level for data presented in technology screening studies. One rating approach is based on a technology’s development status; the other is based on the level of effort expended in the design and cost estimate. The confidence levels of the estimates presented in this report reflect technology development statuses ranging from early demonstration trials to mature development, with a preliminary or simplified level of effort. The rating system indicates the level of effort involved in developing the design and cost estimate.
31 Rev. 1, February 2015
DOE/EPRI Electricity Storage Handbook in Collaboration with NRECA
Chapter 2. Electricity Storage Technologies: Cost, Performance, and Maturity
Table 3. Confidence Rating Based on Cost and Design Estimate
Letter Rating Key Word Description A Actual Data on detailed process and mechanical designs or
historical data from existing units
B Detailed Detailed process design (Class III design and cost estimate)
C Preliminary Preliminary process design (Class II design and cost estimate)
D Simplified Simplified process design (Class I design and cost estimate)
E Goal Technical design/cost goal for value developed from literature data
Accuracy
Because of the impact of local site-specific conditions, energy storage system estimates in this report necessarily fall into the simplified or preliminary classifications. When compared with finalized or detailed cost estimate values, these may vary by 10% to 30%. However, because a consistent methodology is used for developing installed capital and levelized lifecycle cost estimates, these costs are useful in performing screening assessments for comparing various alternative storage technologies according to the service they provide.
32 Rev. 1, February 2015
DOE/EPRI Electricity Storage Handbook in Collaboration with NRECA
Chapter 2. Electricity Storage Technologies: Cost, Performance, and Maturity
Estimates of the range of accuracy for the cost data presented in this section are shown in Table 4, which is based on the confidence ratings described previously.
Table 4. Accuracy Range Estimates for Technology Screening Data*
Percent Accuracy in Technology Development Rating
Estimate Rating
A Mature
B Commercial
C Demo
D Pilot
E & F Lab & Idea
A Actual 0 – – – –
B Detailed -5 to +8 -10 to +15 -15 to +25 – –
C Preliminary -10 to +15 -15 to +20 -20 to +25 -25 to +40 -30 to +60
D Simplified -15 to +20 -20 to +30 -25 to +40 -30 to +50 -30 to +200
E Goal – -30 to +80 -30 to +80 -30 to +100 -30 to +200
This table indicates the overall accuracy for cost estimates. The accuracy is a function of the level of cost-estimating effort and the degree of technical development of the technology. The same ranges apply to O&M costs.
* Ranges in percent (%).
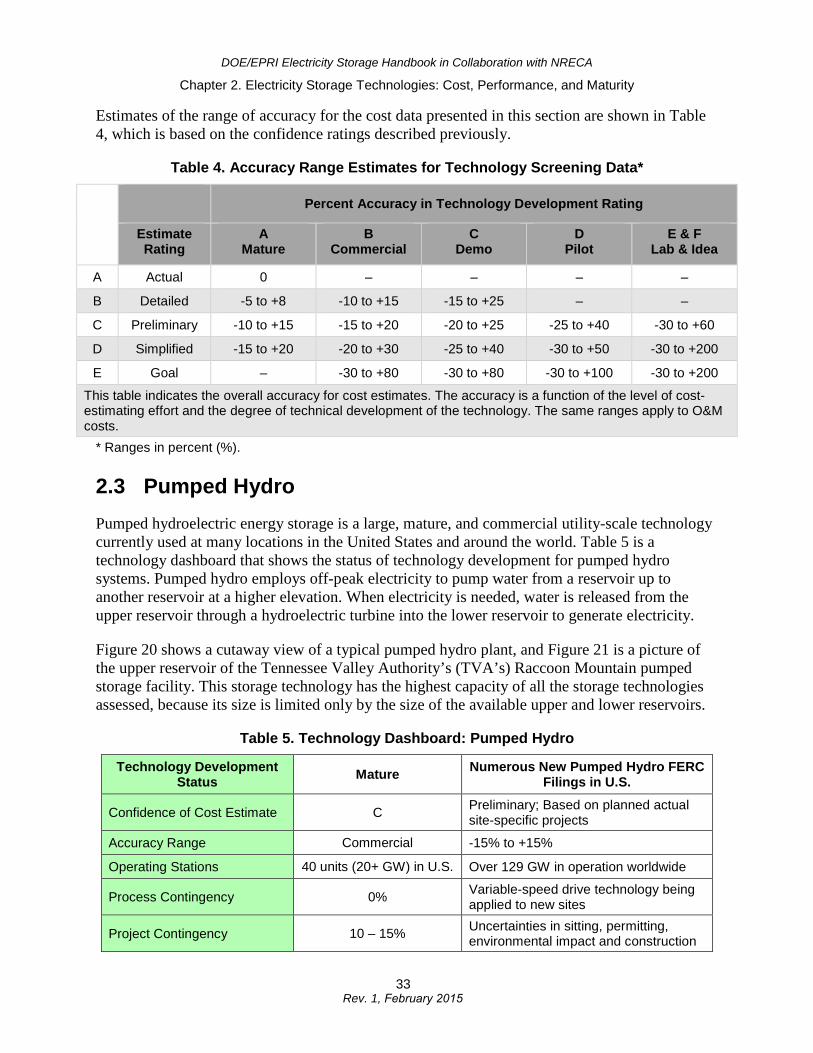
2.3 Pumped Hydro Pumped hydroelectric energy storage is a large, mature, and commercial utility-scale technology currently used at many locations in the United States and around the world. Table 5 is a technology dashboard that shows the status of technology development for pumped hydro systems. Pumped hydro employs off-peak electricity to pump water from a reservoir up to another reservoir at a higher elevation. When electricity is needed, water is released from the upper reservoir through a hydroelectric turbine into the lower reservoir to generate electricity.
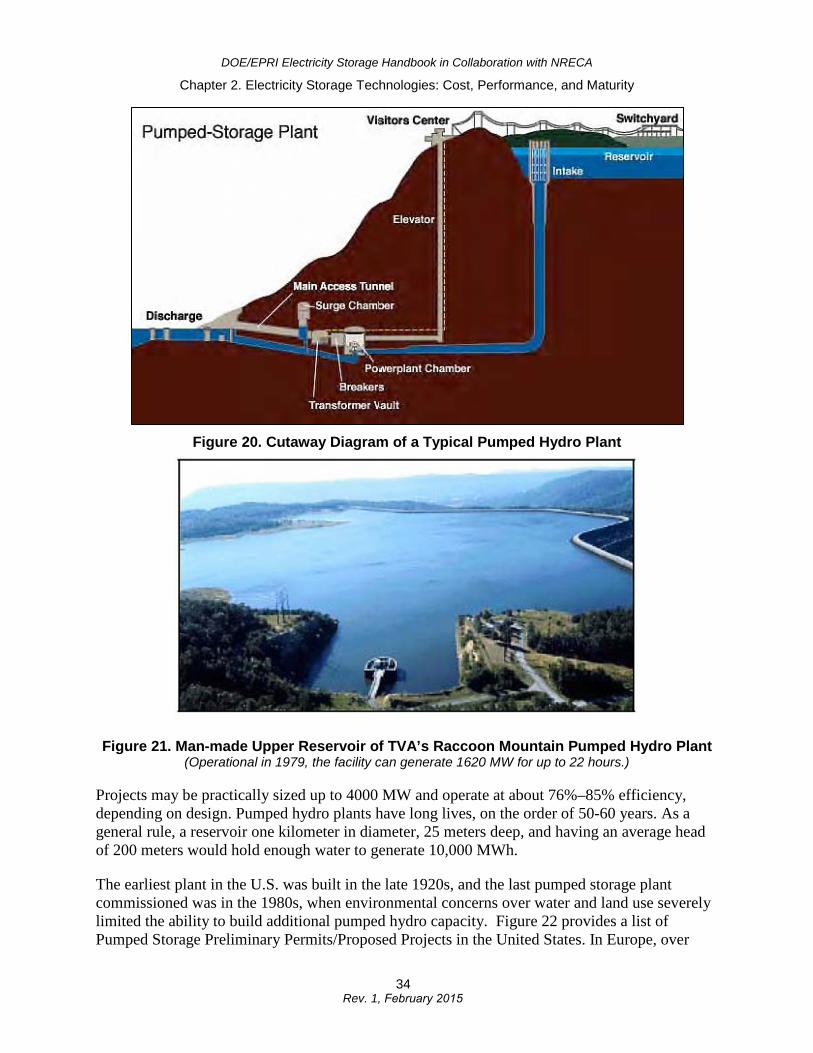
Figure 20 shows a cutaway view of a typical pumped hydro plant, and Figure 21 is a picture of the upper reservoir of the Tennessee Valley Authority’s (TVA’s) Raccoon Mountain pumped storage facility. This storage technology has the highest capacity of all the storage technologies assessed, because its size is limited only by the size of the available upper and lower reservoirs.
Table 5. Technology Dashboard: Pumped Hydro
Technology Development Status Mature Numerous New Pumped Hydro FERC
Filings in U.S.
Confidence of Cost Estimate C Preliminary; Based on planned actual site-specific projects
Accuracy Range Commercial -15% to +15%
Operating Stations 40 units (20+ GW) in U.S. Over 129 GW in operation worldwide
Process Contingency 0% Variable-speed drive technology being applied to new sites
Project Contingency 10 – 15% Uncertainties in sitting, permitting, environmental impact and construction
33 Rev. 1, February 2015
DOE/EPRI Electricity Storage Handbook in Collaboration with NRECA
Chapter 2. Electricity Storage Technologies: Cost, Performance, and Maturity
Figure 20. Cutaway Diagram of a Typical Pumped Hydro Plant
Figure 21. Man-made Upper Reservoir of TVA’s Raccoon Mountain Pumped Hydro Plant (Operational in 1979, the facility can generate 1620 MW for up to 22 hours.)
Projects may be practically sized up to 4000 MW and operate at about 76%–85% efficiency, depending on design. Pumped hydro plants have long lives, on the order of 50-60 years. As a general rule, a reservoir one kilometer in diameter, 25 meters deep, and having an average head of 200 meters would hold enough water to generate 10,000 MWh.
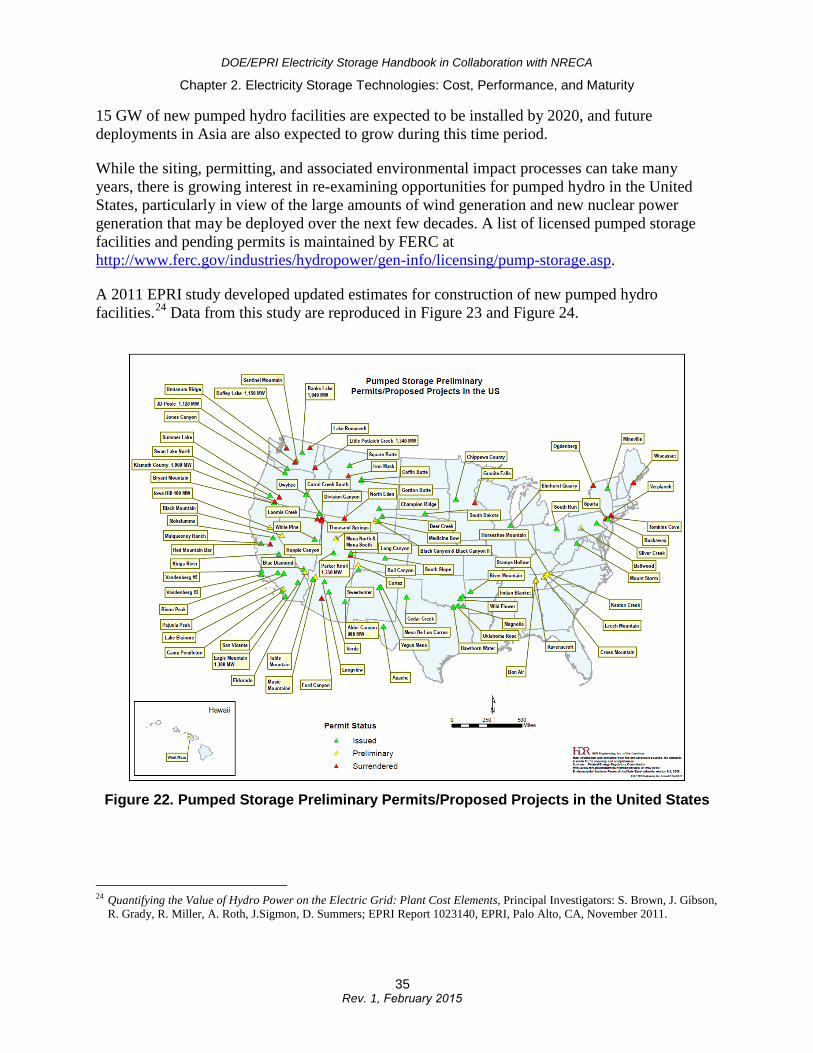
The earliest plant in the U.S. was built in the late 1920s, and the last pumped storage plant commissioned was in the 1980s, when environmental concerns over water and land use severely limited the ability to build additional pumped hydro capacity. Figure 22 provides a list of Pumped Storage Preliminary Permits/Proposed Projects in the United States. In Europe, over
34 Rev. 1, February 2015
DOE/EPRI Electricity Storage Handbook in Collaboration with NRECA
Chapter 2. Electricity Storage Technologies: Cost, Performance, and Maturity
15 GW of new pumped hydro facilities are expected to be installed by 2020, and future deployments in Asia are also expected to grow during this time period.
While the siting, permitting, and associated environmental impact processes can take many years, there is growing interest in re-examining opportunities for pumped hydro in the United States, particularly in view of the large amounts of wind generation and new nuclear power generation that may be deployed over the next few decades. A list of licensed pumped storage facilities and pending permits is maintained by FERC at http://www.ferc.gov/industries/hydropower/gen-info/licensing/pump-storage.asp.
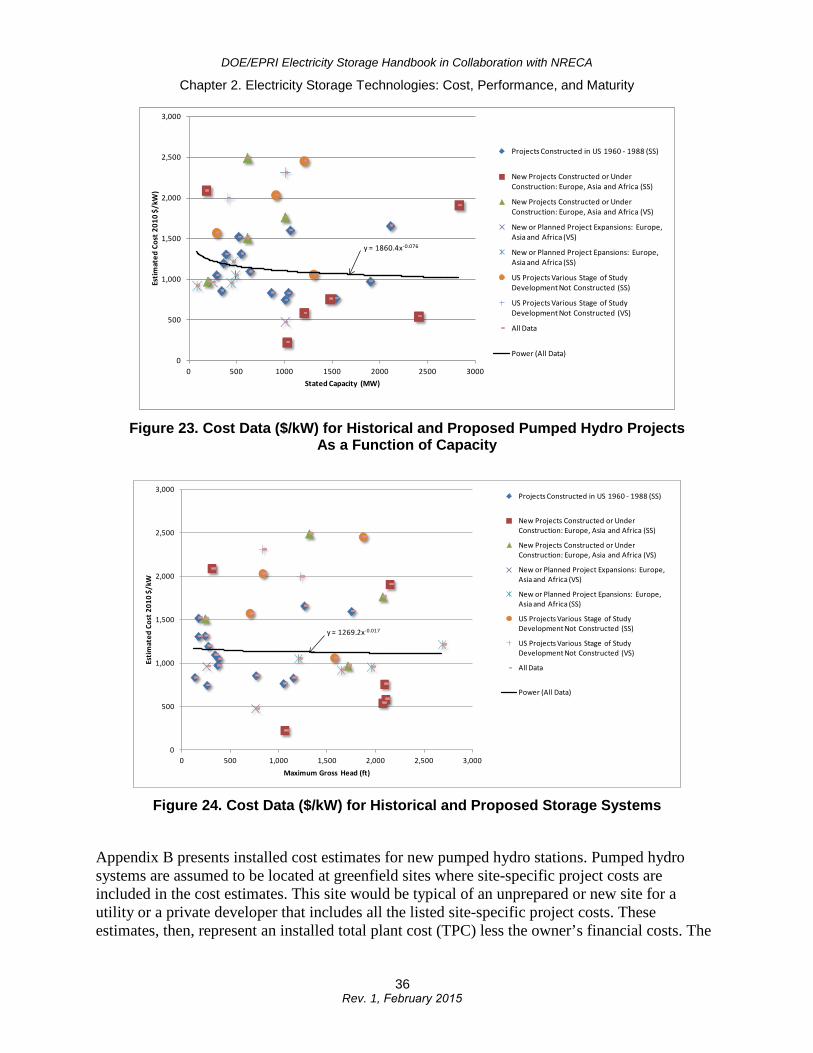
A 2011 EPRI study developed updated estimates for construction of new pumped hydro facilities.24 Data from this study are reproduced in Figure 23 and Figure 24.
Figure 22. Pumped Storage Preliminary Permits/Proposed Projects in the United States
24 Quantifying the Value of Hydro Power on the Electric Grid: Plant Cost Elements, Principal Investigators: S. Brown, J. Gibson, R. Grady, R. Miller, A. Roth, J.Sigmon, D. Summers; EPRI Report 1023140, EPRI, Palo Alto, CA, November 2011.
35 Rev. 1, February 2015
DOE/EPRI Electricity Storage Handbook in Collaboration with NRECA
Chapter 2. Electricity Storage Technologies: Cost, Performance, and Maturity
Figure 23. Cost Data ($/kW) for Historical and Proposed Pumped Hydro Projects As a Function of Capacity
Figure 24. Cost Data ($/kW) for Historical and Proposed Storage Systems
Appendix B presents installed cost estimates for new pumped hydro stations. Pumped hydro systems are assumed to be located at greenfield sites where site-specific project costs are included in the cost estimates. This site would be typical of an unprepared or new site for a utility or a private developer that includes all the listed site-specific project costs. These estimates, then, represent an installed total plant cost (TPC) less the owner’s financial costs. The
y = 1860.4x-0.076
0
500
1,000
1,500
2,000
2,500
3,000
0 500 1000 1500 2000 2500 3000
Estim
ated
Cos
t 201
0 $/
kW)
Stated Capacity (MW)
Projects Constructed in US 1960 - 1988 (SS)
New Projects Constructed or Under Construction: Europe, Asia and Africa (SS)
New Projects Constructed or Under Construction: Europe, Asia and Africa (VS)
New or Planned Project Expansions: Europe, Asia and Africa (VS)
New or Planned Project Epansions: Europe, Asia and Africa (SS)
US Projects Various Stage of Study Development Not Constructed (SS)
US Projects Various Stage of Study Development Not Constructed (VS)
All Data
Power (All Data)
y = 1269.2x-0.017
0
500
1,000
1,500
2,000
2,500
3,000
0 500 1,000 1,500 2,000 2,500 3,000
Estim
ated
Cos
t 201
0 $/
kW
Maximum Gross Head (ft)
Projects Constructed in US 1960 - 1988 (SS)
New Projects Constructed or Under Construction: Europe, Asia and Africa (SS)
New Projects Constructed or Under Construction: Europe, Asia and Africa (VS)
New or Planned Project Expansions: Europe, Asia and Africa (VS)
New or Planned Project Epansions: Europe, Asia and Africa (SS)
US Projects Various Stage of Study Development Not Constructed (SS)
US Projects Various Stage of Study Development Not Constructed (VS)
All Data
Power (All Data)
36 Rev. 1, February 2015
DOE/EPRI Electricity Storage Handbook in Collaboration with NRECA
Chapter 2. Electricity Storage Technologies: Cost, Performance, and Maturity
utility and owner interconnection transmission line costs for pumped hydro systems are also not included in the cost estimates; however, site-specific generator step-up transformers and the site substation are included in the site-specific costs.
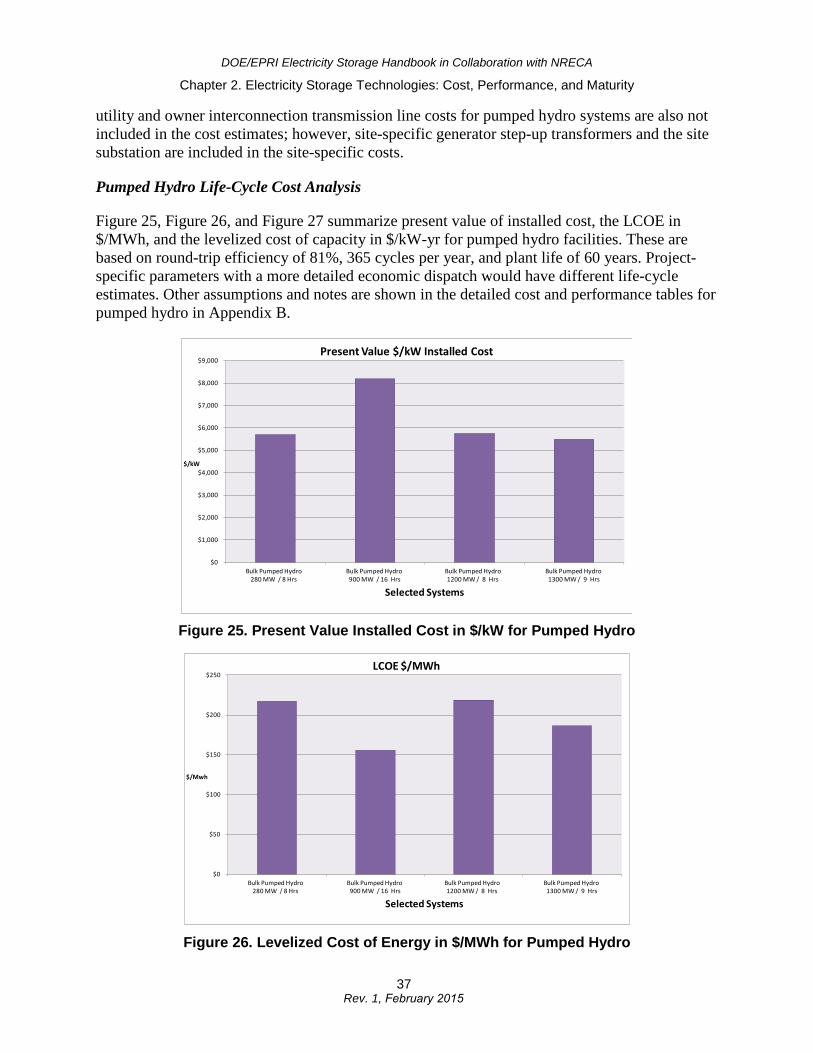
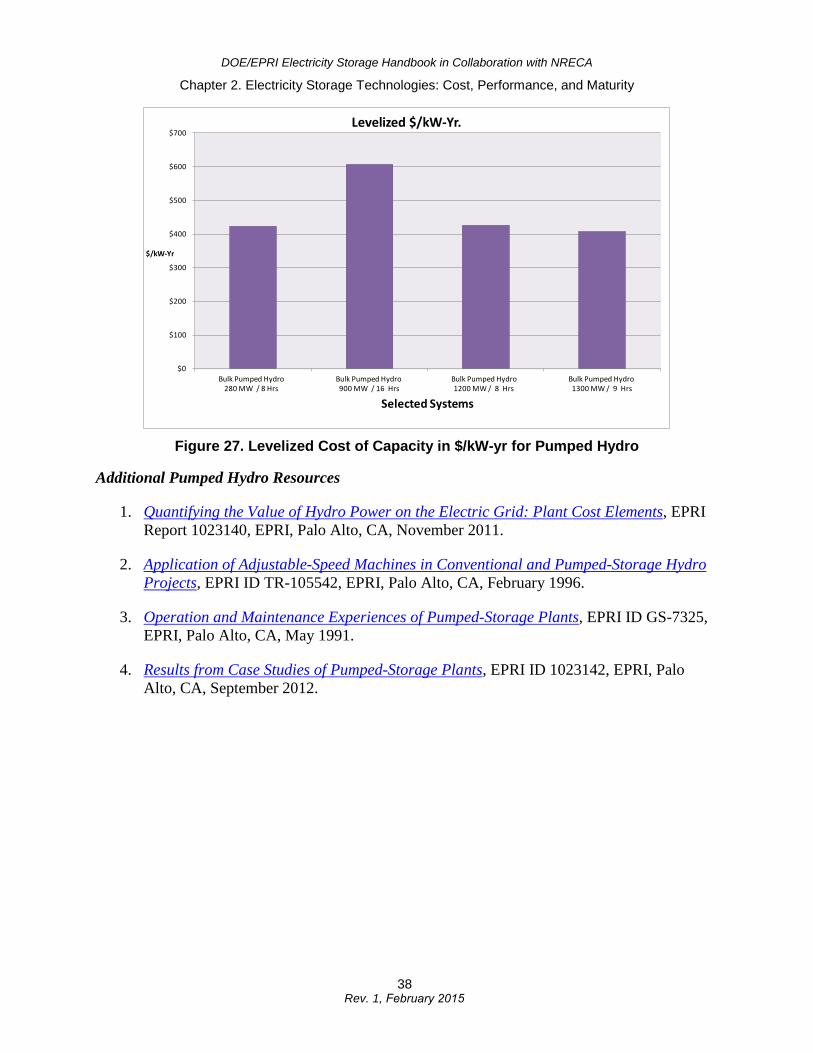
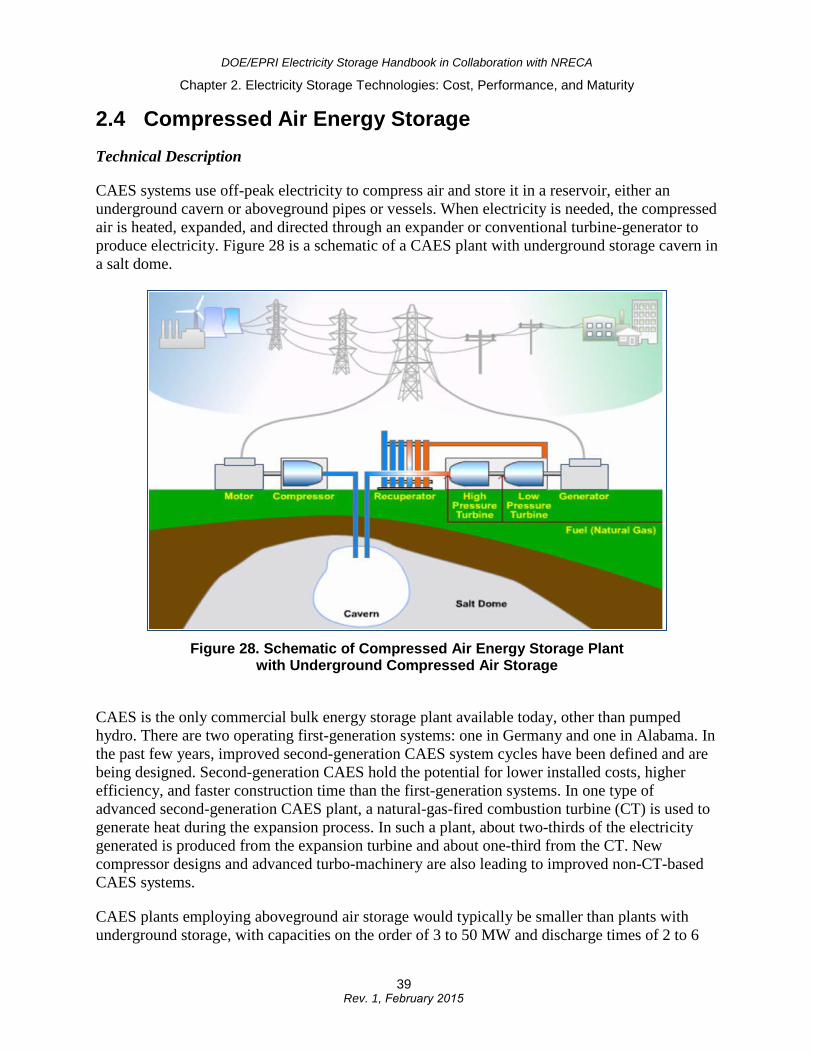
Pumped Hydro Life-Cycle Cost Analysis
Figure 25, Figure 26, and Figure 27 summarize present value of installed cost, the LCOE in $/MWh, and the levelized cost of capacity in $/kW-yr for pumped hydro facilities. These are based on round-trip efficiency of 81%, 365 cycles per year, and plant life of 60 years. Project-specific parameters with a more detailed economic dispatch would have different life-cycle estimates. Other assumptions and notes are shown in the detailed cost and performance tables for pumped hydro in Appendix B.
Figure 25. Present Value Installed Cost in $/kW for Pumped Hydro
Figure 26. Levelized Cost of Energy in $/MWh for Pumped Hydro
$0
$1,000
$2,000
$3,000
$4,000
$5,000
$6,000
$7,000
$8,000
$9,000
Bulk Pumped Hydro 280 MW / 8 Hrs
Bulk Pumped Hydro900 MW / 16 Hrs
Bulk Pumped Hydro 1200 MW / 8 Hrs
Bulk Pumped Hydro1300 MW / 9 Hrs
$/kW
Selected Systems
Present Value $/kW Installed Cost
$0
$50
$100
$150
$200
$250
Bulk Pumped Hydro 280 MW / 8 Hrs
Bulk Pumped Hydro900 MW / 16 Hrs
Bulk Pumped Hydro 1200 MW / 8 Hrs
Bulk Pumped Hydro1300 MW / 9 Hrs
$/Mwh
Selected Systems
LCOE $/MWh
37 Rev. 1, February 2015
DOE/EPRI Electricity Storage Handbook in Collaboration with NRECA
Chapter 2. Electricity Storage Technologies: Cost, Performance, and Maturity
Figure 27. Levelized Cost of Capacity in $/kW-yr for Pumped Hydro
Additional Pumped Hydro Resources
1. Quantifying the Value of Hydro Power on the Electric Grid: Plant Cost Elements, EPRIReport 1023140, EPRI, Palo Alto, CA, November 2011.
2. Application of Adjustable-Speed Machines in Conventional and Pumped-Storage HydroProjects, EPRI ID TR-105542, EPRI, Palo Alto, CA, February 1996.
3. Operation and Maintenance Experiences of Pumped-Storage Plants, EPRI ID GS-7325,EPRI, Palo Alto, CA, May 1991.
4. Results from Case Studies of Pumped-Storage Plants, EPRI ID 1023142, EPRI, PaloAlto, CA, September 2012.
$0
$100
$200
$300
$400
$500
$600
$700
Bulk Pumped Hydro 280 MW / 8 Hrs
Bulk Pumped Hydro900 MW / 16 Hrs
Bulk Pumped Hydro 1200 MW / 8 Hrs
Bulk Pumped Hydro1300 MW / 9 Hrs
$/kW-Yr
Selected Systems
Levelized $/kW-Yr.
38 Rev. 1, February 2015
DOE/EPRI Electricity Storage Handbook in Collaboration with NRECA
Chapter 2. Electricity Storage Technologies: Cost, Performance, and Maturity
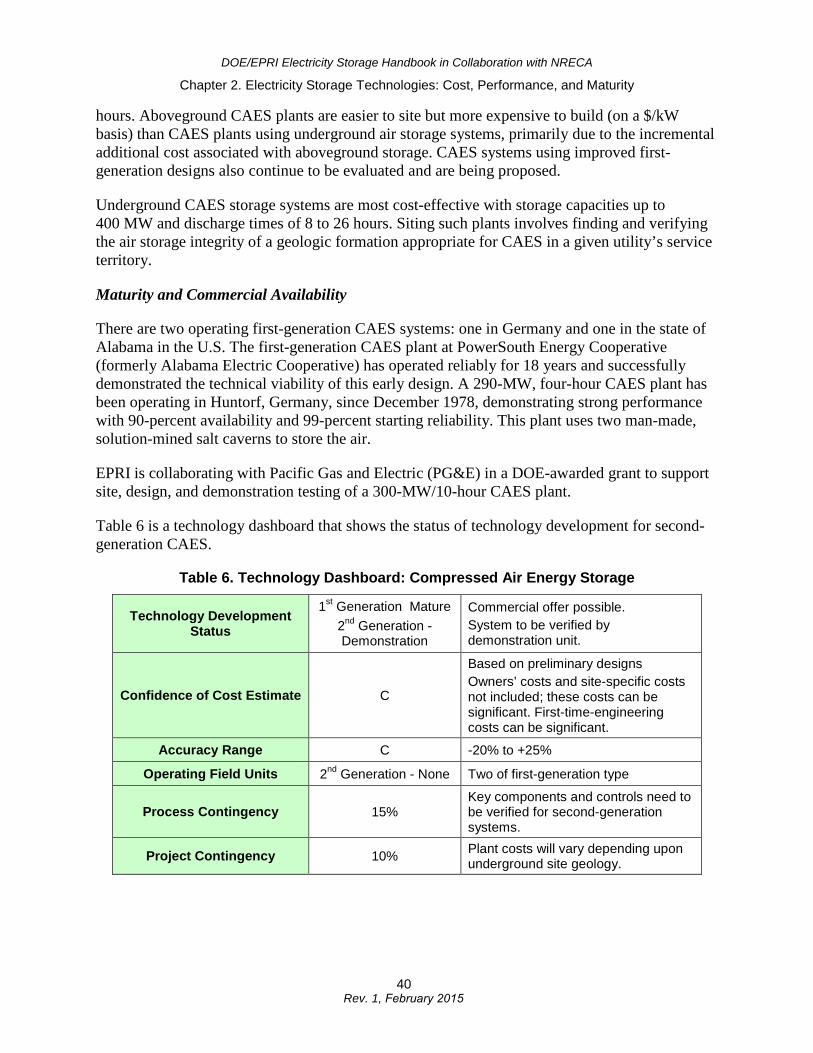
2.4 Compressed Air Energy Storage Technical Description
CAES systems use off-peak electricity to compress air and store it in a reservoir, either an underground cavern or aboveground pipes or vessels. When electricity is needed, the compressed air is heated, expanded, and directed through an expander or conventional turbine-generator to produce electricity. Figure 28 is a schematic of a CAES plant with underground storage cavern in a salt dome.
Figure 28. Schematic of Compressed Air Energy Storage Plant with Underground Compressed Air Storage
CAES is the only commercial bulk energy storage plant available today, other than pumped hydro. There are two operating first-generation systems: one in Germany and one in Alabama. In the past few years, improved second-generation CAES system cycles have been defined and are being designed. Second-generation CAES hold the potential for lower installed costs, higher efficiency, and faster construction time than the first-generation systems. In one type of advanced second-generation CAES plant, a natural-gas-fired combustion turbine (CT) is used to generate heat during the expansion process. In such a plant, about two-thirds of the electricity generated is produced from the expansion turbine and about one-third from the CT. New compressor designs and advanced turbo-machinery are also leading to improved non-CT-based CAES systems.
CAES plants employing aboveground air storage would typically be smaller than plants with underground storage, with capacities on the order of 3 to 50 MW and discharge times of 2 to 6
39 Rev. 1, February 2015
DOE/EPRI Electricity Storage Handbook in Collaboration with NRECA
Chapter 2. Electricity Storage Technologies: Cost, Performance, and Maturity
hours. Aboveground CAES plants are easier to site but more expensive to build (on a $/kW basis) than CAES plants using underground air storage systems, primarily due to the incremental additional cost associated with aboveground storage. CAES systems using improved first-generation designs also continue to be evaluated and are being proposed.
Underground CAES storage systems are most cost-effective with storage capacities up to 400 MW and discharge times of 8 to 26 hours. Siting such plants involves finding and verifying the air storage integrity of a geologic formation appropriate for CAES in a given utility’s service territory.
Maturity and Commercial Availability
There are two operating first-generation CAES systems: one in Germany and one in the state of Alabama in the U.S. The first-generation CAES plant at PowerSouth Energy Cooperative (formerly Alabama Electric Cooperative) has operated reliably for 18 years and successfully demonstrated the technical viability of this early design. A 290-MW, four-hour CAES plant has been operating in Huntorf, Germany, since December 1978, demonstrating strong performance with 90-percent availability and 99-percent starting reliability. This plant uses two man-made, solution-mined salt caverns to store the air.
EPRI is collaborating with Pacific Gas and Electric (PG&E) in a DOE-awarded grant to support site, design, and demonstration testing of a 300-MW/10-hour CAES plant.
Table 6 is a technology dashboard that shows the status of technology development for second-generation CAES.
Table 6. Technology Dashboard: Compressed Air Energy Storage
Technology Development Status
1st Generation Mature 2nd Generation - Demonstration
Commercial offer possible. System to be verified by demonstration unit.
Confidence of Cost Estimate C
Based on preliminary designs Owners’ costs and site-specific costs not included; these costs can be significant. First-time-engineering costs can be significant.
Accuracy Range C -20% to +25%
Operating Field Units 2nd Generation - None Two of first-generation type
Process Contingency 15% Key components and controls need to be verified for second-generation systems.
Project Contingency 10% Plant costs will vary depending upon underground site geology.
40 Rev. 1, February 2015
DOE/EPRI Electricity Storage Handbook in Collaboration with NRECA
Chapter 2. Electricity Storage Technologies: Cost, Performance, and Maturity
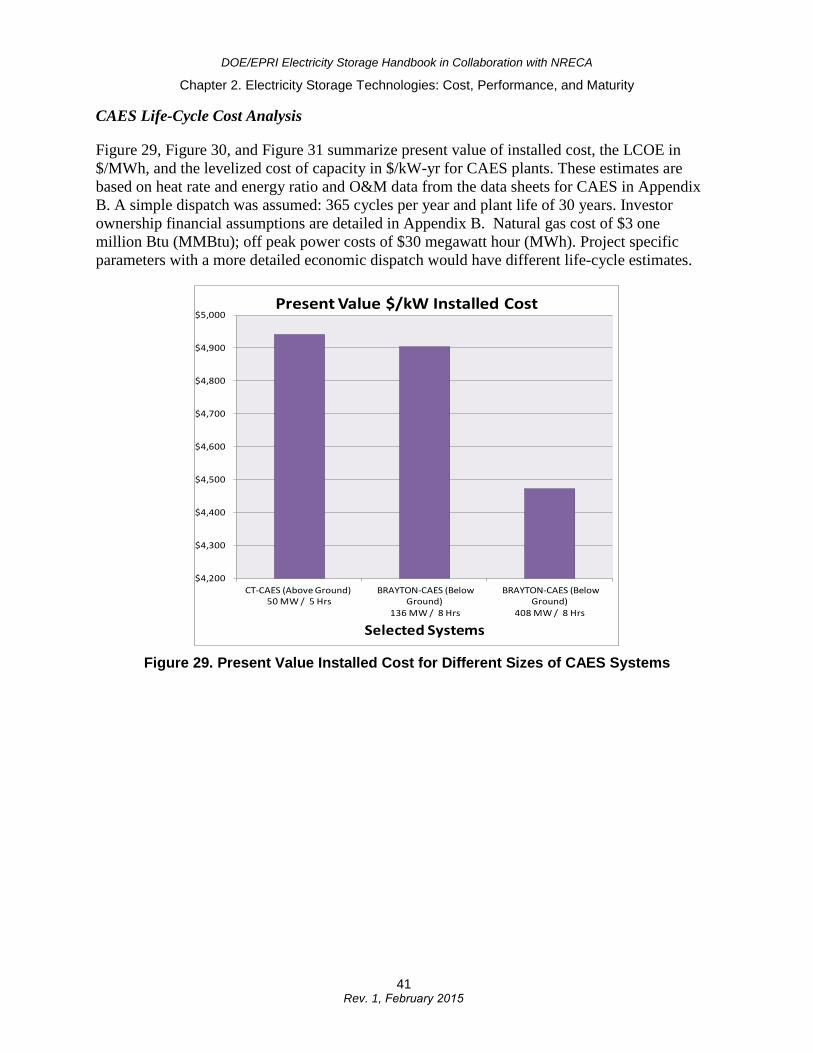
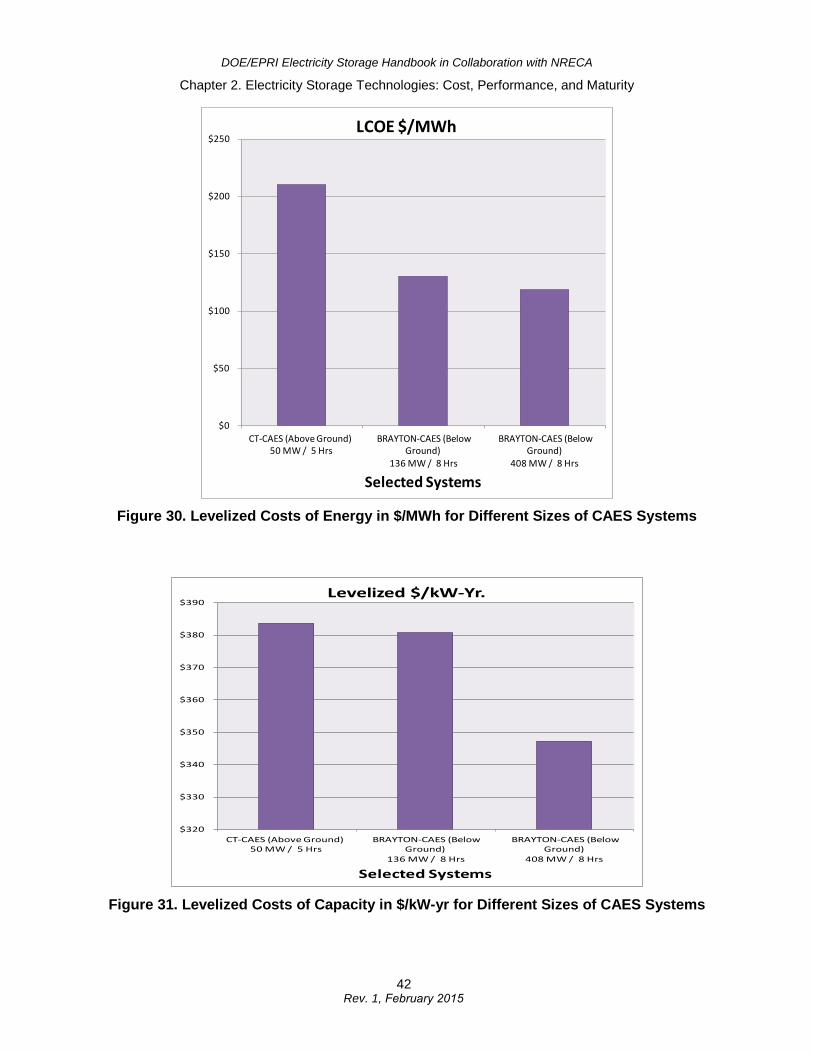
CAES Life-Cycle Cost Analysis
Figure 29, Figure 30, and Figure 31 summarize present value of installed cost, the LCOE in $/MWh, and the levelized cost of capacity in $/kW-yr for CAES plants. These estimates are based on heat rate and energy ratio and O&M data from the data sheets for CAES in Appendix B. A simple dispatch was assumed: 365 cycles per year and plant life of 30 years. Investor ownership financial assumptions are detailed in Appendix B. Natural gas cost of $3 one million Btu (MMBtu); off peak power costs of $30 megawatt hour (MWh). Project specific parameters with a more detailed economic dispatch would have different life-cycle estimates.
Figure 29. Present Value Installed Cost for Different Sizes of CAES Systems
$4,200
$4,300
$4,400
$4,500
$4,600
$4,700
$4,800
$4,900
$5,000
CT-CAES (Above Ground)50 MW / 5 Hrs
BRAYTON-CAES (Below Ground)
136 MW / 8 Hrs
BRAYTON-CAES (Below Ground)
408 MW / 8 Hrs
Selected Systems
Present Value $/kW Installed Cost
41 Rev. 1, February 2015
DOE/EPRI Electricity Storage Handbook in Collaboration with NRECA
Chapter 2. Electricity Storage Technologies: Cost, Performance, and Maturity
Figure 30. Levelized Costs of Energy in $/MWh for Different Sizes of CAES Systems
Figure 31. Levelized Costs of Capacity in $/kW-yr for Different Sizes of CAES Systems
$0
$50
$100
$150
$200
$250
CT-CAES (Above Ground)50 MW / 5 Hrs
BRAYTON-CAES (Below Ground)
136 MW / 8 Hrs
BRAYTON-CAES (Below Ground)
408 MW / 8 Hrs
Selected Systems
LCOE $/MWh
$320
$330
$340
$350
$360
$370
$380
$390
CT-CAES (Above Ground)50 MW / 5 Hrs
BRAYTON-CAES (Below Ground)
136 MW / 8 Hrs
BRAYTON-CAES (Below Ground)
408 MW / 8 Hrs
Selected Systems
Levelized $/kW-Yr.
42 Rev. 1, February 2015
DOE/EPRI Electricity Storage Handbook in Collaboration with NRECA
Chapter 2. Electricity Storage Technologies: Cost, Performance, and Maturity
Additional CAES Resources
1. Electricity Storage Technology Options: A White Paper Primer on Applications, Costsand Benefits. December 2010. EPRI Report 1020676.
2. History of First U.S. Compressed-Air Energy Storage (CAES) Plant (110 MW 26h):Volume 2: Construction, EPRI ID TR-101751-V2, EPRI, Palo Alto, CA, May 1994.
3. History of First U.S. Compressed Air Energy Storage (CAES) Plant (110-MW-26 h):Volume 1: Early CAES Development, EPRI ID 101751-V1, EPRI, Palo Alto, CA,January 1993.
4. Midwest Independent Transmission System Operator (MISO) Energy Storage Study,EPRI ID 1024489, EPRI, Palo Alto, CA, February 2012.
5. Evaluation of Benefits and Identification of Sites for a CAES Plant in New York State,EPRI TR-104268, EPRI, Palo Alto, CA, September 1994.
2.5 Sodium-sulfur Battery Energy Storage Technical Description
Sodium-sulfur (NaS) batteries are a commercial energy storage technology finding applications in electric utility distribution grid support, wind power integration, and high-value grid services. NaS battery technology holds potential for use in grid services because of its long discharge period (approximately 6 hours). Like many other storage technologies, it is capable of prompt, precise response to such grid needs as mitigation of power quality events and response to AGC signals for area regulation.25
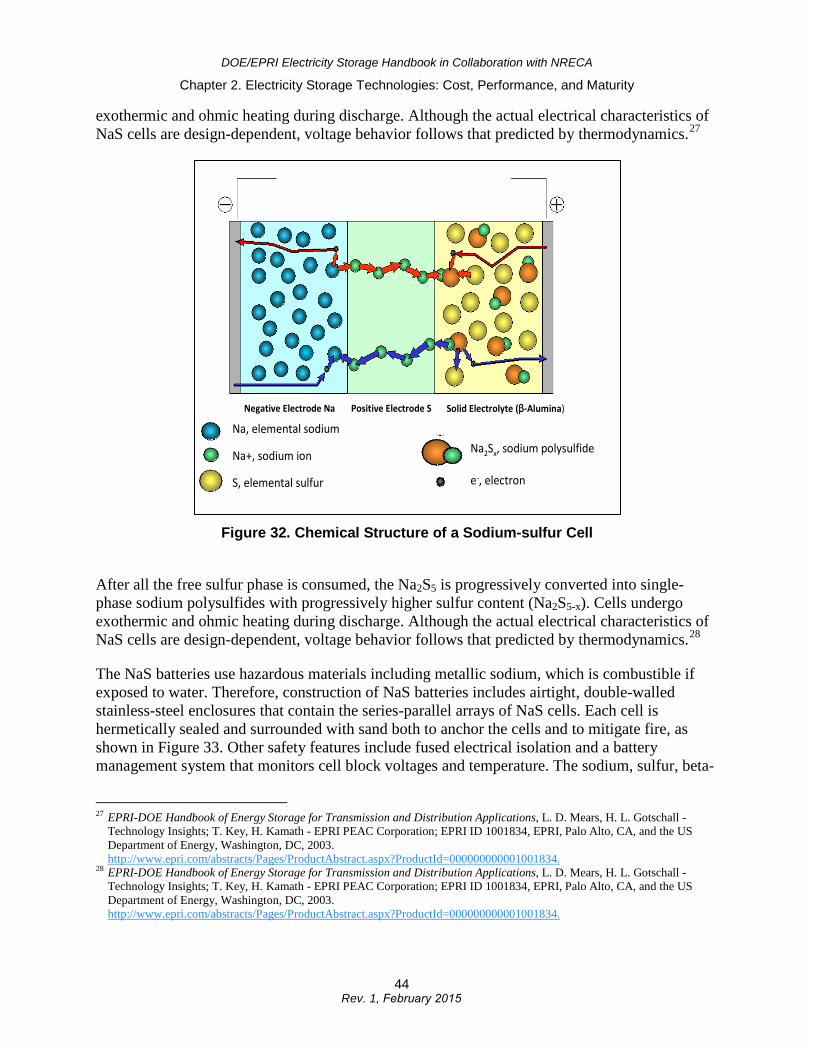
The normal operating temperature regime of NaS cells during discharge/charge cycles is in the range of 300 ºC to 350 ºC. During discharge, the sodium (negative electrode) is oxidized at the sodium/beta alumina interface, forming Na+ ions. These ions migrate through the beta alumina solid electrolyte and combine with sulfur that is being reduced at the positive electrode to form sodium pentasulfide (Na2S5). The Na2S5 is immiscible with the remaining sulfur, thus forming a two-phase liquid mixture (Figure 32).26
After all the free sulfur phase is consumed, the Na2S5 is progressively converted into single-phase sodium polysulfides with progressively higher sulfur content (Na2S5-x). Cells undergo
25 Electric Energy Storage Technology Options: A Primer on Applications, Costs and Benefits, PI: Rastler, Dan, EPRI ID 1020676, EPRI, Palo Alto, CA, September 2010. http://www.epri.com/abstracts/Pages/ProductAbstract.aspx?ProductId=000000000001020676.
26 Courtesy of EPRI.
43 Rev. 1, February 2015
DOE/EPRI Electricity Storage Handbook in Collaboration with NRECA
Chapter 2. Electricity Storage Technologies: Cost, Performance, and Maturity
exothermic and ohmic heating during discharge. Although the actual electrical characteristics of NaS cells are design-dependent, voltage behavior follows that predicted by thermodynamics.27
Figure 32. Chemical Structure of a Sodium-sulfur Cell
After all the free sulfur phase is consumed, the Na2S5 is progressively converted into single-phase sodium polysulfides with progressively higher sulfur content (Na2S5-x). Cells undergo exothermic and ohmic heating during discharge. Although the actual electrical characteristics of NaS cells are design-dependent, voltage behavior follows that predicted by thermodynamics.28
The NaS batteries use hazardous materials including metallic sodium, which is combustible if exposed to water. Therefore, construction of NaS batteries includes airtight, double-walled stainless-steel enclosures that contain the series-parallel arrays of NaS cells. Each cell is hermetically sealed and surrounded with sand both to anchor the cells and to mitigate fire, as shown in Figure 33. Other safety features include fused electrical isolation and a battery management system that monitors cell block voltages and temperature. The sodium, sulfur, beta-
27 EPRI-DOE Handbook of Energy Storage for Transmission and Distribution Applications, L. D. Mears, H. L. Gotschall - Technology Insights; T. Key, H. Kamath - EPRI PEAC Corporation; EPRI ID 1001834, EPRI, Palo Alto, CA, and the US Department of Energy, Washington, DC, 2003. http://www.epri.com/abstracts/Pages/ProductAbstract.aspx?ProductId=000000000001001834.
28 EPRI-DOE Handbook of Energy Storage for Transmission and Distribution Applications, L. D. Mears, H. L. Gotschall - Technology Insights; T. Key, H. Kamath - EPRI PEAC Corporation; EPRI ID 1001834, EPRI, Palo Alto, CA, and the US Department of Energy, Washington, DC, 2003. http://www.epri.com/abstracts/Pages/ProductAbstract.aspx?ProductId=000000000001001834.
Negative Electrode Na Solid Electrolyte (β-Alumina)
Na, elemental sodium
Na+, sodium ion
S, elemental sulfur
Positive Electrode S
Na2Sx, sodium polysulfide
e-, electron
44 Rev. 1, February 2015
DOE/EPRI Electricity Storage Handbook in Collaboration with NRECA
Chapter 2. Electricity Storage Technologies: Cost, Performance, and Maturity
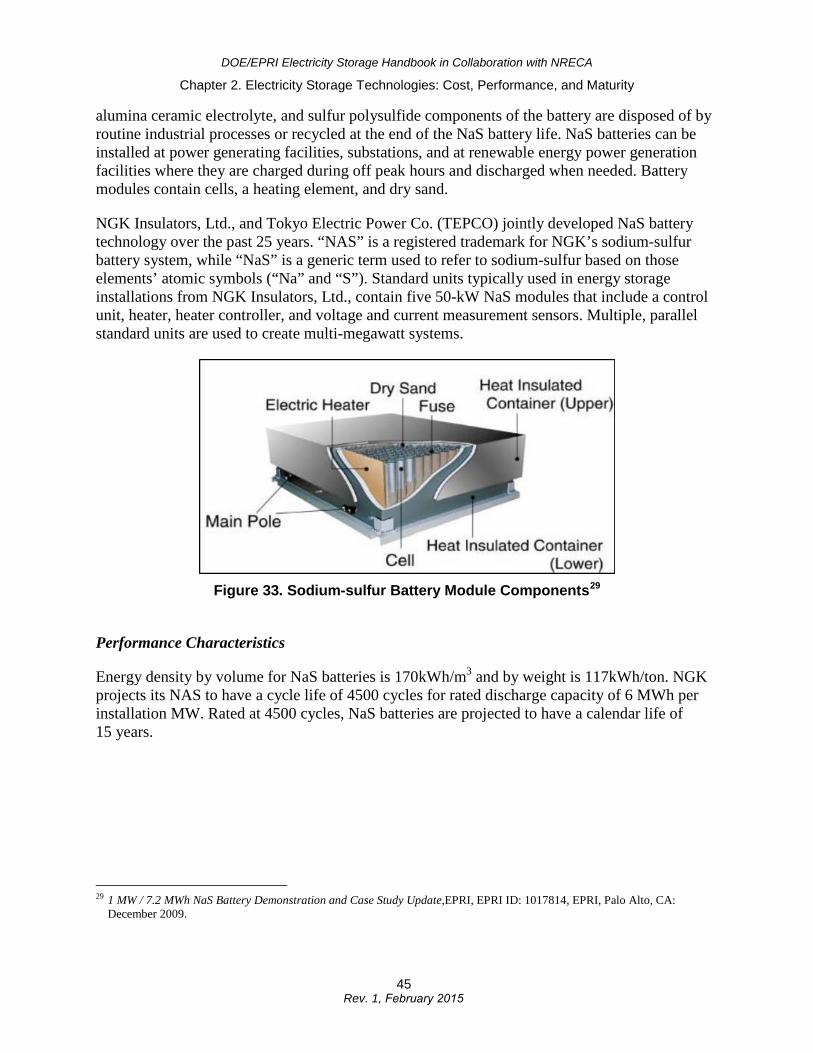
alumina ceramic electrolyte, and sulfur polysulfide components of the battery are disposed of by routine industrial processes or recycled at the end of the NaS battery life. NaS batteries can be installed at power generating facilities, substations, and at renewable energy power generation facilities where they are charged during off peak hours and discharged when needed. Battery modules contain cells, a heating element, and dry sand.
NGK Insulators, Ltd., and Tokyo Electric Power Co. (TEPCO) jointly developed NaS battery technology over the past 25 years. “NAS” is a registered trademark for NGK’s sodium-sulfur battery system, while “NaS” is a generic term used to refer to sodium-sulfur based on those elements’ atomic symbols (“Na” and “S”). Standard units typically used in energy storage installations from NGK Insulators, Ltd., contain five 50-kW NaS modules that include a control unit, heater, heater controller, and voltage and current measurement sensors. Multiple, parallel standard units are used to create multi-megawatt systems.
Figure 33. Sodium-sulfur Battery Module Components29
Performance Characteristics
Energy density by volume for NaS batteries is 170kWh/m3 and by weight is 117kWh/ton. NGK projects its NAS to have a cycle life of 4500 cycles for rated discharge capacity of 6 MWh per installation MW. Rated at 4500 cycles, NaS batteries are projected to have a calendar life of 15 years.
29 1 MW / 7.2 MWh NaS Battery Demonstration and Case Study Update,EPRI, EPRI ID: 1017814, EPRI, Palo Alto, CA: December 2009.
45 Rev. 1, February 2015
DOE/EPRI Electricity Storage Handbook in Collaboration with NRECA
Chapter 2. Electricity Storage Technologies: Cost, Performance, and Maturity
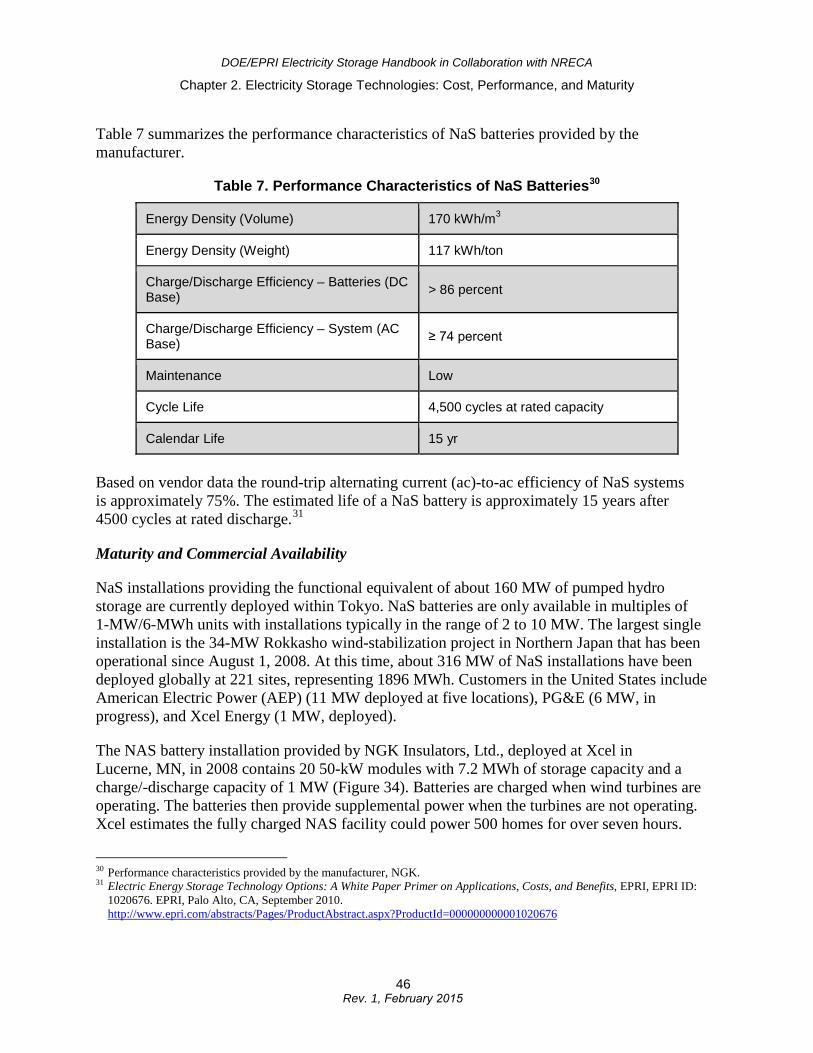
Table 7 summarizes the performance characteristics of NaS batteries provided by the manufacturer.
Table 7. Performance Characteristics of NaS Batteries30
Energy Density (Volume) 170 kWh/m3
Energy Density (Weight) 117 kWh/ton
Charge/Discharge Efficiency – Batteries (DC Base) > 86 percent
Charge/Discharge Efficiency – System (AC Base) ≥ 74 percent
Maintenance Low
Cycle Life 4,500 cycles at rated capacity
Calendar Life 15 yr
Based on vendor data the round-trip alternating current (ac)-to-ac efficiency of NaS systems is approximately 75%. The estimated life of a NaS battery is approximately 15 years after 4500 cycles at rated discharge.31
Maturity and Commercial Availability
NaS installations providing the functional equivalent of about 160 MW of pumped hydro storage are currently deployed within Tokyo. NaS batteries are only available in multiples of 1-MW/6-MWh units with installations typically in the range of 2 to 10 MW. The largest single installation is the 34-MW Rokkasho wind-stabilization project in Northern Japan that has been operational since August 1, 2008. At this time, about 316 MW of NaS installations have been deployed globally at 221 sites, representing 1896 MWh. Customers in the United States include American Electric Power (AEP) (11 MW deployed at five locations), PG&E (6 MW, in progress), and Xcel Energy (1 MW, deployed).
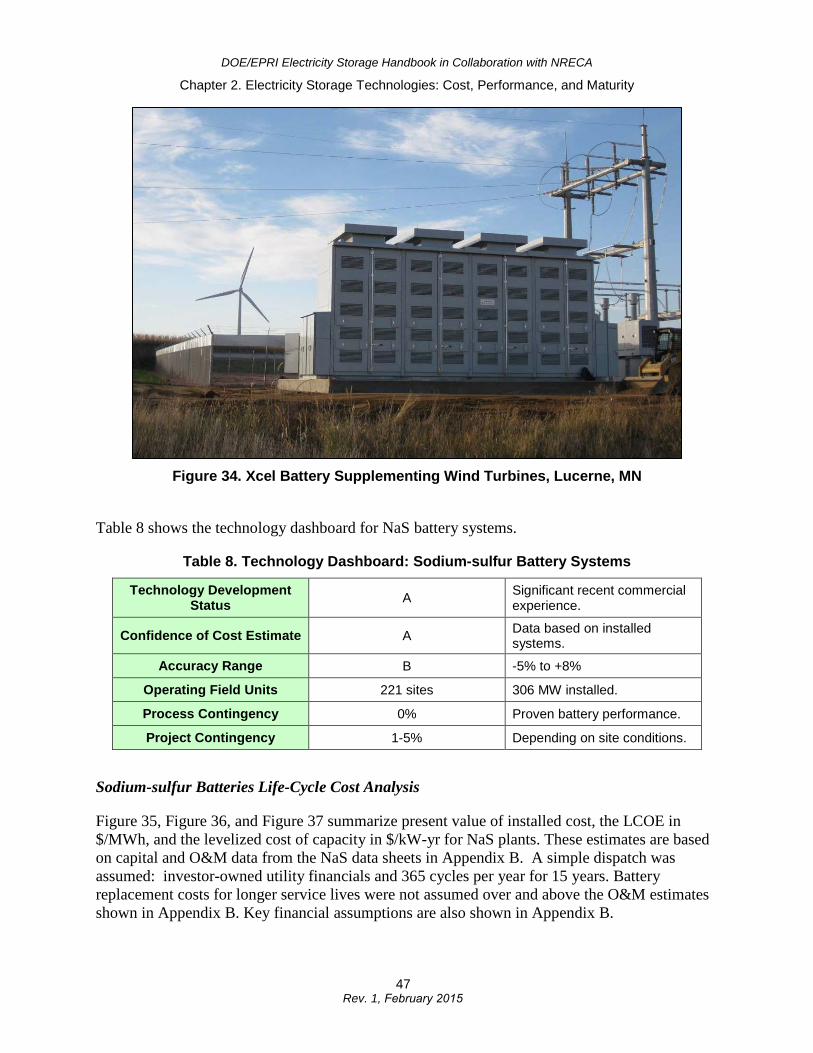
The NAS battery installation provided by NGK Insulators, Ltd., deployed at Xcel in Lucerne, MN, in 2008 contains 20 50-kW modules with 7.2 MWh of storage capacity and a charge/-discharge capacity of 1 MW (Figure 34). Batteries are charged when wind turbines are operating. The batteries then provide supplemental power when the turbines are not operating. Xcel estimates the fully charged NAS facility could power 500 homes for over seven hours.
30 Performance characteristics provided by the manufacturer, NGK. 31 Electric Energy Storage Technology Options: A White Paper Primer on Applications, Costs, and Benefits, EPRI, EPRI ID:
1020676. EPRI, Palo Alto, CA, September 2010. http://www.epri.com/abstracts/Pages/ProductAbstract.aspx?ProductId=000000000001020676
46 Rev. 1, February 2015
DOE/EPRI Electricity Storage Handbook in Collaboration with NRECA
Chapter 2. Electricity Storage Technologies: Cost, Performance, and Maturity
Figure 34. Xcel Battery Supplementing Wind Turbines, Lucerne, MN
Table 8 shows the technology dashboard for NaS battery systems.
Table 8. Technology Dashboard: Sodium-sulfur Battery Systems
Technology Development Status A Significant recent commercial
experience.
Confidence of Cost Estimate A Data based on installed systems.
Accuracy Range B -5% to +8%
Operating Field Units 221 sites 306 MW installed.
Process Contingency 0% Proven battery performance.
Project Contingency 1-5% Depending on site conditions.
Sodium-sulfur Batteries Life-Cycle Cost Analysis
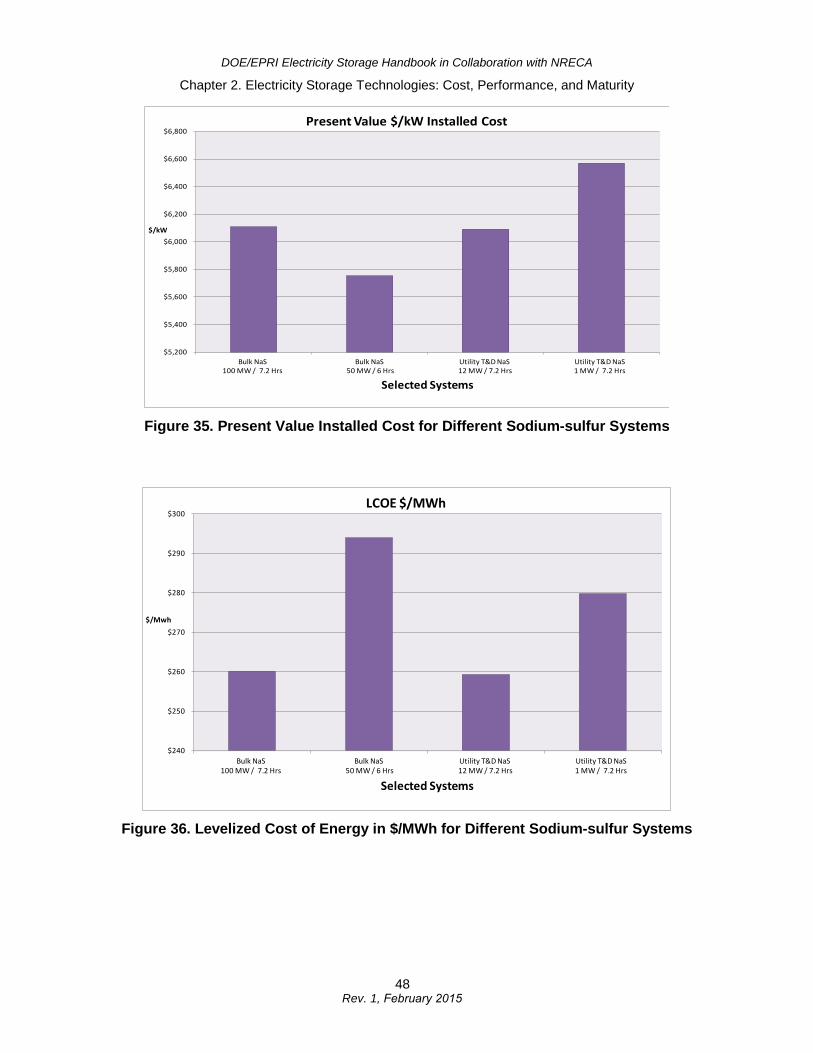
Figure 35, Figure 36, and Figure 37 summarize present value of installed cost, the LCOE in $/MWh, and the levelized cost of capacity in $/kW-yr for NaS plants. These estimates are based on capital and O&M data from the NaS data sheets in Appendix B. A simple dispatch was assumed: investor-owned utility financials and 365 cycles per year for 15 years. Battery replacement costs for longer service lives were not assumed over and above the O&M estimates shown in Appendix B. Key financial assumptions are also shown in Appendix B.
47 Rev. 1, February 2015
DOE/EPRI Electricity Storage Handbook in Collaboration with NRECA
Chapter 2. Electricity Storage Technologies: Cost, Performance, and Maturity
Figure 35. Present Value Installed Cost for Different Sodium-sulfur Systems
Figure 36. Levelized Cost of Energy in $/MWh for Different Sodium-sulfur Systems
$5,200
$5,400
$5,600
$5,800
$6,000
$6,200
$6,400
$6,600
$6,800
Bulk NaS 100 MW / 7.2 Hrs
Bulk NaS50 MW / 6 Hrs
Utility T&D NaS12 MW / 7.2 Hrs
Utility T&D NaS 1 MW / 7.2 Hrs
$/kW
Selected Systems
Present Value $/kW Installed Cost
$240
$250
$260
$270
$280
$290
$300
Bulk NaS 100 MW / 7.2 Hrs
Bulk NaS50 MW / 6 Hrs
Utility T&D NaS12 MW / 7.2 Hrs
Utility T&D NaS 1 MW / 7.2 Hrs
$/Mwh
Selected Systems
LCOE $/MWh
48 Rev. 1, February 2015
DOE/EPRI Electricity Storage Handbook in Collaboration with NRECA
Chapter 2. Electricity Storage Technologies: Cost, Performance, and Maturity
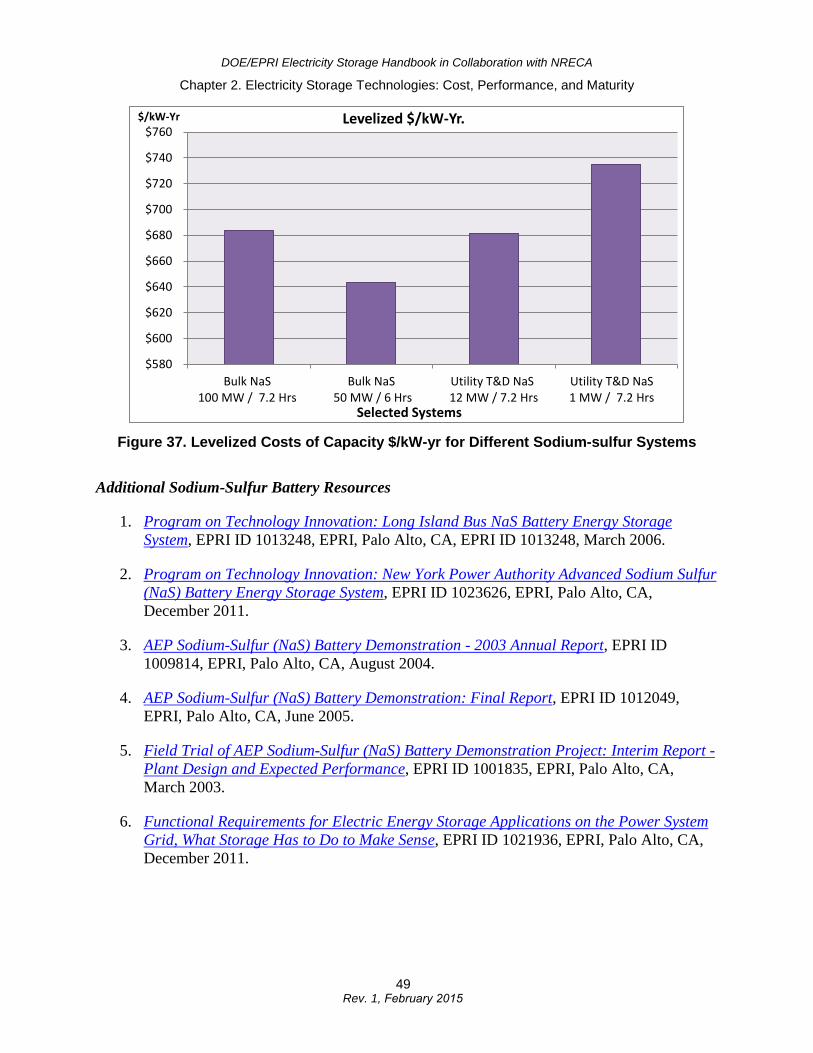
Figure 37. Levelized Costs of Capacity $/kW-yr for Different Sodium-sulfur Systems
Additional Sodium-Sulfur Battery Resources
1. Program on Technology Innovation: Long Island Bus NaS Battery Energy StorageSystem, EPRI ID 1013248, EPRI, Palo Alto, CA, EPRI ID 1013248, March 2006.
2. Program on Technology Innovation: New York Power Authority Advanced Sodium Sulfur(NaS) Battery Energy Storage System, EPRI ID 1023626, EPRI, Palo Alto, CA,December 2011.
3. AEP Sodium-Sulfur (NaS) Battery Demonstration - 2003 Annual Report, EPRI ID1009814, EPRI, Palo Alto, CA, August 2004.
4. AEP Sodium-Sulfur (NaS) Battery Demonstration: Final Report, EPRI ID 1012049,EPRI, Palo Alto, CA, June 2005.
5. Field Trial of AEP Sodium-Sulfur (NaS) Battery Demonstration Project: Interim Report -Plant Design and Expected Performance, EPRI ID 1001835, EPRI, Palo Alto, CA,March 2003.
6. Functional Requirements for Electric Energy Storage Applications on the Power SystemGrid, What Storage Has to Do to Make Sense, EPRI ID 1021936, EPRI, Palo Alto, CA,December 2011.
$580
$600
$620
$640
$660
$680
$700
$720
$740
$760
Bulk NaS100 MW / 7.2 Hrs
Bulk NaS 50 MW / 6 Hrs
Utility T&D NaS 12 MW / 7.2 Hrs
Utility T&D NaS1 MW / 7.2 Hrs
$/kW-Yr
Selected Systems
Levelized $/kW-Yr.
49 Rev. 1, February 2015
DOE/EPRI Electricity Storage Handbook in Collaboration with NRECA
Chapter 2. Electricity Storage Technologies: Cost, Performance, and Maturity
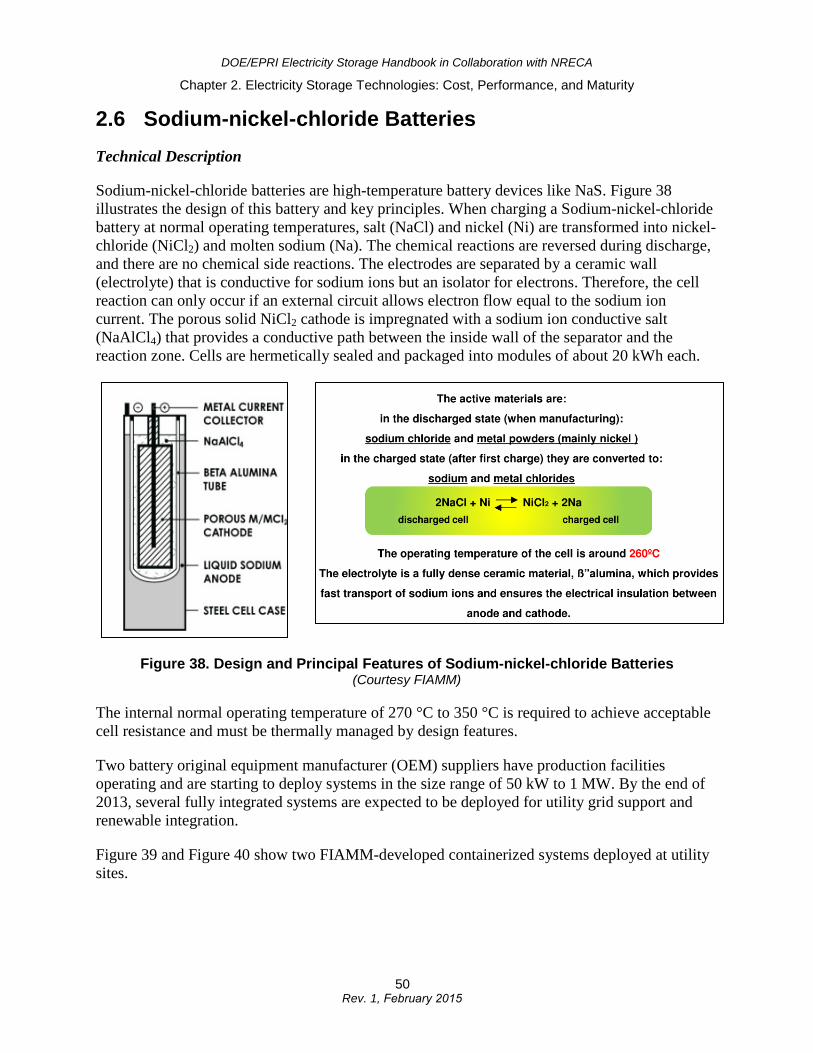
2.6 Sodium-nickel-chloride Batteries Technical Description
Sodium-nickel-chloride batteries are high-temperature battery devices like NaS. Figure 38 illustrates the design of this battery and key principles. When charging a Sodium-nickel-chloride battery at normal operating temperatures, salt (NaCl) and nickel (Ni) are transformed into nickel-chloride (NiCl2) and molten sodium (Na). The chemical reactions are reversed during discharge, and there are no chemical side reactions. The electrodes are separated by a ceramic wall (electrolyte) that is conductive for sodium ions but an isolator for electrons. Therefore, the cell reaction can only occur if an external circuit allows electron flow equal to the sodium ion current. The porous solid NiCl2 cathode is impregnated with a sodium ion conductive salt (NaAlCl4) that provides a conductive path between the inside wall of the separator and the reaction zone. Cells are hermetically sealed and packaged into modules of about 20 kWh each.
Figure 38. Design and Principal Features of Sodium-nickel-chloride Batteries (Courtesy FIAMM)
The internal normal operating temperature of 270 °C to 350 °C is required to achieve acceptable cell resistance and must be thermally managed by design features.
Two battery original equipment manufacturer (OEM) suppliers have production facilities operating and are starting to deploy systems in the size range of 50 kW to 1 MW. By the end of 2013, several fully integrated systems are expected to be deployed for utility grid support and renewable integration.
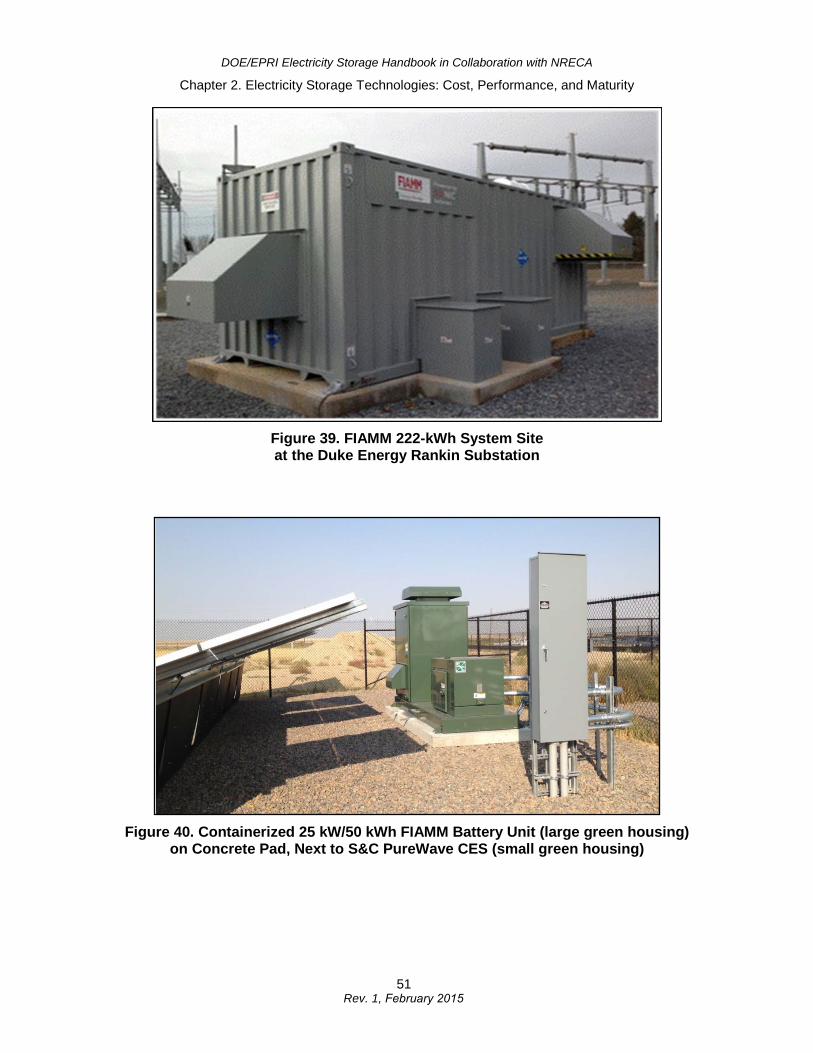
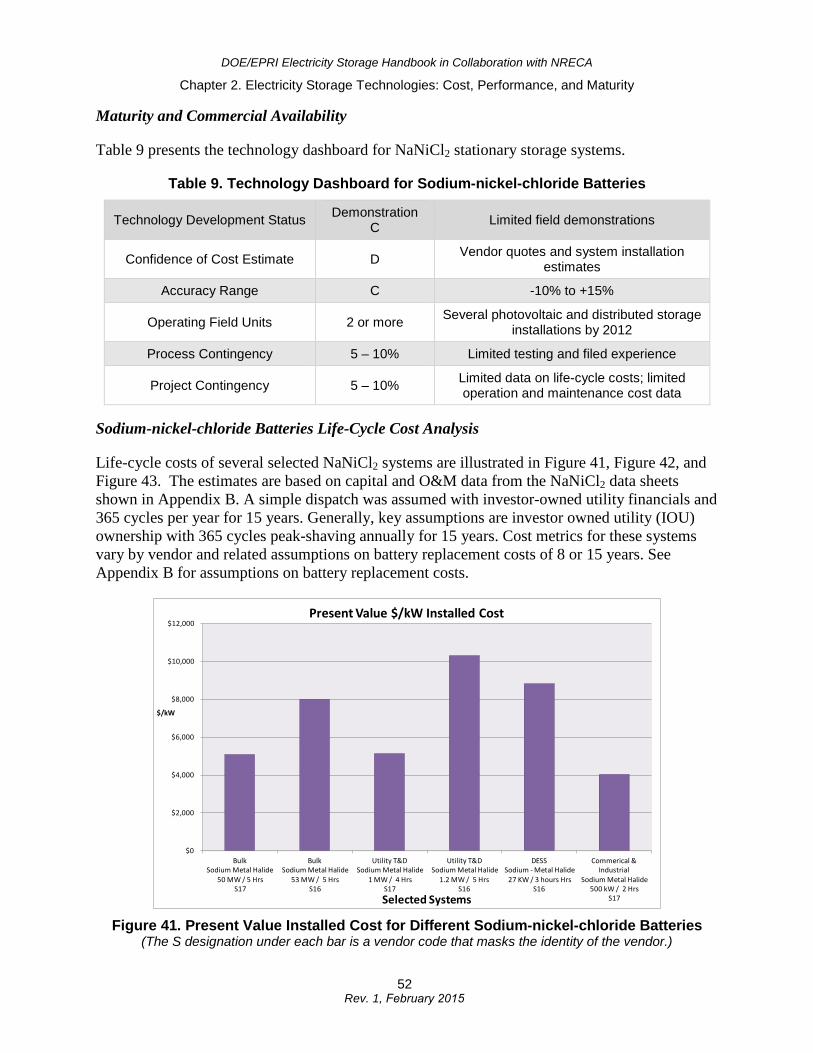
Figure 39 and Figure 40 show two FIAMM-developed containerized systems deployed at utility sites.
50 Rev. 1, February 2015
DOE/EPRI Electricity Storage Handbook in Collaboration with NRECA
Chapter 2. Electricity Storage Technologies: Cost, Performance, and Maturity
Figure 39. FIAMM 222-kWh System Site at the Duke Energy Rankin Substation
Figure 40. Containerized 25 kW/50 kWh FIAMM Battery Unit (large green housing) on Concrete Pad, Next to S&C PureWave CES (small green housing)
51 Rev. 1, February 2015
DOE/EPRI Electricity Storage Handbook in Collaboration with NRECA
Chapter 2. Electricity Storage Technologies: Cost, Performance, and Maturity
Maturity and Commercial Availability
Table 9 presents the technology dashboard for NaNiCl2 stationary storage systems.
Table 9. Technology Dashboard for Sodium-nickel-chloride Batteries
Technology Development Status Demonstration C Limited field demonstrations
Confidence of Cost Estimate D Vendor quotes and system installation estimates
Accuracy Range C -10% to +15%
Operating Field Units 2 or more Several photovoltaic and distributed storage installations by 2012
Process Contingency 5 – 10% Limited testing and filed experience
Project Contingency 5 – 10% Limited data on life-cycle costs; limited operation and maintenance cost data
Sodium-nickel-chloride Batteries Life-Cycle Cost Analysis
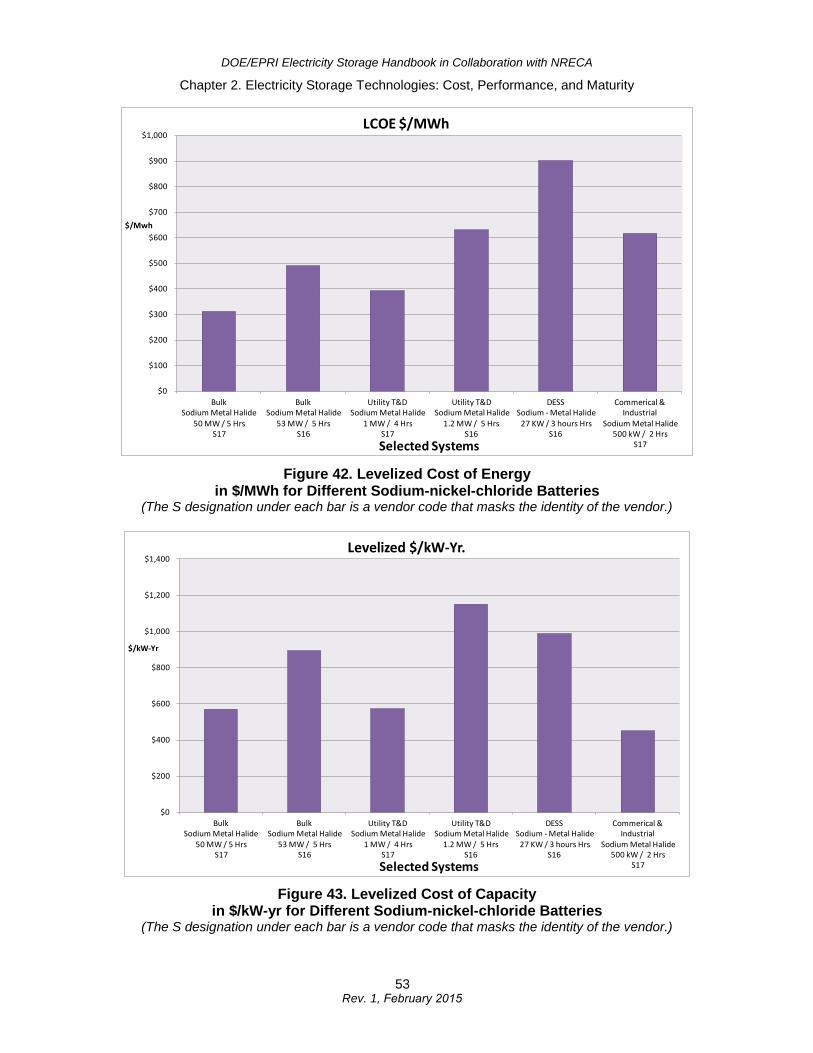
Life-cycle costs of several selected NaNiCl2 systems are illustrated in Figure 41, Figure 42, and Figure 43. The estimates are based on capital and O&M data from the NaNiCl2 data sheets shown in Appendix B. A simple dispatch was assumed with investor-owned utility financials and 365 cycles per year for 15 years. Generally, key assumptions are investor owned utility (IOU) ownership with 365 cycles peak-shaving annually for 15 years. Cost metrics for these systems vary by vendor and related assumptions on battery replacement costs of 8 or 15 years. See Appendix B for assumptions on battery replacement costs.
Figure 41. Present Value Installed Cost for Different Sodium-nickel-chloride Batteries (The S designation under each bar is a vendor code that masks the identity of the vendor.)
$0
$2,000
$4,000
$6,000
$8,000
$10,000
$12,000
Bulk Sodium Metal Halide
50 MW / 5 HrsS17
BulkSodium Metal Halide
53 MW / 5 HrsS16
Utility T&DSodium Metal Halide
1 MW / 4 HrsS17
Utility T&DSodium Metal Halide
1.2 MW / 5 HrsS16
DESSSodium - Metal Halide
27 KW / 3 hours Hrs S16
Commerical & Industrial
Sodium Metal Halide500 kW / 2 Hrs
S17
$/kW
Selected Systems
Present Value $/kW Installed Cost
52 Rev. 1, February 2015
DOE/EPRI Electricity Storage Handbook in Collaboration with NRECA
Chapter 2. Electricity Storage Technologies: Cost, Performance, and Maturity
Figure 42. Levelized Cost of Energy in $/MWh for Different Sodium-nickel-chloride Batteries
(The S designation under each bar is a vendor code that masks the identity of the vendor.)
Figure 43. Levelized Cost of Capacity in $/kW-yr for Different Sodium-nickel-chloride Batteries
(The S designation under each bar is a vendor code that masks the identity of the vendor.)
$0
$100
$200
$300
$400
$500
$600
$700
$800
$900
$1,000
Bulk Sodium Metal Halide
50 MW / 5 HrsS17
BulkSodium Metal Halide
53 MW / 5 HrsS16
Utility T&DSodium Metal Halide
1 MW / 4 HrsS17
Utility T&DSodium Metal Halide
1.2 MW / 5 HrsS16
DESSSodium - Metal Halide
27 KW / 3 hours Hrs S16
Commerical & Industrial
Sodium Metal Halide500 kW / 2 Hrs
S17
$/Mwh
Selected Systems
LCOE $/MWh
$0
$200
$400
$600
$800
$1,000
$1,200
$1,400
Bulk Sodium Metal Halide
50 MW / 5 HrsS17
BulkSodium Metal Halide
53 MW / 5 HrsS16
Utility T&DSodium Metal Halide
1 MW / 4 HrsS17
Utility T&DSodium Metal Halide
1.2 MW / 5 HrsS16
DESSSodium - Metal Halide
27 KW / 3 hours Hrs S16
Commerical & Industrial
Sodium Metal Halide500 kW / 2 Hrs
S17
$/kW-Yr
Selected Systems
Levelized $/kW-Yr.
53 Rev. 1, February 2015
DOE/EPRI Electricity Storage Handbook in Collaboration with NRECA
Chapter 2. Electricity Storage Technologies: Cost, Performance, and Maturity
Additional Sodium-nickel-chloride Battery Resource
1. Technology Review and Assessment of Distributed Energy Resources, EPRI ID 1012983,EPRI, Palo Alto, CA, February 2006.
2.7 Vanadium Redox Batteries Technical Description
Vanadium reduction and oxidation (redox) batteries are of a type known as flow batteries, in which one or both active materials is in solution in the electrolyte at all times. In this case, the vanadium ions remain in an aqueous acidic solution throughout the entire process.
The vanadium redox flow battery is a flow battery based on redox reactions of different ionic forms of vanadium. During battery charge, V3+ ions are converted to V2+ ions at the negative electrode through the acceptance of electrons. Meanwhile, at the positive electrode, V4+ ions are converted to V5+ ions through the release of electrons. Both of these reactions absorb the electrical energy put into the system and store it chemically. During discharge, the reactions run in the opposite direction, resulting in the release of the chemical energy as electrical energy.
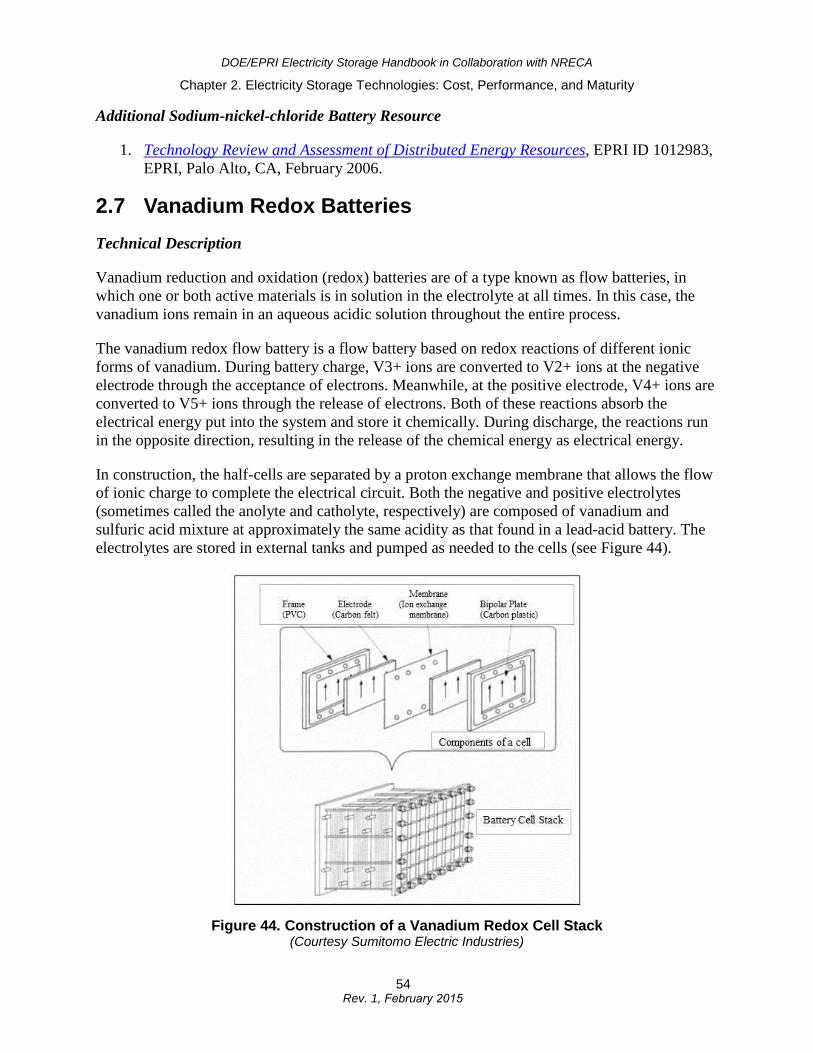
In construction, the half-cells are separated by a proton exchange membrane that allows the flow of ionic charge to complete the electrical circuit. Both the negative and positive electrolytes (sometimes called the anolyte and catholyte, respectively) are composed of vanadium and sulfuric acid mixture at approximately the same acidity as that found in a lead-acid battery. The electrolytes are stored in external tanks and pumped as needed to the cells (see Figure 44).
Figure 44. Construction of a Vanadium Redox Cell Stack (Courtesy Sumitomo Electric Industries)
54 Rev. 1, February 2015
DOE/EPRI Electricity Storage Handbook in Collaboration with NRECA
Chapter 2. Electricity Storage Technologies: Cost, Performance, and Maturity
Individual cells have a nominal open-circuit voltage of about 1.4 V. To achieve higher voltages, cells are connected in series to produce cell stacks. Vanadium redox flow batteries have an important advantage among flow batteries: the two electrolytes are identical when fully discharged. This makes shipment and storage simple and inexpensive and greatly simplifies electrolyte management during operation.32
Self-discharge is typically not a problem for vanadium redox systems, because the electrolytes are stored in separate tanks. Self-discharge may occur within the cell stack if it is filled with charged electrolyte, resulting in the loss of energy and heat generation in the stacks. For this reason, the stacks are usually elevated above the tanks, so that electrolyte drains back into the tanks when the pumps are shut down. The battery will then take a short while to come back into operation again. Alternatively, the pumps can operate in an idling state, which would allow charged electrolyte to be available at all times, at the price of a slightly higher parasitic loss.33
The life of a vanadium redox system is determined by a number of components. The cell stack is probably the limited life component, with a useful life estimated at ~10 years; however, operational field data are not available to confirm these lifetimes. The tanks, plumbing, structure, power electronics, and controls have a longer useful life. The electrolytes and the active materials they contain do not degrade with time.
Vanadium redox systems are capable of stepping from zero output to full output within a few milliseconds, if the stacks are already primed with reactants. In fact, the limiting factor for beginning battery discharge is more commonly the controls and communications equipment. For short-duration discharges for voltage support, the electrolyte contained in the stacks can respond without the pumps running at all. The cell stack can produce three times the rated power output provided the state of charge is between 50% and 80%.34
The physical scale of vanadium redox systems tends to be large due to the large volumes of electrolyte required when sized for utility-scale (megawatt-hour) projects. Unlike many other battery technologies, cycle life of vanadium redox systems is not dependent on depth of discharge. Systems are rated at 10,000 cycles, although some accelerated testing performed by Sumitomo Electric Industries, Ltd., produced a battery system with one 20-kW stack for cycle testing that continued for more than 13,000 cycles over about two years.
When decommissioning a vanadium redox system, the solid ion exchange cell membranes may be highly acidic or alkaline and therefore toxic. They should be disposed of in the same manner as any corrosive material. If possible, the liquid electrolyte is recycled. If disposed of, the
32 VRB Energy Storage for Voltage Stabilization: Testing and Evaluation of the PacifiCorp Vanadium Redox Battery Energy Storage System at Castle Valley, Utah, EPRI ID 1008434, EPRI, Palo Alto, CA, 2005.
33 EPRI-DOE Handbook of Energy Storage for Transmission and Distribution Applications, EPRI, Palo Alto, CA, and the U.S. Department of Energy, Washington, DC: 2003. 1001834. L. D. Mears, H. L. Gotschall - Technology Insights; T. Key, H. Kamath - EPRI PEAC Corporation; http://www.epri.com/abstracts/Pages/ProductAbstract.aspx?ProductId=000000000001001834.
34 Ibid.
55 Rev. 1, February 2015
DOE/EPRI Electricity Storage Handbook in Collaboration with NRECA
Chapter 2. Electricity Storage Technologies: Cost, Performance, and Maturity
vanadium is extracted from the electrolyte before further processing of the liquid. Research is ongoing to determine the exact environmental risk factors for vanadium.
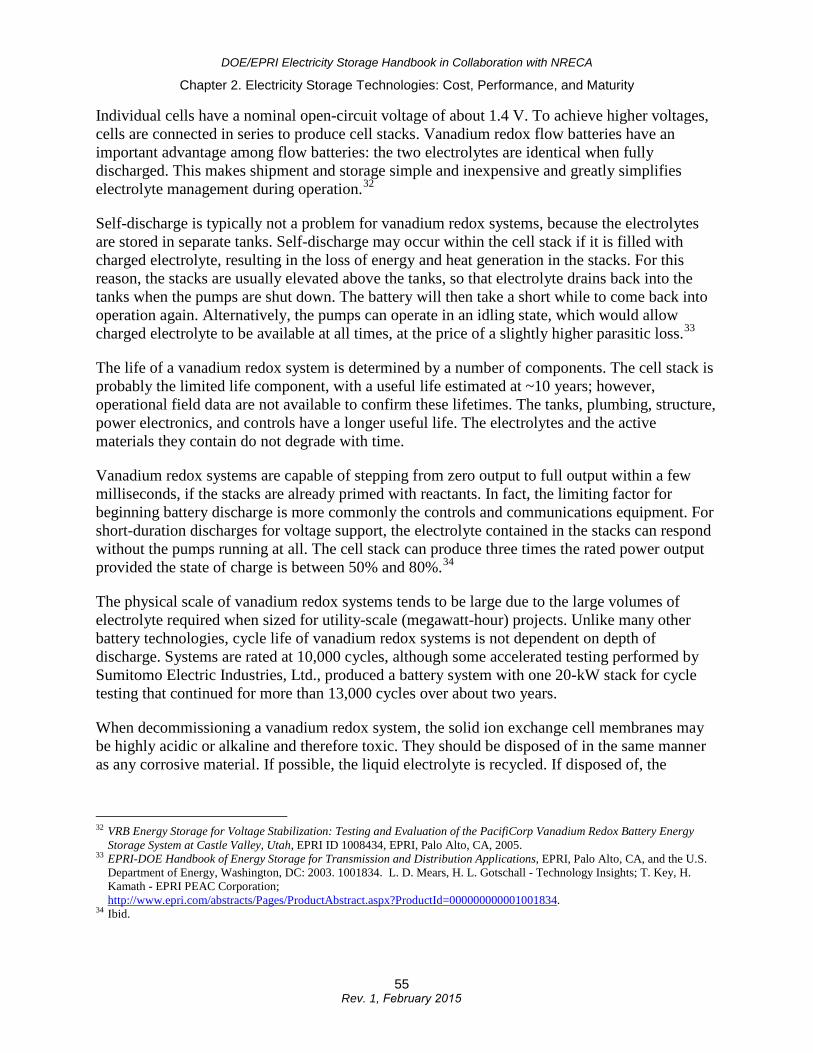
Figure 4535 illustrates the schematic of a vanadium redox flow battery.
Technical Maturity
Table 10 illustrates a dashboard for a vanadium flow battery system. This type of flow battery is technically the more mature battery of all the flow-type battery systems.
Figure 45. Principles of the Vanadium Redox Battery (Courtesy of the Pacific Northwest National Laboratory)
35 VRB Energy Storage for Voltage Stabilization: Testing and Evaluation of the PacifiCorp Vanadium Redox Battery Energy Storage System at Castle Valley, Utah, PI: Harash Kamath – EPRI PEAC Corporation, EPRI ID 1008434, EPRI, Palo Alto, CA, March 2005.
56 Rev. 1, February 2015
DOE/EPRI Electricity Storage Handbook in Collaboration with NRECA
Chapter 2. Electricity Storage Technologies: Cost, Performance, and Maturity
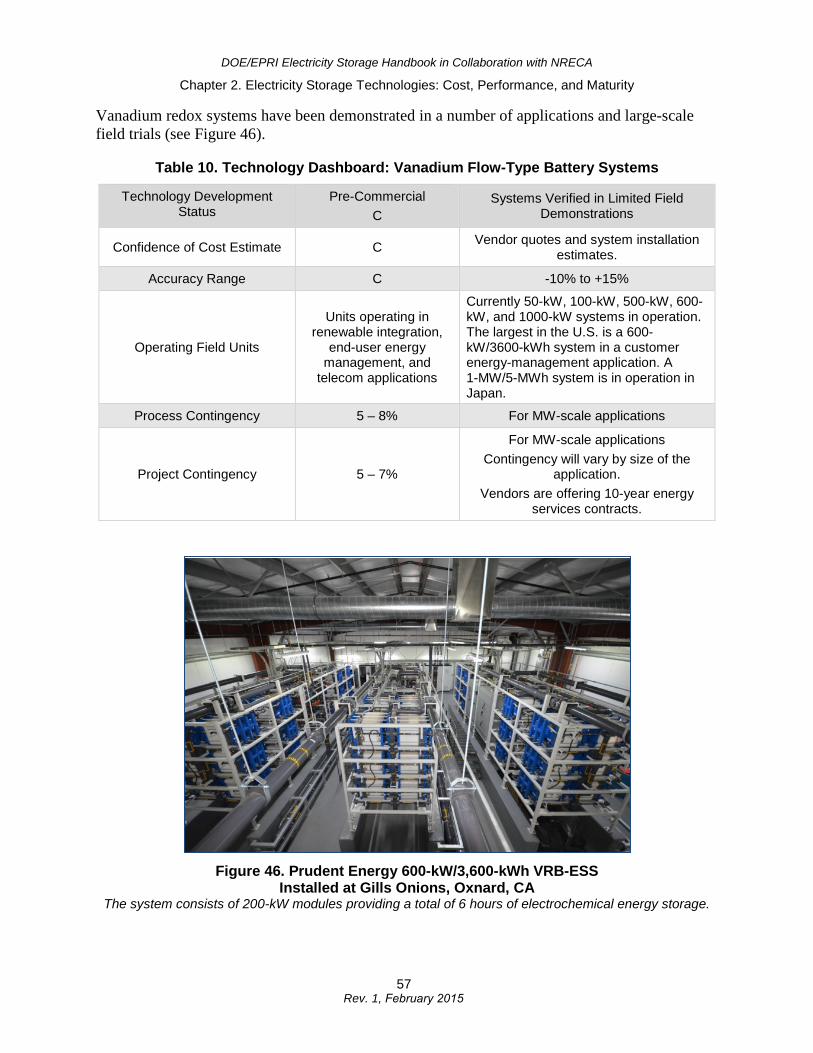
Vanadium redox systems have been demonstrated in a number of applications and large-scale field trials (see Figure 46).
Table 10. Technology Dashboard: Vanadium Flow-Type Battery Systems
Technology Development Status
Pre-Commercial C
Systems Verified in Limited Field Demonstrations
Confidence of Cost Estimate C Vendor quotes and system installation estimates.
Accuracy Range C -10% to +15%
Operating Field Units
Units operating in renewable integration,
end-user energy management, and
telecom applications
Currently 50-kW, 100-kW, 500-kW, 600-kW, and 1000-kW systems in operation. The largest in the U.S. is a 600-kW/3600-kWh system in a customer energy-management application. A 1-MW/5-MWh system is in operation in Japan.
Process Contingency 5 – 8% For MW-scale applications
Project Contingency 5 – 7%
For MW-scale applications Contingency will vary by size of the
application. Vendors are offering 10-year energy
services contracts.
Figure 46. Prudent Energy 600-kW/3,600-kWh VRB-ESS Installed at Gills Onions, Oxnard, CA
The system consists of 200-kW modules providing a total of 6 hours of electrochemical energy storage.
57 Rev. 1, February 2015
DOE/EPRI Electricity Storage Handbook in Collaboration with NRECA
Chapter 2. Electricity Storage Technologies: Cost, Performance, and Maturity
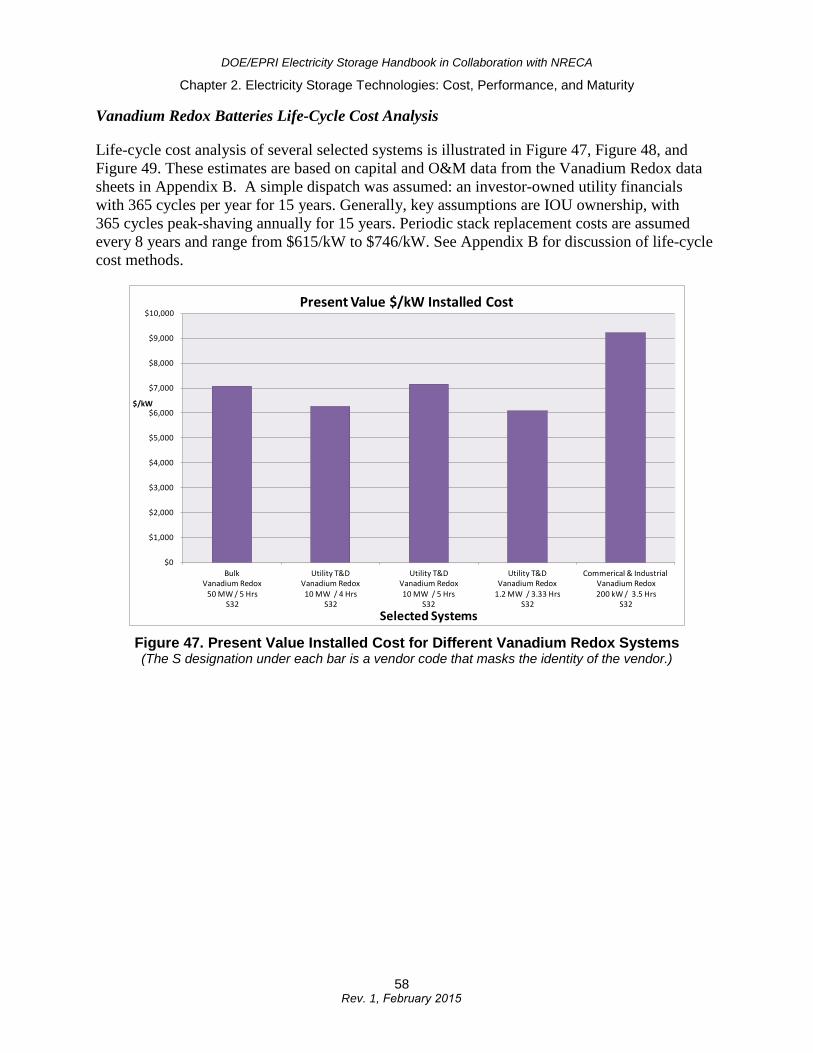
Vanadium Redox Batteries Life-Cycle Cost Analysis
Life-cycle cost analysis of several selected systems is illustrated in Figure 47, Figure 48, and Figure 49. These estimates are based on capital and O&M data from the Vanadium Redox data sheets in Appendix B. A simple dispatch was assumed: an investor-owned utility financials with 365 cycles per year for 15 years. Generally, key assumptions are IOU ownership, with 365 cycles peak-shaving annually for 15 years. Periodic stack replacement costs are assumed every 8 years and range from $615/kW to $746/kW. See Appendix B for discussion of life-cycle cost methods.
Figure 47. Present Value Installed Cost for Different Vanadium Redox Systems (The S designation under each bar is a vendor code that masks the identity of the vendor.)
$0
$1,000
$2,000
$3,000
$4,000
$5,000
$6,000
$7,000
$8,000
$9,000
$10,000
Bulk Vanadium Redox
50 MW / 5 HrsS32
Utility T&D Vanadium Redox10 MW / 4 Hrs
S32
Utility T&D Vanadium Redox 10 MW / 5 Hrs
S32
Utility T&DVanadium Redox
1.2 MW / 3.33 HrsS32
Commerical & IndustrialVanadium Redox200 kW / 3.5 Hrs
S32
$/kW
Selected Systems
Present Value $/kW Installed Cost
58 Rev. 1, February 2015
DOE/EPRI Electricity Storage Handbook in Collaboration with NRECA
Chapter 2. Electricity Storage Technologies: Cost, Performance, and Maturity
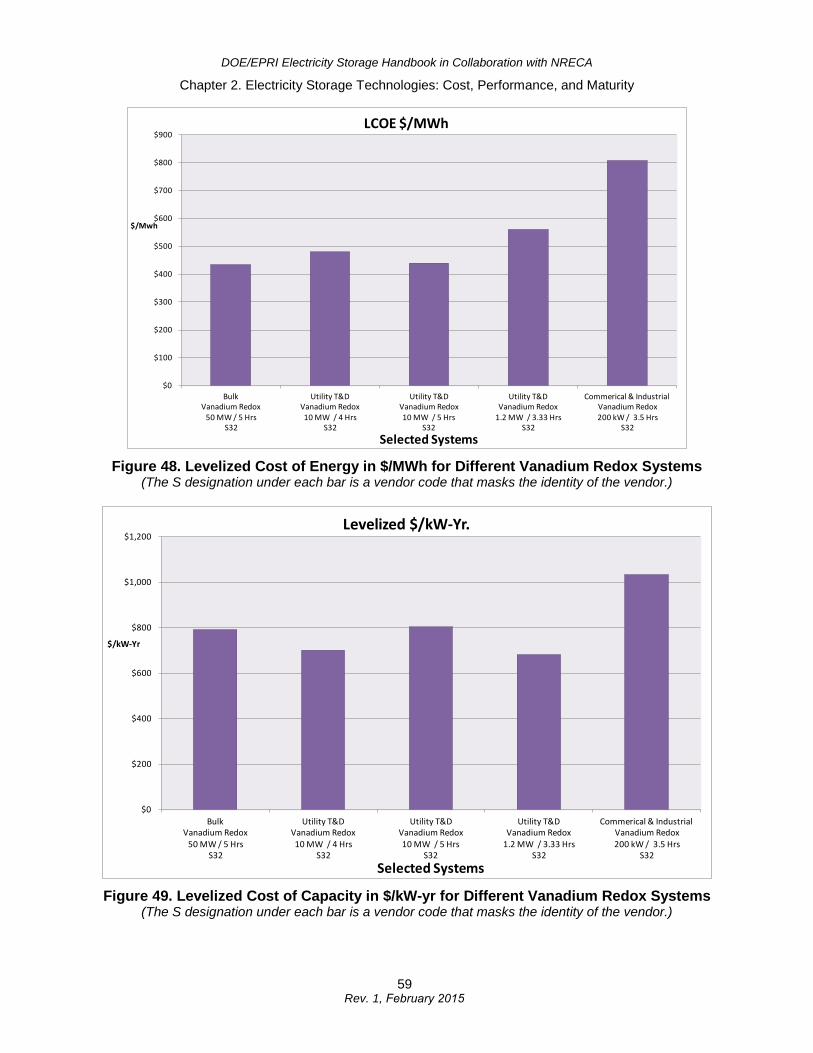
Figure 48. Levelized Cost of Energy in $/MWh for Different Vanadium Redox Systems (The S designation under each bar is a vendor code that masks the identity of the vendor.)
Figure 49. Levelized Cost of Capacity in $/kW-yr for Different Vanadium Redox Systems (The S designation under each bar is a vendor code that masks the identity of the vendor.)
$0
$100
$200
$300
$400
$500
$600
$700
$800
$900
Bulk Vanadium Redox
50 MW / 5 HrsS32
Utility T&D Vanadium Redox10 MW / 4 Hrs
S32
Utility T&D Vanadium Redox 10 MW / 5 Hrs
S32
Utility T&DVanadium Redox
1.2 MW / 3.33 HrsS32
Commerical & IndustrialVanadium Redox200 kW / 3.5 Hrs
S32
$/Mwh
Selected Systems
LCOE $/MWh
$0
$200
$400
$600
$800
$1,000
$1,200
Bulk Vanadium Redox
50 MW / 5 HrsS32
Utility T&D Vanadium Redox10 MW / 4 Hrs
S32
Utility T&D Vanadium Redox 10 MW / 5 Hrs
S32
Utility T&DVanadium Redox
1.2 MW / 3.33 HrsS32
Commerical & IndustrialVanadium Redox200 kW / 3.5 Hrs
S32
$/kW-Yr
Selected Systems
Levelized $/kW-Yr.
59 Rev. 1, February 2015
DOE/EPRI Electricity Storage Handbook in Collaboration with NRECA
Chapter 2. Electricity Storage Technologies: Cost, Performance, and Maturity
Additional Vanadium Redox Battery Resources
1. VRB Energy Storage for Voltage Stabilization: Testing and Evaluation of the PacifiCorpVanadium Redox Battery Energy Storage System at Castle Valley, Utah, EPRI ID1008434, EPRI, Palo Alto, CA, March 2005.
2. Vanadium Redox Flow Batteries, EPRI ID 1014836, EPRI, Palo Alto, CA, March 2007.
3. Assessment of Advanced Batteries for Energy Storage Applications in DeregulatedElectric Utilities, EPRI ID TR-111162, EPRI, Palo Alto, CA, December 1998.
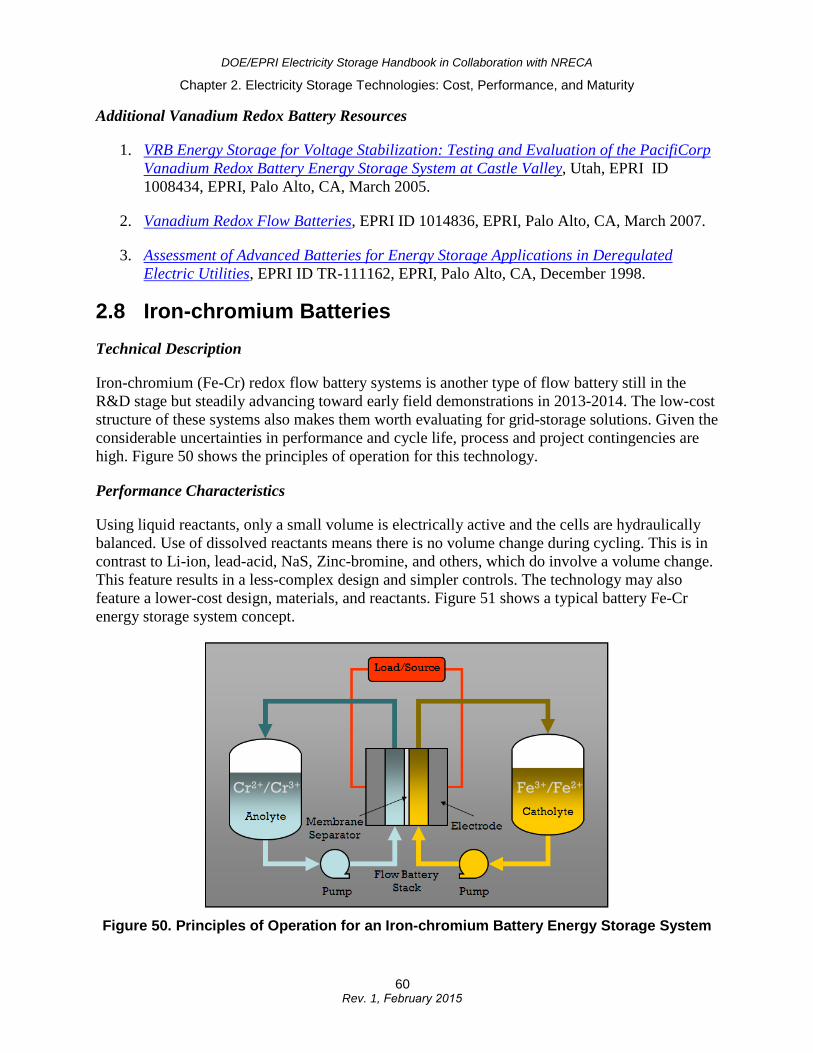
2.8 Iron-chromium Batteries Technical Description
Iron-chromium (Fe-Cr) redox flow battery systems is another type of flow battery still in the R&D stage but steadily advancing toward early field demonstrations in 2013-2014. The low-cost structure of these systems also makes them worth evaluating for grid-storage solutions. Given the considerable uncertainties in performance and cycle life, process and project contingencies are high. Figure 50 shows the principles of operation for this technology.
Performance Characteristics
Using liquid reactants, only a small volume is electrically active and the cells are hydraulically balanced. Use of dissolved reactants means there is no volume change during cycling. This is in contrast to Li-ion, lead-acid, NaS, Zinc-bromine, and others, which do involve a volume change. This feature results in a less-complex design and simpler controls. The technology may also feature a lower-cost design, materials, and reactants. Figure 51 shows a typical battery Fe-Cr energy storage system concept.
Figure 50. Principles of Operation for an Iron-chromium Battery Energy Storage System
Cr2+/Cr3+ Fe3+/Fe2+Cr2+/Cr3+ Fe3+/Fe2+
60 Rev. 1, February 2015
DOE/EPRI Electricity Storage Handbook in Collaboration with NRECA
Chapter 2. Electricity Storage Technologies: Cost, Performance, and Maturity
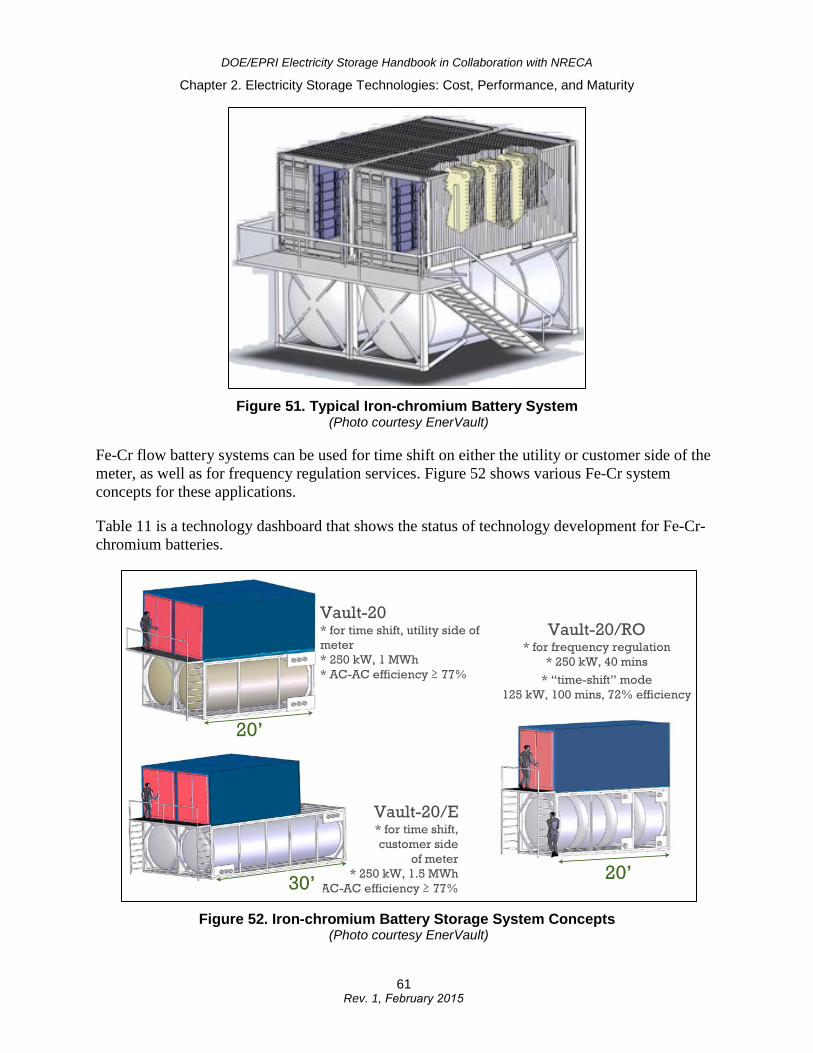
Figure 51. Typical Iron-chromium Battery System (Photo courtesy EnerVault)
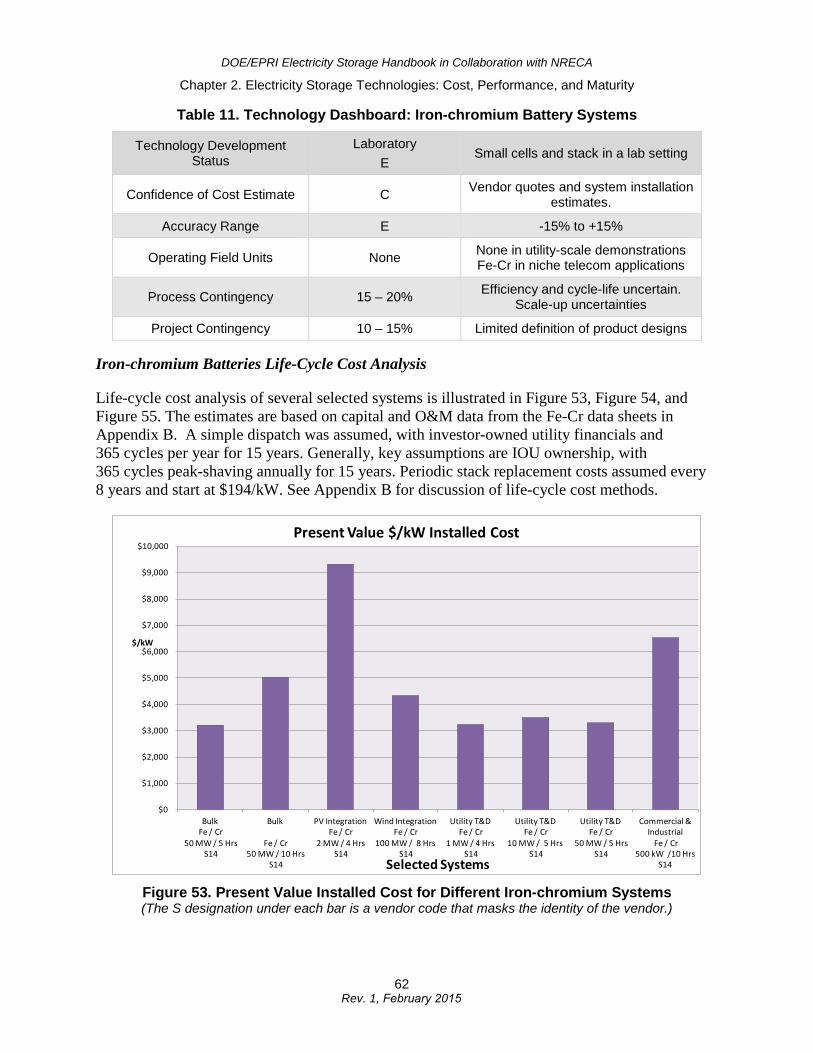
Fe-Cr flow battery systems can be used for time shift on either the utility or customer side of the meter, as well as for frequency regulation services. Figure 52 shows various Fe-Cr system concepts for these applications.
Table 11 is a technology dashboard that shows the status of technology development for Fe-Cr-chromium batteries.
Figure 52. Iron-chromium Battery Storage System Concepts (Photo courtesy EnerVault)
20’
20’
Vault-20/RO* for frequency regulation
* 250 kW, 40 mins* “time-shift” mode
125 kW, 100 mins, 72% efficiency
Vault-20* for time shift, utility side ofmeter* 250 kW, 1 MWh* AC-AC efficiency ≥ 77%
Vault-20/E* for time shift,customer side
of meter* 250 kW, 1.5 MWh
* AC-AC efficiency ≥ 77%30’
61 Rev. 1, February 2015
DOE/EPRI Electricity Storage Handbook in Collaboration with NRECA
Chapter 2. Electricity Storage Technologies: Cost, Performance, and Maturity
Table 11. Technology Dashboard: Iron-chromium Battery Systems
Technology Development Status
Laboratory E
Small cells and stack in a lab setting
Confidence of Cost Estimate C Vendor quotes and system installation estimates.
Accuracy Range E -15% to +15%
Operating Field Units None None in utility-scale demonstrations Fe-Cr in niche telecom applications
Process Contingency 15 – 20% Efficiency and cycle-life uncertain. Scale-up uncertainties
Project Contingency 10 – 15% Limited definition of product designs
Iron-chromium Batteries Life-Cycle Cost Analysis
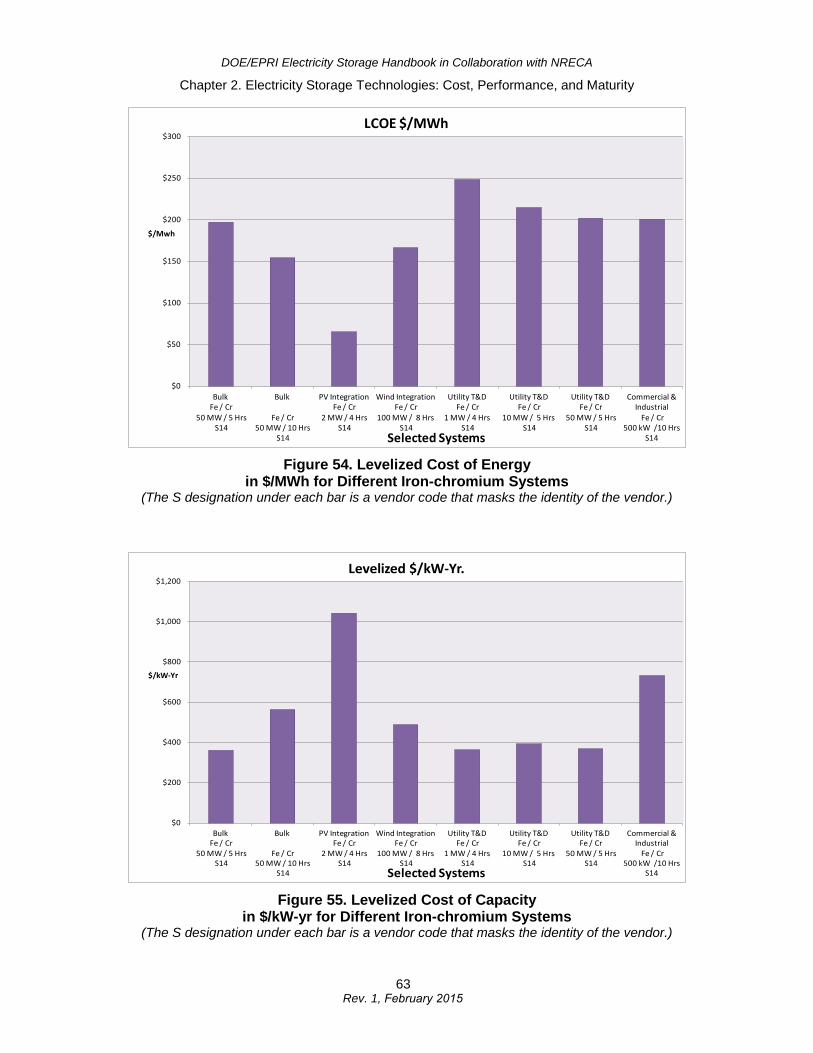
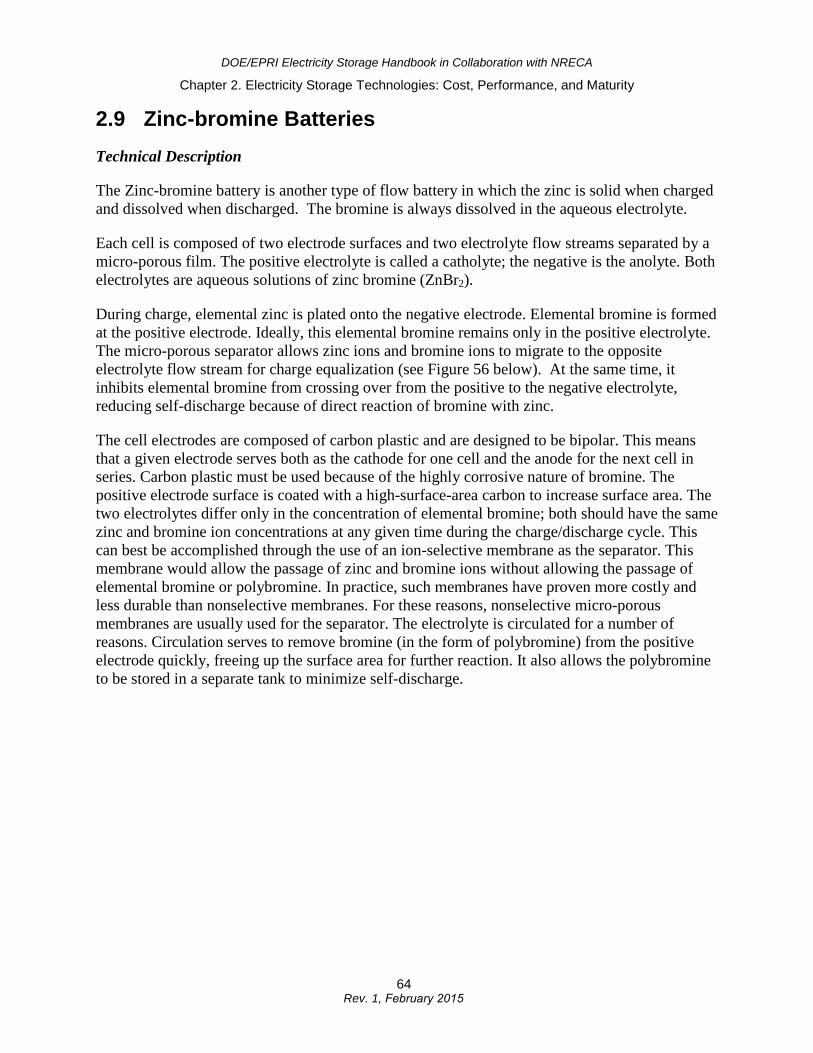
Life-cycle cost analysis of several selected systems is illustrated in Figure 53, Figure 54, and Figure 55. The estimates are based on capital and O&M data from the Fe-Cr data sheets in Appendix B. A simple dispatch was assumed, with investor-owned utility financials and 365 cycles per year for 15 years. Generally, key assumptions are IOU ownership, with 365 cycles peak-shaving annually for 15 years. Periodic stack replacement costs assumed every 8 years and start at $194/kW. See Appendix B for discussion of life-cycle cost methods.
Figure 53. Present Value Installed Cost for Different Iron-chromium Systems (The S designation under each bar is a vendor code that masks the identity of the vendor.)
$0
$1,000
$2,000
$3,000
$4,000
$5,000
$6,000
$7,000
$8,000
$9,000
$10,000
BulkFe / Cr
50 MW / 5 HrsS14
Bulk
Fe / Cr50 MW / 10 Hrs
S14
PV Integration Fe / Cr
2 MW / 4 HrsS14
Wind IntegrationFe / Cr
100 MW / 8 HrsS14
Utility T&DFe / Cr
1 MW / 4 HrsS14
Utility T&DFe / Cr
10 MW / 5 HrsS14
Utility T&D Fe / Cr
50 MW / 5 HrsS14
Commercial & Industrial
Fe / Cr 500 kW /10 Hrs
S14
$/kW
Selected Systems
Present Value $/kW Installed Cost
62 Rev. 1, February 2015
DOE/EPRI Electricity Storage Handbook in Collaboration with NRECA
Chapter 2. Electricity Storage Technologies: Cost, Performance, and Maturity
Figure 54. Levelized Cost of Energy in $/MWh for Different Iron-chromium Systems
(The S designation under each bar is a vendor code that masks the identity of the vendor.)
Figure 55. Levelized Cost of Capacity in $/kW-yr for Different Iron-chromium Systems
(The S designation under each bar is a vendor code that masks the identity of the vendor.)
$0
$50
$100
$150
$200
$250
$300
BulkFe / Cr
50 MW / 5 HrsS14
Bulk
Fe / Cr50 MW / 10 Hrs
S14
PV Integration Fe / Cr
2 MW / 4 HrsS14
Wind IntegrationFe / Cr
100 MW / 8 HrsS14
Utility T&DFe / Cr
1 MW / 4 HrsS14
Utility T&DFe / Cr
10 MW / 5 HrsS14
Utility T&D Fe / Cr
50 MW / 5 HrsS14
Commercial & Industrial
Fe / Cr 500 kW /10 Hrs
S14
$/Mwh
Selected Systems
LCOE $/MWh
$0
$200
$400
$600
$800
$1,000
$1,200
BulkFe / Cr
50 MW / 5 HrsS14
Bulk
Fe / Cr50 MW / 10 Hrs
S14
PV Integration Fe / Cr
2 MW / 4 HrsS14
Wind IntegrationFe / Cr
100 MW / 8 HrsS14
Utility T&DFe / Cr
1 MW / 4 HrsS14
Utility T&DFe / Cr
10 MW / 5 HrsS14
Utility T&D Fe / Cr
50 MW / 5 HrsS14
Commercial & Industrial
Fe / Cr 500 kW /10 Hrs
S14
$/kW-Yr
Selected Systems
Levelized $/kW-Yr.
63 Rev. 1, February 2015
DOE/EPRI Electricity Storage Handbook in Collaboration with NRECA
Chapter 2. Electricity Storage Technologies: Cost, Performance, and Maturity
2.9 Zinc-bromine Batteries Technical Description
The Zinc-bromine battery is another type of flow battery in which the zinc is solid when charged and dissolved when discharged. The bromine is always dissolved in the aqueous electrolyte.
Each cell is composed of two electrode surfaces and two electrolyte flow streams separated by a micro-porous film. The positive electrolyte is called a catholyte; the negative is the anolyte. Both electrolytes are aqueous solutions of zinc bromine (ZnBr2).
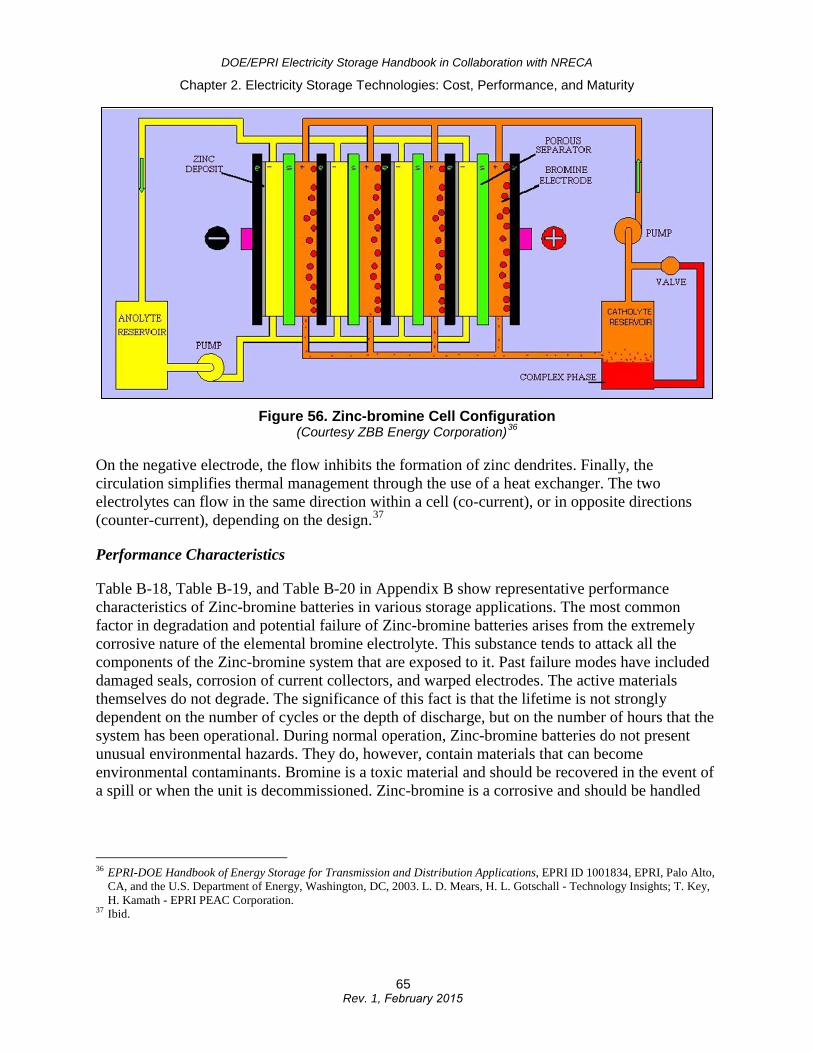
During charge, elemental zinc is plated onto the negative electrode. Elemental bromine is formed at the positive electrode. Ideally, this elemental bromine remains only in the positive electrolyte. The micro-porous separator allows zinc ions and bromine ions to migrate to the opposite electrolyte flow stream for charge equalization (see Figure 56 below). At the same time, it inhibits elemental bromine from crossing over from the positive to the negative electrolyte, reducing self-discharge because of direct reaction of bromine with zinc.
The cell electrodes are composed of carbon plastic and are designed to be bipolar. This means that a given electrode serves both as the cathode for one cell and the anode for the next cell in series. Carbon plastic must be used because of the highly corrosive nature of bromine. The positive electrode surface is coated with a high-surface-area carbon to increase surface area. The two electrolytes differ only in the concentration of elemental bromine; both should have the same zinc and bromine ion concentrations at any given time during the charge/discharge cycle. This can best be accomplished through the use of an ion-selective membrane as the separator. This membrane would allow the passage of zinc and bromine ions without allowing the passage of elemental bromine or polybromine. In practice, such membranes have proven more costly and less durable than nonselective membranes. For these reasons, nonselective micro-porous membranes are usually used for the separator. The electrolyte is circulated for a number of reasons. Circulation serves to remove bromine (in the form of polybromine) from the positive electrode quickly, freeing up the surface area for further reaction. It also allows the polybromine to be stored in a separate tank to minimize self-discharge.
64 Rev. 1, February 2015
DOE/EPRI Electricity Storage Handbook in Collaboration with NRECA
Chapter 2. Electricity Storage Technologies: Cost, Performance, and Maturity
Figure 56. Zinc-bromine Cell Configuration (Courtesy ZBB Energy Corporation)36
On the negative electrode, the flow inhibits the formation of zinc dendrites. Finally, the circulation simplifies thermal management through the use of a heat exchanger. The two electrolytes can flow in the same direction within a cell (co-current), or in opposite directions (counter-current), depending on the design.37
Performance Characteristics
Table B-18, Table B-19, and Table B-20 in Appendix B show representative performance characteristics of Zinc-bromine batteries in various storage applications. The most common factor in degradation and potential failure of Zinc-bromine batteries arises from the extremely corrosive nature of the elemental bromine electrolyte. This substance tends to attack all the components of the Zinc-bromine system that are exposed to it. Past failure modes have included damaged seals, corrosion of current collectors, and warped electrodes. The active materials themselves do not degrade. The significance of this fact is that the lifetime is not strongly dependent on the number of cycles or the depth of discharge, but on the number of hours that the system has been operational. During normal operation, Zinc-bromine batteries do not present unusual environmental hazards. They do, however, contain materials that can become environmental contaminants. Bromine is a toxic material and should be recovered in the event of a spill or when the unit is decommissioned. Zinc-bromine is a corrosive and should be handled
36 EPRI-DOE Handbook of Energy Storage for Transmission and Distribution Applications, EPRI ID 1001834, EPRI, Palo Alto, CA, and the U.S. Department of Energy, Washington, DC, 2003. L. D. Mears, H. L. Gotschall - Technology Insights; T. Key, H. Kamath - EPRI PEAC Corporation.
37 Ibid.
65 Rev. 1, February 2015
DOE/EPRI Electricity Storage Handbook in Collaboration with NRECA
Chapter 2. Electricity Storage Technologies: Cost, Performance, and Maturity
appropriately. Zinc is considered a transition-metal contaminant in some locales and thus should be properly recovered when the unit is decommissioned.38
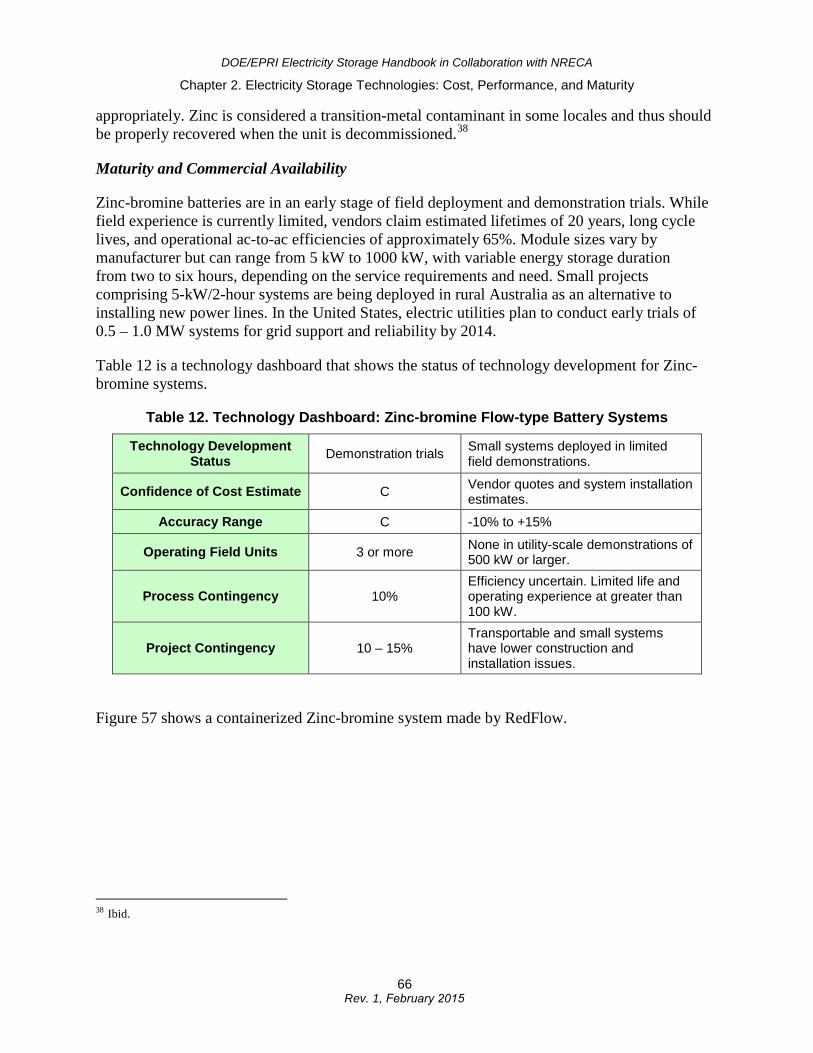
Maturity and Commercial Availability
Zinc-bromine batteries are in an early stage of field deployment and demonstration trials. While field experience is currently limited, vendors claim estimated lifetimes of 20 years, long cycle lives, and operational ac-to-ac efficiencies of approximately 65%. Module sizes vary by manufacturer but can range from 5 kW to 1000 kW, with variable energy storage duration from two to six hours, depending on the service requirements and need. Small projects comprising 5-kW/2-hour systems are being deployed in rural Australia as an alternative to installing new power lines. In the United States, electric utilities plan to conduct early trials of 0.5 – 1.0 MW systems for grid support and reliability by 2014.
Table 12 is a technology dashboard that shows the status of technology development for Zinc-bromine systems.
Table 12. Technology Dashboard: Zinc-bromine Flow-type Battery Systems
Technology Development Status Demonstration trials Small systems deployed in limited
field demonstrations.
Confidence of Cost Estimate C Vendor quotes and system installation estimates.
Accuracy Range C -10% to +15%
Operating Field Units 3 or more None in utility-scale demonstrations of 500 kW or larger.
Process Contingency 10% Efficiency uncertain. Limited life and operating experience at greater than 100 kW.
Project Contingency 10 – 15% Transportable and small systems have lower construction and installation issues.
Figure 57 shows a containerized Zinc-bromine system made by RedFlow.
38 Ibid.
66 Rev. 1, February 2015
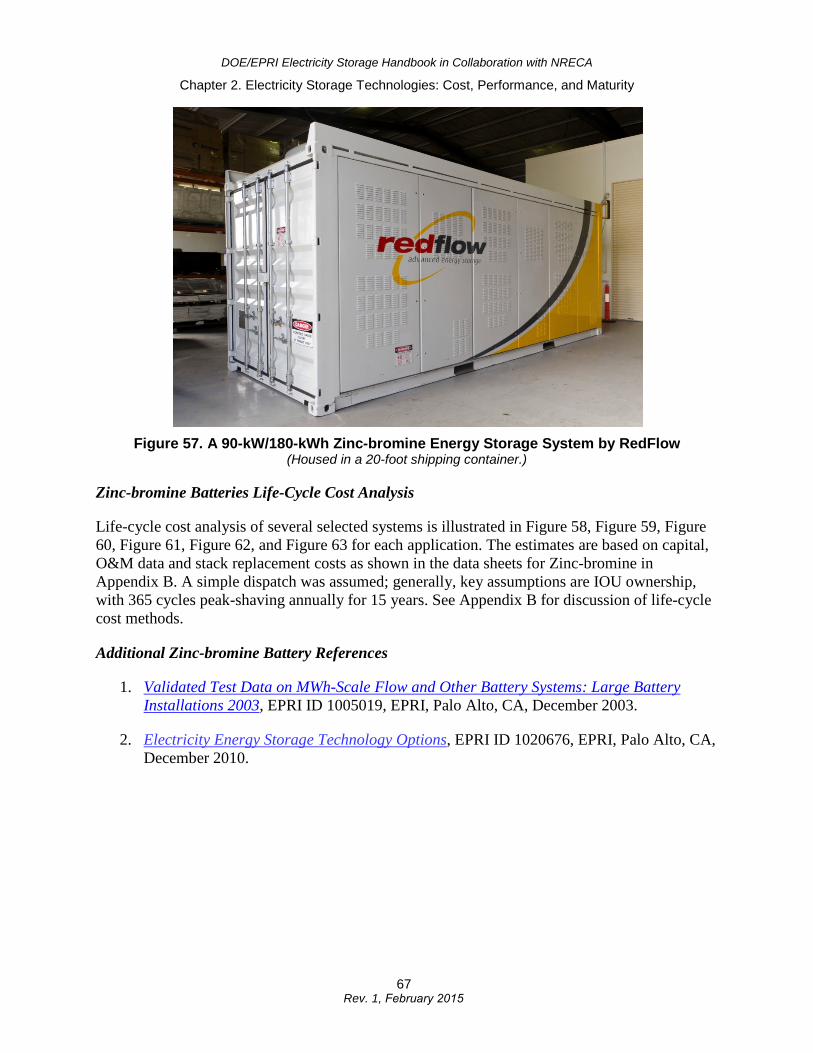
DOE/EPRI Electricity Storage Handbook in Collaboration with NRECA
Chapter 2. Electricity Storage Technologies: Cost, Performance, and Maturity
Figure 57. A 90-kW/180-kWh Zinc-bromine Energy Storage System by RedFlow (Housed in a 20-foot shipping container.)
Zinc-bromine Batteries Life-Cycle Cost Analysis
Life-cycle cost analysis of several selected systems is illustrated in Figure 58, Figure 59, Figure 60, Figure 61, Figure 62, and Figure 63 for each application. The estimates are based on capital, O&M data and stack replacement costs as shown in the data sheets for Zinc-bromine in Appendix B. A simple dispatch was assumed; generally, key assumptions are IOU ownership, with 365 cycles peak-shaving annually for 15 years. See Appendix B for discussion of life-cycle cost methods.
Additional Zinc-bromine Battery References
1. Validated Test Data on MWh-Scale Flow and Other Battery Systems: Large BatteryInstallations 2003, EPRI ID 1005019, EPRI, Palo Alto, CA, December 2003.
2. Electricity Energy Storage Technology Options, EPRI ID 1020676, EPRI, Palo Alto, CA,December 2010.
67 Rev. 1, February 2015
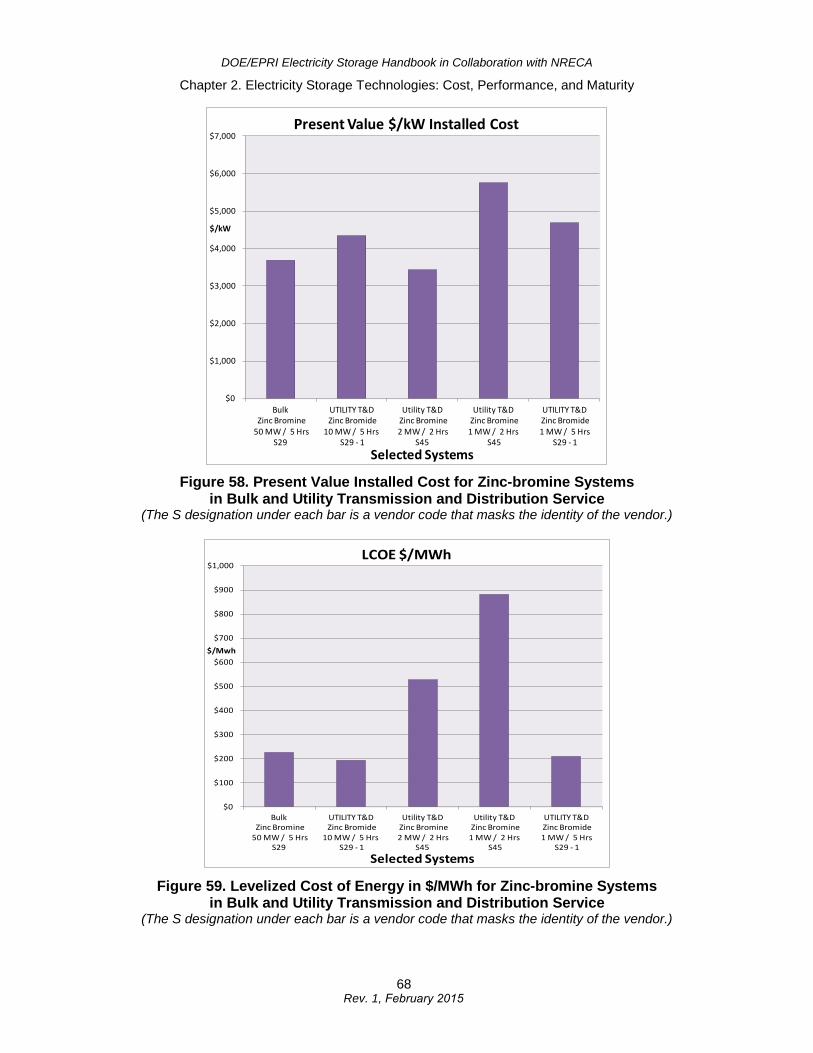
DOE/EPRI Electricity Storage Handbook in Collaboration with NRECA
Chapter 2. Electricity Storage Technologies: Cost, Performance, and Maturity
Figure 58. Present Value Installed Cost for Zinc-bromine Systems in Bulk and Utility Transmission and Distribution Service
(The S designation under each bar is a vendor code that masks the identity of the vendor.)
Figure 59. Levelized Cost of Energy in $/MWh for Zinc-bromine Systems in Bulk and Utility Transmission and Distribution Service
(The S designation under each bar is a vendor code that masks the identity of the vendor.)
$0
$1,000
$2,000
$3,000
$4,000
$5,000
$6,000
$7,000
BulkZinc Bromine
50 MW / 5 Hrs S29
UTILITY T&DZinc Bromide
10 MW / 5 HrsS29 - 1
Utility T&DZinc Bromine2 MW / 2 Hrs
S45
Utility T&DZinc Bromine
1 MW / 2 Hrs S45
UTILITY T&DZinc Bromide1 MW / 5 Hrs
S29 - 1
$/kW
Selected Systems
Present Value $/kW Installed Cost
$0
$100
$200
$300
$400
$500
$600
$700
$800
$900
$1,000
BulkZinc Bromine
50 MW / 5 Hrs S29
UTILITY T&DZinc Bromide
10 MW / 5 HrsS29 - 1
Utility T&DZinc Bromine2 MW / 2 Hrs
S45
Utility T&DZinc Bromine
1 MW / 2 Hrs S45
UTILITY T&DZinc Bromide1 MW / 5 Hrs
S29 - 1
$/Mwh
Selected Systems
LCOE $/MWh
68 Rev. 1, February 2015
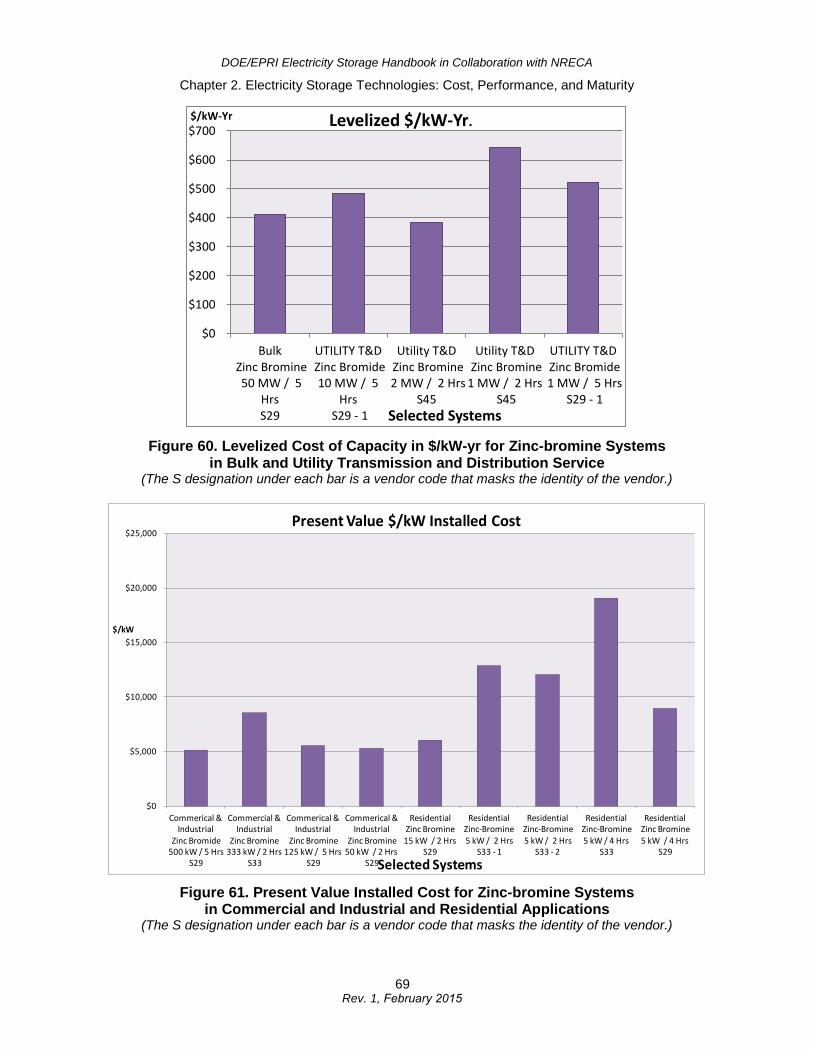
DOE/EPRI Electricity Storage Handbook in Collaboration with NRECA
Chapter 2. Electricity Storage Technologies: Cost, Performance, and Maturity
Figure 60. Levelized Cost of Capacity in $/kW-yr for Zinc-bromine Systems in Bulk and Utility Transmission and Distribution Service
(The S designation under each bar is a vendor code that masks the identity of the vendor.)
Figure 61. Present Value Installed Cost for Zinc-bromine Systems in Commercial and Industrial and Residential Applications
(The S designation under each bar is a vendor code that masks the identity of the vendor.)
$0
$100
$200
$300
$400
$500
$600
$700
Bulk Zinc Bromine 50 MW / 5
HrsS29
UTILITY T&D Zinc Bromide
10 MW / 5Hrs
S29 - 1
Utility T&D Zinc Bromine 2 MW / 2 Hrs
S45
Utility T&D Zinc Bromine1 MW / 2 Hrs
S45
UTILITY T&D Zinc Bromide 1 MW / 5 Hrs
S29 - 1
$/kW-Yr
Selected Systems
Levelized $/kW-Yr.
$0
$5,000
$10,000
$15,000
$20,000
$25,000
Commerical & Industrial
Zinc Bromide500 kW / 5 Hrs
S29
Commercial & Industrial
Zinc Bromine 333 kW / 2 Hrs
S33
Commerical & Industrial
Zinc Bromine 125 kW / 5 Hrs
S29
Commerical & Industrial
Zinc Bromine50 kW / 2 Hrs
S29
ResidentialZinc Bromine
15 kW / 2 Hrs S29
Residential Zinc-Bromine5 kW / 2 Hrs
S33 - 1
ResidentialZinc-Bromine5 kW / 2 Hrs
S33 - 2
ResidentialZinc-Bromine 5 kW / 4 Hrs
S33
ResidentialZinc Bromine 5 kW / 4 Hrs
S29
$/kW
Selected Systems
Present Value $/kW Installed Cost
69 Rev. 1, February 2015
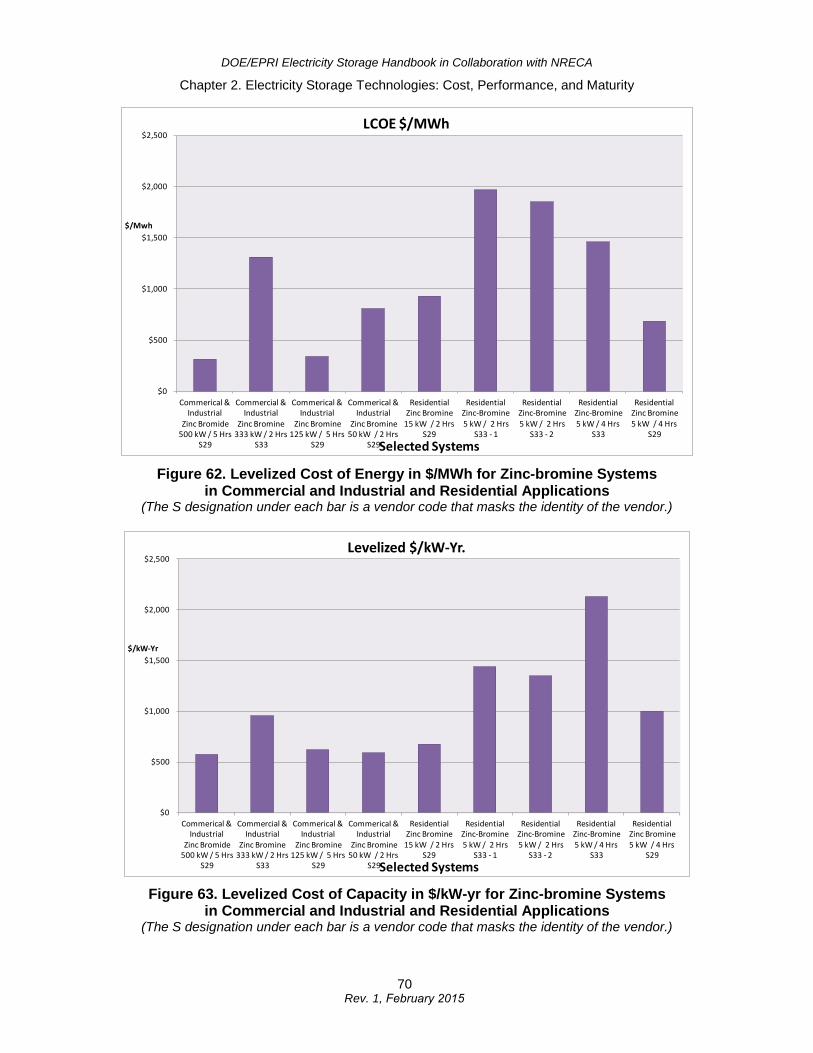
DOE/EPRI Electricity Storage Handbook in Collaboration with NRECA
Chapter 2. Electricity Storage Technologies: Cost, Performance, and Maturity
Figure 62. Levelized Cost of Energy in $/MWh for Zinc-bromine Systems in Commercial and Industrial and Residential Applications
(The S designation under each bar is a vendor code that masks the identity of the vendor.)
Figure 63. Levelized Cost of Capacity in $/kW-yr for Zinc-bromine Systems in Commercial and Industrial and Residential Applications
(The S designation under each bar is a vendor code that masks the identity of the vendor.)
$0
$500
$1,000
$1,500
$2,000
$2,500
Commerical & Industrial
Zinc Bromide500 kW / 5 Hrs
S29
Commercial & Industrial
Zinc Bromine 333 kW / 2 Hrs
S33
Commerical & Industrial
Zinc Bromine 125 kW / 5 Hrs
S29
Commerical & Industrial
Zinc Bromine50 kW / 2 Hrs
S29
ResidentialZinc Bromine
15 kW / 2 Hrs S29
Residential Zinc-Bromine5 kW / 2 Hrs
S33 - 1
ResidentialZinc-Bromine5 kW / 2 Hrs
S33 - 2
ResidentialZinc-Bromine 5 kW / 4 Hrs
S33
ResidentialZinc Bromine 5 kW / 4 Hrs
S29
$/Mwh
Selected Systems
LCOE $/MWh
$0
$500
$1,000
$1,500
$2,000
$2,500
Commerical & Industrial
Zinc Bromide500 kW / 5 Hrs
S29
Commercial & Industrial
Zinc Bromine 333 kW / 2 Hrs
S33
Commerical & Industrial
Zinc Bromine 125 kW / 5 Hrs
S29
Commerical & Industrial
Zinc Bromine50 kW / 2 Hrs
S29
ResidentialZinc Bromine
15 kW / 2 Hrs S29
Residential Zinc-Bromine5 kW / 2 Hrs
S33 - 1
ResidentialZinc-Bromine5 kW / 2 Hrs
S33 - 2
ResidentialZinc-Bromine 5 kW / 4 Hrs
S33
ResidentialZinc Bromine 5 kW / 4 Hrs
S29
$/kW-Yr
Selected Systems
Levelized $/kW-Yr.
70 Rev. 1, February 2015
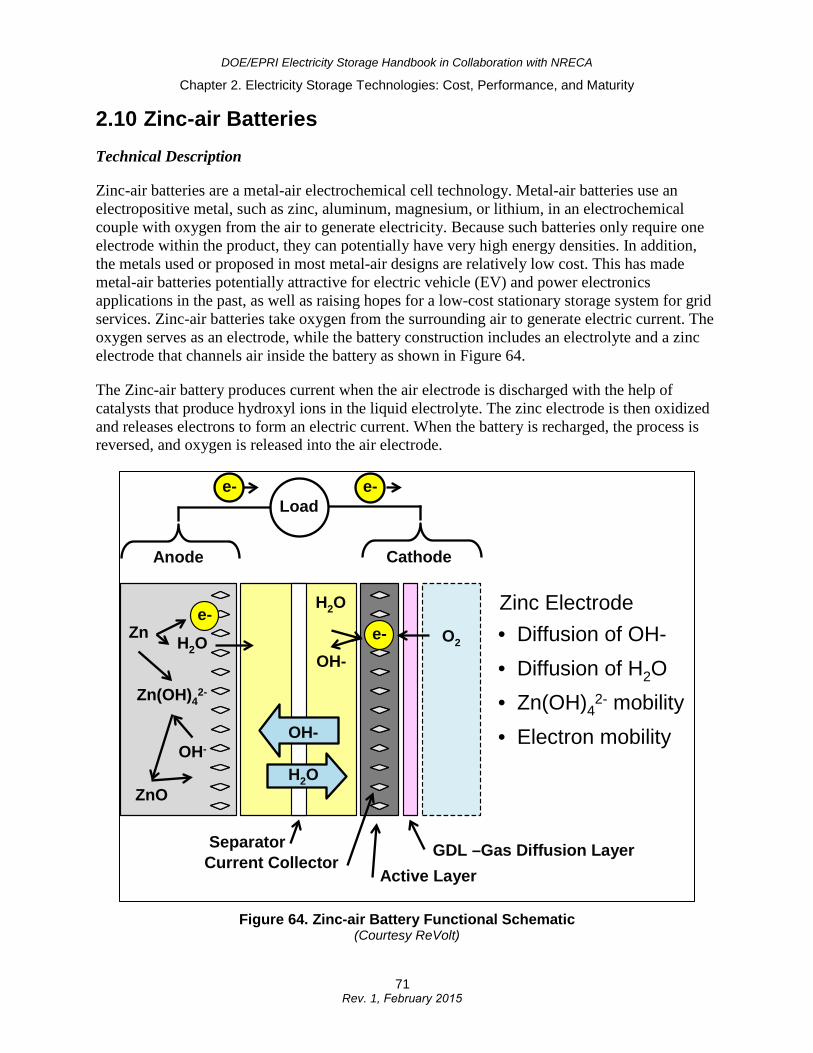
DOE/EPRI Electricity Storage Handbook in Collaboration with NRECA
Chapter 2. Electricity Storage Technologies: Cost, Performance, and Maturity
2.10 Zinc-air Batteries Technical Description
Zinc-air batteries are a metal-air electrochemical cell technology. Metal-air batteries use an electropositive metal, such as zinc, aluminum, magnesium, or lithium, in an electrochemical couple with oxygen from the air to generate electricity. Because such batteries only require one electrode within the product, they can potentially have very high energy densities. In addition, the metals used or proposed in most metal-air designs are relatively low cost. This has made metal-air batteries potentially attractive for electric vehicle (EV) and power electronics applications in the past, as well as raising hopes for a low-cost stationary storage system for grid services. Zinc-air batteries take oxygen from the surrounding air to generate electric current. The oxygen serves as an electrode, while the battery construction includes an electrolyte and a zinc electrode that channels air inside the battery as shown in Figure 64.
The Zinc-air battery produces current when the air electrode is discharged with the help of catalysts that produce hydroxyl ions in the liquid electrolyte. The zinc electrode is then oxidized and releases electrons to form an electric current. When the battery is recharged, the process is reversed, and oxygen is released into the air electrode.
Figure 64. Zinc-air Battery Functional Schematic (Courtesy ReVolt)
Load
CathodeAnode
e-e-
H2O
OH-O2e-
GDL –Gas Diffusion LayerActive Layer
Current CollectorSeparator
Zn H2O
Zn(OH)42-
ZnO
OH-
e-
H2O
OH-
Zinc Electrode• Diffusion of OH-• Diffusion of H2O• Zn(OH)4
2- mobility• Electron mobility
71 Rev. 1, February 2015

DOE/EPRI Electricity Storage Handbook in Collaboration with NRECA
Chapter 2. Electricity Storage Technologies: Cost, Performance, and Maturity
The challenge for researchers has been to address issues such as electrolyte management, avoiding carbon dioxide (CO2) impacts from the air on the electrolyte and cathode, thermal management, and avoiding Zn dentrite formation. Methods are also being investigated to address issues with the air electrolyte not deactivating in the recharging cycle and slowing or stopping the oxidation reaction. The cessation of the oxidation reaction reduces the number of times that a Zinc-air battery can be recharged.
Despite the many advantages, metal-air batteries also pose several historical disadvantages. The batteries are susceptible to changes in ambient air conditions, including humidity and airborne contaminants. The air electrode – a sophisticated technology that requires a three-way catalytic interface between the gaseous oxygen, the liquid electrolyte, and the solid current collector – has been difficult and expensive to make. However, the technology is far more stable and less dangerous than other battery technologies.
Performance Characteristics
Electric recharge has been difficult and inefficient with metal-air batteries, with typical round-trip efficiencies below 50 percent. Some developers have attempted to overcome this limitation with mechanically rechargeable systems in which the discharged metal anode is replaced with a fresh metal anode and the system continues to operate.
There are currently a few early-stage companies attempting to bring energy-dense, high-operating-efficiency, better depth-of-discharge stationary systems to the market, particularly for utility T&D grid support and renewable energy integration. R&D is underway by several companies, with some research still in the university laboratory stage.
Zinc-air batteries have up to three times the energy density of Li-ion, its most competitive battery technology. Unlike lithium-ion, however, Zinc-air batteries neither produce potentially toxic or explosive gases, nor contain toxic or environmentally dangerous components. Zinc-oxide, which is the main material in a zinc-air battery, is 100-percent recyclable.
Maturity and Commercial Availability
Zinc-air technology is still in early R&D phase for stationary storage systems for grid services markets. Despite substantial technical obstacles faced in the past, this technology holds a great deal of potential because of its low capital cost for grid support and potentially for electric transportation applications.
72 Rev. 1, February 2015
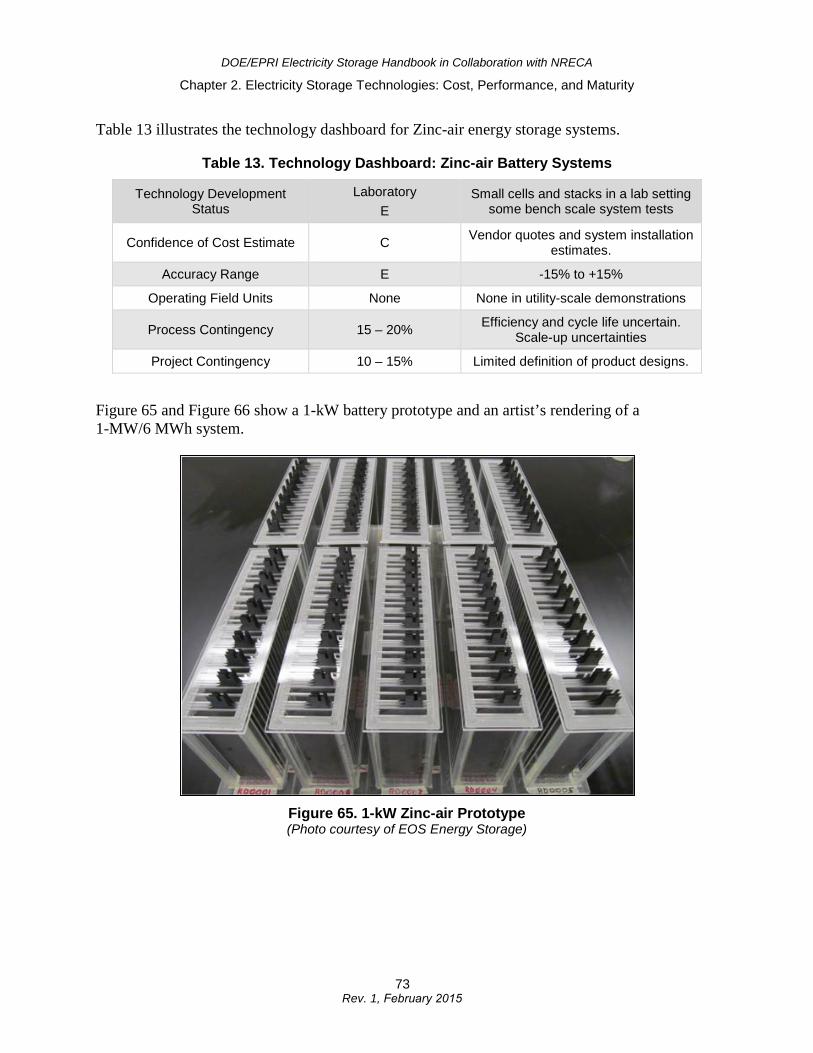
DOE/EPRI Electricity Storage Handbook in Collaboration with NRECA
Chapter 2. Electricity Storage Technologies: Cost, Performance, and Maturity
Table 13 illustrates the technology dashboard for Zinc-air energy storage systems.
Table 13. Technology Dashboard: Zinc-air Battery Systems
Technology Development Status
Laboratory E
Small cells and stacks in a lab setting some bench scale system tests
Confidence of Cost Estimate C Vendor quotes and system installation estimates.
Accuracy Range E -15% to +15%
Operating Field Units None None in utility-scale demonstrations
Process Contingency 15 – 20% Efficiency and cycle life uncertain. Scale-up uncertainties
Project Contingency 10 – 15% Limited definition of product designs.
Figure 65 and Figure 66 show a 1-kW battery prototype and an artist’s rendering of a 1-MW/6 MWh system.
Figure 65. 1-kW Zinc-air Prototype (Photo courtesy of EOS Energy Storage)
73 Rev. 1, February 2015
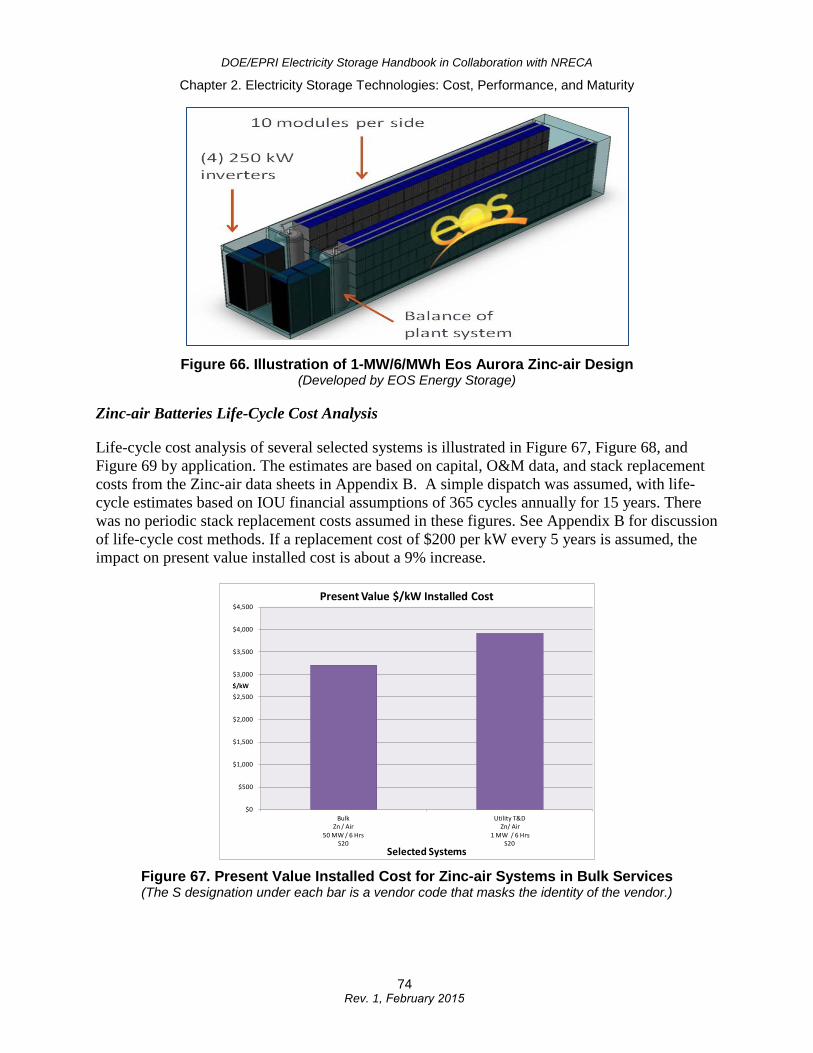
DOE/EPRI Electricity Storage Handbook in Collaboration with NRECA
Chapter 2. Electricity Storage Technologies: Cost, Performance, and Maturity
Figure 66. Illustration of 1-MW/6/MWh Eos Aurora Zinc-air Design (Developed by EOS Energy Storage)
Zinc-air Batteries Life-Cycle Cost Analysis
Life-cycle cost analysis of several selected systems is illustrated in Figure 67, Figure 68, and Figure 69 by application. The estimates are based on capital, O&M data, and stack replacement costs from the Zinc-air data sheets in Appendix B. A simple dispatch was assumed, with life-cycle estimates based on IOU financial assumptions of 365 cycles annually for 15 years. There was no periodic stack replacement costs assumed in these figures. See Appendix B for discussion of life-cycle cost methods. If a replacement cost of $200 per kW every 5 years is assumed, the impact on present value installed cost is about a 9% increase.
Figure 67. Present Value Installed Cost for Zinc-air Systems in Bulk Services (The S designation under each bar is a vendor code that masks the identity of the vendor.)
$0
$500
$1,000
$1,500
$2,000
$2,500
$3,000
$3,500
$4,000
$4,500
Bulk Zn / Air
50 MW / 6 Hrs S20
Utility T&DZn/ Air
1 MW / 6 Hrs S20
$/kW
Selected Systems
Present Value $/kW Installed Cost
74 Rev. 1, February 2015
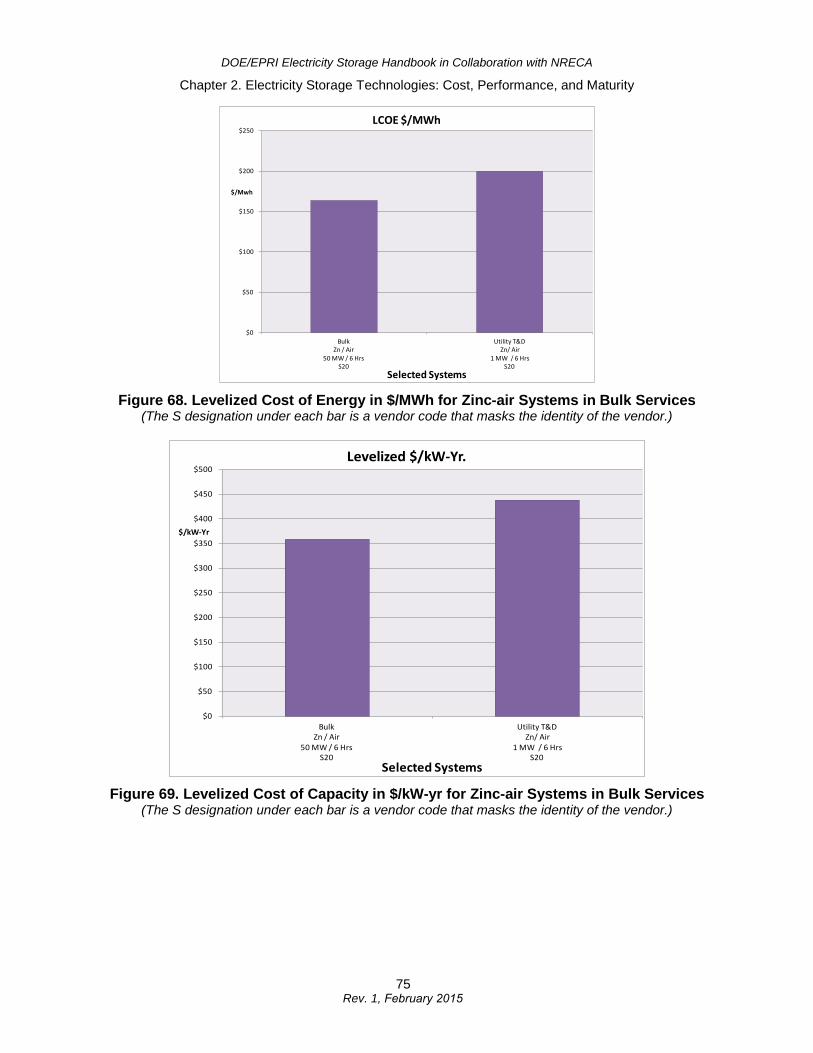
DOE/EPRI Electricity Storage Handbook in Collaboration with NRECA
Chapter 2. Electricity Storage Technologies: Cost, Performance, and Maturity
Figure 68. Levelized Cost of Energy in $/MWh for Zinc-air Systems in Bulk Services (The S designation under each bar is a vendor code that masks the identity of the vendor.)
Figure 69. Levelized Cost of Capacity in $/kW-yr for Zinc-air Systems in Bulk Services (The S designation under each bar is a vendor code that masks the identity of the vendor.)
$0
$50
$100
$150
$200
$250
Bulk Zn / Air
50 MW / 6 Hrs S20
Utility T&DZn/ Air
1 MW / 6 Hrs S20
$/Mwh
Selected Systems
LCOE $/MWh
$0
$50
$100
$150
$200
$250
$300
$350
$400
$450
$500
Bulk Zn / Air
50 MW / 6 Hrs S20
Utility T&DZn/ Air
1 MW / 6 Hrs S20
$/kW-Yr
Selected Systems
Levelized $/kW-Yr.
75 Rev. 1, February 2015
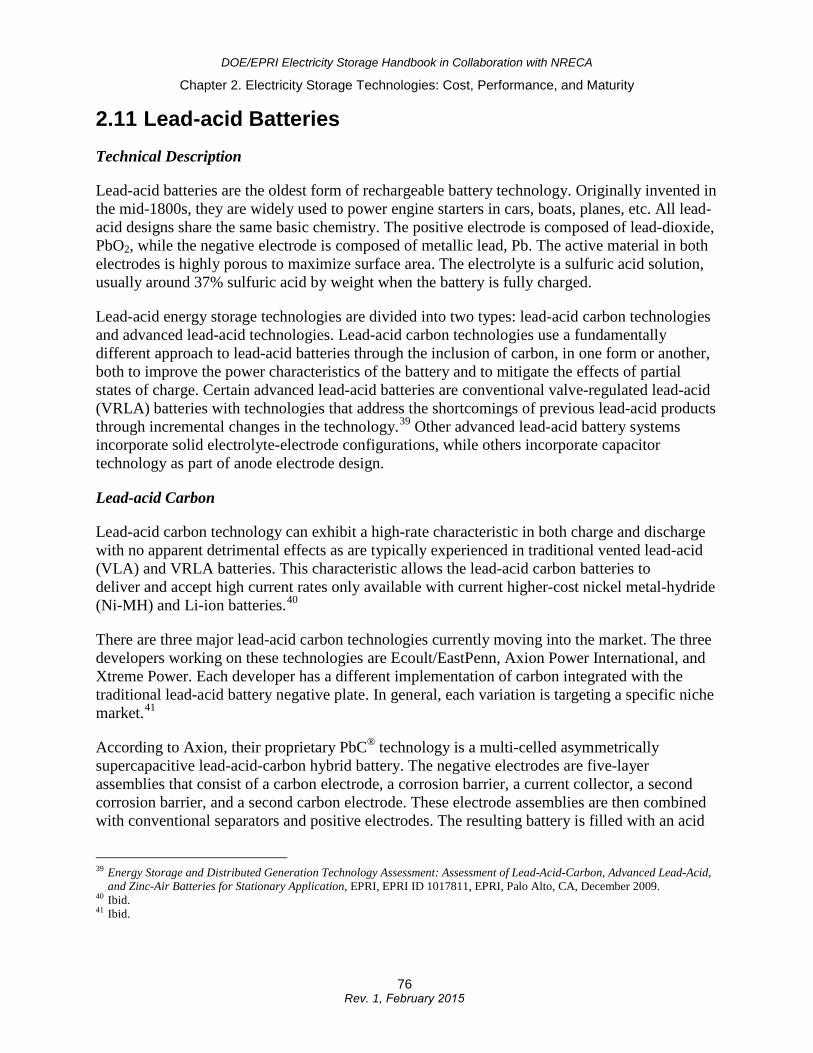
DOE/EPRI Electricity Storage Handbook in Collaboration with NRECA
Chapter 2. Electricity Storage Technologies: Cost, Performance, and Maturity
2.11 Lead-acid Batteries Technical Description
Lead-acid batteries are the oldest form of rechargeable battery technology. Originally invented in the mid-1800s, they are widely used to power engine starters in cars, boats, planes, etc. All lead-acid designs share the same basic chemistry. The positive electrode is composed of lead-dioxide, PbO2, while the negative electrode is composed of metallic lead, Pb. The active material in both electrodes is highly porous to maximize surface area. The electrolyte is a sulfuric acid solution, usually around 37% sulfuric acid by weight when the battery is fully charged.
Lead-acid energy storage technologies are divided into two types: lead-acid carbon technologies and advanced lead-acid technologies. Lead-acid carbon technologies use a fundamentally different approach to lead-acid batteries through the inclusion of carbon, in one form or another, both to improve the power characteristics of the battery and to mitigate the effects of partial states of charge. Certain advanced lead-acid batteries are conventional valve-regulated lead-acid (VRLA) batteries with technologies that address the shortcomings of previous lead-acid products through incremental changes in the technology.39 Other advanced lead-acid battery systems incorporate solid electrolyte-electrode configurations, while others incorporate capacitor technology as part of anode electrode design.
Lead-acid Carbon
Lead-acid carbon technology can exhibit a high-rate characteristic in both charge and discharge with no apparent detrimental effects as are typically experienced in traditional vented lead-acid (VLA) and VRLA batteries. This characteristic allows the lead-acid carbon batteries to deliver and accept high current rates only available with current higher-cost nickel metal-hydride (Ni-MH) and Li-ion batteries.40
There are three major lead-acid carbon technologies currently moving into the market. The three developers working on these technologies are Ecoult/EastPenn, Axion Power International, and Xtreme Power. Each developer has a different implementation of carbon integrated with the traditional lead-acid battery negative plate. In general, each variation is targeting a specific niche market.41
According to Axion, their proprietary PbC® technology is a multi-celled asymmetrically supercapacitive lead-acid-carbon hybrid battery. The negative electrodes are five-layer assemblies that consist of a carbon electrode, a corrosion barrier, a current collector, a second corrosion barrier, and a second carbon electrode. These electrode assemblies are then combined with conventional separators and positive electrodes. The resulting battery is filled with an acid
39 Energy Storage and Distributed Generation Technology Assessment: Assessment of Lead-Acid-Carbon, Advanced Lead-Acid, and Zinc-Air Batteries for Stationary Application, EPRI, EPRI ID 1017811, EPRI, Palo Alto, CA, December 2009.
40 Ibid. 41 Ibid.
76 Rev. 1, February 2015
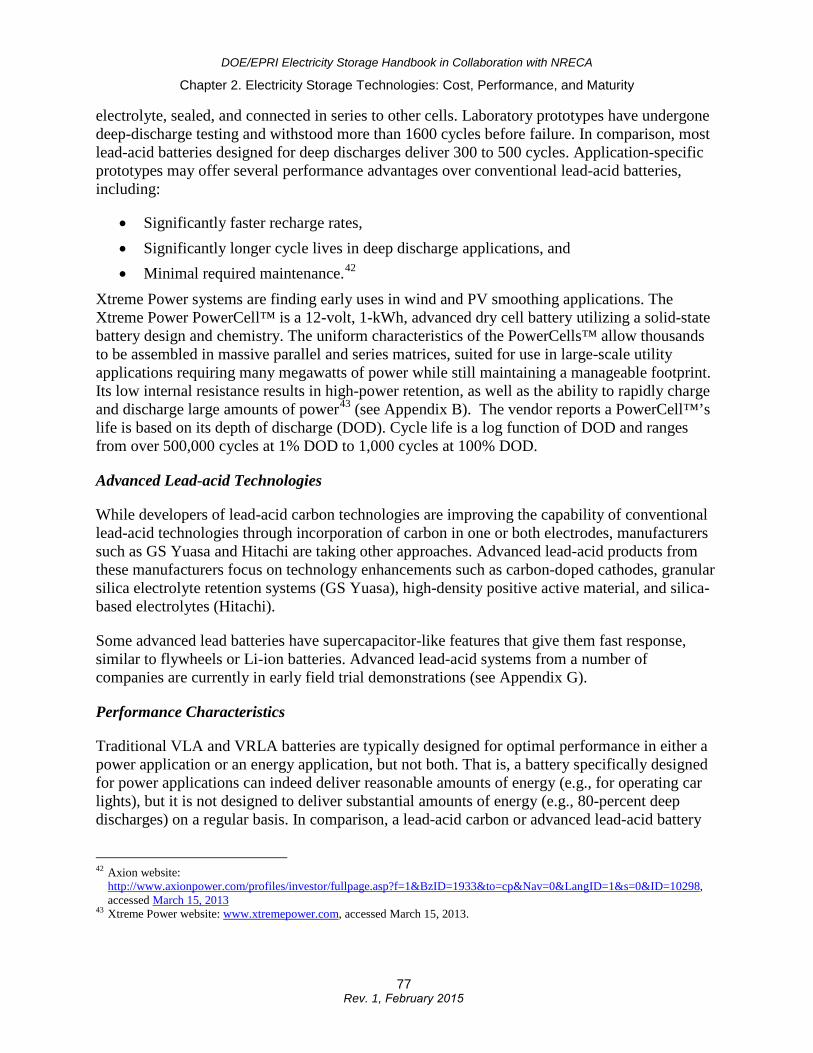
DOE/EPRI Electricity Storage Handbook in Collaboration with NRECA
Chapter 2. Electricity Storage Technologies: Cost, Performance, and Maturity
electrolyte, sealed, and connected in series to other cells. Laboratory prototypes have undergone deep-discharge testing and withstood more than 1600 cycles before failure. In comparison, most lead-acid batteries designed for deep discharges deliver 300 to 500 cycles. Application-specific prototypes may offer several performance advantages over conventional lead-acid batteries, including:
• Significantly faster recharge rates,• Significantly longer cycle lives in deep discharge applications, and• Minimal required maintenance.42
Xtreme Power systems are finding early uses in wind and PV smoothing applications. The Xtreme Power PowerCell™ is a 12-volt, 1-kWh, advanced dry cell battery utilizing a solid-state battery design and chemistry. The uniform characteristics of the PowerCells™ allow thousands to be assembled in massive parallel and series matrices, suited for use in large-scale utility applications requiring many megawatts of power while still maintaining a manageable footprint. Its low internal resistance results in high-power retention, as well as the ability to rapidly charge and discharge large amounts of power43 (see Appendix B). The vendor reports a PowerCell™’s life is based on its depth of discharge (DOD). Cycle life is a log function of DOD and ranges from over 500,000 cycles at 1% DOD to 1,000 cycles at 100% DOD.
Advanced Lead-acid Technologies
While developers of lead-acid carbon technologies are improving the capability of conventional lead-acid technologies through incorporation of carbon in one or both electrodes, manufacturers such as GS Yuasa and Hitachi are taking other approaches. Advanced lead-acid products from these manufacturers focus on technology enhancements such as carbon-doped cathodes, granular silica electrolyte retention systems (GS Yuasa), high-density positive active material, and silica-based electrolytes (Hitachi).
Some advanced lead batteries have supercapacitor-like features that give them fast response, similar to flywheels or Li-ion batteries. Advanced lead-acid systems from a number of companies are currently in early field trial demonstrations (see Appendix G).
Performance Characteristics
Traditional VLA and VRLA batteries are typically designed for optimal performance in either a power application or an energy application, but not both. That is, a battery specifically designed for power applications can indeed deliver reasonable amounts of energy (e.g., for operating car lights), but it is not designed to deliver substantial amounts of energy (e.g., 80-percent deep discharges) on a regular basis. In comparison, a lead-acid carbon or advanced lead-acid battery
42 Axion website: http://www.axionpower.com/profiles/investor/fullpage.asp?f=1&BzID=1933&to=cp&Nav=0&LangID=1&s=0&ID=10298, accessed March 15, 2013
43 Xtreme Power website: www.xtremepower.com, accessed March 15, 2013.
77 Rev. 1, February 2015
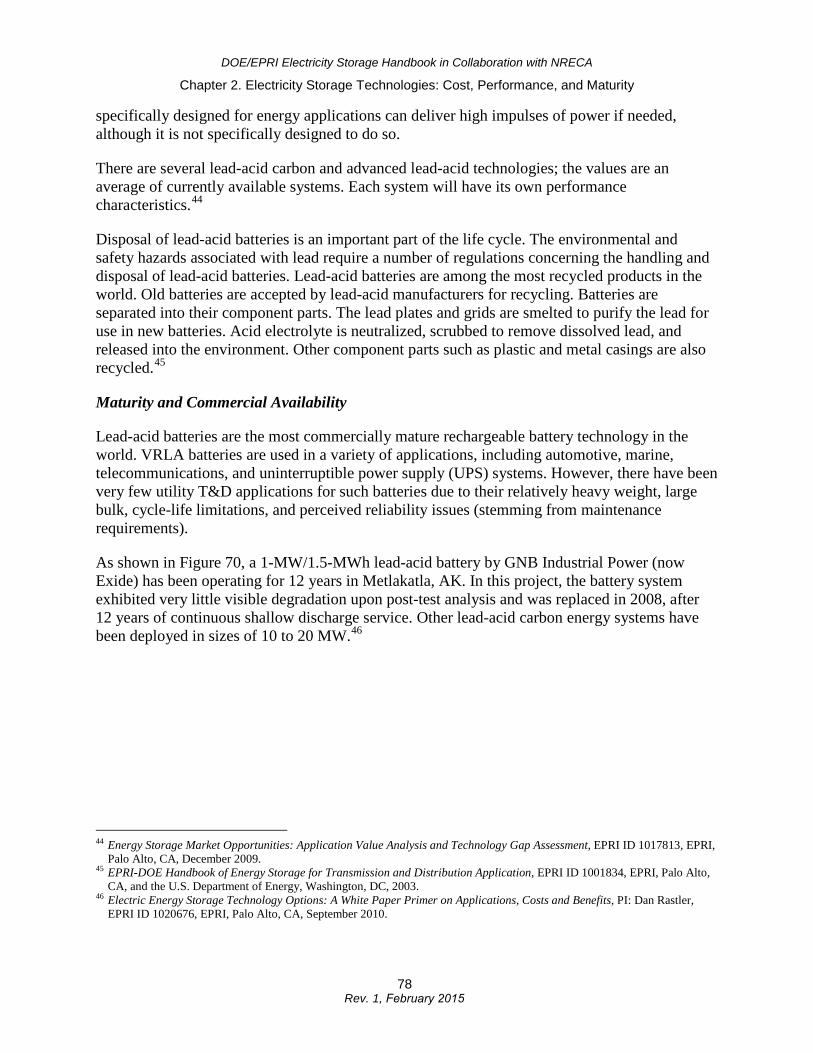
DOE/EPRI Electricity Storage Handbook in Collaboration with NRECA
Chapter 2. Electricity Storage Technologies: Cost, Performance, and Maturity
specifically designed for energy applications can deliver high impulses of power if needed, although it is not specifically designed to do so.
There are several lead-acid carbon and advanced lead-acid technologies; the values are an average of currently available systems. Each system will have its own performance characteristics.44
Disposal of lead-acid batteries is an important part of the life cycle. The environmental and safety hazards associated with lead require a number of regulations concerning the handling and disposal of lead-acid batteries. Lead-acid batteries are among the most recycled products in the world. Old batteries are accepted by lead-acid manufacturers for recycling. Batteries are separated into their component parts. The lead plates and grids are smelted to purify the lead for use in new batteries. Acid electrolyte is neutralized, scrubbed to remove dissolved lead, and released into the environment. Other component parts such as plastic and metal casings are also recycled.45
Maturity and Commercial Availability
Lead-acid batteries are the most commercially mature rechargeable battery technology in the world. VRLA batteries are used in a variety of applications, including automotive, marine, telecommunications, and uninterruptible power supply (UPS) systems. However, there have been very few utility T&D applications for such batteries due to their relatively heavy weight, large bulk, cycle-life limitations, and perceived reliability issues (stemming from maintenance requirements).
As shown in Figure 70, a 1-MW/1.5-MWh lead-acid battery by GNB Industrial Power (now Exide) has been operating for 12 years in Metlakatla, AK. In this project, the battery system exhibited very little visible degradation upon post-test analysis and was replaced in 2008, after 12 years of continuous shallow discharge service. Other lead-acid carbon energy systems have been deployed in sizes of 10 to 20 MW.46
44 Energy Storage Market Opportunities: Application Value Analysis and Technology Gap Assessment, EPRI ID 1017813, EPRI, Palo Alto, CA, December 2009.
45 EPRI-DOE Handbook of Energy Storage for Transmission and Distribution Application, EPRI ID 1001834, EPRI, Palo Alto, CA, and the U.S. Department of Energy, Washington, DC, 2003.
46 Electric Energy Storage Technology Options: A White Paper Primer on Applications, Costs and Benefits, PI: Dan Rastler, EPRI ID 1020676, EPRI, Palo Alto, CA, September 2010.
78 Rev. 1, February 2015
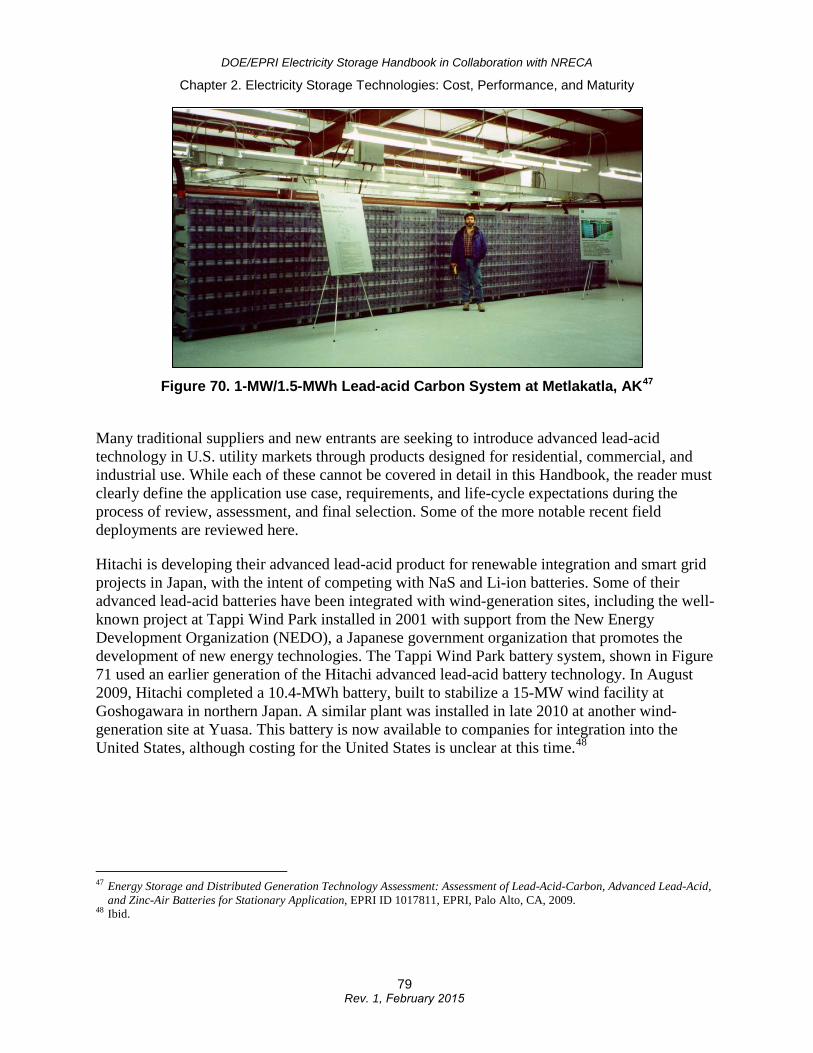
DOE/EPRI Electricity Storage Handbook in Collaboration with NRECA
Chapter 2. Electricity Storage Technologies: Cost, Performance, and Maturity
Figure 70. 1-MW/1.5-MWh Lead-acid Carbon System at Metlakatla, AK47
Many traditional suppliers and new entrants are seeking to introduce advanced lead-acid technology in U.S. utility markets through products designed for residential, commercial, and industrial use. While each of these cannot be covered in detail in this Handbook, the reader must clearly define the application use case, requirements, and life-cycle expectations during the process of review, assessment, and final selection. Some of the more notable recent field deployments are reviewed here.
Hitachi is developing their advanced lead-acid product for renewable integration and smart grid projects in Japan, with the intent of competing with NaS and Li-ion batteries. Some of their advanced lead-acid batteries have been integrated with wind-generation sites, including the well-known project at Tappi Wind Park installed in 2001 with support from the New Energy Development Organization (NEDO), a Japanese government organization that promotes the development of new energy technologies. The Tappi Wind Park battery system, shown in Figure 71 used an earlier generation of the Hitachi advanced lead-acid battery technology. In August 2009, Hitachi completed a 10.4-MWh battery, built to stabilize a 15-MW wind facility at Goshogawara in northern Japan. A similar plant was installed in late 2010 at another wind-generation site at Yuasa. This battery is now available to companies for integration into the United States, although costing for the United States is unclear at this time.48
47 Energy Storage and Distributed Generation Technology Assessment: Assessment of Lead-Acid-Carbon, Advanced Lead-Acid, and Zinc-Air Batteries for Stationary Application, EPRI ID 1017811, EPRI, Palo Alto, CA, 2009.
48 Ibid.
79 Rev. 1, February 2015
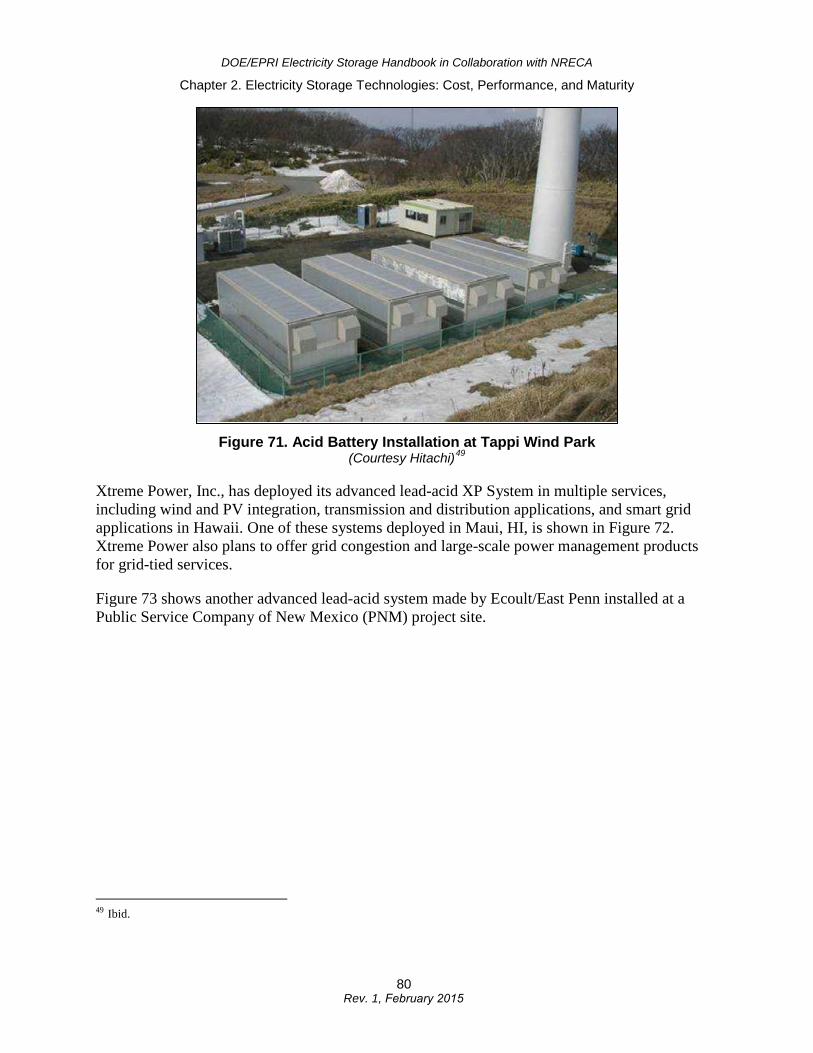
DOE/EPRI Electricity Storage Handbook in Collaboration with NRECA
Chapter 2. Electricity Storage Technologies: Cost, Performance, and Maturity
Figure 71. Acid Battery Installation at Tappi Wind Park (Courtesy Hitachi)49
Xtreme Power, Inc., has deployed its advanced lead-acid XP System in multiple services, including wind and PV integration, transmission and distribution applications, and smart grid applications in Hawaii. One of these systems deployed in Maui, HI, is shown in Figure 72. Xtreme Power also plans to offer grid congestion and large-scale power management products for grid-tied services.
Figure 73 shows another advanced lead-acid system made by Ecoult/East Penn installed at a Public Service Company of New Mexico (PNM) project site.
49 Ibid.
80 Rev. 1, February 2015
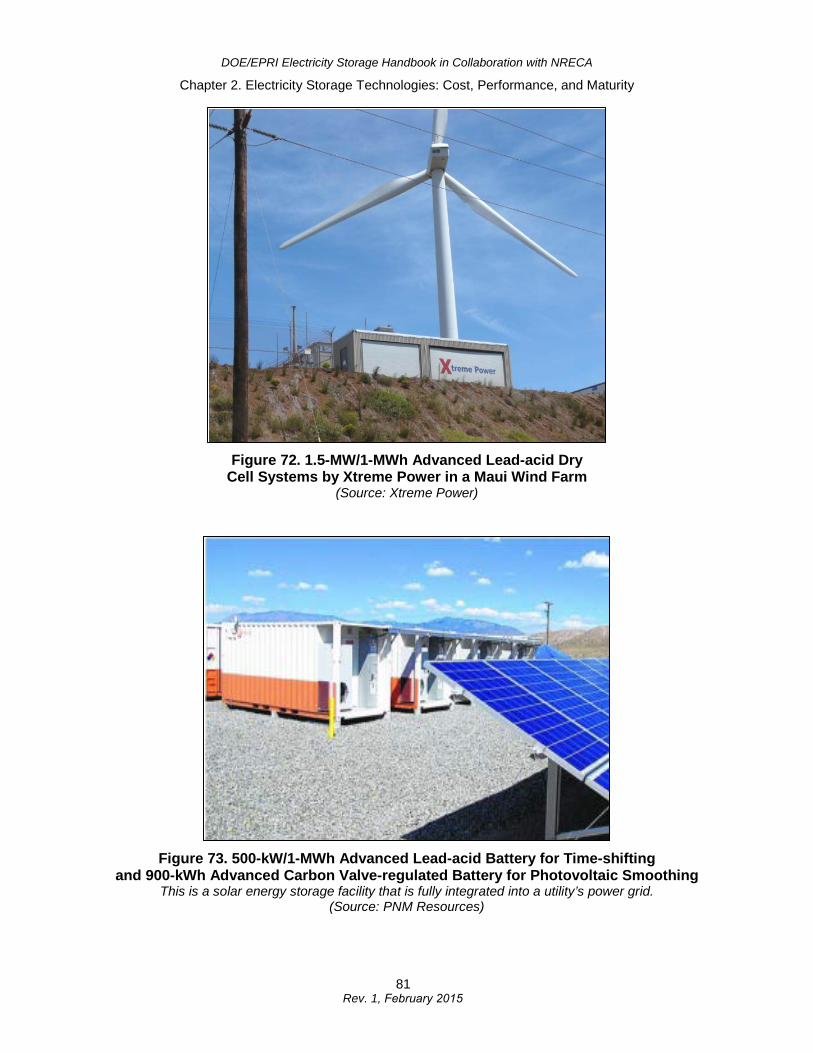
DOE/EPRI Electricity Storage Handbook in Collaboration with NRECA
Chapter 2. Electricity Storage Technologies: Cost, Performance, and Maturity
Figure 72. 1.5-MW/1-MWh Advanced Lead-acid Dry Cell Systems by Xtreme Power in a Maui Wind Farm
(Source: Xtreme Power)
Figure 73. 500-kW/1-MWh Advanced Lead-acid Battery for Time-shifting and 900-kWh Advanced Carbon Valve-regulated Battery for Photovoltaic Smoothing
This is a solar energy storage facility that is fully integrated into a utility’s power grid. (Source: PNM Resources)
81 Rev. 1, February 2015
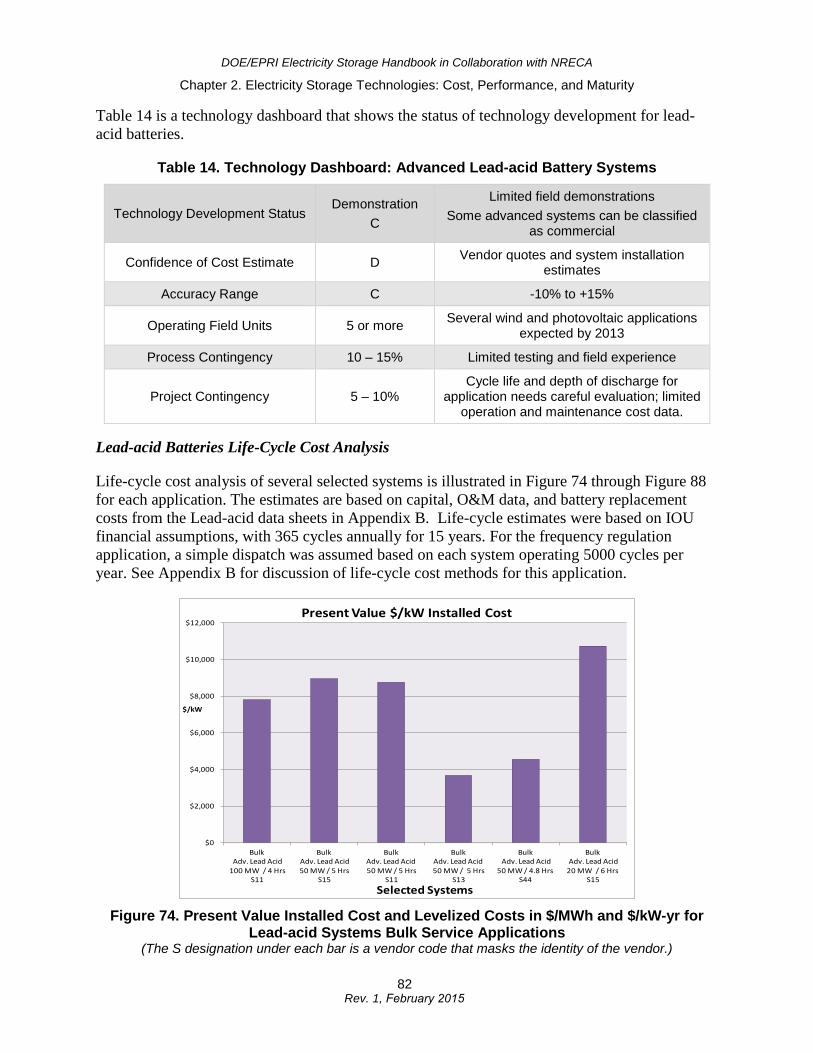
DOE/EPRI Electricity Storage Handbook in Collaboration with NRECA
Chapter 2. Electricity Storage Technologies: Cost, Performance, and Maturity
Table 14 is a technology dashboard that shows the status of technology development for lead-acid batteries.
Table 14. Technology Dashboard: Advanced Lead-acid Battery Systems
Technology Development Status Demonstration
C
Limited field demonstrations Some advanced systems can be classified
as commercial
Confidence of Cost Estimate D Vendor quotes and system installation estimates
Accuracy Range C -10% to +15%
Operating Field Units 5 or more Several wind and photovoltaic applications expected by 2013
Process Contingency 10 – 15% Limited testing and field experience
Project Contingency 5 – 10% Cycle life and depth of discharge for
application needs careful evaluation; limited operation and maintenance cost data.
Lead-acid Batteries Life-Cycle Cost Analysis
Life-cycle cost analysis of several selected systems is illustrated in Figure 74 through Figure 88 for each application. The estimates are based on capital, O&M data, and battery replacement costs from the Lead-acid data sheets in Appendix B. Life-cycle estimates were based on IOU financial assumptions, with 365 cycles annually for 15 years. For the frequency regulation application, a simple dispatch was assumed based on each system operating 5000 cycles per year. See Appendix B for discussion of life-cycle cost methods for this application.
Figure 74. Present Value Installed Cost and Levelized Costs in $/MWh and $/kW-yr for Lead-acid Systems Bulk Service Applications
(The S designation under each bar is a vendor code that masks the identity of the vendor.)
$0
$2,000
$4,000
$6,000
$8,000
$10,000
$12,000
BulkAdv. Lead Acid
100 MW / 4 HrsS11
BulkAdv. Lead Acid50 MW / 5 Hrs
S15
Bulk Adv. Lead Acid50 MW / 5 Hrs
S11
Bulk Adv. Lead Acid50 MW / 5 Hrs
S13
BulkAdv. Lead Acid
50 MW / 4.8 Hrs S44
BulkAdv. Lead Acid
20 MW / 6 HrsS15
$/kW
Selected Systems
Present Value $/kW Installed Cost
82 Rev. 1, February 2015
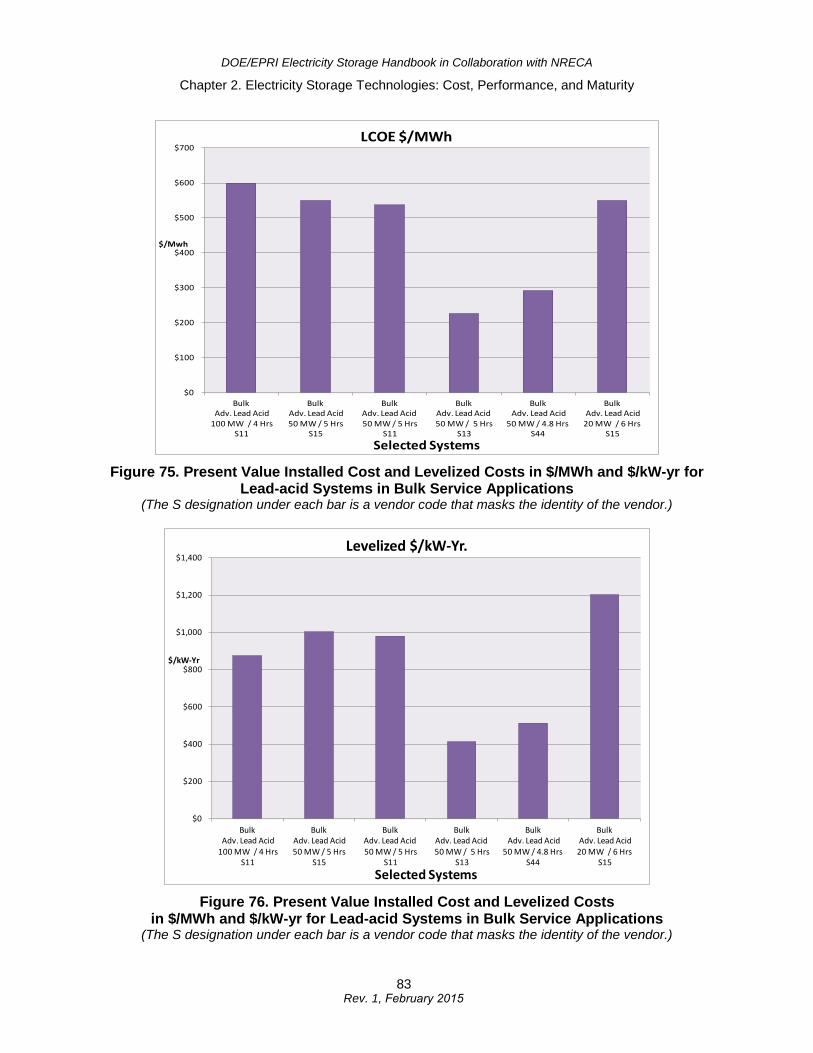
DOE/EPRI Electricity Storage Handbook in Collaboration with NRECA
Chapter 2. Electricity Storage Technologies: Cost, Performance, and Maturity
Figure 75. Present Value Installed Cost and Levelized Costs in $/MWh and $/kW-yr for Lead-acid Systems in Bulk Service Applications
(The S designation under each bar is a vendor code that masks the identity of the vendor.)
Figure 76. Present Value Installed Cost and Levelized Costs in $/MWh and $/kW-yr for Lead-acid Systems in Bulk Service Applications
(The S designation under each bar is a vendor code that masks the identity of the vendor.)
$0
$100
$200
$300
$400
$500
$600
$700
BulkAdv. Lead Acid
100 MW / 4 HrsS11
BulkAdv. Lead Acid50 MW / 5 Hrs
S15
Bulk Adv. Lead Acid50 MW / 5 Hrs
S11
Bulk Adv. Lead Acid50 MW / 5 Hrs
S13
BulkAdv. Lead Acid
50 MW / 4.8 Hrs S44
BulkAdv. Lead Acid
20 MW / 6 HrsS15
$/Mwh
Selected Systems
LCOE $/MWh
$0
$200
$400
$600
$800
$1,000
$1,200
$1,400
BulkAdv. Lead Acid
100 MW / 4 HrsS11
BulkAdv. Lead Acid50 MW / 5 Hrs
S15
Bulk Adv. Lead Acid50 MW / 5 Hrs
S11
Bulk Adv. Lead Acid50 MW / 5 Hrs
S13
BulkAdv. Lead Acid
50 MW / 4.8 Hrs S44
BulkAdv. Lead Acid
20 MW / 6 HrsS15
$/kW-Yr
Selected Systems
Levelized $/kW-Yr.
83 Rev. 1, February 2015
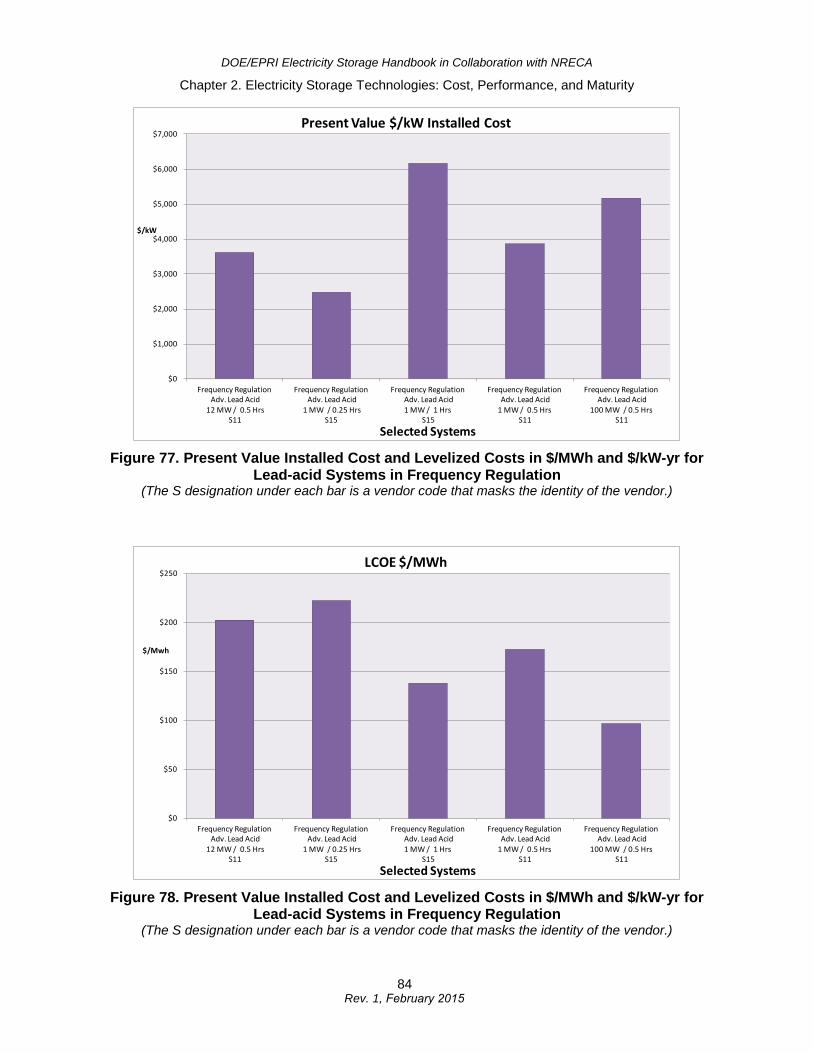
DOE/EPRI Electricity Storage Handbook in Collaboration with NRECA
Chapter 2. Electricity Storage Technologies: Cost, Performance, and Maturity
Figure 77. Present Value Installed Cost and Levelized Costs in $/MWh and $/kW-yr for Lead-acid Systems in Frequency Regulation
(The S designation under each bar is a vendor code that masks the identity of the vendor.)
Figure 78. Present Value Installed Cost and Levelized Costs in $/MWh and $/kW-yr for Lead-acid Systems in Frequency Regulation
(The S designation under each bar is a vendor code that masks the identity of the vendor.)
$0
$1,000
$2,000
$3,000
$4,000
$5,000
$6,000
$7,000
Frequency Regulation Adv. Lead Acid
12 MW / 0.5 HrsS11
Frequency Regulation Adv. Lead Acid
1 MW / 0.25 HrsS15
Frequency RegulationAdv. Lead Acid 1 MW / 1 Hrs
S15
Frequency Regulation Adv. Lead Acid
1 MW / 0.5 HrsS11
Frequency Regulation Adv. Lead Acid
100 MW / 0.5 Hrs S11
$/kW
Selected Systems
Present Value $/kW Installed Cost
$0
$50
$100
$150
$200
$250
Frequency Regulation Adv. Lead Acid
12 MW / 0.5 HrsS11
Frequency Regulation Adv. Lead Acid
1 MW / 0.25 HrsS15
Frequency RegulationAdv. Lead Acid 1 MW / 1 Hrs
S15
Frequency Regulation Adv. Lead Acid
1 MW / 0.5 HrsS11
Frequency Regulation Adv. Lead Acid
100 MW / 0.5 Hrs S11
$/Mwh
Selected Systems
LCOE $/MWh
84 Rev. 1, February 2015
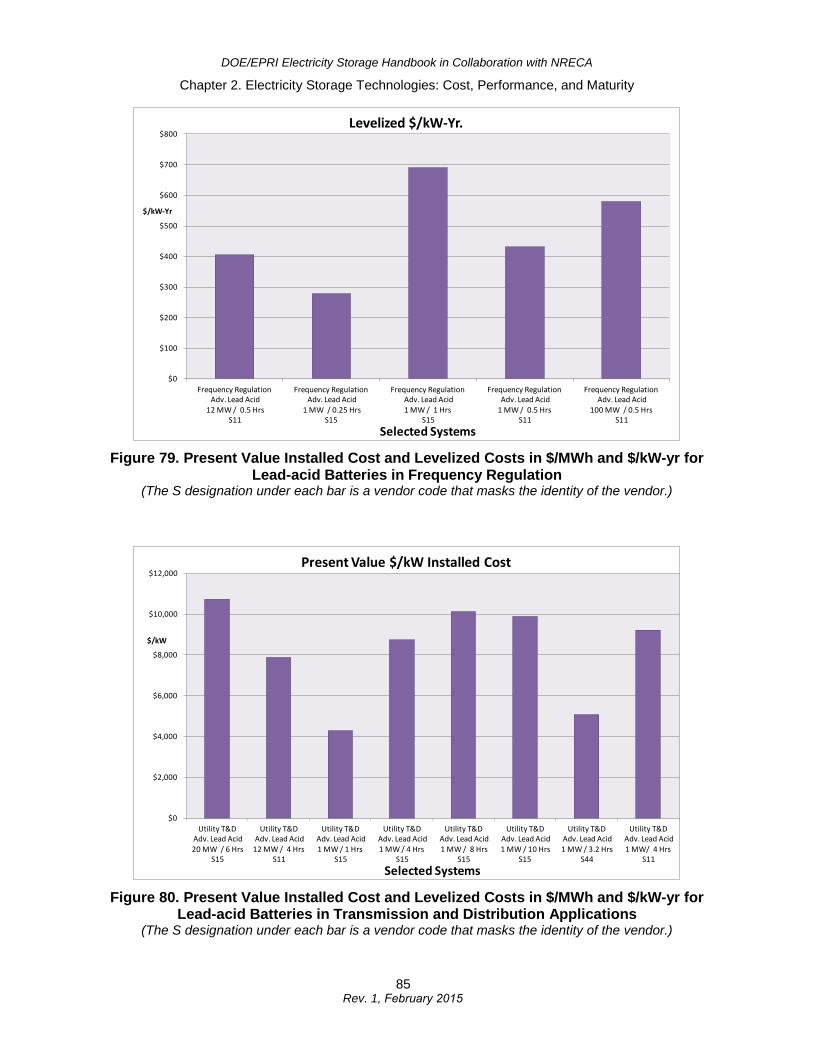
DOE/EPRI Electricity Storage Handbook in Collaboration with NRECA
Chapter 2. Electricity Storage Technologies: Cost, Performance, and Maturity
Figure 79. Present Value Installed Cost and Levelized Costs in $/MWh and $/kW-yr for Lead-acid Batteries in Frequency Regulation
(The S designation under each bar is a vendor code that masks the identity of the vendor.)
Figure 80. Present Value Installed Cost and Levelized Costs in $/MWh and $/kW-yr for Lead-acid Batteries in Transmission and Distribution Applications
(The S designation under each bar is a vendor code that masks the identity of the vendor.)
$0
$100
$200
$300
$400
$500
$600
$700
$800
Frequency Regulation Adv. Lead Acid
12 MW / 0.5 HrsS11
Frequency Regulation Adv. Lead Acid
1 MW / 0.25 HrsS15
Frequency RegulationAdv. Lead Acid 1 MW / 1 Hrs
S15
Frequency Regulation Adv. Lead Acid
1 MW / 0.5 HrsS11
Frequency Regulation Adv. Lead Acid
100 MW / 0.5 Hrs S11
$/kW-Yr
Selected Systems
Levelized $/kW-Yr.
$0
$2,000
$4,000
$6,000
$8,000
$10,000
$12,000
Utility T&DAdv. Lead Acid20 MW / 6 Hrs
S15
Utility T&DAdv. Lead Acid
12 MW / 4 HrsS11
Utility T&DAdv. Lead Acid 1 MW / 1 Hrs
S15
Utility T&DAdv. Lead Acid 1 MW / 4 Hrs
S15
Utility T&DAdv. Lead Acid1 MW / 8 Hrs
S15
Utility T&DAdv. Lead Acid1 MW / 10 Hrs
S15
Utility T&DAdv. Lead Acid1 MW / 3.2 Hrs
S44
Utility T&D Adv. Lead Acid 1 MW/ 4 Hrs
S11
$/kW
Selected Systems
Present Value $/kW Installed Cost
85 Rev. 1, February 2015
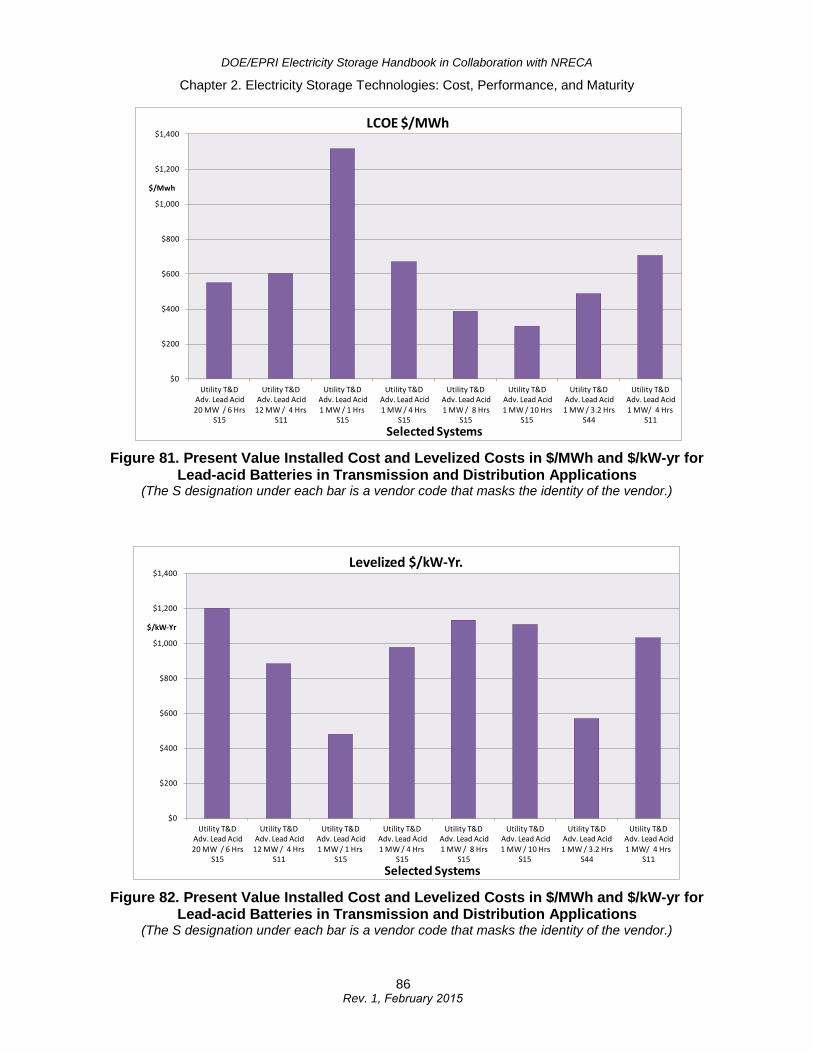
DOE/EPRI Electricity Storage Handbook in Collaboration with NRECA
Chapter 2. Electricity Storage Technologies: Cost, Performance, and Maturity
Figure 81. Present Value Installed Cost and Levelized Costs in $/MWh and $/kW-yr for Lead-acid Batteries in Transmission and Distribution Applications
(The S designation under each bar is a vendor code that masks the identity of the vendor.)
Figure 82. Present Value Installed Cost and Levelized Costs in $/MWh and $/kW-yr for Lead-acid Batteries in Transmission and Distribution Applications
(The S designation under each bar is a vendor code that masks the identity of the vendor.)
$0
$200
$400
$600
$800
$1,000
$1,200
$1,400
Utility T&DAdv. Lead Acid20 MW / 6 Hrs
S15
Utility T&DAdv. Lead Acid
12 MW / 4 HrsS11
Utility T&DAdv. Lead Acid 1 MW / 1 Hrs
S15
Utility T&DAdv. Lead Acid 1 MW / 4 Hrs
S15
Utility T&DAdv. Lead Acid1 MW / 8 Hrs
S15
Utility T&DAdv. Lead Acid1 MW / 10 Hrs
S15
Utility T&DAdv. Lead Acid1 MW / 3.2 Hrs
S44
Utility T&D Adv. Lead Acid 1 MW/ 4 Hrs
S11
$/Mwh
Selected Systems
LCOE $/MWh
$0
$200
$400
$600
$800
$1,000
$1,200
$1,400
Utility T&DAdv. Lead Acid20 MW / 6 Hrs
S15
Utility T&DAdv. Lead Acid
12 MW / 4 HrsS11
Utility T&DAdv. Lead Acid 1 MW / 1 Hrs
S15
Utility T&DAdv. Lead Acid 1 MW / 4 Hrs
S15
Utility T&DAdv. Lead Acid1 MW / 8 Hrs
S15
Utility T&DAdv. Lead Acid1 MW / 10 Hrs
S15
Utility T&DAdv. Lead Acid1 MW / 3.2 Hrs
S44
Utility T&D Adv. Lead Acid 1 MW/ 4 Hrs
S11
$/kW-Yr
Selected Systems
Levelized $/kW-Yr.
86 Rev. 1, February 2015
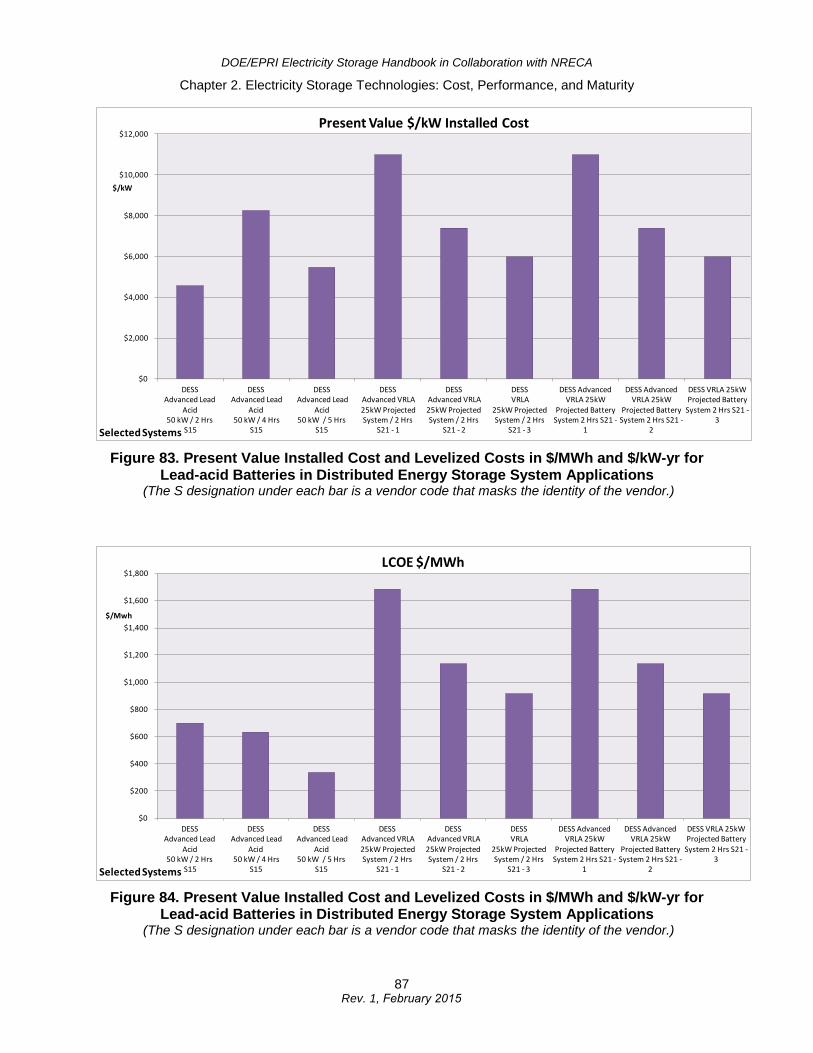
DOE/EPRI Electricity Storage Handbook in Collaboration with NRECA
Chapter 2. Electricity Storage Technologies: Cost, Performance, and Maturity
Figure 83. Present Value Installed Cost and Levelized Costs in $/MWh and $/kW-yr for Lead-acid Batteries in Distributed Energy Storage System Applications
(The S designation under each bar is a vendor code that masks the identity of the vendor.)
Figure 84. Present Value Installed Cost and Levelized Costs in $/MWh and $/kW-yr for Lead-acid Batteries in Distributed Energy Storage System Applications
(The S designation under each bar is a vendor code that masks the identity of the vendor.)
$0
$2,000
$4,000
$6,000
$8,000
$10,000
$12,000
DESS Advanced Lead
Acid 50 kW / 2 Hrs
S15
DESSAdvanced Lead
Acid50 kW / 4 Hrs
S15
DESSAdvanced Lead
Acid 50 kW / 5 Hrs
S15
DESSAdvanced VRLA25kW Projected System / 2 Hrs
S21 - 1
DESSAdvanced VRLA 25kW Projected System / 2 Hrs
S21 - 2
DESSVRLA
25kW Projected System / 2 Hrs
S21 - 3
DESS Advanced VRLA 25kW
Projected Battery System 2 Hrs S21 -
1
DESS Advanced VRLA 25kW
Projected Battery System 2 Hrs S21 -
2
DESS VRLA 25kW Projected Battery
System 2 Hrs S21 -3
$/kW
Selected Systems
Present Value $/kW Installed Cost
$0
$200
$400
$600
$800
$1,000
$1,200
$1,400
$1,600
$1,800
DESS Advanced Lead
Acid 50 kW / 2 Hrs
S15
DESSAdvanced Lead
Acid50 kW / 4 Hrs
S15
DESSAdvanced Lead
Acid 50 kW / 5 Hrs
S15
DESSAdvanced VRLA25kW Projected System / 2 Hrs
S21 - 1
DESSAdvanced VRLA 25kW Projected System / 2 Hrs
S21 - 2
DESSVRLA
25kW Projected System / 2 Hrs
S21 - 3
DESS Advanced VRLA 25kW
Projected Battery System 2 Hrs S21 -
1
DESS Advanced VRLA 25kW
Projected Battery System 2 Hrs S21 -
2
DESS VRLA 25kW Projected Battery
System 2 Hrs S21 -3
$/Mwh
Selected Systems
LCOE $/MWh
87 Rev. 1, February 2015
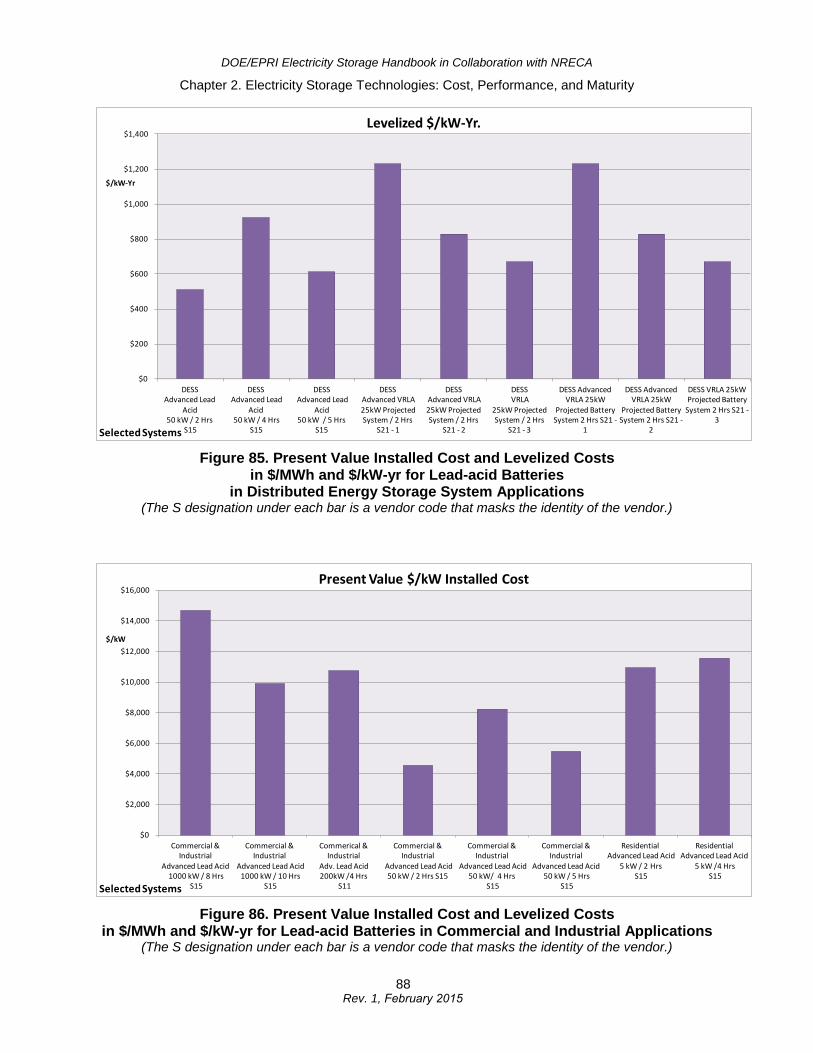
DOE/EPRI Electricity Storage Handbook in Collaboration with NRECA
Chapter 2. Electricity Storage Technologies: Cost, Performance, and Maturity
Figure 85. Present Value Installed Cost and Levelized Costs in $/MWh and $/kW-yr for Lead-acid Batteries
in Distributed Energy Storage System Applications (The S designation under each bar is a vendor code that masks the identity of the vendor.)
Figure 86. Present Value Installed Cost and Levelized Costs in $/MWh and $/kW-yr for Lead-acid Batteries in Commercial and Industrial Applications
(The S designation under each bar is a vendor code that masks the identity of the vendor.)
$0
$200
$400
$600
$800
$1,000
$1,200
$1,400
DESS Advanced Lead
Acid 50 kW / 2 Hrs
S15
DESSAdvanced Lead
Acid50 kW / 4 Hrs
S15
DESSAdvanced Lead
Acid 50 kW / 5 Hrs
S15
DESSAdvanced VRLA25kW Projected System / 2 Hrs
S21 - 1
DESSAdvanced VRLA 25kW Projected System / 2 Hrs
S21 - 2
DESSVRLA
25kW Projected System / 2 Hrs
S21 - 3
DESS Advanced VRLA 25kW
Projected Battery System 2 Hrs S21 -
1
DESS Advanced VRLA 25kW
Projected Battery System 2 Hrs S21 -
2
DESS VRLA 25kW Projected Battery
System 2 Hrs S21 -3
$/kW-Yr
Selected Systems
Levelized $/kW-Yr.
$0
$2,000
$4,000
$6,000
$8,000
$10,000
$12,000
$14,000
$16,000
Commercial & Industrial
Advanced Lead Acid1000 kW / 8 Hrs
S15
Commercial & Industrial
Advanced Lead Acid1000 kW / 10 Hrs
S15
Commerical & Industrial
Adv. Lead Acid 200kW /4 Hrs
S11
Commercial & Industrial
Advanced Lead Acid 50 kW / 2 Hrs S15
Commercial & Industrial
Advanced Lead Acid 50 kW/ 4 Hrs
S15
Commercial & Industrial
Advanced Lead Acid50 kW / 5 Hrs
S15
ResidentialAdvanced Lead Acid
5 kW / 2 HrsS15
Residential Advanced Lead Acid
5 kW /4 HrsS15
$/kW
Selected Systems
Present Value $/kW Installed Cost
88 Rev. 1, February 2015
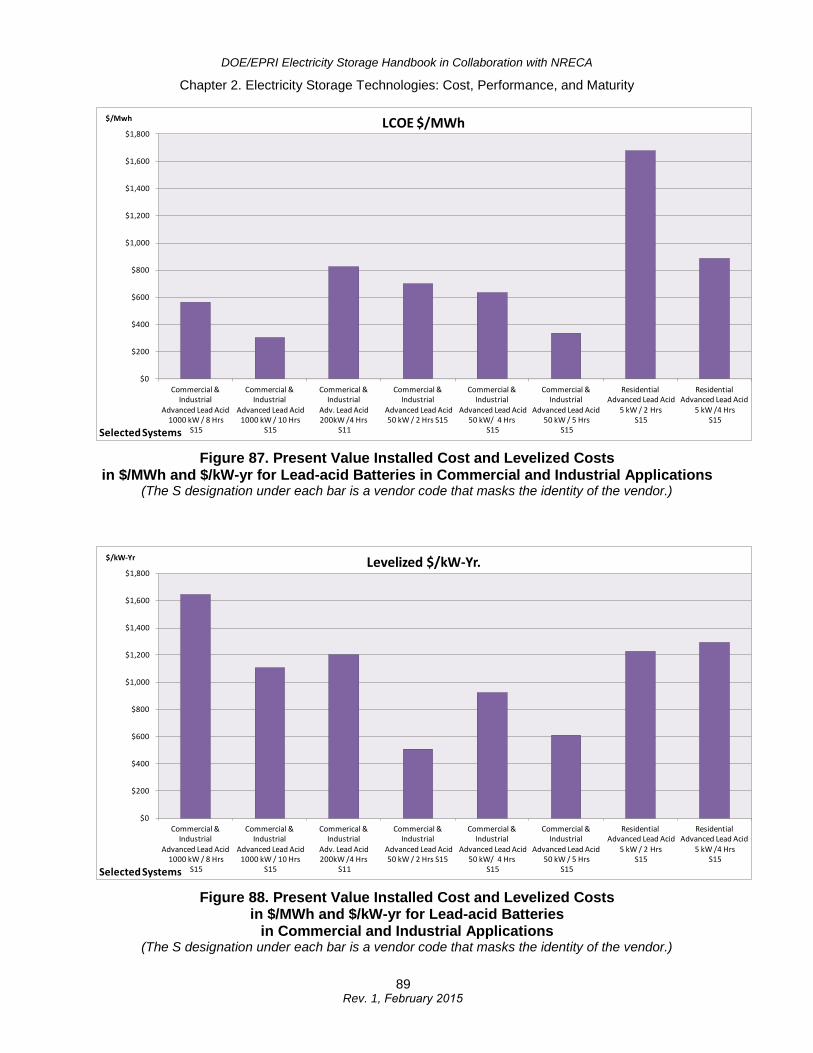
DOE/EPRI Electricity Storage Handbook in Collaboration with NRECA
Chapter 2. Electricity Storage Technologies: Cost, Performance, and Maturity
Figure 87. Present Value Installed Cost and Levelized Costs in $/MWh and $/kW-yr for Lead-acid Batteries in Commercial and Industrial Applications
(The S designation under each bar is a vendor code that masks the identity of the vendor.)
Figure 88. Present Value Installed Cost and Levelized Costs in $/MWh and $/kW-yr for Lead-acid Batteries
in Commercial and Industrial Applications (The S designation under each bar is a vendor code that masks the identity of the vendor.)
$0
$200
$400
$600
$800
$1,000
$1,200
$1,400
$1,600
$1,800
Commercial & Industrial
Advanced Lead Acid1000 kW / 8 Hrs
S15
Commercial & Industrial
Advanced Lead Acid1000 kW / 10 Hrs
S15
Commerical & Industrial
Adv. Lead Acid 200kW /4 Hrs
S11
Commercial & Industrial
Advanced Lead Acid 50 kW / 2 Hrs S15
Commercial & Industrial
Advanced Lead Acid 50 kW/ 4 Hrs
S15
Commercial & Industrial
Advanced Lead Acid50 kW / 5 Hrs
S15
ResidentialAdvanced Lead Acid
5 kW / 2 HrsS15
Residential Advanced Lead Acid
5 kW /4 HrsS15
$/Mwh
Selected Systems
LCOE $/MWh
$0
$200
$400
$600
$800
$1,000
$1,200
$1,400
$1,600
$1,800
Commercial & Industrial
Advanced Lead Acid1000 kW / 8 Hrs
S15
Commercial & Industrial
Advanced Lead Acid1000 kW / 10 Hrs
S15
Commerical & Industrial
Adv. Lead Acid 200kW /4 Hrs
S11
Commercial & Industrial
Advanced Lead Acid 50 kW / 2 Hrs S15
Commercial & Industrial
Advanced Lead Acid 50 kW/ 4 Hrs
S15
Commercial & Industrial
Advanced Lead Acid50 kW / 5 Hrs
S15
ResidentialAdvanced Lead Acid
5 kW / 2 HrsS15
Residential Advanced Lead Acid
5 kW /4 HrsS15
$/kW-Yr
Selected Systems
Levelized $/kW-Yr.
89 Rev. 1, February 2015
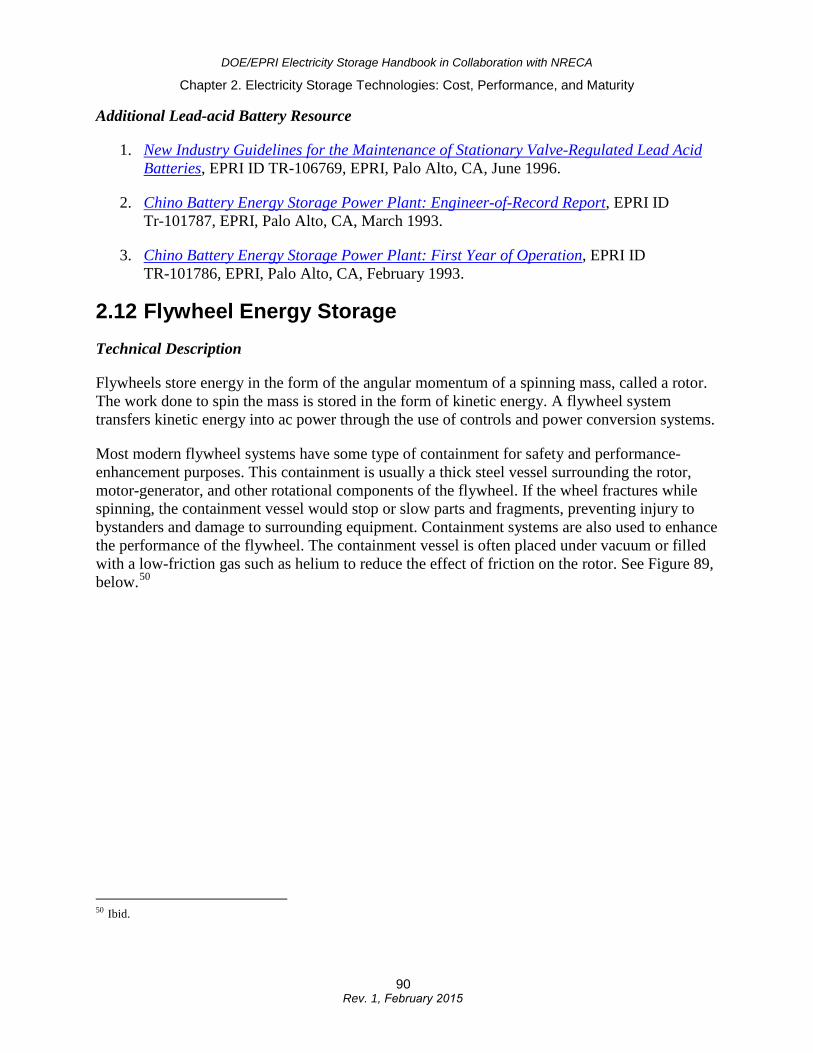
DOE/EPRI Electricity Storage Handbook in Collaboration with NRECA
Chapter 2. Electricity Storage Technologies: Cost, Performance, and Maturity
Additional Lead-acid Battery Resource
1. New Industry Guidelines for the Maintenance of Stationary Valve-Regulated Lead AcidBatteries, EPRI ID TR-106769, EPRI, Palo Alto, CA, June 1996.
2. Chino Battery Energy Storage Power Plant: Engineer-of-Record Report, EPRI IDTr-101787, EPRI, Palo Alto, CA, March 1993.
3. Chino Battery Energy Storage Power Plant: First Year of Operation, EPRI IDTR-101786, EPRI, Palo Alto, CA, February 1993.
2.12 Flywheel Energy Storage Technical Description
Flywheels store energy in the form of the angular momentum of a spinning mass, called a rotor. The work done to spin the mass is stored in the form of kinetic energy. A flywheel system transfers kinetic energy into ac power through the use of controls and power conversion systems.
Most modern flywheel systems have some type of containment for safety and performance-enhancement purposes. This containment is usually a thick steel vessel surrounding the rotor, motor-generator, and other rotational components of the flywheel. If the wheel fractures while spinning, the containment vessel would stop or slow parts and fragments, preventing injury to bystanders and damage to surrounding equipment. Containment systems are also used to enhance the performance of the flywheel. The containment vessel is often placed under vacuum or filled with a low-friction gas such as helium to reduce the effect of friction on the rotor. See Figure 89, below.50
50 Ibid.
90 Rev. 1, February 2015
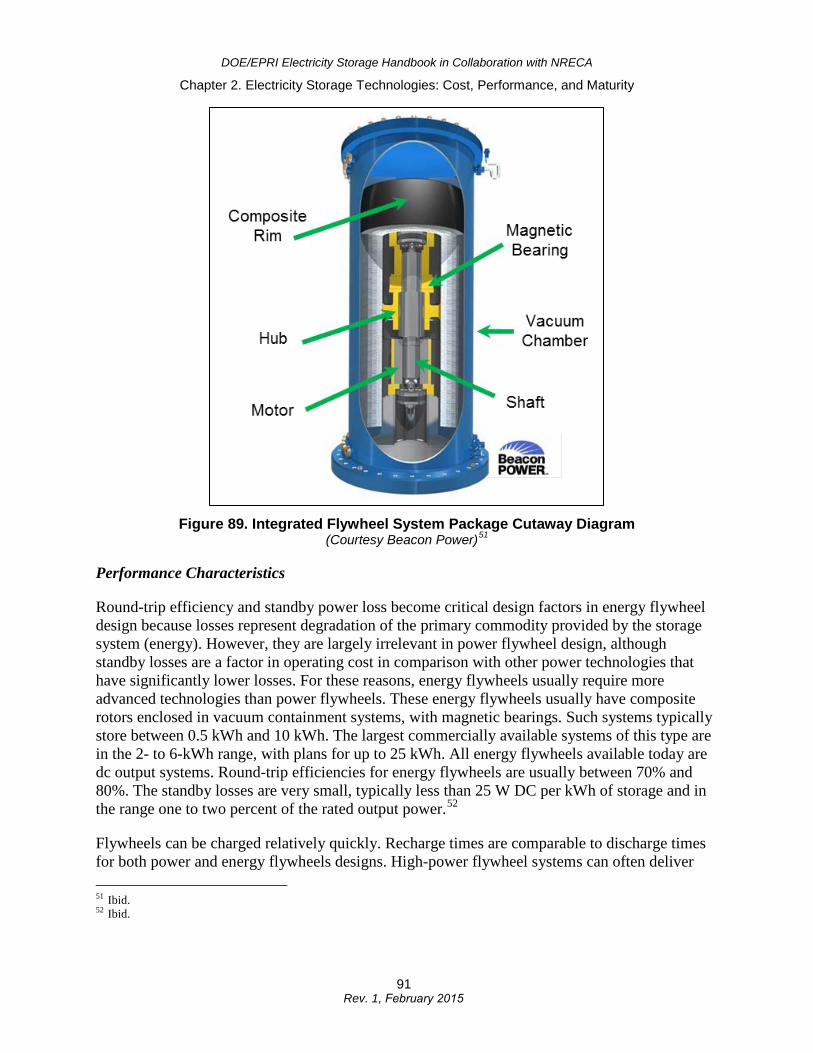
DOE/EPRI Electricity Storage Handbook in Collaboration with NRECA
Chapter 2. Electricity Storage Technologies: Cost, Performance, and Maturity
Figure 89. Integrated Flywheel System Package Cutaway Diagram (Courtesy Beacon Power)51
Performance Characteristics
Round-trip efficiency and standby power loss become critical design factors in energy flywheel design because losses represent degradation of the primary commodity provided by the storage system (energy). However, they are largely irrelevant in power flywheel design, although standby losses are a factor in operating cost in comparison with other power technologies that have significantly lower losses. For these reasons, energy flywheels usually require more advanced technologies than power flywheels. These energy flywheels usually have composite rotors enclosed in vacuum containment systems, with magnetic bearings. Such systems typically store between 0.5 kWh and 10 kWh. The largest commercially available systems of this type are in the 2- to 6-kWh range, with plans for up to 25 kWh. All energy flywheels available today are dc output systems. Round-trip efficiencies for energy flywheels are usually between 70% and 80%. The standby losses are very small, typically less than 25 W DC per kWh of storage and in the range one to two percent of the rated output power.52
Flywheels can be charged relatively quickly. Recharge times are comparable to discharge times for both power and energy flywheels designs. High-power flywheel systems can often deliver
51 Ibid. 52 Ibid.
91 Rev. 1, February 2015
DOE/EPRI Electricity Storage Handbook in Collaboration with NRECA
Chapter 2. Electricity Storage Technologies: Cost, Performance, and Maturity
their energy and recharge in seconds, if adequate recharging power is available. Bidirectional power conversion facilitates this two-way action.53
Flywheels generally exhibit excellent cycle life in comparison with other energy storage systems. Most developers estimate cycle life in excess of 100,000 full charge-discharge cycles. The rotor is subject to fatigue effects arising from the stresses applied during charge and discharge. The most common failure mode for the rotor is the propagation of cracks through the rotor over a period of time.54
As with any energy storage technology, hazardous conditions may exist around operating flywheels. Considerable effort has gone into making flywheels safe for use under a variety of conditions. The most prominent safety issue in flywheel design is failure of the flywheel rotor while it is rotating. In large, massive rotors, such as those made of steel, failure typically results from the propagation of cracks through the rotor, causing large pieces of the flywheel to break off during rotation. Unless the wheel is properly contained, this type of failure can cause damage to surrounding equipment and injury to people in the vicinity. Large steel containment systems are employed to prevent high-speed fragments from causing damage in the event of failure.55
In contrast to many other energy storage systems, flywheel systems have few adverse environmental effects, both in normal operation and in failure conditions. Neither low-speed nor high-speed flywheel systems use hazardous materials, and the machines produce no emissions.56
Today’s flywheel systems are shorter energy duration systems and not generally attractive for large-scale grid support services that require many kWh or MWh of energy storage. Flywheels charge by drawing electricity from the grid to increase rotational speed and discharge by generating electricity as the wheel’s rotation slows. They have a very fast response time of four milliseconds or less, can be sized between 100 kW and 1650 kW, and may be used for short durations of up to one hour. They have very high efficiencies of about 935, with lifetimes estimated at 20 years.
Although flywheels have power densities 5 to 10 times that of batteries—meaning they require much less space to store a comparable amount of power—there are practical limitations to the amount of energy (kWh) that can be stored. A flywheel energy storage plant can be scaled up by adding more flywheel system modules. Typical flywheel applications include power quality and UPS uses, as seen in commercial products. Research is under way to develop more advanced flywheel systems that can store large quantities of energy.
Because flywheel systems are fast-responding and efficient, they are currently being positioned to provide ISO frequency-regulation services. Analysis of such flywheel services have been
53 EPRI-DOE Handbook of Energy Storage for Transmission and Distribution Applications, EPRI ID 1001834, EPRI, Palo Alto, CA, and the U.S. Department of Energy, Washington, DC, 2003. L. D. Mears, H. L. Gotschall - Technology Insights; T. Key, H. Kamath - EPRI PEAC Corporation;
54 Ibid. 55 Ibid. 56 Ibid.
92 Rev. 1, February 2015
DOE/EPRI Electricity Storage Handbook in Collaboration with NRECA
Chapter 2. Electricity Storage Technologies: Cost, Performance, and Maturity
shown to offer system benefits, including avoiding the cycling of large fossil power systems and lower CO2 emissions. Spindle Grid Regulation, LLC (formerly Beacon Power), is currently demonstrating megawatt-scale flywheel plants with cumulative capacities of 20 MW to support the frequency-regulation market needs of ISOs.57
There are also a number of applications that now propose using flywheels as an energy storage medium. These include inrush control, voltage regulation, and stabilization in substations for light rail, trolley, and wind-generation stabilization. The majority of products currently being marketed by national and international-based companies are targeted for power quality (PQ) applications. Another high value application in PQ is short-term bridging through power disturbances or from one power source to an alternate source.58
In summary, the applications proposed for flywheel energy storage are the following:
• Power quality/regulation,• UPS, and• Grid frequency-regulation services.
Maturity and Commercial Availability
Flywheels are currently being marketed as environmentally safe, reliable, modular, and high-cycle life alternatives to lead-acid batteries for UPS and other power-conditioning equipment designed to improve the quality of power delivered to critical or protected loads. Okinawa Power has installed a 23-MW flywheel system for frequency regulation. Fuji Electric has demonstrated the use of flywheel technology to stabilize wind power generation.59
Spindle Grid Regulation, LLC, owns a 20-MW flywheel-based frequency-regulation facility in Stephentown, NY, that commenced operations in 2011 and sells frequency-regulation services to New York Independent System Operator (NYISO) under tariff rates. According to empirical testing performed during early trials, flywheels showed that 1 MW of fast-response flywheel storage produced 20 to 30 MW of regulation service, and that flywheel regulation was two to three times better than an average Independent System Operator –New England (ISO-NE) generator.60 The facility sits on five acres and comprises 200 flywheels, each with a storage capacity of 100kW. Stephentown was originally developed and built by Beacon Power. Beacon also operates the facility. Spindle is also developing a second 20-MW facility in Hazle Township, PA, with financial assistance from the DOE and the Commonwealth of Pennsylvania.
57 Large-Scale Energy Storage in Decarbonised Power Grids, Inage, Shin-ichi, International Energy Agency, Paris, France, 2009.
58 EPRI-DOE Handbook of Energy Storage for Transmission and Distribution Applications, EPRI ID 1001834, EPRI, Palo Alto, CA, and the U.S. Department of Energy, Washington, DC, 2003. L. D. Mears, H. L. Gotschall - Technology Insights; T. Key, H. Kamath - EPRI PEAC Corporation.
59 Electric Energy Storage Technology Options: A White Paper Primer on Applications, Costs and Benefits, PI: Dan Rastler, EPRI ID 1020676, EPRI, Palo Alto, CA, 2010.
60 Application of Fast-Response Energy Storage in NYISO for Frequency Regulation Services, Beacon Power Corporation, Portland, OR, April 2010.
93 Rev. 1, February 2015
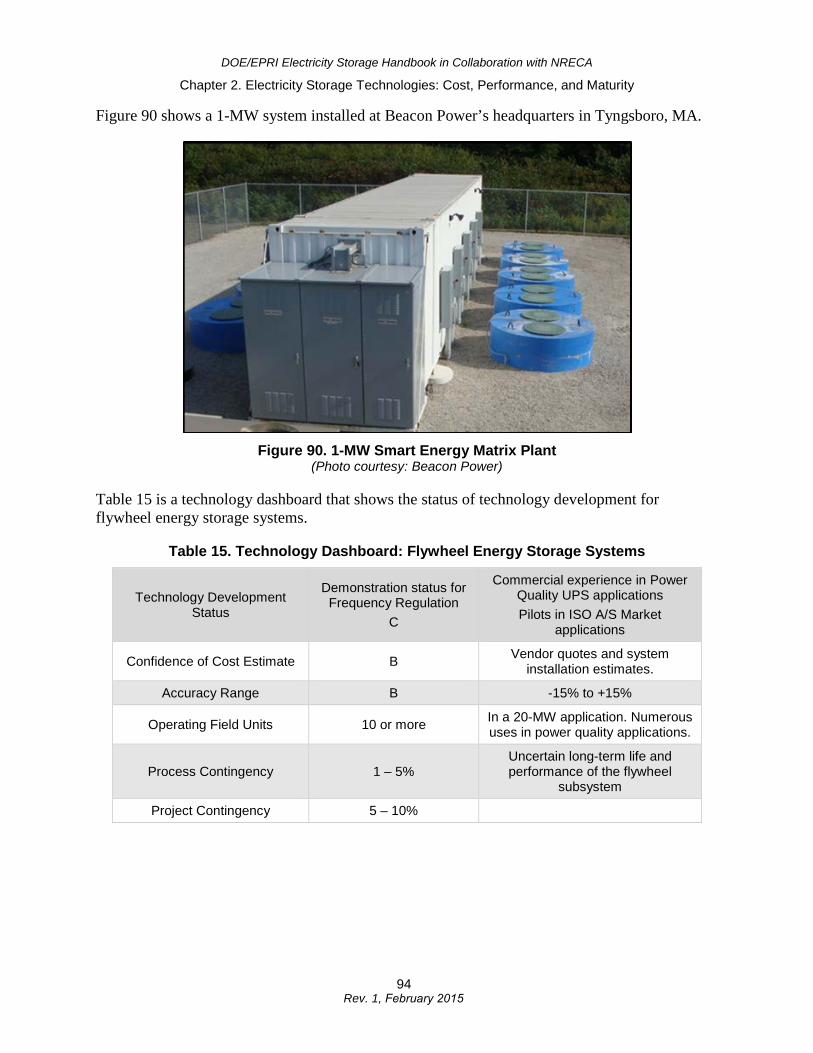
DOE/EPRI Electricity Storage Handbook in Collaboration with NRECA
Chapter 2. Electricity Storage Technologies: Cost, Performance, and Maturity
Figure 90 shows a 1-MW system installed at Beacon Power’s headquarters in Tyngsboro, MA.
Figure 90. 1-MW Smart Energy Matrix Plant (Photo courtesy: Beacon Power)
Table 15 is a technology dashboard that shows the status of technology development for flywheel energy storage systems.
Table 15. Technology Dashboard: Flywheel Energy Storage Systems
Technology Development Status
Demonstration status for Frequency Regulation
C
Commercial experience in Power Quality UPS applications Pilots in ISO A/S Market
applications
Confidence of Cost Estimate B Vendor quotes and system installation estimates.
Accuracy Range B -15% to +15%
Operating Field Units 10 or more In a 20-MW application. Numerous uses in power quality applications.
Process Contingency 1 – 5% Uncertain long-term life and performance of the flywheel
subsystem
Project Contingency 5 – 10%
94 Rev. 1, February 2015
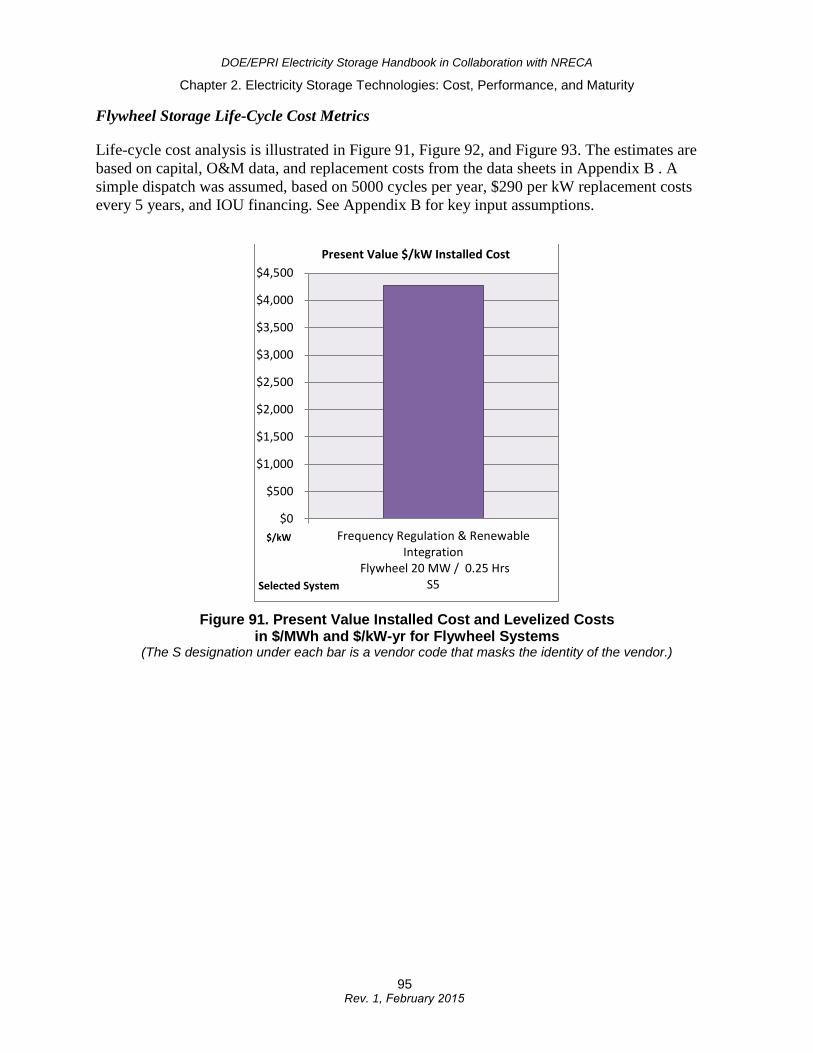
DOE/EPRI Electricity Storage Handbook in Collaboration with NRECA
Chapter 2. Electricity Storage Technologies: Cost, Performance, and Maturity
Flywheel Storage Life-Cycle Cost Metrics
Life-cycle cost analysis is illustrated in Figure 91, Figure 92, and Figure 93. The estimates are based on capital, O&M data, and replacement costs from the data sheets in Appendix B . A simple dispatch was assumed, based on 5000 cycles per year, $290 per kW replacement costs every 5 years, and IOU financing. See Appendix B for key input assumptions.
Figure 91. Present Value Installed Cost and Levelized Costs in $/MWh and $/kW-yr for Flywheel Systems
(The S designation under each bar is a vendor code that masks the identity of the vendor.)
$0
$500
$1,000
$1,500
$2,000
$2,500
$3,000
$3,500
$4,000
$4,500
Frequency Regulation & RenewableIntegration
Flywheel 20 MW / 0.25 HrsS5
$/kW
Selected System
Present Value $/kW Installed Cost
95 Rev. 1, February 2015
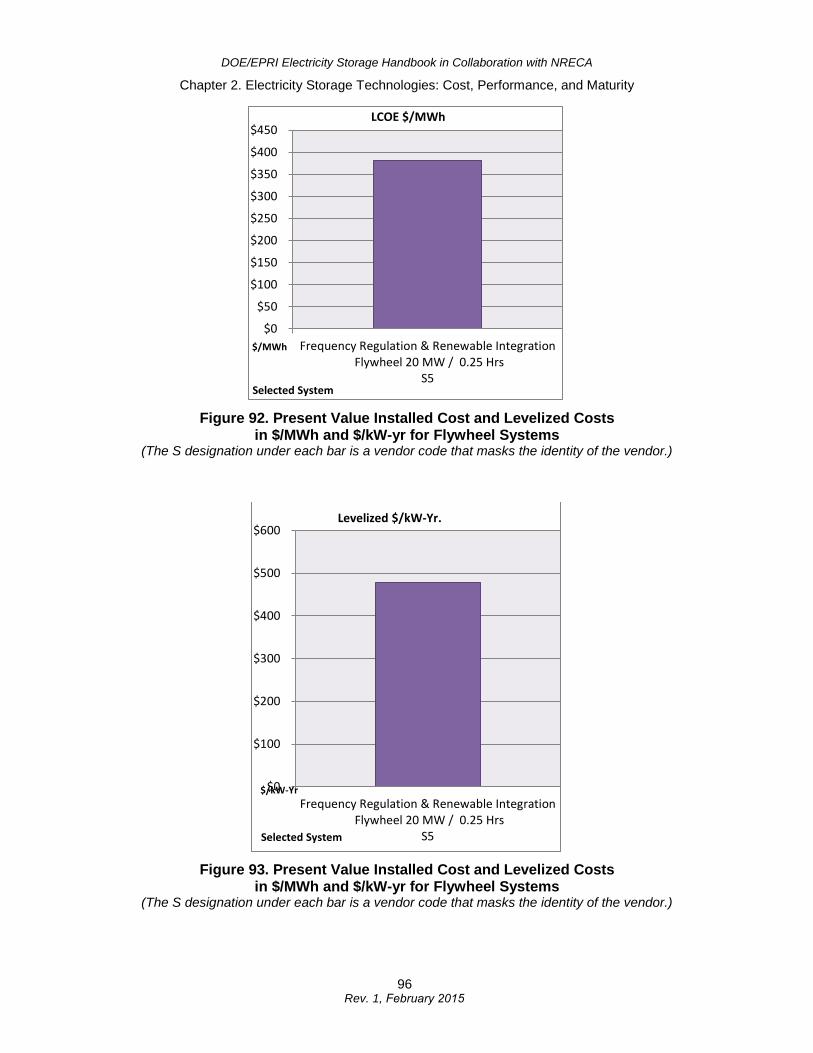
DOE/EPRI Electricity Storage Handbook in Collaboration with NRECA
Chapter 2. Electricity Storage Technologies: Cost, Performance, and Maturity
Figure 92. Present Value Installed Cost and Levelized Costs in $/MWh and $/kW-yr for Flywheel Systems
(The S designation under each bar is a vendor code that masks the identity of the vendor.)
Figure 93. Present Value Installed Cost and Levelized Costs in $/MWh and $/kW-yr for Flywheel Systems
(The S designation under each bar is a vendor code that masks the identity of the vendor.)
$0
$50
$100
$150
$200
$250
$300
$350
$400
$450
Frequency Regulation & Renewable Integration Flywheel 20 MW / 0.25 Hrs
S5
$/MWh
Selected System
LCOE $/MWh
$0
$100
$200
$300
$400
$500
$600
Frequency Regulation & Renewable Integration Flywheel 20 MW / 0.25 Hrs
S5
$/kW-Yr
Selected System
Levelized $/kW-Yr.
96 Rev. 1, February 2015
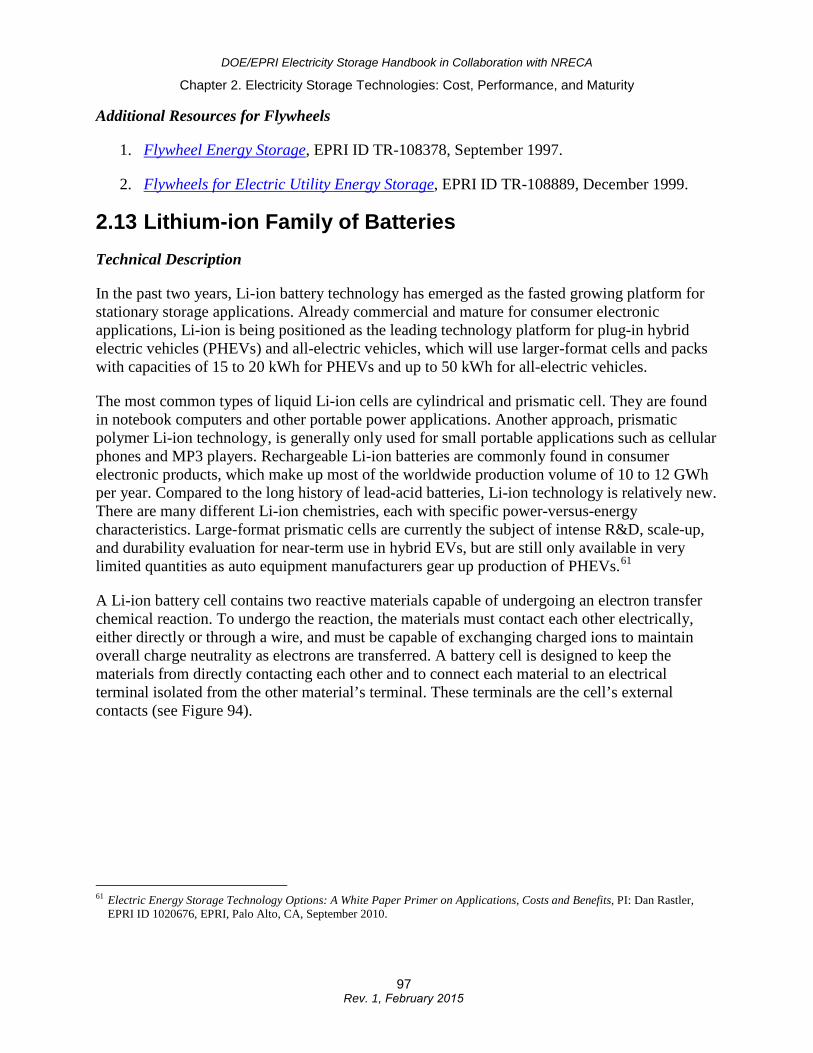
DOE/EPRI Electricity Storage Handbook in Collaboration with NRECA
Chapter 2. Electricity Storage Technologies: Cost, Performance, and Maturity
Additional Resources for Flywheels
1. Flywheel Energy Storage, EPRI ID TR-108378, September 1997.
2. Flywheels for Electric Utility Energy Storage, EPRI ID TR-108889, December 1999.
2.13 Lithium-ion Family of Batteries Technical Description
In the past two years, Li-ion battery technology has emerged as the fasted growing platform for stationary storage applications. Already commercial and mature for consumer electronic applications, Li-ion is being positioned as the leading technology platform for plug-in hybrid electric vehicles (PHEVs) and all-electric vehicles, which will use larger-format cells and packs with capacities of 15 to 20 kWh for PHEVs and up to 50 kWh for all-electric vehicles.
The most common types of liquid Li-ion cells are cylindrical and prismatic cell. They are found in notebook computers and other portable power applications. Another approach, prismatic polymer Li-ion technology, is generally only used for small portable applications such as cellular phones and MP3 players. Rechargeable Li-ion batteries are commonly found in consumer electronic products, which make up most of the worldwide production volume of 10 to 12 GWh per year. Compared to the long history of lead-acid batteries, Li-ion technology is relatively new. There are many different Li-ion chemistries, each with specific power-versus-energy characteristics. Large-format prismatic cells are currently the subject of intense R&D, scale-up, and durability evaluation for near-term use in hybrid EVs, but are still only available in very limited quantities as auto equipment manufacturers gear up production of PHEVs.61
A Li-ion battery cell contains two reactive materials capable of undergoing an electron transfer chemical reaction. To undergo the reaction, the materials must contact each other electrically, either directly or through a wire, and must be capable of exchanging charged ions to maintain overall charge neutrality as electrons are transferred. A battery cell is designed to keep the materials from directly contacting each other and to connect each material to an electrical terminal isolated from the other material’s terminal. These terminals are the cell’s external contacts (see Figure 94).
61 Electric Energy Storage Technology Options: A White Paper Primer on Applications, Costs and Benefits, PI: Dan Rastler, EPRI ID 1020676, EPRI, Palo Alto, CA, September 2010.
97 Rev. 1, February 2015
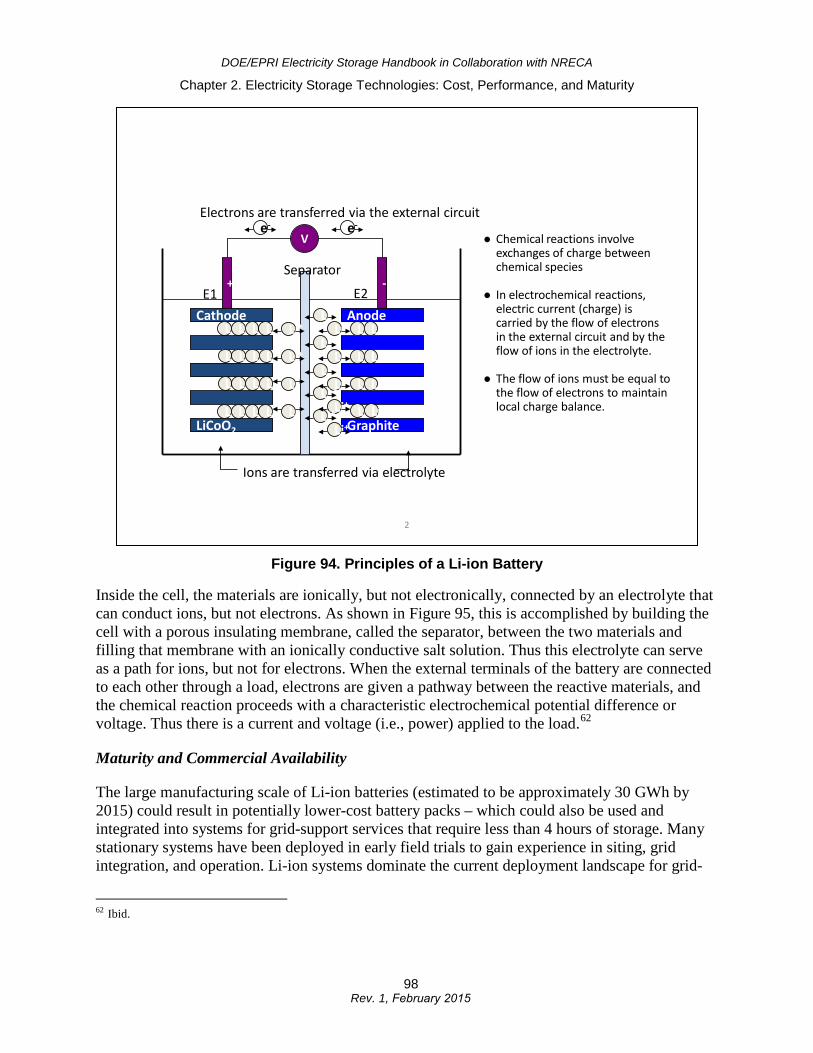
DOE/EPRI Electricity Storage Handbook in Collaboration with NRECA
Chapter 2. Electricity Storage Technologies: Cost, Performance, and Maturity
Figure 94. Principles of a Li-ion Battery
Inside the cell, the materials are ionically, but not electronically, connected by an electrolyte that can conduct ions, but not electrons. As shown in Figure 95, this is accomplished by building the cell with a porous insulating membrane, called the separator, between the two materials and filling that membrane with an ionically conductive salt solution. Thus this electrolyte can serve as a path for ions, but not for electrons. When the external terminals of the battery are connected to each other through a load, electrons are given a pathway between the reactive materials, and the chemical reaction proceeds with a characteristic electrochemical potential difference or voltage. Thus there is a current and voltage (i.e., power) applied to the load.62
Maturity and Commercial Availability
The large manufacturing scale of Li-ion batteries (estimated to be approximately 30 GWh by 2015) could result in potentially lower-cost battery packs – which could also be used and integrated into systems for grid-support services that require less than 4 hours of storage. Many stationary systems have been deployed in early field trials to gain experience in siting, grid integration, and operation. Li-ion systems dominate the current deployment landscape for grid-
62 Ibid.
2
Chemical reactions involve exchanges of charge betweenchemical species
In electrochemical reactions,electric current (charge) iscarried by the flow of electronsin the external circuit and by the flow of ions in the electrolyte.
The flow of ions must be equal tothe flow of electrons to maintainlocal charge balance.
LiCoO2
Cathode
Graphite
Anode
+ -
Li Li Li Li
Li Li Li Li
Li Li Li Li
Li Li Li Li
Li LiLi+
Li+Li+
Li+
Li+
Li+Li+
Li+
Li +
Li + Li Li
Li Li
Li LiLi+
Li+
Li+
Li+
Ions are transferred via electrolyte
Separator
E1 E2
Ve- e-
Electrons are transferred via the external circuit
98 Rev. 1, February 2015
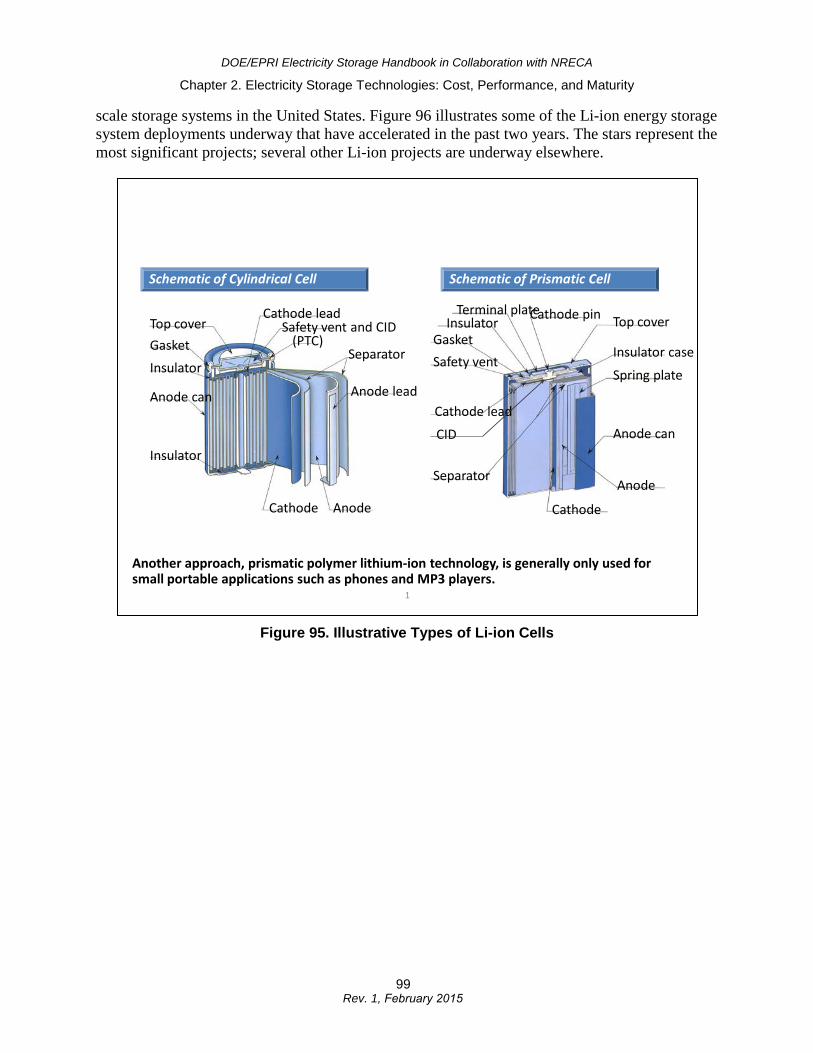
DOE/EPRI Electricity Storage Handbook in Collaboration with NRECA
Chapter 2. Electricity Storage Technologies: Cost, Performance, and Maturity
scale storage systems in the United States. Figure 96 illustrates some of the Li-ion energy storage system deployments underway that have accelerated in the past two years. The stars represent the most significant projects; several other Li-ion projects are underway elsewhere.
Figure 95. Illustrative Types of Li-ion Cells
1
Schematic of Cylindrical Cell Schematic of Prismatic Cell
Cathode leadSafety vent and CID
(PTC)Separator
Anode lead
AnodeCathode
Insulator
Anode can
InsulatorGasketTop cover
Cathode pin Top cover
Insulator case
Spring plate
Anode can
Anode
Cathode
Separator
Cathode lead
Safety ventGasket
InsulatorTerminal plate
CID
Another approach, prismatic polymer lithium-ion technology, is generally only used for small portable applications such as phones and MP3 players.
99 Rev. 1, February 2015
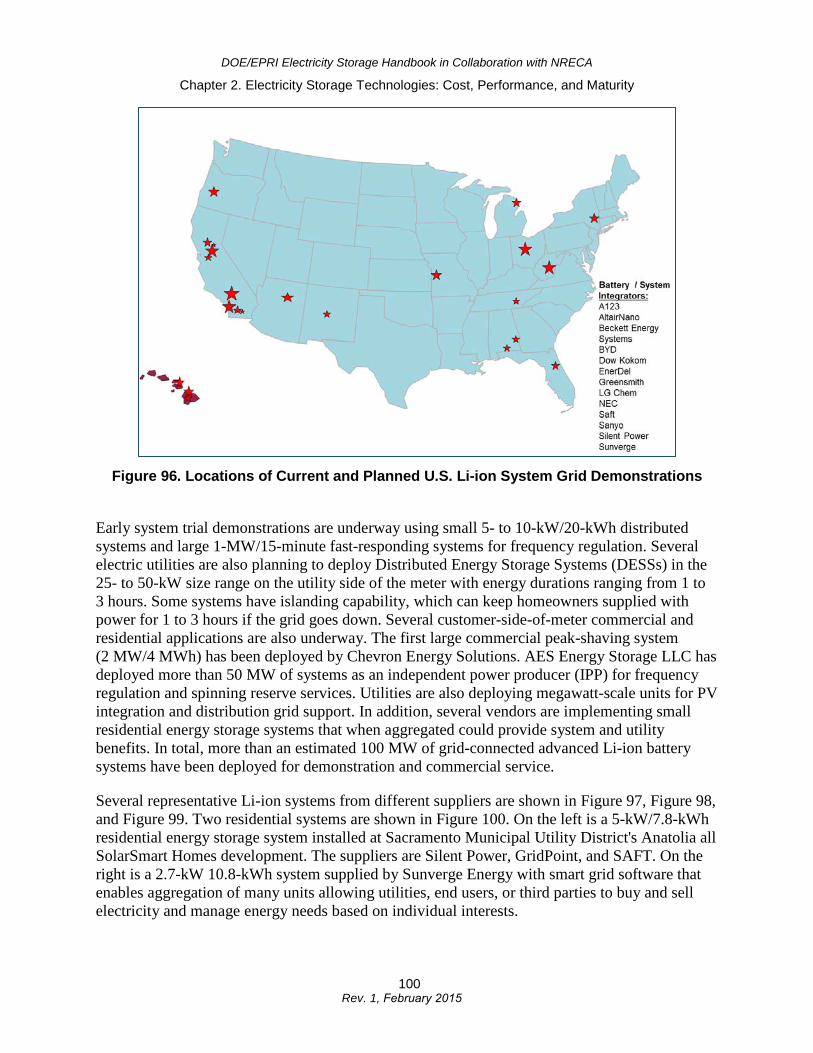
DOE/EPRI Electricity Storage Handbook in Collaboration with NRECA
Chapter 2. Electricity Storage Technologies: Cost, Performance, and Maturity
Figure 96. Locations of Current and Planned U.S. Li-ion System Grid Demonstrations
Early system trial demonstrations are underway using small 5- to 10-kW/20-kWh distributed systems and large 1-MW/15-minute fast-responding systems for frequency regulation. Several electric utilities are also planning to deploy Distributed Energy Storage Systems (DESSs) in the 25- to 50-kW size range on the utility side of the meter with energy durations ranging from 1 to 3 hours. Some systems have islanding capability, which can keep homeowners supplied with power for 1 to 3 hours if the grid goes down. Several customer-side-of-meter commercial and residential applications are also underway. The first large commercial peak-shaving system (2 MW/4 MWh) has been deployed by Chevron Energy Solutions. AES Energy Storage LLC has deployed more than 50 MW of systems as an independent power producer (IPP) for frequency regulation and spinning reserve services. Utilities are also deploying megawatt-scale units for PV integration and distribution grid support. In addition, several vendors are implementing small residential energy storage systems that when aggregated could provide system and utility benefits. In total, more than an estimated 100 MW of grid-connected advanced Li-ion battery systems have been deployed for demonstration and commercial service.
Several representative Li-ion systems from different suppliers are shown in Figure 97, Figure 98, and Figure 99. Two residential systems are shown in Figure 100. On the left is a 5-kW/7.8-kWh residential energy storage system installed at Sacramento Municipal Utility District's Anatolia all SolarSmart Homes development. The suppliers are Silent Power, GridPoint, and SAFT. On the right is a 2.7-kW 10.8-kWh system supplied by Sunverge Energy with smart grid software that enables aggregation of many units allowing utilities, end users, or third parties to buy and sell electricity and manage energy needs based on individual interests.
100 Rev. 1, February 2015
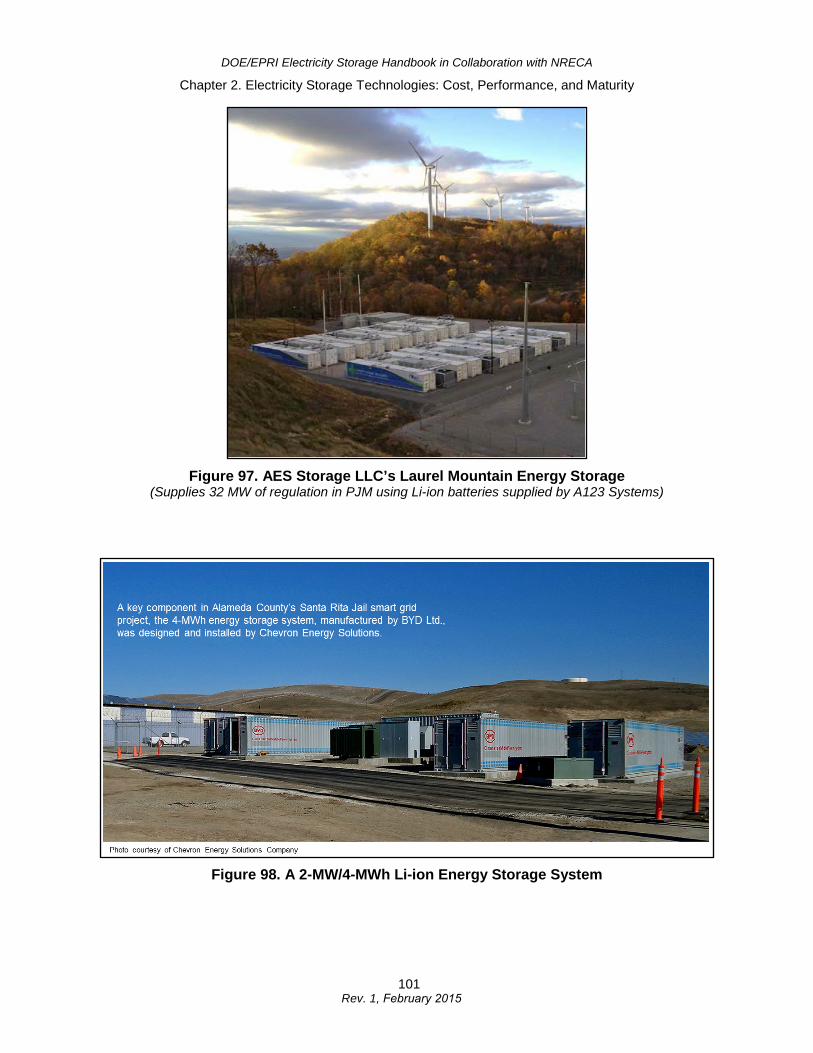
DOE/EPRI Electricity Storage Handbook in Collaboration with NRECA
Chapter 2. Electricity Storage Technologies: Cost, Performance, and Maturity
Figure 97. AES Storage LLC’s Laurel Mountain Energy Storage (Supplies 32 MW of regulation in PJM using Li-ion batteries supplied by A123 Systems)
Figure 98. A 2-MW/4-MWh Li-ion Energy Storage System
101Rev. 1, February 2015
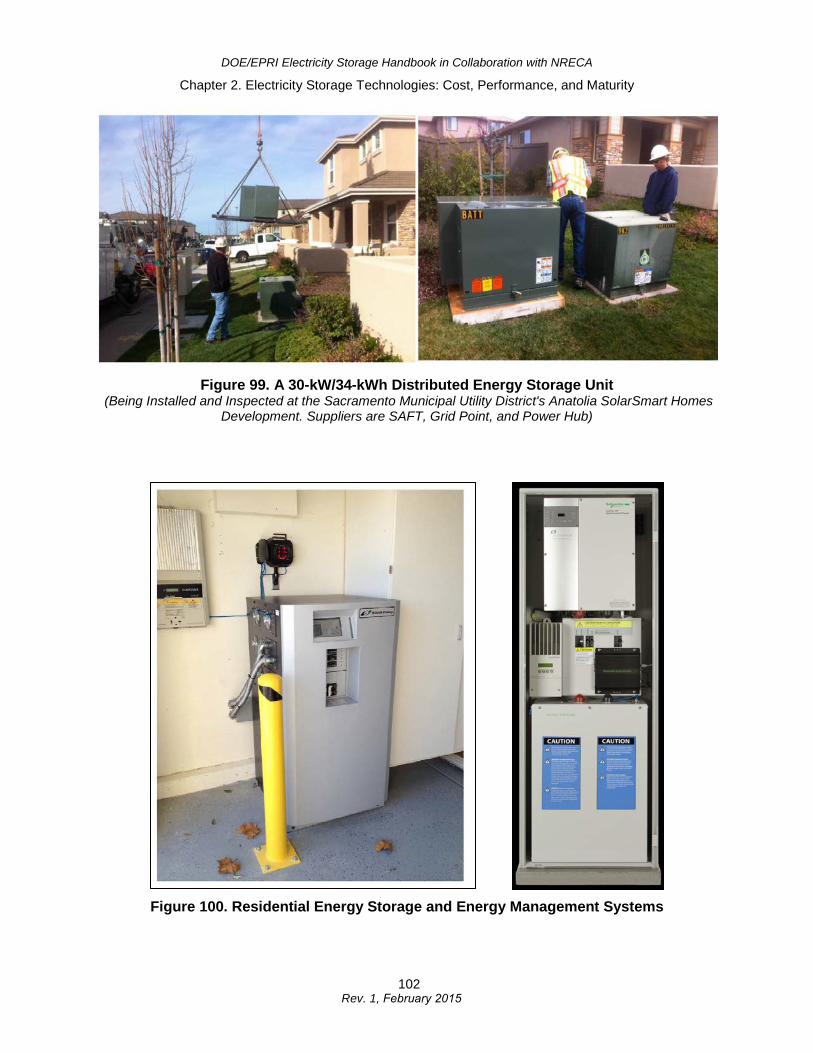
DOE/EPRI Electricity Storage Handbook in Collaboration with NRECA
Chapter 2. Electricity Storage Technologies: Cost, Performance, and Maturity
Figure 99. A 30-kW/34-kWh Distributed Energy Storage Unit (Being Installed and Inspected at the Sacramento Municipal Utility District's Anatolia SolarSmart Homes
Development. Suppliers are SAFT, Grid Point, and Power Hub)
Figure 100. Residential Energy Storage and Energy Management Systems
102Rev. 1, February 2015
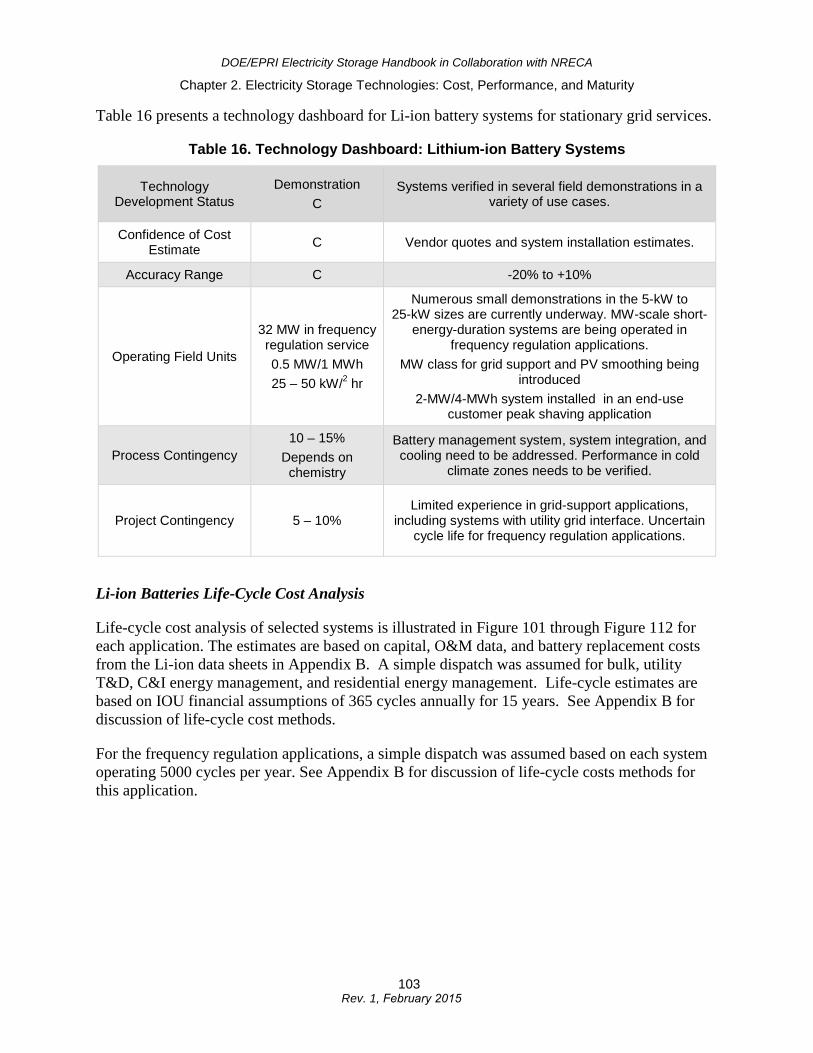
DOE/EPRI Electricity Storage Handbook in Collaboration with NRECA
Chapter 2. Electricity Storage Technologies: Cost, Performance, and Maturity
Table 16 presents a technology dashboard for Li-ion battery systems for stationary grid services.
Table 16. Technology Dashboard: Lithium-ion Battery Systems
Technology Development Status
Demonstration C
Systems verified in several field demonstrations in a variety of use cases.
Confidence of Cost Estimate C Vendor quotes and system installation estimates.
Accuracy Range C -20% to +10%
Operating Field Units
32 MW in frequency regulation service 0.5 MW/1 MWh 25 – 50 kW/2 hr
Numerous small demonstrations in the 5-kW to 25-kW sizes are currently underway. MW-scale short-
energy-duration systems are being operated in frequency regulation applications.
MW class for grid support and PV smoothing being introduced
2-MW/4-MWh system installed in an end-use customer peak shaving application
Process Contingency 10 – 15%
Depends on chemistry
Battery management system, system integration, and cooling need to be addressed. Performance in cold
climate zones needs to be verified.
Project Contingency 5 – 10% Limited experience in grid-support applications,
including systems with utility grid interface. Uncertain cycle life for frequency regulation applications.
Li-ion Batteries Life-Cycle Cost Analysis
Life-cycle cost analysis of selected systems is illustrated in Figure 101 through Figure 112 for each application. The estimates are based on capital, O&M data, and battery replacement costs from the Li-ion data sheets in Appendix B. A simple dispatch was assumed for bulk, utility T&D, C&I energy management, and residential energy management. Life-cycle estimates are based on IOU financial assumptions of 365 cycles annually for 15 years. See Appendix B for discussion of life-cycle cost methods.
For the frequency regulation applications, a simple dispatch was assumed based on each system operating 5000 cycles per year. See Appendix B for discussion of life-cycle costs methods for this application.
103 Rev. 1, February 2015
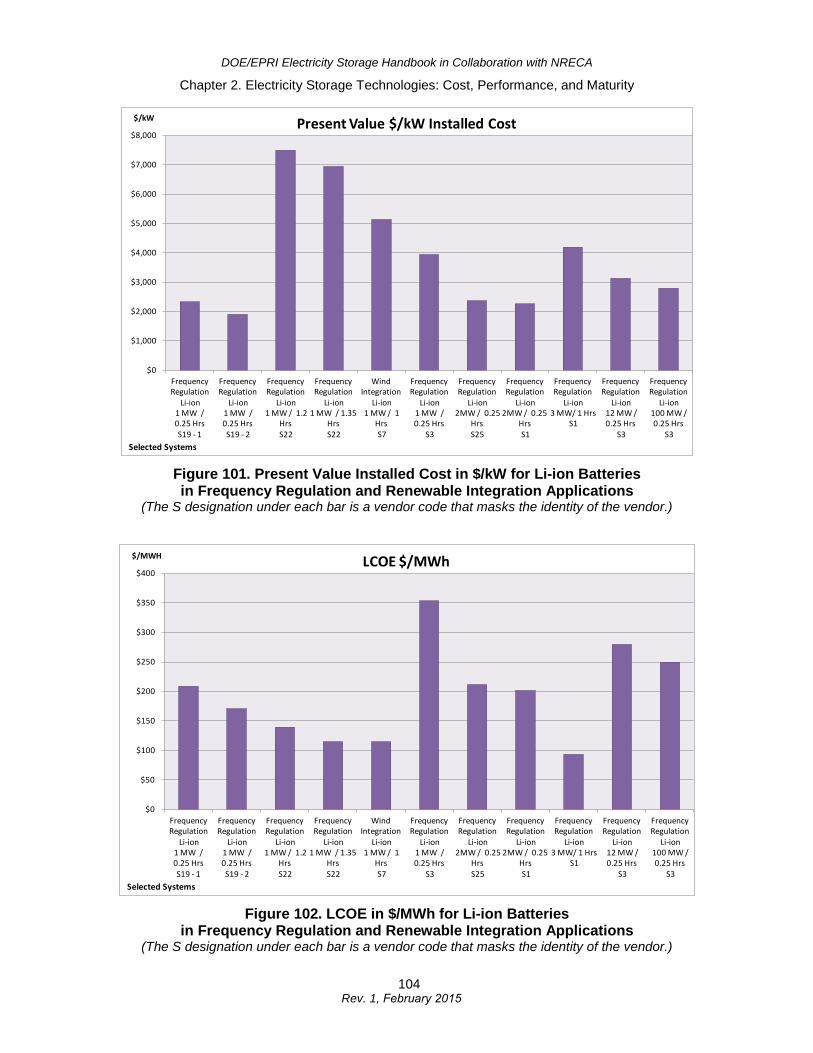
DOE/EPRI Electricity Storage Handbook in Collaboration with NRECA
Chapter 2. Electricity Storage Technologies: Cost, Performance, and Maturity
Figure 101. Present Value Installed Cost in $/kW for Li-ion Batteries in Frequency Regulation and Renewable Integration Applications
(The S designation under each bar is a vendor code that masks the identity of the vendor.)
Figure 102. LCOE in $/MWh for Li-ion Batteries in Frequency Regulation and Renewable Integration Applications
(The S designation under each bar is a vendor code that masks the identity of the vendor.)
$0
$1,000
$2,000
$3,000
$4,000
$5,000
$6,000
$7,000
$8,000
Frequency Regulation
Li-ion 1 MW / 0.25 Hrs S19 - 1
Frequency Regulation
Li-ion1 MW / 0.25 HrsS19 - 2
Frequency Regulation
Li-ion1 MW / 1.2
HrsS22
Frequency Regulation
Li-ion 1 MW / 1.35
HrsS22
Wind Integration
Li-ion1 MW / 1
HrsS7
Frequency Regulation
Li-ion 1 MW / 0.25 Hrs
S3
Frequency Regulation
Li-ion2MW / 0.25
HrsS25
Frequency Regulation
Li-ion 2MW / 0.25
HrsS1
Frequency Regulation
Li-ion3 MW/ 1 Hrs
S1
Frequency Regulation
Li-ion 12 MW / 0.25 Hrs
S3
Frequency Regulation
Li-ion 100 MW / 0.25 Hrs
S3
$/kW
Selected Systems
Present Value $/kW Installed Cost
$0
$50
$100
$150
$200
$250
$300
$350
$400
Frequency Regulation
Li-ion 1 MW / 0.25 Hrs S19 - 1
Frequency Regulation
Li-ion1 MW / 0.25 HrsS19 - 2
Frequency Regulation
Li-ion1 MW / 1.2
HrsS22
Frequency Regulation
Li-ion 1 MW / 1.35
HrsS22
Wind Integration
Li-ion1 MW / 1
HrsS7
Frequency Regulation
Li-ion 1 MW / 0.25 Hrs
S3
Frequency Regulation
Li-ion2MW / 0.25
HrsS25
Frequency Regulation
Li-ion 2MW / 0.25
HrsS1
Frequency Regulation
Li-ion3 MW/ 1 Hrs
S1
Frequency Regulation
Li-ion 12 MW / 0.25 Hrs
S3
Frequency Regulation
Li-ion 100 MW / 0.25 Hrs
S3
$/MWH
Selected Systems
LCOE $/MWh
104 Rev. 1, February 2015
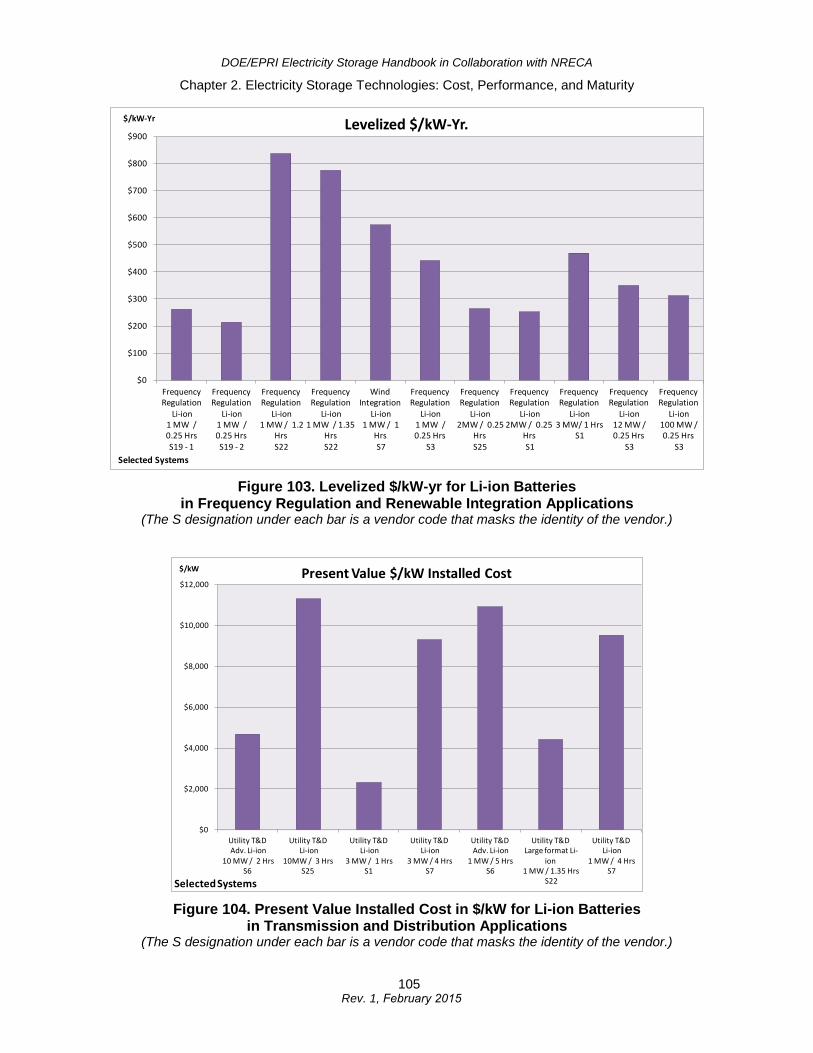
DOE/EPRI Electricity Storage Handbook in Collaboration with NRECA
Chapter 2. Electricity Storage Technologies: Cost, Performance, and Maturity
Figure 103. Levelized $/kW-yr for Li-ion Batteries in Frequency Regulation and Renewable Integration Applications
(The S designation under each bar is a vendor code that masks the identity of the vendor.)
Figure 104. Present Value Installed Cost in $/kW for Li-ion Batteries in Transmission and Distribution Applications
(The S designation under each bar is a vendor code that masks the identity of the vendor.)
$0
$100
$200
$300
$400
$500
$600
$700
$800
$900
Frequency Regulation
Li-ion 1 MW / 0.25 Hrs S19 - 1
Frequency Regulation
Li-ion1 MW / 0.25 HrsS19 - 2
Frequency Regulation
Li-ion1 MW / 1.2
HrsS22
Frequency Regulation
Li-ion 1 MW / 1.35
HrsS22
Wind Integration
Li-ion1 MW / 1
HrsS7
Frequency Regulation
Li-ion 1 MW / 0.25 Hrs
S3
Frequency Regulation
Li-ion2MW / 0.25
HrsS25
Frequency Regulation
Li-ion 2MW / 0.25
HrsS1
Frequency Regulation
Li-ion3 MW/ 1 Hrs
S1
Frequency Regulation
Li-ion 12 MW / 0.25 Hrs
S3
Frequency Regulation
Li-ion 100 MW / 0.25 Hrs
S3
$/kW-Yr
Selected Systems
Levelized $/kW-Yr.
$0
$2,000
$4,000
$6,000
$8,000
$10,000
$12,000
Utility T&DAdv. Li-ion
10 MW / 2 Hrs S6
Utility T&DLi-ion
10MW / 3 Hrs S25
Utility T&DLi-ion
3 MW / 1 Hrs S1
Utility T&DLi-ion
3 MW / 4 HrsS7
Utility T&DAdv. Li-ion
1 MW / 5 HrsS6
Utility T&DLarge format Li-
ion1 MW / 1.35 Hrs
S22
Utility T&DLi-ion
1 MW / 4 HrsS7
$/kW
Selected Systems
Present Value $/kW Installed Cost
105 Rev. 1, February 2015
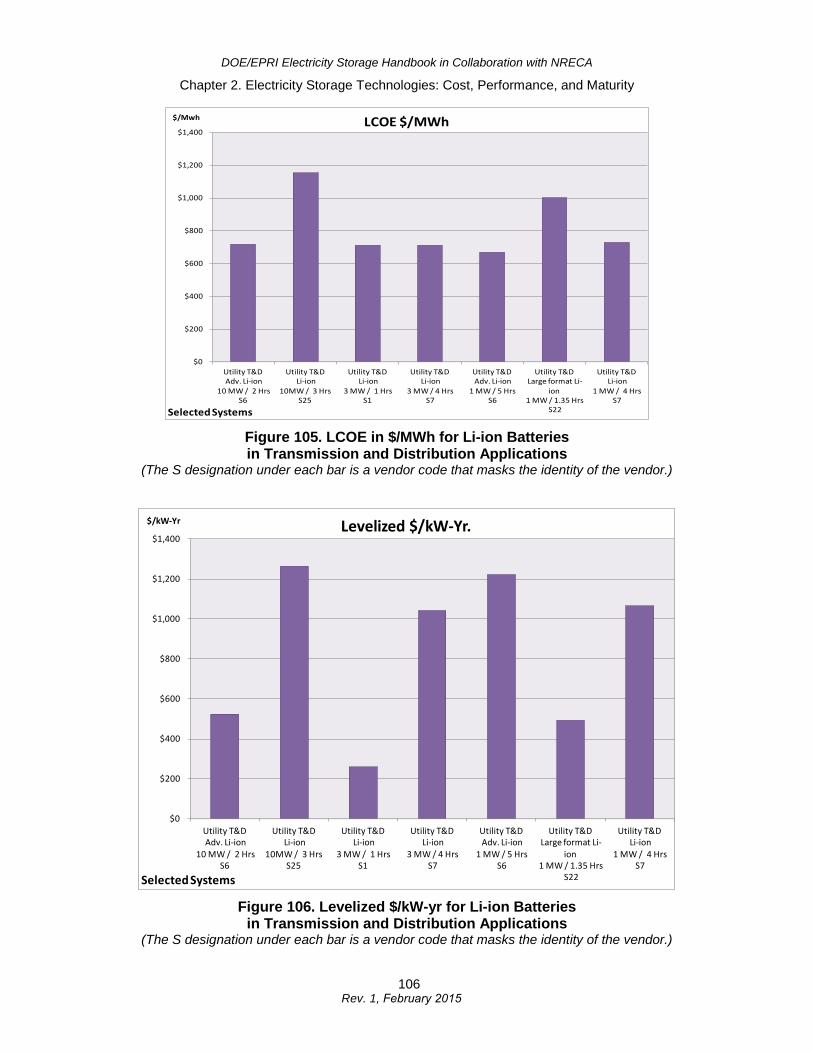
DOE/EPRI Electricity Storage Handbook in Collaboration with NRECA
Chapter 2. Electricity Storage Technologies: Cost, Performance, and Maturity
Figure 105. LCOE in $/MWh for Li-ion Batteries in Transmission and Distribution Applications
(The S designation under each bar is a vendor code that masks the identity of the vendor.)
Figure 106. Levelized $/kW-yr for Li-ion Batteries in Transmission and Distribution Applications
(The S designation under each bar is a vendor code that masks the identity of the vendor.)
$0
$200
$400
$600
$800
$1,000
$1,200
$1,400
Utility T&DAdv. Li-ion
10 MW / 2 Hrs S6
Utility T&DLi-ion
10MW / 3 Hrs S25
Utility T&DLi-ion
3 MW / 1 Hrs S1
Utility T&DLi-ion
3 MW / 4 HrsS7
Utility T&DAdv. Li-ion
1 MW / 5 HrsS6
Utility T&DLarge format Li-
ion1 MW / 1.35 Hrs
S22
Utility T&DLi-ion
1 MW / 4 HrsS7
$/Mwh
Selected Systems
LCOE $/MWh
$0
$200
$400
$600
$800
$1,000
$1,200
$1,400
Utility T&DAdv. Li-ion
10 MW / 2 Hrs S6
Utility T&DLi-ion
10MW / 3 Hrs S25
Utility T&DLi-ion
3 MW / 1 Hrs S1
Utility T&DLi-ion
3 MW / 4 HrsS7
Utility T&DAdv. Li-ion
1 MW / 5 HrsS6
Utility T&DLarge format Li-
ion1 MW / 1.35 Hrs
S22
Utility T&DLi-ion
1 MW / 4 HrsS7
$/kW-Yr
Selected Systems
Levelized $/kW-Yr.
106 Rev. 1, February 2015
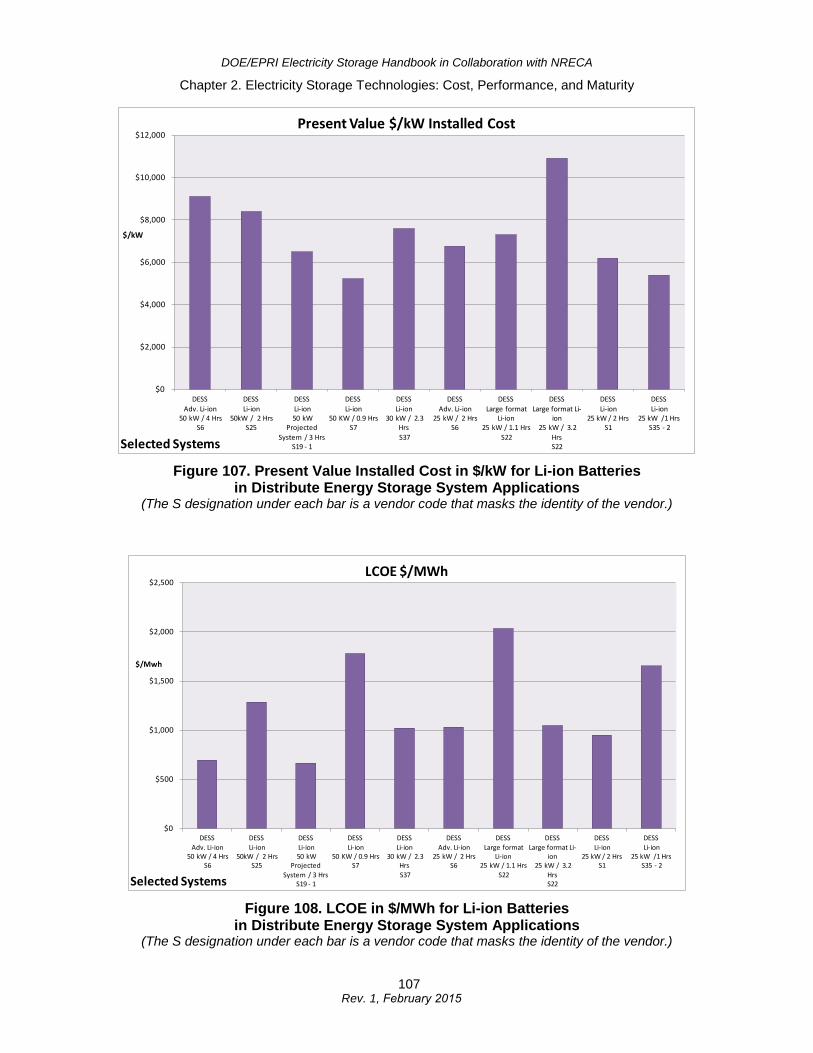
DOE/EPRI Electricity Storage Handbook in Collaboration with NRECA
Chapter 2. Electricity Storage Technologies: Cost, Performance, and Maturity
Figure 107. Present Value Installed Cost in $/kW for Li-ion Batteries in Distribute Energy Storage System Applications
(The S designation under each bar is a vendor code that masks the identity of the vendor.)
Figure 108. LCOE in $/MWh for Li-ion Batteries in Distribute Energy Storage System Applications
(The S designation under each bar is a vendor code that masks the identity of the vendor.)
$0
$2,000
$4,000
$6,000
$8,000
$10,000
$12,000
DESSAdv. Li-ion
50 kW / 4 HrsS6
DESSLi-ion
50kW / 2 HrsS25
DESSLi-ion50 kW
Projected System / 3 Hrs
S19 - 1
DESSLi-ion
50 KW / 0.9 HrsS7
DESS Li-ion
30 kW / 2.3 HrsS37
DESSAdv. Li-ion
25 kW / 2 Hrs S6
DESSLarge format
Li-ion25 kW / 1.1 Hrs
S22
DESSLarge format Li-
ion25 kW / 3.2
HrsS22
DESSLi-ion
25 kW / 2 HrsS1
DESSLi-ion
25 kW /1 HrsS35 - 2
$/kW
Selected Systems
Present Value $/kW Installed Cost
$0
$500
$1,000
$1,500
$2,000
$2,500
DESSAdv. Li-ion
50 kW / 4 HrsS6
DESSLi-ion
50kW / 2 HrsS25
DESSLi-ion50 kW
Projected System / 3 Hrs
S19 - 1
DESSLi-ion
50 KW / 0.9 HrsS7
DESS Li-ion
30 kW / 2.3 HrsS37
DESSAdv. Li-ion
25 kW / 2 Hrs S6
DESSLarge format
Li-ion25 kW / 1.1 Hrs
S22
DESSLarge format Li-
ion25 kW / 3.2
HrsS22
DESSLi-ion
25 kW / 2 HrsS1
DESSLi-ion
25 kW /1 HrsS35 - 2
$/Mwh
Selected Systems
LCOE $/MWh
107 Rev. 1, February 2015
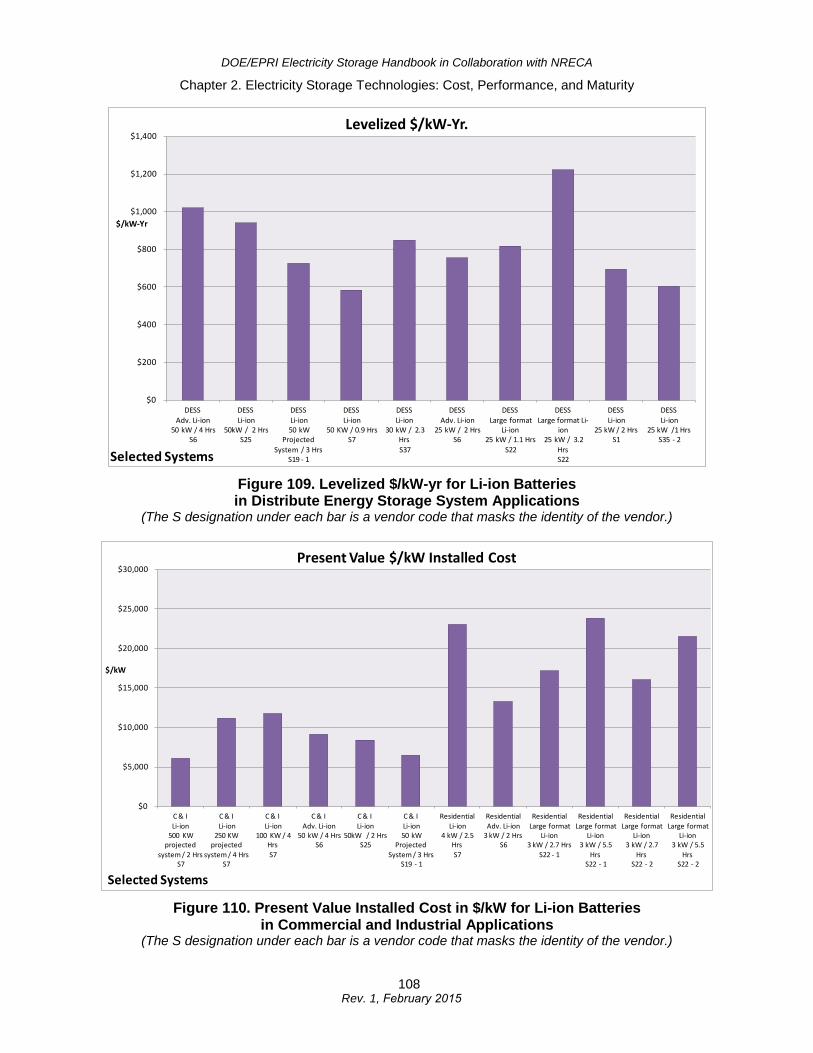
DOE/EPRI Electricity Storage Handbook in Collaboration with NRECA
Chapter 2. Electricity Storage Technologies: Cost, Performance, and Maturity
Figure 109. Levelized $/kW-yr for Li-ion Batteries in Distribute Energy Storage System Applications
(The S designation under each bar is a vendor code that masks the identity of the vendor.)
Figure 110. Present Value Installed Cost in $/kW for Li-ion Batteries in Commercial and Industrial Applications
(The S designation under each bar is a vendor code that masks the identity of the vendor.)
$0
$200
$400
$600
$800
$1,000
$1,200
$1,400
DESSAdv. Li-ion
50 kW / 4 HrsS6
DESSLi-ion
50kW / 2 HrsS25
DESSLi-ion50 kW
Projected System / 3 Hrs
S19 - 1
DESSLi-ion
50 KW / 0.9 HrsS7
DESS Li-ion
30 kW / 2.3 HrsS37
DESSAdv. Li-ion
25 kW / 2 Hrs S6
DESSLarge format
Li-ion25 kW / 1.1 Hrs
S22
DESSLarge format Li-
ion25 kW / 3.2
HrsS22
DESSLi-ion
25 kW / 2 HrsS1
DESSLi-ion
25 kW /1 HrsS35 - 2
$/kW-Yr
Selected Systems
Levelized $/kW-Yr.
$0
$5,000
$10,000
$15,000
$20,000
$25,000
$30,000
C & ILi-ion
500 KW projected
system / 2 HrsS7
C & ILi-ion
250 KW projected
system / 4 HrsS7
C & ILi-ion
100 KW / 4 HrsS7
C & IAdv. Li-ion
50 kW / 4 HrsS6
C & ILi-ion
50kW / 2 HrsS25
C & ILi-ion50 kW
Projected System / 3 Hrs
S19 - 1
ResidentialLi-ion
4 kW / 2.5 HrsS7
ResidentialAdv. Li-ion
3 kW / 2 HrsS6
ResidentialLarge format
Li-ion3 kW / 2.7 Hrs
S22 - 1
ResidentialLarge format
Li-ion3 kW / 5.5
HrsS22 - 1
ResidentialLarge format
Li-ion3 kW / 2.7
HrsS22 - 2
ResidentialLarge format
Li-ion3 kW / 5.5
HrsS22 - 2
$/kW
Selected Systems
Present Value $/kW Installed Cost
108 Rev. 1, February 2015
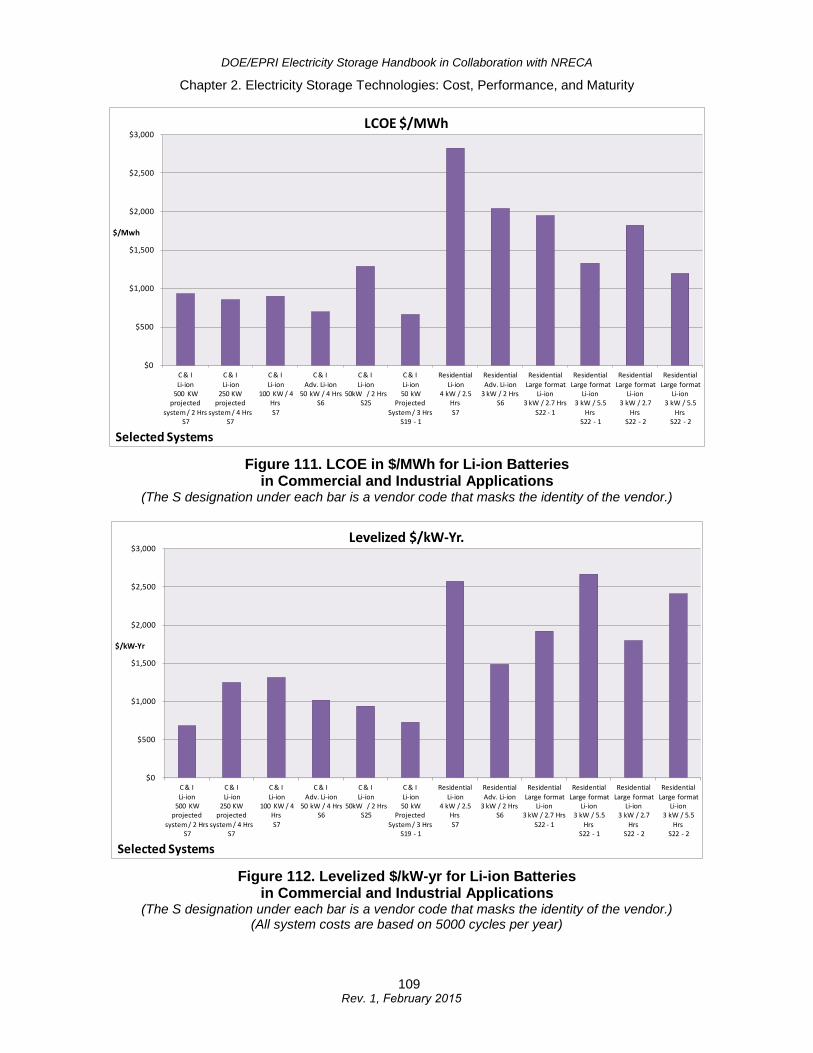
DOE/EPRI Electricity Storage Handbook in Collaboration with NRECA
Chapter 2. Electricity Storage Technologies: Cost, Performance, and Maturity
Figure 111. LCOE in $/MWh for Li-ion Batteries in Commercial and Industrial Applications
(The S designation under each bar is a vendor code that masks the identity of the vendor.)
Figure 112. Levelized $/kW-yr for Li-ion Batteries in Commercial and Industrial Applications
(The S designation under each bar is a vendor code that masks the identity of the vendor.) (All system costs are based on 5000 cycles per year)
$0
$500
$1,000
$1,500
$2,000
$2,500
$3,000
C & ILi-ion
500 KW projected
system / 2 HrsS7
C & ILi-ion
250 KW projected
system / 4 HrsS7
C & ILi-ion
100 KW / 4 HrsS7
C & IAdv. Li-ion
50 kW / 4 HrsS6
C & ILi-ion
50kW / 2 HrsS25
C & ILi-ion50 kW
Projected System / 3 Hrs
S19 - 1
ResidentialLi-ion
4 kW / 2.5 HrsS7
ResidentialAdv. Li-ion
3 kW / 2 HrsS6
ResidentialLarge format
Li-ion3 kW / 2.7 Hrs
S22 - 1
ResidentialLarge format
Li-ion3 kW / 5.5
HrsS22 - 1
ResidentialLarge format
Li-ion3 kW / 2.7
HrsS22 - 2
ResidentialLarge format
Li-ion3 kW / 5.5
HrsS22 - 2
$/Mwh
Selected Systems
LCOE $/MWh
$0
$500
$1,000
$1,500
$2,000
$2,500
$3,000
C & ILi-ion
500 KW projected
system / 2 HrsS7
C & ILi-ion
250 KW projected
system / 4 HrsS7
C & ILi-ion
100 KW / 4 HrsS7
C & IAdv. Li-ion
50 kW / 4 HrsS6
C & ILi-ion
50kW / 2 HrsS25
C & ILi-ion50 kW
Projected System / 3 Hrs
S19 - 1
ResidentialLi-ion
4 kW / 2.5 HrsS7
ResidentialAdv. Li-ion
3 kW / 2 HrsS6
ResidentialLarge format
Li-ion3 kW / 2.7 Hrs
S22 - 1
ResidentialLarge format
Li-ion3 kW / 5.5
HrsS22 - 1
ResidentialLarge format
Li-ion3 kW / 2.7
HrsS22 - 2
ResidentialLarge format
Li-ion3 kW / 5.5
HrsS22 - 2
$/kW-Yr
Selected Systems
Levelized $/kW-Yr.
109 Rev. 1, February 2015
DOE/EPRI Electricity Storage Handbook in Collaboration with NRECA
Chapter 2. Electricity Storage Technologies: Cost, Performance, and Maturity
Additional Resources for Li-ion Batteries
1. Technical Specification for a Transportable Energy Storage System for Grid SupportUsing Commercially Available Li-ion Technology, EPRI ID 1025573, EPRI, Palo Alto,CA, July 2012.
2. Demonstration Initiative for a Grid Support Storage System using Li-ion Technology:Phase I Report, EPRI ID 1025574, EPRI, Palo Alto, CA, August 2012.
3. Electricity Energy Storage Technology Options, EPRI ID 1020676, EPRI, Palo Alto, CA,December 2010.
110Rev. 1, February 2015
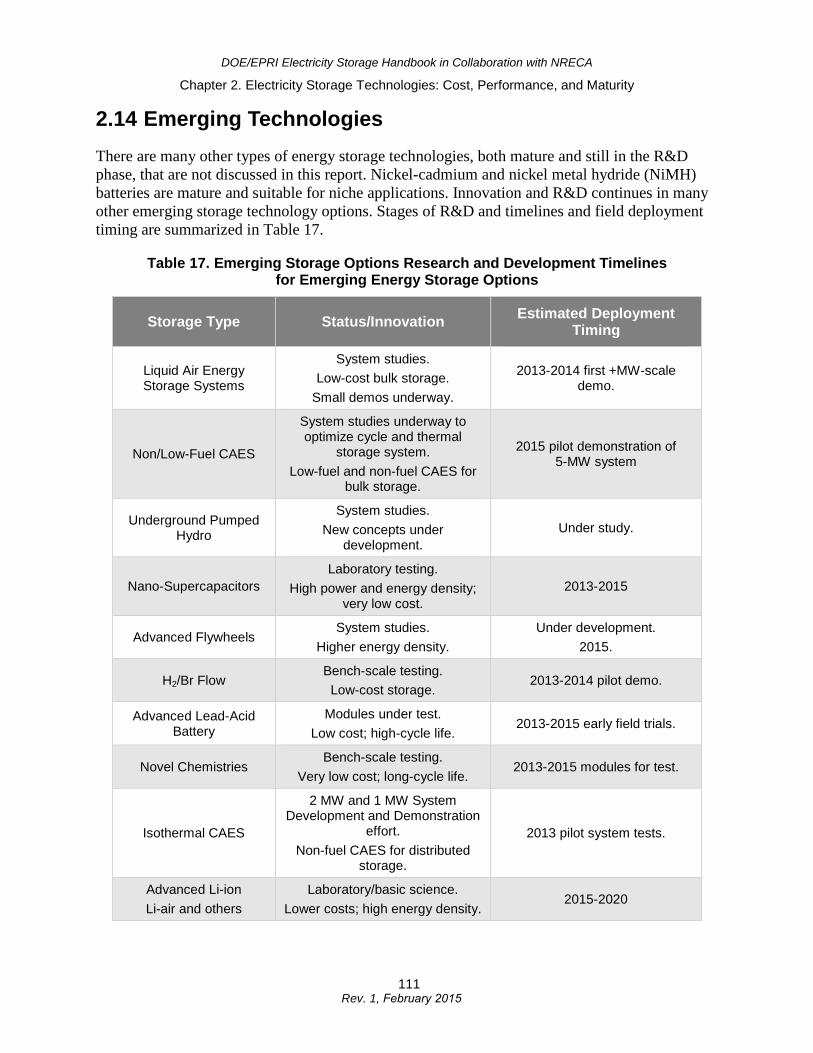
DOE/EPRI Electricity Storage Handbook in Collaboration with NRECA
Chapter 2. Electricity Storage Technologies: Cost, Performance, and Maturity
2.14 Emerging Technologies There are many other types of energy storage technologies, both mature and still in the R&D phase, that are not discussed in this report. Nickel-cadmium and nickel metal hydride (NiMH) batteries are mature and suitable for niche applications. Innovation and R&D continues in many other emerging storage technology options. Stages of R&D and timelines and field deployment timing are summarized in Table 17.
Table 17. Emerging Storage Options Research and Development Timelines for Emerging Energy Storage Options
Storage Type Status/Innovation Estimated Deployment Timing
Liquid Air Energy Storage Systems
System studies. Low-cost bulk storage.
Small demos underway.
2013-2014 first +MW-scale demo.
Non/Low-Fuel CAES
System studies underway to optimize cycle and thermal
storage system. Low-fuel and non-fuel CAES for
bulk storage.
2015 pilot demonstration of 5-MW system
Underground Pumped Hydro
System studies. New concepts under
development. Under study.
Nano-Supercapacitors Laboratory testing.
High power and energy density; very low cost.
2013-2015
Advanced Flywheels System studies.
Higher energy density. Under development.
2015.
H2/Br Flow Bench-scale testing. Low-cost storage.
2013-2014 pilot demo.
Advanced Lead-Acid Battery
Modules under test. Low cost; high-cycle life.
2013-2015 early field trials.
Novel Chemistries Bench-scale testing.
Very low cost; long-cycle life. 2013-2015 modules for test.
Isothermal CAES
2 MW and 1 MW System Development and Demonstration
effort. Non-fuel CAES for distributed
storage.
2013 pilot system tests.
Advanced Li-ion Li-air and others
Laboratory/basic science. Lower costs; high energy density.
2015-2020
111 Rev. 1, February 2015
DOE/EPRI Electricity Storage Handbook in Collaboration with NRECA
Chapter 2. Electricity Storage Technologies: Cost, Performance, and Maturity
112 Rev. 1, February 2015