Embed Size (px)
Citation preview
Costs and benefits of a United Kingdom exit from the European Union

Costs and benefits of a United Kingdom exit
from the European Union
Ap
ril
201
5
STUDY commissioned by the
Bertelsmann Stiftung
Term: March 1, 2015 through April 15, 2015
Final report on April 15, 2015
Rahel Aichele
Gabriel Felbermayr
Center for International Economics
Poschingerstr. 5, 81679 Munich
2
Table of contents
1. Introduction 5
2. Historical summary: From Winston Churchill’s “United States of Europe” in
1946 to Nigel Farage’s UKIP today 9
3. The United Kingdom’s economic relationships with the EU over time 13
3.1. Trade relations 17
3.2. Foreign direct investments 24
3.3. Migration 28
4. Net contribution and UK rebate: How much does the UK actually pay? 32
5. Scenario calculations: What costs could a Brexit create for the UK? Static
effects 37
5.1. Scenarios 37
5.2. Estimating the effects on trade, sectoral net value added, openness
and real income 38
5.3. Static net effects: a cost-benefit analysis of the EU exit 43
6. What costs would Germany and the EU be facing? Static analysis 45
7. Dynamic effects 49
7.1. Dynamic effects of trade (de)integration for the UK and Germany
49
7.2. Effects through limiting the free movement of people 51
7.3. Estimating the maximum damage of a Brexit 53
7.4. Comparison with other studies 55
8. Closing comments and solution options 57
Bibliography 59
3
Figures and tables
Figure 1 United Kingdom’s per capita income relative to Germany (GER) and
France (FRA) over time (purchasing power parities) ........................................ 10
Figure 2 Economic trends in the UK, Germany and EU, 1960-2013 (growth rates
of the GDP per capita in %) .............................................................................. 13
Figure 3 Economic trends in Germany and the UK, Q1 2010-Q4 2014 (growth
rates of the nominal GDP) ................................................................................ 14
Figure 4 Long-term interest rates for 10-year bonds, 2010-2015 ..................... 15
Figure 5 Comparison of inflation rates in the UK and Germany, 1996-2014 .... 16
Figure 6 Government debt in the UK and Germany, 2002-2013 ...................... 17
Figure 7 Percentage of British exports and imports to and from the EU over time
(in %) ................................................................................................................ 18
Figure 8 Top 10 export destinations (%) UK, 2012 ........................................... 19
Figure 9 Top 10 import sources (%) UK, 2012 ................................................. 20
Figure 10 EU and total FDI stock in the UK ...................................................... 25
Figure 11 Countries of origin for EU27 FDI stock in the UK (in USD millions), 2012
......................................................................................................................... 26
Figure 12 UK FDI stock in other EU countries and worldwide .......................... 27
Figure 13 Target countries within the EU27 for UK FDI stock (in USD millions),
2012 ................................................................................................................. 28
Figure 14 Foreign population growth in the UK ................................................ 29
Figure 15 EU citizens in the UK (in thousands), 2011 ...................................... 30
Figure 16 UK citizens who live in other EU countries (in thousands), 2009 ..... 31
Figure 17 The United Kingdom’s net financing contribution to the EU budget . 35
Figure 18 Influence of a Brexit on sectoral value added in the UK ................... 43
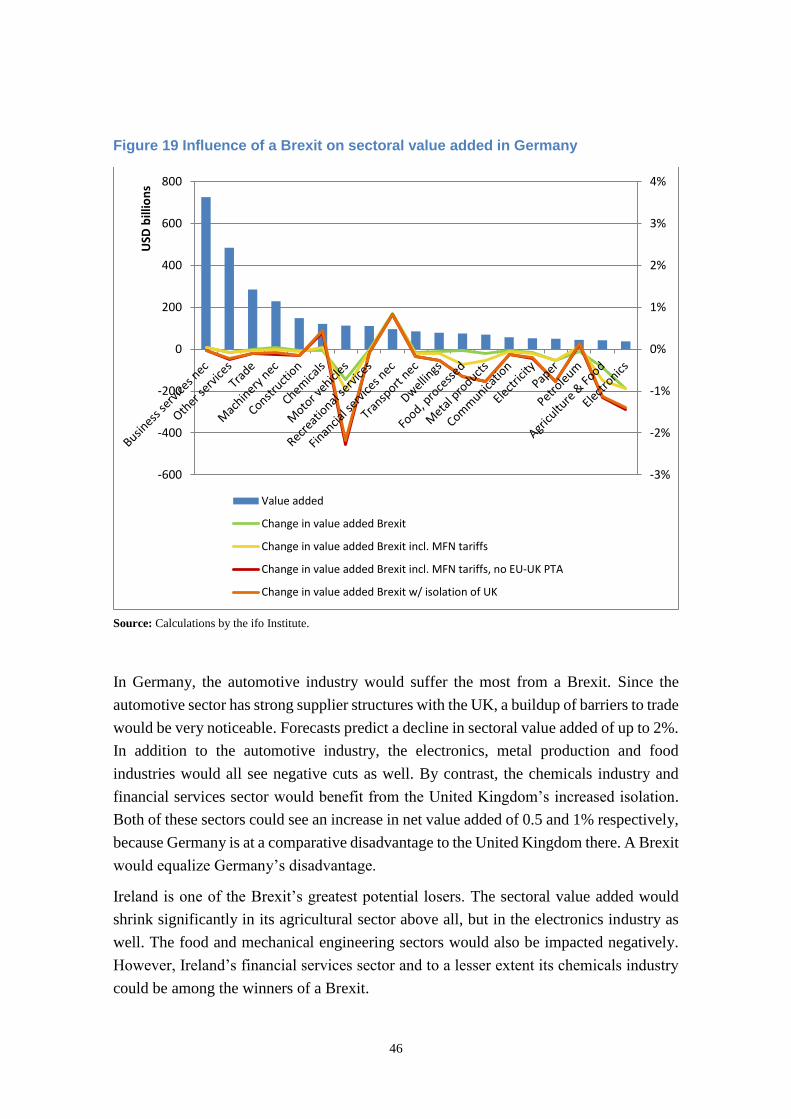
Figure 19 Influence of a Brexit on sectoral value added in Germany ............... 46
Figure 20 Influence of a Brexit on sectoral value added in Ireland ................... 47
Figure 21 Development of per capita income in the UK and in a synthetic control
group before and after the United Kingdom joined the EU ............................... 54
Table 1 Top 20 UK exports to the EU, 2012 21
Table 2 Top 20 UK imports from the EU, 2012 22
Table 3 Top 20 UK exports to Germany, 2012 23
Table 4 Top 20 UK imports from Germany, 2012 24
Table 5 2013 EU budget, gross and net contributions and how they may change
due to a Brexit 33

4
Table 6 Costs of a Brexit, different scenarios 40
Table 7 Changes in the UK’s income per capita through reduced trade openness,
static + dynamic effects, long term 50
Table 8 Changes in Germany’s income per capita through reduced trade
openness, static + dynamic effects, long term 51
Table 9 Changes in the UK’s income per capita through limiting the free
movement of people, static + dynamic effects, long term 53
5
1. Introduction
“You can’t have your cake and eat it, too.”
(famous English saying first documented in a letter from Duke Thomas of Norfolk to
Thomas Cromwell dated 1538.1)
Or maybe you can?
Is it possible to take part in the economic advantages of the European project without
having to bear the associated political costs of relinquishing sovereignty?
Proponents of the United Kingdom leaving the European Union – the Brexit (“British
Exit”) – believe that the answer to this question is yes.2 Opponents see economic
unification above all as a means for creating a political community in Europe. And many
pragmatists think that true, deep economic integration without a minimum of common
political institutions is impossible. Therefore, the idea of gaining economic advantages
without sacrificing a certain amount of political leeway is simply fiction. You can’t have
your cake and eat it, too. We can’t have both things at the same time - the benefits of
deep economic integration and complete political flexibility.
The debate about the United Kingdom’s (UK) role in Europe has been marked by this
fundamental tension since the beginning. After World War II the country preferred a free
trade zone rather than a customs union, which would enable the UK to have flexibility in
handling its special relations with its colonies and the USA and could function without
establishing common institutions. When the United Kingdom finally joined the European
Community in 1973, the course had already been largely set – and the country has been
at odds with its fate ever since.
The election results for the UK’s House of Commons from May 7, 2015 will be crucial
for deciding whether the country remains in the EU. Having been reelected Prime
Minister David Cameron, promised his electorate, he will hold a referendum on the Brexit
in 2017 to decide whether the country is in or out. Prior to that, conditions for the United
Kingdom to stay in the EU are slated to be renegotiated.
The discussion about the Brexit is about the future of Europe, because many other EU
member states are having similar discussions, although to a less extreme degree. However
the potential referendum should turn out and however the other EU members may react
1 British History Online. See also http://www.todayifoundout.com/index.php/2014/01/cake-eat/. 2 The term, “Brexit,” is misleading in that Britain or Great Britain would not be exiting the EU, but rather
the United Kingdom, which includes England, Scotland, Wales and Northern Ireland. The geographical
term “British Isles” also encompasses Ireland, which is not debating whether to leave the EU.
6
to a Brexit, the case will set a precedent that will significantly influence how the EU
continues to develop.
What would happen in the event of a Brexit? Since the Treaty of Lisbon in 2009, countries
have the opportunity to freely and unilaterally exit the EU.3 But how a country’s
relationships with the remaining EU member states would be handled after an exit, and
how common policy areas – especially trade policy – should be returned to the national
level would need to be negotiated on an individual basis after the intent to exit is
announced. The economic costs arising from a Brexit depend heavily on these details.
Can the country reach a new bilateral free trade agreement after exiting that would
guarantee non-discriminatory access to the goods and services markets of EU members?
How would the freedom of labor markets and capital markets be handled? Since the EU
negotiates international trade agreements on behalf of its members, the approximately 40
existing bilateral agreements would no longer apply to the United Kingdom should it
withdraw from the Union. How well and how quickly could the country successfully
replace these agreements? Obviously a great deal depends on the goodwill of the
remaining EU members and their trade partners. It is nearly impossible to anticipate what
would happen since all EU member states have veto powers. As such, the costs stemming
from a Brexit cannot be predicted with great reliability.
However, it is certainly clear that a Brexit would have substantial effects on the United
Kingdom and other EU nations because the UK’s economic interdependence with other
EU member states is significant:
1. The United Kingdom’s trade continues to focus very heavily on the EU: More than
50% of its exports go to the EU, and more than 50% of imports come from other EU
nations. In the mid-1960s, these percentages were significantly less than 40%.
2. More than half of the foreign direct investments in the UK come from the EU. This
percentage has remained relatively stable in recent years. However, the absolute
investment volumes have more than tripled since the beginning of the millennium.
3. A little over 2 million citizens from other EU member states live in the United
Kingdom. Just over 1 million of those come from the new member states, primarily
Poland, but Ireland and Italy as well. Around 1 million UK citizens live in other EU
countries, predominantly in Spain, France and Ireland.
Even though predictions are impossible, we can at least say something about the structure
of expected effects arising from a Brexit and their magnitude. This study aims to quantify
3 EU Treaty, Art. 50(1) “Any Member State may decide to withdraw from the Union in accordance with its
own constitutional requirements.”
7
the economic costs of a Brexit primarily using scenario calculations – thought
experiments on the computer that simulate the effects under different conditions to gain
new insights. The most important of these are:
1. The costs of the Brexit for the United Kingdom range between 0.6 and 3% of the per
capita income (GDP per capita) in the base year in static models – depending on
whether the Brexit takes place as a “soft exit,” or (less likely) an “isolation of the
UK.” If dynamic effects that illustrate the impact of economic integration on
investment and innovation behavior are taken into account, the costs increase to
between 2 and 14%.
2. For the United Kingdom, leaving the EU would yield a potential fiscal saving of 0.5%
of the GDP at most. As such, the static models make clear that a Brexit on balance
would not yield a profit for the UK and that the net cost – depending on the scenario
– could be drastically high.
3. The economic uncertainty that a Brexit would unleash for the UK and other EU
member states is huge, certainly for the first few years after the decision is made. The
broad spectrum of predictions demonstrates this uncertainty. The resulting indirect
costs for economic momentum are scarcely quantifiable, but they could be
significantly higher than the direct costs of increasingly difficult market access.
4. A Brexit would entail very high costs for some of the remaining EU member
states: On one hand, the UK’s eliminated net contribution for financing the EU would
need to be compensated for. On the other, access to markets in the United Kingdom
would also worsen for companies in the EU. However, these costs would differ widely
depending on the countries’ intensity of economic relations with the UK. The biggest
losers – after the United Kingdom – would be Ireland, Malta and Luxembourg,
which maintain strong economic relationships with the island kingdom’s finance
sector. These countries would have to accept heavy losses similar in magnitude to
those in the UK. According to the results of static model simulations, Germany’s
losses would be relatively moderate (0.1 to 0.3%), but could be much higher in
dynamic models (0.6 to 3.0%). Germany would need to transfer an additional €2.5
billion to Brussels to compensate for loss of the UK’s financial contribution to the EU
budget if the contribution mechanism is not changed.
5. Findings in academic literature show that the United Kingdom has enjoyed both fiscal
and labor market benefits from the immigration of EU citizens. If half of the EU
immigrants would return to their home countries, the Britons could expect a lower per
capita income of between 2 and 5% long term. The effects on innovation and
investment dynamics are also key.
8
6. At a sectoral level, a Brexit would most heavily impact the UK’s mechanical
engineering, automotive and chemicals industries. The EU’s MFN import tariffs are
relatively high in these areas. However, the finance industry could be the biggest
loser. Conversely, this industry would benefit in countries like Germany, France and
Luxembourg. On the continent, losses would be concentrated in the automotive, food
and paper industries.
7. Since a Brexit would also have a negative impact on the remaining EU member states
without timely and generous negotiations on new terms of cooperation, they have a
strong incentive to quickly negotiate follow-up agreements with the United
Kingdom, which in turn could limit the costs for the UK.
9
2. Historical summary: From Winston Churchill’s “United
States of Europe” in 1946 to Nigel Farage’s UKIP today
The United Kingdom’s relationship to the European unification process has been marked
by pro- and anti-European phases right from the start.4 After all, it was Winston Churchill
who promoted the United States of Europe in his Zurich speech in 1946 (although it is
unclear to this day whether he saw the UK as part of Europe or not).5 In 1948, the United
Kingdom signed a defense pledge, the Treaty of Brussels (also called the Brussels Pact),
with France and the Benelux countries. But the UK did not join in a short time later when
France, Italy, Germany and the Benelux countries founded the European Coal and Steel
Community (ECSC) in 1951. At that time, London considered closer ties with the
continent contradictory to the Commonwealth’s pursuit of its own economic and political
objectives.6 For that reason, then-Prime Minister Clement Attlee (Labour) rejected the
invitation. Then sentiment began to slowly shift back again because the United Kingdom
was steadily losing economic ground to the fast-growing economies of Germany and
France. Clearly the unification process on the continent had promoted a significant
rebound in the core heavy industries of that time.
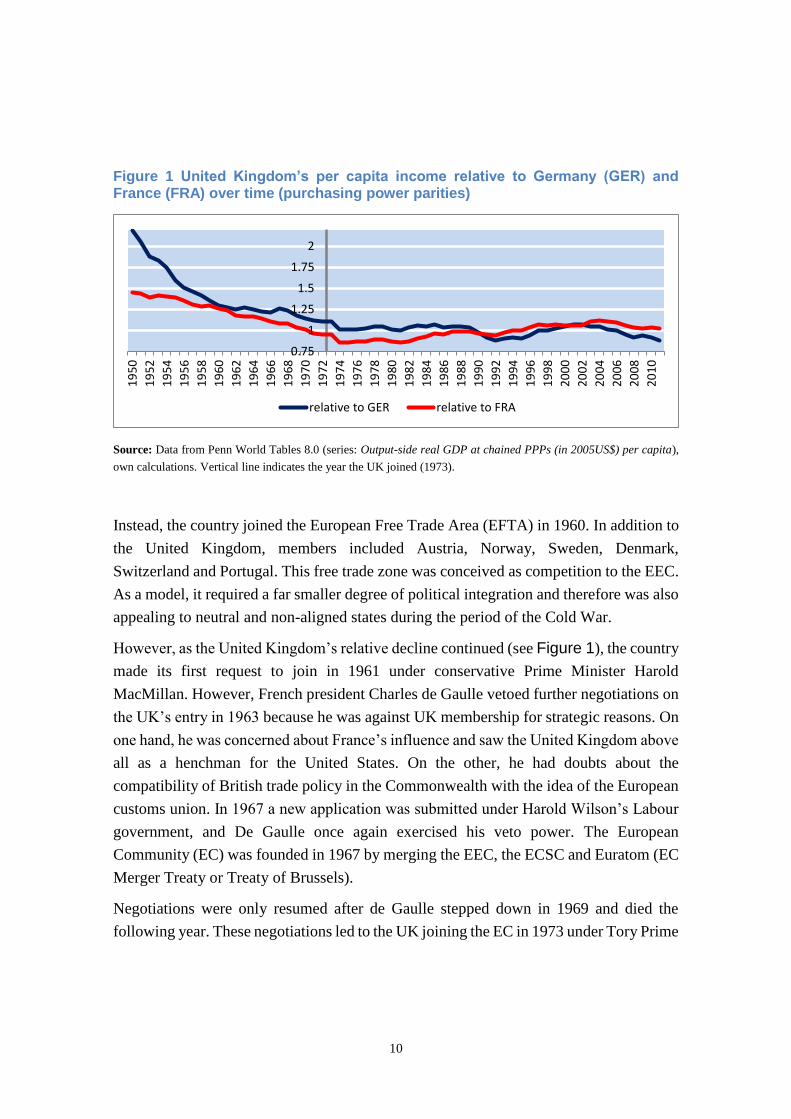
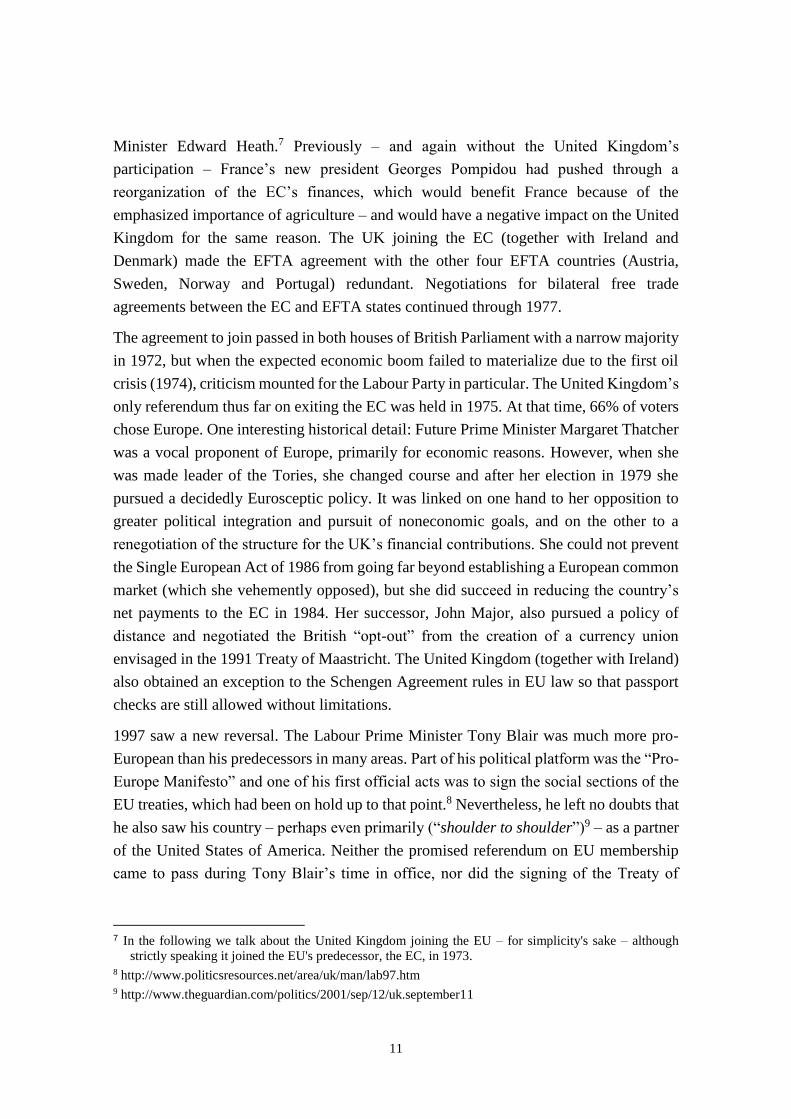
At the beginning of the 1950s, Britain’s per capita income was more than double that of
Germany’s. But by 1957, it was less than 1 ½ times as high (see Figure 1). The trend
relative to France (and Italy, not shown here) is similar, if not as dramatic. Nevertheless,
the United Kingdom was once again absent when the Treaty of Rome was signed. The
European Atomic Energy Community (EURATOM) and the European Economic
Community (EEC) were founded around the same time as the ECSC. The EEC plan
included establishing a European customs union, meaning (i) the elimination of all tariffs
between member states, and (ii) the creation of institutions for setting common and
uniform external tariffs. In contrast to a free trade zone, a customs union also requires a
certain level of political integration because members cannot have their own tariffs
against third-party nations. Sapir (2011) speaks of a “huge political step” in this context.
This was too ambitious for the Tory government led by Anthony Eden.
4 Perisic (2010) and Campus & Coricelli (2015) offer good overview articles. 5 See http://europa.eu/about-eu/eu-history/founding-fathers/pdf/winston_churchill_en.pdf. For an
interpretation, see the relevant commentary from Viviane Reding
http://www.theguardian.com/world/2014/feb/17/eurozone-countries-united-states-europe-viviane-
reding 6 In a 1961 debate in the House of Commons, Labour MP Harold Wilson made the famous statement: “If
there has to be a choice, we are not entitled to sell our friends and kinsmen down the river for a
problematical and marginal advantage in selling washing machines in Dusseldorf.” (Gowland and
Turner, 1999).
10
Figure 1 United Kingdom’s per capita income relative to Germany (GER) and France (FRA) over time (purchasing power parities)
Source: Data from Penn World Tables 8.0 (series: Output-side real GDP at chained PPPs (in 2005US$) per capita),
own calculations. Vertical line indicates the year the UK joined (1973).
Instead, the country joined the European Free Trade Area (EFTA) in 1960. In addition to
the United Kingdom, members included Austria, Norway, Sweden, Denmark,
Switzerland and Portugal. This free trade zone was conceived as competition to the EEC.
As a model, it required a far smaller degree of political integration and therefore was also
appealing to neutral and non-aligned states during the period of the Cold War.
However, as the United Kingdom’s relative decline continued (see Figure 1), the country
made its first request to join in 1961 under conservative Prime Minister Harold
MacMillan. However, French president Charles de Gaulle vetoed further negotiations on
the UK’s entry in 1963 because he was against UK membership for strategic reasons. On
one hand, he was concerned about France’s influence and saw the United Kingdom above
all as a henchman for the United States. On the other, he had doubts about the
compatibility of British trade policy in the Commonwealth with the idea of the European
customs union. In 1967 a new application was submitted under Harold Wilson’s Labour
government, and De Gaulle once again exercised his veto power. The European
Community (EC) was founded in 1967 by merging the EEC, the ECSC and Euratom (EC
Merger Treaty or Treaty of Brussels).
Negotiations were only resumed after de Gaulle stepped down in 1969 and died the
following year. These negotiations led to the UK joining the EC in 1973 under Tory Prime
0.75
1
1.25
1.5
1.75
2
19
50
19
52
19
54
19
56
19
58
19
60
19
62
19
64
19
66
19
68
19
70
19
72
19
74
19
76
19
78
19
80
19
82
19
84
19
86
19
88
19
90
19
92
19
94
19
96
19
98
20
00
20
02
20
04
20
06
20
08
20
10
relative to GER relative to FRA
11
Minister Edward Heath.7 Previously – and again without the United Kingdom’s
participation – France’s new president Georges Pompidou had pushed through a
reorganization of the EC’s finances, which would benefit France because of the
emphasized importance of agriculture – and would have a negative impact on the United
Kingdom for the same reason. The UK joining the EC (together with Ireland and
Denmark) made the EFTA agreement with the other four EFTA countries (Austria,
Sweden, Norway and Portugal) redundant. Negotiations for bilateral free trade
agreements between the EC and EFTA states continued through 1977.
The agreement to join passed in both houses of British Parliament with a narrow majority
in 1972, but when the expected economic boom failed to materialize due to the first oil
crisis (1974), criticism mounted for the Labour Party in particular. The United Kingdom’s
only referendum thus far on exiting the EC was held in 1975. At that time, 66% of voters
chose Europe. One interesting historical detail: Future Prime Minister Margaret Thatcher
was a vocal proponent of Europe, primarily for economic reasons. However, when she
was made leader of the Tories, she changed course and after her election in 1979 she
pursued a decidedly Eurosceptic policy. It was linked on one hand to her opposition to
greater political integration and pursuit of noneconomic goals, and on the other to a
renegotiation of the structure for the UK’s financial contributions. She could not prevent
the Single European Act of 1986 from going far beyond establishing a European common
market (which she vehemently opposed), but she did succeed in reducing the country’s
net payments to the EC in 1984. Her successor, John Major, also pursued a policy of
distance and negotiated the British “opt-out” from the creation of a currency union
envisaged in the 1991 Treaty of Maastricht. The United Kingdom (together with Ireland)
also obtained an exception to the Schengen Agreement rules in EU law so that passport
checks are still allowed without limitations.
1997 saw a new reversal. The Labour Prime Minister Tony Blair was much more pro-
European than his predecessors in many areas. Part of his political platform was the “Pro-
Europe Manifesto” and one of his first official acts was to sign the social sections of the
EU treaties, which had been on hold up to that point.8 Nevertheless, he left no doubts that
he also saw his country – perhaps even primarily (“shoulder to shoulder”)9 – as a partner
of the United States of America. Neither the promised referendum on EU membership
came to pass during Tony Blair’s time in office, nor did the signing of the Treaty of
7 In the following we talk about the United Kingdom joining the EU – for simplicity's sake – although
strictly speaking it joined the EU's predecessor, the EC, in 1973. 8 http://www.politicsresources.net/area/uk/man/lab97.htm 9 http://www.theguardian.com/politics/2001/sep/12/uk.september11
12
Lisbon, which would adopt substantial portions of the EU Constitution that were so
heavily debated in the United Kingdom.
Nothing has changed in the ambivalent relationship between the island and the continent
since that time. Both Tory and Labour governments see economic advantages in the EU,
but are skeptical of deeper political integration with Europe. The accents of the debate
vary over time and between the parties. Immigration of workers from the EU is discussed
more in difficult economic times, while the most important topic in times of relative
prosperity is Brussels’ regulation mania that puts the brakes on economic growth. But the
issue is always raised of whether the EU does not excessively limit the island nation’s
sovereignty and whether it is in conflict with the fundamental principle of the UK’s
(unwritten) constitution in which the British Parliament cannot be subordinate to any
lawmaking power.
However, the rapid rise of the extremely euro-critical United Kingdom Independence
Party (UKIP) is relatively new. This party was founded in 1993 by opponents of the
Treaty of Maastricht and showed its first sign of life in 1999 when the party won 7% of
votes in the EU parliamentary elections (three seats). The euro sceptics won 12 seats in
2004. In 2006, Nigel Farage was chosen as head of the party, and he has held this position
since that time with one brief interruption. In the 2009 EU elections, the UKIP took
second place among the British parties, winning 13 seats (16.5% of votes). Five years
later the UKIP was the most successful British party in the 2014 EU elections and won
24 seats (27.5% of votes). It won 3.1% of votes in the 2010 House of Commons election,
but was not initially represented there due to the “first past the post” voting process.
However, by winning two by-elections it had already seated two representatives out of
the 650 total. After the 2015 elections UKIP could only manage to secure one seat in the
House of Commons, while David Cameron’s conservative party, against most expert’s
prediction, managed to achieve an absolute majority with 330 seats.
13
3. The United Kingdom’s economic relationships with the EU
over time
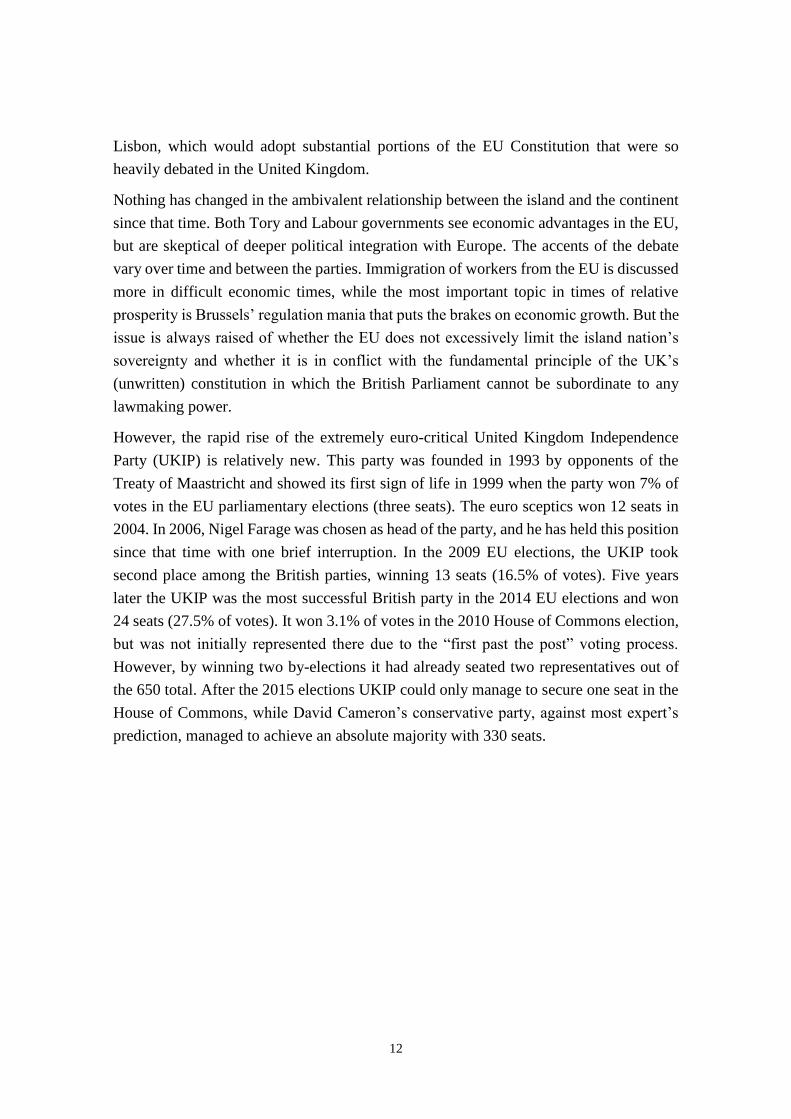
Economic growth in the United Kingdom was similar to Germany and the EU countries
in the 1970s and 1980s (Figure 2). The decades were marked by two oil crises and
subsequent economic surges. In the 1990s and early 2000s, the UK achieved higher
growth rates (between 2 and 4%) than both Germany as well as the average of all EU
countries. The financial crisis from 2007 to 2009 hit all European countries hard and led
to a substantial slump in economic performance. The United Kingdom saw a 6% decline
in the GDP per capita. Germany was similarly impacted and had a growth rate of -5% in
2009. There was a slight recovery between 2010 and 2013 with growth rates between zero
and 1%. Germany was able to recover quickly from the crisis in 2010; the UK’s upturn
was not as strong.
Figure 2 Economic trends in the UK, Germany and EU, 1960-2013 (growth rates of the GDP per capita in %)
Source: Data from the World Bank’s World Development Indicators 2014. Own representation.
14
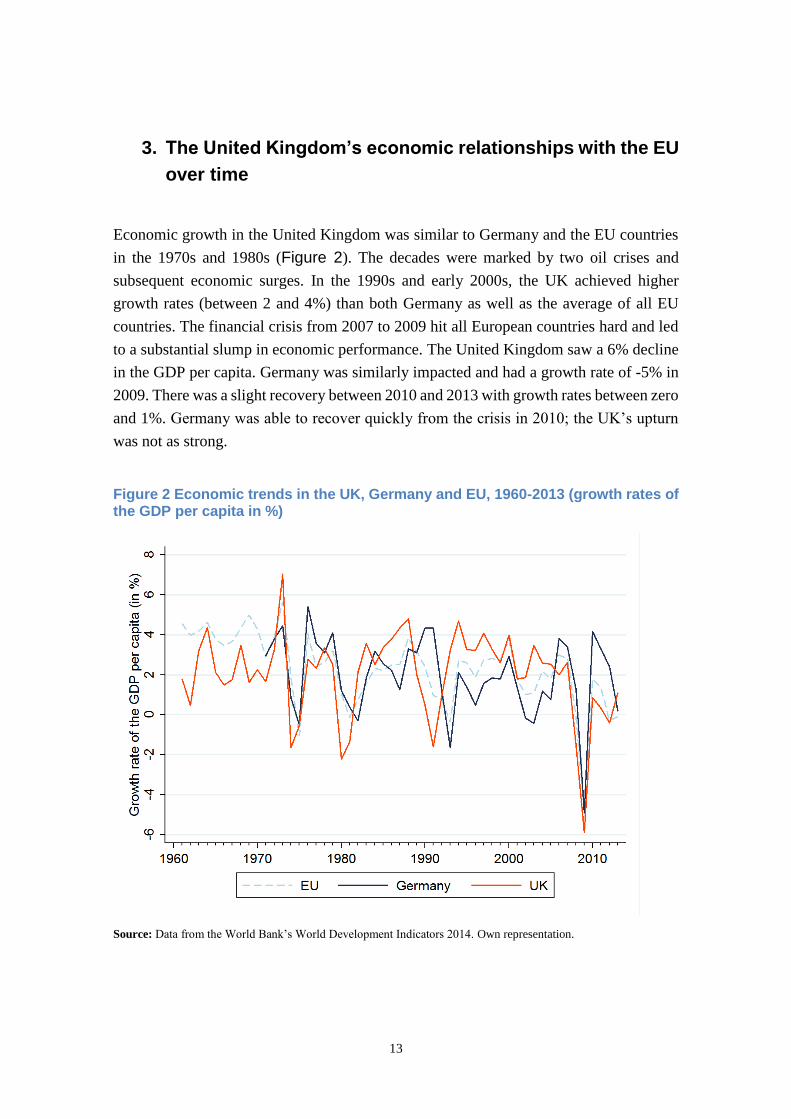
Figure 3 Economic trends in Germany and the UK, Q1 2010-Q4 2014 (growth rates of the nominal GDP)
Source: Data from EZB, Quarterly GDP data, seasonally and working day adjusted. Own representation.
The most current data shows that the growth dynamic in the United Kingdom has been
stronger than in Germany in most quarters since mid-2012 (see Figure 3) and significantly
above the euro zone average (not shown in the figure).
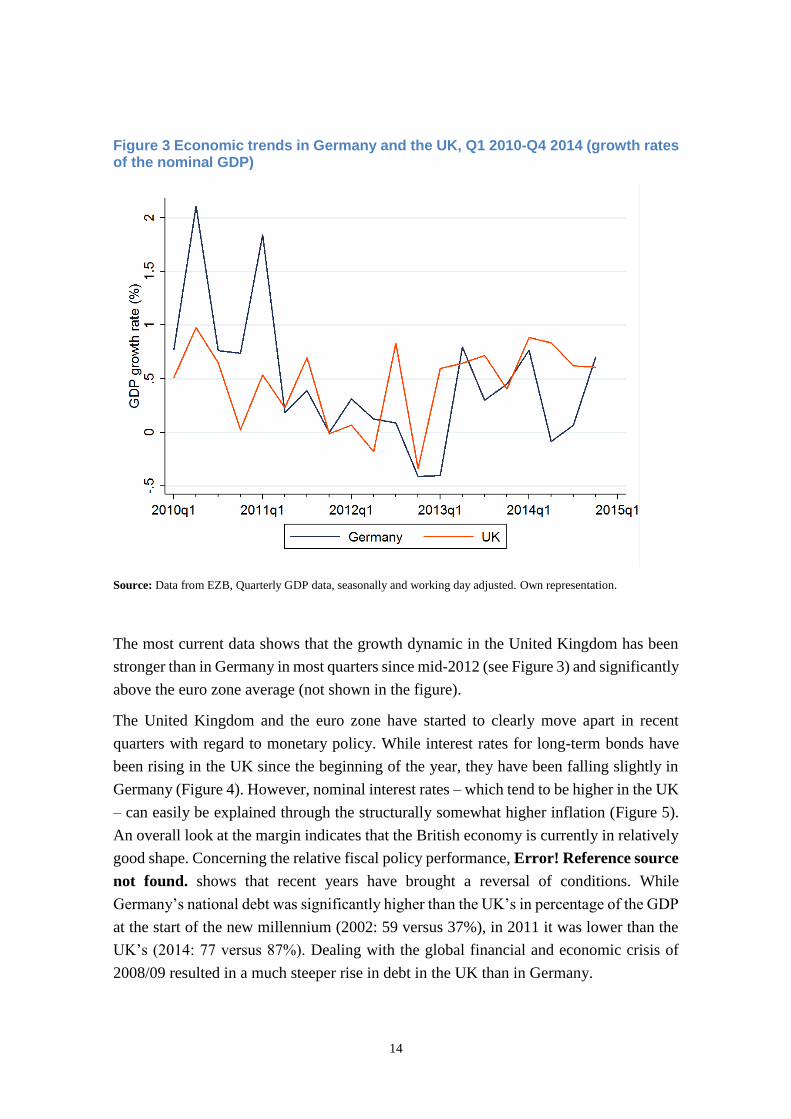
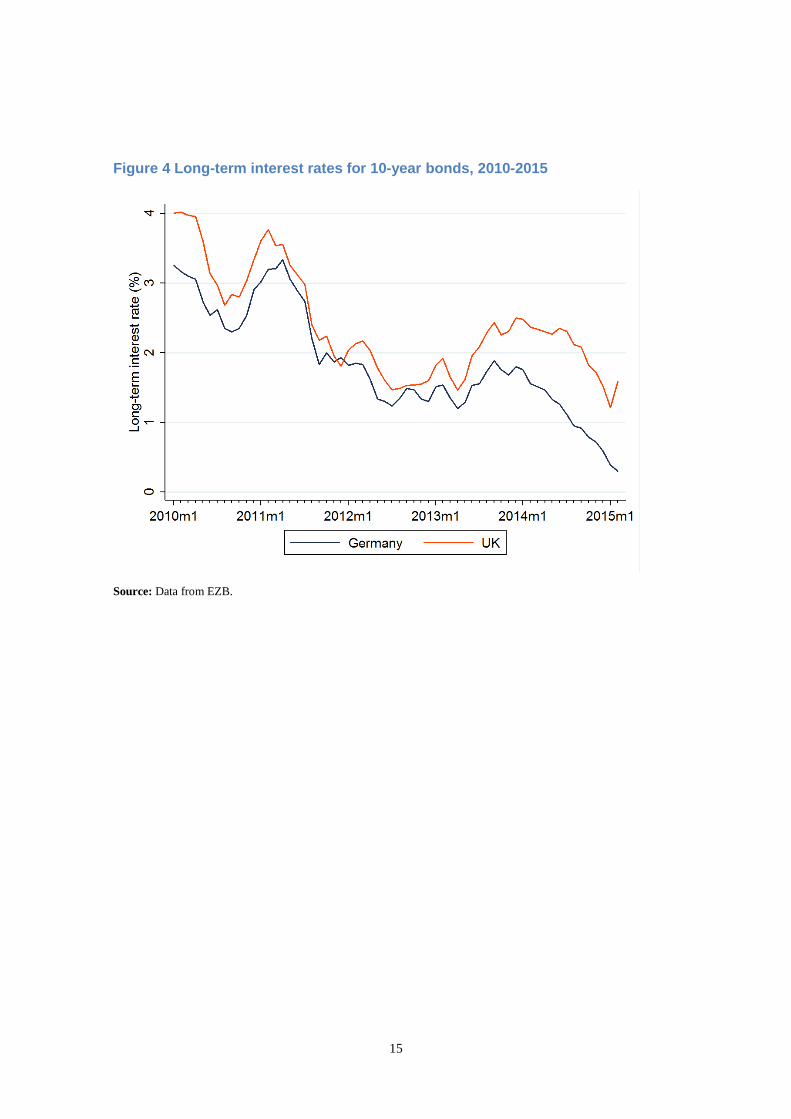
The United Kingdom and the euro zone have started to clearly move apart in recent
quarters with regard to monetary policy. While interest rates for long-term bonds have
been rising in the UK since the beginning of the year, they have been falling slightly in
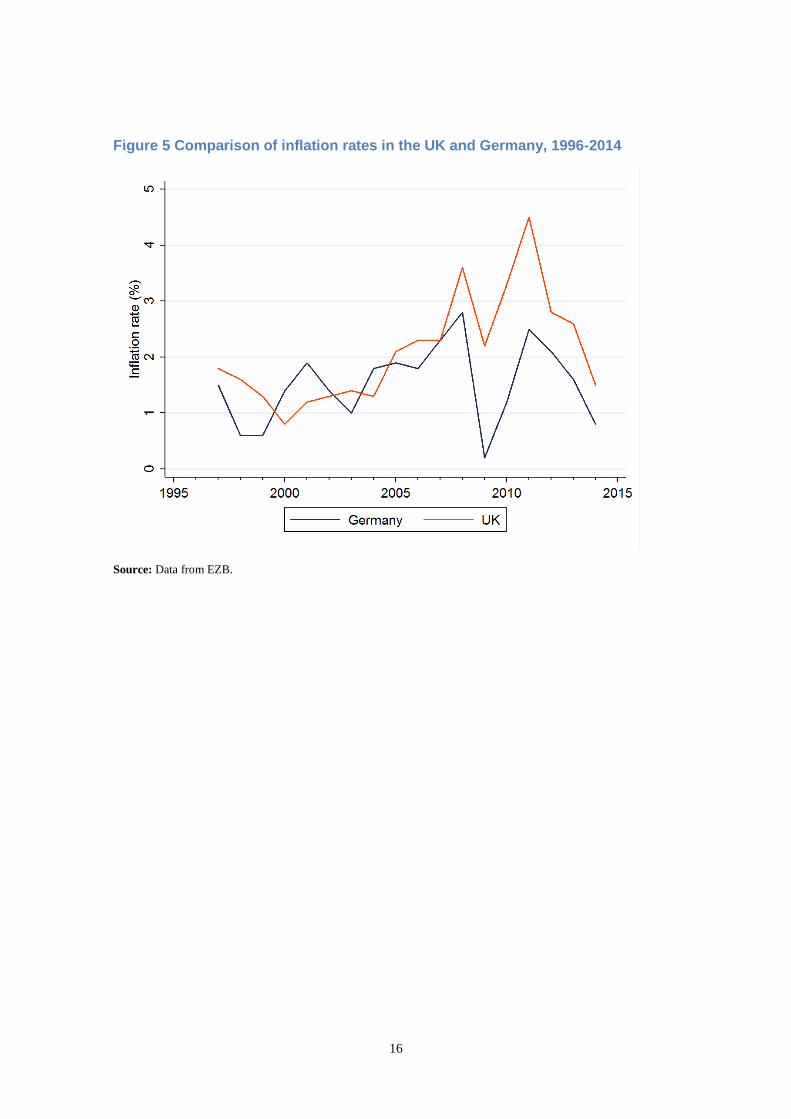
Germany (Figure 4). However, nominal interest rates – which tend to be higher in the UK
– can easily be explained through the structurally somewhat higher inflation (Figure 5).
An overall look at the margin indicates that the British economy is currently in relatively
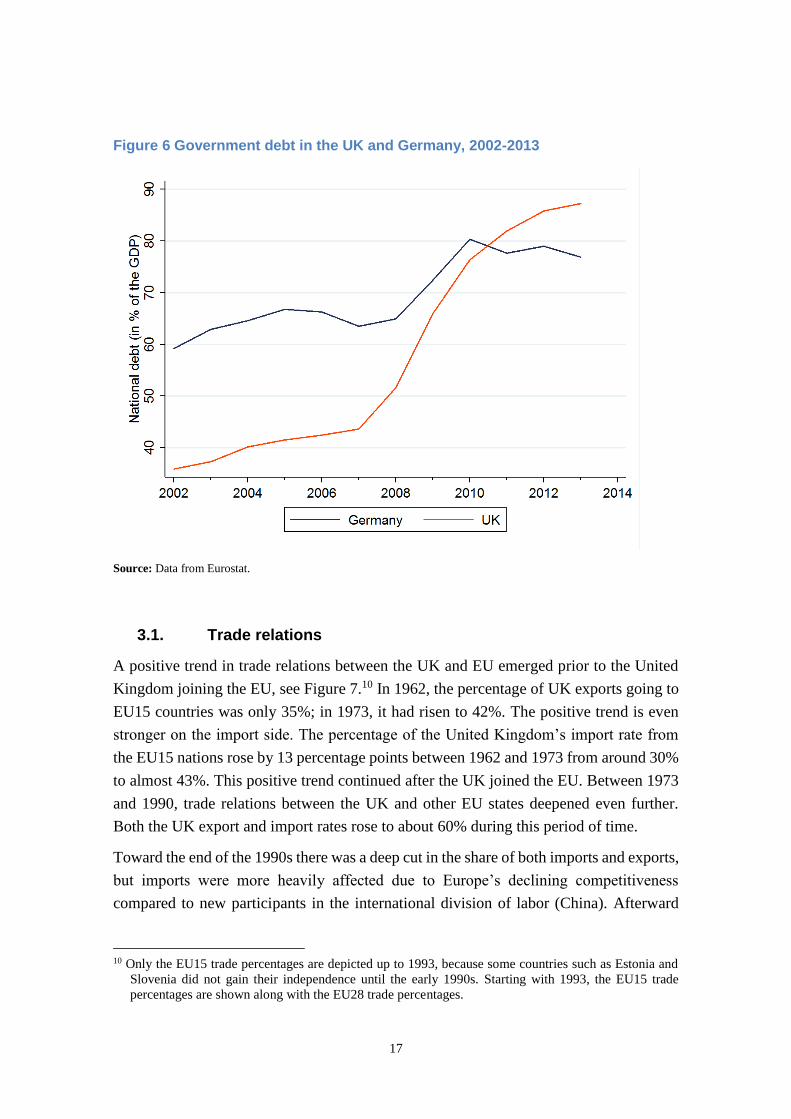
good shape. Concerning the relative fiscal policy performance, Error! Reference source
not found. shows that recent years have brought a reversal of conditions. While
Germany’s national debt was significantly higher than the UK’s in percentage of the GDP
at the start of the new millennium (2002: 59 versus 37%), in 2011 it was lower than the
UK’s (2014: 77 versus 87%). Dealing with the global financial and economic crisis of
2008/09 resulted in a much steeper rise in debt in the UK than in Germany.
15
Figure 4 Long-term interest rates for 10-year bonds, 2010-2015
Source: Data from EZB.
16
Figure 5 Comparison of inflation rates in the UK and Germany, 1996-2014
Source: Data from EZB.
17
Figure 6 Government debt in the UK and Germany, 2002-2013
Source: Data from Eurostat.
3.1. Trade relations
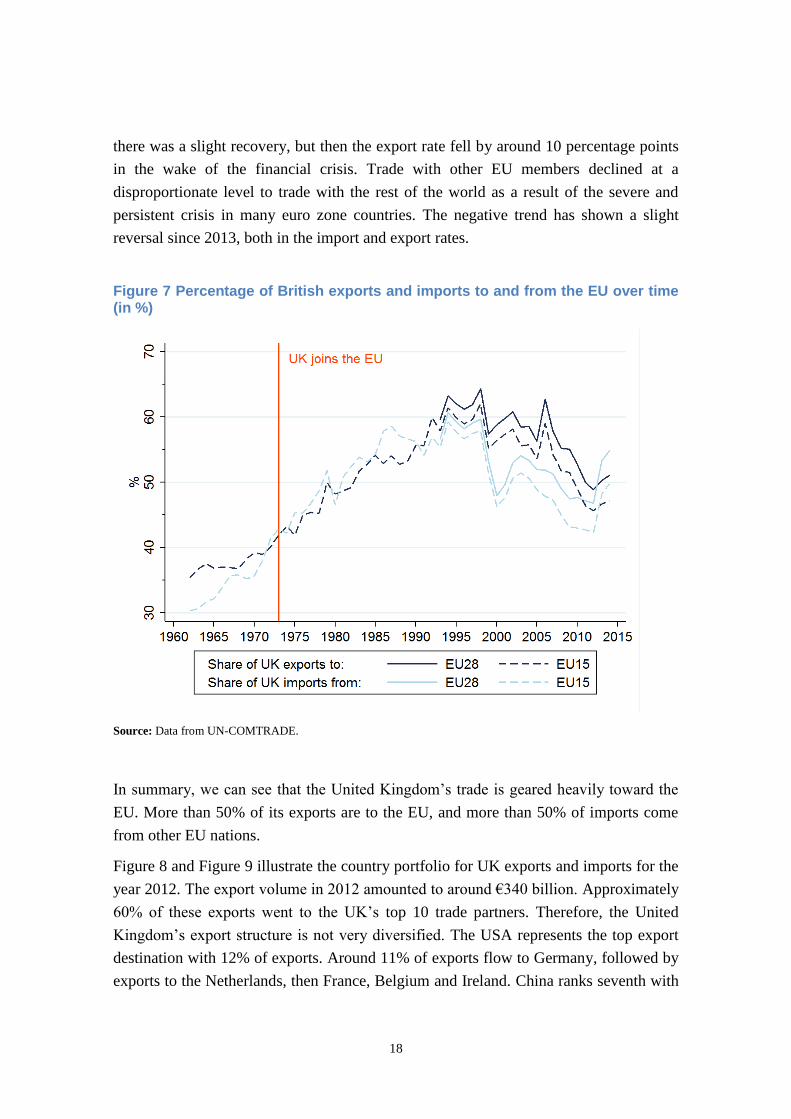
A positive trend in trade relations between the UK and EU emerged prior to the United
Kingdom joining the EU, see Figure 7.10 In 1962, the percentage of UK exports going to
EU15 countries was only 35%; in 1973, it had risen to 42%. The positive trend is even
stronger on the import side. The percentage of the United Kingdom’s import rate from
the EU15 nations rose by 13 percentage points between 1962 and 1973 from around 30%
to almost 43%. This positive trend continued after the UK joined the EU. Between 1973
and 1990, trade relations between the UK and other EU states deepened even further.
Both the UK export and import rates rose to about 60% during this period of time.
Toward the end of the 1990s there was a deep cut in the share of both imports and exports,
but imports were more heavily affected due to Europe’s declining competitiveness
compared to new participants in the international division of labor (China). Afterward
10 Only the EU15 trade percentages are depicted up to 1993, because some countries such as Estonia and
Slovenia did not gain their independence until the early 1990s. Starting with 1993, the EU15 trade
percentages are shown along with the EU28 trade percentages.
18
there was a slight recovery, but then the export rate fell by around 10 percentage points
in the wake of the financial crisis. Trade with other EU members declined at a
disproportionate level to trade with the rest of the world as a result of the severe and
persistent crisis in many euro zone countries. The negative trend has shown a slight
reversal since 2013, both in the import and export rates.
Figure 7 Percentage of British exports and imports to and from the EU over time (in %)
Source: Data from UN-COMTRADE.
In summary, we can see that the United Kingdom’s trade is geared heavily toward the
EU. More than 50% of its exports are to the EU, and more than 50% of imports come
from other EU nations.
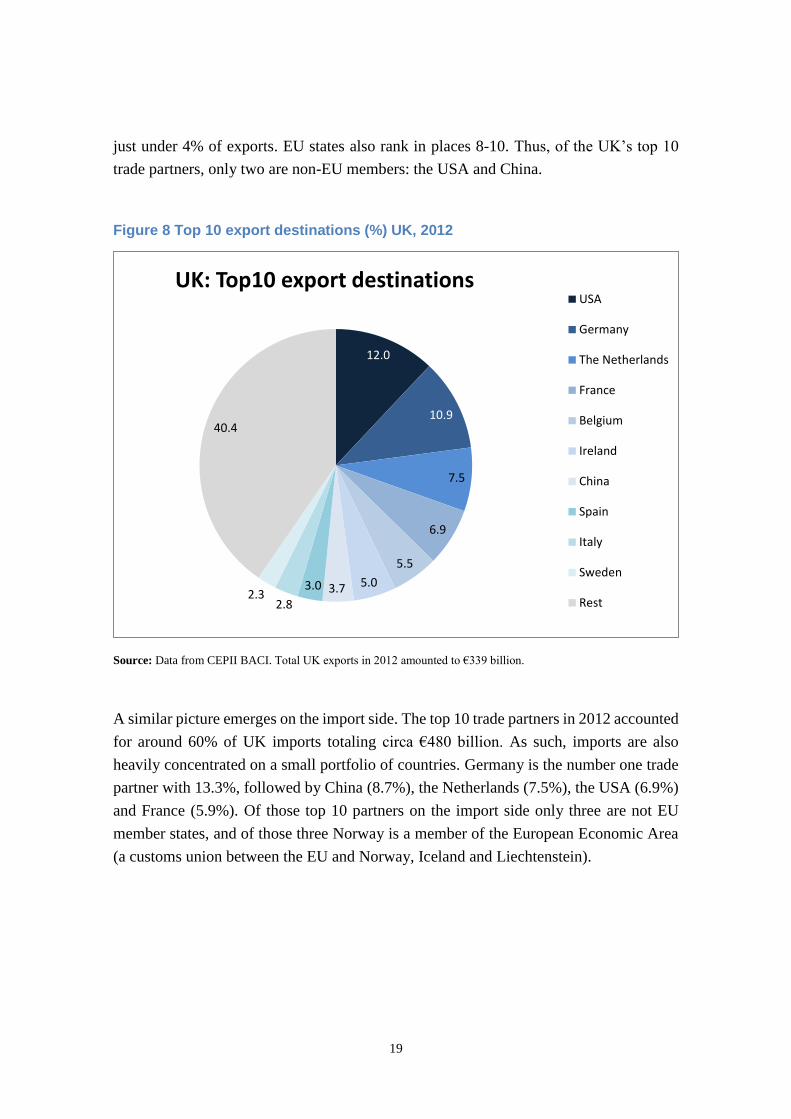
Figure 8 and Figure 9 illustrate the country portfolio for UK exports and imports for the
year 2012. The export volume in 2012 amounted to around €340 billion. Approximately
60% of these exports went to the UK’s top 10 trade partners. Therefore, the United
Kingdom’s export structure is not very diversified. The USA represents the top export
destination with 12% of exports. Around 11% of exports flow to Germany, followed by
exports to the Netherlands, then France, Belgium and Ireland. China ranks seventh with
19
just under 4% of exports. EU states also rank in places 8-10. Thus, of the UK’s top 10
trade partners, only two are non-EU members: the USA and China.
Figure 8 Top 10 export destinations (%) UK, 2012
Source: Data from CEPII BACI. Total UK exports in 2012 amounted to €339 billion.
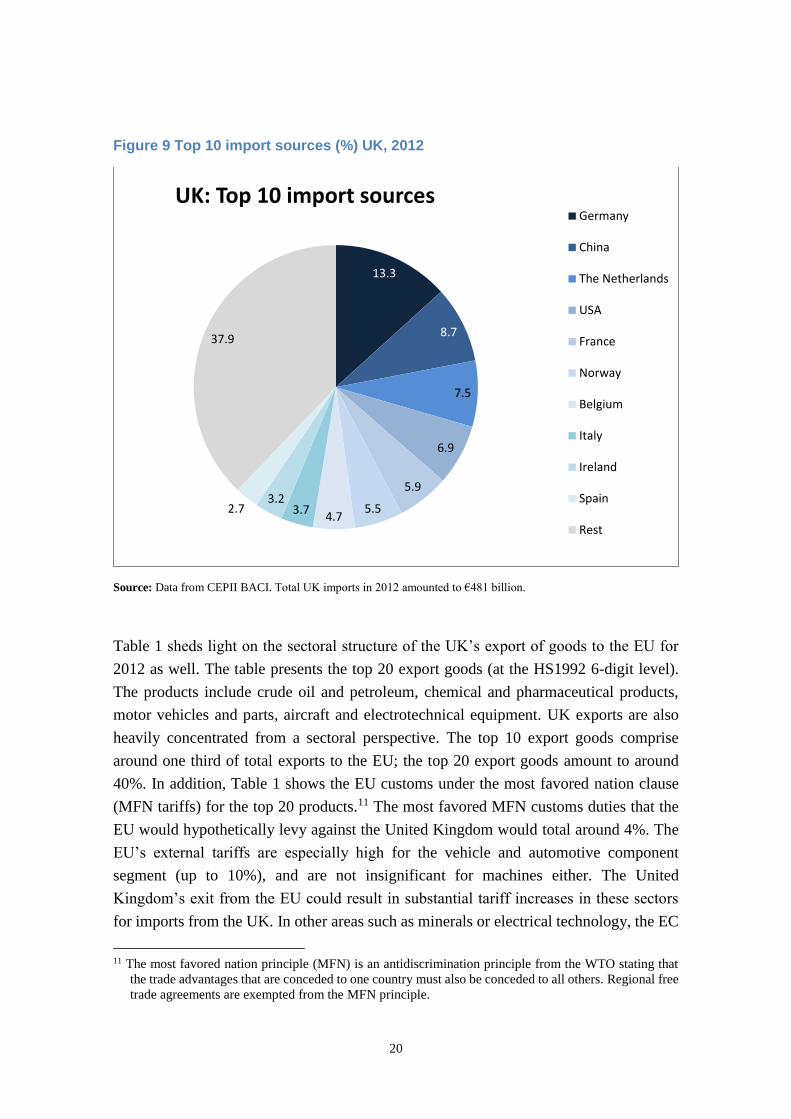
A similar picture emerges on the import side. The top 10 trade partners in 2012 accounted
for around 60% of UK imports totaling circa €480 billion. As such, imports are also
heavily concentrated on a small portfolio of countries. Germany is the number one trade
partner with 13.3%, followed by China (8.7%), the Netherlands (7.5%), the USA (6.9%)
and France (5.9%). Of those top 10 partners on the import side only three are not EU
member states, and of those three Norway is a member of the European Economic Area
(a customs union between the EU and Norway, Iceland and Liechtenstein).
12.0
10.9
7.5
6.9
5.5
5.03.73.0
2.82.3
40.4
UK: Top10 export destinationsUSA
Germany
The Netherlands
France
Belgium
Ireland
China
Spain
Italy
Sweden
Rest
20
Figure 9 Top 10 import sources (%) UK, 2012
Source: Data from CEPII BACI. Total UK imports in 2012 amounted to €481 billion.
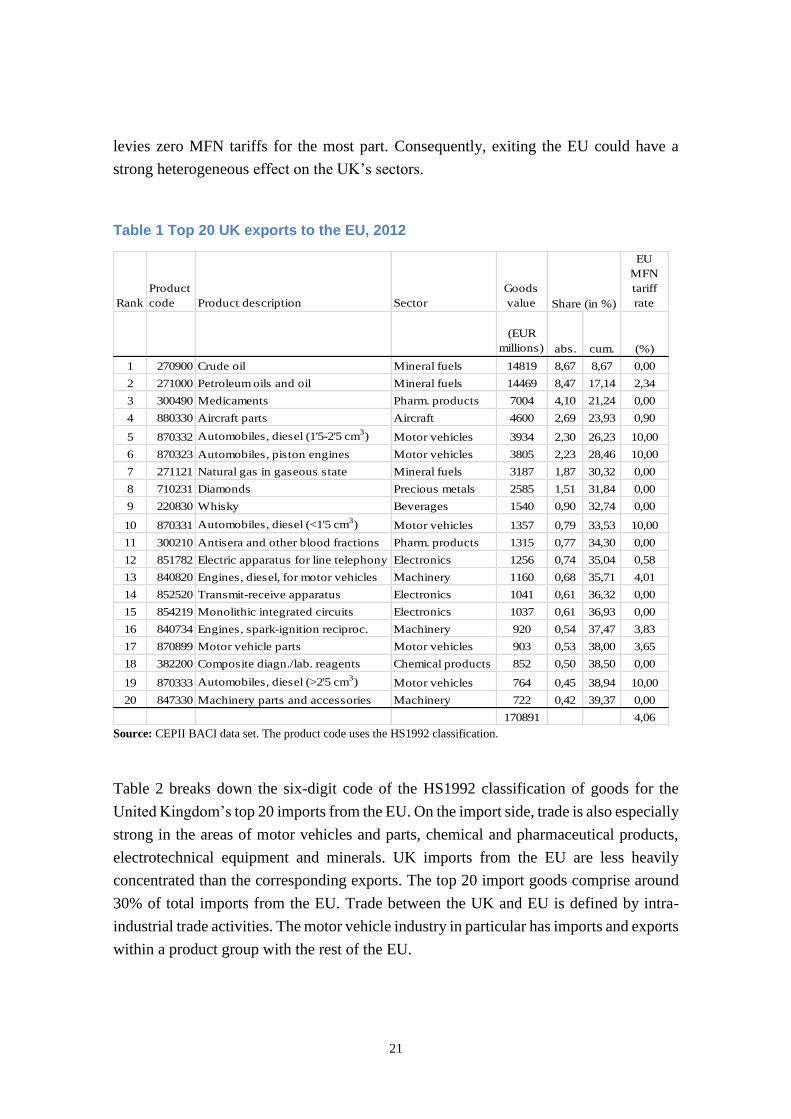
Table 1 sheds light on the sectoral structure of the UK’s export of goods to the EU for
2012 as well. The table presents the top 20 export goods (at the HS1992 6-digit level).
The products include crude oil and petroleum, chemical and pharmaceutical products,
motor vehicles and parts, aircraft and electrotechnical equipment. UK exports are also
heavily concentrated from a sectoral perspective. The top 10 export goods comprise
around one third of total exports to the EU; the top 20 export goods amount to around
40%. In addition, Table 1 shows the EU customs under the most favored nation clause
(MFN tariffs) for the top 20 products.11 The most favored MFN customs duties that the
EU would hypothetically levy against the United Kingdom would total around 4%. The
EU’s external tariffs are especially high for the vehicle and automotive component
segment (up to 10%), and are not insignificant for machines either. The United
Kingdom’s exit from the EU could result in substantial tariff increases in these sectors
for imports from the UK. In other areas such as minerals or electrical technology, the EC
11 The most favored nation principle (MFN) is an antidiscrimination principle from the WTO stating that
the trade advantages that are conceded to one country must also be conceded to all others. Regional free
trade agreements are exempted from the MFN principle.
13.3
8.7
7.5
6.9
5.9
5.54.7
3.73.2
2.7
37.9
UK: Top 10 import sourcesGermany
China
The Netherlands
USA
France
Norway
Belgium
Italy
Ireland
Spain
Rest
21
levies zero MFN tariffs for the most part. Consequently, exiting the EU could have a
strong heterogeneous effect on the UK’s sectors.
Table 1 Top 20 UK exports to the EU, 2012
Source: CEPII BACI data set. The product code uses the HS1992 classification.
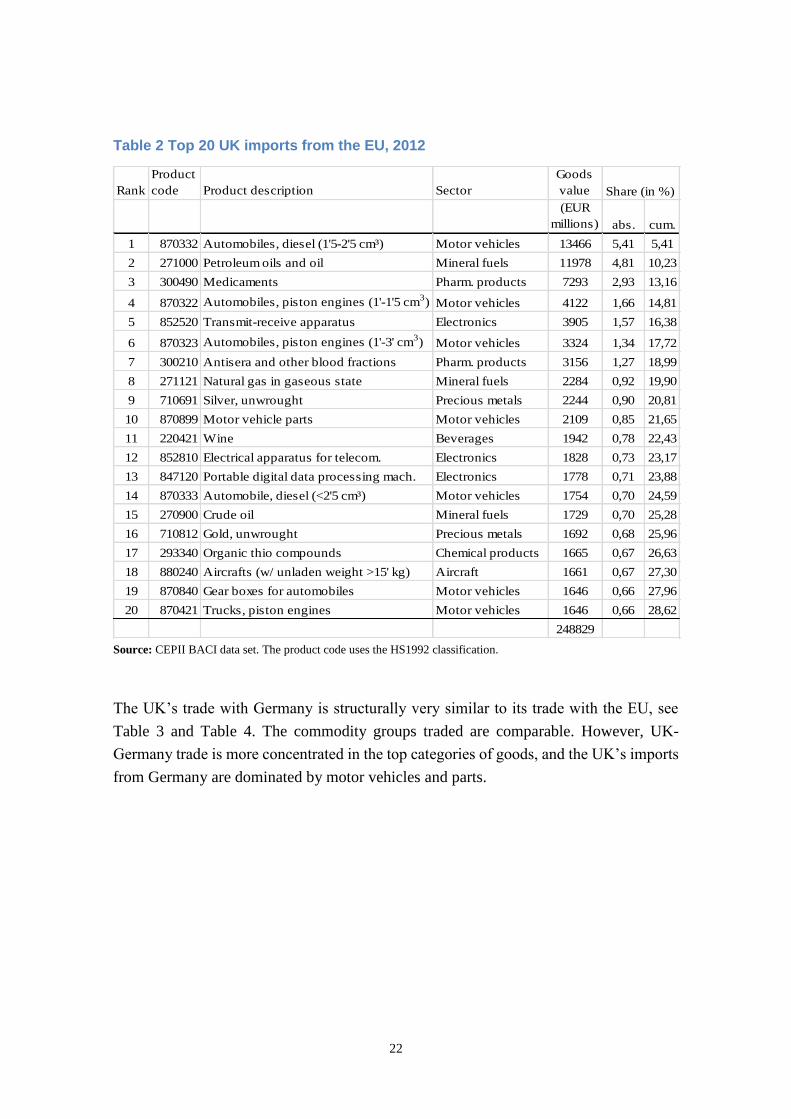
Table 2 breaks down the six-digit code of the HS1992 classification of goods for the
United Kingdom’s top 20 imports from the EU. On the import side, trade is also especially
strong in the areas of motor vehicles and parts, chemical and pharmaceutical products,
electrotechnical equipment and minerals. UK imports from the EU are less heavily
concentrated than the corresponding exports. The top 20 import goods comprise around
30% of total imports from the EU. Trade between the UK and EU is defined by intra-
industrial trade activities. The motor vehicle industry in particular has imports and exports
within a product group with the rest of the EU.
Rank
Product
code Product description Sector
Goods
value
EU
MFN
tariff
rate
(EUR
millions) abs. cum. (%)
1 270900 Crude oil Mineral fuels 14819 8,67 8,67 0,00
2 271000 Petroleum oils and oil Mineral fuels 14469 8,47 17,14 2,34
3 300490 Medicaments Pharm. products 7004 4,10 21,24 0,00
4 880330 Aircraft parts Aircraft 4600 2,69 23,93 0,90
5 870332 Automobiles, diesel (1'5-2'5 cm3) Motor vehicles 3934 2,30 26,23 10,00
6 870323 Automobiles, piston engines Motor vehicles 3805 2,23 28,46 10,00
7 271121 Natural gas in gaseous state Mineral fuels 3187 1,87 30,32 0,00
8 710231 Diamonds Precious metals 2585 1,51 31,84 0,00
9 220830 Whisky Beverages 1540 0,90 32,74 0,00
10 870331 Automobiles, diesel (<1'5 cm3) Motor vehicles 1357 0,79 33,53 10,00
11 300210 Antisera and other blood fractions Pharm. products 1315 0,77 34,30 0,00
12 851782 Electric apparatus for line telephony Electronics 1256 0,74 35,04 0,58
13 840820 Engines, diesel, for motor vehicles Machinery 1160 0,68 35,71 4,01
14 852520 Transmit-receive apparatus Electronics 1041 0,61 36,32 0,00
15 854219 Monolithic integrated circuits Electronics 1037 0,61 36,93 0,00
16 840734 Engines, spark-ignition reciproc. Machinery 920 0,54 37,47 3,83
17 870899 Motor vehicle parts Motor vehicles 903 0,53 38,00 3,65
18 382200 Composite diagn./lab. reagents Chemical products 852 0,50 38,50 0,00
19 870333 Automobiles, diesel (>2'5 cm3) Motor vehicles 764 0,45 38,94 10,00
20 847330 Machinery parts and accessories Machinery 722 0,42 39,37 0,00
170891 4,06
Share (in %)
22
Table 2 Top 20 UK imports from the EU, 2012
Rank
Product
code Product description Sector
Goods
value
(EUR
millions) abs. cum.
1 870332 Automobiles, diesel (1'5-2'5 cm³) Motor vehicles 13466 5,41 5,41
2 271000 Petroleum oils and oil Mineral fuels 11978 4,81 10,23
3 300490 Medicaments Pharm. products 7293 2,93 13,16
4 870322 Automobiles, piston engines (1'-1'5 cm3) Motor vehicles 4122 1,66 14,81
5 852520 Transmit-receive apparatus Electronics 3905 1,57 16,38
6 870323 Automobiles, piston engines (1'-3' cm3) Motor vehicles 3324 1,34 17,72
7 300210 Antisera and other blood fractions Pharm. products 3156 1,27 18,99
8 271121 Natural gas in gaseous state Mineral fuels 2284 0,92 19,90
9 710691 Silver, unwrought Precious metals 2244 0,90 20,81
10 870899 Motor vehicle parts Motor vehicles 2109 0,85 21,65
11 220421 Wine Beverages 1942 0,78 22,43
12 852810 Electrical apparatus for telecom. Electronics 1828 0,73 23,17
13 847120 Portable digital data processing mach. Electronics 1778 0,71 23,88
14 870333 Automobile, diesel (<2'5 cm³) Motor vehicles 1754 0,70 24,59
15 270900 Crude oil Mineral fuels 1729 0,70 25,28
16 710812 Gold, unwrought Precious metals 1692 0,68 25,96
17 293340 Organic thio compounds Chemical products 1665 0,67 26,63
18 880240 Aircrafts (w/ unladen weight >15' kg) Aircraft 1661 0,67 27,30
19 870840 Gear boxes for automobiles Motor vehicles 1646 0,66 27,96
20 870421 Trucks, piston engines Motor vehicles 1646 0,66 28,62
248829
Share (in %)
Source: CEPII BACI data set. The product code uses the HS1992 classification.
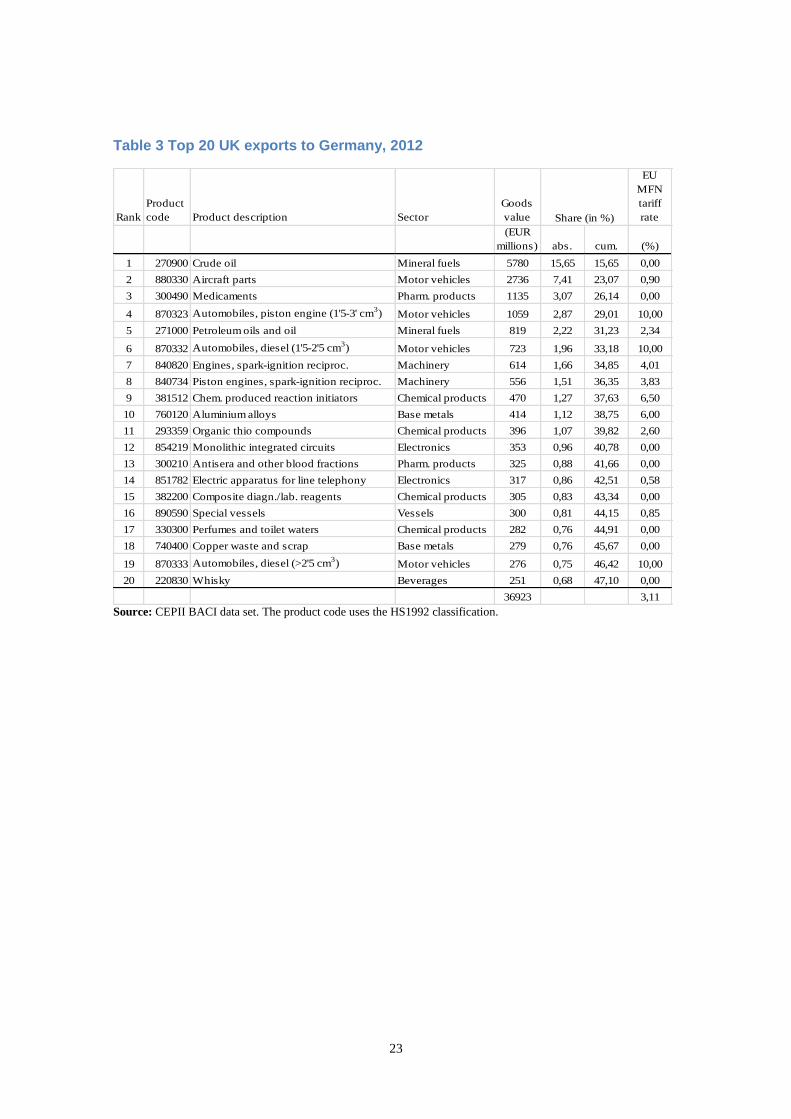
The UK’s trade with Germany is structurally very similar to its trade with the EU, see
Table 3 and Table 4. The commodity groups traded are comparable. However, UK-
Germany trade is more concentrated in the top categories of goods, and the UK’s imports
from Germany are dominated by motor vehicles and parts.
23
Table 3 Top 20 UK exports to Germany, 2012
Rank
Product
code Product description Sector
Goods
value
EU
MFN
tariff
rate
(EUR
millions) abs. cum. (%)
1 270900 Crude oil Mineral fuels 5780 15,65 15,65 0,00
2 880330 Aircraft parts Motor vehicles 2736 7,41 23,07 0,90
3 300490 Medicaments Pharm. products 1135 3,07 26,14 0,00
4 870323 Automobiles, piston engine (1'5-3' cm3) Motor vehicles 1059 2,87 29,01 10,00
5 271000 Petroleum oils and oil Mineral fuels 819 2,22 31,23 2,34
6 870332 Automobiles, diesel (1'5-2'5 cm3) Motor vehicles 723 1,96 33,18 10,00
7 840820 Engines, spark-ignition reciproc. Machinery 614 1,66 34,85 4,01
8 840734 Piston engines, spark-ignition reciproc. Machinery 556 1,51 36,35 3,83
9 381512 Chem. produced reaction initiators Chemical products 470 1,27 37,63 6,50
10 760120 Aluminium alloys Base metals 414 1,12 38,75 6,00
11 293359 Organic thio compounds Chemical products 396 1,07 39,82 2,60
12 854219 Monolithic integrated circuits Electronics 353 0,96 40,78 0,00
13 300210 Antisera and other blood fractions Pharm. products 325 0,88 41,66 0,00
14 851782 Electric apparatus for line telephony Electronics 317 0,86 42,51 0,58
15 382200 Composite diagn./lab. reagents Chemical products 305 0,83 43,34 0,00
16 890590 Special vessels Vessels 300 0,81 44,15 0,85
17 330300 Perfumes and toilet waters Chemical products 282 0,76 44,91 0,00
18 740400 Copper waste and scrap Base metals 279 0,76 45,67 0,00
19 870333 Automobiles, diesel (>2'5 cm3) Motor vehicles 276 0,75 46,42 10,00
20 220830 Whisky Beverages 251 0,68 47,10 0,00
36923 3,11
Share (in %)
Source: CEPII BACI data set. The product code uses the HS1992 classification.
24
Table 4 Top 20 UK imports from Germany, 2012
Rank
Product
code Product description Sector
Goods
value
(EUR
millions) abs. cum.
1 870332 Automobiles, diesel (1'5-2'5 cm3) Motor vehicles 7401 11,59 11,59
2 870322 Automobiles, piston engine (1'-1'5 cm³) Motor vehicles 2014 3,15 14,74
3 870323 Automobiles, piston engine (1'5-3 cm3) Motor vehicles 1895 2,97 17,71
4 300490 Medicaments Pharm. products 1691 2,65 20,36
5 300210 Antisera and other blood fractions Pharm. products 1560 2,44 22,80
6 870333 Automobiles, diesel (>2'5 cm3) Motor vehicles 1339 2,10 24,89
7 710812 Gold, unwrought Precious metals 1231 1,93 26,82
8 710691 Silver, unwrought Precious metals 892 1,40 28,22
9 880240 Aircrafts (w/ unladen weight >15' kg) Aircraft 846 1,33 29,54
10 870899 Motor vehicle parts Motor vehicles 731 1,14 30,69
11 870840 Gear boxes for automobiles Motor vehicles 586 0,92 31,61
12 870829 Other motor vehicles parts Motor vehicles 582 0,91 32,52
13 847120 Portable digital data processing mach. Electronics 580 0,91 33,43
14 271000 Petroleum oils and oil Mineral fuels 551 0,86 34,29
15 870324 Automobiles, piston engine (>3' cm3) Motor vehicles 495 0,78 35,06
16 840991 Parts for spark-ignition piston engines Machinery 454 0,71 35,77
17 844390 Parts of printing machinery Electronics 429 0,67 36,45
18 870421 Trucks, diesel or semi-diesel engine Motor vehicles 387 0,61 37,05
19 760612 Plates and strips of aluminium Base metals 363 0,57 37,62
20 392690 Articles of plastics Plastics 330 0,52 38,14
63868
Share (in %)
Source: CEPII BACI data set. The product code uses the HS1992 classification.
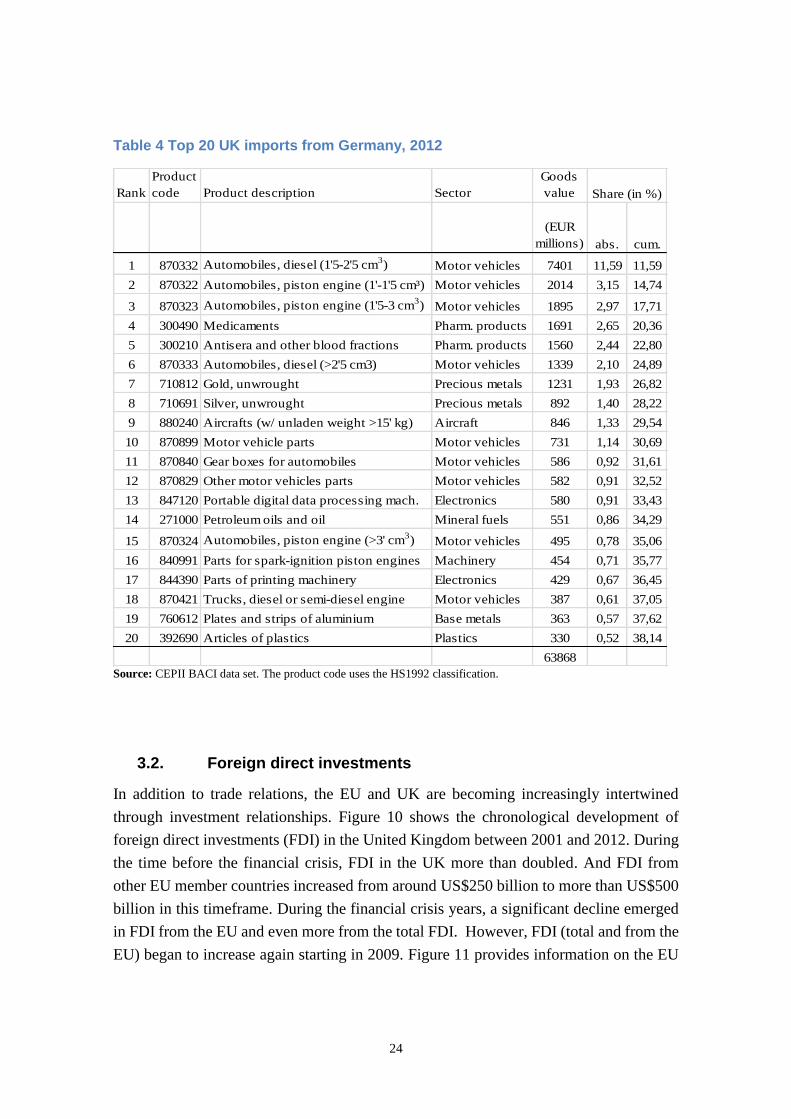
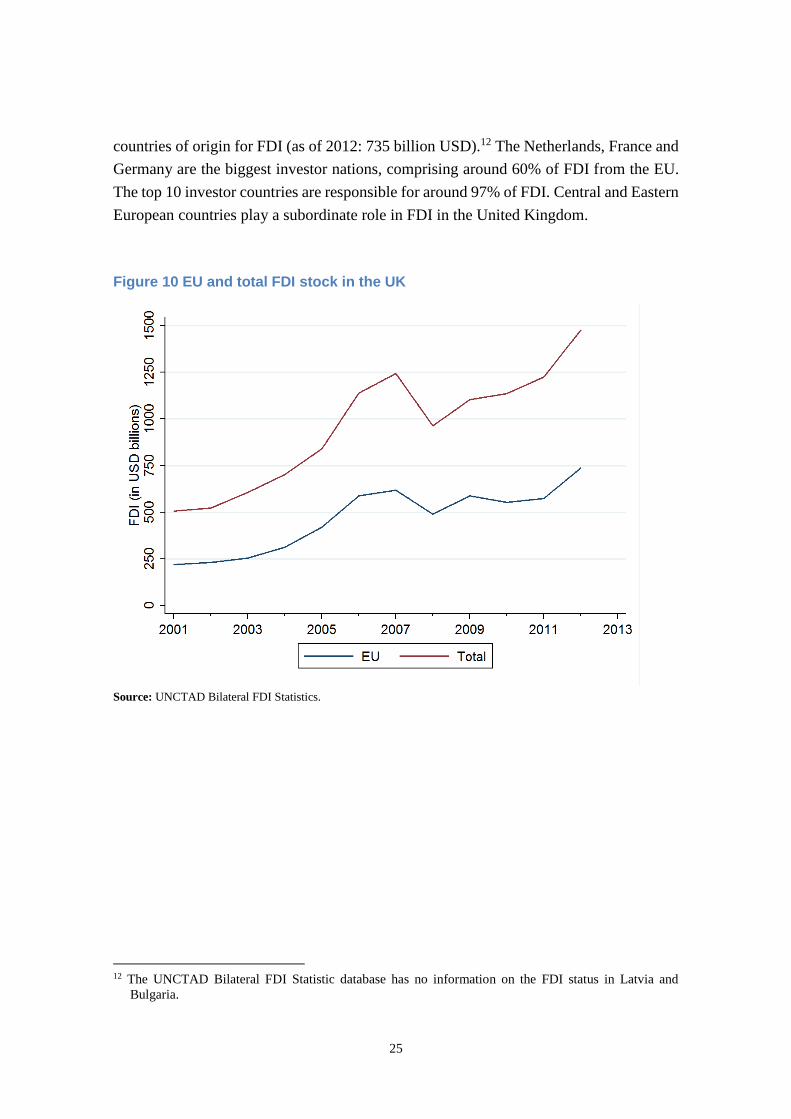
3.2. Foreign direct investments
In addition to trade relations, the EU and UK are becoming increasingly intertwined
through investment relationships. Figure 10 shows the chronological development of
foreign direct investments (FDI) in the United Kingdom between 2001 and 2012. During
the time before the financial crisis, FDI in the UK more than doubled. And FDI from
other EU member countries increased from around US$250 billion to more than US$500
billion in this timeframe. During the financial crisis years, a significant decline emerged
in FDI from the EU and even more from the total FDI. However, FDI (total and from the
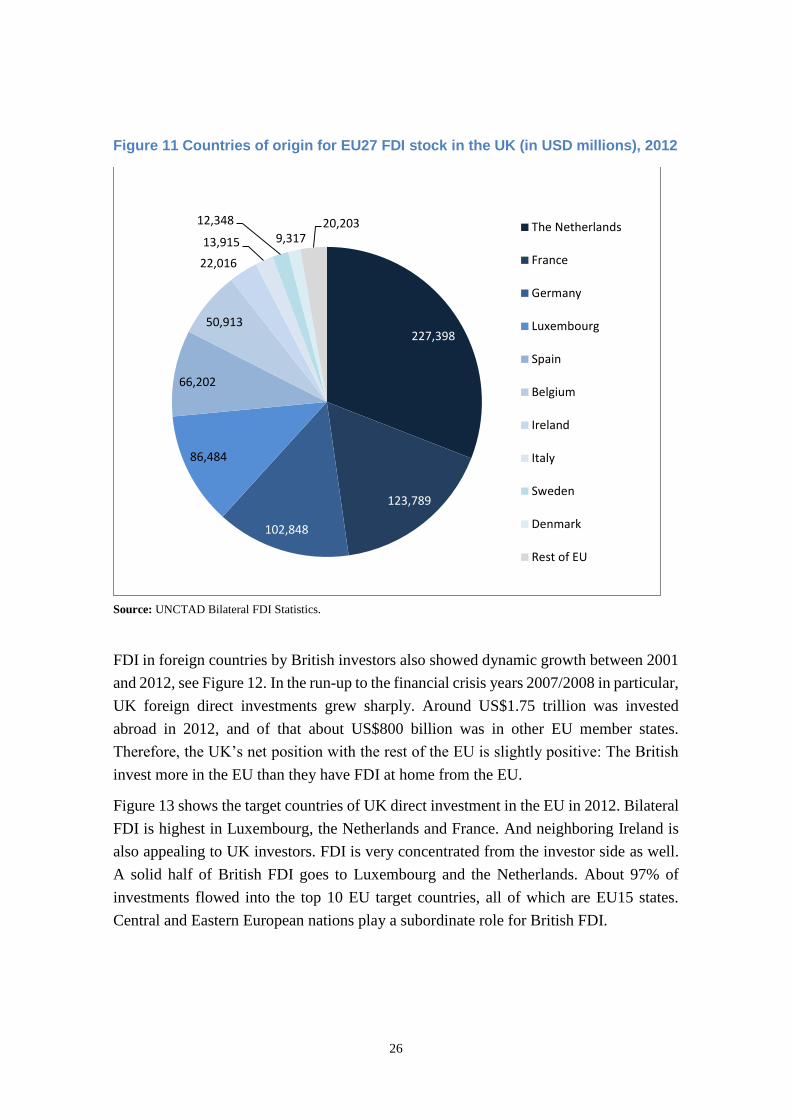
EU) began to increase again starting in 2009. Figure 11 provides information on the EU
25
countries of origin for FDI (as of 2012: 735 billion USD).12 The Netherlands, France and
Germany are the biggest investor nations, comprising around 60% of FDI from the EU.
The top 10 investor countries are responsible for around 97% of FDI. Central and Eastern
European countries play a subordinate role in FDI in the United Kingdom.
Figure 10 EU and total FDI stock in the UK
Source: UNCTAD Bilateral FDI Statistics.
12 The UNCTAD Bilateral FDI Statistic database has no information on the FDI status in Latvia and
Bulgaria.
26
Figure 11 Countries of origin for EU27 FDI stock in the UK (in USD millions), 2012
Source: UNCTAD Bilateral FDI Statistics.
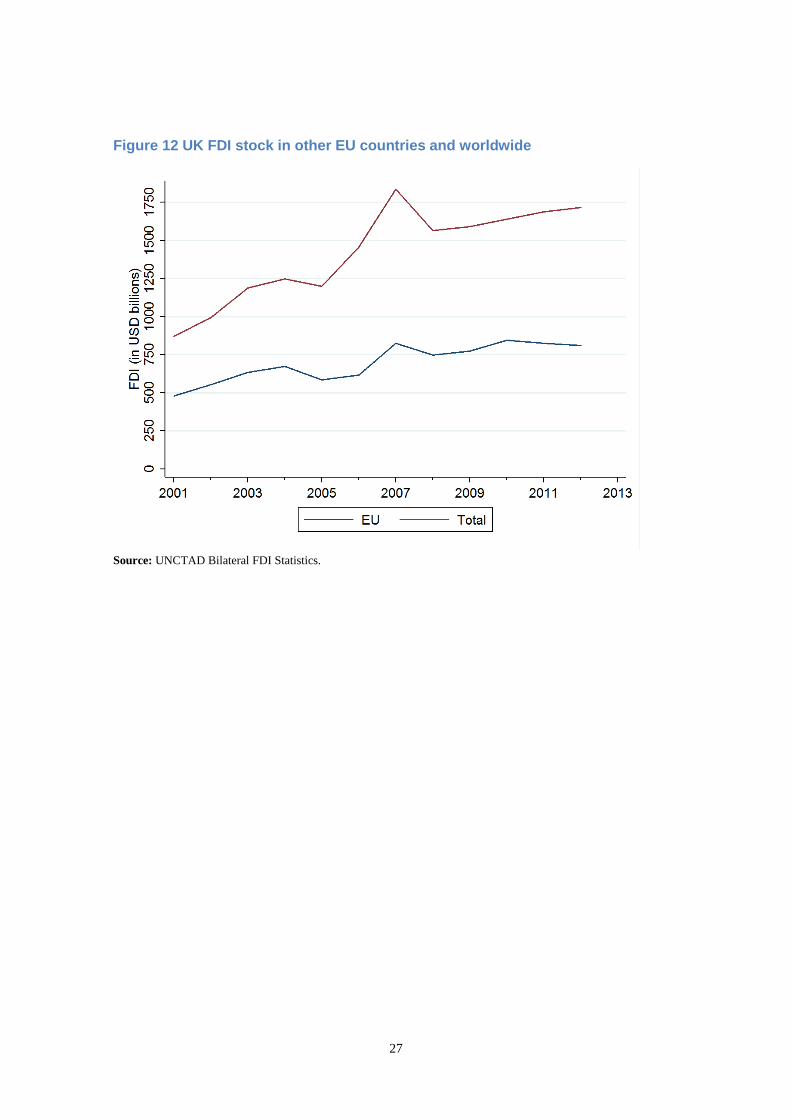
FDI in foreign countries by British investors also showed dynamic growth between 2001
and 2012, see Figure 12. In the run-up to the financial crisis years 2007/2008 in particular,
UK foreign direct investments grew sharply. Around US$1.75 trillion was invested
abroad in 2012, and of that about US$800 billion was in other EU member states.
Therefore, the UK’s net position with the rest of the EU is slightly positive: The British
invest more in the EU than they have FDI at home from the EU.
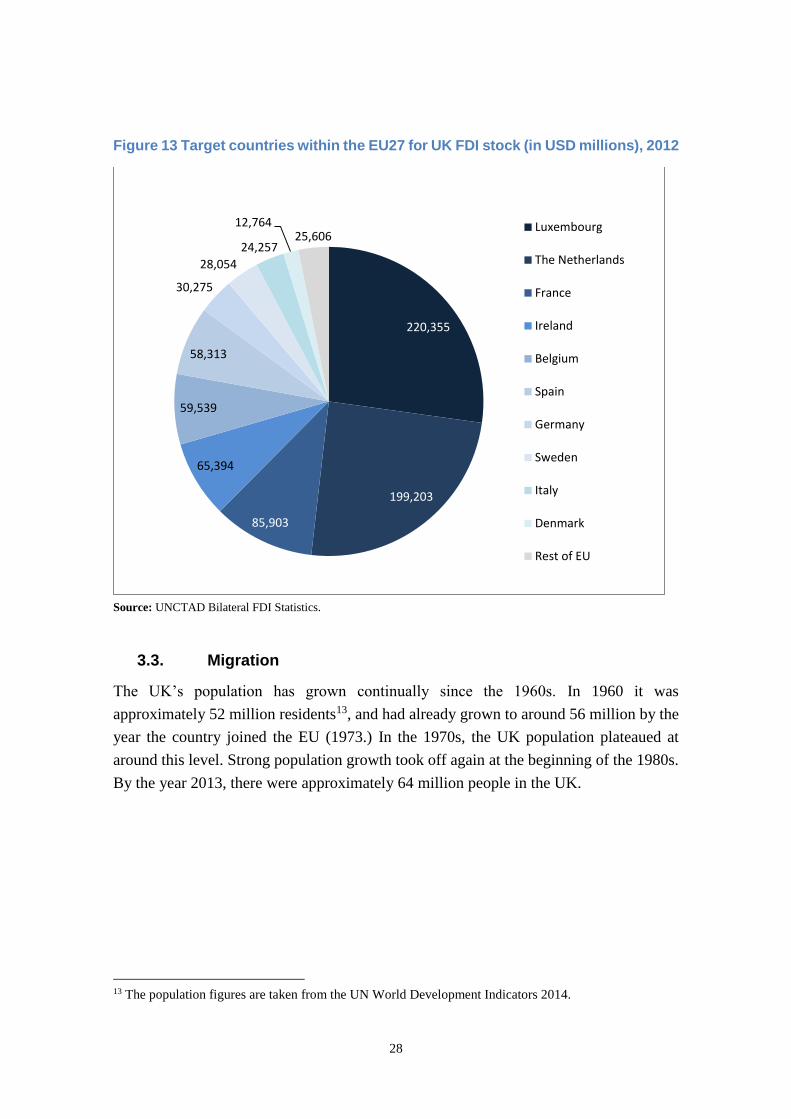
Figure 13 shows the target countries of UK direct investment in the EU in 2012. Bilateral
FDI is highest in Luxembourg, the Netherlands and France. And neighboring Ireland is
also appealing to UK investors. FDI is very concentrated from the investor side as well.
A solid half of British FDI goes to Luxembourg and the Netherlands. About 97% of
investments flowed into the top 10 EU target countries, all of which are EU15 states.
Central and Eastern European nations play a subordinate role for British FDI.
227,398
123,789
102,848
86,484
66,202
50,913
22,016
13,915
12,348
9,31720,203 The Netherlands
France
Germany
Luxembourg
Spain
Belgium
Ireland
Italy
Sweden
Denmark
Rest of EU
27
Figure 12 UK FDI stock in other EU countries and worldwide
Source: UNCTAD Bilateral FDI Statistics.
28
Figure 13 Target countries within the EU27 for UK FDI stock (in USD millions), 2012
Source: UNCTAD Bilateral FDI Statistics.
3.3. Migration
The UK’s population has grown continually since the 1960s. In 1960 it was
approximately 52 million residents13, and had already grown to around 56 million by the
year the country joined the EU (1973.) In the 1970s, the UK population plateaued at
around this level. Strong population growth took off again at the beginning of the 1980s.
By the year 2013, there were approximately 64 million people in the UK.
13 The population figures are taken from the UN World Development Indicators 2014.
220,355
199,203
85,903
65,394
59,539
58,313
30,275
28,054
24,257
12,76425,606
Luxembourg
The Netherlands
France
Ireland
Belgium
Spain
Germany
Sweden
Italy
Denmark
Rest of EU
29
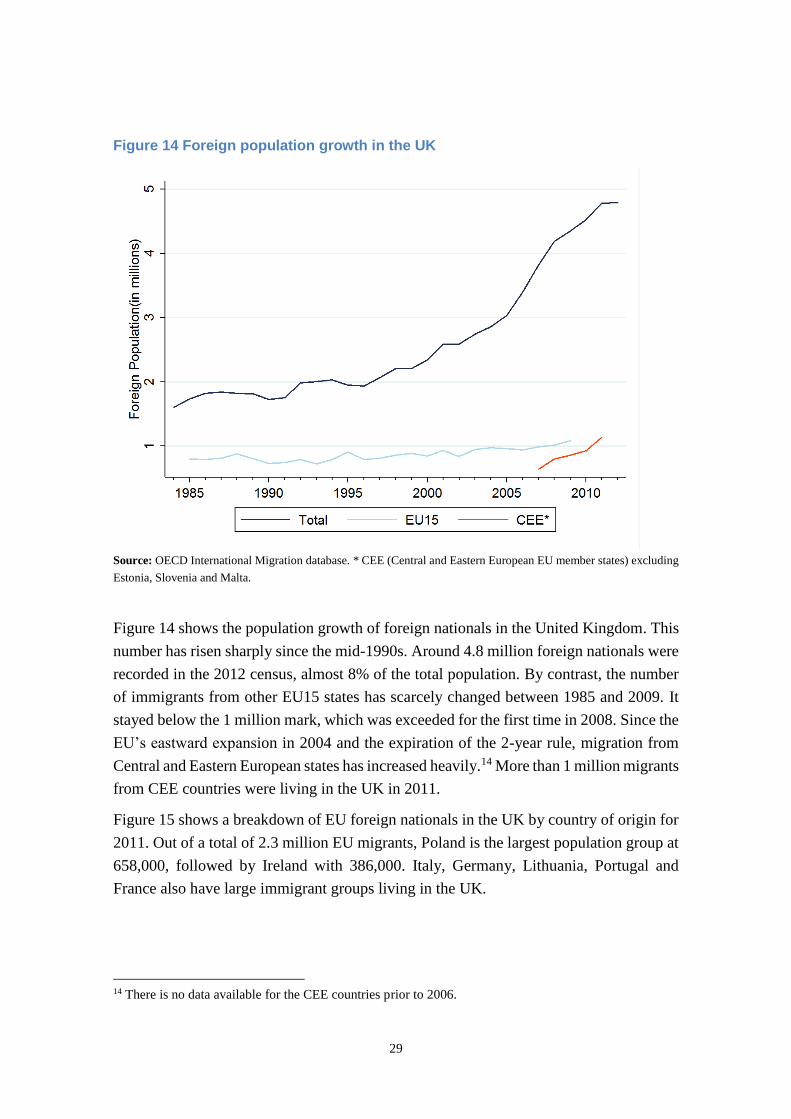
Figure 14 Foreign population growth in the UK
Source: OECD International Migration database. * CEE (Central and Eastern European EU member states) excluding
Estonia, Slovenia and Malta.
Figure 14 shows the population growth of foreign nationals in the United Kingdom. This
number has risen sharply since the mid-1990s. Around 4.8 million foreign nationals were
recorded in the 2012 census, almost 8% of the total population. By contrast, the number
of immigrants from other EU15 states has scarcely changed between 1985 and 2009. It
stayed below the 1 million mark, which was exceeded for the first time in 2008. Since the
EU’s eastward expansion in 2004 and the expiration of the 2-year rule, migration from
Central and Eastern European states has increased heavily.14 More than 1 million migrants
from CEE countries were living in the UK in 2011.
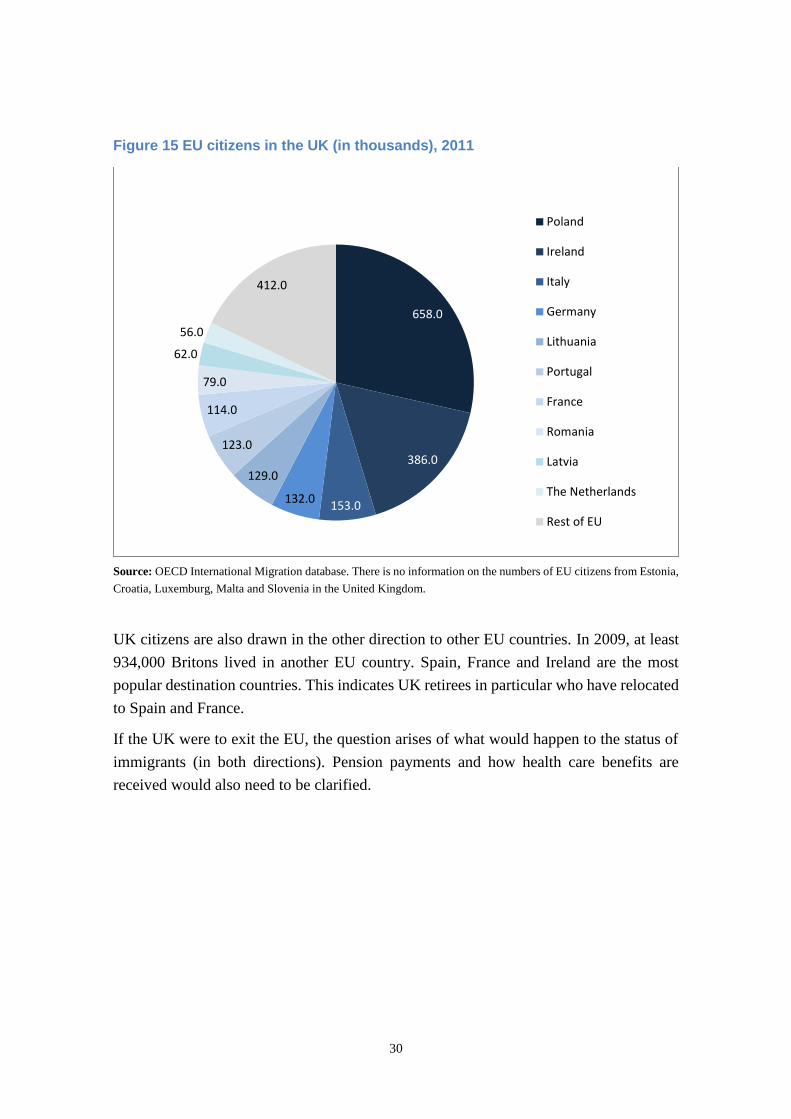
Figure 15 shows a breakdown of EU foreign nationals in the UK by country of origin for
2011. Out of a total of 2.3 million EU migrants, Poland is the largest population group at
658,000, followed by Ireland with 386,000. Italy, Germany, Lithuania, Portugal and
France also have large immigrant groups living in the UK.
14 There is no data available for the CEE countries prior to 2006.
30
Figure 15 EU citizens in the UK (in thousands), 2011
Source: OECD International Migration database. There is no information on the numbers of EU citizens from Estonia,
Croatia, Luxemburg, Malta and Slovenia in the United Kingdom.
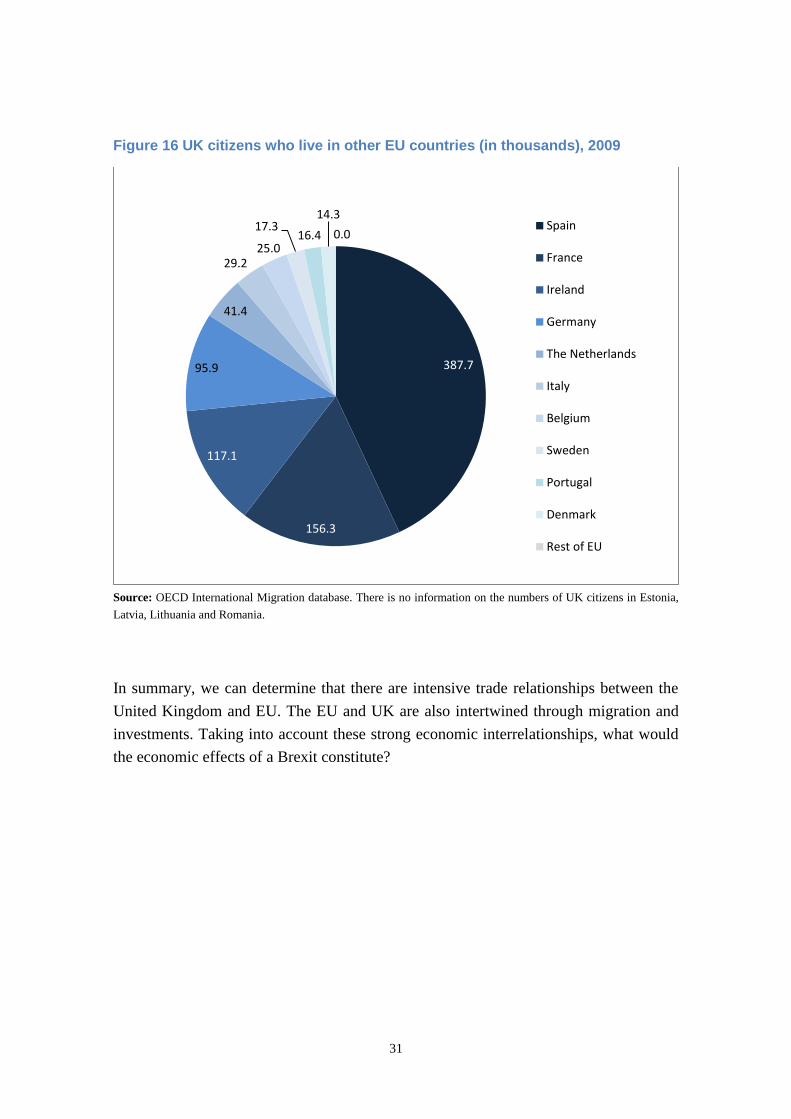
UK citizens are also drawn in the other direction to other EU countries. In 2009, at least
934,000 Britons lived in another EU country. Spain, France and Ireland are the most
popular destination countries. This indicates UK retirees in particular who have relocated
to Spain and France.
If the UK were to exit the EU, the question arises of what would happen to the status of
immigrants (in both directions). Pension payments and how health care benefits are
received would also need to be clarified.
658.0
386.0
153.0132.0
129.0
123.0
114.0
79.0
62.0
56.0
412.0
Poland
Ireland
Italy
Germany
Lithuania
Portugal
France
Romania
Latvia
The Netherlands
Rest of EU
31
Figure 16 UK citizens who live in other EU countries (in thousands), 2009
Source: OECD International Migration database. There is no information on the numbers of UK citizens in Estonia,
Latvia, Lithuania and Romania.
In summary, we can determine that there are intensive trade relationships between the
United Kingdom and EU. The EU and UK are also intertwined through migration and
investments. Taking into account these strong economic interrelationships, what would
the economic effects of a Brexit constitute?
387.7
156.3
117.1
95.9
41.4
29.225.0
17.316.4
14.3
0.0Spain
France
Ireland
Germany
The Netherlands
Italy
Belgium
Sweden
Portugal
Denmark
Rest of EU
32
4. Net contribution and UK rebate: How much does the UK
actually pay?
In addition to gaining greater national sovereignty, the elimination of the UK’s net
contribution to the EU budget is another argument brought by Brexit proponents.
The European Union’s budget is determined annually on the initiative of the European
Commission of the EU Parliament and the Council of the European Union. It amounts on
average to somewhat more than 1% of the European gross national income (GNI).15 A
total of €135.5 billion were available for expenditures in 2014. The EU cannot levy taxes
or duties, nor can it finance itself through normal borrowing. Its revenues (identified as
the European Union’s own resources) come from three main sources: member state
contributions proportional to their GNI (ca. 74% of all revenues in 2014), a value-added
tax of 0.3% in the member states (ca. 13% in 2013) and traditional own resources from
tariffs on imports from outside the EU and sugar levies (ca. 12% in 2013).
The expenditures are separated into categories with upper limits in a multi-year financial
framework. There are ceilings for annual limits for liabilities as well as payments. The
Common Agricultural Policy (CAP) as well as regional policy are the two largest
individual items in the framework from 2007-2013 and from 2014-2020. In the financial
framework for 2014-2020, the maximum allowable liability for the CAP is 38% of the
total budget (€48 billion aggregated over the years) and 33.9% for regional policy (circa
€367 billion total).
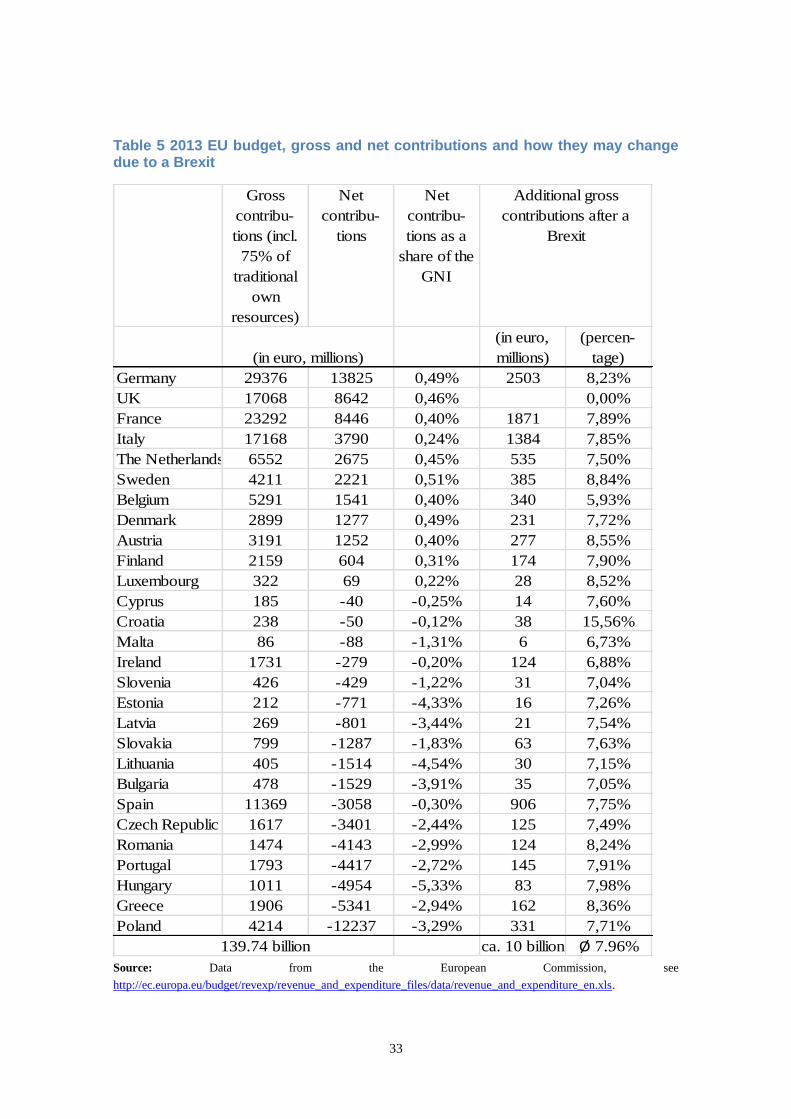
Table 5 depicts the country-specific contributions to the 2013 EU budget. The first
column shows the gross contributions, which at €139.74 billion in total represent the
entirety of the European Union’s own resources in 2013. The second and third columns
demonstrate that Germany, the United Kingdom and France are the biggest absolute net
contributors, paying in about one half a percent of their GNI. Eleven of the 28 member
states are net contributors in the 2013 budget. The biggest net recipients receive between
3 and 5% of their GNI from EU funds. Net recipients are primarily Eastern European
member states because regional policy constitutes a significant portion of the EU budget
(category: “Cohesion for growth and employment”). For example, as the country with the
largest absolute net income, Poland receives €10.6 billion from the regional government
and €3.2 billion from the CAP.
15 See http://ec.europa.eu/budget/mff/resources/index_en.cfm for a detailed depiction of the EU budget.
33
Table 5 2013 EU budget, gross and net contributions and how they may change due to a Brexit
Gross
contribu-
tions (incl.
75% of
traditional
own
resources)
Net
contribu-
tions
Net
contribu-
tions as a
share of the
GNI
(in euro,
millions)
(percen-
tage)
Germany 29376 13825 0,49% 2503 8,23%
UK 17068 8642 0,46% 0,00%
France 23292 8446 0,40% 1871 7,89%
Italy 17168 3790 0,24% 1384 7,85%
The Netherlands 6552 2675 0,45% 535 7,50%
Sweden 4211 2221 0,51% 385 8,84%
Belgium 5291 1541 0,40% 340 5,93%
Denmark 2899 1277 0,49% 231 7,72%
Austria 3191 1252 0,40% 277 8,55%
Finland 2159 604 0,31% 174 7,90%
Luxembourg 322 69 0,22% 28 8,52%
Cyprus 185 -40 -0,25% 14 7,60%
Croatia 238 -50 -0,12% 38 15,56%
Malta 86 -88 -1,31% 6 6,73%
Ireland 1731 -279 -0,20% 124 6,88%
Slovenia 426 -429 -1,22% 31 7,04%
Estonia 212 -771 -4,33% 16 7,26%
Latvia 269 -801 -3,44% 21 7,54%
Slovakia 799 -1287 -1,83% 63 7,63%
Lithuania 405 -1514 -4,54% 30 7,15%
Bulgaria 478 -1529 -3,91% 35 7,05%
Spain 11369 -3058 -0,30% 906 7,75%
Czech Republic 1617 -3401 -2,44% 125 7,49%
Romania 1474 -4143 -2,99% 124 8,24%
Portugal 1793 -4417 -2,72% 145 7,91%
Hungary 1011 -4954 -5,33% 83 7,98%
Greece 1906 -5341 -2,94% 162 8,36%
Poland 4214 -12237 -3,29% 331 7,71%
139.74 billion ca. 10 billion Ø 7.96%
Additional gross
contributions after a
Brexit
(in euro, millions)
Source: Data from the European Commission, see
http://ec.europa.eu/budget/revexp/revenue_and_expenditure_files/data/revenue_and_expenditure_en.xls.
34
Because the United Kingdom benefits relatively little from CAP expenditures (for
example, it received only €3.16 billion in 2013 compared to France’s €8.58 billion),
Margaret Thatcher negotiated the introduction of a “UK rebate” in 1984. At its core, this
contains a refund of approximately 2/3 of the United Kingdom’s annual net contributions
to the EU budget. For the years 2011-2013, the rebate averaged around €4.1 billion. A
correction in how the rebate is calculated was introduced in 2008, which reduces the
rebate depending on the costs of the EU expansion. According to forecasts by the UK’s
economic and finance ministry (HM Treasury, 2014), the rebate will hover around an
average of €6 billion in the years up to 2020 (£4.83 billion, average exchange rate in
2014).
The costs of the UK rebate are distributed among the other 27 member states according
to their share of the EU’s GNI. However, Germany’s share as well as that of the
Netherlands, Austria and Sweden is limited to 25% percent of their actual contribution
toward financing the British rebate because these countries would have otherwise
considered their percentage of the EU budget as too high. This means that France bears
the greatest absolute burden. Nevertheless, the table shows that even with the rebate, the
UK is still the second-highest absolute net contributor (after Germany).
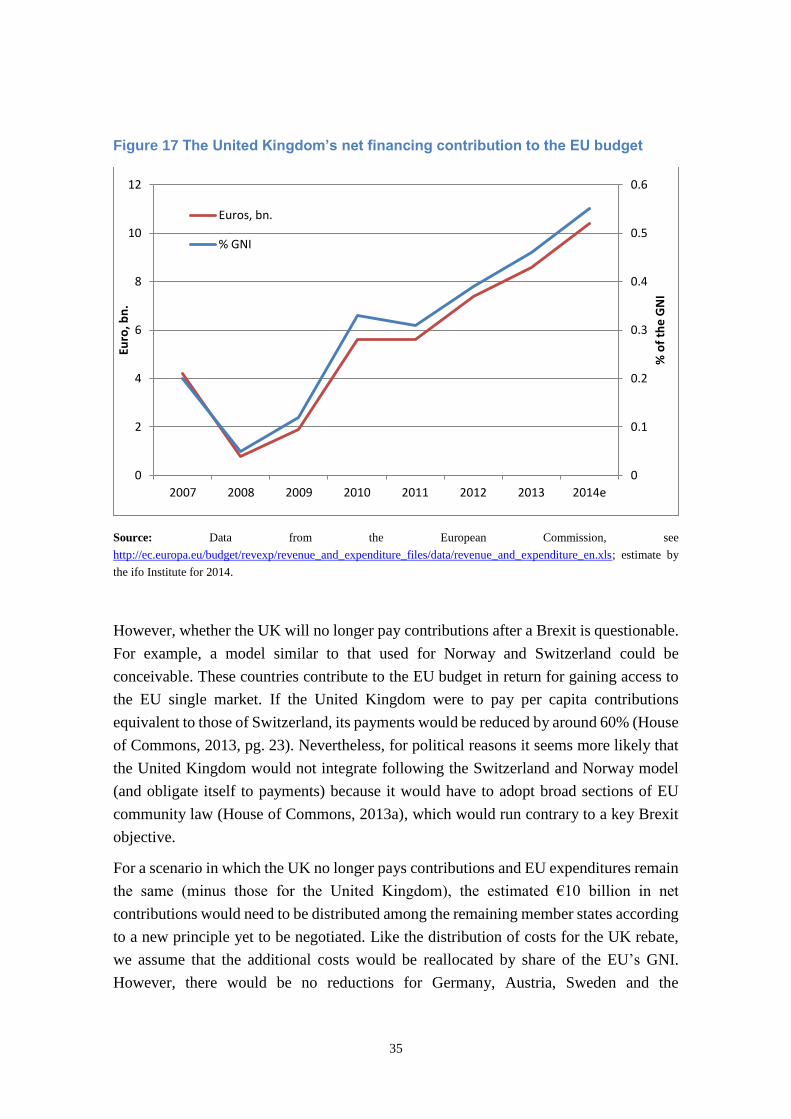
Figure 17 illustrates that the United Kingdom’s net contribution has grown over the last
few years. One key element of the Brexit debate is that net payments have increased
sharply since the global financial and economic crisis in 2008. This reflects the fact that
the long-term recession in many euro zone countries has reduced their contributions to
the EU budget. The net contribution has increased from approximately €6 billion to
around €10 billion since 2010. This corresponds to an increase of 0.33% to 0.55% of the
GNI.
If the United Kingdom exits the EU on January 1, 2018, this will change how the EU
budget is financed. According to estimates by the UK’s economic and finance ministry
(HM Treasury, 2014, pg. 18), the United Kingdom will pay a net contribution of £8 billion
for fiscal year April 2017-April 2018 (after subtracting the UK rebate) if it remains in the
EU. This is roughly equivalent to €10 billion16, or approximately 0.51% of the British
GNI for 2013. If we use the mean value of forecasts for the years 2017 through 2020, the
UK’s net contribution would average €10.5 billion or about 0.56% of the country’s GNI.
Therefore, if the United Kingdom exits the EU it can expect an income gain of around
0.5% from eliminating its EU net contribution.
16 After conversion with the average exchange rate for the year 2014, see HM Treasury (2014).
35
Figure 17 The United Kingdom’s net financing contribution to the EU budget
Source: Data from the European Commission, see
http://ec.europa.eu/budget/revexp/revenue_and_expenditure_files/data/revenue_and_expenditure_en.xls; estimate by
the ifo Institute for 2014.
However, whether the UK will no longer pay contributions after a Brexit is questionable.
For example, a model similar to that used for Norway and Switzerland could be
conceivable. These countries contribute to the EU budget in return for gaining access to
the EU single market. If the United Kingdom were to pay per capita contributions
equivalent to those of Switzerland, its payments would be reduced by around 60% (House
of Commons, 2013, pg. 23). Nevertheless, for political reasons it seems more likely that
the United Kingdom would not integrate following the Switzerland and Norway model
(and obligate itself to payments) because it would have to adopt broad sections of EU
community law (House of Commons, 2013a), which would run contrary to a key Brexit
objective.
For a scenario in which the UK no longer pays contributions and EU expenditures remain
the same (minus those for the United Kingdom), the estimated €10 billion in net
contributions would need to be distributed among the remaining member states according
to a new principle yet to be negotiated. Like the distribution of costs for the UK rebate,
we assume that the additional costs would be reallocated by share of the EU’s GNI.
However, there would be no reductions for Germany, Austria, Sweden and the
0
0.1
0.2
0.3
0.4
0.5
0.6
0
2
4
6
8
10
12
2007 2008 2009 2010 2011 2012 2013 2014e
% o
f th
e G
NI
Euro
, bn
.
Euros, bn.
% GNI

36
Netherlands. Applying this rule would result in absolute additional costs of around €2.5
billion for Germany and €1.9 billion for France (see column 4 of Table 5). If we place the
increased contributions in relation to the GNI, each EU country would see an added
burden of about 0.089% of its GNI (as of 2013). The last column in Table 5 illustrates the
percentual increase in gross contributions for the individual member states if a Brexit
occurs. On average, the gross contributions will rise by circa 8%.
37
5. Scenario calculations: What costs could a Brexit create for
the UK? Static effects
5.1. Scenarios
How high are the economic costs of a Brexit for the UK – and for Europe overall? The
conditions surrounding a Brexit are unclear. A number of different scenarios are
conceivable from a trade policy perspective, ranging from a UK exit with ongoing strong
trade integration with EU states (similar to the status of Norway or Switzerland) to a trade
policy Ice Age between the EU and UK.
Therefore, this study aims to quantify the economic costs of a Brexit primarily using
scenario calculations – thought experiments on the computer that simulate the effects of
the event under different conditions. The scenarios differ in the assumptions made
regarding the development of trade costs between the EU and the United Kingdom. The
following briefly explains the configuration of the selected scenarios.
(i) Soft exit: The United Kingdom exits the EU, but receives a status similar to
that of Norway or Switzerland, meaning that the EU and UK retain a deep
trade agreement. The increased cost of trade results from reversing the trade
cost reductions from joining the EU that were previously observed.
(ii) Deep cut: The United Kingdom exits the EU and there is no trade agreement
between the EU and UK. This means that non-tariff barriers to trade would be
introduced/increased by dismantling exemptions from existing trade
agreements and tariffs would potentially be introduced between the EU and
UK. EU tariffs against the USA (or the EU’s MFN tariffs) would serve as a
point of reference.
(iii) Isolation of the UK: The United Kingdom exits the EU and loses its
preferential access to the EU common market entirely. In addition, it loses
preferential market access negotiated by the EU to countries that have a free
trade agreement with the EU.
The third scenario would certainly entail the most drastic cuts. Over the long term, the
United Kingdom can surely counter these cuts and negotiate its own free trade
agreements, but that typically takes a few years and the UK would definitely not enjoy
the same negotiating power as the EU. Nevertheless, scenario 3 is probably unrealistic.
While prevailing WTO law requires a country to levy MFN tariffs against its trade
partners if they do not have a free trade agreement, there really is no reason why – if a
Brexit does happen – the United Kingdom would have to return to the non-tariff barriers
38
from before it joined the EU. After all, the acquis communautaire has been implemented
into UK law. But uncoupling from the EU’s regulatory coordination and harmonization
process – a key demand of the UKIP and other Euro critics – would gradually lead to a
buildup of new non-tariff barriers to trade. Therefore, the period of time involved in
scenario 3 is longer than with the other scenarios.
It is also unclear what will happen with preferential trade agreements (PTAs) currently in
negotiation. The EU has been very active on trade policy matters in recent years. It has
successfully concluded negotiations on a series of modern free trade agreements that have
already taken effect: with South Korea (2011), Peru (2013), Colombia (2013), and with
the Central American nations of Costa Rica, El Salvador, Guatemala, Honduras,
Nicaragua and Panama (2013). Additional free trade agreements have been negotiated
and are waiting for ratification by the European Parliament, for example with Singapore,
Canada, Moldova and Georgia. Moreover, the EU is currently in negotiations with the
USA, Japan, Malaysia, Vietnam, Thailand, India and MERCOSUR. The EU anticipates
positive impetus for trade, growth and employment within its borders from all of these
free trade agreements. Should the United Kingdom exit the EU, it would no longer be
part of the newly concluded free trade agreements. As such, costs would arise not only
from the loss of unlimited access to the EU single market, but also through lost trade gains
from future EU free trade agreements. Another scenario takes these lost future gains into
account.
5.2. Estimating the effects on trade, sectoral net value added,
openness and real income
To estimate the effects of the different Brexit scenarios on trade, sectoral net value added
and real income, we are utilizing the ifo Institute model for analyzing trade policy
(Aichele et al., 2014). This is based on a static model of general equilibrium in which
approximately 130 countries can engage in trade with each other in 34 sectors for goods
and services, and in which the trade flows can be slowed through tariffs and non-tariff
barriers to trade. The model utilizes New Quantitative Trade Theory; see Costinot and
Rodriguez-Clare (2015) for a description of these model types. It is important to
emphasize here that the calculable effects are static. The dynamic effects of trade – such
as the innovation capabilities of companies – are excluded. As such, the model reveals
fundamental limitations. The dynamic effects will be discussed later. However, this does
not mean that these static effects would emerge in their entirety immediately after a
Brexit. This is particularly relevant with regard to non-tariff barriers to trade: The effects
of the loss of regulatory cooperation with the EU would develop slowly. According to
39
empirical literature (e.g., Jung, 2012), the adjustment would take around 10 to 12 years,
meaning that if an official exit took place in 2018, the simulated effects would apply to
the year 2028 or 2030.
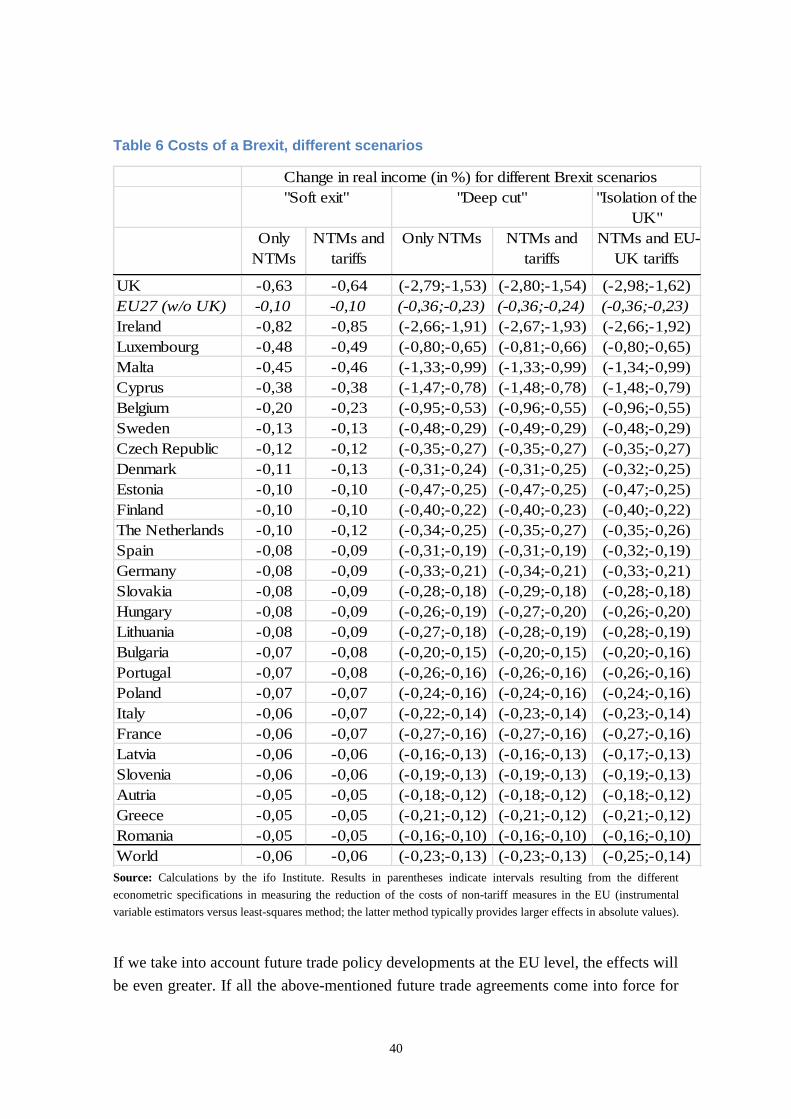
Table 6 provides an overview of the projected effects of a Brexit on all EU27 countries.
Aside from Ireland, the United Kingdom is the country that would see the greatest welfare
losses. In a “soft exit” scenario, the country would lose approximately 0.6% of its real
income. In a “deep cut” scenario in which any preferential treatment of trade between the
EU and UK is abolished, the expectations of welfare losses are significantly higher
(between 1.5 and 2.8%), whereby the interval of econometric specifications is reflected
in the measurement of non-tariff barriers to trade. The reintroduction of tariffs with the
EU states (to the level of tariffs that the EU levies against the USA) plays a subordinate
role for the welfare effects. Effects on the scenarios with and without the introduction of
tariffs are nearly identical.17 The loss of all free trade agreements including the full
withdrawal from the EU would cost the United Kingdom between 1.6 and 3% of its real
income. Although the additional effect of total isolation is low for the UK, it only
emphasizes the importance of trade with the EU.
Therefore, the costs of a Brexit in the static model – depending on scenario – for the
United Kingdom fall between 0.6 and 3% of per capita income in the base year.
17 The reintroduction of tariffs can nevertheless have an impact on sectoral net value added.
40
Table 6 Costs of a Brexit, different scenarios
"Isolation of the
UK"
Only
NTMs
NTMs and
tariffs
Only NTMs NTMs and
tariffs
NTMs and EU-
UK tariffs
UK -0,63 -0,64 (-2,79;-1,53) (-2,80;-1,54) (-2,98;-1,62)
EU27 (w/o UK) -0,10 -0,10 (-0,36;-0,23) (-0,36;-0,24) (-0,36;-0,23)
Ireland -0,82 -0,85 (-2,66;-1,91) (-2,67;-1,93) (-2,66;-1,92)
Luxembourg -0,48 -0,49 (-0,80;-0,65) (-0,81;-0,66) (-0,80;-0,65)
Malta -0,45 -0,46 (-1,33;-0,99) (-1,33;-0,99) (-1,34;-0,99)
Cyprus -0,38 -0,38 (-1,47;-0,78) (-1,48;-0,78) (-1,48;-0,79)
Belgium -0,20 -0,23 (-0,95;-0,53) (-0,96;-0,55) (-0,96;-0,55)
Sweden -0,13 -0,13 (-0,48;-0,29) (-0,49;-0,29) (-0,48;-0,29)
Czech Republic -0,12 -0,12 (-0,35;-0,27) (-0,35;-0,27) (-0,35;-0,27)
Denmark -0,11 -0,13 (-0,31;-0,24) (-0,31;-0,25) (-0,32;-0,25)
Estonia -0,10 -0,10 (-0,47;-0,25) (-0,47;-0,25) (-0,47;-0,25)
Finland -0,10 -0,10 (-0,40;-0,22) (-0,40;-0,23) (-0,40;-0,22)
The Netherlands -0,10 -0,12 (-0,34;-0,25) (-0,35;-0,27) (-0,35;-0,26)
Spain -0,08 -0,09 (-0,31;-0,19) (-0,31;-0,19) (-0,32;-0,19)
Germany -0,08 -0,09 (-0,33;-0,21) (-0,34;-0,21) (-0,33;-0,21)
Slovakia -0,08 -0,09 (-0,28;-0,18) (-0,29;-0,18) (-0,28;-0,18)
Hungary -0,08 -0,09 (-0,26;-0,19) (-0,27;-0,20) (-0,26;-0,20)
Lithuania -0,08 -0,09 (-0,27;-0,18) (-0,28;-0,19) (-0,28;-0,19)
Bulgaria -0,07 -0,08 (-0,20;-0,15) (-0,20;-0,15) (-0,20;-0,16)
Portugal -0,07 -0,08 (-0,26;-0,16) (-0,26;-0,16) (-0,26;-0,16)
Poland -0,07 -0,07 (-0,24;-0,16) (-0,24;-0,16) (-0,24;-0,16)
Italy -0,06 -0,07 (-0,22;-0,14) (-0,23;-0,14) (-0,23;-0,14)
France -0,06 -0,07 (-0,27;-0,16) (-0,27;-0,16) (-0,27;-0,16)
Latvia -0,06 -0,06 (-0,16;-0,13) (-0,16;-0,13) (-0,17;-0,13)
Slovenia -0,06 -0,06 (-0,19;-0,13) (-0,19;-0,13) (-0,19;-0,13)
Autria -0,05 -0,05 (-0,18;-0,12) (-0,18;-0,12) (-0,18;-0,12)
Greece -0,05 -0,05 (-0,21;-0,12) (-0,21;-0,12) (-0,21;-0,12)
Romania -0,05 -0,05 (-0,16;-0,10) (-0,16;-0,10) (-0,16;-0,10)
World -0,06 -0,06 (-0,23;-0,13) (-0,23;-0,13) (-0,25;-0,14)
Change in real income (in %) for different Brexit scenarios
"Soft exit" "Deep cut"
Source: Calculations by the ifo Institute. Results in parentheses indicate intervals resulting from the different
econometric specifications in measuring the reduction of the costs of non-tariff measures in the EU (instrumental
variable estimators versus least-squares method; the latter method typically provides larger effects in absolute values).
If we take into account future trade policy developments at the EU level, the effects will
be even greater. If all the above-mentioned future trade agreements come into force for
41
the EU, remaining in the Union could bring the United Kingdom additional real income
growth of 1 to 5% according to the ifo trade model (Aichele et al., 2014). This would be
called into question if a Brexit occurs. Should the UK not be part of future EU trade
agreements in this hypothetical world, several alternatives are conceivable: (i) soft exit or
(ii) deep cut. In the first case, changes in real income of -0.6 to -0.4% are projected for
the UK based on the base year. Greater welfare losses of between 1.5 and 2.5% would
result from a deep cut.
Therefore, the UK would lose out on income growth between 1.4 and 7.5% over the long
term if we take into consideration lost future gains from trade along with the direct
negative trade effects of exiting the EU.
A Brexit would lead to a realignment of British trade to a certain extent. The share of UK
exports that go to the EU would decline over the long term by 4 to 6 percentage points
with a soft exit. The percentage of imports that the United Kingdom receives from the EU
drop by a similar amount. For a more drastic disruption in trade relations, the ifo trade
model predicts a decrease of 12 to 16 percentage points in the share of exports and 14 to
21 percentage points for imports.18 This indicates strong trade-diverting effects. In
particular, the share of UK exports to the USA (projected to see an increase of 1-5
percentage points) and to East Asia (Japan and South Korea would see an increase of 0.3-
1.5 percentage points) would benefit from the diversion of trade. The share of exports to
ASEAN and EFTA would also increase (between 0.2 and 0.9 percentage points). On the
import side, imports from China, the USA, the ASEAN nations and Southeast Asia would
benefit substantially, as would the Eurasian Customs Union.
UK trade flows would be rerouted from more than just EU countries. British openness
would decline overall.19 In the outset situation, the United Kingdom has a ratio of export
plus import of 52.8% of the GDP. If a Brexit occurs, trade openness would decline by 3
to 13 percentage points depending on the severity of disruption for trade relations. A
Brexit would significantly isolate the UK internationally.
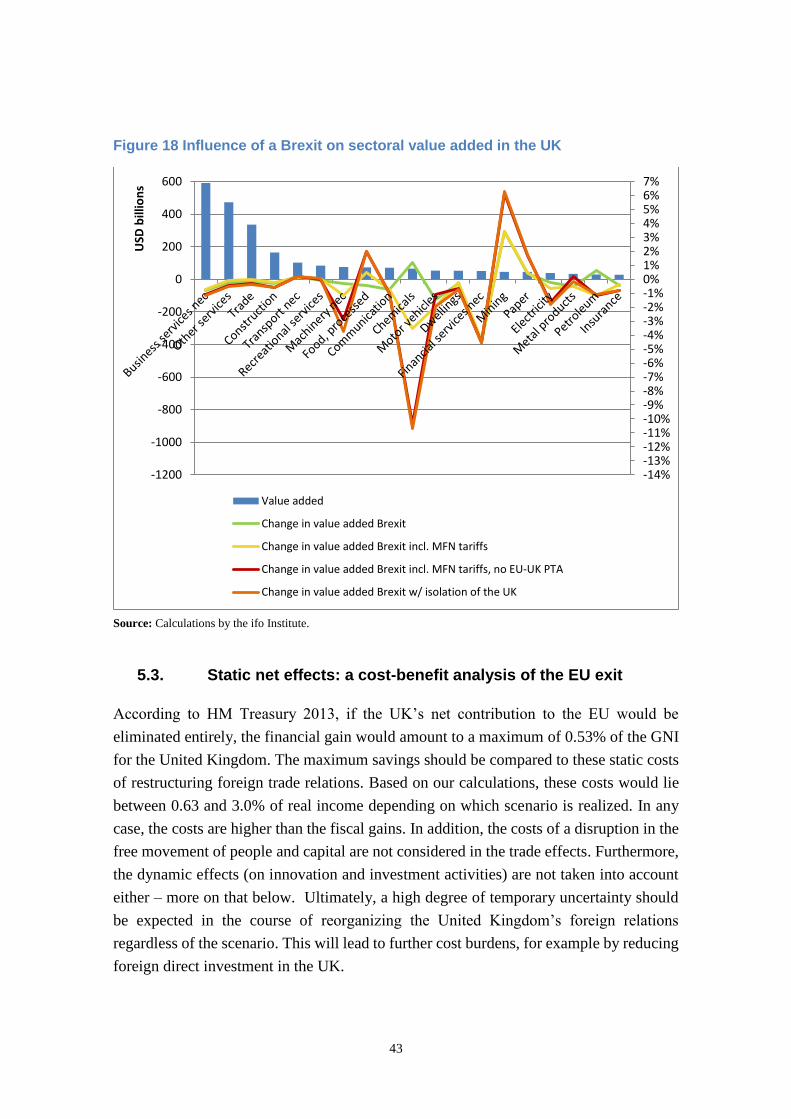
Figure 18 depicts a forecast of the development of sectoral value added if a Brexit does
happen. The value added is depicted in the base year (left side) for all UK sectors that
contribute more than 1% to its national value added. Business services, other services and
trade services are of particular economic importance. The figure shows the anticipated
changes in sectoral value added for the different Brexit scenarios (shown on the right
18 This means that in an extreme case, Europe's relative importance to the United Kingdom's foreign trade
would approximately return to the percentages depicted in Error! Reference source not found. for
1973 – in other words, the level prior to the UK joining the EU. 19 Openness is defined here as the percentage of exports plus imports in a country’s gross domestic product.
42
side). The heterogeneity of the sectoral effects is obvious. The chemicals, mechanical
engineering and automotive sectors in particular should expect losses in value added due
to a Brexit. These three sectors are heavily incorporated in the European value chain and
for that reason would be hit especially hard by Brexit effects. Moreover, the EU’s external
tariffs for the automotive and mechanical engineering sectors are considerable. A deep
disruption would lead to noticeable cuts, especially for the mechanical engineering and
chemicals industries.
In the service sector, financial services would see a particularly strong negative impact.
The decline in value added would be nearly 5% for this industry.
We can also see that a Brexit would have very different regional effects throughout the
United Kingdom. Northern Ireland, which naturally has above-average trade with Ireland
(an EU country), would see an above-average negative impact. The same would apply to
Scotland, although to a lesser degree. Therefore, a Brexit could further fuel tensions
between the individual countries of the United Kingdom (e.g., with regard to Scotland’s
independence). The effects on the city of London, which is heavily intertwined with the
other European financial capitals (Frankfurt, Paris, Luxemburg), would also be highly
negative.
43
Figure 18 Influence of a Brexit on sectoral value added in the UK
Source: Calculations by the ifo Institute.
5.3. Static net effects: a cost-benefit analysis of the EU exit
According to HM Treasury 2013, if the UK’s net contribution to the EU would be
eliminated entirely, the financial gain would amount to a maximum of 0.53% of the GNI
for the United Kingdom. The maximum savings should be compared to these static costs
of restructuring foreign trade relations. Based on our calculations, these costs would lie
between 0.63 and 3.0% of real income depending on which scenario is realized. In any
case, the costs are higher than the fiscal gains. In addition, the costs of a disruption in the
free movement of people and capital are not considered in the trade effects. Furthermore,
the dynamic effects (on innovation and investment activities) are not taken into account
either – more on that below. Ultimately, a high degree of temporary uncertainty should
be expected in the course of reorganizing the United Kingdom’s foreign relations
regardless of the scenario. This will lead to further cost burdens, for example by reducing
foreign direct investment in the UK.
-14%-13%-12%-11%-10%-9%-8%-7%-6%-5%-4%-3%-2%-1%0%1%2%3%4%5%6%7%
-1200
-1000
-800
-600
-400
-200
0
200
400
600
USD
bill
ion
s
Value added
Change in value added Brexit
Change in value added Brexit incl. MFN tariffs
Change in value added Brexit incl. MFN tariffs, no EU-UK PTA
Change in value added Brexit w/ isolation of the UK

44
Therefore, the static analysis makes clear with high probability that a Brexit would be a
net loss for the United Kingdom totaling at least 0.1% of the annual per capita income.
45
6. What costs would Germany and the EU be facing? Static
analysis
A Brexit would likely bring negative economic effects for the United Kingdom – and the
remaining EU countries could be negatively affected as well. As discussed previously,
the United Kingdom’s net contribution to the EU budget would need to be compensated
for should it exit the Union. Moreover, businesses in EU countries would suffer from
reduced access to the UK market. With 15% of the EU’s GDP and 13% of its population
(as of 2013), the United Kingdom is an important market for businesses in Germany and
other EU states.
For Germany, a Brexit would mean a reorientation toward continental Europe. Germany’s
share of exports to the UK would fall by 1 to 4 percentage points, and imports from the
UK by between 0.7 and 2.7 percentage points. Aside from the increased trade rate with
other EU states, it would also increase to a lesser degree with the EFTA states, the
Eurasian Customs Union, the USA, China and East Asia. However, we predict that
Germany’s overall trade openness will decline from 80.6% in the base year by between
0.5 and 1.8 percentage points.
46
Figure 19 Influence of a Brexit on sectoral value added in Germany
Source: Calculations by the ifo Institute.
In Germany, the automotive industry would suffer the most from a Brexit. Since the
automotive sector has strong supplier structures with the UK, a buildup of barriers to trade
would be very noticeable. Forecasts predict a decline in sectoral value added of up to 2%.
In addition to the automotive industry, the electronics, metal production and food
industries would all see negative cuts as well. By contrast, the chemicals industry and
financial services sector would benefit from the United Kingdom’s increased isolation.
Both of these sectors could see an increase in net value added of 0.5 and 1% respectively,
because Germany is at a comparative disadvantage to the United Kingdom there. A Brexit
would equalize Germany’s disadvantage.
Ireland is one of the Brexit’s greatest potential losers. The sectoral value added would
shrink significantly in its agricultural sector above all, but in the electronics industry as
well. The food and mechanical engineering sectors would also be impacted negatively.
However, Ireland’s financial services sector and to a lesser extent its chemicals industry
could be among the winners of a Brexit.
-3%
-2%
-1%
0%
1%
2%
3%
4%
-600
-400
-200
0
200
400
600
800
USD
bill
ion
s
Value added
Change in value added Brexit
Change in value added Brexit incl. MFN tariffs
Change in value added Brexit incl. MFN tariffs, no EU-UK PTA
Change in value added Brexit w/ isolation of UK
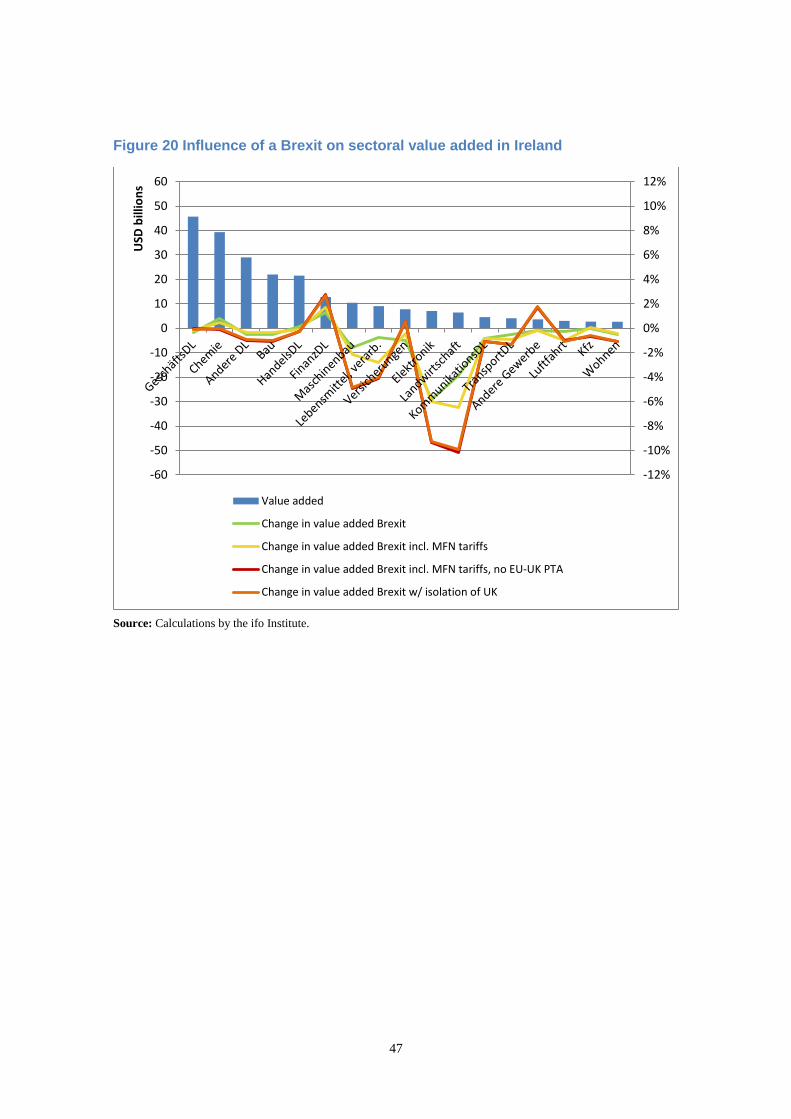
47
Figure 20 Influence of a Brexit on sectoral value added in Ireland
Source: Calculations by the ifo Institute.
-12%
-10%
-8%
-6%
-4%
-2%
0%
2%
4%
6%
8%
10%
12%
-60
-50
-40
-30
-20
-10
0
10
20
30
40
50
60
USD
bill
ion
s
Value added
Change in value added Brexit
Change in value added Brexit incl. MFN tariffs
Change in value added Brexit incl. MFN tariffs, no EU-UK PTA
Change in value added Brexit w/ isolation of UK
48
So how high are the costs of a Brexit for Germany and the EU? Negative welfare effects
were predicted for the world in all the scenarios simulated in this study. These effects
represent a loss ranging between 0.06 and 0.25% of the global real income. Every EU
country would lose from a Brexit. On average, the EU real income would decrease by 0.1
to 0.4% depending on the depth of trade policy cuts. However, far more drastic effects
are anticipated for individual EU countries. For example, the projected welfare losses for
Ireland are even higher than for the UK – about 0.8% real income loss in case of a soft
exit and between 1.9 and 2.7% for a deep cut. Germany lies slightly above the EU average
with welfare losses of between 0.1 and 0.3%.
If we take into account the expected EU free trade agreements in the future, an EU average
of real income gains between 0.7 and 4.7% is expected through already negotiated
agreements and those still in the negotiation phase. If the UK is no longer part of the EU,
the anticipated average gain drops by 0.2 percentage points. This can be traced back
primarily to the negative effects of a UK exit on the other EU nations. Germany
anticipates real income growth of between 0.9 and 5.5% due to the upcoming agreements.
This growth would be lower by about 0.15 percentage points if the UK exits the EU.
Overall, negative effects are expected for all countries through the buildup of trade
barriers resulting from a Brexit. If we add to that the additional contributions to the EU
budget totaling approximately 0.089% of the GNI, a Brexit could be costly not only for
the UK, but for the remaining EU member states as well.
In the next section, we argue that these losses will increase significantly when dynamic
effects of the reduced trade openness are taken into account.
49
7. Dynamic effects
7.1. Dynamic effects of trade (de)integration for the UK and
Germany
The calculations shown above that were made with the help of the ifo trade model are
static. They demonstrate the effects that a Brexit would have on the static efficiency of
the countries under consideration. However, they do not take into account that
international competition, access to foreign markets and international capital mobility can
also strengthen the incentives for businesses and their investment and innovation
activities.20
There is a great body of empirical literature that addresses these effects. The literature
typically finds that globalization strengthens companies’ incentives for investment and
innovation, and therefore can also have an effect on growth rates in addition to staticlevel
effects.21 Another area of the literature uses regression analyses to determine the effects
of trade openness on long-term income per capita. Unlike the ifo model, these do not
assume a specific model structure, but rather specify a purely empirical ad hoc model and
attempt to causally identify the effects of openness. Here we need to consider that
openness can create additional income, but it could be driven itself by growth.
Determining the extent of the causal effect is difficult – unlike a pure correlation. To do
so, we need to examine differences in the openness of countries that are not driven by
economic factors, but instead by geographic conditions, real exogenous shocks (e.g.,
natural disasters) or historical events (e.g., the opening of the Suez Canal).22
To estimate the dynamic effects, we can draw on the results of the empirical ad hoc
models and ask which effects on per capita income can be expected from reducing
openness in addition to the static effects already discussed.
Table 7 shows which overall effects (static plus dynamic effects) on the United
Kingdom’s long-term income can be anticipated based on the results of different
empirical studies. The first and still most prominent study is by Frankel and Romer
(1999). These authors find that increasing the share of openness by 1 percentage point
20 This is symptomatic for the current quantitative trade models; see Costinot und Rodriguez-Clare (2015)
for an overview. The difficulty in taking the dynamic effects into consideration lies in (1) the dimensionality
of this type of dynamic global model, and (2) there is no real agreement in the academic discourse on which
models are the best suited. 21 The study by Bustos (2011) provides one example of this. 22 See Felbermayr and Gröschl (2013) for an overview.
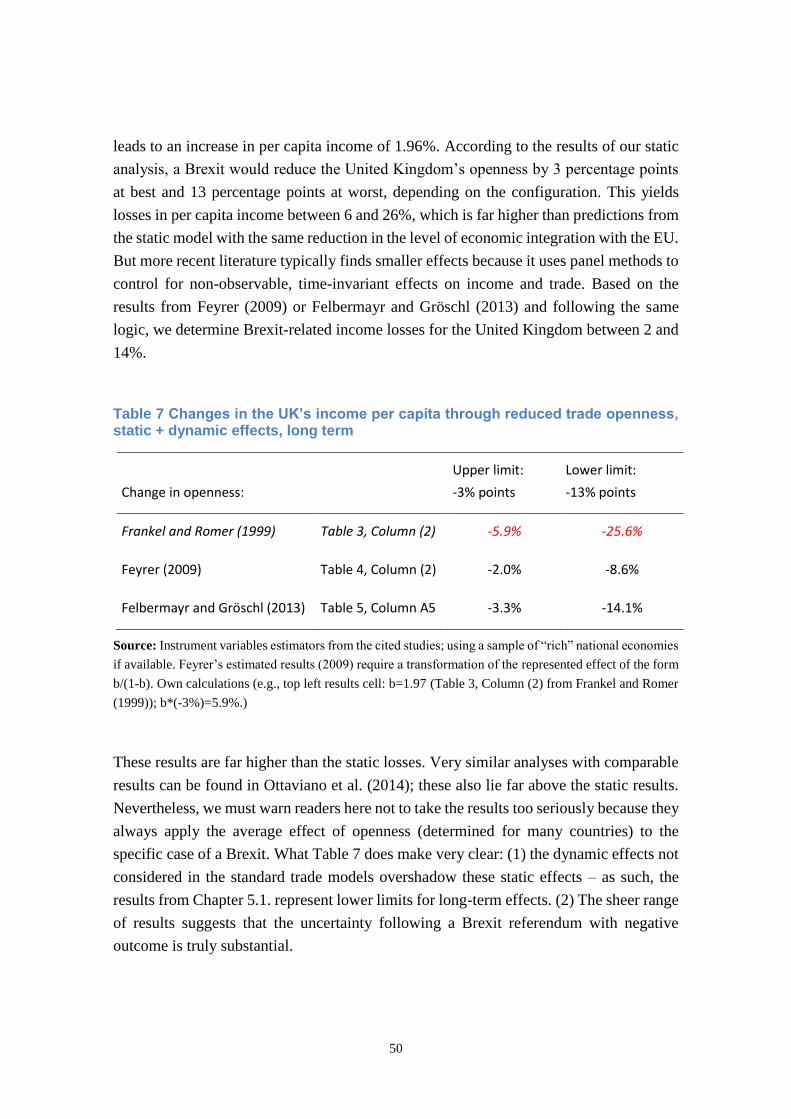
50
leads to an increase in per capita income of 1.96%. According to the results of our static
analysis, a Brexit would reduce the United Kingdom’s openness by 3 percentage points
at best and 13 percentage points at worst, depending on the configuration. This yields
losses in per capita income between 6 and 26%, which is far higher than predictions from
the static model with the same reduction in the level of economic integration with the EU.
But more recent literature typically finds smaller effects because it uses panel methods to
control for non-observable, time-invariant effects on income and trade. Based on the
results from Feyrer (2009) or Felbermayr and Gröschl (2013) and following the same
logic, we determine Brexit-related income losses for the United Kingdom between 2 and
14%.
Table 7 Changes in the UK’s income per capita through reduced trade openness, static + dynamic effects, long term
Change in openness:
Upper limit:
-3% points
Lower limit:
-13% points
Frankel and Romer (1999) Table 3, Column (2) -5.9% -25.6%
Feyrer (2009) Table 4, Column (2) -2.0% -8.6%
Felbermayr and Gröschl (2013) Table 5, Column A5 -3.3% -14.1%
Source: Instrument variables estimators from the cited studies; using a sample of “rich” national economies
if available. Feyrer’s estimated results (2009) require a transformation of the represented effect of the form
b/(1-b). Own calculations (e.g., top left results cell: b=1.97 (Table 3, Column (2) from Frankel and Romer
(1999)); b*(-3%)=5.9%.)
These results are far higher than the static losses. Very similar analyses with comparable
results can be found in Ottaviano et al. (2014); these also lie far above the static results.
Nevertheless, we must warn readers here not to take the results too seriously because they
always apply the average effect of openness (determined for many countries) to the
specific case of a Brexit. What Table 7 does make very clear: (1) the dynamic effects not
considered in the standard trade models overshadow these static effects – as such, the
results from Chapter 5.1. represent lower limits for long-term effects. (2) The sheer range
of results suggests that the uncertainty following a Brexit referendum with negative
outcome is truly substantial.
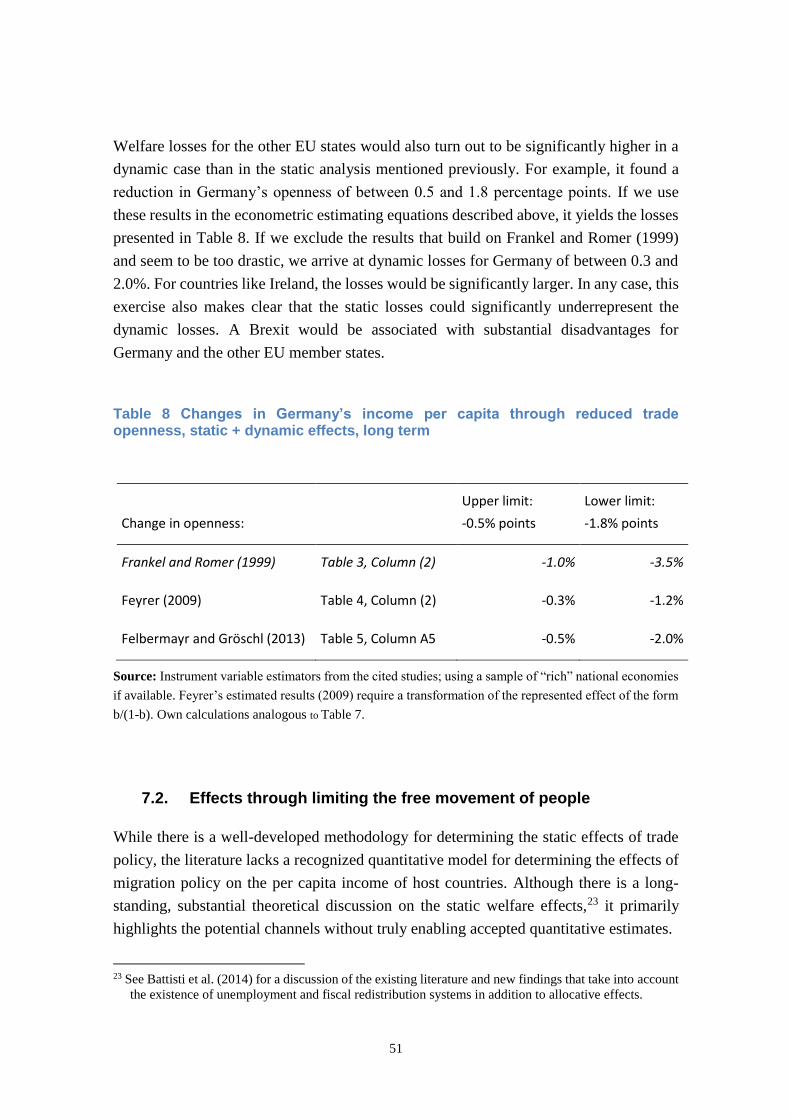
51
Welfare losses for the other EU states would also turn out to be significantly higher in a
dynamic case than in the static analysis mentioned previously. For example, it found a
reduction in Germany’s openness of between 0.5 and 1.8 percentage points. If we use
these results in the econometric estimating equations described above, it yields the losses
presented in Table 8. If we exclude the results that build on Frankel and Romer (1999)
and seem to be too drastic, we arrive at dynamic losses for Germany of between 0.3 and
2.0%. For countries like Ireland, the losses would be significantly larger. In any case, this
exercise also makes clear that the static losses could significantly underrepresent the
dynamic losses. A Brexit would be associated with substantial disadvantages for
Germany and the other EU member states.
Table 8 Changes in Germany’s income per capita through reduced trade openness, static + dynamic effects, long term
Change in openness:
Upper limit:
-0.5% points
Lower limit:
-1.8% points
Frankel and Romer (1999) Table 3, Column (2) -1.0% -3.5%
Feyrer (2009) Table 4, Column (2) -0.3% -1.2%
Felbermayr and Gröschl (2013) Table 5, Column A5 -0.5% -2.0%
Source: Instrument variable estimators from the cited studies; using a sample of “rich” national economies
if available. Feyrer’s estimated results (2009) require a transformation of the represented effect of the form
b/(1-b). Own calculations analogous to Table 7.
7.2. Effects through limiting the free movement of people
While there is a well-developed methodology for determining the static effects of trade
policy, the literature lacks a recognized quantitative model for determining the effects of
migration policy on the per capita income of host countries. Although there is a long-
standing, substantial theoretical discussion on the static welfare effects,23 it primarily
highlights the potential channels without truly enabling accepted quantitative estimates.
23 See Battisti et al. (2014) for a discussion of the existing literature and new findings that take into account
the existence of unemployment and fiscal redistribution systems in addition to allocative effects.
52
Immigration can be advantageous for the domestic population because immigrants’
contribution to the value of production is typically higher than their compensation. For
example, in addition to their own income, they also generate income for domestic owners
of property and private capital. Moreover, immigration can fill gaps in the labor market
and a better-functioning labor market can mean higher wages and employment rates for
domestic workers. Add to that the dynamic effects: A growing and structurally younger
population increases the incentives for process and product innovations, and a more
diverse workforce could make innovative systems more efficient. However, a lack of
wage flexibility can make immigration lead to unemployment. Furthermore, generous
and progressive social systems can draw low-income immigrants in particular, who then
cause increased costs for the social systems.
Empirical evidence is inconclusive on the issue of whether immigrants are net recipients
or net contributors to the coffers of government redistribution systems. Dustmann and
Frattini (2013) found that immigrants provide a positive fiscal contribution for the United
Kingdom – quite the opposite of frequently claimed assumptions to the contrary.
However, there is a great deal of uncertainty on how public goods and services should be
taken into consideration, since they are financed with progressive taxation, but are used
equally by all residents of the country. But even Battisti et al. (2014), who make rather
pessimistic assumptions, and the other effects of immigration mentioned above that took
into account the existence of unemployment, did not find that the most recent waves of
immigration were detrimental to the United Kingdom. In any case, the effects were very
minimal for the local population. In order to complete a quantitative estimate of possible
effects on per capita income, we can proceed in a fashion similar to when calculating the
dynamic trade effects. Felbermayr et al. (2010) utilize econometric methods to estimate
the effect of a change in immigrant numbers on the per capita income of a host country.
The challenge for this study also lies in ensuring the causal direction. Immigration may
have an effect on per capita income in the host country, but it is also driven to a high
degree by incomes in the host country. The instrumental variable estimators used here yet
again show a high degree of uncertainty, but they indicate very consistently the positive
effects of immigration on per capita income.
Table 9 uses these results to estimate the effect that a decline in immigrant numbers from
the EU could have on the United Kingdom, and specifically on per capita income there.
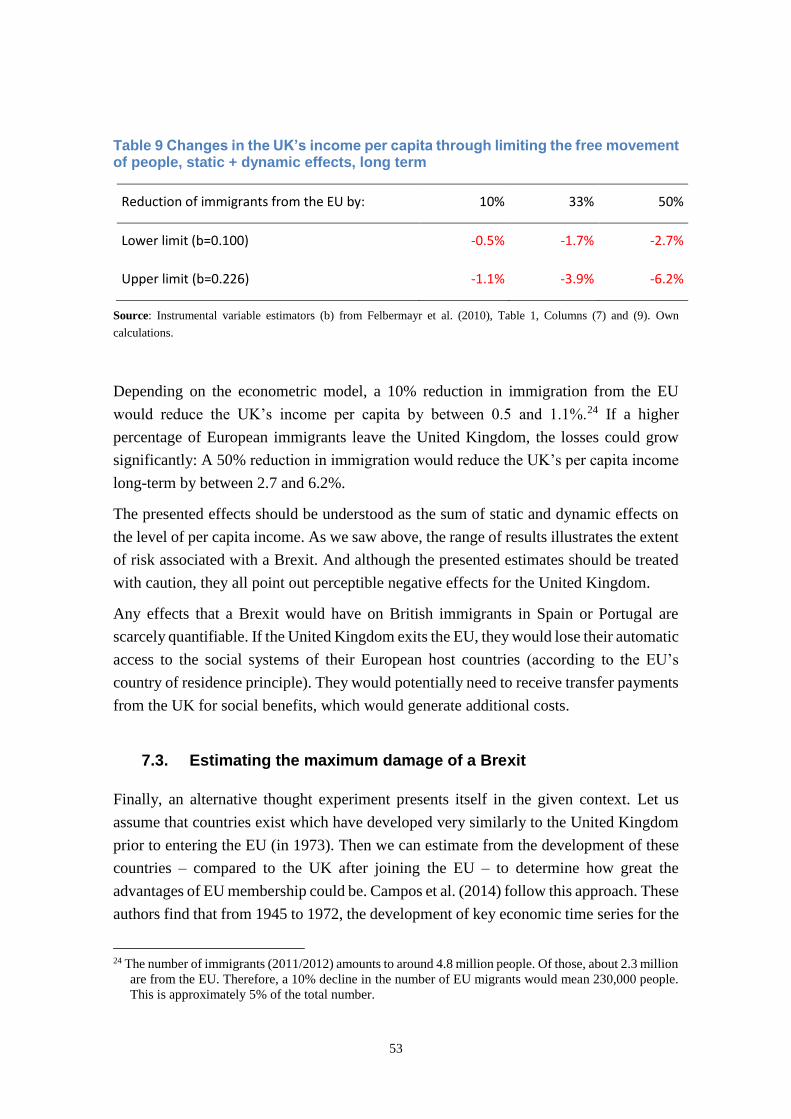
53
Table 9 Changes in the UK’s income per capita through limiting the free movement of people, static + dynamic effects, long term
Reduction of immigrants from the EU by: 10% 33% 50%
Lower limit (b=0.100) -0.5% -1.7% -2.7%
Upper limit (b=0.226) -1.1% -3.9% -6.2%
Source: Instrumental variable estimators (b) from Felbermayr et al. (2010), Table 1, Columns (7) and (9). Own
calculations.
Depending on the econometric model, a 10% reduction in immigration from the EU
would reduce the UK’s income per capita by between 0.5 and 1.1%.24 If a higher
percentage of European immigrants leave the United Kingdom, the losses could grow
significantly: A 50% reduction in immigration would reduce the UK’s per capita income
long-term by between 2.7 and 6.2%.
The presented effects should be understood as the sum of static and dynamic effects on
the level of per capita income. As we saw above, the range of results illustrates the extent
of risk associated with a Brexit. And although the presented estimates should be treated
with caution, they all point out perceptible negative effects for the United Kingdom.
Any effects that a Brexit would have on British immigrants in Spain or Portugal are
scarcely quantifiable. If the United Kingdom exits the EU, they would lose their automatic
access to the social systems of their European host countries (according to the EU’s
country of residence principle). They would potentially need to receive transfer payments
from the UK for social benefits, which would generate additional costs.
7.3. Estimating the maximum damage of a Brexit
Finally, an alternative thought experiment presents itself in the given context. Let us
assume that countries exist which have developed very similarly to the United Kingdom
prior to entering the EU (in 1973). Then we can estimate from the development of these
countries – compared to the UK after joining the EU – to determine how great the
advantages of EU membership could be. Campos et al. (2014) follow this approach. These
authors find that from 1945 to 1972, the development of key economic time series for the
24 The number of immigrants (2011/2012) amounts to around 4.8 million people. Of those, about 2.3 million
are from the EU. Therefore, a 10% decline in the number of EU migrants would mean 230,000 people.
This is approximately 5% of the total number.
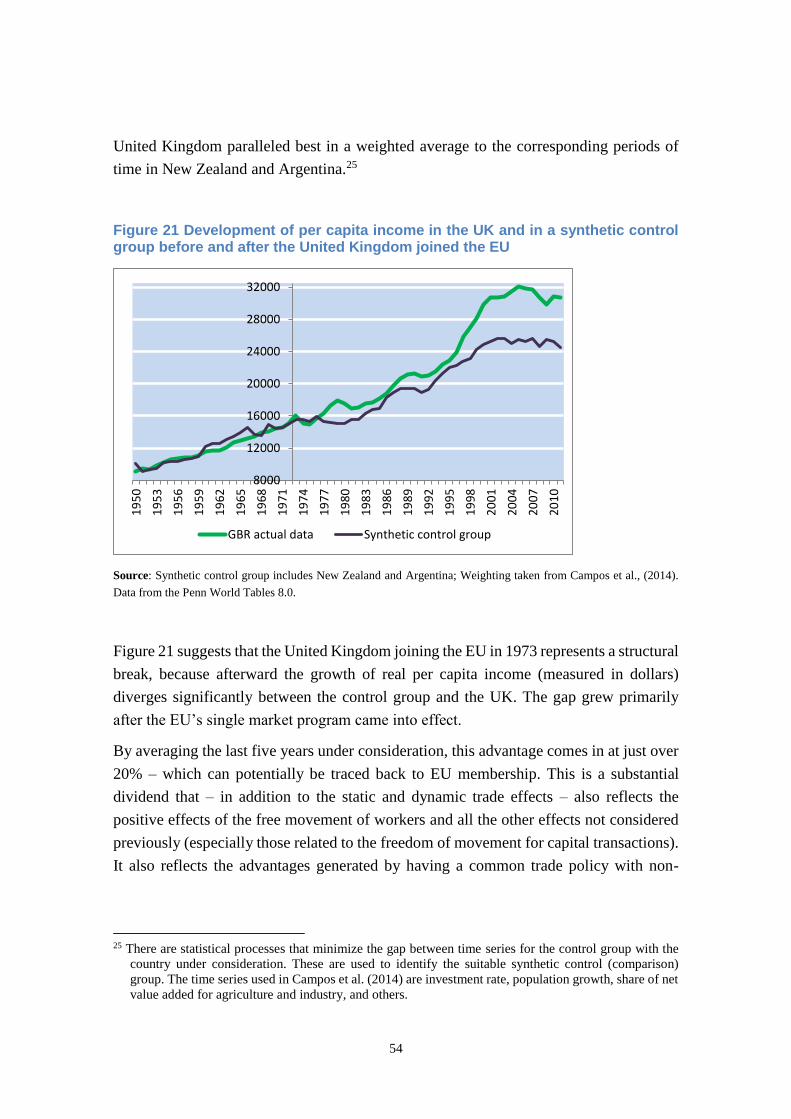
54
United Kingdom paralleled best in a weighted average to the corresponding periods of
time in New Zealand and Argentina.25
Figure 21 Development of per capita income in the UK and in a synthetic control group before and after the United Kingdom joined the EU
Source: Synthetic control group includes New Zealand and Argentina; Weighting taken from Campos et al., (2014).
Data from the Penn World Tables 8.0.
Figure 21 suggests that the United Kingdom joining the EU in 1973 represents a structural
break, because afterward the growth of real per capita income (measured in dollars)
diverges significantly between the control group and the UK. The gap grew primarily
after the EU’s single market program came into effect.
By averaging the last five years under consideration, this advantage comes in at just over
20% – which can potentially be traced back to EU membership. This is a substantial
dividend that – in addition to the static and dynamic trade effects – also reflects the
positive effects of the free movement of workers and all the other effects not considered
previously (especially those related to the freedom of movement for capital transactions).
It also reflects the advantages generated by having a common trade policy with non-
25 There are statistical processes that minimize the gap between time series for the control group with the
country under consideration. These are used to identify the suitable synthetic control (comparison)
group. The time series used in Campos et al. (2014) are investment rate, population growth, share of net
value added for agriculture and industry, and others.
8000
12000
16000
20000
24000
28000
32000
19
50
19
53
19
56
19
59
19
62
19
65
19
68
19
71
19
74
19
77
19
80
19
83
19
86
19
89
19
92
19
95
19
98
20
01
20
04
20
07
20
10
GBR actual data Synthetic control group
55
member states. The number indicates the magnitude of losses that could arise for the
United Kingdom through a Brexit.
7.4. Comparison with other studies
A whole series of studies discuss the political and legal aspects of a Brexit (for example,
see House of Commons, 2013). However, only two studies attempt to quantify the
Brexit’s consequences. One study by the Centre for Economic Performance (CEP) at the
LSE London (Ottaviano et al., 2014) also uses a quantitative trade model and finds effects
of a similar magnitude to this study. The projected income cuts for the UK range between
1.1% in the optimistic scenario to nearly 10% in the most pessimistic scenario. In contrast
to this study, Ottaviano et al. (2014) apply assumptions about trade cost reductions based
on expert estimates and present effects solely for the United Kingdom. Another difference
is that all the scenarios assume that future trade costs within the EU will be further reduced
due to additional lowering of non-tariff barriers to trade. Trade cost reductions between
5 and 10% are assumed here, which the UK would be unable to realize should it exit the
EU. The future of trade policy with other countries is not modeled in this study. In the
“optimistic” scenario, the study assumes that the UK will receive a status like the EFTA
nations. This would lead to a 0.4% decline in real income and another 1.26% in losses
from foregone NTM reductions within the EU in the future. The total losses of 1.66%
must be offset against the elimination of the UK’s net contribution to the EU (0.53%
higher income26). In the “pessimistic” CEP scenario, the UK loses circa 3.1% of its real
income.27 The authors see their quantitative results as the lower limit, because effects
from migration and other dynamic effects such as increased productivity through trade or
availability of a greater palette of products are not taken into account. Empirical
estimations are used to estimate the dynamic effects. Income losses in the “optimistic”
scenario double to around 2%, and worsen to between 6.3 and 9.5% in the “pessimistic”
scenario.
A study by Open Europe (Persson et al. 2015) arrives at a more positive assessment of a
Brexit. If a Brexit does occur, forecasts for the United Kingdom’s GDP in 2030 range
between a reduction of 2.2% and an increase of 1.6%. However, the “best case” scenario
(1.6% increase), which would lead to considerable gains for the UK, assumes that the
26 Ottaviano et al. (2014) use estimates from HM Treasury (2013) for their calculation. 27 This effect on the UK's real income is determined as follows: 0.14% +0.93% real income loss through
the increase of tariffs and NTMs, 2.55% loss due to foregone NTM reductions within the EU in the
future, minus the elimination of the net contribution to the EU totaling 0.53% of the GNI.
56
United Kingdom will open its trade policy unilaterally to all countries after exiting the
EU, implement deregulation policy at home and negotiate a free trade agreement with the
EU. By contrast, the “worst case” scenario (-2.2%) assumes that the UK will not negotiate
a free trade agreement with the EU and is unable to renegotiate free trade agreements with
other countries. The report assesses both scenarios as politically unrealistic and estimates
income effects of -0.8 to 0.6% as politically realistic. But positive effects on British
welfare are only predicted if the UK can negotiate a free trade agreement with the EU and
at the same time successfully pursue a policy of deregulation and trade liberalization with
all other countries. It does not take into account that these positive effects can also be
enjoyed as an EU member, for example if the EU concludes a trade agreement with the
USA.
57
8. Closing comments and solution options
In his election platform back in 1997, Tony Blair highlighted three options for the United
Kingdom: (1) exiting the EU, (2) carrying on as before – “from the sidelines,” and (3)
taking on an active and reformist leadership role in Europe. Blair pursued option (3);
however, the long-term result of his efforts is more aligned with option (2). It is likely
that a solution will be waiting at the end of this ongoing process that resembles option
(2), even if many signs currently point to a Brexit.
The results of this study suggest this conclusion because the economic costs of a Brexit
could potentially be substantial for the United Kingdom, and reorganizing all the
country’s foreign economic relationships – not just with EU members, but also with third-
party nations that have trade agreements with the EU – entails a high degree of difficult-
to-predict risks. Also, other EU members – especially Ireland, but also Germany –
would suffer from a Brexit. There must be a solution to the conflict that is better for
everyone involved than a Brexit, which would burn all the bridges. A compromise, or at
least a “soft exit” as defined above, would be painful for everyone perhaps, but is still
better than the United Kingdom drifting off into economic policy isolation.
Where could Europe compromise with the United Kingdom? There are many
opportunities here, which could potentially even open up new options for the EU. For
example, other EU member states also have concerns regarding the country of residence
principle as it is practiced and applied to the free movement of people. After a relatively
short transitional period, all immigrants (including the unemployed) are integrated into
the host country’s social systems. We could solve the particularly controversial issue of
immigration by applying the country of origin principle to unemployed immigrants
– then the migrants would remain integrated in their home country’s social system.
Migration that is only motivated by the opportunity to exploit differences in the generosity
of systems and does not promote economic welfare would no longer take place.28 This
would also be in the interest of Germany and France.
There is also the opportunity to compromise with the UK by implementing an upper limit
for its contribution to the EU budget. In recent years, the net contribution has grown
considerably due primarily to weak growth in the euro zone. This represents a second
crucial topic of debate after the immigration issue. For example, a net contribution limit
of 0.30% of the GDP would be conceivable and would correspond to the average of the
last few years. The cost of such a compromise would have to be borne by the other
28 For example, see Sinn (2004).

58
member states, but it would only be a fraction of the fiscal costs that would arise from the
complete elimination of the UK’s net contribution if a Brexit should occur.
After all, having the United Kingdom remain in the EU would certainly be helpful in
promoting the quick conclusion of a free trade agreement with the USA. The UK has
long had a special relationship with the United States and this would render unnecessary
the United Kingdom’s choice of striving exclusively for deep economic integration with
either Continental Europe or the USA.
59
Bibliography
Aichele, R; Felbermayr, G. & Heiland, I.: “Going deep: The Trade and Welfare Effects
of TTIP,” CESifo Working Paper, No. 5150, 2014.
Battisti, M.; Felbermayr, G.; Peri, G.; Poutvaara; P., “Immigration, Search, and
Redistribution: A Quantitative Assessment of Native Welfare,” NBER Working Paper
No. 20131, 2014.
Bustos, P., “Trade Liberalization, Exports and Technology Upgrading: Evidence on the
impact of MERCOSUR on Argentinian Firms,” American Economic Review, 101 (1),
304-340, 2011.
Campos, N.F.; Coricelli, F.: “Why did Britain join the EU? A new insight from economic
history,” VoxEU, February 3, 2015.
Campos, N.; F. Coricelli; L. Moretti, “Economic Growth and Political Integration:
Estimating the Benefits from Membership in the European Union Using the Synthetic
Counterfactuals Method,” IZA Disussion Paper 8162, 2014.
Costinot, A.; Rodriguez-Clare, A., “Trade Theory with Numbers: Quantifying the
Consequences of Globalization,” Handbook of International Economics, Vol. 4, Ch. 4,
Gita Gopinath, Elhanan Helpman, and Kenneth Rogoff (Publisher), 2014.
Dustmann, C.; Frattini, T., “The Fiscal Effects of Immigration to the UK.” CREM
Discussion Paper 22/13, 2013.
Felbermayr, G., Hiller, S., Sala, D., “Does Immigration boost Per Capita Income?”
Economics Letters 107: 177-179, 2010.
Felbermayr, G.; Gröschl, J., “Natural Disasters and the Effect of Trade on Income: A New
Panel IV Approach,” European Economic Review 58, 18-30, 2013.
Feyrer, J., “Trade and Income – Exploiting Time Series in Geography,” NBER Working
Paper 14910, 2009.
Frankel, J.; Romer, D., “Does Trade Cause Growth,” American Economic Review 98(3):
379-399, 1999.
Gowland, D.; und Turner, I.: “Reluctant Europeans: Britain and European Integration
1945-1998,” Routledge, 1999.
HM Treasury: “European Union Finances 2013,” 2013
HM Treasury: “European Union Finances 2014,” 2014
60
House of Commons: “Leaving the EU,” House of Commons Library Research Paper No.
13/42, 2013
House of Commons: “The future of the European Union: UK Government policy,” House
of Commons Foreign Affairs Committee First Report, Volume I, 2013a
Jung, B.; “Gradualism and Dynamic Trade Adjustment: Revisiting the Pro-Trade Effect
of Free Trade Agreements,” Economics Letters 115: 63-66, 2012.
Persson, M; Ruparel, R.; Swidlicki, P.; Booth S. & Howarth C.: “What if...? The
Consequences, challenges & opportunities facing Britain outside EU,” Open Europe
Report No. 03/2015, 2015
Ottaviano, G.; Pessoa, J. P.; Sampson, T. & Reenen, J. V.: “Brexit or Fixit? The Trade
and Welfare Effects of Leaving the European Union,” LSE Center for Economic
Performance, Working Paper No. CEPPA016, 2014
Ottaviano, G. I. P.; Pessoa, J. P.; Sampson, T. & van Reenen, J.: “The Costs and Benefits
of Leaving the EU,” CFS Working Paper No. 472, 2014
Sapir, A., “European Integration at the Crossroads: A Review Essay on the 50th
Anniversary of Bela Balassa’s Theory of Economic Integration,” Journal of Economic
Literature 49(4): 1200-1229, 2011.
Perisic, B., “Britain and Europe: A History of Difficult Relations,” Institute for Cultural
Diplomacy, Berlin, 2010.
Sinn, H.-W., “Social Union, Migration and the Constitution: Integration at Risk,” CES-
ifo Forum 5 (3), 04-11, 2004.

Imprint
© 2015 Bertelsmann Stiftung
Bertelsmann Stiftung
Carl-Bertelsmann-Straße 256
33311 Gütersloh
www.bertelsmann-stiftung.de
Responsible
Dr. Ulrich Schoof
Editing
Sibylle Reiter
Cover Design
Nicole Meyerholz, Bielefeld
Picture
Kaonos – Shutterstock.com
www.bertelsmann-stiftung.de
Adresse | Kontakt
Bertelsmann Stiftung
Carl-Bertelsmann-Straße 256
33311 Gütersloh
GED-Team
Programm Nachhaltig Wirtschaften
Telefon +49 5241 81-81353
www.ged-project.de