Embed Size (px)
Citation preview
Cott to Acquire Eden Springs
Expanding Our Home and Office Delivery Business and Platforms
Safe Harbor Statements
1
Forward Looking Statements: This presentation contains forward-looking statements within the meaning of Section 27A of the Securities Act of 1933, Section 21E of the Securities Exchange Act of 1934 and applicable Canadian securities laws conveying management's expectations as to the future based on plans, estimates and projections at the time the Company makes the statements. Forward-looking statements involve inherent risks and uncertainties and the Company cautions you that a number of important factors could cause actual results to differ materially from those contained in any such forward-looking statement. The forward-looking statements contained in this presentation include, but are not limited to, statements related to the anticipated timing of the transaction, the completion of the transaction on the terms proposed, the financing of the transaction on terms currently anticipated, and the potential impact the acquisition will have on the Company. Management believes these assumptions to be reasonable but there is no assurance that they will prove to be accurate. Factors that could cause actual results to differ materially from those described in this presentation include, among others: (1) the ability to consummate the proposed transaction; (2) receipt of regulatory approvals without unexpected delays or conditions; (3) changes in estimates of future earnings and cash flows; (4) changes in expectations as to the closing of the transaction; (5) expected synergies and cost savings are not achieved or achieved at a slower pace than expected; (6) integration problems, delays or other related costs; (7) retention of customers and suppliers; (8) the cost of capital necessary to finance the transaction; and (9) unanticipated changes in laws, regulations, or other industry standards affecting the companies. The foregoing list of factors is not exhaustive. Readers are cautioned not to place undue reliance on these forward-looking statements, which speak only as of the date hereof. Readers are urged to carefully review and consider the various disclosures, including but not limited to risk factors contained in the Company's Annual Report in the Form 10-K for the year ended January 2, 2016. The Company does not, except as expressly required by applicable law, undertake to update or revise any of these statements in light of new information or future events.
Non-GAAP Measures: The Company utilizes certain non-GAAP financial measures, including 2016 estimated Eden Springs adjusted EBITDA, to separate the impact of certain items from the underlying Eden Springs business. Management believes this supplemental information is useful to investors for their independent evaluation and understanding of the transaction with Eden Springs. Additionally, the Company supplements its reporting of net cash provided by (used in) operating activities determined in accordance with GAAP by excluding capital expenditures to present, free cash flow (on a stand-alone and pro forma basis), and by excluding acquisition, integration and transaction costs to present adjusted free cash flow (on a stand-alone and pro forma basis), which management believes provides useful information to investors. With respect to our expectations of performance of Eden as it is being integrated, reconciliations of free cash flow accretion and adjusted free cash flow accretion are not available, as we are unable to quantify certain amounts that would be required to be included in the relevant GAAP measures without unreasonable effort. We expect that the unavailable reconciling items, which primarily include foreign exchange impact, interest costs associated with yet to be issued debt and phasing of capex, could significantly affect our financial results. These items depend on highly variable factors and any such reconciliations would imply a degree of precision that would be confusing or misleading to investors. We expect the variability of these factors to have a significant, and potentially unpredictable, impact on our future GAAP financial results. The non-GAAP financial measures described above are in addition to, and not meant to be considered superior to, or a substitute for, the Company’s financial statements prepared in accordance with GAAP. In addition, the non-GAAP financial measures included in this presentation reflect management's judgment of particular items, and may be different from, and therefore may not be comparable to, similarly titled measures reported by other companies. A reconciliation of these non-GAAP measures may be found on www.cott.com.

Today’s Management Attendees
2
Jerry FowdenChief Executive Officer
Jay WellsChief Financial Officer
Tom HarringtonChief Executive Officer – DS Services
Jarrod LanghansHead of Investor Relations
Q&A
Strategic Rationale and Transaction Overview
Introduction
Today’s Agenda
3
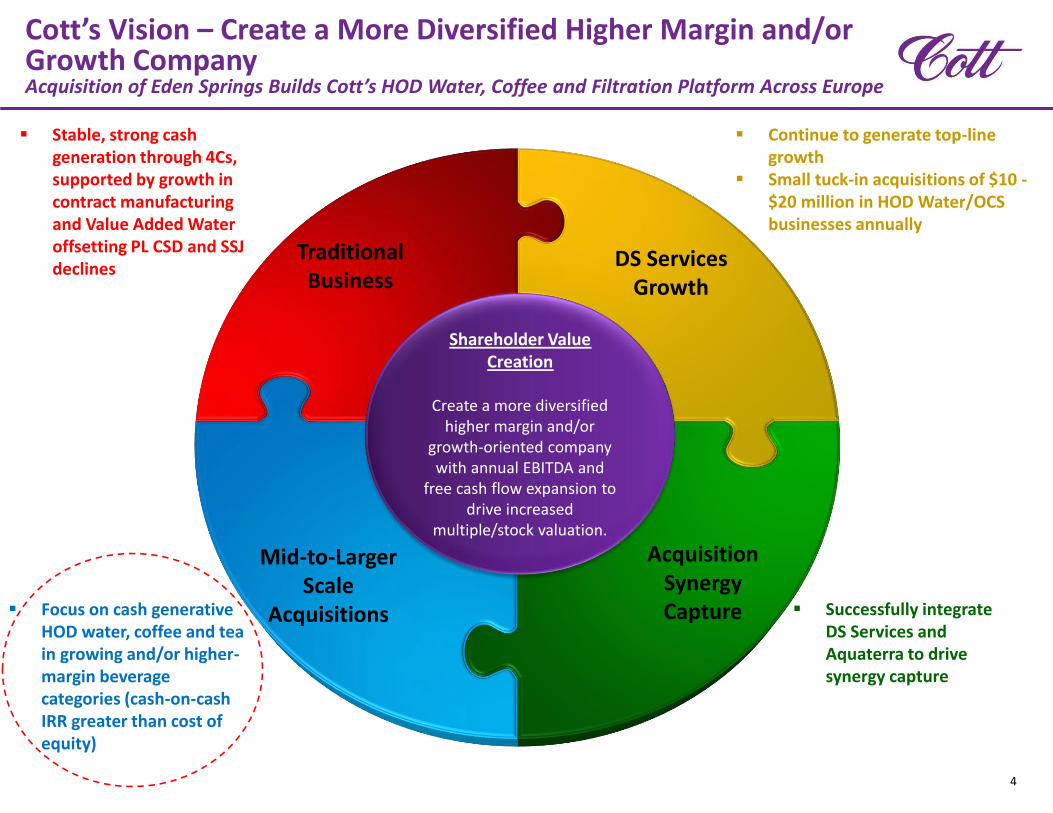
Successfully integrate DS Services and Aquaterra to drive synergy capture
Stable, strong cash generation through 4Cs, supported by growth in contract manufacturing and Value Added Water offsetting PL CSD and SSJ declines
Continue to generate top-line growth
Small tuck-in acquisitions of $10 -$20 million in HOD Water/OCS businesses annually
DS Services Growth
Acquisition Synergy Capture
Mid-to-Larger Scale
Acquisitions
Traditional Business
Focus on cash generative HOD water, coffee and tea in growing and/or higher-margin beverage categories (cash-on-cash IRR greater than cost of equity)
Shareholder Value Creation
Create a more diversified higher margin and/or
growth-oriented company with annual EBITDA and
free cash flow expansion to drive increased
multiple/stock valuation.
Cott’s Vision – Create a More Diversified Higher Margin and/or Growth CompanyAcquisition of Eden Springs Builds Cott’s HOD Water, Coffee and Filtration Platform Across Europe
4
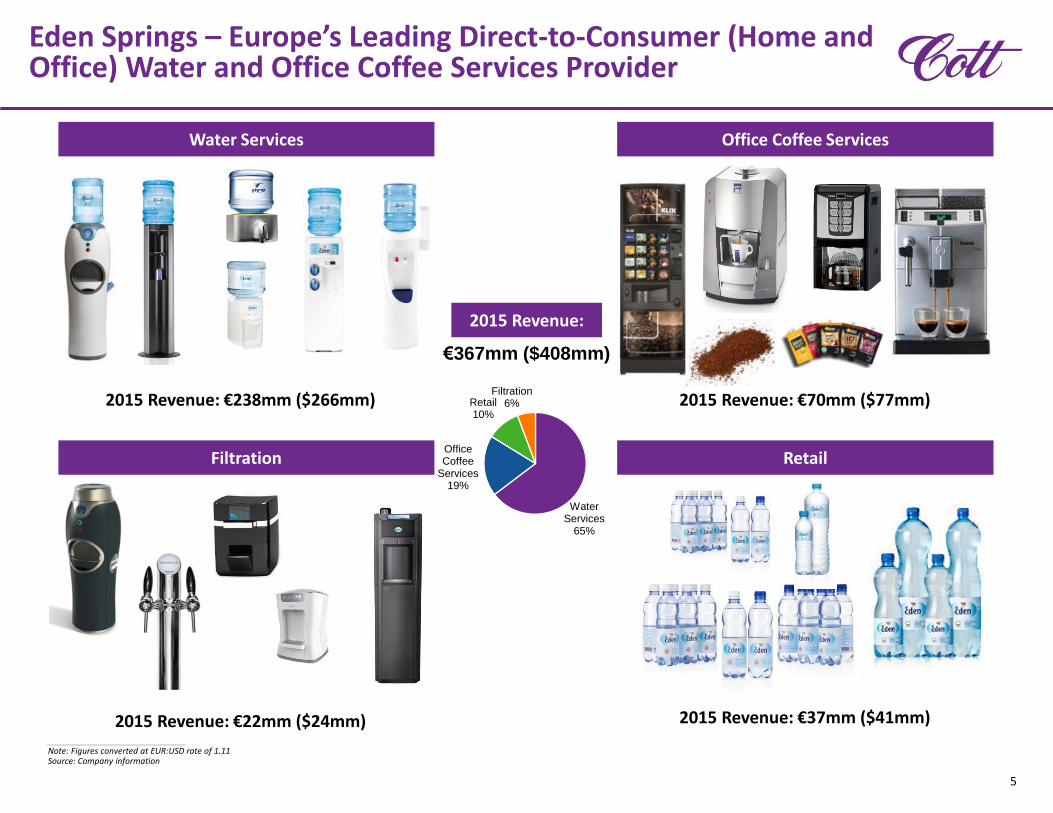
Eden Springs – Europe’s Leading Direct-to-Consumer (Home and Office) Water and Office Coffee Services Provider
2015 Revenue: €238mm ($266mm)
Water Services Office Coffee Services
2015 Revenue: €70mm ($77mm)
Filtration
2015 Revenue: €22mm ($24mm)
Retail
2015 Revenue: €37mm ($41mm) ___________________________Note: Figures converted at EUR:USD rate of 1.11 Source: Company information
5
2015 Revenue:
€367mm ($408mm)
Water Services
65%
Office Coffee
Services19%
Retail10%
Filtration6%
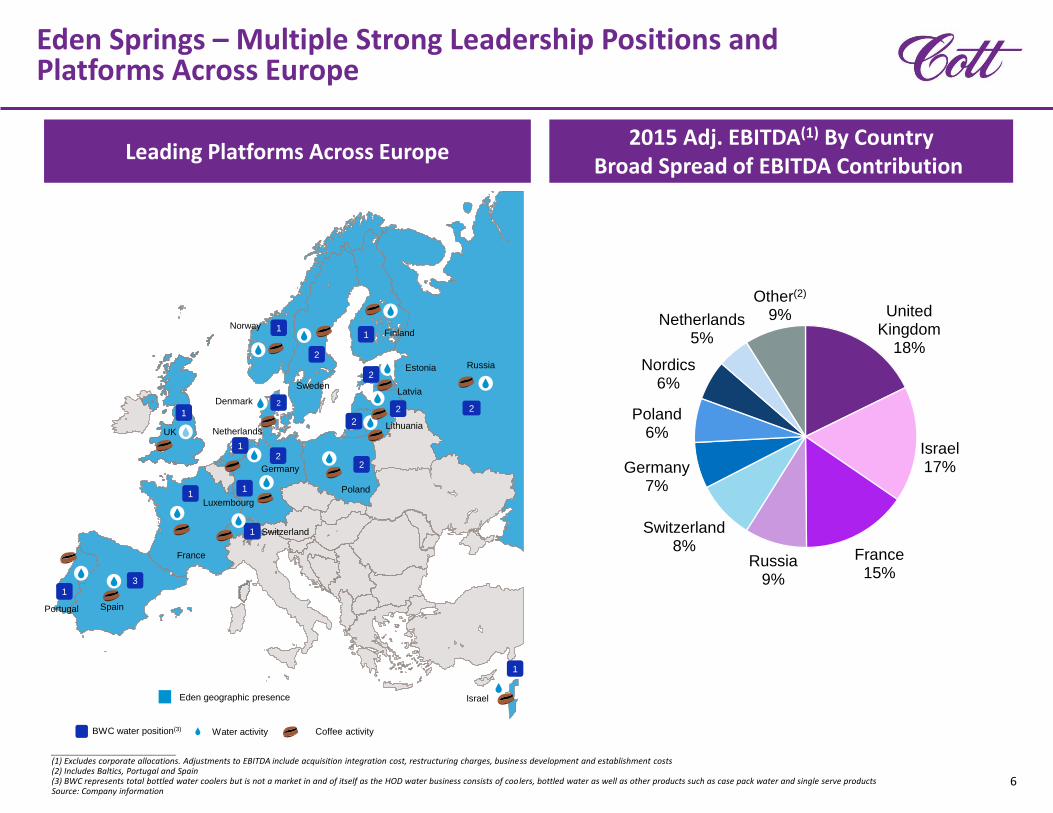
United Kingdom
18%
Israel17%
France15%
Russia9%
Switzerland8%
Germany7%
Poland6%
Nordics6%
Netherlands5%
Other(2)
9%
Eden Springs – Multiple Strong Leadership Positions and Platforms Across Europe
6
Leading Platforms Across Europe
3
1
1
1
1
1
12
2
2
2
11
2
1
2
2
2
Portugal Spain
France
Switzerland
Germany
UK Netherlands
Denmark
Norway
Sweden
Finland
Estonia
Latvia
Lithuania
Russia
IsraelEden geographic presence
BWC water position(3) Water activity Coffee activity
2015 Adj. EBITDA(1) By CountryBroad Spread of EBITDA Contribution
___________________________(1) Excludes corporate allocations. Adjustments to EBITDA include acquisition integration cost, restructuring charges, business development and establishment costs (2) Includes Baltics, Portugal and Spain(3) BWC represents total bottled water coolers but is not a market in and of itself as the HOD water business consists of coolers, bottled water as well as other products such as case pack water and single serve productsSource: Company information
Poland
Luxembourg
7
31
1
1
1
12
2
2
11
2
1
2
Portugal Spain
France Switzerland
Germany
UK Netherlands
Denmark
Norway
Sweden
Finland
Estonia
Latvia
Russia
Israel
Eden geographic presence
BWC water position(1)
1
1
1
1
1
1
1
1
1
1
1
1
1
2
2
2
2
2
3
3
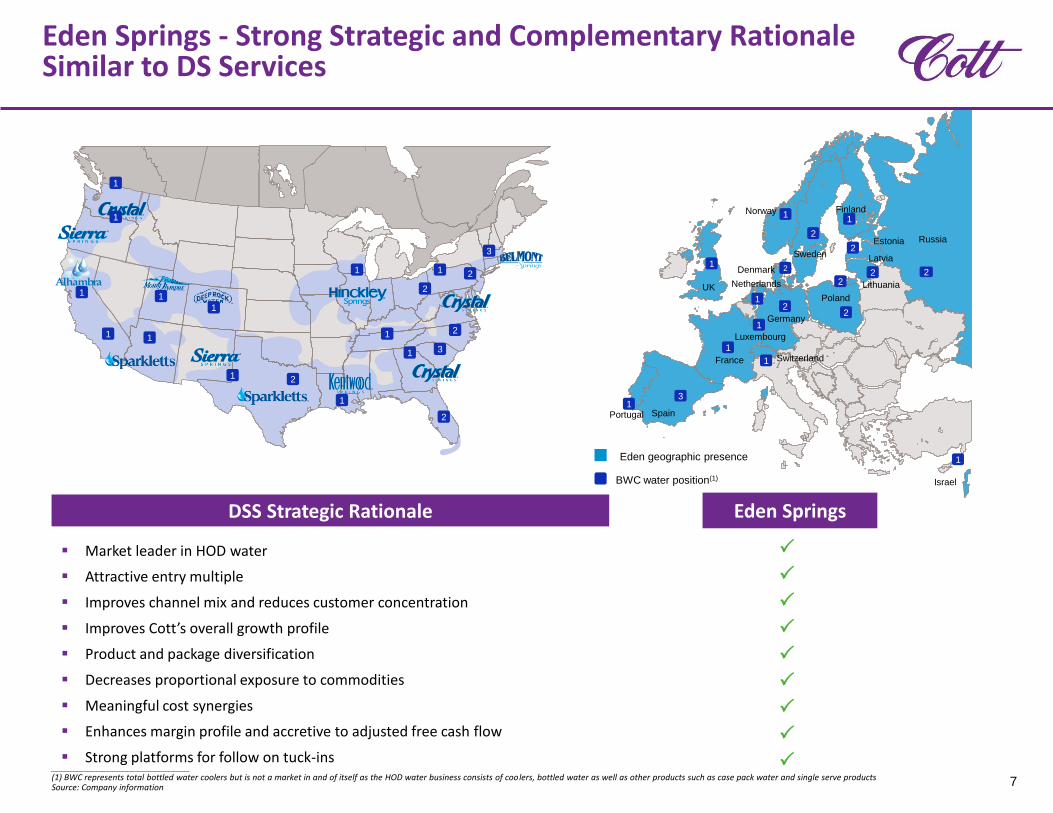
___________________________(1) BWC represents total bottled water coolers but is not a market in and of itself as the HOD water business consists of coolers, bottled water as well as other products such as case pack water and single serve productsSource: Company information
Eden Springs - Strong Strategic and Complementary Rationale Similar to DS Services
DSS Strategic Rationale
Market leader in HOD water
Attractive entry multiple
Improves channel mix and reduces customer concentration
Improves Cott’s overall growth profile
Product and package diversification
Decreases proportional exposure to commodities
Meaningful cost synergies
Enhances margin profile and accretive to adjusted free cash flow
Strong platforms for follow on tuck-ins
Eden Springs
2
Poland
2
Luxembourg
Lithuania
2
1
Q&A
Strategic Rationale and Transaction Overview
Introduction
Today’s Agenda
8
Cott’s Eden Springs Transaction Overview and Strategic Rationale
9
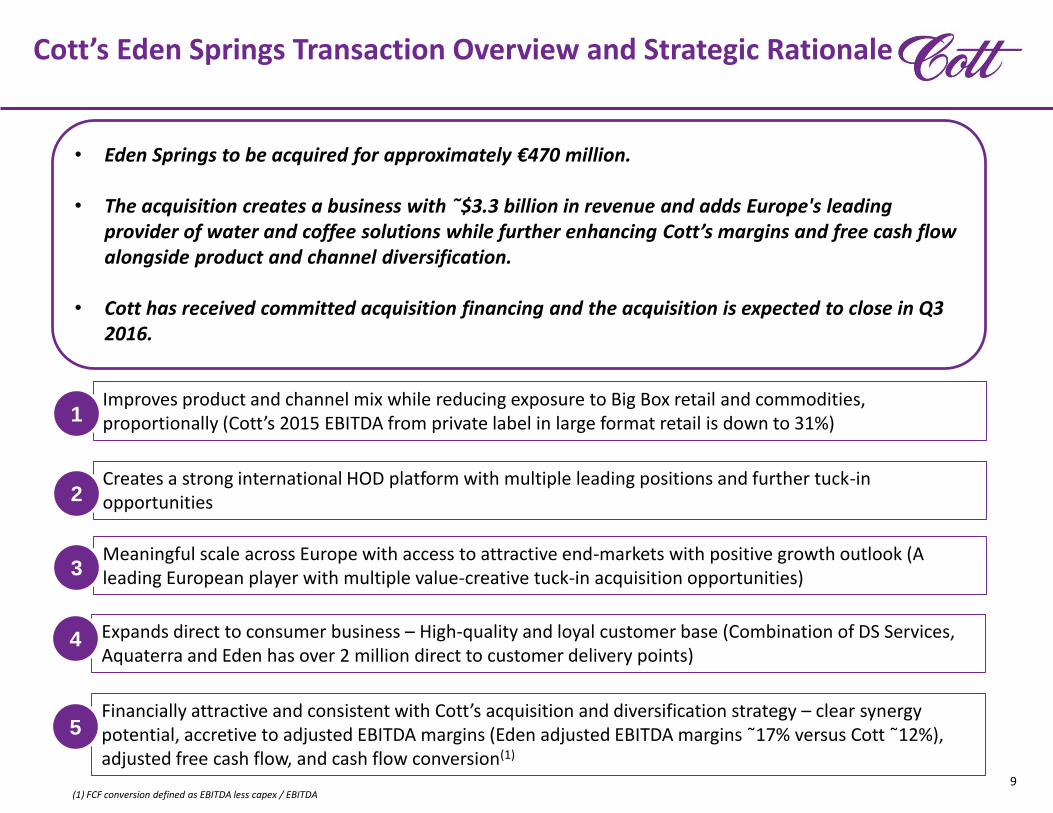
Improves product and channel mix while reducing exposure to Big Box retail and commodities, proportionally (Cott’s 2015 EBITDA from private label in large format retail is down to 31%)1
Creates a strong international HOD platform with multiple leading positions and further tuck-in opportunities 2
Meaningful scale across Europe with access to attractive end-markets with positive growth outlook (A leading European player with multiple value-creative tuck-in acquisition opportunities)3
Financially attractive and consistent with Cott’s acquisition and diversification strategy – clear synergy potential, accretive to adjusted EBITDA margins (Eden adjusted EBITDA margins ῀17% versus Cott ῀12%), adjusted free cash flow, and cash flow conversion(1)
5
Expands direct to consumer business – High-quality and loyal customer base (Combination of DS Services, Aquaterra and Eden has over 2 million direct to customer delivery points)
4
• Eden Springs to be acquired for approximately €470 million.
• The acquisition creates a business with ῀$3.3 billion in revenue and adds Europe's leading provider of water and coffee solutions while further enhancing Cott’s margins and free cash flow alongside product and channel diversification.
• Cott has received committed acquisition financing and the acquisition is expected to close in Q3 2016.
(1) FCF conversion defined as EBITDA less capex / EBITDA
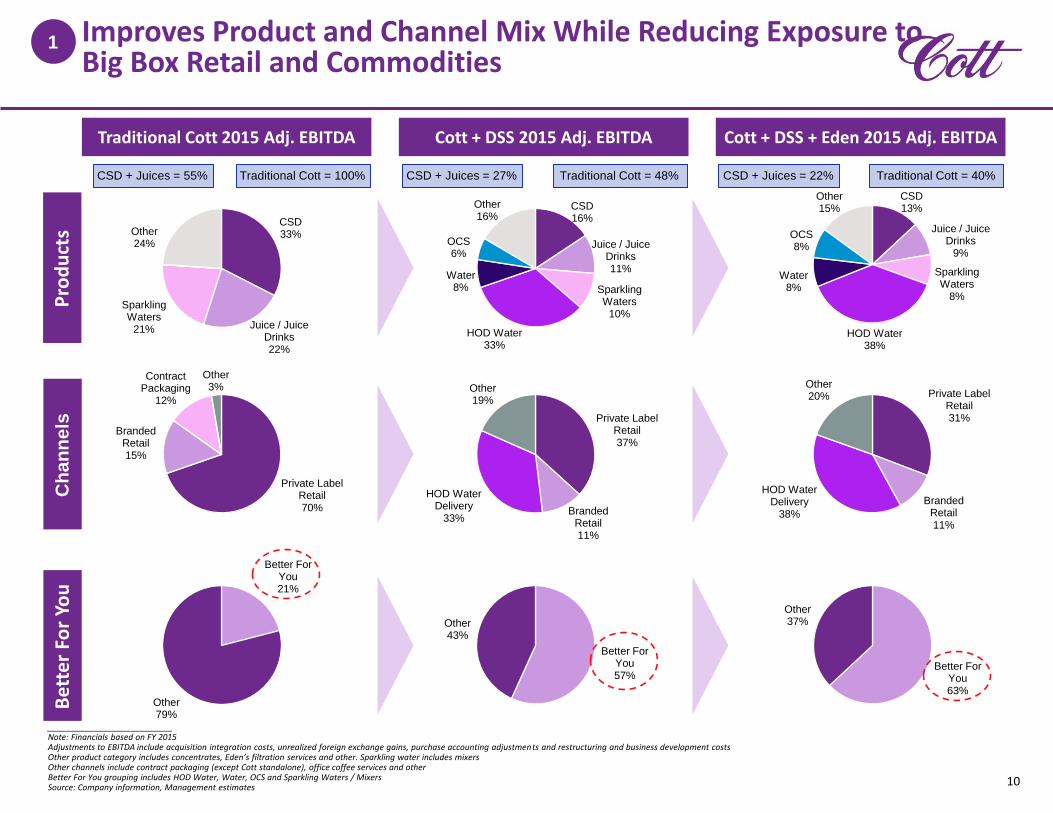
CSD16%
Juice / Juice Drinks11%
Sparkling Waters
10%
HOD Water33%
Water8%
OCS6%
Other16%
CSD33%
Juice / Juice Drinks22%
Sparkling Waters
21%
Other24%
Better For You57%
Other43%
Better For You21%
Other79%
CSD13%
Juice / Juice Drinks
9%
Sparkling Waters
8%
HOD Water38%
Water8%
OCS8%
Other15%
Ch
an
ne
lsB
ette
r Fo
r Yo
u
Traditional Cott 2015 Adj. EBITDA Cott + DSS 2015 Adj. EBITDA Cott + DSS + Eden 2015 Adj. EBITDA
Improves Product and Channel Mix While Reducing Exposure to Big Box Retail and Commodities
10
Pro
du
cts
Better For You63%
Other37%
CSD + Juices = 55% CSD + Juices = 27% CSD + Juices = 22%Traditional Cott = 100% Traditional Cott = 48% Traditional Cott = 40%
1
___________________________Note: Financials based on FY 2015Adjustments to EBITDA include acquisition integration costs, unrealized foreign exchange gains, purchase accounting adjustments and restructuring and business development costsOther product category includes concentrates, Eden’s filtration services and other. Sparkling water includes mixers Other channels include contract packaging (except Cott standalone), office coffee services and otherBetter For You grouping includes HOD Water, Water, OCS and Sparkling Waters / MixersSource: Company information, Management estimates
Private Label Retail70%
Branded Retail15%
Contract Packaging
12%
Other3%
Private Label Retail37%
Branded Retail11%
HOD Water Delivery
33%
Other19%
Private Label Retail31%
Branded Retail11%
HOD Water Delivery
38%
Other20%
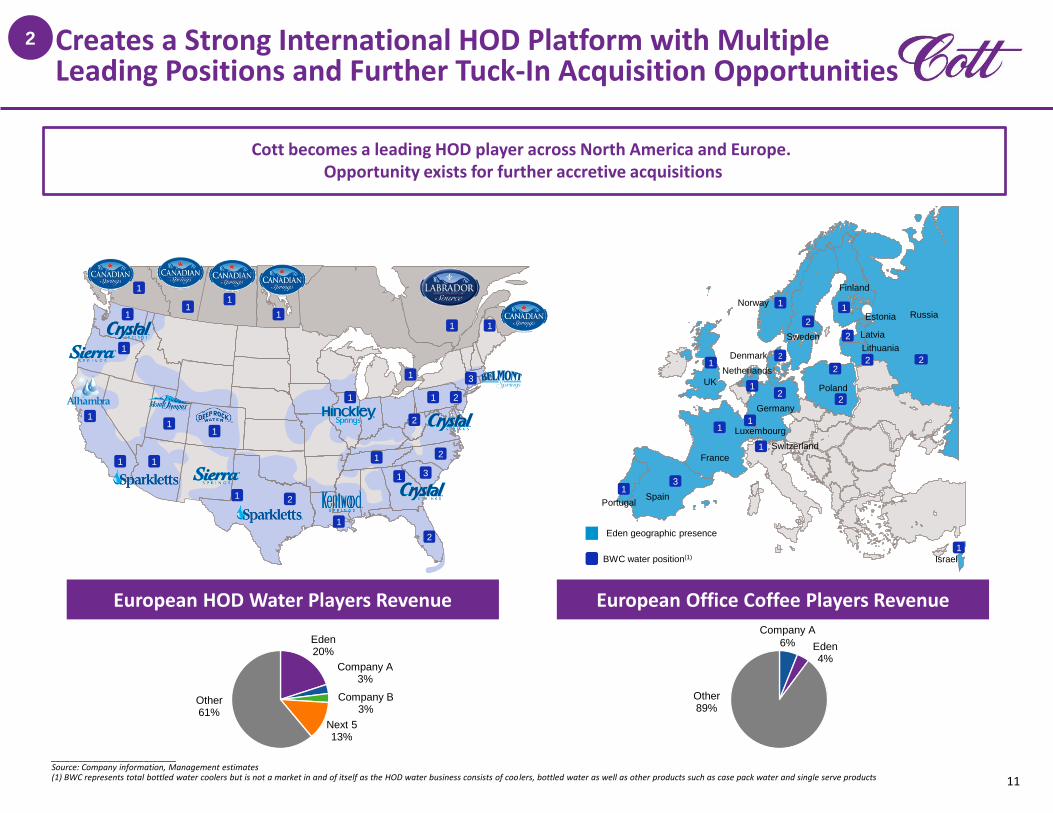
Creates a Strong International HOD Platform with Multiple Leading Positions and Further Tuck-In Acquisition Opportunities
11
Eden geographic presence
BWC water position(1)
1
1
1
1
1
11
1
1
1
1
1
1
2
2
2
2
2
3
3
___________________________Source: Company information, Management estimates(1) BWC represents total bottled water coolers but is not a market in and of itself as the HOD water business consists of coolers, bottled water as well as other products such as case pack water and single serve products
1 1
1
1
1
11
2
Eden4%
Other89%
Eden20%
Company A3%
Company B3%
Next 513%
Other61%
European HOD Water Players Revenue European Office Coffee Players Revenue
31
1
1
1
1
12
2
2
11
2
1
22
Israel
Company A
6%
Cott becomes a leading HOD player across North America and Europe. Opportunity exists for further accretive acquisitions
2
2
PortugalSpain
France
Switzerland
Germany
UK
Netherlands
Denmark
Norway
Sweden
Finland
Estonia
Latvia
Lithuania
Russia
Poland
Luxembourg
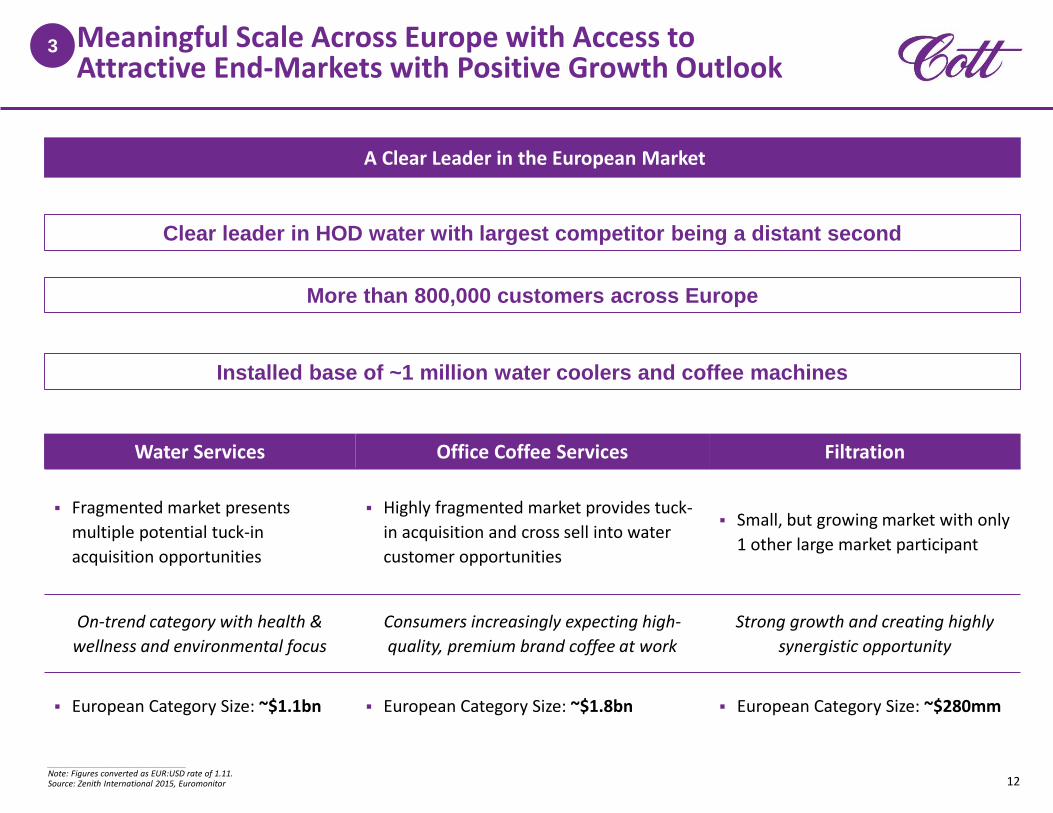
Meaningful Scale Across Europe with Access to Attractive End-Markets with Positive Growth Outlook
A Clear Leader in the European Market
12
3
Water Services Office Coffee Services Filtration
Fragmented market presents
multiple potential tuck-in
acquisition opportunities
Highly fragmented market provides tuck-
in acquisition and cross sell into water
customer opportunities
Small, but growing market with only
1 other large market participant
On-trend category with health &
wellness and environmental focus
Consumers increasingly expecting high-
quality, premium brand coffee at work
Strong growth and creating highly
synergistic opportunity
European Category Size: ~$1.1bn European Category Size: ~$1.8bn European Category Size: ~$280mm
___________________________Note: Figures converted as EUR:USD rate of 1.11. Source: Zenith International 2015, Euromonitor
More than 800,000 customers across Europe
Installed base of ~1 million water coolers and coffee machines
Clear leader in HOD water with largest competitor being a distant second
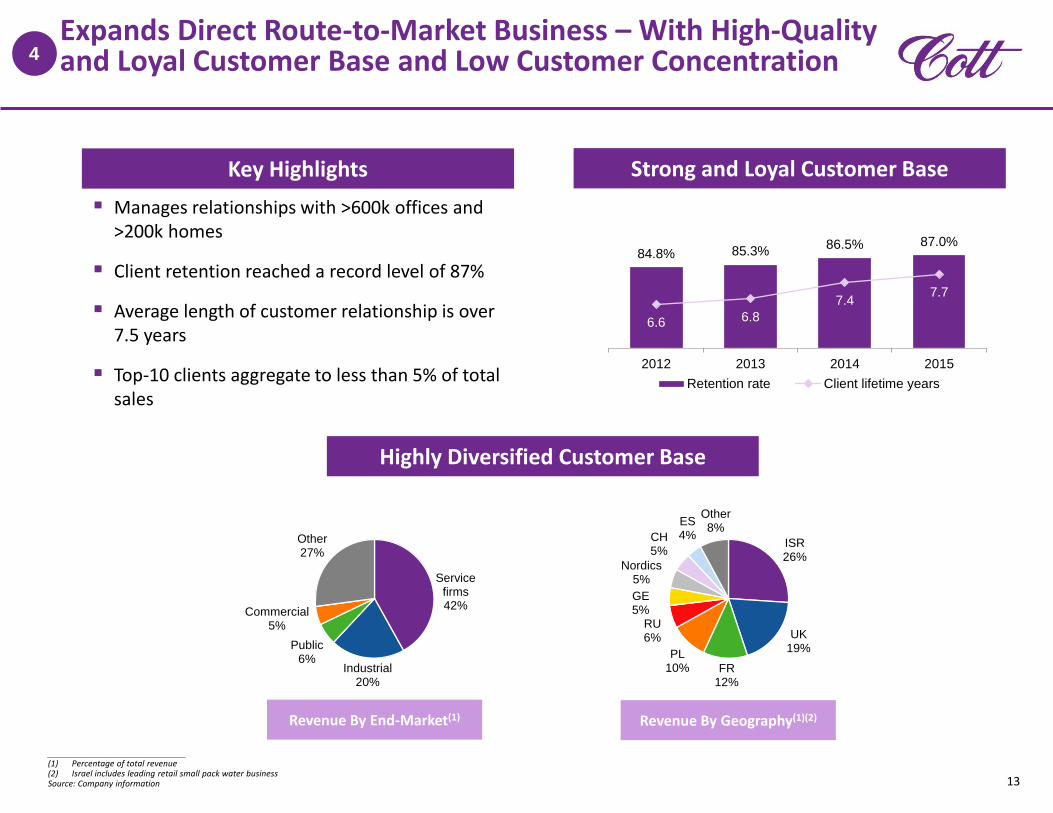
ISR26%
UK19%
FR12%
PL10%
RU6%
GE5%
Nordics5%
CH5%
ES4%
Other8%
Expands Direct Route-to-Market Business – With High-Quality and Loyal Customer Base and Low Customer Concentration
13
4
Service firms42%
Industrial20%
Public6%
Commercial5%
Other27%
Key Highlights Strong and Loyal Customer Base
Manages relationships with >600k offices and >200k homes
Client retention reached a record level of 87%
Average length of customer relationship is over 7.5 years
Top-10 clients aggregate to less than 5% of total sales
Highly Diversified Customer Base
84.8% 85.3% 86.5% 87.0%
6.6 6.8
7.47.7
2012 2013 2014 2015
Retention rate Client lifetime years
Revenue By End-Market(1) Revenue By Geography(1)(2)
___________________________(1) Percentage of total revenue(2) Israel includes leading retail small pack water businessSource: Company information
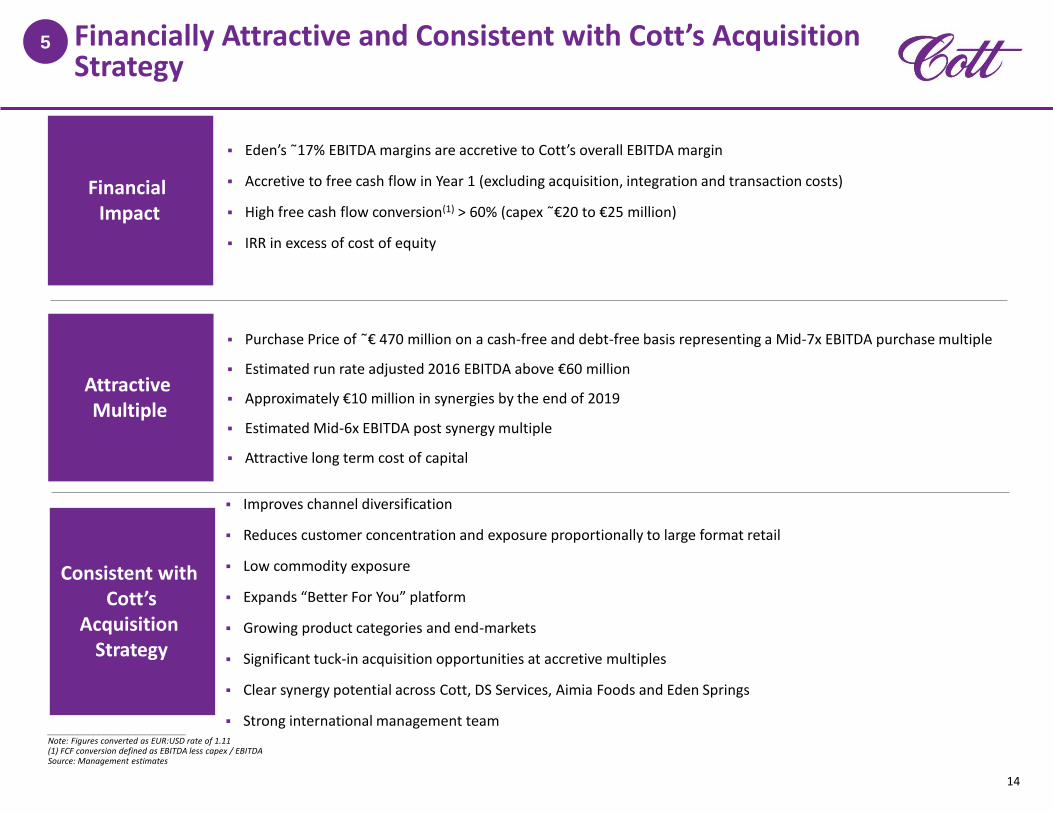
Financially Attractive and Consistent with Cott’s Acquisition Strategy
14
5
Purchase Price of ῀€ 470 million on a cash-free and debt-free basis representing a Mid-7x EBITDA purchase multiple
Estimated run rate adjusted 2016 EBITDA above €60 million
Approximately €10 million in synergies by the end of 2019
Estimated Mid-6x EBITDA post synergy multiple
Attractive long term cost of capital
Financial Impact
Eden’s ῀17% EBITDA margins are accretive to Cott’s overall EBITDA margin
Accretive to free cash flow in Year 1 (excluding acquisition, integration and transaction costs)
High free cash flow conversion(1) > 60% (capex ῀€20 to €25 million)
IRR in excess of cost of equity
___________________________Note: Figures converted as EUR:USD rate of 1.11 (1) FCF conversion defined as EBITDA less capex / EBITDASource: Management estimates
Attractive Multiple
Consistent with Cott’s
Acquisition Strategy
Improves channel diversification
Reduces customer concentration and exposure proportionally to large format retail
Low commodity exposure
Expands “Better For You” platform
Growing product categories and end-markets
Significant tuck-in acquisition opportunities at accretive multiples
Clear synergy potential across Cott, DS Services, Aimia Foods and Eden Springs
Strong international management team
Strategic Rationale and Transaction Overview
Introduction
Q&A
Today’s Agenda
15