Embed Size (px)
Citation preview

COTTON REPORT Kai Hughes Executive Director International Cotton Advisory Committee
Cotton Production & Trade Trends
International Cotton Advisory Committee

www.icac.org
million hectares US cts/lb
20
25
30
35
40
0
30
60
90
120
150
180
00/01 05/06 10/11 15/16
Cotlook A Index (previous season)
Area
WORLD COTTON AREA AND PRICES

www.icac.org
0
4
8
12
16
20
Maize Soybean Rice Sugar Sorghum
2010 2011 2012 2013
2014 2015 2016 2017
ratio
PRICE OF COTTON VS. COMPETING CROPS AT PLANTING TIME N. HEMISPHERE (2010-2017)*
*World Bank Commodities Price Data (The Pink Sheet)

www.icac.org
million hectares kg/ha
0
300
600
900
0
10
20
30
40
06/07 08/09 10/11 12/13 14/15 16/17
N. Hemisphere S. Hemisphere Yield
WORLD COTTON AREA AND YIELD

www.icac.org
kg/ha
400
550
700
850
86/87 91/92 96/97 01/02 06/07 11/12 16/17
571
772
WORLD AVERAGE YIELD (rainfed + irrigated)

www.icac.org
400
500
600
700
800
900
95
/96
97
/98
99
/00
01
/02
03
/04
05
/06
07
/08
09
/10
11
/12
13
/14
15
/16
17
/18
19
/20
21
/22
kg/ha
WORLD COTTON YIELDS REMAIN STAGNANT SINCE 2005/06

www.icac.org
India 24%
China 21%
US 18%
Pakistan 8%
Brazil 6%
Fr. Africa 5%
Uzbek. 3%
Turkey 3%
Australia 4% ROW
8%
COTTON PRODUCTION BY COUNTRY
6 M India is since 2015/16, the world’s
largest producer of cotton
2017/18: 25.6 Million tons

www.icac.org million tons
6.03
5.25
4.60
1.95
1.57
1.19
0.98
0.83
0.80
0 1 2 3 4 5 6 7
India
China
USA
Pakistan
Brazil
Fr. Africa
Australia
Turkey
Uzbekistan
16/17
17/18
CHANGES IN WORLD COTTON PRODUCTION

www.icac.org million tons
WORLD COTTON CONSUMPTION
5.3
2.2
1.5
1.4
1.3
0.7
0.8
0.7
0 1 2 3 4 5 6
India
Pakistan
Turkey
Bangladesh
Vietnam
USA
Brazil
Indonesia15/16
16/17
17/18China 32%
India 21%
Pakistan 9%
Turkey 6%
Bangladesh 6%
Vietnam 5%
Brazil 3%
Indonesia 3%
USA 3% ROW
12%
2017/18: 25.2 Million tons

www.icac.org
Million tons
0%
10%
20%
30%
40%
50%
0
2
4
6
8
10
12
90/91 95/96 00/01 05/06 10/11 15/16
Consumption Share
Share
CHINA COTTON CONSUMPTION

www.icac.org million tons
WORLD COTTON EXPORTS
3.1
1.0
0.8
0.8
0.7
0.4
0 1 2 3 4
USA
Fr. Africa
India
Australia
Brazil
Uzbekistan
16/17
17/18 40% The U.S remains the world’s
largest exporter of cotton

www.icac.org
0%
10%
20%
30%
40%
50%
90/91 95/96 00/01 05/06 10/11 15/16
USA
India
Fr. Africa
Brazil
EXPORTS: SHARE OF WORLD TOTAL
www.icac.org
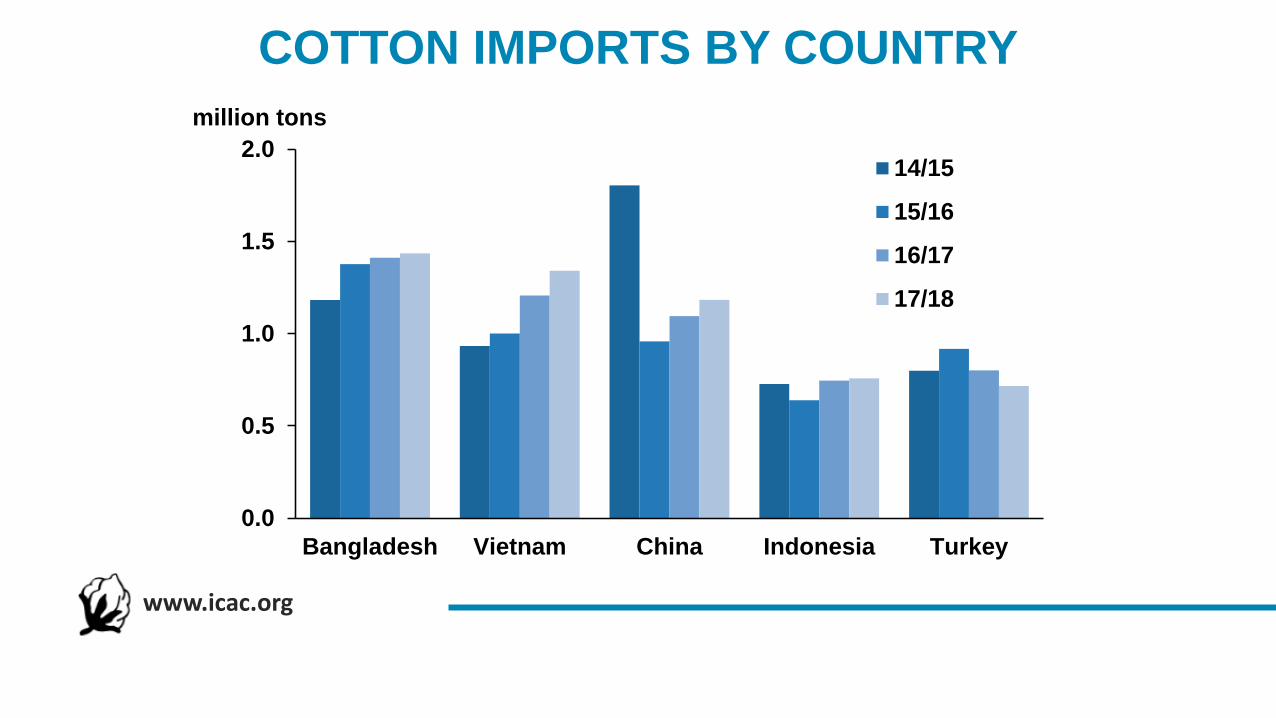
COTTON IMPORTS BY COUNTRY
0.0
0.5
1.0
1.5
2.0
Bangladesh Vietnam China Indonesia Turkey
14/15
15/16
16/17
17/18
million tons
www.icac.org
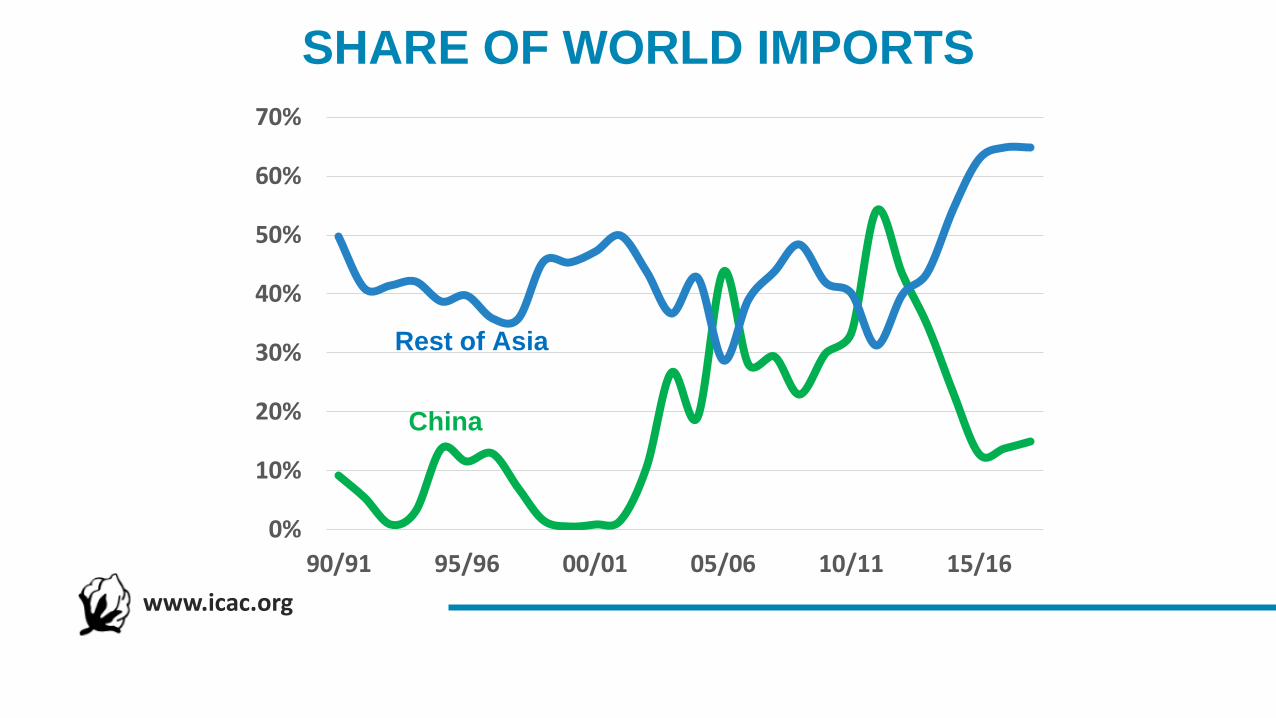
SHARE OF WORLD IMPORTS
0%
10%
20%
30%
40%
50%
60%
70%
90/91 95/96 00/01 05/06 10/11 15/16
Rest of Asia
China

www.icac.org
WORLD COTTON PRODUCTION AND MILL USE
17
19
21
23
25
27
29
00/01 05/06 10/11 15/16
Production
Mill Use
million tons
Accumulated Surplus Through 14/15:
13.8 million tons
Stock Reduction in 15/16 and 16/17:
4.4 million tons

www.icac.org
ESTIMATED SIZE OF CHINA NATIONAL RESERVE
13.0
8.4
6.4
Aug-11 Aug-12 Aug-13 Aug-14 Aug-15 Aug-16 Aug-17
0
2
4
6
8
10
12
14
million tons

www.icac.org
WORLD ENDING STOCKS
0
5
10
15
20
25
00
/01
04
/05
08
/09
12
/13
16
/17
World-less China China
million tons

www.icac.org
COTLOOK A INDEX
Season-average (US cents/lb)
83
69
40
60
80
100
120
140
160
180
74/75 84/85 94/95 04/05 14/15

www.icac.org
ASSISTANCE TO COTTON PRODUCTION
Direct support to production
Border protection
Crop insurance subsidies
Minimum support price mechanisms
Input subsidies
Transportation subsidies

www.icac.org
ASSISTANCE TO COTTON
1.5
4.7
7.4 6.5
10.7
7.4
4.5
0
2
4
6
8
10
12
97/98 00/01 03/04 06/07 09/10 12/13 15/16
Billion US$
www.icac.org
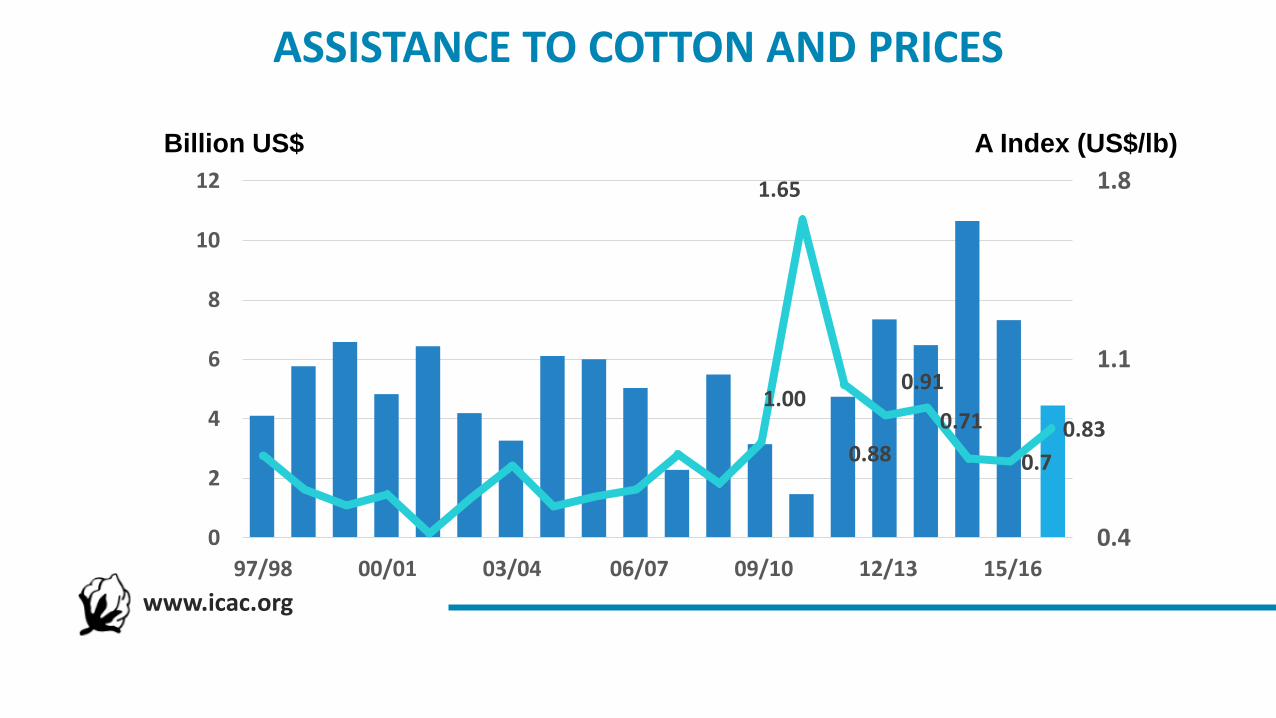
ASSISTANCE TO COTTON AND PRICES
1.65
1.00
0.88
0.91
0.71
0.7
0.83
0.4
1.1
1.8
0
2
4
6
8
10
12
97/98 00/01 03/04 06/07 09/10 12/13 15/16
Billion US$ A Index (US$/lb)

www.icac.org
WORLD COTTON PRODUCTION UNDER ASSISTANCE
0
10
20
30
40
97/98 00/01 03/04 06/07 09/10 12/13 15/16
Without Assistance With Assistance
76%
71% 70%
Average with Assistance: 55%
83%
48%
Million tons

WORLD TEXTILE FIBRE DEMAND (END-USE)
www.icac.org

www.icac.org
0
20
40
60
80
100
Cotton Wool Non-Cellulosic Cellulosic
WORLD CONSUMPTION OF MAJOR TEXTILE FIBRES Million tons

www.icac.org
0
5
10
15
20
25
30
WORLD COTTON CONSUMPTION REMAINS BELOW PEAK
Million tons

3.0
7.5 8.2
www.icac.org
POPULATION Billions
WORLD TEXTILE FIBER CONSUMPTION
Million tons 1
96
0
20
16
20
25
15.2
90.4
115.7
19
60
20
16
20
25
TEXTILE FIBER CONSUMPTION Kgs per capita
5.1
12.1
14.1
19
60
20
16
20
25

3.4
3.3
3.2
www.icac.org
19
60
20
16
20
25
1.1
8.7
10.9
19
60
20
16
20
25
WORLD CONSUMPTION PER CAPITA Kilograms
CHEMICAL FIBERS COTTON
www.icac.org
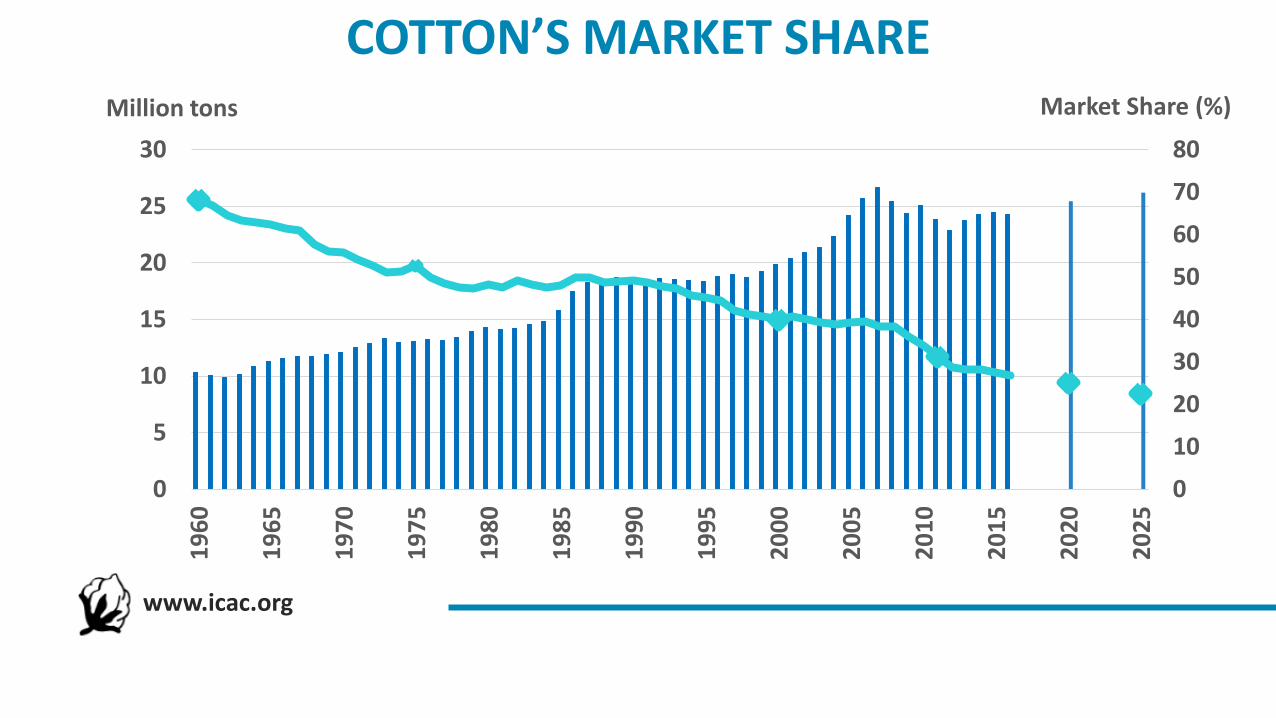
COTTON’S MARKET SHARE Million tons Market Share (%)
0
10
20
30
40
50
60
70
80
0
5
10
15
20
25
30
19
60
19
65
19
70
19
75
19
80
19
85
19
90
19
95
20
00
20
05
20
10
20
15
20
20
20
25

www.icac.org
TEXTILE FIBRE CONSUMPTION BY REGION END-USE
Million tons
0
20
40
60
801
96
0
19
65
19
70
19
75
19
80
19
85
19
90
19
95
20
00
20
05
20
10
20
15
Developed Countries
Developing Countries
C. and E. Europe &former USSR
1960 Develo
ping Countri
es 32%
Developed
Countries
51%
C. and E.
Europe &
form…
Developing
Countries
65%
Developed
Countries
31%
C. and E.
Europe &
form…
2016

www.icac.org
WORLD POPULATION Billions
0
2
4
6
8
19
60
19
65
19
70
19
75
19
80
19
85
19
90
19
95
20
00
20
05
20
10
20
15
20
20
20
25
Developed Countries
Developing Countries
C. and E. Europe & formerUSSR
Africa Asia M.E & Europe
L.A & Caribbean
2017 1.3 4.0 0.3 0.6
2025 1.5 4.2 0.4 0.7
2050 2.5 4.6 0.5 0.8
Change in Population (Billions)

www.icac.org
0
20
40
60
80
Polyester Others
Million tons
WORLD CHEMICAL FIBER YARN PRODUCTION BY FIBRE TYPE

www.icac.org
-5%
0%
5%
10%
15%
20%
19
97
20
03
20
09
20
15
POLYESTER FIBRE PRODUCTION GROWTH RATES

www.icac.org
0
10
20
30
40
50
60
Filament Staple
GLOBAL POLYESTER PRODUCTION BY FIBRE TYPE Million tons
8%CAGR
Polyester Filament production has nearly tripled since 2002.

www.icac.org
19.3
2.5 1.3 1.8 1.2
37.3
4.8 1.4 1.4 1.3
0
5
10
15
20
25
30
35
40
2007 2016
TOP 5 POLYESTER PRODUCING COUNTRIES
Million tons

www.icac.org
CHINA’S SHARE OF GLOBAL CHEMICAL FIBRE YARN PRODUCTION
9%
[VALUE…
24%
[VALUE…
62%
[VALUE… 69
%
[VALUE…
1990 2000
2010 2016

www.icac.org
Million tons
1.6
0.4 0.3 0.3 0.1
3.5
0.4 0.6 0.5
0.1
0
1
2
3
4
China Western Europe India Indonesia Thailand
2007 2016
LEADING PRODUCERS OF CELLULOSIC FIBRE

• Growth in global cotton consumption has been limited by
competition with polyester, and by consumer’s changing
attitude and behavior towards less formal fashion styles. (Yoga
Pants, leggings, Athleisure wear)
• Cotton promotion, innovation, application and research must
continue in order to change consumers preferences and to
improve the technical performance of cotton vis-à-vis polyester.
• High cotton prices benefit cotton growers. However, high
cotton prices have a negative impact in cotton consumption.
• New concerns regarding plastics and microplastic pollution
could have a positive impact on the demand for cotton.
www.icac.org

Thank you
Any Questions?
International Cotton Advisory Committee