Embed Size (px)
Citation preview
Country Assessment of Agricultural Statistical Systems in Africa Measuring the Capacity of African Countries to Produce Timely, Reliable and Sustainable Agricultural Statistics A
Country Assessment of Agricultural Statistical Systems in AfricaMeasuring the Capacity of African Countries to Produce Timely, Reliable, and Sustainable Agricultural Statistics
Chapter x Xxxxxxxxxxxxxx xxxxxxxxxxxB
This report was prepared by the Statistical Capacity Building Division of the Statistics Department at the African Development Bank. The findings reflect the opinions of the authors and not necessarily those of the African Development Bank or its Board of Directors. Every effort has been made to present reliable information as provided by 52 countries who participated in the assessment of the agriculture statistical capacity in Africa during the period 2012–2013.
Statistics DepartmentChief Economist ComplexAfrican Development BankImmeuble du Centre de commerce international d’AbidjanAvenue Jean-Paul II01 BP 1387 Abidjan 01Abidjan, Côte d’Ivoire
Tel: (225) 20 26 33 25
E-mail: [email protected]: www.afdb.org
Copyright © 2014 African Development Bank
Design/layout by Phoenix Design Aid A/S. Denmark. ISO14001/ISO 9001 Certified and approved CO2 neutral company. Printing by Scanprint using environmentally friendly recycled paper with vegetable inks.
ISBN: 978-9938-882-33-9

Country Assessment of Agricultural Statistical Systems in AfricaMeasuring the Capacity of African Countries to Produce Timely, Reliable, and Sustainable Agricultural Statistics
For Implementation of the Action Plan for Africa for Improving Statistics for
Food Security, Sustainable Agriculture, and Rural Development (2011–2017)
Chapter x Xxxxxxxxxxxxxx xxxxxxxxxxxii
LIST OF FIGURES .............................................................................................................................................................................. vLIST OF TABLES ............................................................................................................................................................................... viFOREWORD ...................................................................................................................................................................................viiiACKNOWLEDGMENTS ...................................................................................................................................................................... xABBREVIATIONS ............................................................................................................................................................................. xiEXECUTIVE SUMMARY ....................................................................................................................................................................xii
1. BACKGROUND ..................................................................................................................................................... 11.1 Introduction ........................................................................................................................................................................21.2 Objectives of the Country Assessments (CAs) .......................................................................................................................21.3 Background and scope of the assessment ............................................................................................................................3
2. DESIGN AND METHODOLOGY ............................................................................................................................. 42.1 Preparation of Country Assessment instruments ...................................................................................................................5 2.1.1 Review of previous CA initiatives ................................................................................................................................5 2.1.2 Agreement on the approach to be used (Concept Note and Framework) ......................................................................6 2.1.3 Design, process, and instruments of the First Stage of the CA ......................................................................................6 2.1.4 Training on the CA process and instruments ................................................................................................................72.2 Data collection ....................................................................................................................................................................7 2.2.1 Country Assessment follow-up missions ......................................................................................................................7 2.2.2 Setting up national governance structures ...................................................................................................................8 2.2.3 Impact on data reporting ............................................................................................................................................8 2.2.4 Evaluation and analysis of the status and trend of data reporting ................................................................................82.3 Data verification and validation, plus endorsement of preliminary results ............................................................................102.4 How to measure country capacity to produce timely and reliable agricultural statistics ........................................................102.5 Data capture and processing .............................................................................................................................................132.6 Data tabulation and analysis .............................................................................................................................................132.7 Dissemination strategy of the CA results ............................................................................................................................13
3. EXPERIENCE, LESSONS LEARNED, AND CONSTRAINTS ..................................................................................... 143.1 Experience and lessons learned..........................................................................................................................................15 3.1.1 Requirement to adapt the standard CA instruments to the regional context and specificities ......................................15 3.1.2 Importance of field-testing the CA instruments .........................................................................................................15 3.1.3 Usefulness of the training workshop on CA instruments and process .........................................................................15 3.1.4 CA follow-up missions (including virtual follow-ups), data checks and the validation process .....................................15 3.1.5 Need for a workshop for countries to review, endorse, and own the CA results ..........................................................153.2 Constraints........................................................................................................................................................................15
Table of contents
iv
4 AGRICULTURAL STATISTICS CAPACITY INDICATORS (ASCIs), 2013 .................................................................... 174.1 Prerequisites Dimension – the level of Institutional Infrastructure in Africa ..........................................................................18 4.1.1 Ranking countries using the Institutional Infrastructure Dimension ............................................................................18 4.1.2 Grouping of countries under the Institutional Infrastructure Dimension ......................................................................194.2 Input Dimension – Resources availability in Africa ..............................................................................................................22 4.2.1 Ranking countries under the Input (Resources) Dimension ........................................................................................22 4.2.2 Grouping countries under the Input (Resources) Dimension .......................................................................................224.3 Throughput Dimension – Statistical methods and practices in Africa ...................................................................................26 4.3.1 Ranking countries under the Throughput dimension ..................................................................................................26 4.3.2 Grouping countries under the Throughput Dimension ................................................................................................274.4 Output Dimension – Availability of statistical information in Africa ......................................................................................30 4.4.1 Ranking countries under the Output Dimension ........................................................................................................30 4.4.2 Grouping countries under the Output Dimension .......................................................................................................314.5 Composite Indicator of all four dimensions.........................................................................................................................34 4.5.1 Ranking countries under the Composite ASCI ............................................................................................................34 4.5.2 Country groupings under the Composite ASCI ...........................................................................................................34
5. CONCLUSION .................................................................................................................................................... 38
6. ANNEXES .......................................................................................................................................................... 40A1 Country assessment questionnaire used in 2013 ................................................................................................................41A2 Procedures for the computation of ASCI and tables ............................................................................................................78A2.1 Mapping questions to indicators ........................................................................................................................................78A2.2 ASCI Formula table ............................................................................................................................................................86A2.3 Variables and scores for Indicator Computation ..................................................................................................................96A3 ASCI showing quality of data at dimensional and elemental levels ....................................................................................100A4 National governance structure – case of Cabo Verde ........................................................................................................104A5 ASCIs with ranking of country performance ......................................................................................................................106A6 GDP per capita and Agriculture Value Added in 2013 .......................................................................................................110A7 GDP per capita in African countries, 2013 ........................................................................................................................111
Country Assessment of Agricultural Statistical Systems in Africa Measuring the Capacity of African Countries to Produce Timely, Reliable and Sustainable Agricultural Statistics v
1 Trend of country responses to surveys by year .........................................................................................................................82 Country responses to surveys in 2007, 2009, and 2013 ..........................................................................................................83 Level of institutional infrastructure in Africa by components ..................................................................................................184 Institutional Infrastructure capacity by country ......................................................................................................................195 Mapping the Prerequisites Dimension – institutional infrastructure capacity levels across Africa .............................................206 Level of Resources capacity in Africa by components .............................................................................................................227 Resources capacity level by country ......................................................................................................................................238 Mapping the Input Dimension – Resources capacity across Africa .........................................................................................249 Statistical Methods and Practices capacity levels in Africa, by components .............................................................................2610 Statistical Methods and Practices capacity by country ...........................................................................................................2711 Mapping the Throughput Dimension – capacity indicator of statistical methods and practices across Africa ............................2812 Availability of Statistical Information in Africa by component .................................................................................................3013 Availability of Statistical Information by country ....................................................................................................................3114 Mapping the Output Dimension – Availability of statistical information across Africa .............................................................3215 Availability of statistical information in Africa, by components ...............................................................................................3416 Composite ASCI by country ..................................................................................................................................................3517 Mapping composite ASCI rankings across Africa ...................................................................................................................36
List of figures
vi
1 Country responses to surveys in 2007, 2009, and 2013 ..........................................................................................................92 Country responses by level of completeness for each questionnaire module ..........................................................................103 Scale of ASCI basic data availability ......................................................................................................................................104 Country groupings by Institutional Infrastructure Dimension ..................................................................................................195 African countries grouped by Institutional Infrastructure indicator, GDP per capita and Agriculture VA (% of GDP) ..................216 Country groupings by Resources Dimension ..........................................................................................................................237 African countries grouped by Resources capacity indicator, GDP per capita, and Agriculture VA (% of GDP) ...........................258 Country groupings by Statistical Methods and Practices Dimension .......................................................................................279 African countries grouped by Statistical Methods and Practices indicator, GDP per capita, and Agriculture VA (% of GDP) ......2910 Country groupings by Availability of Statistical Information Dimension ..................................................................................3111 Country groupings by Availability of Statistical Information indicator, GDP per capita, and Agriculture VA (% of GDP) .............3312 Country groupings by Composite ASCI .................................................................................................................................3513 African countries by Composite ASCI, GDP per capita, and Agriculture VA (% of GDP) ...........................................................37
List of tables
Country Assessment of Agricultural Statistical Systems in Africa Measuring the Capacity of African Countries to Produce Timely, Reliable and Sustainable Agricultural Statistics vii
List of tables
viii
Foreword
The Statistics Department of the African Development Bank (AfDB) is pleased to present this “Assessment of Agricultural Statistical Systems in Africa: Measuring the Capacity of African Countries to Produce Timely, Reliable, and SustainableAgricultural Statistics.” The agricultural sector remains the engine of growth for many countries in Africa – as it does for many other developing regions of the world; however, agricultural statistics to inform the development of this sector have remained inadequate. Concerned about the state of agricultural statistics in the world, the UN Statistical Commission endorsed in 2010 a “Global Strategy for Improving Agricultural and Rural Statistics.”
Africa was the first region to develop an Action Plan titled “Improving Statistics for Food Security, Sustainable Agriculture, and Rural Development – An Action Plan Africa 2011-2015,” to guide the implementation of the Global Strategy. The Action Plan provided for the undertaking of statistical capacity and needs assessment in African countries to: (i) establish baselines against which targets could be set and performance measured; (ii) support a comprehensive technical assistance program for Africa, covering also training and research; and (iii) establish a monitoring and evaluation (M&E) system to measure changes in the level of statistical capacity over time.
The assessment was to be effected in two stages. The first stage would focus on establishing baseline information on African countries’ statistical capacity. Stage two would comprise an in-depth assessment of the state of statistics in the agricultural sector in selected countries on a needs basis, to inform the design of country Strategic Plans for Agricultural and Rural Statistics (SPARS).
In 2013, the first-stage assessment collected data from 52 African countries. These data were used to compile Agricultural Statistics Capacity Indicators (ASCIs), which were validated by countries at a workshop held in Rabat, Morocco, in November 2013. These indica-tors are presented in this publication, which also gives background information about the Action Plan for Africa of the Global Strategy, the methodology used to make the assessment and collect the data, and how data compilation was carried out.
The successful completion of the country assessments was due in no small measure to a concerted effort on the part of country teams from the National Statistical Offices and Ministries of Agriculture, as well as a broad cross-section of stakeholders. On behalf of the AfDB, I would like to thank all those involved for the making the exercise a huge success. I especially would like to take this opportunity to thank the Food and Agriculture Organization (FAO) of the United Nations for providing the methodology and instruments without which the assessments would not have been possible. Thanks are also due to the African countries themselves, for the enthusiasm they have shown in the implementation of the Action Plan and for their participation in the assessments.
Appreciation also needs to be expression to the technical team, headed by Mr. Oliver Chinganya, the Manager of the Statistical Capacity Building Division of the Statistics Department of the AfDB. Other members of the team included Vincent Ngendakumana, Ben Kiregyera, Estella Addiko, E.S.K Muwanga Zake, Seghir Bouzaffour, Enock Fabiano Ching’Anda, Aleston Kyanga, Riadh Kouki, and Marwa Ben Hassen. At different stages of the process, valuable inputs were also obtained from Naman Keita, Srivastava Mukesh, Eloi Ouedraogo, Christophe Duhamel, Stephen Bahemuka, and Adam Abdoulaye. Finally, special thanks are due to the UK Department for International Development (DfID) and the Bill and Melinda Gates Foundation (BMGF) for their financial contributions which helped to make this work possible.
The AfDB is widely recognized as a knowledge hub for the region, by dint of its statistical publications as well as its online databases, including the newly launched Africa Information Highway (AIH), which will serve as a “one-stop shop” for a broad range of develop-ment data on Africa, including agriculture and rural development statistics. The AIH is an open data system, with full and free access
Country Assessment of Agricultural Statistical Systems in Africa Measuring the Capacity of African Countries to Produce Timely, Reliable and Sustainable Agricultural Statistics ix
Foreword
to all stakeholders (RMCs, including line ministries, national statistical offices, central banks, subregional organizations, regional economic communities, non-governmental organizations, statistical training centers, researchers, UN agencies, international develop-ment organizations, the private sector, and the public at large. I am therefore pleased to recommend this report on “Measuring the Capacity of African Countries to Produce Timely and Reliable Agricultural Statistics” to all the current and future users of data relating to Africa’s agricultural statistics. It is anticipated that this report will serve a vital role in helping to bolster food security, sustainable rural development, and agricultural productivity in Africa for the long term.
Charles Leyeka LufumpaDirector, Statistics DepartmentAfrican Development Bank
Acknowledgments
This report was prepared under the direction of Oliver Chinganya, Manager, Statistical Capacity Building Division of the AfDB, and the overall guidance of Charles Leyeka Lufumpa, Director of the Statistics Department. The core team included Vincent Ngendakumana, Ben Kiregyera, and Estella Addiko. The collection, editing, and validation of country data were carried out by the participating 52 countries under the close supervision of the AfDB’s Statistics team. The success of the country assessments was due in large part to the work of the agriculture statisticians from the Ministries of Agriculture and various National Statistical Offices of Algeria, Angola, Benin, Botswana, Burkina Faso, Burundi, Cabo Verde, Cameroon, Chad, Comoros, Côte d’Ivoire, Congo Republic, Democratic Republic of Congo, Djibouti, Egypt, Equatorial Guinea, Ethiopia, Gabon, The Gambia, Ghana, Guinea, Guinea-Bissau, Kenya, Lesotho, Liberia, Libya, Madagascar, Malawi, Mali, Mauritania, Mauritius, Morocco, Mozambique, Namibia, Niger, Nigeria, Rwanda, São Tomé and Príncipe, Senegal, Seychelles, Sierra Leone, Somalia, South Africa, Sudan, South Sudan, Swaziland, Tanzania, Togo, Tunisia, Uganda, Zambia, and Zimbabwe.
The AfDB coordinating team benefited not only from the willingness of participating countries to collect, edit, and review data inputs, but also from the practical insights and advice provided during the workshops and one-on-one consultations during the country assessment exercise.
x
Country Assessment of Agricultural Statistical Systems in Africa Measuring the Capacity of African Countries to Produce Timely, Reliable and Sustainable Agricultural Statistics xi
AFCAS African Commission on Agricultural Statistics
AfDB African Development Bank
ASCI Agricultural Statistics Capacity Indicator
ASDCI Agricultural Statistics Development Composite Indicator
ASSD Africa Symposium on Statistical Development
AUC African Union Commission
CA Country Assessment
DQAF Data Quality Assessment Framework
DRC Democratic Republic of Congo
ECA UN Economic Commission for Africa
FAO Food and Agriculture Organization of the United Nations
FAOSTAT Food and Agriculture Organization Corporate Statistical Database
GDP Gross Domestic Product
ICP-Africa International Comparison Program for Africa
IDA International Development Association
IdCA In-depth Country Assessment
IMF International Monetary Fund
M&E Monitoring and Evaluation
MOA Ministry of Agriculture
NASCC National Agricultural Statistics Coordination Committee
NSAS National System of Agricultural Statistics
NSC National Strategy Coordinator
NSDS National Strategy for the Development of Statistics
NSO National Statistical Office
NSS National Statistical System
OECD Organization for Economic Cooperation and Development
PARIS21 Partnership in Statistics for Development in the 21st Century
SPARS Strategic Plan for Agriculture and Rural Statistics
TQM Total Quality Management
TWG Technical Working Group
TYS Ten Year Strategy (AfDB)
USD United States Dollar
UN United Nations
VA Value Added
WB World Bank
Abbreviations
xii
Executive summary
IntroductionAgriculture plays a major role in Africa’s economic and social development, yet the sector is confronted with numerous challenges that hamper the eradication of poverty and hunger and the attainment of sustainable food security. One key challenge is a lack of reliable statistical data to inform policy analysis and evidence-based decision-making. In response to this deficiency, Africa was the first global region to design an Action Plan (2011-2017) titled “Improving Statistics for Food Security, Sustainable Agriculture, and Rural Devel-opment” to guide the implementation of the “Global Strategy for Improving Agricultural and Rural Statistics” (World Bank, Food and Agriculture Organization, and UN Statistical Commission, 2010).
The Africa Action Plan provides a framework and methodology to improve national and regional food and agricultural statistics to guide policy analysis and decision-making in the 21st century. It seeks to address the declining quantity and quality of agricultural statistics, to support emerging data needs and requirements. The Action Plan also seeks to ensure that data systems across countries are fully inte-grated, harmonized, and in alignment with international standards as a way to achieve synergy and cost-effectiveness. In this respect, it aligns to one of the five operational priorities of the African Development Bank’s Ten-Year Strategy 2013–2022 (TYS), namely to foster regional integration. Moreover the Action Plan, by seeking to improve food security and boost productivity and incomes over the long term, responds to two overarching objectives of the TYS, namely to achieve growth that is more inclusive and, second, to ensure that inclusive growth is sustainable.
Agricultural Statistics Capacity Indicators (ASCIs)To establish the baseline information for the implementation of the Africa Action Plan, a Country Assessment (CA) of the agricultural statistical systems was carried out in 52 African countries in 2013. This was to ascertain the current status of institutional, technical, and resource capacities to produce the requisite agricultural statistics. The CAs were also geared to establish targets, enrich effective monitoring and evaluation (M&E), and measure the impact of the implementation of Action Plan over time.
Data from the CAs were used to construct Agricultural Statistics Capacity Indicators (ASCIs) for each country. The ASCI is a multidimen-sional indicator that measures each country’s capacity to produce timely and reliable agricultural and rural statistics. It provides evidence on the current level of development of national agricultural and rural statistics systems. The ASCIs provide insights into most aspects of the statistical environment in which data are collected, processed and disseminated, including the government’s commitment to support the development of legal frameworks, strategic plans, the institutional infrastructure, and provision of resources for statistical programs.
The ASCIs are captured by four dimensions, each comprising an aggregation of a number of different elements/components. The four dimensions are:
(1) Institutional Infrastructure (Prerequisites Dimension),(2) Resources (Input Dimension),(3) Statistical Methods and Practices (Throughput Dimension), and (4) Availability of Statistical Information (Output Dimension).
This report presents the status of each country’s capacity in relation to these four statistical dimensions. It identifies each country’s strengths and weaknesses and presents best practices, which other countries may emulate. The report also provides baseline information to measure individual countries’ progress toward achieving the objectives and targets set by the “Global Strategy for Improving Agri-cultural and Rural Statistics” (henceforth Global Strategy) in general. It also strengthens development partners’ knowledge of individual countries’ capacities, so that they may target countries that require additional assistance in specific areas.
Country Assessment of Agricultural Statistical Systems in Africa Measuring the Capacity of African Countries to Produce Timely, Reliable and Sustainable Agricultural Statistics xiii
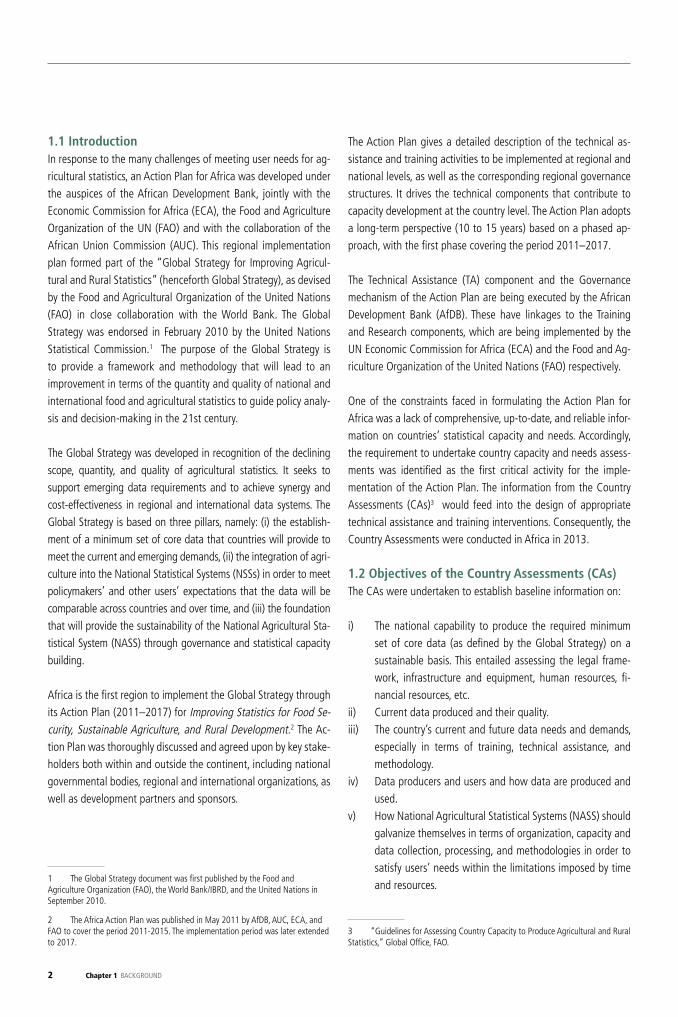
Executive summary Overall status of Agricultural Statistics Capacity Indicators for the regionAssessing all four dimensions of ASCIs for Africa overall, the report shows the continent to be weak in allocating financial resources (24.4%) for agricultural statistical activities as well as in applying appropriate agricultural statistics methods and practices (41.4%). Nonetheless, the region demonstrates average strength for the dimensions “Institutional Infrastructure” (57.2%) and “Availability of Statistical Information” (62.1%).
Rating all the countries in the region, Ethiopia emerges as the country best equipped (66.5%) to run an effective and efficient agricultural statistics system and to produce timely, reliable, and sustainable statistics. The next best performers are: South Africa (65.6%), Ghana (64.1%), Namibia (63.8%), and Egypt (62.9%). Guinea-Bissau and Libya emerge as the worst performers (below 20%) in their use of required standards to effectively undertake agricultural statistics development. This calls for special advocacy and technical support in the worst-performing countries to scale up and streamline the development of agricultural and rural devel-opment statistics.
(i) Prerequisites Dimension: Institutional infrastructureBenin, Burkina Faso, Lesotho, Mauritius, Namibia, Nigeria, Rwanda, Tunis, and Uganda, score the highest (above 80%) in the region on this dimension. These countries operate with almost all the fundamental institutional requirements in place in their statistical insti-tutions to produce quality, reliable, timely, and sustainable agricultural statistics to meet the demand of users. By contrast, Libya scores the lowest (15.3%) on this dimension. Comoros, Chad, Guinea, Madagascar, Swaziland, and Zimbabwe have low GDP per capita, low agriculture value added (% of GDP), and weak institutional infrastructure (below 40%) for the production of the required agricultural statistics. These countries require both financial and technical support to improve this dimension. Countries such as Benin, Burkina Faso, Lesotho, Nigeria, Rwanda, and Uganda have low GDP per capita as well as low agricultural valued added (% of GDP), yet have very strong institutional infrastructure (above 80%) in order to carry out agricultural statistical activities. This signifies the existence of best practices which should be emulated by even the rich countries that have poor institutional infrastructure.
(ii) Input Dimension: ResourcesMost countries in the region register a low score (below 50%) on this dimension. “Resources” in this context includes not only finances, but also human resources and physical infrastructure to run the agricultural statistics systems effectively and efficiently. Mauritius is the only country operating above 60% of the required standards. The next best performers are Botswana, South Africa, and Zambia, which score between 50–60%, followed by Cabo Verde, Ghana, Malawi, Namibia, and Rwanda, which score between 40–50%. Sudan scores the lowest (3.1%) on this dimension. Somalia and Liberia are among the poor countries with a high proportion of agriculture value added, yet they have a weak resources base for agricultural statistics activities.
(iii) Throughput Dimension: Statistical Methods and PracticesThis dimension gives an overall picture of the capability of each country to undertake the collection, management, and dissemination of agricultural statistical activities efficiently. Some relatively poor countries such as Ethiopia and Ghana score highly (60–80%) on this dimension. Their respective practices should therefore be shared with other countries (both poor and rich) that score low – countries such as Equatorial Guinea, Gabon, Libya, and the Seychelles. What is clear is that these countries need to channel more of their resources toward funding agricultural statistical activities. Areas that require special attention include the adoption of data collection technology; improving infrastructure such as establishing ICT networks and information systems; conducting regular agricultural surveys and census-es; and managing data (including data processing, analysis, interpretation and dissemination to data users).
(iv) Output Dimension: Availability of Statistical InformationThis dimension considers the minimum set of core data requirements, as determined by the Global Strategy. Burkina Faso, Ethiopia, Ghana, and Mali score the highest on this dimension (above 80%), even though they are poor. This demonstrates that whatever data they produce, they make available to users. On the other hand, some rich countries such as Angola, Equatorial Guinea, and Libya are capable of funding their agricultural statistical activities and infrastructure, however the statistical information produced is not made readily available to users. These countries need support to generate the statistical downstream activities of data processing, analysis, and dissemination to users.

Chapter x Xxxxxxxxxxxxxx xxxxxxxxxxxxiv
Country Assessment of Agricultural Statistical Systems in Africa Measuring the Capacity of African Countries to Produce Timely, Reliable and Sustainable Agricultural Statistics 1
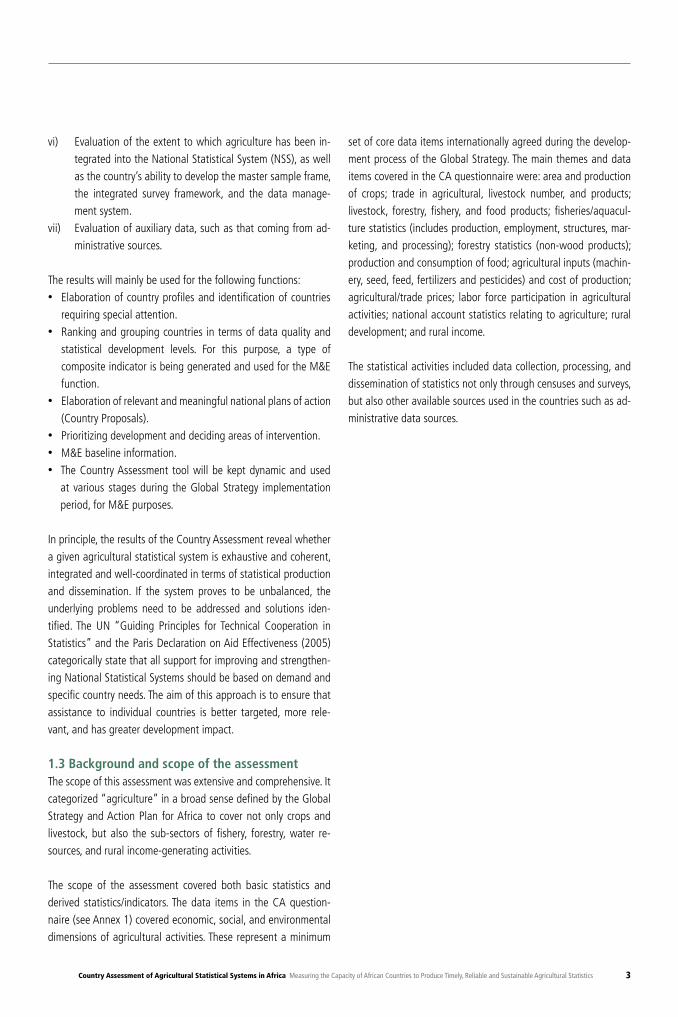
1. BACKGROUND
2 Chapter 1 BACKGROUND
1.1 IntroductionIn response to the many challenges of meeting user needs for ag-ricultural statistics, an Action Plan for Africa was developed under the auspices of the African Development Bank, jointly with the Economic Commission for Africa (ECA), the Food and Agriculture Organization of the UN (FAO) and with the collaboration of the African Union Commission (AUC). This regional implementation plan formed part of the “Global Strategy for Improving Agricul-tural and Rural Statistics” (henceforth Global Strategy), as devised by the Food and Agricultural Organization of the United Nations (FAO) in close collaboration with the World Bank. The Global Strategy was endorsed in February 2010 by the United Nations Statistical Commission.1 The purpose of the Global Strategy is to provide a framework and methodology that will lead to an improvement in terms of the quantity and quality of national and international food and agricultural statistics to guide policy analy-sis and decision-making in the 21st century.
The Global Strategy was developed in recognition of the declining scope, quantity, and quality of agricultural statistics. It seeks to support emerging data requirements and to achieve synergy and cost-effectiveness in regional and international data systems. The Global Strategy is based on three pillars, namely: (i) the establish-ment of a minimum set of core data that countries will provide to meet the current and emerging demands, (ii) the integration of agri-culture into the National Statistical Systems (NSSs) in order to meet policymakers’ and other users’ expectations that the data will be comparable across countries and over time, and (iii) the foundation that will provide the sustainability of the National Agricultural Sta-tistical System (NASS) through governance and statistical capacity building.
Africa is the first region to implement the Global Strategy through its Action Plan (2011–2017) for Improving Statistics for Food Se-curity, Sustainable Agriculture, and Rural Development.2 The Ac-tion Plan was thoroughly discussed and agreed upon by key stake-holders both within and outside the continent, including national governmental bodies, regional and international organizations, as well as development partners and sponsors.
1 The Global Strategy document was first published by the Food and Agriculture Organization (FAO), the World Bank/IBRD, and the United Nations in September 2010.
2 The Africa Action Plan was published in May 2011 by AfDB, AUC, ECA, and FAO to cover the period 2011-2015. The implementation period was later extended to 2017.
The Action Plan gives a detailed description of the technical as-sistance and training activities to be implemented at regional and national levels, as well as the corresponding regional governance structures. It drives the technical components that contribute to capacity development at the country level. The Action Plan adopts a long-term perspective (10 to 15 years) based on a phased ap-proach, with the first phase covering the period 2011–2017.
The Technical Assistance (TA) component and the Governance mechanism of the Action Plan are being executed by the African Development Bank (AfDB). These have linkages to the Training and Research components, which are being implemented by the UN Economic Commission for Africa (ECA) and the Food and Ag-riculture Organization of the United Nations (FAO) respectively.
One of the constraints faced in formulating the Action Plan for Africa was a lack of comprehensive, up-to-date, and reliable infor-mation on countries’ statistical capacity and needs. Accordingly, the requirement to undertake country capacity and needs assess-ments was identified as the first critical activity for the imple-mentation of the Action Plan. The information from the Country Assessments (CAs)3 would feed into the design of appropriate technical assistance and training interventions. Consequently, the Country Assessments were conducted in Africa in 2013.
1.2 Objectives of the Country Assessments (CAs)The CAs were undertaken to establish baseline information on:
i) The national capability to produce the required minimum set of core data (as defined by the Global Strategy) on a sustainable basis. This entailed assessing the legal frame-work, infrastructure and equipment, human resources, fi-nancial resources, etc.
ii) Current data produced and their quality.iii) The country’s current and future data needs and demands,
especially in terms of training, technical assistance, and methodology.
iv) Data producers and users and how data are produced and used.
v) How National Agricultural Statistical Systems (NASS) should galvanize themselves in terms of organization, capacity and data collection, processing, and methodologies in order to satisfy users’ needs within the limitations imposed by time and resources.
3 “Guidelines for Assessing Country Capacity to Produce Agricultural and Rural Statistics,” Global Office, FAO.
Country Assessment of Agricultural Statistical Systems in Africa Measuring the Capacity of African Countries to Produce Timely, Reliable and Sustainable Agricultural Statistics 3
vi) Evaluation of the extent to which agriculture has been in-tegrated into the National Statistical System (NSS), as well as the country’s ability to develop the master sample frame, the integrated survey framework, and the data manage-ment system.
vii) Evaluation of auxiliary data, such as that coming from ad-ministrative sources.
The results will mainly be used for the following functions:• Elaboration of country profiles and identification of countries
requiring special attention.• Ranking and grouping countries in terms of data quality and
statistical development levels. For this purpose, a type of composite indicator is being generated and used for the M&E function.
• Elaboration of relevant and meaningful national plans of action (Country Proposals).
• Prioritizing development and deciding areas of intervention.• M&E baseline information.• The Country Assessment tool will be kept dynamic and used
at various stages during the Global Strategy implementation period, for M&E purposes.
In principle, the results of the Country Assessment reveal whether a given agricultural statistical system is exhaustive and coherent, integrated and well-coordinated in terms of statistical production and dissemination. If the system proves to be unbalanced, the underlying problems need to be addressed and solutions iden-tified. The UN “Guiding Principles for Technical Cooperation in Statistics” and the Paris Declaration on Aid Effectiveness (2005) categorically state that all support for improving and strengthen-ing National Statistical Systems should be based on demand and specific country needs. The aim of this approach is to ensure that assistance to individual countries is better targeted, more rele-vant, and has greater development impact.
1.3 Background and scope of the assessmentThe scope of this assessment was extensive and comprehensive. It categorized “agriculture” in a broad sense defined by the Global Strategy and Action Plan for Africa to cover not only crops and livestock, but also the sub-sectors of fishery, forestry, water re-sources, and rural income-generating activities.
The scope of the assessment covered both basic statistics and derived statistics/indicators. The data items in the CA question-naire (see Annex 1) covered economic, social, and environmental dimensions of agricultural activities. These represent a minimum
set of core data items internationally agreed during the develop-ment process of the Global Strategy. The main themes and data items covered in the CA questionnaire were: area and production of crops; trade in agricultural, livestock number, and products; livestock, forestry, fishery, and food products; fisheries/aquacul-ture statistics (includes production, employment, structures, mar-keting, and processing); forestry statistics (non-wood products); production and consumption of food; agricultural inputs (machin-ery, seed, feed, fertilizers and pesticides) and cost of production; agricultural/trade prices; labor force participation in agricultural activities; national account statistics relating to agriculture; rural development; and rural income.
The statistical activities included data collection, processing, and dissemination of statistics not only through censuses and surveys, but also other available sources used in the countries such as ad-ministrative data sources.
Chapter x Xxxxxxxxxxxxxx xxxxxxxxxxx4
2. DESIGN AND METHODOLOGY
Country Assessment of Agricultural Statistical Systems in Africa Measuring the Capacity of African Countries to Produce Timely, Reliable and Sustainable Agricultural Statistics 5
2.1 Preparation of Country Assessment instrumentsAfrica contributed significantly to the design and elaboration of the Country Assessment (CA) process and standard instruments that have been adapted by other regions. It should be recalled that at the time of developing the Action Plan for Africa, updated and comprehensive baseline information as well as tools for the measurement of performance and target indicators were lacking. The CA process therefore needed to be undertaken prior to the implementation of the technical components of the Action Plan.
Before undertaking the Country Assessments, similar initiatives undertaken in the past and other existing data sources were re-viewed to see if their findings might be used in lieu of conducting a comprehensive and systematic CA across all African countries. It was hoped and anticipated that this might significantly reduce administrative costs and speed up the process.
2.1.1 Review of previous CA initiativesIn Africa, national assessments of statistical development had been undertaken in the past by various institutions, often with slightly different statistical perspectives and objectives. The previ-ous main assessments comprised the following:
› The African Development Bank’s (AfDB) Country Assessments in the context of the 2005 International Comparison Program for Africa (ICP-Africa), which covered 48 countries over the pe-riod 2002–2003. The objectives of the ICP country assessments were to produce an inventory of strengths, weaknesses, prob-lems, and challenges in each country, and identify solutions that could be put in place through the ICP.
› Assessments undertaken by countries themselves in the context of formulating National Strategies for the Development of Sta-tistics (NSDSs). These examined the current state of the Nation-al Statistical Systems (NSSs) in terms of: legal and institutional frameworks; linkages and coordination arrangements; current and future user needs; existing capacity to meet these needs and fill existing data gaps; statistical methods and procedures in use; adherence to international standards; constraints and problems; as well as the processing, analysis, and archiving of data, etc. In a number of countries, the same assessment was extended to sectors including the agricultural sector as a basis for designing Sector Strategic Plans for statistics, including Stra-tegic Plans for Agricultural and Rural Statistics (SPARS).
› FAO biennial country assessments in Africa have been carried out within the framework of the African Commission on Ag-ricultural Statistics (AFCAS), looking at the current state of agricultural statistical systems in member countries. The most
comprehensive CA was undertaken in 2007, covering 49 coun-tries; the related report was published in 2008.
› Since the early 1990s, the FAO Statistics Division has been assessing the quality of the data that they compile (assess-ment of the quality of official data versus semi-official and FAO estimates, as contained in FAOSTAT). More recently, the FAO Statistics Division has begun using data quality dimensions very similar to those of Eurostat (2000) and has consolidated a statistical metadata component within the Agricultural Bul-letin Board on Data Collection, Dissemination and Quality of Statistics.
› The World Bank assesses statistical capacity in countries and publishes the results on its Bulletin Board on Statistical Capaci-ty. The objective is to improve the measurement and monitoring of statistical capacity of IDA countries, in close collaboration with countries and users.
› The IMF Data Quality Assessment Framework (DQAF), updat-ed in 2003 from the original version of 2001, identifies quali-ty-related features of statistical systems governance, statistical processes, and statistical products. The DQAF’s coverage is or-ganized around a set of prerequisites (legal and institutional environment, relevance, resources, and quality management) and five dimensions of data quality, namely assurances of integrity, methodological soundness, accuracy and reliability, serviceability, and accessibility. For each dimension, the DQAF identifies 3–5 elements of good practice, and for each element, several relevant indicators.
› Eurostat’s Data Quality Assessment Methods and Tools were proposed in the early 2000s. The scope is limited to the sta-tistical products and certain aspects of the processes leading to their production, as well as user perception of statistical products.
› The OECD quality framework has benefited from the work car-ried out in recent years by the IMF, Eurostat, Statistics Cana-da, and other national statistics offices (NSOs). It has avoided “reinventing the wheel” by adapting existing definitions and approaches to the OECD context. It views data quality in terms of seven dimensions: relevance, accuracy, credibility, timeliness, accessibility, interpretability, and coherence.
Other previous CAs were more focused on the following main information sources: (i) the report produced for AFCAS 2007 and 2009, (ii) FAOSTAT data, (iii) PARIS21 (for data on the existence of NSDS), and (iv) the WB Bulletin Board on Statistical Capacity. Indicators that are available for all countries and for the same year (2007) have been filtered to inform Input and Output elements of country agricultural statistical capacity. An Agricultural Statistics

6 Chapter 2 DESIGN AND METHODOLOGY
Development Composite Indicator (ASDCI) was thereafter gener-ated from these sources.
2.1.2 Agreement on the approach to be used (Concept Note and Framework)From the above summary of past and recent similar CA initiatives, it appears that significant progress has been made by different institutions in assessing national statistical capacities. However, in many cases, the work has been limited to the strict analysis of the data quality (in particular the Eurostat and OECD frame-works). In the case of the IMF, the “prerequisites”4 do not cov-er the statistics system as a whole. The bulk of all background documents is developed around the description/analysis of the data quality. Another important question that the earlier mod-els of data quality assessment failed to address is how they can be used for grouping and/or ranking countries in terms of their developmental level of agricultural statistics systems in general. Another issue that tended to be overlooked is how the models could be used for monitoring the trend of data quality over time.
Furthermore, the required dimensions and elements to compre-hensively inform the needs and capacities of National Systems of Agricultural Statistics (NSASs) were insufficiently reported. In-deed, important data on the financial and human resources as well as on equipment allocated to agricultural statistics activities, country commitment and political will etc. were not available for all countries and for the same reference period.
It therefore became clear that a comprehensive CA model was needed to go beyond the simple Data Quality Assessment Frame-work and cover the entire agricultural statistics systems. This would then allow the calculation of a Composite indicator (similar to the World Bank’s Capacity Building indicator), as well as the establishment of an M&E system over time.
At the outset of the process design, it was proposed that the Country Assessment, as the starting point for the implementation of the Global Strategy, be carried out in two stages:
• The first stage would establish the baseline information on a country’s statistical capacity, using a self-administered standard questionnaire. The aim was intended to quickly collect information from the National Statistics Offices and statistical offices in the Ministries of Agriculture, as well as from other institutions with statistical responsibilities in the agriculture sector.
4 By “prerequisites,” we mean all the institutional infrastructure such as the legal framework, strategic vision, and planning for agricultural statistics, etc.
• The second stage of the CA, called “In-depth Country Assess-ment” (IdCA) was to be carried out through expert missions and workshops to provide a detailed diagnostic report. This report would be used to develop Strategic Plans for Agricul-ture and Rural Statistics (SPARS)5 and/or Country Proposals (National Action Plans) for implementation of the Africa Action Plan at the country level. The second-stage assessment aimed to determine the human, financial, and technical resources a country would need to build a sustainable National System for Agricultural Statistics.
However, in order to speed up the process, the workshop held in Rabat, Morocco, in November 2013 recommended carrying out IdCAs not as a standalone activity but as a full part and build-ing-block of the SPARS development process.6
2.1.3 Design, process, and instruments7 of the first stage of the Country AssessmentFor the Action Plan for Africa, accumulated experience and lessons learned from previous regional initiatives were capitalized upon to inform the standard Country Assessment questionnaire to be administered in countries. The questionnaire was adapted to the needs and specificities of the African context, while also comply-ing with the objectives and framework of the Global Strategy.
Data to be gathered from National Statistics Offices and statistical agencies in agricultural sub-sectors were to be compiled through three different modules, to avoid the omission and/or duplication of required information. The modules were: Module I: Overview of the National Statistical System; Module II: On-going Statistical Activities and Constraints, and Module III: Information on Agri-cultural Sub-sectors (to be duplicated/repeated for each agricul-tural sub-sector of a given country). To facilitate the completion of the questionnaire in a uniform manner, guidelines were provided on how to collect data. The full questionnaire is presented in An-nex 1. Furthermore, two Excel templates were developed to report on the minimum core data sets and their quality respectively.
Three pilot countries (Ghana, Rwanda, and Uganda) were identi-fied to field-test the questionnaire and Excel templates. Based on the findings and lessons learned from this exercise, the question-
5 Also called Sectoral Strategic Plans for Agriculture and Rural Statistics (SSPARS).6 The workshop was attended by 85 country participants, including agricultural statistics experts from Ministries of Agriculture and National Statistical Offices (NSOs) from 48 regional member countries.7 By “instruments,” we mean all those tools that were used for carrying out the CA process: questionnaire, guidelines, data processing tools, tabulation and analysis plans, etc.
Country Assessment of Agricultural Statistical Systems in Africa Measuring the Capacity of African Countries to Produce Timely, Reliable and Sustainable Agricultural Statistics 7
naire was thereafter reviewed, revised, finalized, and translated into French.
Standard Guidelines for generating/calculating the Agricultural Sta-tistics Capacity Indicators (ASCIs) were developed by FAO in close collaboration with the AfDB. The Standard Guidelines document was reviewed to align it to the Africa CA questionnaire (see the matrix of “Mapping questions/variables/modalities to indicators: Standard versus African” in Annex A2.1). More details on the ASCIs model/calculation are presented in Section 2.4.1 below.
The system for data quality control and validation, as well as the tabulation and analysis plans, were thereafter elaborated.
2.1.4 Training on the Country Assessment process and instrumentsTwo training and launch workshops on the Action Plan for Africa (2011-2015) for Improving Statistics for Food Security, Sustain-able Agriculture, and Rural Development in general, and on the CA instruments and process in particular, were organized in June and August 2012, in Kigali, Rwanda and Addis Ababa, Ethiopia respectively.
In total, 89 officials from 48 countries were trained at these workshops. Forty-one countries were able to send both required representatives – one from their National Statistics Office (NSO) and another from their Ministry of Agriculture (MOA) – whereas 7 countries were represented by only one such delegate, and 6 countries did not send anyone. Both workshops agreed on a roadmap for the way forward regarding the process of the CA as well as other related activities, particularly operational arrangements for data compilation. The first priority activ-
ity to be carried out by each country was to establish national gover-nance structures (where these did not yet exist). This entailed the set-ting-up of a National Agricultural Statistics Committee and National Technical Working Group, and the designation of a National Strategy Coordinator (NSC) and his/her Alternate in each country.
2.2 Data collection2.2.1 Country Assessment follow-up missionsFollow-up missions to countries were undertaken and tasked to ensure, among other things, that: (i) operational structures were in place, (ii) CA data were being effectively compiled as required; (iii) minimum core data sets were being reported and their respec-tive quality evaluated; and (iv) challenges and constraints faced by countries in carrying out the CAs, as well as required concrete solutions to address them, were identified.
Such missions were fielded in 31 countries and where this was not possible, the follow-up was carried out virtually, by phone and/or emails. The main outcomes of the follow-up missions can be summarized as follows:
i) Forty-nine countries nominated their National Strategy Co-ordinators (NSCs), who constitute an important component of recommended governance structures at the country level. NSCs were, inter alia, responsible for coordinating the CA data collection in their respective countries, ensuring their consoli-dation, checking, validation and submission to the AfDB.
ii) Existing data sources of the minimum core data sets were identified and related documents/reports/files (hard and/or soft copies) collected.
iii) The quality of the minimum core data sets was evaluated and recorded using the template designed for the purpose.
8 Chapter 2 DESIGN AND METHODOLOGY
iv) Challenges and constraints faced by countries in carrying out CAs were reported and concrete steps to address these chal-lenges were proposed.
v) Mission reports were produced.
2.2.2 Setting up national governance structuresThe CA follow-up missions helped countries to establish national governance structures, including the development of their respec-tive terms of reference, identification of relevant institutions, and respective representatives/members. Briefly, the established na-tional coordination mechanism of agricultural statistics includes the following structures:
• National Agricultural Statistics Coordination Committee (NA-SCC) chaired by a data user, usually a senior policymaker at the Ministry of Agriculture. NASCC oversees the design and devel-opment of the National System of Agricultural Statistics (NSAS), ensuring its integration into the National Statistics System (NSS);
• National Strategy Coordinator (NSC) responsible for the admin-istrative and technical work in the implementation of the plan in the country; and
• Technical Working Group (TWG) covering different areas of agriculture tasked to assist the NC.
2.2.3 Impact on data reportingIn addition to helping to establish national governance structures, the follow-up missions assisted in speeding up the first stage of the CA process and data collection, ensuring their completeness. It is worth noting that, for this latest assessment, greater efforts were made by countries to respond exhaustively to all questions, including those which in the past were often ignored (e.g. on financial and human resources, and leadership), although there were challenges in reporting accurately in some countries.
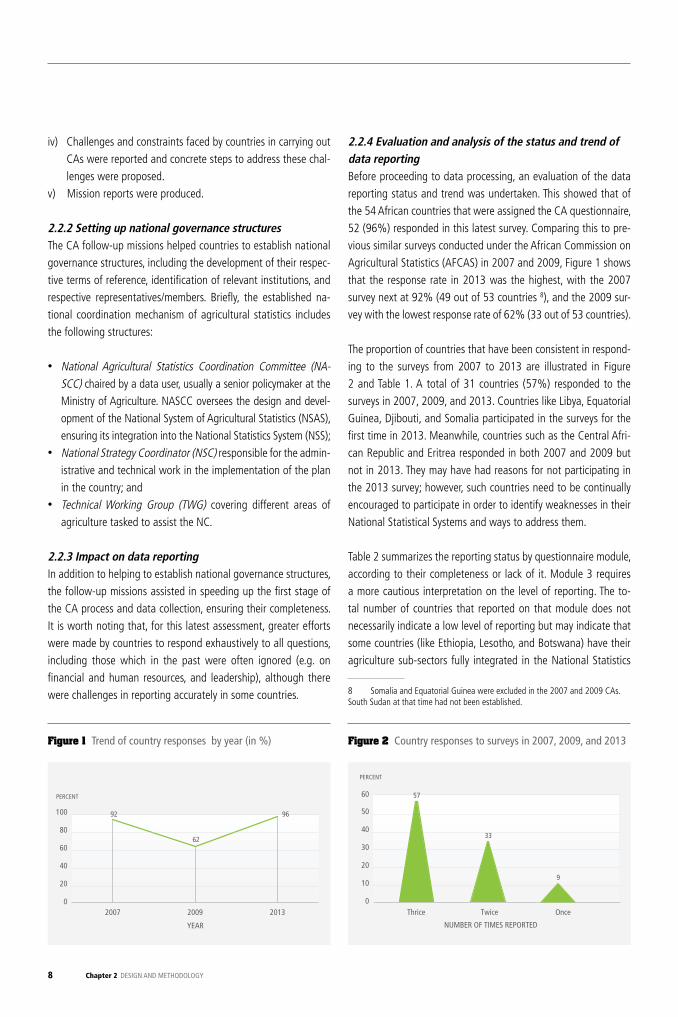
2.2.4 Evaluation and analysis of the status and trend of data reportingBefore proceeding to data processing, an evaluation of the data reporting status and trend was undertaken. This showed that of the 54 African countries that were assigned the CA questionnaire, 52 (96%) responded in this latest survey. Comparing this to pre-vious similar surveys conducted under the African Commission on Agricultural Statistics (AFCAS) in 2007 and 2009, Figure 1 shows that the response rate in 2013 was the highest, with the 2007 survey next at 92% (49 out of 53 countries 8), and the 2009 sur-vey with the lowest response rate of 62% (33 out of 53 countries). The proportion of countries that have been consistent in respond-ing to the surveys from 2007 to 2013 are illustrated in Figure 2 and Table 1. A total of 31 countries (57%) responded to the surveys in 2007, 2009, and 2013. Countries like Libya, Equatorial Guinea, Djibouti, and Somalia participated in the surveys for the first time in 2013. Meanwhile, countries such as the Central Afri-can Republic and Eritrea responded in both 2007 and 2009 but not in 2013. They may have had reasons for not participating in the 2013 survey; however, such countries need to be continually encouraged to participate in order to identify weaknesses in their National Statistical Systems and ways to address them. Table 2 summarizes the reporting status by questionnaire module, according to their completeness or lack of it. Module 3 requires a more cautious interpretation on the level of reporting. The to-tal number of countries that reported on that module does not necessarily indicate a low level of reporting but may indicate that some countries (like Ethiopia, Lesotho, and Botswana) have their agriculture sub-sectors fully integrated in the National Statistics
8 Somalia and Equatorial Guinea were excluded in the 2007 and 2009 CAs. South Sudan at that time had not been established.
Figure 1 Trend of country responses by year (in %) Figure 2 Country responses to surveys in 2007, 2009, and 2013
0
20
40
60
80
100
0
10
20
30
40
50
60
2007 2009 2013
PERCENT
PERCENT
YEAR
62
92 96
Thrice Twice Once
NUMBER OF TIMES REPORTED
57
33
9
0
20
40
60
80
100
0
10
20
30
40
50
60
2007 2009 2013
PERCENT
PERCENT
YEAR
62
92 96
Thrice Twice Once
NUMBER OF TIMES REPORTED
57
33
9

Country Assessment of Agricultural Statistical Systems in Africa Measuring the Capacity of African Countries to Produce Timely, Reliable and Sustainable Agricultural Statistics 9
Country 2007 2009 2013 TotalEquatorial Guinea 1 1Libya 1 1Somalia 1 1Djibouti 1 1South Sudan 1 1Subtotal of one response 5 5Algeria 1 1 2Chad 1 1 2Comoros 1 1 2Congo, Republic of 1 1 2Benin 1 1 2Central African Republic 1 1 2Egypt 1 1 2Eritrea 1 1 2Gabon 1 1 2Gambia 1 1 2Guinea 1 1 2Liberia 1 1 2Madagascar 1 1 2Morocco 1 1 2Seychelles 1 1 2Sierra Leone 1 1 2Sudan 1 1 2Zimbabwe 1 1 2Subtotal of two responses 18 2 16 18Guinea-Bissau 1 1 1 3Lesotho 1 1 1 3Angola 1 1 1 3Botswana 1 1 1 3Burkina Faso 1 1 1 3Burundi 1 1 1 3Cabo Verde 1 1 1 3Cameroon 1 1 1 3Congo, Democratic Republic of 1 1 1 3Côte d'Ivoire 1 1 1 3Ethiopia 1 1 1 3Ghana 1 1 1 3Kenya 1 1 1 3Malawi 1 1 1 3Mali 1 1 1 3Mauritania 1 1 1 3Mauritius 1 1 1 3Mozambique 1 1 1 3Namibia 1 1 1 3Niger 1 1 1 3Nigeria 1 1 1 3Rwanda 1 1 1 3São Tomé and Principe 1 1 1 3Senegal 1 1 1 3South Africa 1 1 1 3Swaziland 1 1 1 3Tanzania 1 1 1 3Togo 1 1 1 3Tunisia 1 1 1 3Uganda 1 1 1 3Zambia 1 1 1 3Subtotal of three responses 31 31 31 31Total Africa 49 33 52 54
Table 1 Country responses to surveys in 2007, 2009, and 2013
10 Chapter 2 DESIGN AND METHODOLOGY
System (National Bureau of Statistics). Hence data from such countries have been absorbed by Module 2.
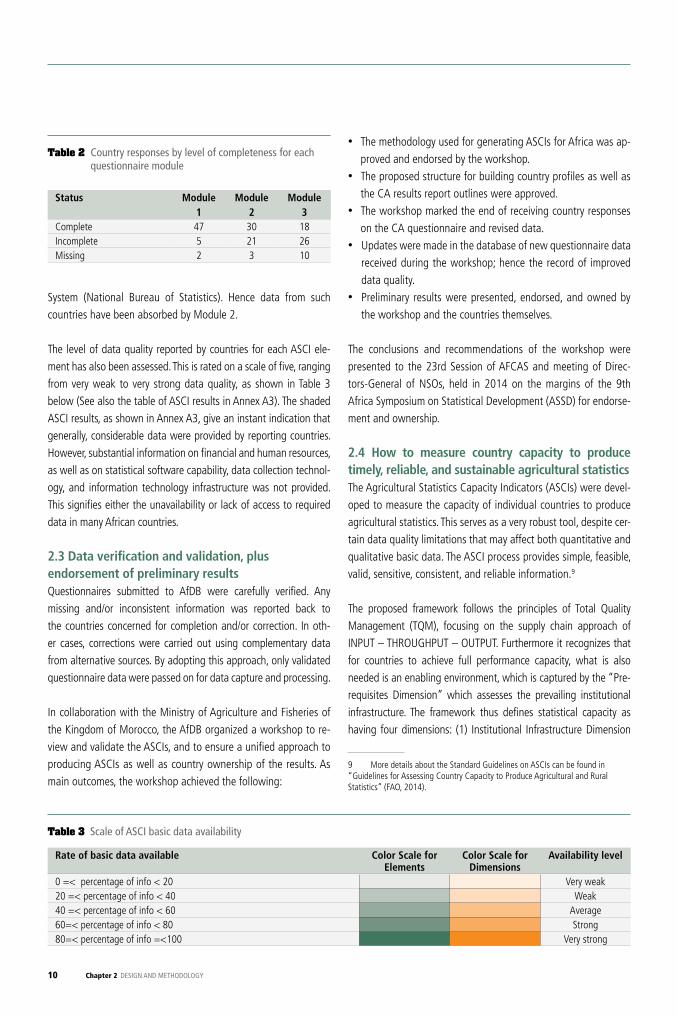
The level of data quality reported by countries for each ASCI ele-ment has also been assessed. This is rated on a scale of five, ranging from very weak to very strong data quality, as shown in Table 3 below (See also the table of ASCI results in Annex A3). The shaded ASCI results, as shown in Annex A3, give an instant indication that generally, considerable data were provided by reporting countries. However, substantial information on financial and human resources, as well as on statistical software capability, data collection technol-ogy, and information technology infrastructure was not provided. This signifies either the unavailability or lack of access to required data in many African countries.
2.3 Data verification and validation, plus endorsement of preliminary resultsQuestionnaires submitted to AfDB were carefully verified. Any missing and/or inconsistent information was reported back to the countries concerned for completion and/or correction. In oth-er cases, corrections were carried out using complementary data from alternative sources. By adopting this approach, only validated questionnaire data were passed on for data capture and processing.
In collaboration with the Ministry of Agriculture and Fisheries of the Kingdom of Morocco, the AfDB organized a workshop to re-view and validate the ASCIs, and to ensure a unified approach to producing ASCIs as well as country ownership of the results. As main outcomes, the workshop achieved the following:
• The methodology used for generating ASCIs for Africa was ap-proved and endorsed by the workshop.
• The proposed structure for building country profiles as well as the CA results report outlines were approved.
• The workshop marked the end of receiving country responses on the CA questionnaire and revised data.
• Updates were made in the database of new questionnaire data received during the workshop; hence the record of improved data quality.
• Preliminary results were presented, endorsed, and owned by the workshop and the countries themselves.
The conclusions and recommendations of the workshop were presented to the 23rd Session of AFCAS and meeting of Direc-tors-General of NSOs, held in 2014 on the margins of the 9th Africa Symposium on Statistical Development (ASSD) for endorse-ment and ownership.
2.4 How to measure country capacity to produce timely, reliable, and sustainable agricultural statisticsThe Agricultural Statistics Capacity Indicators (ASCIs) were devel-oped to measure the capacity of individual countries to produce agricultural statistics. This serves as a very robust tool, despite cer-tain data quality limitations that may affect both quantitative and qualitative basic data. The ASCI process provides simple, feasible, valid, sensitive, consistent, and reliable information.9
The proposed framework follows the principles of Total Quality Management (TQM), focusing on the supply chain approach of INPUT – THROUGHPUT – OUTPUT. Furthermore it recognizes that for countries to achieve full performance capacity, what is also needed is an enabling environment, which is captured by the “Pre-requisites Dimension” which assesses the prevailing institutional infrastructure. The framework thus defines statistical capacity as having four dimensions: (1) Institutional Infrastructure Dimension
9 More details about the Standard Guidelines on ASCIs can be found in “Guidelines for Assessing Country Capacity to Produce Agricultural and Rural Statistics” (FAO, 2014).
Status Module 1
Module 2
Module 3
Complete 47 30 18Incomplete 5 21 26Missing 2 3 10
Rate of basic data available Color Scale for Elements
Color Scale for Dimensions
Availability level
0 =< percentage of info < 20 Very weak20 =< percentage of info < 40 Weak40 =< percentage of info < 60 Average60=< percentage of info < 80 Strong80=< percentage of info =<100 Very strong
Table 2 Country responses by level of completeness for each questionnaire module
Table 3 Scale of ASCI basic data availability
Country Assessment of Agricultural Statistical Systems in Africa Measuring the Capacity of African Countries to Produce Timely, Reliable and Sustainable Agricultural Statistics 11
(Prerequisites), (2) Resources Dimension (Input), (3) Statistical Methods and Practices Dimension (Throughput), and (4) Availability of Statistical Information Dimension (Output). Each of these four dimensions captures a set of elements of capacity which may be independent of each other and at different levels of development. The ASCIs are therefore grouped into the above four dimensions and respective elements in accordance with the global Standard Guidelines developed for that purpose by FAO (FAO, 2014).
The indicator on the Institutional Infrastructure Dimension (Prerequisites) provides an amalgamation of assessments on five main elements, namely: (i) the Legal Framework; (ii) Coordi-nation in the National Statistical System; (iii) Strategic Vision and Planning for Agriculture Statistics; (iv) Integration of Agriculture in the National Statistical System; and (v) Relevance of Data. This Prerequisites Dimension is a primary requirement for smooth and efficient running of any system. It translates into the fact that ev-ery public statistical activity needs to be underpinned by a legal authority to undertake certain operations of field data collection. There is also the need for coordination of national efforts to avoid duplication and inconsistency in statistics procedures. It is equally important to have a system informed by a Strategic Vision, which sets the parameters for development and prescribes the method-ology and technology to be adopted but with room for adjustment on annual programs, based on budgetary allocations. The integra-tion of agriculture statistics into the National Statistical System provides a wider scope for data analysis. Sustainability of com-munication channels between data producers and users is also crucial to maintain the relevance of data (ensuring that they meet user requirements, expectations, and satisfaction).
The Resources Dimension (Input) shows the strength of a country in deploying adequate resources to execute statistical ac-tivities. It involves three essential elements to undertake statistical work: the existence of qualified (quality and quantity) permanent personnel for planning and execution of activities; financial re-sources to hire the necessary personnel and meet related expen-diture specific to activities; and the physical infrastructure which can serve a variety of activities. The human resources indicator comprises two components, (i) the number of staff available in the workforce, and (ii) the depth of their knowledge, training, and experience. The Resources indicator of each country capacity is an amalgamation of these different elements.
The Statistical Methods and Practices Dimension (Throughput) gives an overall picture of the capability of each country to undertake the agricultural statistical activities in a pro-
fessional manner. This dimension of country capacity reflects nine elements. The first three relate to the use of information technol-ogy, to include statistical software capability, data collection tech-nology, and information technology infrastructure. The next three elements focus on the adoption of statistical standards, statistical activities, and the analysis and use of the data collected. The other elements focus on agricultural surveys, and on agricultural and market price information. The remaining element captures the perception of how well the country is performing on this dimen-sion (Quality Consciousness).
Availability of Statistical Information Dimension (Out-put) considers the minimum set of core data, as determined by the Global Strategy. It includes statistics on the production of ma-jor crops, livestock, aquaculture and fisheries, and forestry prod-ucts. The second requirement is economic data on the agricultural holdings, including inputs and outputs. The third requirement is to collect data on the use of fertilizers, chemicals, tillage methods, and other land-use activities to monitor how agricultural produc-tion affects the environment. The fourth requirement is to mea-sure the social well-being of the farming and rural households. This indicator gives an idea of the extent to which a statistical system is producing the minimum core set of data for the coun-try. It signifies the strength of data availability, their timeliness and accessibility, as well as how their overall quality is perceived among countries.
For Africa, a mapping has been done to link CA relevant questions (standard vs. African) to indicators/dimensions and elements (see Annex A2.1). The Excel Model to generate ASCIs has been based on those dimensions, and takes into account respective elements within each one of them. The four dimensions are aggregated (av-erage in %) into a composite ASCI indicator to enable country ranking according to the level of development of the National System of Agricultural statistics (NSAS) as a whole.
For example, for a legal framework to be fit for purpose, it needs to have in place a legal or statutory basis for statistical activities in the country in general (to be marked 1 if yes and zero if no) and a legal basis for the collection of agricultural statistics in particular (1 if yes and zero if no) which are operational (1 if yes and zero if no) and fully adequate (2 if yes, 1 if adequate, and zero if inade-quate). Such an ideal situation would count for 100% (5 out of 5) of scoring. The scoring and formulas used for each element and dimension are presented in Annexes A2.2 and A2.3. Furthermore, the ASCI Model allows automatic generation of radar and histo-gram charts to ease the analysis of resulting indicators.
12 Chapter 2 DESIGN AND METHODOLOGY
The four dimensions are aggregated into a composite indicator to measure each country’s capacity as a whole to produce agri-cultural statistics. The ASCIs place emphasis on the strengths and weaknesses that exist in specific areas of the National Statistical Systems, especially in agricultural statistics in Africa. This then contributes to the overall quality level of information produced and used on regular basis. All related data for each dimension and associated elements are presented in Annex A5 of this report.
In addition to key ASCI results, ranking and grouping of countries according to their strengths in the various components of each dimension, as well as their level of GDP and Agriculture Value Added (VA) as a % of GDP, have been established. The average of all the dimensions is also used to rank the countries according to the development level of their respective agricultural statistics systems as a whole. It should however be clarified that this is a relative ranking. It is not intended to show which country comes first or last for a given indicator, but rather aims at identifying
where best practices can be found. It also establishes starting points or benchmarks, against which a country can measure its performance and progress in related areas toward achieving the objectives of the Africa Action Plan of the Global Strategy.
Countries were divided into five groupings (A, B, C, D, and E) rang-ing from Very Weak to Very Strong indicator values on the ASCI scoring system:
Group A – very weak indicator values (ASCIs less than 20%); Group B – weak indicator values (ASCIs between 20% and 40%); Group C – average indicator values (ASCIs between 40% and 60%); Group D – strong indicator values (ASCIs between 60% and 80%); andGroup E – very strong indicator values (ASCIs between 80% and 100%).
A further analysis was carried out on the correlation between fi-nancial resources (GDP per capita), importance of the agriculture sector (through Agriculture Value Added or VA) of each country, and the level of each ASCI dimension. (See the 2013 GDP per capita and per country in Table A6 and Figure A7 in Annexes 6 and 7, respectively); hence the need to examine other country groupings:10
• GDP per capita groupings: Lowest $0-999; Low $1,000-1,999; Average $2,000-3,999; High $4,000-9,999; Highest $10,000+; and
• Agriculture Value Added (VA) as % of GDP groupings: Lowest 0-20%; Low 20-40%; Average 40-60%; High 60-80%; Highest 80-100%.
Terrestrial mapping of each dimension is also provided in this report. The maps show the level of countries’ capacity for Dimen-sions 1 to 4 and the Composite indicator respectively in five col-or ranges, from Very Weak to Very Strong. This conforms to the grouping of the ASCI among countries. The mapping presents a quick overview of the Africa’s capacity level on each dimension.11
10 It should be noted that the nominal per capita GDPs are used as proxies of real per capita GDPs.11 Disclaimer: Care was taken in the creation of those maps. However, country boundaries and/or information shown there are the responsibility of the authors; they do not reflect the AfDB position nor do they correspond to official country maps. Notification of any possible error is welcomed.
Country Assessment of Agricultural Statistical Systems in Africa Measuring the Capacity of African Countries to Produce Timely, Reliable and Sustainable Agricultural Statistics 13
2.5 Data capture and processingData were captured and processed using two different means:
1. An Excel model was developed to capture relevant informa-tion for the calculation and automatic generation of the ASCI results as well as related graphs; and
2. Epi-Data software was used to capture all data for compre-hensive results tabulation. In fact, this is generally used to capture the data and enables the necessary checks and value labels to produce high-data quality. A comprehensive data input system was designed with it. Validated data were ex-ported to SPSS for further processing and generation of result tables.
2.6 Data tabulation and analysisData were comprehensively tabulated and analyzed using SPSS, whilst MS-Excel was used in graphical analysis. A tabulation plan (list of possible tables) had been prepared to report on the fre-quencies of facts by country and/or correlation between them. A comparative analysis of the assessment results over three succes-sive cycles (2007, 2009, and 2013) was also conducted to com-pare the agricultural statistics activities or performance on the African continent over the period.
2.7 Dissemination strategy of the CA resultsTo report comprehensively on the 2013 CA results, the following approach was agreed:
i) This first report presents the methodology and instruments used for the whole CA process as well as the main ASCI results, including the country rankings and groupings.
ii) The second report presents the country profiles, based on their respective detailed ASCI results.
iii) The third report contains a set of tabulated data from the three CA cycles (2007, 2009 and 2013), including a compar-ative and trend analysis.
The series of reports is to be produced first in English and there-after translated into French for a wider circulation. In addition to the production of hard copies, which will be distributed to stake-holders across the continent, the reports will be reproduced elec-tronically, through flash discs, the AfDB internet/website, as well as in the form of an eBook for easy access and wider distribution.
Chapter x Xxxxxxxxxxxxxx xxxxxxxxxxx14
3. EXPERIENCE, LESSONS LEARNED, AND CONSTRAINTS
Country Assessment of Agricultural Statistical Systems in Africa Measuring the Capacity of African Countries to Produce Timely, Reliable and Sustainable Agricultural Statistics 15
3.1 Experience and lessons learned3.1.1 Requirement to adapt the standard CA instruments to the regional context and specificitiesThe CA standard questionnaire was reviewed to take into account lessons learned from previous similar assessments, as well as the African context and specificities. Consequently, five principal steps were taken:
i) The main questionnaire was structured into three modules to report on information of a general nature coming from the National Bureau of Statistics, and from specific sub-sectors of agriculture individually, hence avoiding possible omission and/or duplication of data (e.g. on financial and human resources).
ii) Key guidelines, concepts, and definitions were incorporated directly into the questionnaire to ease its completion and en-sure a common understanding of what was required.
iii) Questions (variables and modalities) were mapped to ensure an easy interpretation of the resulting ASCIs for Africa, as well as their comparability with those of other regions (see Annex A2.1).
iv) Two additional Excel templates were developed to report on an extended list of the minimum core data sets and their quality respectively, beyond what is required by the standard questionnaire (e.g. data reported exclusively for major select-ed commodity groups: crop production, livestock production, etc.).
v) The three CA instruments were prepared in both English and French for use in countries’ respective official languages.
3.1.2 Importance of field-testing the CA instrumentsThe field-testing of the CA instruments proved very useful for their fine-tuning, and to ensure that they were adapted to the context and real needs of the exercise. The field-testing also helped to identify potential problems and constraints in advance, so that required solutions and actions could be prepared.
3.1.3 Usefulness of the training workshop on CA instruments and processThe selection and training of representatives from two key institu-tions in each country (the Ministry of Agriculture and the National Statistics Office) enhanced good collaboration and coordination of the work program in each country. Concepts and definitions were well explained and understood, and guidance on conducting the CA process as a whole was provided. This significantly im-proved the quality of collected data, while ensuring awareness of the importance of the CA exercise to those most directly involved.
3.1.4 CA follow-up missions (including virtual follow-ups), data checks and the validation processFollow-up missions helped to boost the CA process by (i) assisting countries to set up national governance structures (see example in Annex A4), (ii) ensuring that the national Technical Working Groups were well established (with representatives from all ag-ricultural sub-sectors) and that they functioned appropriately (by submitting their respective CA data) and were well coordinated (by the National Strategy Coordinators who organized meetings for data consolidation and validation). This helped to foster an excellent team spirit among officials, while ensuring the required quality of the compiled data.
However, some countries encountered difficulties in securing funding for their Technical Working Group meetings. Other coun-tries had difficulty in completing the questionnaire within the stip-ulated timeframe, simply because the National Statistics Offices and line ministries responsible for each agricultural sub-sector were not housed at the same location. Furthermore, some of the requested data were considered sensitive and were in the custody of non-statistical units (e.g. financial and human resources infor-mation, etc.), which explains the difficulties in procuring them on time.
In any case, regular follow-ups and virtual interactions with countries through emails and telephone calls proved to be very useful in finding solutions to problems encountered by national staff carrying out statistical work. Continuous communications also allowed countries to gain clarification on how to complete the questionnaire and/or to feed back missing information in real time, thereby safeguarding data quality and completeness.
Follow-up and monitoring to ensure timely responses from coun-tries proved necessary in many cases. Every completed ques-tionnaire was considered valid only after it had been thoroughly checked before data capture and processing.
3.1.5 Need for a workshop for countries to review, endorse, and own the CA resultsA workshop was organized to enable African countries to share and discuss the CA results. This provided an opportunity for them to endorse and own the results of the exercise.
3.2 ConstraintsIt cannot be emphasized enough that the quality of the CA results in general, and the ASCIs in particular, relies heavily on the basic information reported directly by countries, particularly in terms
16 Chapter 3 EXPERIENCE, LESSONS LEARNED, AND CONSTRAINTS
of accuracy and completeness. For this reason, countries need to be aware of the importance of responding in a more timely and comprehensive manner to future country assessments of this kind.
The following factors were deemed to have affected the quality of the basic information used to generate the CA results and in-dicators:
• The revision of the standard version of the CA questionnaire after the Africa questionnaire had been finalized and already administrated to countries led to inconsistencies in the way some of the ASCIs were calculated and generated. It therefore became necessary to redefine formulas and/or the scoring of related variables.
• The unavailability of comprehensive standard guidelines for the completion of the questionnaire at the time of sending it out impacted on countries’ ability to complete the exercise in a consistent and coherent manner.
• The follow-up and monitoring of responses from countries be-came quite demanding. Some countries did not submit data within the stipulated timeframe, which was partly because the questionnaire demands responses from more than one insti-tution. This was due to the fact that there are sections of the questionnaire, especially in Module III, that require all line min-istries responsible for each sub-sector of agriculture to make their respective inputs. It is important to note that some of the concerned ministries are not housed at one location. Fur-thermore, some portions of the questionnaire were not well completed. In particular, sensitive sections such as financial resources, human resources, and number of computers in use by countries were not fully completed by some countries. This impeded detailed analysis of information. For this reason, a great deal of pressure was exerted on the countries to respond in a timely manner, comprehensively and consistently to all questions.
• Some countries kept on sending updates or revised question-naires. This led to further delays in completing data processing and analysis.
Country Assessment of Agricultural Statistical Systems in Africa Measuring the Capacity of African Countries to Produce Timely, Reliable and Sustainable Agricultural Statistics 17
4. AGRICULTURAL STATISTICS CAPACITY INDICATORS (ASCIs)
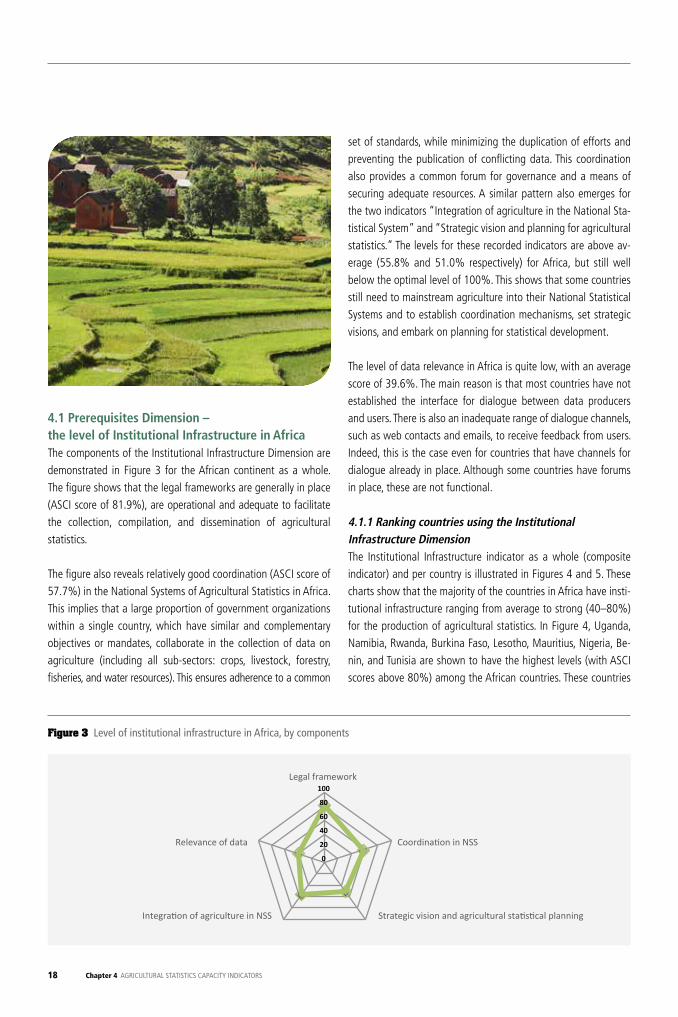
18 Chapter 4 AGRICULTURAL STATISTICS CAPACITY INDICATORS
4.1 Prerequisites Dimension – the level of Institutional Infrastructure in AfricaThe components of the Institutional Infrastructure Dimension are demonstrated in Figure 3 for the African continent as a whole. The figure shows that the legal frameworks are generally in place (ASCI score of 81.9%), are operational and adequate to facilitate the collection, compilation, and dissemination of agricultural statistics.
The figure also reveals relatively good coordination (ASCI score of 57.7%) in the National Systems of Agricultural Statistics in Africa. This implies that a large proportion of government organizations within a single country, which have similar and complementary objectives or mandates, collaborate in the collection of data on agriculture (including all sub-sectors: crops, livestock, forestry, fisheries, and water resources). This ensures adherence to a common
set of standards, while minimizing the duplication of efforts and preventing the publication of conflicting data. This coordination also provides a common forum for governance and a means of securing adequate resources. A similar pattern also emerges for the two indicators “Integration of agriculture in the National Sta-tistical System” and “Strategic vision and planning for agricultural statistics.” The levels for these recorded indicators are above av-erage (55.8% and 51.0% respectively) for Africa, but still well below the optimal level of 100%. This shows that some countries still need to mainstream agriculture into their National Statistical Systems and to establish coordination mechanisms, set strategic visions, and embark on planning for statistical development.
The level of data relevance in Africa is quite low, with an average score of 39.6%. The main reason is that most countries have not established the interface for dialogue between data producers and users. There is also an inadequate range of dialogue channels, such as web contacts and emails, to receive feedback from users. Indeed, this is the case even for countries that have channels for dialogue already in place. Although some countries have forums in place, these are not functional.
4.1.1 Ranking countries using the Institutional Infrastructure DimensionThe Institutional Infrastructure indicator as a whole (composite indicator) and per country is illustrated in Figures 4 and 5. These charts show that the majority of the countries in Africa have insti-tutional infrastructure ranging from average to strong (40–80%) for the production of agricultural statistics. In Figure 4, Uganda, Namibia, Rwanda, Burkina Faso, Lesotho, Mauritius, Nigeria, Be-nin, and Tunisia are shown to have the highest levels (with ASCI scores above 80%) among the African countries. These countries
Figure 3 Level of institutional infrastructure in Africa, by components
0
20
40
60
80
100Legal framework
Coordination in NSS
Strategic vision and agricultural statistical planning Integration of agriculture in NSS
Relevance of data
Financial resources
Human resources: staffing
Human resources: training
Physical infrastructure
Statistical software capability
Data collection technology
Info. technology infrastructure
Adoption of international standards
General statistical activities Agric. market and price info.
Agricultural surveys
Analysis and use of data
Quality consciousness
Core data availability
Timeliness
Overall data quality perception
Data accessibility
0
20
40
60
80
100
0
20
40
60
80
100
0
20
40
60
80
100
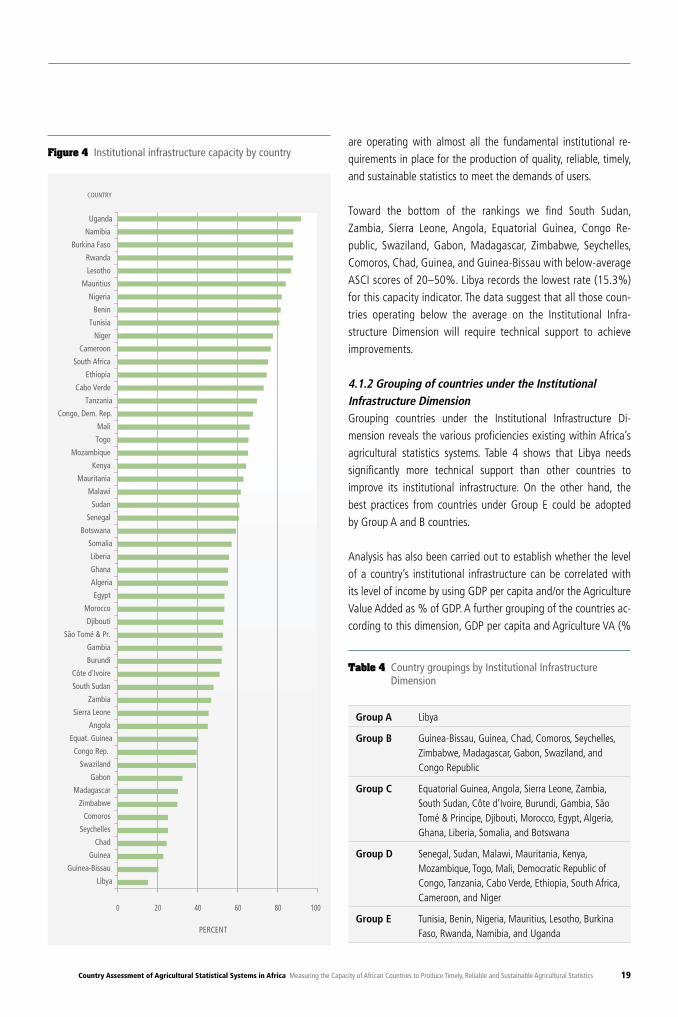
Country Assessment of Agricultural Statistical Systems in Africa Measuring the Capacity of African Countries to Produce Timely, Reliable and Sustainable Agricultural Statistics 19
are operating with almost all the fundamental institutional re-quirements in place for the production of quality, reliable, timely, and sustainable statistics to meet the demands of users.
Toward the bottom of the rankings we find South Sudan, Zambia, Sierra Leone, Angola, Equatorial Guinea, Congo Re-public, Swaziland, Gabon, Madagascar, Zimbabwe, Seychelles, Comoros, Chad, Guinea, and Guinea-Bissau with below-average ASCI scores of 20–50%. Libya records the lowest rate (15.3%) for this capacity indicator. The data suggest that all those coun-tries operating below the average on the Institutional Infra-structure Dimension will require technical support to achieve improvements.
4.1.2 Grouping of countries under the Institutional Infrastructure DimensionGrouping countries under the Institutional Infrastructure Di-mension reveals the various proficiencies existing within Africa’s agricultural statistics systems. Table 4 shows that Libya needs significantly more technical support than other countries to improve its institutional infrastructure. On the other hand, the best practices from countries under Group E could be adopted by Group A and B countries.
Analysis has also been carried out to establish whether the level of a country’s institutional infrastructure can be correlated with its level of income by using GDP per capita and/or the Agriculture Value Added as % of GDP. A further grouping of the countries ac-cording to this dimension, GDP per capita and Agriculture VA (%
Figure 4 Institutional infrastructure capacity by country
COUNTRY
0 20 40 60 80 100
PERCENT
Uganda
Namibia
Burkina Faso
Rwanda
Lesotho
Mauritius
Nigeria
Benin
Tunisia
Niger
Cameroon
South Africa
Ethiopia
Cabo Verde
Tanzania
Congo, Dem. Rep.
Mali
Togo
Mozambique
Kenya
Mauritania
Malawi
Sudan
Senegal
Botswana
Somalia
Liberia
Ghana
Algeria
Egypt
Morocco
Djibouti
São Tomé & Pr.
Gambia
Burundi
Côte d'Ivoire
South Sudan
Zambia
Sierra Leone
Angola
Equat. Guinea
Congo Rep.
Swaziland
Gabon
Madagascar
Zimbabwe
Comoros
Seychelles
Chad
Guinea
Guinea-Bissau
Libya
Group A Libya
Group B Guinea-Bissau, Guinea, Chad, Comoros, Seychelles, Zimbabwe, Madagascar, Gabon, Swaziland, and Congo Republic
Group C Equatorial Guinea, Angola, Sierra Leone, Zambia, South Sudan, Côte d’Ivoire, Burundi, Gambia, São Tomé & Principe, Djibouti, Morocco, Egypt, Algeria, Ghana, Liberia, Somalia, and Botswana
Group D Senegal, Sudan, Malawi, Mauritania, Kenya, Mozambique, Togo, Mali, Democratic Republic of Congo, Tanzania, Cabo Verde, Ethiopia, South Africa, Cameroon, and Niger
Group E Tunisia, Benin, Nigeria, Mauritius, Lesotho, Burkina Faso, Rwanda, Namibia, and Uganda
Table 4 Country groupings by Institutional Infrastructure Dimension
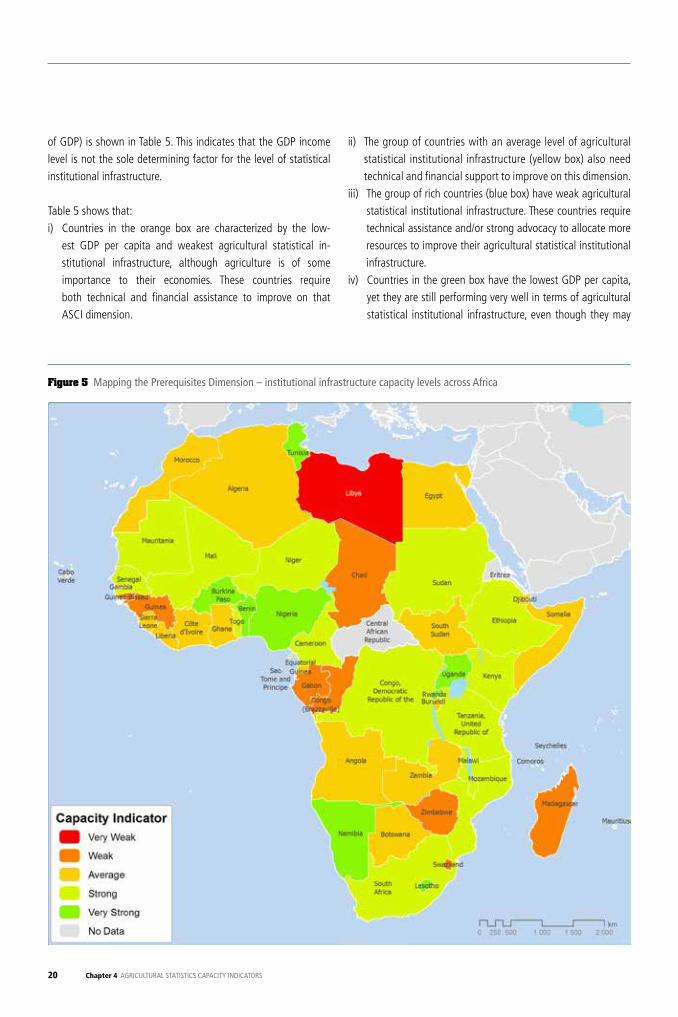
20 Chapter 4 AGRICULTURAL STATISTICS CAPACITY INDICATORS
of GDP) is shown in Table 5. This indicates that the GDP income level is not the sole determining factor for the level of statistical institutional infrastructure.
Table 5 shows that:i) Countries in the orange box are characterized by the low-
est GDP per capita and weakest agricultural statistical in-stitutional infrastructure, although agriculture is of some importance to their economies. These countries require both technical and financial assistance to improve on that ASCI dimension.
ii) The group of countries with an average level of agricultural statistical institutional infrastructure (yellow box) also need technical and financial support to improve on this dimension.
iii) The group of rich countries (blue box) have weak agricultural statistical institutional infrastructure. These countries require technical assistance and/or strong advocacy to allocate more resources to improve their agricultural statistical institutional infrastructure.
iv) Countries in the green box have the lowest GDP per capita, yet they are still performing very well in terms of agricultural statistical institutional infrastructure, even though they may
Figure 5 Mapping the Prerequisites Dimension – institutional infrastructure capacity levels across Africa
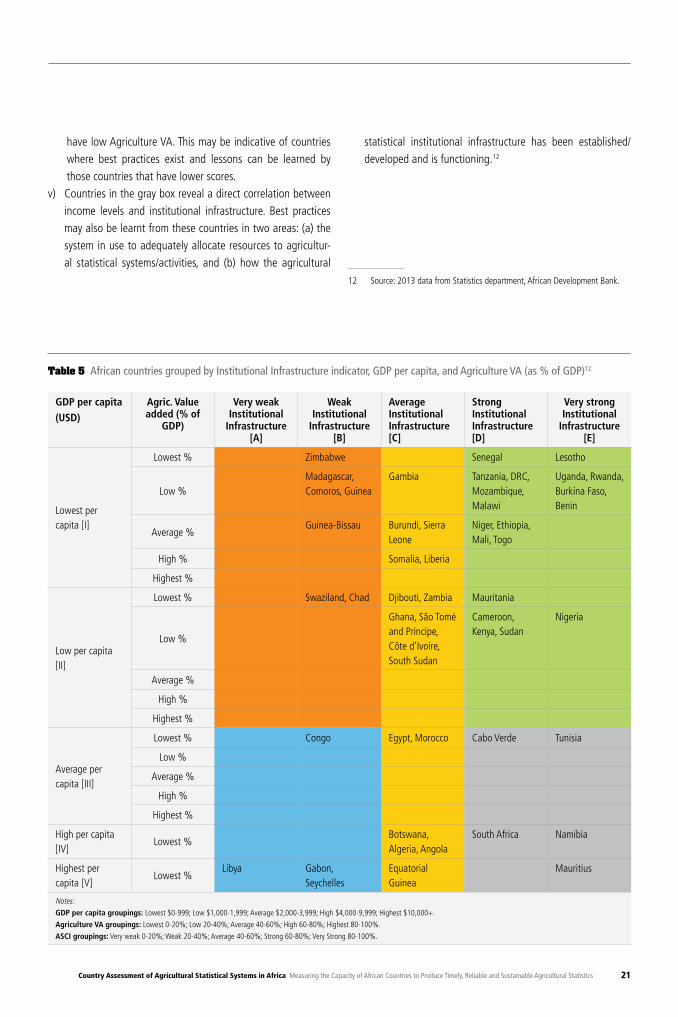
Country Assessment of Agricultural Statistical Systems in Africa Measuring the Capacity of African Countries to Produce Timely, Reliable and Sustainable Agricultural Statistics 21
have low Agriculture VA. This may be indicative of countries where best practices exist and lessons can be learned by those countries that have lower scores.
v) Countries in the gray box reveal a direct correlation between income levels and institutional infrastructure. Best practices may also be learnt from these countries in two areas: (a) the system in use to adequately allocate resources to agricultur-al statistical systems/activities, and (b) how the agricultural
statistical institutional infrastructure has been established/developed and is functioning.12
12 Source: 2013 data from Statistics department, African Development Bank.
GDP per capita(USD)
Agric. Value added (% of
GDP)
Very weak Institutional
Infrastructure [A]
Weak Institutional
Infrastructure [B]
Average Institutional Infrastructure [C]
Strong Institutional Infrastructure [D]
Very strong Institutional
Infrastructure [E]
Lowest per capita [I]
Lowest % Zimbabwe Senegal Lesotho
Low %Madagascar, Comoros, Guinea
Gambia Tanzania, DRC, Mozambique, Malawi
Uganda, Rwanda, Burkina Faso, Benin
Average %Guinea-Bissau Burundi, Sierra
LeoneNiger, Ethiopia, Mali, Togo
High % Somalia, Liberia
Highest %
Low per capita [II]
Lowest % Swaziland, Chad Djibouti, Zambia Mauritania
Low %
Ghana, São Tomé and Principe, Côte d'Ivoire, South Sudan
Cameroon, Kenya, Sudan
Nigeria
Average %
High %
Highest %
Average per capita [III]
Lowest % Congo Egypt, Morocco Cabo Verde Tunisia
Low %
Average %
High %
Highest %
High per capita [IV]
Lowest %Botswana, Algeria, Angola
South Africa Namibia
Highest per capita [V]
Lowest %Libya Gabon,
SeychellesEquatorial Guinea
Mauritius
Notes:GDP per capita groupings: Lowest $0-999; Low $1,000-1,999; Average $2,000-3,999; High $4,000-9,999; Highest $10,000+.
Agriculture VA groupings: Lowest 0-20%; Low 20-40%; Average 40-60%; High 60-80%; Highest 80-100%.
ASCI groupings: Very weak 0-20%; Weak 20-40%; Average 40-60%; Strong 60-80%; Very Strong 80-100%.
Table 5 African countries grouped by Institutional Infrastructure indicator, GDP per capita, and Agriculture VA (as % of GDP)12
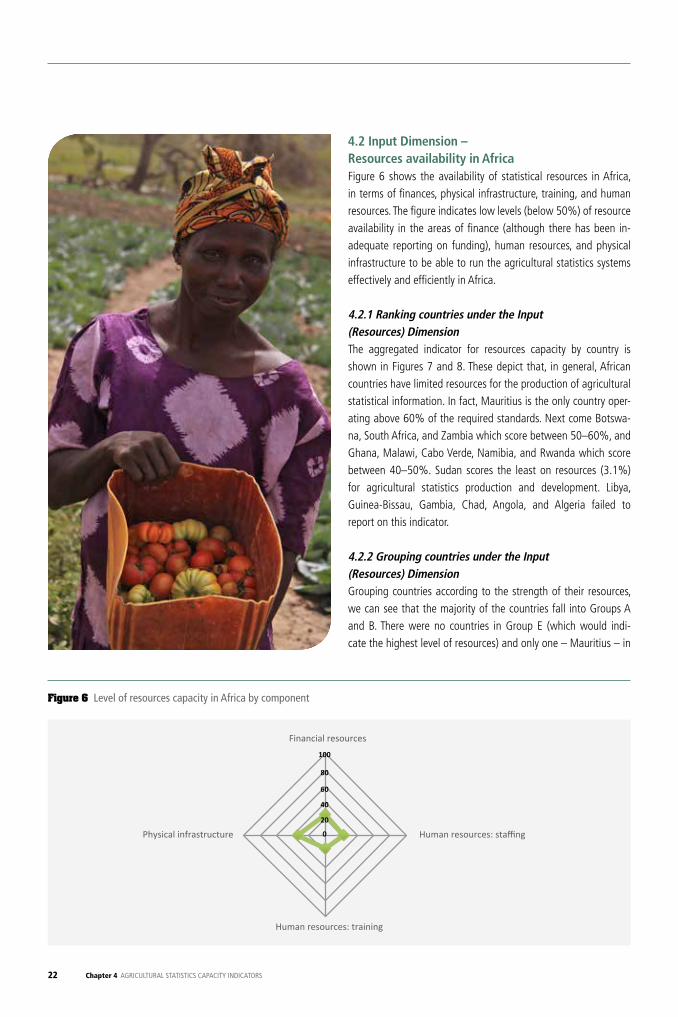
22 Chapter 4 AGRICULTURAL STATISTICS CAPACITY INDICATORS
4.2 Input Dimension – Resources availability in AfricaFigure 6 shows the availability of statistical resources in Africa, in terms of finances, physical infrastructure, training, and human resources. The figure indicates low levels (below 50%) of resource availability in the areas of finance (although there has been in-adequate reporting on funding), human resources, and physical infrastructure to be able to run the agricultural statistics systems effectively and efficiently in Africa.
4.2.1 Ranking countries under the Input (Resources) DimensionThe aggregated indicator for resources capacity by country is shown in Figures 7 and 8. These depict that, in general, African countries have limited resources for the production of agricultural statistical information. In fact, Mauritius is the only country oper-ating above 60% of the required standards. Next come Botswa-na, South Africa, and Zambia which score between 50–60%, and Ghana, Malawi, Cabo Verde, Namibia, and Rwanda which score between 40–50%. Sudan scores the least on resources (3.1%) for agricultural statistics production and development. Libya, Guinea-Bissau, Gambia, Chad, Angola, and Algeria failed to report on this indicator. 4.2.2 Grouping countries under the Input (Resources) DimensionGrouping countries according to the strength of their resources, we can see that the majority of the countries fall into Groups A and B. There were no countries in Group E (which would indi-cate the highest level of resources) and only one – Mauritius – in
Figure 6 Level of resources capacity in Africa by component
0
20
40
60
80
100Legal framework
Coordination in NSS
Strategic vision and agricultural statistical planning Integration of agriculture in NSS
Relevance of data
Financial resources
Human resources: staffing
Human resources: training
Physical infrastructure
Statistical software capability
Data collection technology
Info. technology infrastructure
Adoption of international standards
General statistical activities Agric. market and price info.
Agricultural surveys
Analysis and use of data
Quality consciousness
Core data availability
Timeliness
Overall data quality perception
Data accessibility
0
20
40
60
80
100
0
20
40
60
80
100
0
20
40
60
80
100

Country Assessment of Agricultural Statistical Systems in Africa Measuring the Capacity of African Countries to Produce Timely, Reliable and Sustainable Agricultural Statistics 23
Group D. This means that at the time of the Country Assessment exercise, there were very low financial and human resources allo-cated to agricultural statistical activities (Table 6). Countries in Af-rica generally need a lot of support in appropriating funds towards the agricultural statistics activities.
Table 7 evaluates the Resources Dimension against GDP per capita and Agriculture Value Added (as a % of GDP). This clearly demonstrates that rich countries (in the blue box) do not nec-essarily allocate the required level of resources for agricultural statistics activities. This is often because funds are channeled to other national programs which may be given higher priority. Nev-ertheless, advocacy is needed in such cases to explain why it is so important to increase support to agricultural statistics systems, particularly to improve food security as well as boosting GDP and sustainable livelihoods for the rural population, and to feed the in-creasing numbers of migrants moving to the cities. This may mean not only increased funding per se, but also training the requisite personnel to run agricultural statistical programs, as they contrib-ute to national development planning.
Mauritius (gray box) presents an interesting case. The agriculture sector’s contribution to the economy is one of the lowest on the continent (3.5% in 2013) and yet substantial resources are made available for agricultural statistics (Mauritius presents the highest Resources indicator).
Figure 7 Resources capacity level by country
COUNTRY
0 20 40 60 80 100
Angola
Algeria
Chad
Gambia
Guinea-Bissau
Libya
Sudan
Congo, Dem. Rep
Equat. Guinea
Somalia
Madagascar
Niger Burundi
Zimbabwe
Djibouti Congo Rep.
Guinea
Togo Sierra Leone
Comoros
South Sudan
Mauritania Morocco
Benin Tanzania
Seychelles
Tunisia
Burkina Faso
Mali
Swaziland
Lesotho Cameroon
Gabon Nigeria
Liberia Kenya
Ethiopia Côte d'Ivoire
Mozambique São Tomé & Pr.
Egypt Senegal
Uganda
Rwanda
Namibia
Cabo VerdeMalawi
Ghana
Zambia
Botswana
Mauritius
South Africa
PERCENT
Group A Algeria, Angola, Chad, Gambia, Guinea-Bissau, Libya, Sudan, Democratic Republic of Congo, Equatorial Guinea, Somalia, Madagascar, Niger, Burundi, Zimbabwe, Djibouti, Congo Republic, Guinea, Togo, Sierra Leone, Comoros, South Sudan, Mauritania, Morocco, and Benin
Group B Tanzania, Seychelles, Burkina Faso, Tunisia, Mali, Swaziland, Lesotho, Cameroon, Gabon, Nigeria, Senegal, Kenya, Egypt, Ethiopia, Côte d’Ivoire, Mozambique, São Tomé and Principe, Uganda, and Liberia
Group C Rwanda, Namibia, Cabo Verde, Malawi, Ghana, Zambia, South Africa, and Botswana
Group D Mauritius
Group E -
Table 6 Country groupings by Resources Dimension
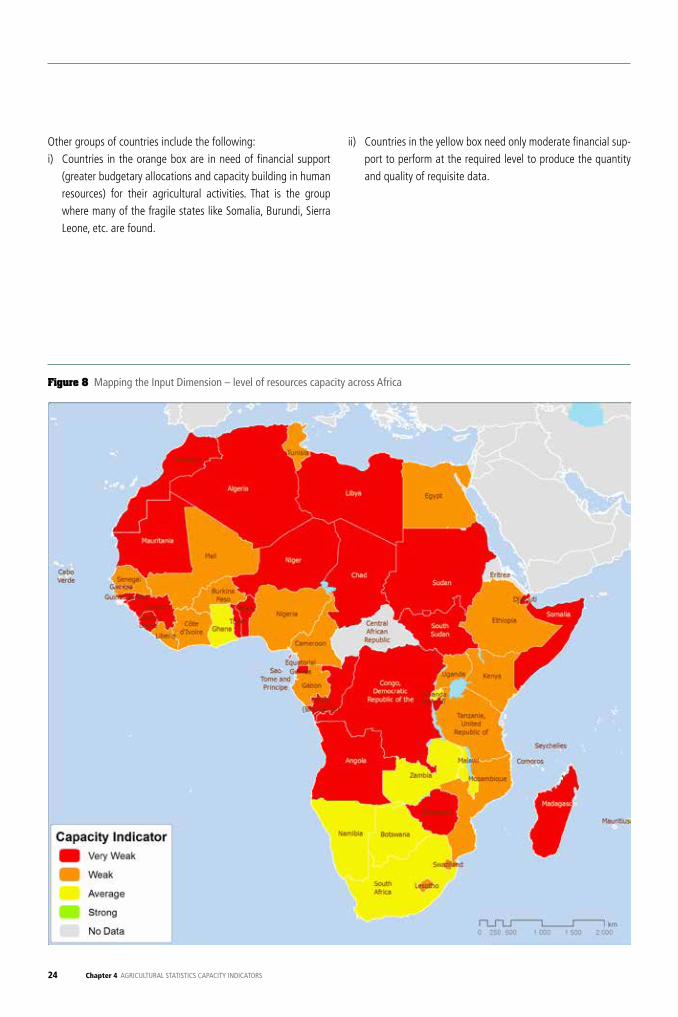
24 Chapter 4 AGRICULTURAL STATISTICS CAPACITY INDICATORS
Other groups of countries include the following: i) Countries in the orange box are in need of financial support
(greater budgetary allocations and capacity building in human resources) for their agricultural activities. That is the group where many of the fragile states like Somalia, Burundi, Sierra Leone, etc. are found.
ii) Countries in the yellow box need only moderate financial sup-port to perform at the required level to produce the quantity and quality of requisite data.
Figure 8 Mapping the Input Dimension – level of resources capacity across Africa
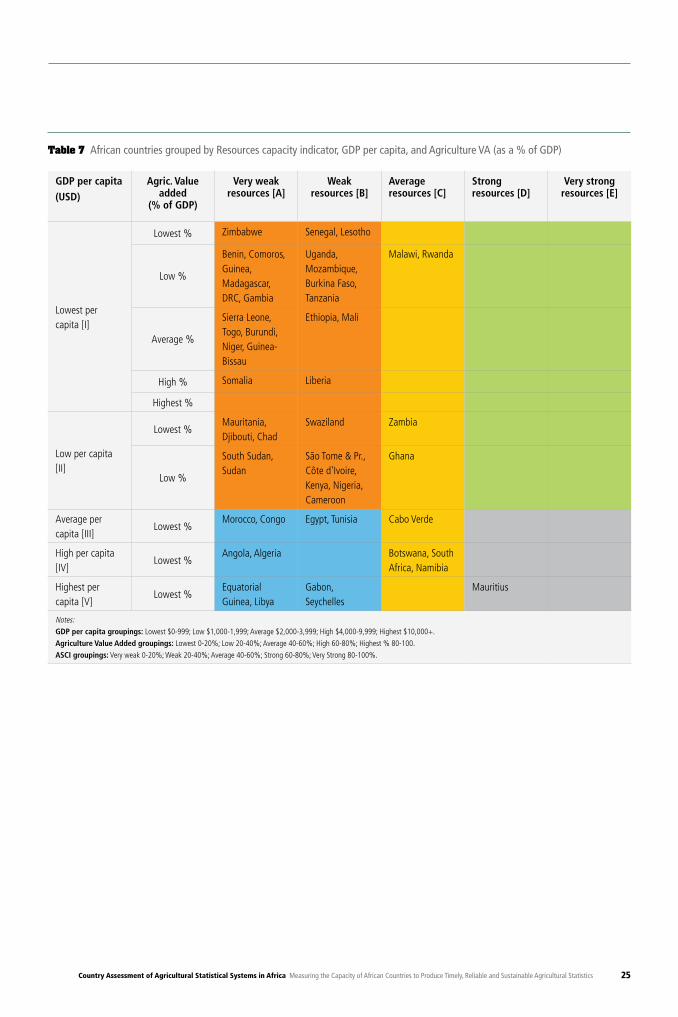
Country Assessment of Agricultural Statistical Systems in Africa Measuring the Capacity of African Countries to Produce Timely, Reliable and Sustainable Agricultural Statistics 25
GDP per capita(USD)
Agric. Value added
(% of GDP)
Very weak resources [A]
Weak resources [B]
Average resources [C]
Strong resources [D]
Very strong resources [E]
Lowest per capita [I]
Lowest % Zimbabwe Senegal, Lesotho
Low %
Benin, Comoros, Guinea, Madagascar, DRC, Gambia
Uganda, Mozambique, Burkina Faso, Tanzania
Malawi, Rwanda
Average %
Sierra Leone, Togo, Burundi, Niger, Guinea-Bissau
Ethiopia, Mali
High % Somalia Liberia
Highest %
Low per capita [II]
Lowest %Mauritania, Djibouti, Chad
Swaziland Zambia
Low %
South Sudan, Sudan
São Tome & Pr., Côte d'Ivoire, Kenya, Nigeria, Cameroon
Ghana
Average per capita [III]
Lowest %Morocco, Congo Egypt, Tunisia Cabo Verde
High per capita [IV]
Lowest %Angola, Algeria Botswana, South
Africa, Namibia
Highest per capita [V]
Lowest %Equatorial Guinea, Libya
Gabon, Seychelles
Mauritius
Notes:GDP per capita groupings: Lowest $0-999; Low $1,000-1,999; Average $2,000-3,999; High $4,000-9,999; Highest $10,000+.
Agriculture Value Added groupings: Lowest 0-20%; Low 20-40%; Average 40-60%; High 60-80%; Highest % 80-100.
ASCI groupings: Very weak 0-20%; Weak 20-40%; Average 40-60%; Strong 60-80%; Very Strong 80-100%.
Table 7 African countries grouped by Resources capacity indicator, GDP per capita, and Agriculture VA (as a % of GDP)
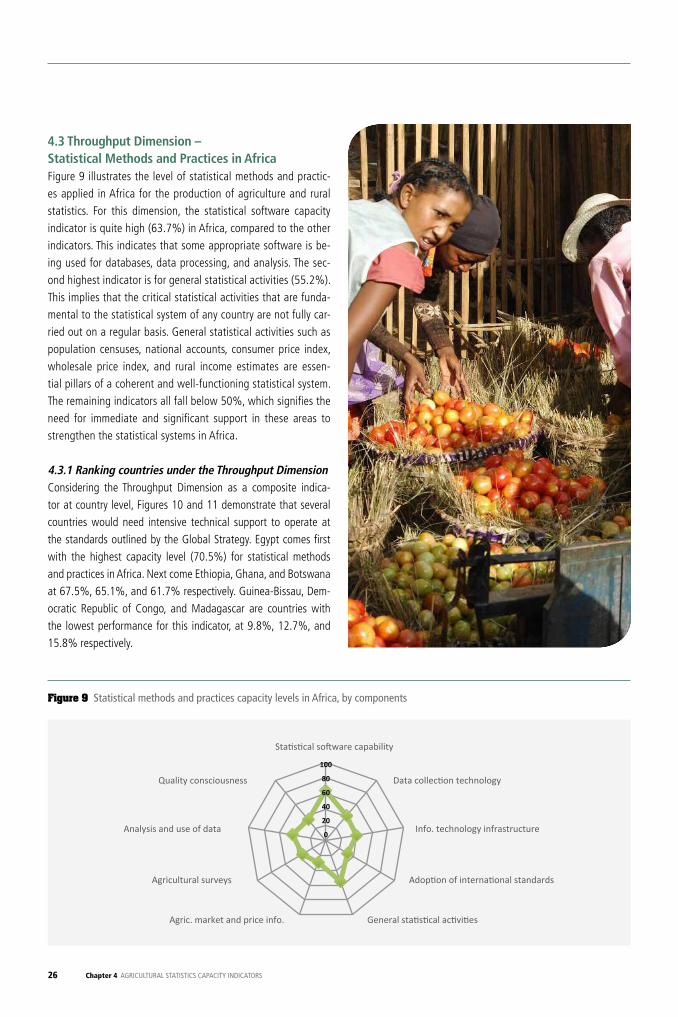
26 Chapter 4 AGRICULTURAL STATISTICS CAPACITY INDICATORS
4.3 Throughput Dimension –Statistical Methods and Practices in AfricaFigure 9 illustrates the level of statistical methods and practic-es applied in Africa for the production of agriculture and rural statistics. For this dimension, the statistical software capacity indicator is quite high (63.7%) in Africa, compared to the other indicators. This indicates that some appropriate software is be-ing used for databases, data processing, and analysis. The sec-ond highest indicator is for general statistical activities (55.2%). This implies that the critical statistical activities that are funda-mental to the statistical system of any country are not fully car-ried out on a regular basis. General statistical activities such as population censuses, national accounts, consumer price index, wholesale price index, and rural income estimates are essen-tial pillars of a coherent and well-functioning statistical system. The remaining indicators all fall below 50%, which signifies the need for immediate and significant support in these areas to strengthen the statistical systems in Africa. 4.3.1 Ranking countries under the Throughput DimensionConsidering the Throughput Dimension as a composite indica-tor at country level, Figures 10 and 11 demonstrate that several countries would need intensive technical support to operate at the standards outlined by the Global Strategy. Egypt comes first with the highest capacity level (70.5%) for statistical methods and practices in Africa. Next come Ethiopia, Ghana, and Botswana at 67.5%, 65.1%, and 61.7% respectively. Guinea-Bissau, Dem-ocratic Republic of Congo, and Madagascar are countries with the lowest performance for this indicator, at 9.8%, 12.7%, and 15.8% respectively.
Figure 9 Statistical methods and practices capacity levels in Africa, by components
0
20
40
60
80
100Legal framework
Coordination in NSS
Strategic vision and agricultural statistical planning Integration of agriculture in NSS
Relevance of data
Financial resources
Human resources: staffing
Human resources: training
Physical infrastructure
Statistical software capability
Data collection technology
Info. technology infrastructure
Adoption of international standards
General statistical activities Agric. market and price info.
Agricultural surveys
Analysis and use of data
Quality consciousness
Core data availability
Timeliness
Overall data quality perception
Data accessibility
0
20
40
60
80
100
0
20
40
60
80
100
0
20
40
60
80
100
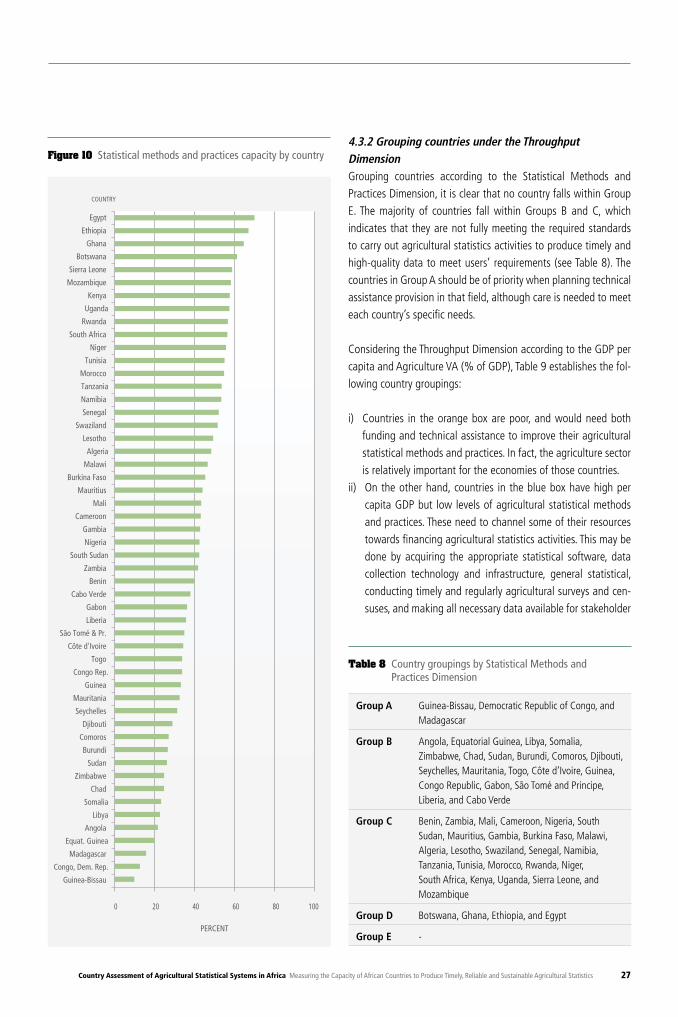
Country Assessment of Agricultural Statistical Systems in Africa Measuring the Capacity of African Countries to Produce Timely, Reliable and Sustainable Agricultural Statistics 27
4.3.2 Grouping countries under the Throughput DimensionGrouping countries according to the Statistical Methods and Practices Dimension, it is clear that no country falls within Group E. The majority of countries fall within Groups B and C, which indicates that they are not fully meeting the required standards to carry out agricultural statistics activities to produce timely and high-quality data to meet users’ requirements (see Table 8). The countries in Group A should be of priority when planning technical assistance provision in that field, although care is needed to meet each country’s specific needs.
Considering the Throughput Dimension according to the GDP per capita and Agriculture VA (% of GDP), Table 9 establishes the fol-lowing country groupings:
i) Countries in the orange box are poor, and would need both funding and technical assistance to improve their agricultural statistical methods and practices. In fact, the agriculture sector is relatively important for the economies of those countries.
ii) On the other hand, countries in the blue box have high per capita GDP but low levels of agricultural statistical methods and practices. These need to channel some of their resources towards financing agricultural statistics activities. This may be done by acquiring the appropriate statistical software, data collection technology and infrastructure, general statistical, conducting timely and regularly agricultural surveys and cen-suses, and making all necessary data available for stakeholder
Figure 10 Statistical methods and practices capacity by country
0 20 40 60 80 100
PERCENT
Egypt
Ethiopia
Ghana
Botswana
Sierra Leone
Mozambique
Kenya
Uganda
Rwanda
South Africa
Niger
Tunisia
Morocco
Tanzania
Namibia
Senegal
Swaziland
Lesotho
Algeria
Malawi
Burkina Faso
Mauritius
Mali
Cameroon
Gambia
Nigeria
South Sudan
Zambia
Benin
Cabo Verde
Gabon
Liberia
São Tomé & Pr.
Côte d'Ivoire
Togo
Congo Rep.
Guinea
Mauritania
Seychelles
Djibouti
Comoros
Burundi
Sudan
Zimbabwe
Chad
Somalia
Libya
Angola
Equat. Guinea
Madagascar
Congo, Dem. Rep.
Guinea-Bissau
COUNTRY
Group A Guinea-Bissau, Democratic Republic of Congo, and Madagascar
Group B Angola, Equatorial Guinea, Libya, Somalia, Zimbabwe, Chad, Sudan, Burundi, Comoros, Djibouti, Seychelles, Mauritania, Togo, Côte d’Ivoire, Guinea, Congo Republic, Gabon, São Tomé and Principe, Liberia, and Cabo Verde
Group C Benin, Zambia, Mali, Cameroon, Nigeria, South Sudan, Mauritius, Gambia, Burkina Faso, Malawi, Algeria, Lesotho, Swaziland, Senegal, Namibia, Tanzania, Tunisia, Morocco, Rwanda, Niger, South Africa, Kenya, Uganda, Sierra Leone, and Mozambique
Group D Botswana, Ghana, Ethiopia, and Egypt
Group E -
Table 8 Country groupings by Statistical Methods and Practices Dimension
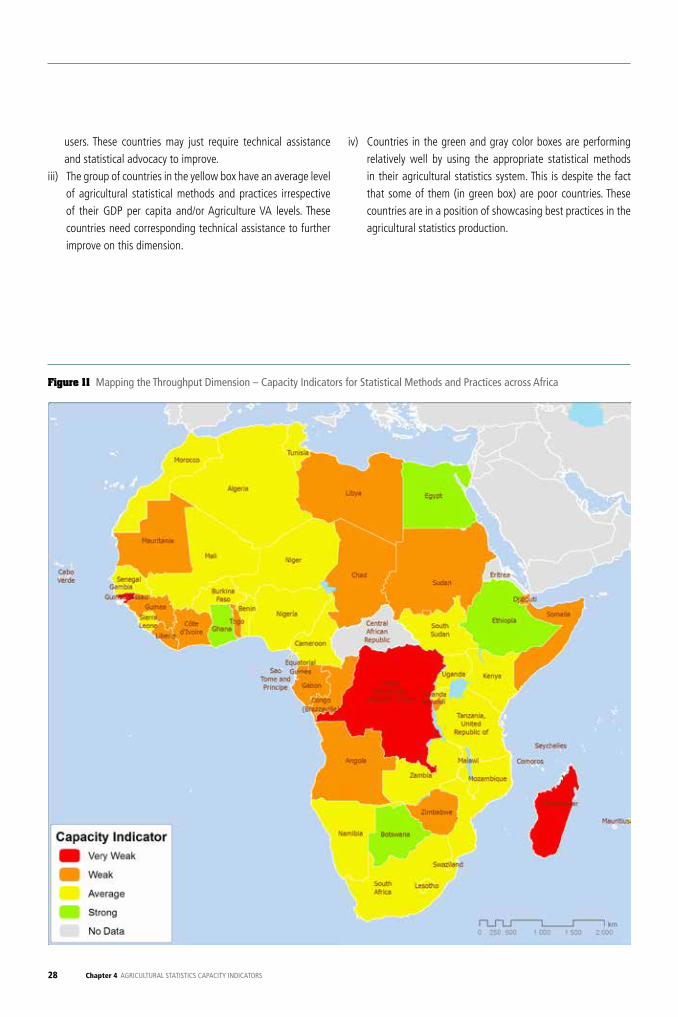
28 Chapter 4 AGRICULTURAL STATISTICS CAPACITY INDICATORS
users. These countries may just require technical assistance and statistical advocacy to improve.
iii) The group of countries in the yellow box have an average level of agricultural statistical methods and practices irrespective of their GDP per capita and/or Agriculture VA levels. These countries need corresponding technical assistance to further improve on this dimension.
iv) Countries in the green and gray color boxes are performing relatively well by using the appropriate statistical methods in their agricultural statistics system. This is despite the fact that some of them (in green box) are poor countries. These countries are in a position of showcasing best practices in the agricultural statistics production.
Figure 11 Mapping the Throughput Dimension – Capacity Indicators for Statistical Methods and Practices across Africa
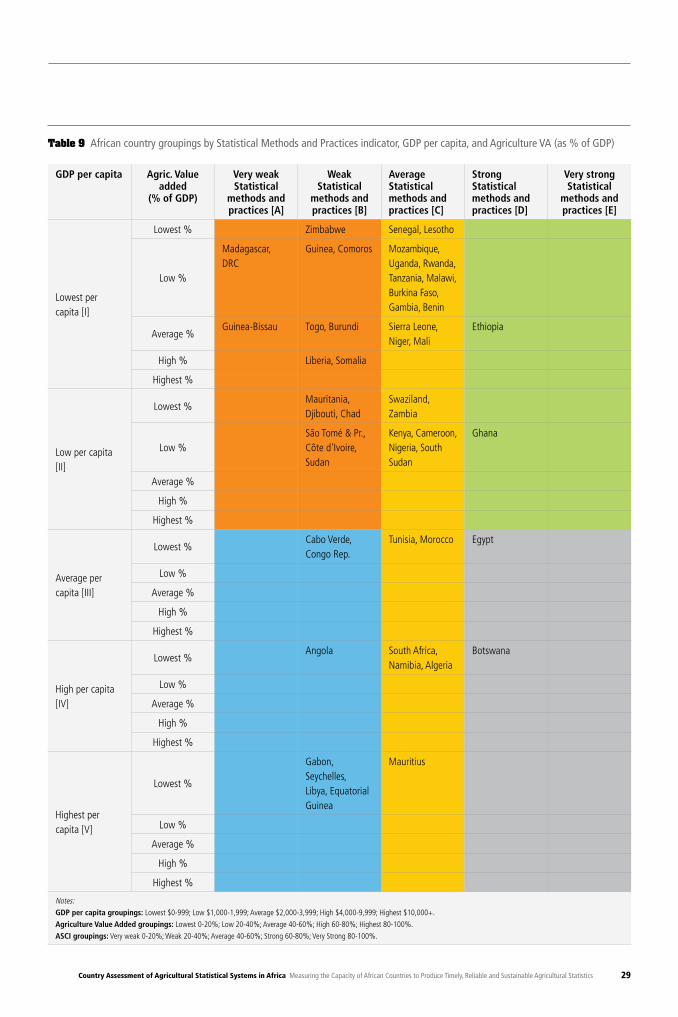
Country Assessment of Agricultural Statistical Systems in Africa Measuring the Capacity of African Countries to Produce Timely, Reliable and Sustainable Agricultural Statistics 29
GDP per capita Agric. Value added
(% of GDP)
Very weak Statistical
methods and practices [A]
Weak Statistical
methods and practices [B]
Average Statistical methods and practices [C]
Strong Statistical methods and practices [D]
Very strong Statistical
methods and practices [E]
Lowest per capita [I]
Lowest % Zimbabwe Senegal, Lesotho
Low %
Madagascar, DRC
Guinea, Comoros Mozambique, Uganda, Rwanda, Tanzania, Malawi, Burkina Faso, Gambia, Benin
Average %Guinea-Bissau Togo, Burundi Sierra Leone,
Niger, MaliEthiopia
High % Liberia, Somalia
Highest %
Low per capita [II]
Lowest %Mauritania, Djibouti, Chad
Swaziland, Zambia
Low %São Tomé & Pr., Côte d'Ivoire, Sudan
Kenya, Cameroon, Nigeria, South Sudan
Ghana
Average %
High %
Highest %
Average per capita [III]
Lowest %Cabo Verde, Congo Rep.
Tunisia, Morocco Egypt
Low %
Average %
High %
Highest %
High per capita [IV]
Lowest %Angola South Africa,
Namibia, AlgeriaBotswana
Low %
Average %
High %
Highest %
Highest per capita [V]
Lowest %
Gabon, Seychelles, Libya, Equatorial Guinea
Mauritius
Low %
Average %
High %
Highest %
Notes:GDP per capita groupings: Lowest $0-999; Low $1,000-1,999; Average $2,000-3,999; High $4,000-9,999; Highest $10,000+.
Agriculture Value Added groupings: Lowest 0-20%; Low 20-40%; Average 40-60%; High 60-80%; Highest 80-100%.
ASCI groupings: Very weak 0-20%; Weak 20-40%; Average 40-60%; Strong 60-80%; Very Strong 80-100%.
Table 9 African country groupings by Statistical Methods and Practices indicator, GDP per capita, and Agriculture VA (as % of GDP)
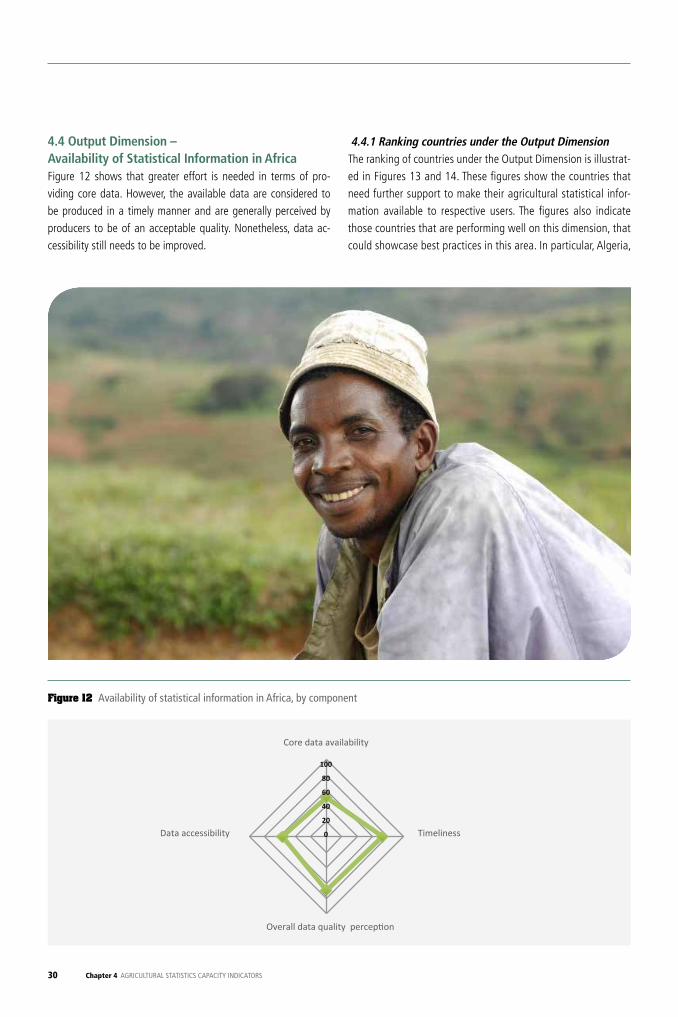
30 Chapter 4 AGRICULTURAL STATISTICS CAPACITY INDICATORS
4.4 Output Dimension – Availability of Statistical Information in AfricaFigure 12 shows that greater effort is needed in terms of pro-viding core data. However, the available data are considered to be produced in a timely manner and are generally perceived by producers to be of an acceptable quality. Nonetheless, data ac-cessibility still needs to be improved.
4.4.1 Ranking countries under the Output DimensionThe ranking of countries under the Output Dimension is illustrat-ed in Figures 13 and 14. These figures show the countries that need further support to make their agricultural statistical infor-mation available to respective users. The figures also indicate those countries that are performing well on this dimension, that could showcase best practices in this area. In particular, Algeria,
Figure 12 Availability of statistical information in Africa, by component
0
20
40
60
80
100Legal framework
Coordination in NSS
Strategic vision and agricultural statistical planning Integration of agriculture in NSS
Relevance of data
Financial resources
Human resources: staffing
Human resources: training
Physical infrastructure
Statistical software capability
Data collection technology
Info. technology infrastructure
Adoption of international standards
General statistical activities Agric. market and price info.
Agricultural surveys
Analysis and use of data
Quality consciousness
Core data availability
Timeliness
Overall data quality perception
Data accessibility
0
20
40
60
80
100
0
20
40
60
80
100
0
20
40
60
80
100
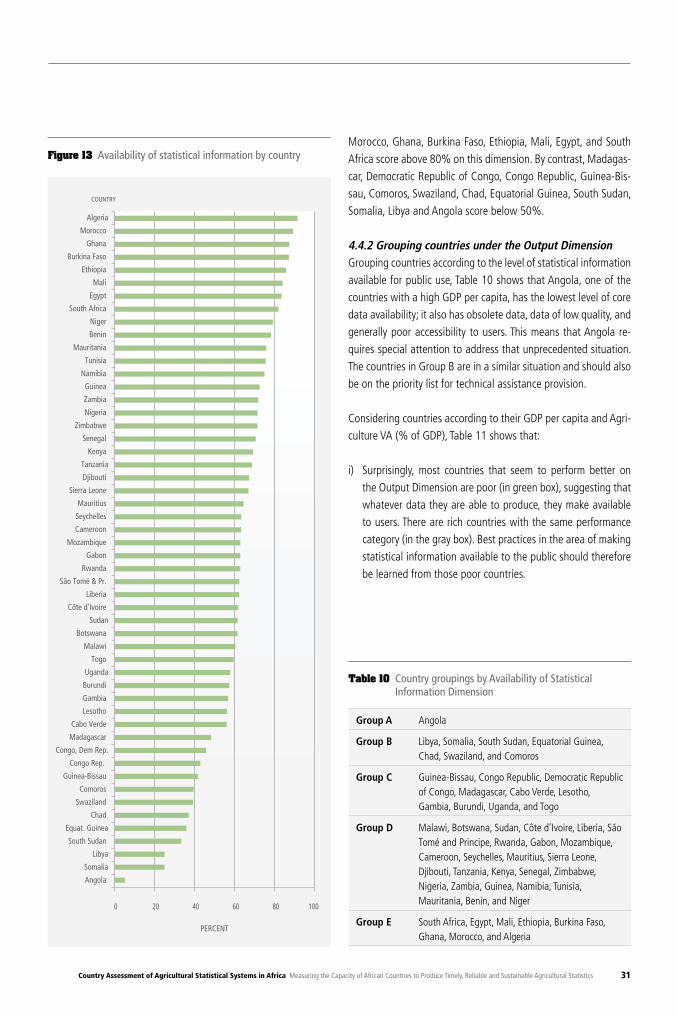
Country Assessment of Agricultural Statistical Systems in Africa Measuring the Capacity of African Countries to Produce Timely, Reliable and Sustainable Agricultural Statistics 31
Morocco, Ghana, Burkina Faso, Ethiopia, Mali, Egypt, and South Africa score above 80% on this dimension. By contrast, Madagas-car, Democratic Republic of Congo, Congo Republic, Guinea-Bis-sau, Comoros, Swaziland, Chad, Equatorial Guinea, South Sudan, Somalia, Libya and Angola score below 50%. 4.4.2 Grouping countries under the Output Dimension Grouping countries according to the level of statistical information available for public use, Table 10 shows that Angola, one of the countries with a high GDP per capita, has the lowest level of core data availability; it also has obsolete data, data of low quality, and generally poor accessibility to users. This means that Angola re-quires special attention to address that unprecedented situation. The countries in Group B are in a similar situation and should also be on the priority list for technical assistance provision.
Considering countries according to their GDP per capita and Agri-culture VA (% of GDP), Table 11 shows that:
i) Surprisingly, most countries that seem to perform better on the Output Dimension are poor (in green box), suggesting that whatever data they are able to produce, they make available to users. There are rich countries with the same performance category (in the gray box). Best practices in the area of making statistical information available to the public should therefore be learned from those poor countries.
Figure 13 Availability of statistical information by country
0 20 40 60 80 100
PERCENT
Algeria
Morocco
Ghana
Burkina Faso
Ethiopia
Mali
Egypt
South Africa
Niger
Benin
Mauritania
Tunisia
Namibia
Guinea
Zambia
Nigeria
Zimbabwe
Senegal
Kenya
Tanzania
Djibouti
Sierra Leone
Mauritius
Seychelles
Cameroon
Mozambique
Gabon
Rwanda
São Tomé & Pr.
Liberia
Côte d'Ivoire
Sudan
Botswana
Malawi
Togo
Uganda
Burundi
Gambia
Lesotho
Cabo Verde
Madagascar
Congo, Dem Rep.
Congo Rep.
Guinea-Bissau
Comoros
Swaziland
Chad
Equat. Guinea
South Sudan
Libya
Somalia
Angola
COUNTRY
Group A Angola
Group B Libya, Somalia, South Sudan, Equatorial Guinea, Chad, Swaziland, and Comoros
Group C Guinea-Bissau, Congo Republic, Democratic Republic of Congo, Madagascar, Cabo Verde, Lesotho, Gambia, Burundi, Uganda, and Togo
Group D Malawi, Botswana, Sudan, Côte d’Ivoire, Liberia, São Tomé and Principe, Rwanda, Gabon, Mozambique, Cameroon, Seychelles, Mauritius, Sierra Leone, Djibouti, Tanzania, Kenya, Senegal, Zimbabwe, Nigeria, Zambia, Guinea, Namibia, Tunisia, Mauritania, Benin, and Niger
Group E South Africa, Egypt, Mali, Ethiopia, Burkina Faso, Ghana, Morocco, and Algeria
Table 10 Country groupings by Availability of Statistical Information Dimension
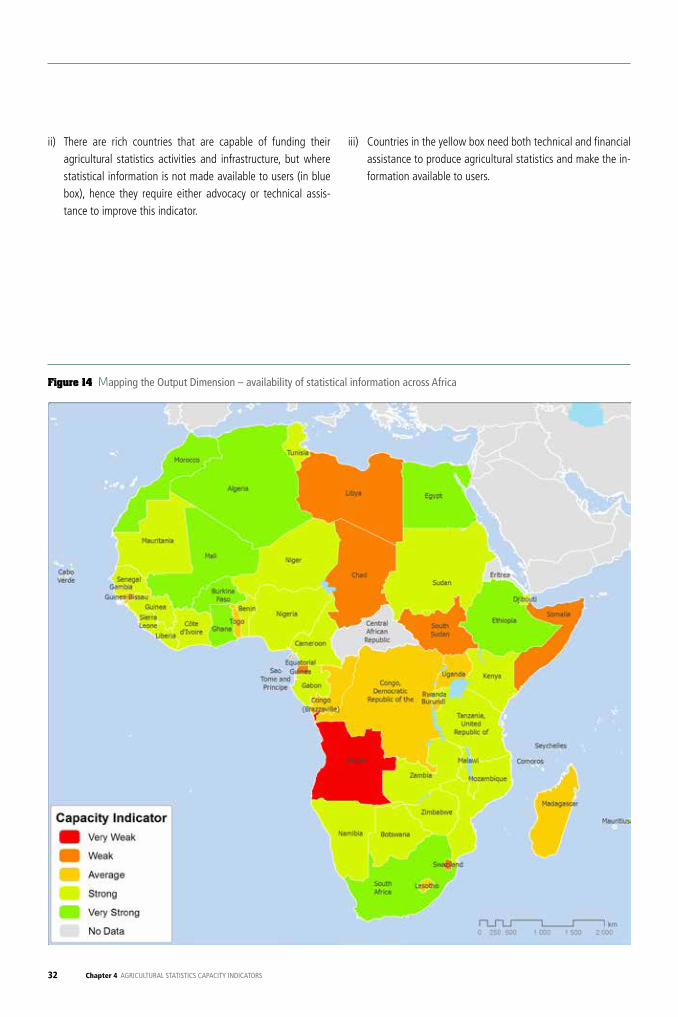
32 Chapter 4 AGRICULTURAL STATISTICS CAPACITY INDICATORS
ii) There are rich countries that are capable of funding their agricultural statistics activities and infrastructure, but where statistical information is not made available to users (in blue box), hence they require either advocacy or technical assis-tance to improve this indicator.
iii) Countries in the yellow box need both technical and financial assistance to produce agricultural statistics and make the in-formation available to users.
Figure 14 Mapping the Output Dimension – availability of statistical information across Africa
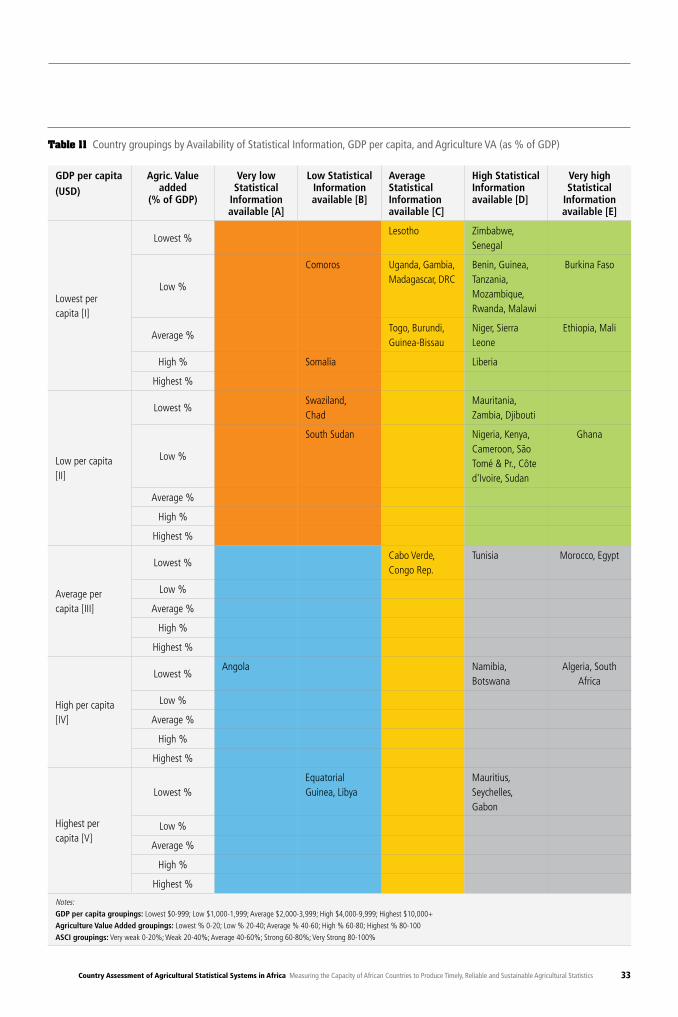
Country Assessment of Agricultural Statistical Systems in Africa Measuring the Capacity of African Countries to Produce Timely, Reliable and Sustainable Agricultural Statistics 33
GDP per capita(USD)
Agric. Value added
(% of GDP)
Very low Statistical
Information available [A]
Low Statistical Information available [B]
Average Statistical Information available [C]
High Statistical Information available [D]
Very high Statistical
Information available [E]
Lowest per capita [I]
Lowest %Lesotho Zimbabwe,
Senegal
Low %
Comoros Uganda, Gambia, Madagascar, DRC
Benin, Guinea, Tanzania, Mozambique, Rwanda, Malawi
Burkina Faso
Average %Togo, Burundi, Guinea-Bissau
Niger, Sierra Leone
Ethiopia, Mali
High % Somalia Liberia
Highest %
Low per capita [II]
Lowest %Swaziland, Chad
Mauritania, Zambia, Djibouti
Low %
South Sudan Nigeria, Kenya, Cameroon, São Tomé & Pr., Côte d'Ivoire, Sudan
Ghana
Average %
High %
Highest %
Average per capita [III]
Lowest %Cabo Verde, Congo Rep.
Tunisia Morocco, Egypt
Low %
Average %
High %
Highest %
High per capita [IV]
Lowest %Angola Namibia,
BotswanaAlgeria, South
Africa
Low %
Average %
High %
Highest %
Highest per capita [V]
Lowest %Equatorial Guinea, Libya
Mauritius, Seychelles, Gabon
Low %
Average %
High %
Highest %
Notes:GDP per capita groupings: Lowest $0-999; Low $1,000-1,999; Average $2,000-3,999; High $4,000-9,999; Highest $10,000+
Agriculture Value Added groupings: Lowest % 0-20; Low % 20-40; Average % 40-60; High % 60-80; Highest % 80-100
ASCI groupings: Very weak 0-20%; Weak 20-40%; Average 40-60%; Strong 60-80%; Very Strong 80-100%
Table 11 Country groupings by Availability of Statistical Information, GDP per capita, and Agriculture VA (as % of GDP)
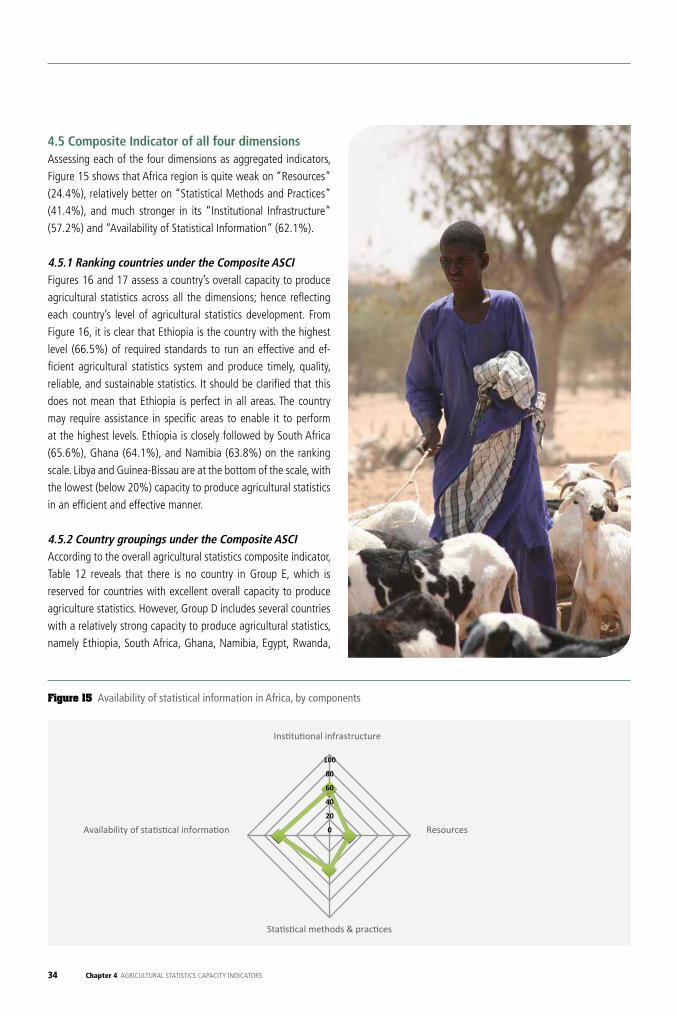
34 Chapter 4 AGRICULTURAL STATISTICS CAPACITY INDICATORS
4.5 Composite Indicator of all four dimensionsAssessing each of the four dimensions as aggregated indicators, Figure 15 shows that Africa region is quite weak on “Resources” (24.4%), relatively better on “Statistical Methods and Practices” (41.4%), and much stronger in its “Institutional Infrastructure” (57.2%) and “Availability of Statistical Information” (62.1%).
4.5.1 Ranking countries under the Composite ASCIFigures 16 and 17 assess a country’s overall capacity to produce agricultural statistics across all the dimensions; hence reflecting each country’s level of agricultural statistics development. From Figure 16, it is clear that Ethiopia is the country with the highest level (66.5%) of required standards to run an effective and ef-ficient agricultural statistics system and produce timely, quality, reliable, and sustainable statistics. It should be clarified that this does not mean that Ethiopia is perfect in all areas. The country may require assistance in specific areas to enable it to perform at the highest levels. Ethiopia is closely followed by South Africa (65.6%), Ghana (64.1%), and Namibia (63.8%) on the ranking scale. Libya and Guinea-Bissau are at the bottom of the scale, with the lowest (below 20%) capacity to produce agricultural statistics in an efficient and effective manner. 4.5.2 Country groupings under the Composite ASCIAccording to the overall agricultural statistics composite indicator, Table 12 reveals that there is no country in Group E, which is reserved for countries with excellent overall capacity to produce agriculture statistics. However, Group D includes several countries with a relatively strong capacity to produce agricultural statistics, namely Ethiopia, South Africa, Ghana, Namibia, Egypt, Rwanda,
Figure 15 Availability of statistical information in Africa, by components
Resources
Statistical methods & practices
Institutional infrastructure
Availability of statistical information 0
20
40
60
80
100
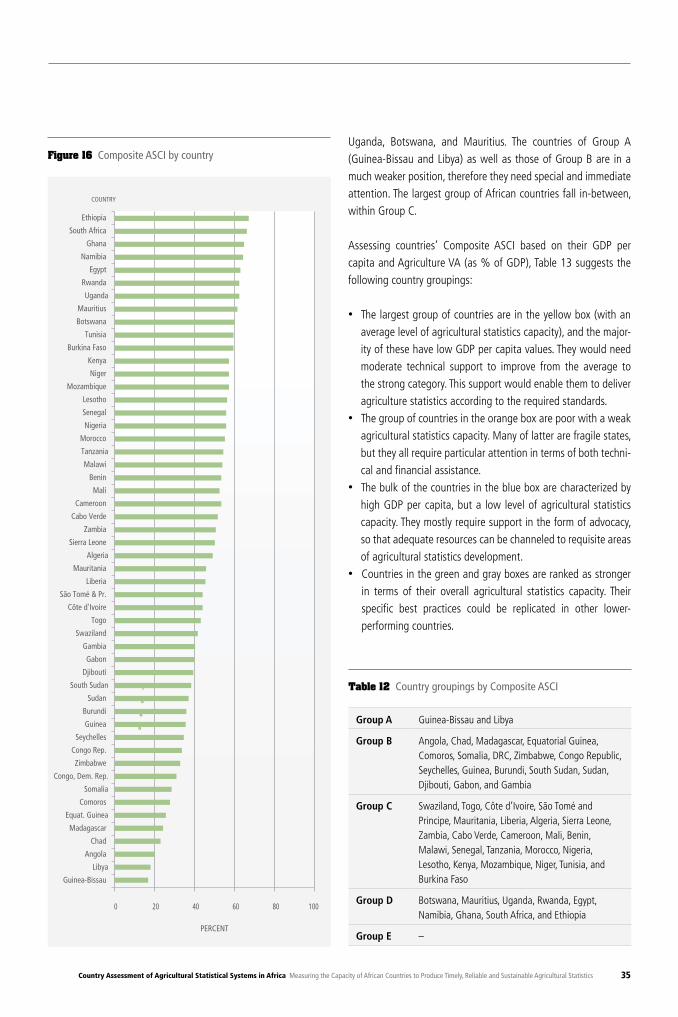
Country Assessment of Agricultural Statistical Systems in Africa Measuring the Capacity of African Countries to Produce Timely, Reliable and Sustainable Agricultural Statistics 35
Uganda, Botswana, and Mauritius. The countries of Group A (Guinea-Bissau and Libya) as well as those of Group B are in a much weaker position, therefore they need special and immediate attention. The largest group of African countries fall in-between, within Group C.
Assessing countries’ Composite ASCI based on their GDP per capita and Agriculture VA (as % of GDP), Table 13 suggests the following country groupings:
• The largest group of countries are in the yellow box (with an average level of agricultural statistics capacity), and the major-ity of these have low GDP per capita values. They would need moderate technical support to improve from the average to the strong category. This support would enable them to deliver agriculture statistics according to the required standards.
• The group of countries in the orange box are poor with a weak agricultural statistics capacity. Many of latter are fragile states, but they all require particular attention in terms of both techni-cal and financial assistance.
• The bulk of the countries in the blue box are characterized by high GDP per capita, but a low level of agricultural statistics capacity. They mostly require support in the form of advocacy, so that adequate resources can be channeled to requisite areas of agricultural statistics development.
• Countries in the green and gray boxes are ranked as stronger in terms of their overall agricultural statistics capacity. Their specific best practices could be replicated in other lower- performing countries.
Figure 16 Composite ASCI by country
0 20 40 60 80 100
PERCENT
Ethiopia
South Africa
Ghana
Namibia
Egypt
Rwanda
Uganda
Mauritius
Botswana
Tunisia
Burkina Faso
Kenya
Niger
Mozambique
Lesotho
Senegal
Nigeria
Morocco
Tanzania
Malawi
Benin
Mali
Cameroon
Cabo Verde
Zambia
Sierra Leone
Algeria
Mauritania
Liberia
São Tomé & Pr.
Côte d'Ivoire
Togo
Swaziland
Gambia
Gabon
Djibouti
South Sudan
Sudan
Burundi
Guinea
Seychelles
Congo Rep.
Zimbabwe
Congo, Dem. Rep.
Somalia
Comoros
Equat. Guinea
Madagascar
Chad
Angola
Libya
Guinea-Bissau
COUNTRY
Table 12 Country groupings by Composite ASCI
Group A Guinea-Bissau and Libya
Group B Angola, Chad, Madagascar, Equatorial Guinea, Comoros, Somalia, DRC, Zimbabwe, Congo Republic, Seychelles, Guinea, Burundi, South Sudan, Sudan, Djibouti, Gabon, and Gambia
Group C Swaziland, Togo, Côte d’Ivoire, São Tomé and Principe, Mauritania, Liberia, Algeria, Sierra Leone, Zambia, Cabo Verde, Cameroon, Mali, Benin, Malawi, Senegal, Tanzania, Morocco, Nigeria, Lesotho, Kenya, Mozambique, Niger, Tunisia, and Burkina Faso
Group D Botswana, Mauritius, Uganda, Rwanda, Egypt, Namibia, Ghana, South Africa, and Ethiopia
Group E –
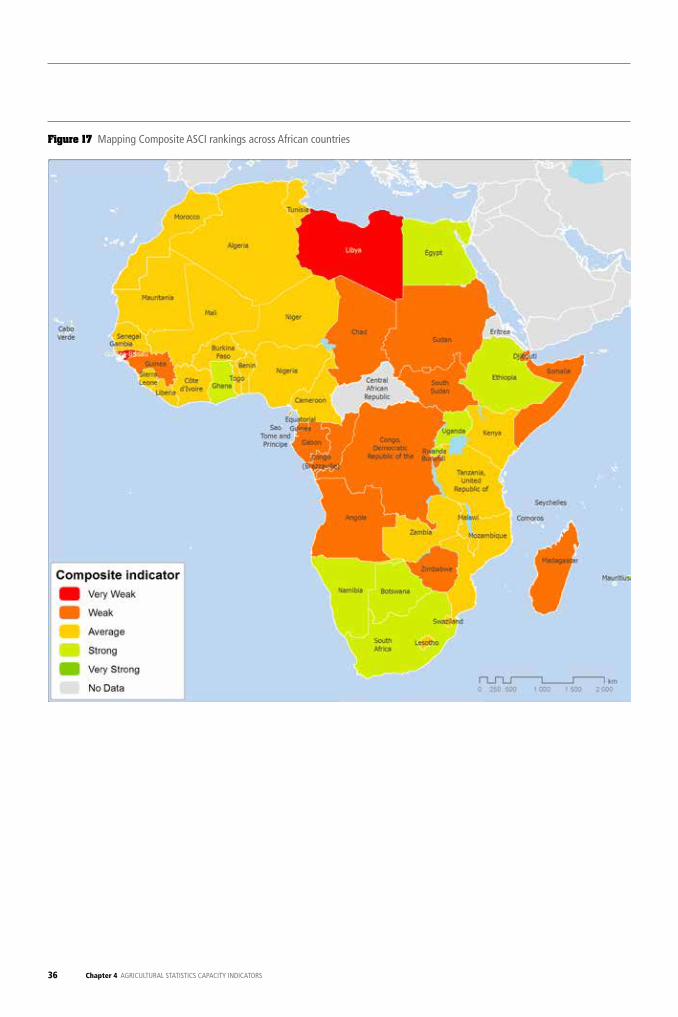
36 Chapter 4 AGRICULTURAL STATISTICS CAPACITY INDICATORS
Figure 17 Mapping Composite ASCI rankings across African countries
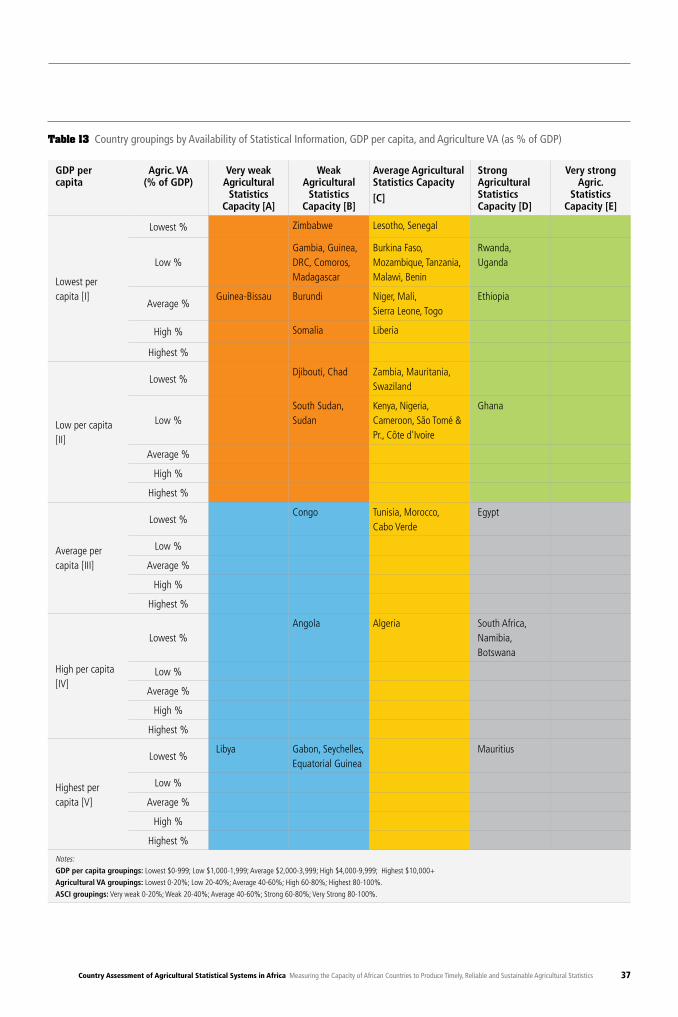
Country Assessment of Agricultural Statistical Systems in Africa Measuring the Capacity of African Countries to Produce Timely, Reliable and Sustainable Agricultural Statistics 37
GDP per capita
Agric. VA (% of GDP)
Very weak Agricultural
Statistics Capacity [A]
Weak Agricultural
Statistics Capacity [B]
Average Agricultural Statistics Capacity [C]
Strong Agricultural Statistics Capacity [D]
Very strong Agric.
Statistics Capacity [E]
Lowest per capita [I]
Lowest % Zimbabwe Lesotho, Senegal
Low %Gambia, Guinea, DRC, Comoros, Madagascar
Burkina Faso, Mozambique, Tanzania, Malawi, Benin
Rwanda, Uganda
Average %Guinea-Bissau Burundi Niger, Mali,
Sierra Leone, TogoEthiopia
High % Somalia Liberia
Highest %
Low per capita [II]
Lowest %Djibouti, Chad Zambia, Mauritania,
Swaziland
Low %South Sudan, Sudan
Kenya, Nigeria, Cameroon, São Tomé & Pr., Côte d'Ivoire
Ghana
Average %
High %
Highest %
Average per capita [III]
Lowest %Congo Tunisia, Morocco,
Cabo VerdeEgypt
Low %
Average %
High %
Highest %
High per capita [IV]
Lowest %Angola Algeria South Africa,
Namibia, Botswana
Low %
Average %
High %
Highest %
Highest per capita [V]
Lowest %Libya Gabon, Seychelles,
Equatorial GuineaMauritius
Low %
Average %
High %
Highest %
Notes:GDP per capita groupings: Lowest $0-999; Low $1,000-1,999; Average $2,000-3,999; High $4,000-9,999; Highest $10,000+
Agricultural VA groupings: Lowest 0-20%; Low 20-40%; Average 40-60%; High 60-80%; Highest 80-100%.
ASCI groupings: Very weak 0-20%; Weak 20-40%; Average 40-60%; Strong 60-80%; Very Strong 80-100%.
Table 13 Country groupings by Availability of Statistical Information, GDP per capita, and Agriculture VA (as % of GDP)
Chapter x Xxxxxxxxxxxxxx xxxxxxxxxxx38
5. CONCLUSION
Country Assessment of Agricultural Statistical Systems in Africa Measuring the Capacity of African Countries to Produce Timely, Reliable and Sustainable Agricultural Statistics 39
A number of key conclusions may be drawn from this Country Assessment of Agricultural Statistical Systems in Africa:
1. The undertaking of country capacity and needs assessments (i.e. Country Assessments) was identified as the first critical activity required for the implementation of the “Action Plan for Africa of the Global Strategy for Improving Statistics for Food Security, Sustainable Agriculture, and Rural Develop-ment.” This activity was successfully undertaken in 52 African countries in 2013. The Country Assessment exercise went well beyond previous country assessments, since those mainly fo-cused on data quality. It assessed the four dimensions of sta-tistical capacity for each country – namely the Prerequisites, Input, Throughput, and Output Dimensions. The information from the Country Assessments (CAs) was intended to feed into the design of appropriate technical assistance, training and research interventions, which comprise the technical com-ponents of the Action Plan and for which the AfDB is assuming leadership.
2. During the Country Assessment exercise, countries were as-sisted to establish national governance structures, which are critical for the implementation of the Action Plan at national level. Methodology for assessing country capacity and needs for the production of agricultural and rural statistics was perfected. Moreover, training on conducting CAs and on the objectives and methodology of the Action Plan was given to personnel from both National Statistics Offices and Statistics Agencies in the Ministries of Agriculture.
3. The findings from the 2013 Agricultural Statistics Capacity Indicator (ASCI) assessments for Africa are of paramount im-portance. It is now known for each country their ranked level for each dimension and element in 2013, compared to the optimal/ ideal levels. The country’s strengths and weakness-es are indicated objectively, showing for each indicator the sources and the location of best practice, for replication by low-performing countries. The countries themselves, as well as interested stakeholders and partners, now have baseline information from which to measure progress towards achiev-ing the objectives and targets set out in the “Global Strategy for Improving Agricultural and Rural Statistics” in general and those in the Action Plan for Africa in particular. The Country Assessments also assist development partners to target those countries that require special attention in different areas of interventions.
Chapter x Xxxxxxxxxxxxxx xxxxxxxxxxx40
6. ANNEXES
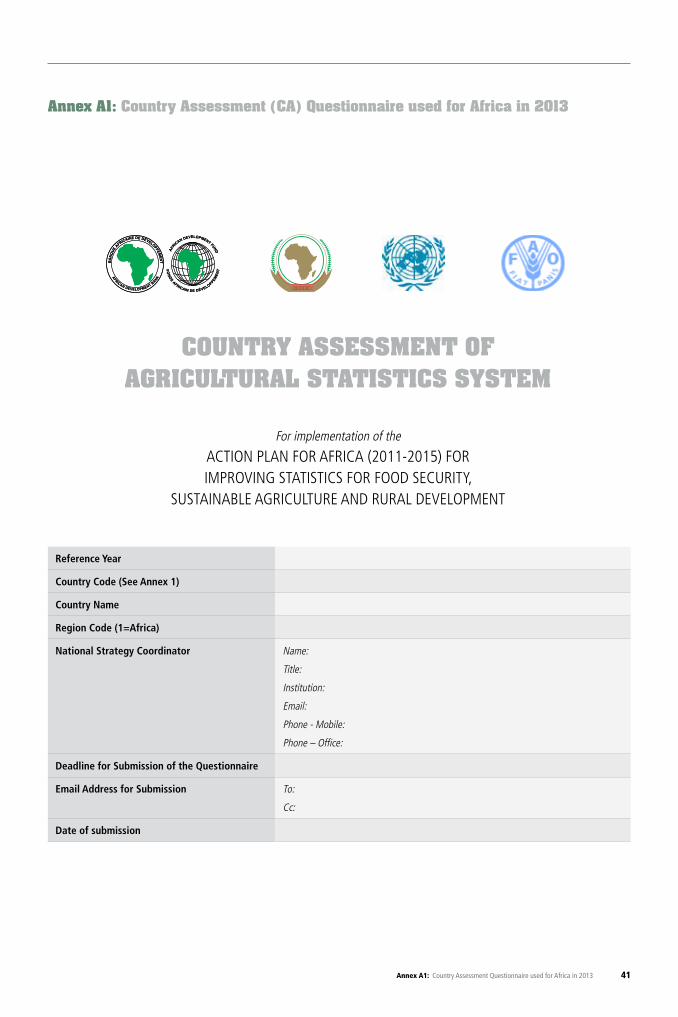
41Annex A1: Country Assessment Questionnaire used for Africa in 2013
Annex A1: Country Assessment (CA) Questionnaire used for Africa in 2013
COUNTRY ASSESSMENT OFAGRICULTURAL STATISTICS SYSTEM
For implementation of the
ACTION PLAN FOR AFRICA (2011-2015) FOR IMPROVING STATISTICS FOR FOOD SECURITY,
SUSTAINABLE AGRICULTURE AND RURAL DEVELOPMENT
Reference Year
Country Code (See Annex 1)
Country Name
Region Code (1=Africa)
National Strategy Coordinator Name:
Title:
Institution:
Email:
Phone - Mobile:
Phone – Office:
Deadline for Submission of the Questionnaire
Email Address for Submission To:
Cc:
Date of submission
42 Annex A1: Country Assessment Questionnaire used for Africa in 2013
ACKNOWLEDGMENTS
This questionnaire is the result of work of a Task Team constituted by the Friends of Chair on Agriculture Statistics of the United Nations Statistical Commission (ECA). The work was carried out under the leadership of FAO Statistics Division with contributions from African Development Bank (AfDB), United Nations Economic Commission for Africa, Australian Bureau of Statistics (ABS), Brazilian Institute of Geography and Statistics (IBGE), Federal State Statistics Service of Russian Federation (ROSSTAT), United States Department of Agri-culture (National Agricultural Statistics Service - NASS and Economic Research Service - ERS), and the World Bank. Many international experts contributed to the development of this questionnaire in their individual capacities.
43Annex A1: Country Assessment Questionnaire used for Africa in 2013
TABLE OF CONTENTS
INTRODUCTIONOBJECTIVE OF THE ASSESSMENTBACKGROUND AND SCOPE OF THE QUESTIONNAIREINSTRUCTIONS FOR COMPLETING
MODULE I: OVERVIEW OF THE NATIONAL STATISTICAL SYSTEM0.1 Respondent Details0.2 Total number of Module III of the questionnaire used
SECTION 1: INSTITUTIONAL ENVIRONMENT1.1 Administrative structure of the country1.2 Legal and administrative framework for the collection of statistics1.3 Structure of the National Statistical System1.4 Strategic framework1.5 Dialogue with data users
SECTION 2: CORE DATA AVAILABILITY2.1 Availability and coverage of agricultural statistics
MODULE II: ONGOING STATISTICAL ACTIVITIES AND CONSTRAINTS0.1 Respondent Details
SECTION 1: MAIN STATISTICAL ACTIVITIES1.1 Population Census 1.2 National Accounts Statistics1.3 Adoption of classifications1.4 Price Indices1.5 Food and Agricultural Surveys Conducted1.6 Household Budget Survey1.7 Availability of derived statistics and indicators in the country1.8 Quality consciousness in statistics1.9 Information technology1.10 Transport Infrastructure1.11 Financial resources 1.12 Human resources and training for statistical activities 1.13 International cooperation in agricultural statistics
SECTION 2: CRITICAL CONSTRAINTS IN AGRICULTURE STATISTICS SYSTEM2.1 Critical constraints2.2 Any other comments2.3 Abbreviations used
44 Annex A1: Country Assessment Questionnaire used for Africa in 2013
MODULE III: INFORMATION ON SUB-SECTORS OF AGRICULTURE0.1 Coverage of sub-sector(s) in the questionnaire0.2 Respondent Details
SECTION 1: MAIN STATISTICAL ACTIVITIES OF THE SUB-SECTORS1.1 Price indices1.2 Food and Agricultural Surveys Conducted1.3 Availability of derived statistics and indicators in the country1.4 Quality consciousness in statistics1.5 Information technology1.6 Transport Infrastructure1.7 Financial resources1.8 Human resources and training for statistical activities 1.9 International cooperation in agricultural statistics
SECTION 2: CRITICAL CONSTRAINTS IN AGRICULTURE STATISTICS SYSTEM2.1 Critical constraints2.2 Any other comments2.3 Abbreviations used
45Annex A1: Country Assessment Questionnaire used for Africa in 2013
INTRODUCTION
OBJECTIVE OF THE ASSESSMENTIn response to the many challenges of meeting the user needs for agricultural statistics, a Global Strategy for Improving Agricultural Sta-tistics was produced (by FAO in close collaboration with the World Bank, Regional Development Banks and the Regional Commissions of the United Nations) and endorsed in February 2010 by the United Nations Statistical Commission. The purpose of the Global Strategy is to provide a framework and methodology that will lead to the improvement of national and international food and agricultural statistics to guide policy analysis and decision making in the 21st century. The Strategy was developed in response to the already mentioned declining quantity and quality of agricultural statistics and the need to provide data to support emerging data requirements and the requirement for the data systems to be integrated to achieve synergy and cost-effectiveness. The strategy is based on three pillars, namely (i) the establishment of a minimum set of core data that countries will provide to meet the current and emerging demands, (ii) the integration of agriculture into the national statistical systems in order to meet policy maker and other data user expectations that the data will be comparable across countries and over time, and (iii) the foundation that will provide the sustainability of the National Agricultural Statistical System through governance and statistical capacity building.
Africa is the first region to implement the Global Strategy. The Action Plan for Africa of the Global Strategy has been designed by the African Development Bank (AfDB), UN Economic Commission for Africa (ECA), and the Food and Agriculture Organization of the United Nations (FAO), in close collaboration with the African Union Commission (AUC). It has been shared and discussed with key stakeholders both within and outside the continent, including African countries, regional and international organizations, regional economic commu-nities (RECs), donors, and the UN Statistical Commission (UNSC). The Action Plan adopts a long-term perspective (10 to 15 years) but will follow a phased approach, with the first phase covering the five-year period 2011–2015.
One challenge faced in the elaboration of the Plan was lack of comprehensive and up-to-date baseline information on countries’ sta-tistical capacity and needs to enable:
(i) establishing the baselines against which targets can be set and performance measured,(ii) drawing up a comprehensive Technical Assistance program for Africa, covering also training and research, and (iii) establishing a monitoring and evaluation (M&E) system to measure changes in the level of statistical capacity through time.
For the above reasons, the Action Plan for Africa has provided for undertaking an assessment of statistical capacity and needs in the countries to collect the required information for the said purpose. The present questionnaire is the first step towards the assessment of the state of National Agricultural Statistical System. The report, to be prepared on the basis of the data gathered through the ques-tionnaire, will highlight areas of strengths and weaknesses in national systems. Missions for carrying out in-depth assessments will be undertaken in the priority countries identified, on the basis of information collected through this questionnaire. The findings and recommendations of these missions will provide the basis to create a national strategy/plan to improve agriculture and rural statistics. Thus, the information gathered through this questionnaire will constitute the basis to assess the capability of countries to produce core data that are consistent and comparable at the national level over time for making policy, enhancing sound investment decisions, and ensuring markets operate efficiently at the national level. It will also help to identify weak areas to be addressed through priority interventions by way of training and technical assistance. In addition, this questionnaire has been developed through an international collaborative process so that it can be used as a standard national and international tool for creating comparable country profiles. More-over, the result of periodic “Country Assessments” carried out using the same standard questionnaire will serve as an monitoring and evaluation tool for measuring progress achieved in the development of agriculture statistics during the course of the implementation of the Global Strategy in general and the Africa Action Plan in particular.
46 Annex A1: Country Assessment Questionnaire used for Africa in 2013
BACKGROUND AND SCOPE OF THE QUESTIONNAIRE At the same time, this questionnaire replaces the earlier system of making country statement under the standard agenda item of “Pres-ent State of Food and Agricultural Statistics in the Countries of the Region: Country Statements” that was undertaken every two years in the framework of the African Commission for Agricultural Statistics (AFCAS) sessions. In line with the past practice, a summary of the responses received from countries in this questionnaire will be presented to the next AFCAS session or any other international body on agriculture statistics.
The scope of this questionnaire is therefore wider than the previous one. The Global Strategy and Action Plan for Africa follow a broader concept of the term “agriculture”, which covers not only crops and livestock, but also the sub-sectors of fishery, forestry, water resources and also rural income-generating activities.
The scope of the assessment to be done through this questionnaire covers both basic statistics and derived statistics/indicators. The data items in the questionnaire cover economic, social and environmental dimensions of activities in agriculture. These represent a core set of data items, internationally agreed during the development process of the Global Strategy. The main themes and data items covered in the questionnaire are as follows: Area and production of crop; Livestock number and products; Trade in agricultural, livestock, fishery, forestry and food products; Fisheries/Aquaculture statistics (including production, employment, structures, marketing and processing); Forestry statistics (including non-wood products); Production and consumption of food; Agricultural inputs (machinery, seed, feed, fertilizers and pesticides) and cost of production; Agricultural / Trade prices; Labor force participating in agricultural activities; National account statistics relating to agriculture; Rural development; Rural income.
For the purpose of country assessments, the statistical activities include the collection, processing and dissemination of statistics not only through censuses and surveys, but also other available sources used in the countries (administrative data sources).
INSTRUCTIONS FOR COMPLETINGAt the country level, there exists a considerable diversity in the organization of the work relating to agriculture statistics. The mandate of agencies to collect statistics on respective sub-sectors differs significantly across countries. The mandate for statistics is usually related to the responsibility for development of the relevant sub-sector. Experience suggests that in any country, no single institution will be able to provide information on all areas of agriculture statistics. Nonetheless, in most countries, the National Statistics Office (NSO) and the Ministry of Agriculture (MOA) together share the responsibility for most of the agriculture statistics. Detailed statistics on fishery, forestry and water resources would come from the institutions responsible for the management of these sub-sectors. Therefore, for a compre-hensive assessment of the state of agriculture statistics in any country, a collaborative effort of all the concerned institutions is crucial.
The questionnaire comprises three different modules. Module I will collect information on Overview of the National Statistical System, Module II will collect information on Ongoing Statistical Activities and Constraints in the statistical system as known by the national statistical office, while Module III will collect Information on Sub-sectors of Agriculture. Two Excel Sheets will be used to provide com-plementary and detailed information on the availability, quality, reliability, and consistency of the minimum core data set. To appreciate the score to be provided to possible responses, group discussions may help.
To ensure ease of responses, most of the questions have been formulated in such a way that only a tick will serve as adequate response. However, section 2 of Modules II and III will need substantial effort to fill. In countries where data directories are available, these could help in facilitating responses. In other situations, a team of professionals from different departments may need to work together to complete the questionnaire. The coordinating agency will be expected to play a key role to ensure that the work is smoothly organized. He will have the full responsibility of consolidating the responses received from other stakeholders, completing and submitting the questionnaire online.
47Annex A1: Country Assessment Questionnaire used for Africa in 2013
The respondents are expected to provide responses to each and every question, as applicable. In order to ensure accuracy in responses, attention needs to be paid to the footnotes and codes provided in the body of the questionnaire. The abbreviations used in responses should be listed along with the full form at the end of the questionnaire.
The respondents are encouraged to provide supplementary electronic material for in-depth study or reference. Moreover, available core date should be collected at the same time and submitted together with the completed questionnaire. The number of Module III used in any country will need to be indicated on the cover page of Module I.
The respondents will need a printed copy of the questionnaire to facilitate its filling. However, they are expected to record any informa-tion collected and hand it over to the National Strategy Coordinator, who will compile and submit it directly online. In case of technical difficulties, he will use a soft copy of the questionnaire and submit it electronically to the email and Cc addresses provided on the cover of the questionnaire, by the stated deadline. When filling it online, he will be able to save it in case of interruption and download it again when resuming the work. He will not be able to submit the questionnaire unless it is entirely completed.
Different regions of the world will use different ways to collect data using this tool. In Africa, the AfDB, which is responsible for the Tech-nical Assistance component and Governance mechanism of the Action Plan for Africa, will lead the process of the Country Assessment implementation.
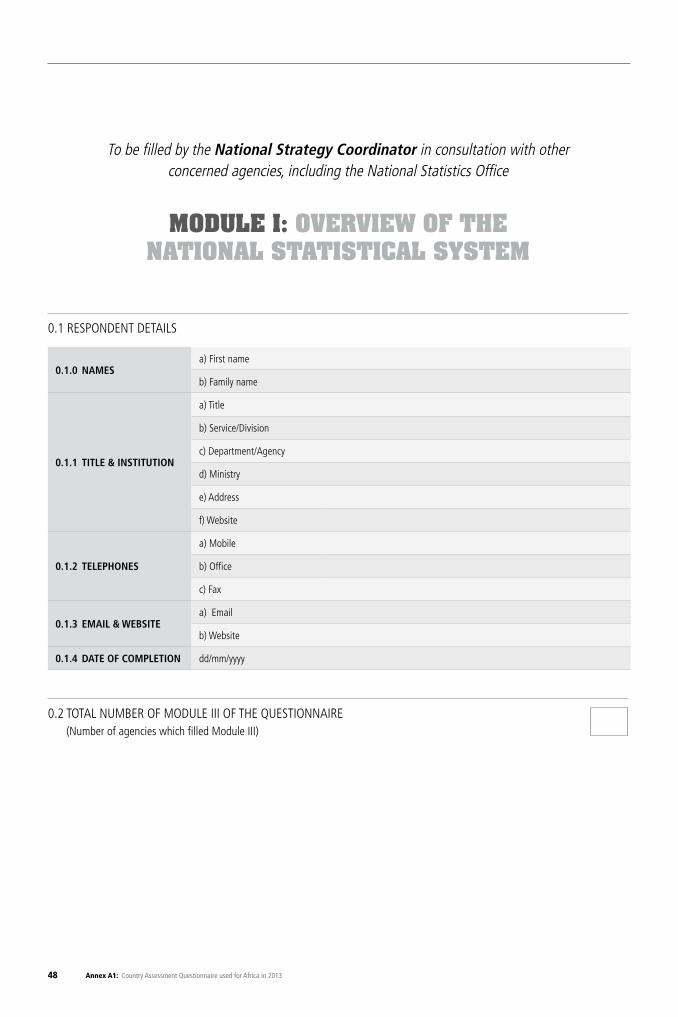
48 Annex A1: Country Assessment Questionnaire used for Africa in 2013
To be filled by the National Strategy Coordinator in consultation with other concerned agencies, including the National Statistics Office
MODULE I: OVERVIEW OF THE NATIONAL STATISTICAL SYSTEM
0.1.0 NAMESa) First name
b) Family name
0.1.1 TITLE & INSTITUTION
a) Title
b) Service/Division
c) Department/Agency
d) Ministry
e) Address
f) Website
0.1.2 TELEPHONES
a) Mobile
b) Office
c) Fax
0.1.3 EMAIL & WEBSITEa) Email
b) Website
0.1.4 DATE OF COMPLETION dd/mm/yyyy
0.1 RESPONDENT DETAILS
0.2 TOTAL NUMBER OF MODULE III OF THE QUESTIONNAIRE (Number of agencies which filled Module III)
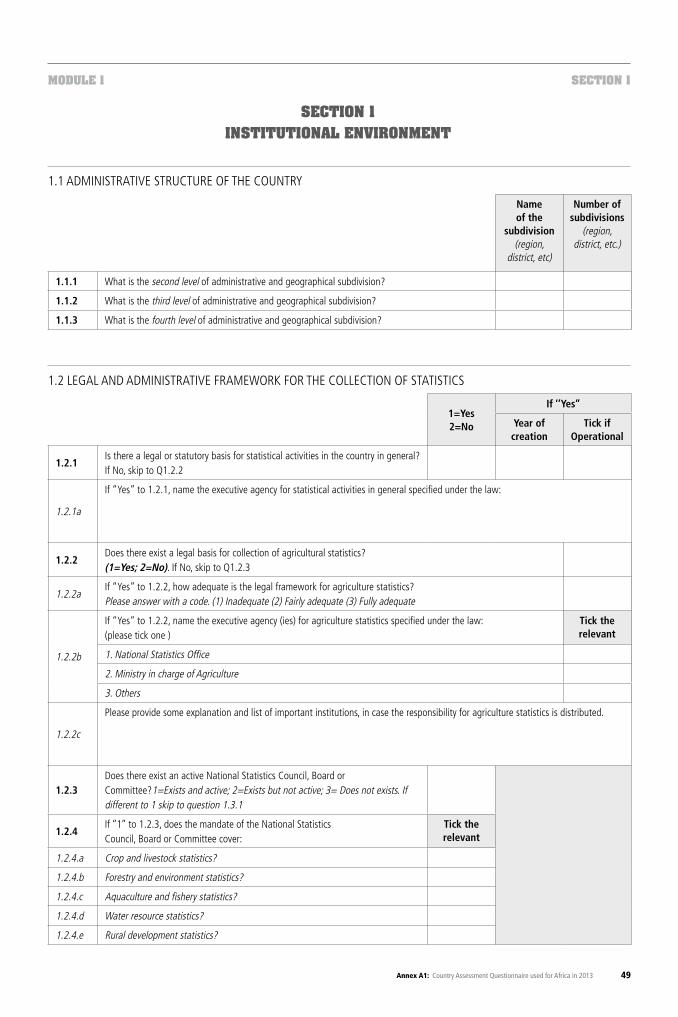
49Annex A1: Country Assessment Questionnaire used for Africa in 2013
1.2 LEGAL AND ADMINISTRATIVE FRAMEWORK FOR THE COLLECTION OF STATISTICS
1.1 ADMINISTRATIVE STRUCTURE OF THE COUNTRY
MODULE 1 SECTION 1
SECTION 1INSTITUTIONAL ENVIRONMENT
1=Yes 2=No
If ‘’Yes’’
Year of creation
Tick ifOperational
1.2.1Is there a legal or statutory basis for statistical activities in the country in general? If No, skip to Q1.2.2
1.2.1a
If “Yes” to 1.2.1, name the executive agency for statistical activities in general specified under the law:
1.2.2Does there exist a legal basis for collection of agricultural statistics? (1=Yes; 2=No). If No, skip to Q1.2.3
1.2.2aIf “Yes” to 1.2.2, how adequate is the legal framework for agriculture statistics?Please answer with a code. (1) Inadequate (2) Fairly adequate (3) Fully adequate
1.2.2b
If “Yes” to 1.2.2, name the executive agency (ies) for agriculture statistics specified under the law: (please tick one )
Tick the relevant
1. National Statistics Office
2. Ministry in charge of Agriculture
3. Others
1.2.2c
Please provide some explanation and list of important institutions, in case the responsibility for agriculture statistics is distributed.
1.2.3Does there exist an active National Statistics Council, Board or Committee?1=Exists and active; 2=Exists but not active; 3= Does not exists. If different to 1 skip to question 1.3.1
1.2.4If ’’1’’ to 1.2.3, does the mandate of the National Statistics Council, Board or Committee cover:
Tick the relevant
1.2.4.a Crop and livestock statistics?
1.2.4.b Forestry and environment statistics?
1.2.4.c Aquaculture and fishery statistics?
1.2.4.d Water resource statistics?
1.2.4.e Rural development statistics?
Name of the
subdivision (region,
district, etc)
Number of subdivisions
(region, district, etc.)
1.1.1 What is the second level of administrative and geographical subdivision?
1.1.2 What is the third level of administrative and geographical subdivision?
1.1.3 What is the fourth level of administrative and geographical subdivision?
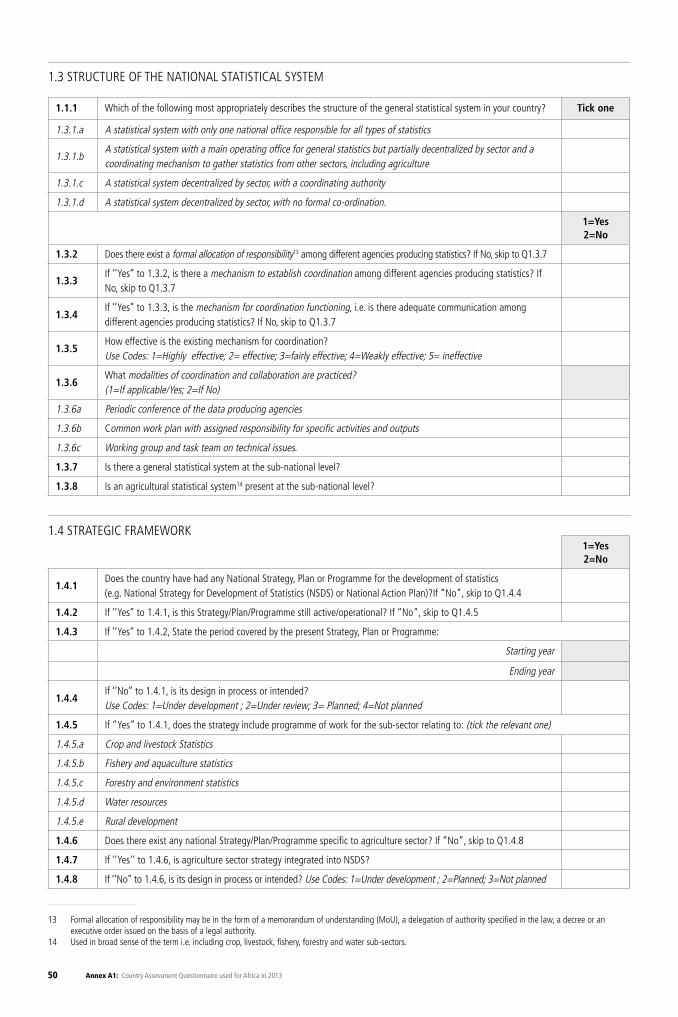
50 Annex A1: Country Assessment Questionnaire used for Africa in 2013
1.3 STRUCTURE OF THE NATIONAL STATISTICAL SYSTEM
1.4 STRATEGIC FRAMEWORK
1.1.1 Which of the following most appropriately describes the structure of the general statistical system in your country? Tick one
1.3.1.a A statistical system with only one national office responsible for all types of statistics
1.3.1.bA statistical system with a main operating office for general statistics but partially decentralized by sector and a coordinating mechanism to gather statistics from other sectors, including agriculture
1.3.1.c A statistical system decentralized by sector, with a coordinating authority
1.3.1.d A statistical system decentralized by sector, with no formal co-ordination.
1=Yes 2=No
1.3.2 Does there exist a formal allocation of responsibility13 among different agencies producing statistics? If No, skip to Q1.3.7
1.3.3If ‘’Yes’’ to 1.3.2, is there a mechanism to establish coordination among different agencies producing statistics? If No, skip to Q1.3.7
1.3.4If ‘’Yes’’ to 1.3.3, is the mechanism for coordination functioning, i.e. is there adequate communication among different agencies producing statistics? If No, skip to Q1.3.7
1.3.5How effective is the existing mechanism for coordination?Use Codes: 1=Highly effective; 2= effective; 3=fairly effective; 4=Weakly effective; 5= ineffective
1.3.6What modalities of coordination and collaboration are practiced? (1=If applicable/Yes; 2=If No)
1.3.6a Periodic conference of the data producing agencies
1.3.6b Common work plan with assigned responsibility for specific activities and outputs
1.3.6c Working group and task team on technical issues.
1.3.7 Is there a general statistical system at the sub-national level?
1.3.8 Is an agricultural statistical system14 present at the sub-national level?
1=Yes 2=No
1.4.1Does the country have had any National Strategy, Plan or Programme for the development of statistics (e.g. National Strategy for Development of Statistics (NSDS) or National Action Plan)?If “No”, skip to Q1.4.4
1.4.2 If ‘’Yes’’ to 1.4.1, is this Strategy/Plan/Programme still active/operational? If “No”, skip to Q1.4.5
1.4.3 If ‘’Yes’’ to 1.4.2, State the period covered by the present Strategy, Plan or Programme:
Starting year
Ending year
1.4.4If ‘’No’’ to 1.4.1, is its design in process or intended? Use Codes: 1=Under development ; 2=Under review; 3= Planned; 4=Not planned
1.4.5 If “Yes” to 1.4.1, does the strategy include programme of work for the sub-sector relating to: (tick the relevant one)
1.4.5.a Crop and livestock Statistics
1.4.5.b Fishery and aquaculture statistics
1.4.5.c Forestry and environment statistics
1.4.5.d Water resources
1.4.5.e Rural development
1.4.6 Does there exist any national Strategy/Plan/Programme specific to agriculture sector? If “No”, skip to Q1.4.8
1.4.7 If ‘’Yes‘’ to 1.4.6, is agriculture sector strategy integrated into NSDS?
1.4.8 If ‘’No’’ to 1.4.6, is its design in process or intended? Use Codes: 1=Under development ; 2=Planned; 3=Not planned
13 Formal allocation of responsibility may be in the form of a memorandum of understanding (MoU), a delegation of authority specified in the law, a decree or an executive order issued on the basis of a legal authority.
14 Used in broad sense of the term i.e. including crop, livestock, fishery, forestry and water sub-sectors.
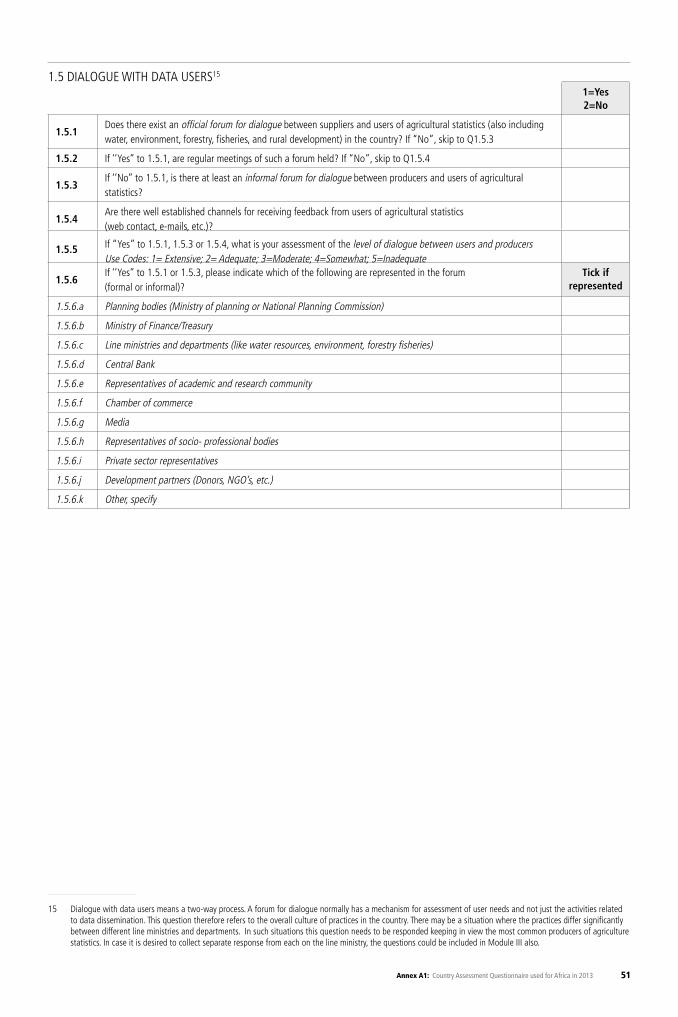
51Annex A1: Country Assessment Questionnaire used for Africa in 2013
1.5 DIALOGUE WITH DATA USERS15 1=Yes 2=No
1.5.1Does there exist an official forum for dialogue between suppliers and users of agricultural statistics (also including water, environment, forestry, fisheries, and rural development) in the country? If “No”, skip to Q1.5.3
1.5.2 If ‘’Yes’’ to 1.5.1, are regular meetings of such a forum held? If “No”, skip to Q1.5.4
1.5.3If ‘’No’’ to 1.5.1, is there at least an informal forum for dialogue between producers and users of agricultural statistics?
1.5.4Are there well established channels for receiving feedback from users of agricultural statistics (web contact, e-mails, etc.)?
1.5.5 If “Yes” to 1.5.1, 1.5.3 or 1.5.4, what is your assessment of the level of dialogue between users and producers Use Codes: 1= Extensive; 2= Adequate; 3=Moderate; 4=Somewhat; 5=Inadequate
1.5.6If ‘’Yes’’ to 1.5.1 or 1.5.3, please indicate which of the following are represented in the forum (formal or informal)?
Tick ifrepresented
1.5.6.a Planning bodies (Ministry of planning or National Planning Commission)
1.5.6.b Ministry of Finance/Treasury
1.5.6.c Line ministries and departments (like water resources, environment, forestry fisheries)
1.5.6.d Central Bank
1.5.6.e Representatives of academic and research community
1.5.6.f Chamber of commerce
1.5.6.g Media
1.5.6.h Representatives of socio- professional bodies
1.5.6.i Private sector representatives
1.5.6.j Development partners (Donors, NGO’s, etc.)
1.5.6.k Other, specify
15 Dialogue with data users means a two-way process. A forum for dialogue normally has a mechanism for assessment of user needs and not just the activities related to data dissemination. This question therefore refers to the overall culture of practices in the country. There may be a situation where the practices differ significantly between different line ministries and departments. In such situations this question needs to be responded keeping in view the most common producers of agriculture statistics. In case it is desired to collect separate response from each on the line ministry, the questions could be included in Module III also.
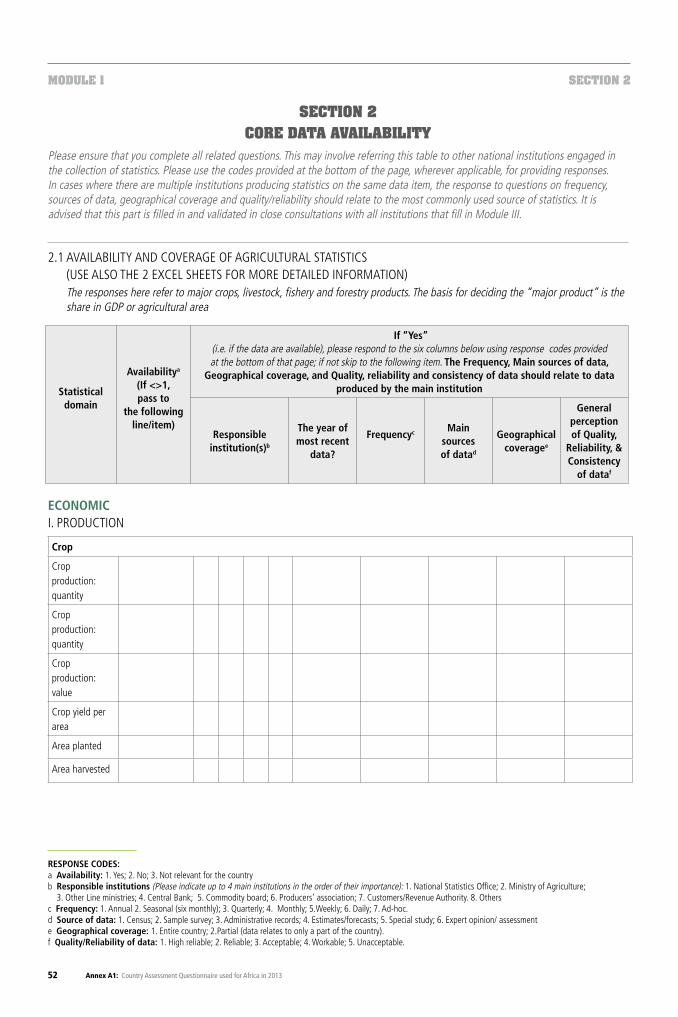
52 Annex A1: Country Assessment Questionnaire used for Africa in 2013
MODULE 1 SECTION 2
SECTION 2CORE DATA AVAILABILITY
Please ensure that you complete all related questions. This may involve referring this table to other national institutions engaged in the collection of statistics. Please use the codes provided at the bottom of the page, wherever applicable, for providing responses. In cases where there are multiple institutions producing statistics on the same data item, the response to questions on frequency, sources of data, geographical coverage and quality/reliability should relate to the most commonly used source of statistics. It is advised that this part is filled in and validated in close consultations with all institutions that fill in Module III.
2.1 AVAILABILITY AND COVERAGE OF AGRICULTURAL STATISTICS (USE ALSO THE 2 EXCEL SHEETS FOR MORE DETAILED INFORMATION) The responses here refer to major crops, livestock, fishery and forestry products. The basis for deciding the “major product” is the share in GDP or agricultural area
ECONOMICI. PRODUCTION
RESPONSE CODES:a Availability: 1. Yes; 2. No; 3. Not relevant for the countryb Responsible institutions (Please indicate up to 4 main institutions in the order of their importance): 1. National Statistics Office; 2. Ministry of Agriculture;
3. Other Line ministries; 4. Central Bank; 5. Commodity board; 6. Producers’ association; 7. Customers/Revenue Authority. 8. Others c Frequency: 1. Annual 2. Seasonal (six monthly); 3. Quarterly; 4. Monthly; 5.Weekly; 6. Daily; 7. Ad-hoc.d Source of data: 1. Census; 2. Sample survey; 3. Administrative records; 4. Estimates/forecasts; 5. Special study; 6. Expert opinion/ assessment e Geographical coverage: 1. Entire country; 2.Partial (data relates to only a part of the country).f Quality/Reliability of data: 1. High reliable; 2. Reliable; 3. Acceptable; 4. Workable; 5. Unacceptable.
Statisticaldomain
Availabilitya
(If <>1, pass to
the following line/item)
If “Yes”(i.e. if the data are available), please respond to the six columns below using response codes provided at the bottom of that page; if not skip to the following item. The Frequency, Main sources of data,
Geographical coverage, and Quality, reliability and consistency of data should relate to data produced by the main institution
Responsible institution(s)b
The year of most recent
data?
Frequencyc Main sources of datad
Geographical coveragee
General perception of Quality,
Reliability, & Consistency
of dataf
Crop
Crop production: quantity
Crop production: quantity
Crop production: value
Crop yield per area
Area planted
Area harvested
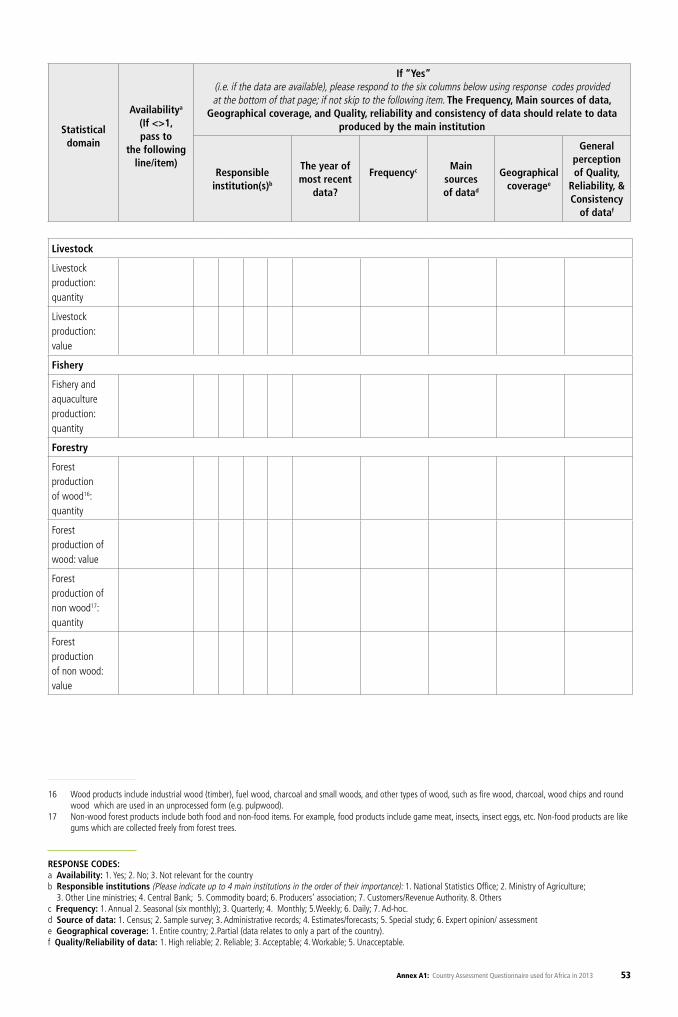
53Annex A1: Country Assessment Questionnaire used for Africa in 2013
RESPONSE CODES:a Availability: 1. Yes; 2. No; 3. Not relevant for the countryb Responsible institutions (Please indicate up to 4 main institutions in the order of their importance): 1. National Statistics Office; 2. Ministry of Agriculture;
3. Other Line ministries; 4. Central Bank; 5. Commodity board; 6. Producers’ association; 7. Customers/Revenue Authority. 8. Others c Frequency: 1. Annual 2. Seasonal (six monthly); 3. Quarterly; 4. Monthly; 5.Weekly; 6. Daily; 7. Ad-hoc.d Source of data: 1. Census; 2. Sample survey; 3. Administrative records; 4. Estimates/forecasts; 5. Special study; 6. Expert opinion/ assessment e Geographical coverage: 1. Entire country; 2.Partial (data relates to only a part of the country).f Quality/Reliability of data: 1. High reliable; 2. Reliable; 3. Acceptable; 4. Workable; 5. Unacceptable.
Statisticaldomain
Availabilitya
(If <>1, pass to
the following line/item)
If “Yes”(i.e. if the data are available), please respond to the six columns below using response codes provided at the bottom of that page; if not skip to the following item. The Frequency, Main sources of data,
Geographical coverage, and Quality, reliability and consistency of data should relate to data produced by the main institution
Responsible institution(s)b
The year of most recent
data?
Frequencyc Main sources of datad
Geographical coveragee
General perception of Quality,
Reliability, & Consistency
of dataf
Livestock
Livestock production: quantity
Livestock production: value
Fishery
Fishery and aquaculture production: quantity
Forestry
Forest production of wood16: quantity
Forest production of wood: value
Forest production of non wood17: quantity
Forest production of non wood: value
16 Wood products include industrial wood (timber), fuel wood, charcoal and small woods, and other types of wood, such as fire wood, charcoal, wood chips and round wood which are used in an unprocessed form (e.g. pulpwood).
17 Non-wood forest products include both food and non-food items. For example, food products include game meat, insects, insect eggs, etc. Non-food products are like gums which are collected freely from forest trees.
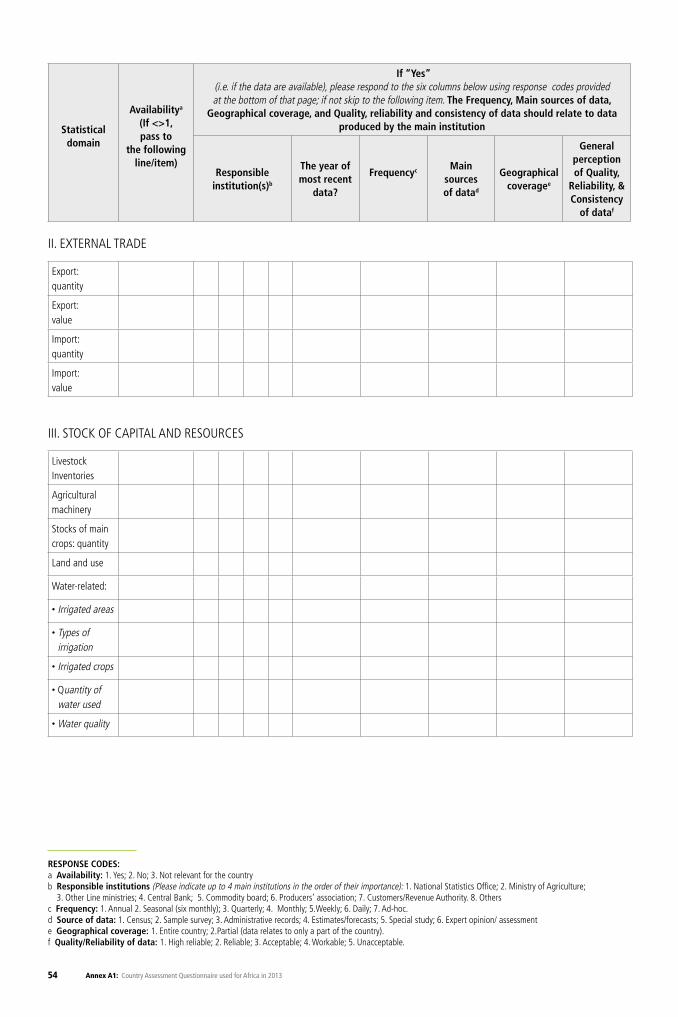
54 Annex A1: Country Assessment Questionnaire used for Africa in 2013
II. EXTERNAL TRADE
III. STOCK OF CAPITAL AND RESOURCES
Statisticaldomain
Availabilitya
(If <>1, pass to
the following line/item)
If “Yes”(i.e. if the data are available), please respond to the six columns below using response codes provided at the bottom of that page; if not skip to the following item. The Frequency, Main sources of data,
Geographical coverage, and Quality, reliability and consistency of data should relate to data produced by the main institution
Responsible institution(s)b
The year of most recent
data?
Frequencyc Main sources of datad
Geographical coveragee
General perception of Quality,
Reliability, & Consistency
of dataf
Export: quantity
Export: value
Import: quantity
Import: value
Livestock Inventories
Agricultural machinery
Stocks of main crops: quantity
Land and use
Water-related:
• Irrigated areas
• Types of irrigation
• Irrigated crops
• Quantity of water used
• Water quality
RESPONSE CODES:a Availability: 1. Yes; 2. No; 3. Not relevant for the countryb Responsible institutions (Please indicate up to 4 main institutions in the order of their importance): 1. National Statistics Office; 2. Ministry of Agriculture;
3. Other Line ministries; 4. Central Bank; 5. Commodity board; 6. Producers’ association; 7. Customers/Revenue Authority. 8. Others c Frequency: 1. Annual 2. Seasonal (six monthly); 3. Quarterly; 4. Monthly; 5.Weekly; 6. Daily; 7. Ad-hoc.d Source of data: 1. Census; 2. Sample survey; 3. Administrative records; 4. Estimates/forecasts; 5. Special study; 6. Expert opinion/ assessment e Geographical coverage: 1. Entire country; 2.Partial (data relates to only a part of the country).f Quality/Reliability of data: 1. High reliable; 2. Reliable; 3. Acceptable; 4. Workable; 5. Unacceptable.
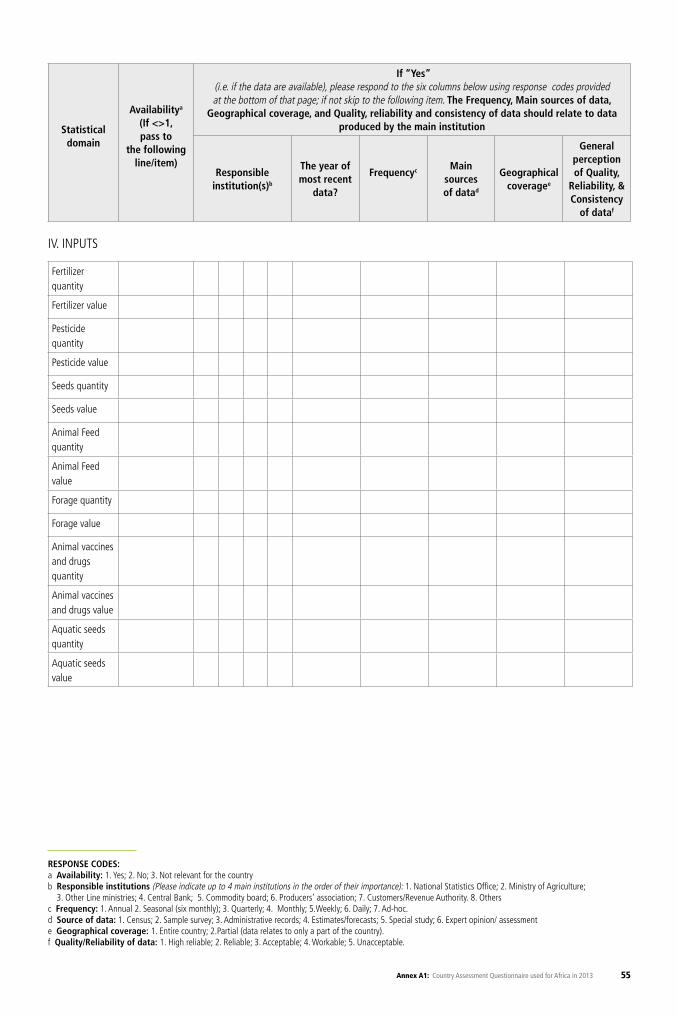
55Annex A1: Country Assessment Questionnaire used for Africa in 2013
IV. INPUTS
Statisticaldomain
Availabilitya
(If <>1, pass to
the following line/item)
If “Yes”(i.e. if the data are available), please respond to the six columns below using response codes provided at the bottom of that page; if not skip to the following item. The Frequency, Main sources of data,
Geographical coverage, and Quality, reliability and consistency of data should relate to data produced by the main institution
Responsible institution(s)b
The year of most recent
data?
Frequencyc Main sources of datad
Geographical coveragee
General perception of Quality,
Reliability, & Consistency
of dataf
Fertilizer quantity
Fertilizer value
Pesticide quantity
Pesticide value
Seeds quantity
Seeds value
Animal Feed quantity
Animal Feed value
Forage quantity
Forage value
Animal vaccines and drugs quantity
Animal vaccines and drugs value
Aquatic seeds quantity
Aquatic seeds value
RESPONSE CODES:a Availability: 1. Yes; 2. No; 3. Not relevant for the countryb Responsible institutions (Please indicate up to 4 main institutions in the order of their importance): 1. National Statistics Office; 2. Ministry of Agriculture;
3. Other Line ministries; 4. Central Bank; 5. Commodity board; 6. Producers’ association; 7. Customers/Revenue Authority. 8. Others c Frequency: 1. Annual 2. Seasonal (six monthly); 3. Quarterly; 4. Monthly; 5.Weekly; 6. Daily; 7. Ad-hoc.d Source of data: 1. Census; 2. Sample survey; 3. Administrative records; 4. Estimates/forecasts; 5. Special study; 6. Expert opinion/ assessment e Geographical coverage: 1. Entire country; 2.Partial (data relates to only a part of the country).f Quality/Reliability of data: 1. High reliable; 2. Reliable; 3. Acceptable; 4. Workable; 5. Unacceptable.
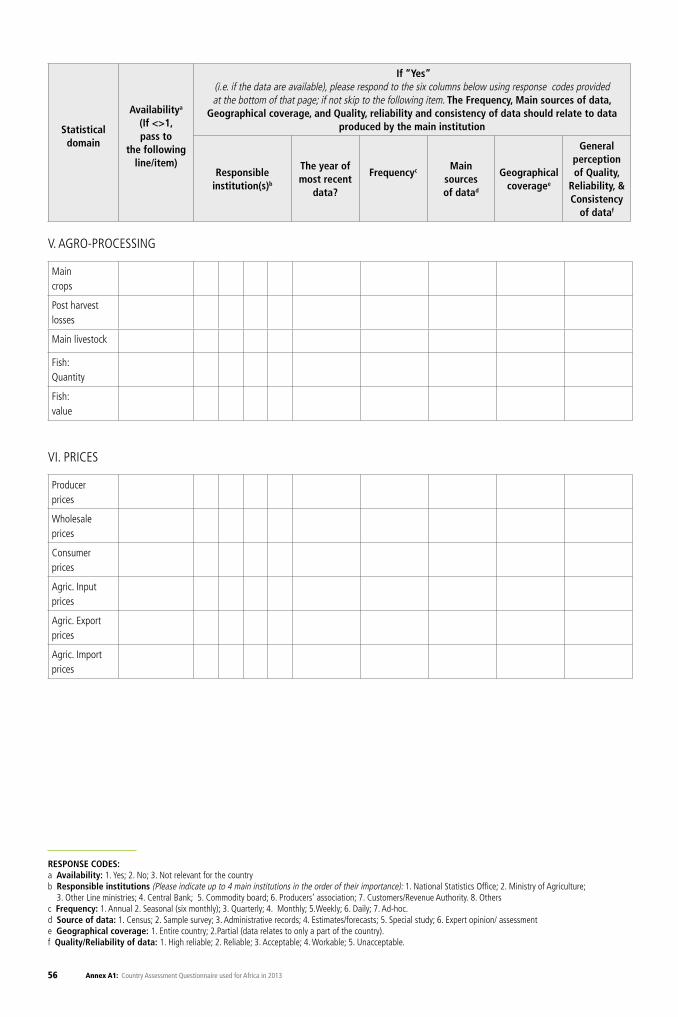
56 Annex A1: Country Assessment Questionnaire used for Africa in 2013
V. AGRO-PROCESSING
VI. PRICES
Statisticaldomain
Availabilitya
(If <>1, pass to
the following line/item)
If “Yes”(i.e. if the data are available), please respond to the six columns below using response codes provided at the bottom of that page; if not skip to the following item. The Frequency, Main sources of data,
Geographical coverage, and Quality, reliability and consistency of data should relate to data produced by the main institution
Responsible institution(s)b
The year of most recent
data?
Frequencyc Main sources of datad
Geographical coveragee
General perception of Quality,
Reliability, & Consistency
of dataf
Maincrops
Post harvest losses
Main livestock
Fish: Quantity
Fish:value
Producer prices
Wholesale prices
Consumer prices
Agric. Input prices
Agric. Export prices
Agric. Import prices
RESPONSE CODES:a Availability: 1. Yes; 2. No; 3. Not relevant for the countryb Responsible institutions (Please indicate up to 4 main institutions in the order of their importance): 1. National Statistics Office; 2. Ministry of Agriculture;
3. Other Line ministries; 4. Central Bank; 5. Commodity board; 6. Producers’ association; 7. Customers/Revenue Authority. 8. Others c Frequency: 1. Annual 2. Seasonal (six monthly); 3. Quarterly; 4. Monthly; 5.Weekly; 6. Daily; 7. Ad-hoc.d Source of data: 1. Census; 2. Sample survey; 3. Administrative records; 4. Estimates/forecasts; 5. Special study; 6. Expert opinion/ assessment e Geographical coverage: 1. Entire country; 2.Partial (data relates to only a part of the country).f Quality/Reliability of data: 1. High reliable; 2. Reliable; 3. Acceptable; 4. Workable; 5. Unacceptable.
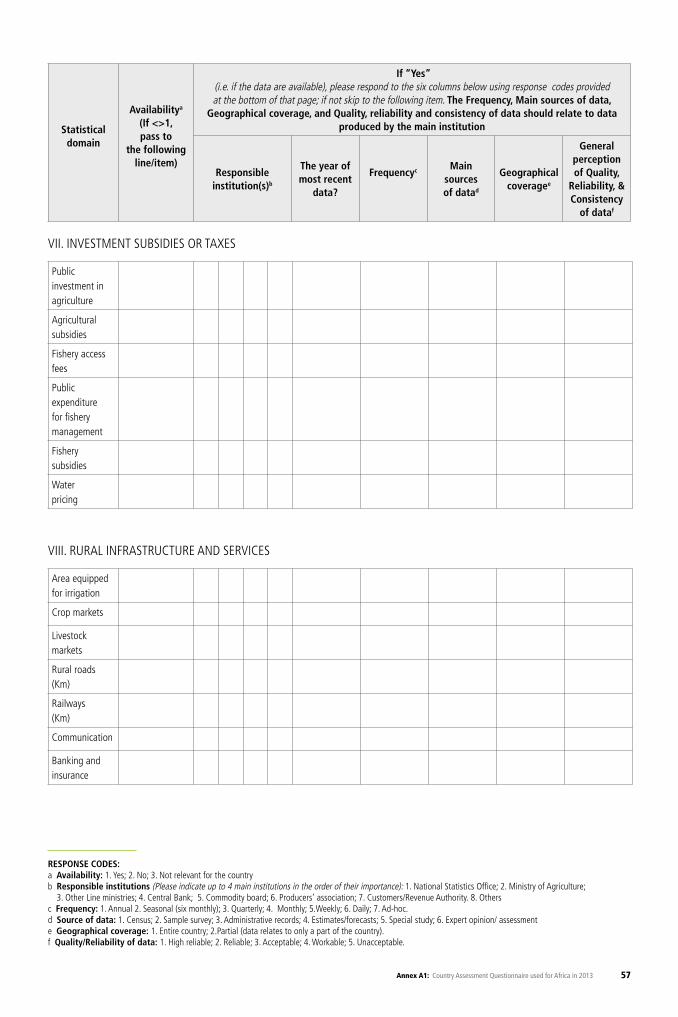
57Annex A1: Country Assessment Questionnaire used for Africa in 2013
VII. INVESTMENT SUBSIDIES OR TAXES
VIII. RURAL INFRASTRUCTURE AND SERVICES
Statisticaldomain
Availabilitya
(If <>1, pass to
the following line/item)
If “Yes”(i.e. if the data are available), please respond to the six columns below using response codes provided at the bottom of that page; if not skip to the following item. The Frequency, Main sources of data,
Geographical coverage, and Quality, reliability and consistency of data should relate to data produced by the main institution
Responsible institution(s)b
The year of most recent
data?
Frequencyc Main sources of datad
Geographical coveragee
General perception of Quality,
Reliability, & Consistency
of dataf
Public investment in agriculture
Agricultural subsidies
Fishery access fees
Public expenditure for fishery management
Fishery subsidies
Water pricing
Area equipped for irrigation
Crop markets
Livestock markets
Rural roads (Km)
Railways (Km)
Communication
Banking and insurance
RESPONSE CODES:a Availability: 1. Yes; 2. No; 3. Not relevant for the countryb Responsible institutions (Please indicate up to 4 main institutions in the order of their importance): 1. National Statistics Office; 2. Ministry of Agriculture;
3. Other Line ministries; 4. Central Bank; 5. Commodity board; 6. Producers’ association; 7. Customers/Revenue Authority. 8. Others c Frequency: 1. Annual 2. Seasonal (six monthly); 3. Quarterly; 4. Monthly; 5.Weekly; 6. Daily; 7. Ad-hoc.d Source of data: 1. Census; 2. Sample survey; 3. Administrative records; 4. Estimates/forecasts; 5. Special study; 6. Expert opinion/ assessment e Geographical coverage: 1. Entire country; 2.Partial (data relates to only a part of the country).f Quality/Reliability of data: 1. High reliable; 2. Reliable; 3. Acceptable; 4. Workable; 5. Unacceptable.
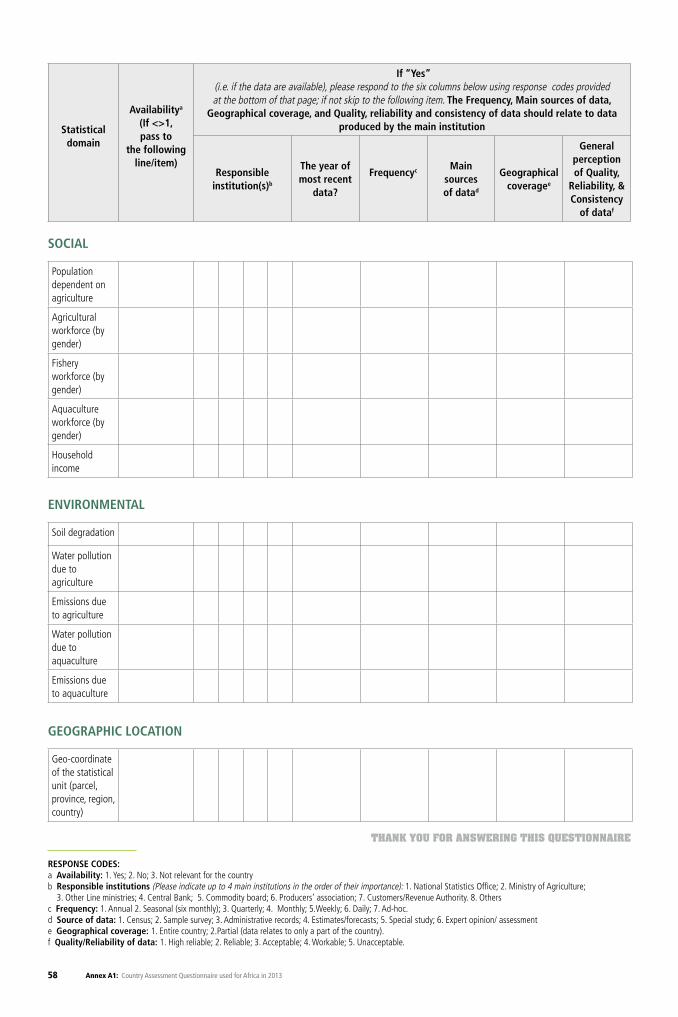
58 Annex A1: Country Assessment Questionnaire used for Africa in 2013
SOCIAL
ENVIRONMENTAL
GEOGRAPHIC LOCATION
Statisticaldomain
Availabilitya
(If <>1, pass to
the following line/item)
If “Yes”(i.e. if the data are available), please respond to the six columns below using response codes provided at the bottom of that page; if not skip to the following item. The Frequency, Main sources of data,
Geographical coverage, and Quality, reliability and consistency of data should relate to data produced by the main institution
Responsible institution(s)b
The year of most recent
data?
Frequencyc Main sources of datad
Geographical coveragee
General perception of Quality,
Reliability, & Consistency
of dataf
Population dependent on agriculture
Agricultural workforce (by gender)
Fishery workforce (by gender)
Aquaculture workforce (by gender)
Household income
Soil degradation
Water pollution due to agriculture
Emissions due to agriculture
Water pollution due to aquaculture
Emissions due to aquaculture
Geo-coordinate of the statistical unit (parcel, province, region, country)
RESPONSE CODES:a Availability: 1. Yes; 2. No; 3. Not relevant for the countryb Responsible institutions (Please indicate up to 4 main institutions in the order of their importance): 1. National Statistics Office; 2. Ministry of Agriculture;
3. Other Line ministries; 4. Central Bank; 5. Commodity board; 6. Producers’ association; 7. Customers/Revenue Authority. 8. Others c Frequency: 1. Annual 2. Seasonal (six monthly); 3. Quarterly; 4. Monthly; 5.Weekly; 6. Daily; 7. Ad-hoc.d Source of data: 1. Census; 2. Sample survey; 3. Administrative records; 4. Estimates/forecasts; 5. Special study; 6. Expert opinion/ assessment e Geographical coverage: 1. Entire country; 2.Partial (data relates to only a part of the country).f Quality/Reliability of data: 1. High reliable; 2. Reliable; 3. Acceptable; 4. Workable; 5. Unacceptable.
THANK YOU FOR ANSWERING THIS QUESTIONNAIRE
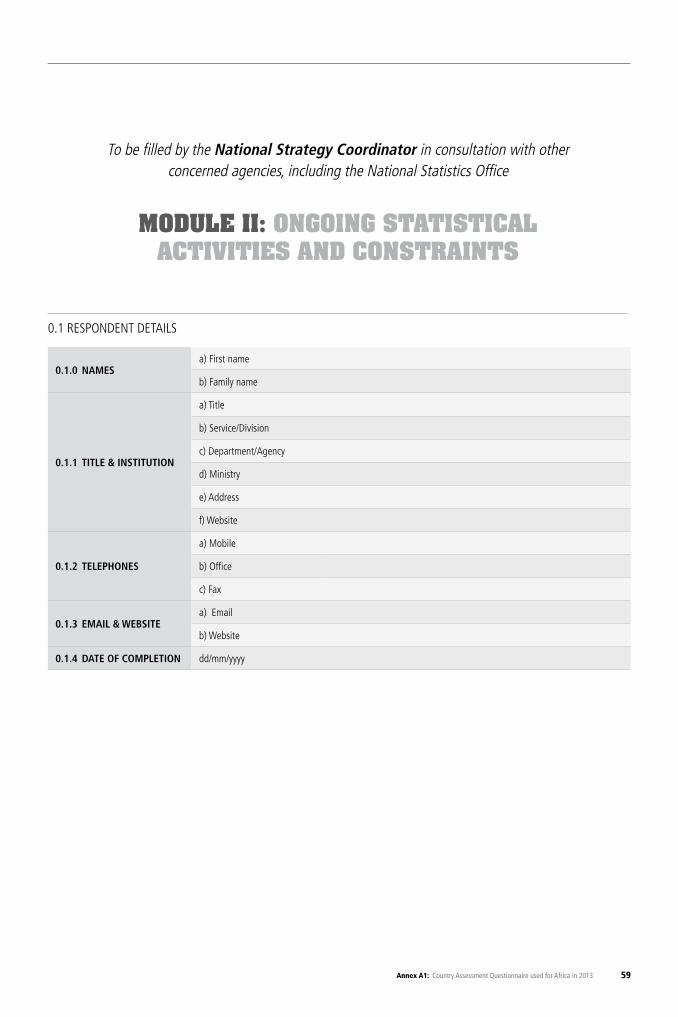
59Annex A1: Country Assessment Questionnaire used for Africa in 2013
To be filled by the National Strategy Coordinator in consultation with other concerned agencies, including the National Statistics Office
MODULE II: ONGOING STATISTICAL ACTIVITIES AND CONSTRAINTS
0.1.0 NAMESa) First name
b) Family name
0.1.1 TITLE & INSTITUTION
a) Title
b) Service/Division
c) Department/Agency
d) Ministry
e) Address
f) Website
0.1.2 TELEPHONES
a) Mobile
b) Office
c) Fax
0.1.3 EMAIL & WEBSITEa) Email
b) Website
0.1.4 DATE OF COMPLETION dd/mm/yyyy
0.1 RESPONDENT DETAILS
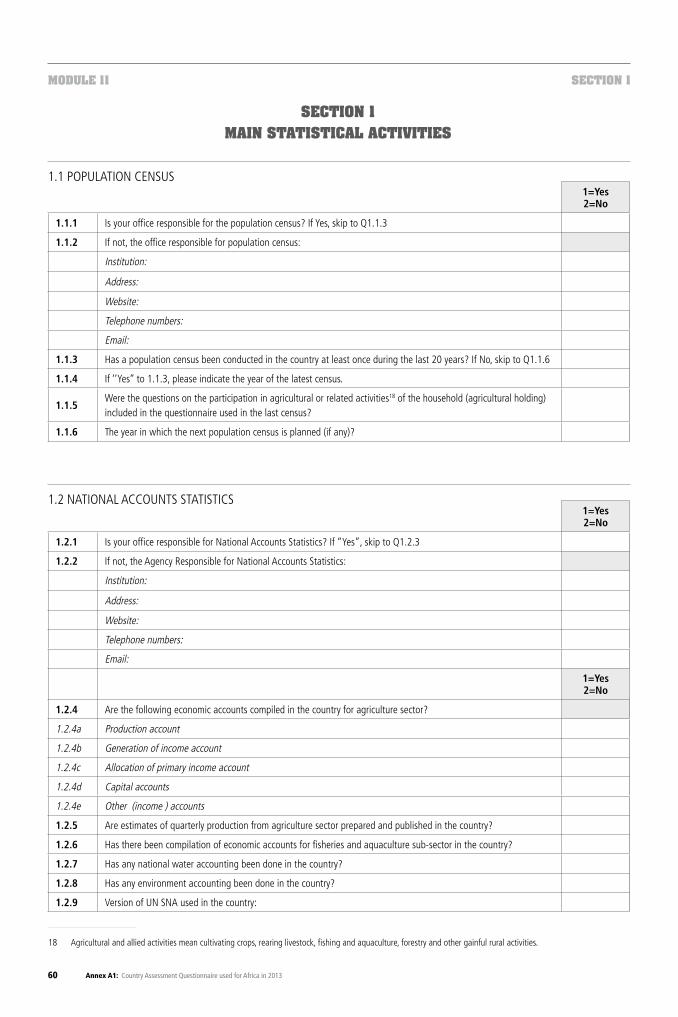
60 Annex A1: Country Assessment Questionnaire used for Africa in 2013
MODULE 11 SECTION 1
SECTION 1MAIN STATISTICAL ACTIVITIES
1.1 POPULATION CENSUS
1.2 NATIONAL ACCOUNTS STATISTICS
1=Yes 2=No
1.1.1 Is your office responsible for the population census? If Yes, skip to Q1.1.3
1.1.2 If not, the office responsible for population census:
Institution:
Address:
Website:
Telephone numbers:
Email:
1.1.3 Has a population census been conducted in the country at least once during the last 20 years? If No, skip to Q1.1.6
1.1.4 If ‘’Yes’’ to 1.1.3, please indicate the year of the latest census.
1.1.5Were the questions on the participation in agricultural or related activities18 of the household (agricultural holding) included in the questionnaire used in the last census?
1.1.6 The year in which the next population census is planned (if any)?
1=Yes 2=No
1.2.1 Is your office responsible for National Accounts Statistics? If “Yes”, skip to Q1.2.3
1.2.2 If not, the Agency Responsible for National Accounts Statistics:
Institution:
Address:
Website:
Telephone numbers:
Email:
1=Yes 2=No
1.2.4 Are the following economic accounts compiled in the country for agriculture sector?
1.2.4a Production account
1.2.4b Generation of income account
1.2.4c Allocation of primary income account
1.2.4d Capital accounts
1.2.4e Other (income ) accounts
1.2.5 Are estimates of quarterly production from agriculture sector prepared and published in the country?
1.2.6 Has there been compilation of economic accounts for fisheries and aquaculture sub-sector in the country?
1.2.7 Has any national water accounting been done in the country?
1.2.8 Has any environment accounting been done in the country?
1.2.9 Version of UN SNA used in the country:
18 Agricultural and allied activities mean cultivating crops, rearing livestock, fishing and aquaculture, forestry and other gainful rural activities.
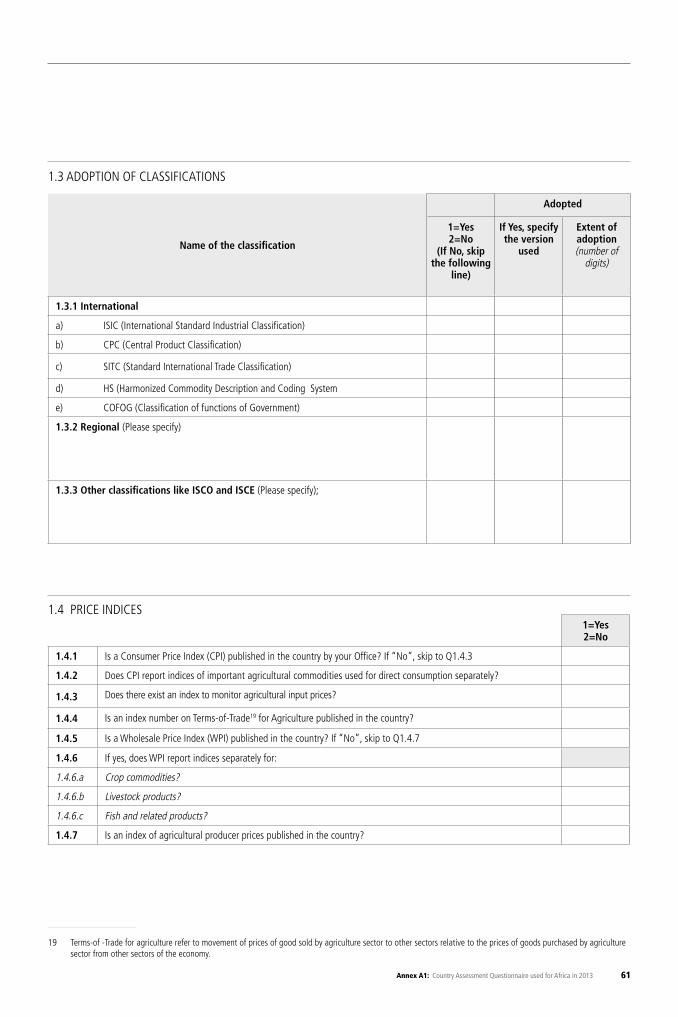
61Annex A1: Country Assessment Questionnaire used for Africa in 2013
1.4 PRICE INDICES
1.3 ADOPTION OF CLASSIFICATIONS
1=Yes 2=No
1.4.1 Is a Consumer Price Index (CPI) published in the country by your Office? If “No”, skip to Q1.4.3
1.4.2 Does CPI report indices of important agricultural commodities used for direct consumption separately?
1.4.3 Does there exist an index to monitor agricultural input prices?
1.4.4 Is an index number on Terms-of-Trade19 for Agriculture published in the country?
1.4.5 Is a Wholesale Price Index (WPI) published in the country? If “No”, skip to Q1.4.7
1.4.6 If yes, does WPI report indices separately for:
1.4.6.a Crop commodities?
1.4.6.b Livestock products?
1.4.6.c Fish and related products?
1.4.7 Is an index of agricultural producer prices published in the country?
Name of the classification
Adopted
1=Yes 2=No
(If No, skip the following
line)
If Yes, specify the version
used
Extent of adoption(number of
digits)
1.3.1 International
a) ISIC (International Standard Industrial Classification)
b) CPC (Central Product Classification)
c) SITC (Standard International Trade Classification)
d) HS (Harmonized Commodity Description and Coding System
e) COFOG (Classification of functions of Government)
1.3.2 Regional (Please specify)
1.3.3 Other classifications like ISCO and ISCE (Please specify);
19 Terms-of -Trade for agriculture refer to movement of prices of good sold by agriculture sector to other sectors relative to the prices of goods purchased by agriculture sector from other sectors of the economy.
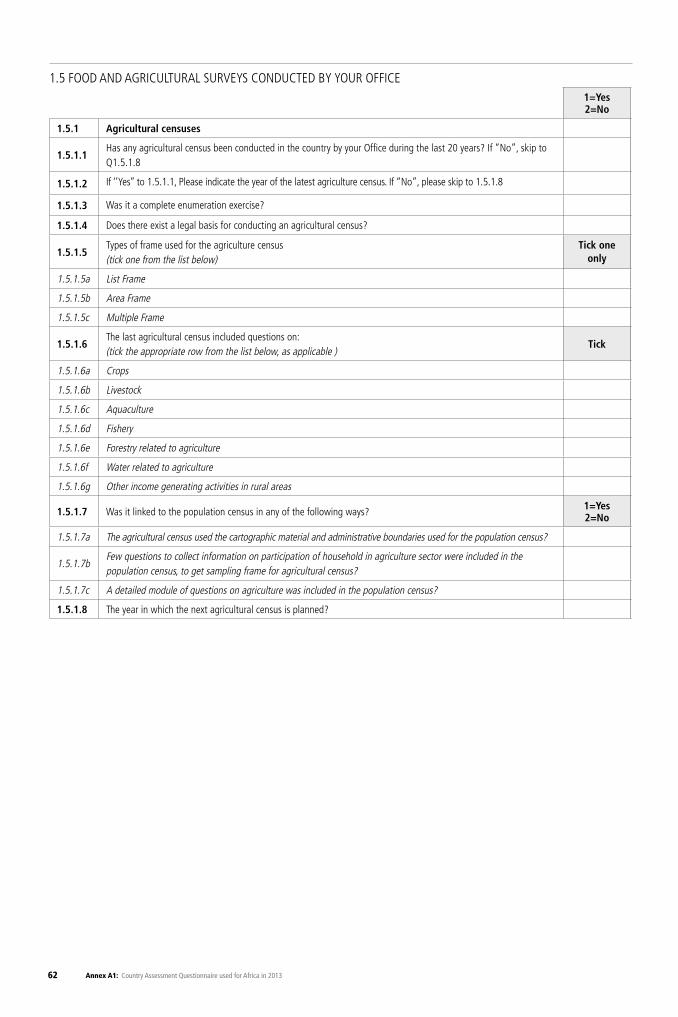
62 Annex A1: Country Assessment Questionnaire used for Africa in 2013
1.5 FOOD AND AGRICULTURAL SURVEYS CONDUCTED BY YOUR OFFICE1=Yes 2=No
1.5.1 Agricultural censuses
1.5.1.1Has any agricultural census been conducted in the country by your Office during the last 20 years? If “No”, skip to Q1.5.1.8
1.5.1.2 If ‘’Yes’’ to 1.5.1.1, Please indicate the year of the latest agriculture census. If “No”, please skip to 1.5.1.8
1.5.1.3 Was it a complete enumeration exercise?
1.5.1.4 Does there exist a legal basis for conducting an agricultural census?
1.5.1.5Types of frame used for the agriculture census (tick one from the list below)
Tick one only
1.5.1.5a List Frame
1.5.1.5b Area Frame
1.5.1.5c Multiple Frame
1.5.1.6The last agricultural census included questions on:(tick the appropriate row from the list below, as applicable )
Tick
1.5.1.6a Crops
1.5.1.6b Livestock
1.5.1.6c Aquaculture
1.5.1.6d Fishery
1.5.1.6e Forestry related to agriculture
1.5.1.6f Water related to agriculture
1.5.1.6g Other income generating activities in rural areas
1.5.1.7 Was it linked to the population census in any of the following ways? 1=Yes 2=No
1.5.1.7a The agricultural census used the cartographic material and administrative boundaries used for the population census?
1.5.1.7bFew questions to collect information on participation of household in agriculture sector were included in the population census, to get sampling frame for agricultural census?
1.5.1.7c A detailed module of questions on agriculture was included in the population census?
1.5.1.8 The year in which the next agricultural census is planned?
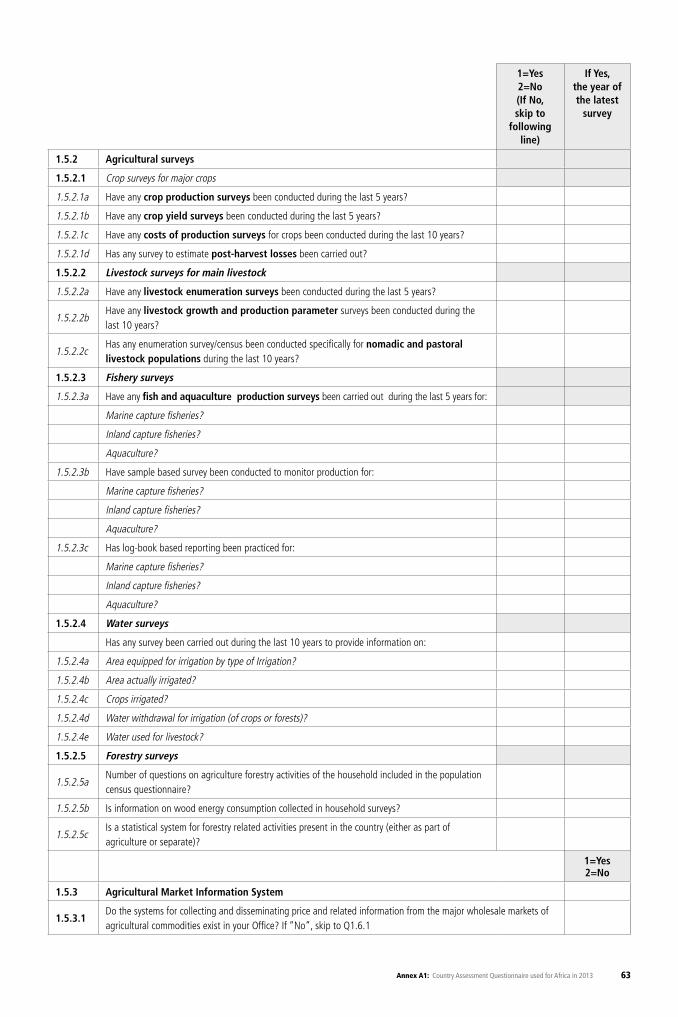
63Annex A1: Country Assessment Questionnaire used for Africa in 2013
1=Yes 2=No(If No, skip to
following line)
If Yes, the year of the latest
survey
1.5.2 Agricultural surveys
1.5.2.1 Crop surveys for major crops
1.5.2.1a Have any crop production surveys been conducted during the last 5 years?
1.5.2.1b Have any crop yield surveys been conducted during the last 5 years?
1.5.2.1c Have any costs of production surveys for crops been conducted during the last 10 years?
1.5.2.1d Has any survey to estimate post-harvest losses been carried out?
1.5.2.2 Livestock surveys for main livestock
1.5.2.2a Have any livestock enumeration surveys been conducted during the last 5 years?
1.5.2.2bHave any livestock growth and production parameter surveys been conducted during the last 10 years?
1.5.2.2cHas any enumeration survey/census been conducted specifically for nomadic and pastoral livestock populations during the last 10 years?
1.5.2.3 Fishery surveys
1.5.2.3a Have any fish and aquaculture production surveys been carried out during the last 5 years for:
Marine capture fisheries?
Inland capture fisheries?
Aquaculture?
1.5.2.3b Have sample based survey been conducted to monitor production for:
Marine capture fisheries?
Inland capture fisheries?
Aquaculture?
1.5.2.3c Has log-book based reporting been practiced for:
Marine capture fisheries?
Inland capture fisheries?
Aquaculture?
1.5.2.4 Water surveys
Has any survey been carried out during the last 10 years to provide information on:
1.5.2.4a Area equipped for irrigation by type of Irrigation?
1.5.2.4b Area actually irrigated?
1.5.2.4c Crops irrigated?
1.5.2.4d Water withdrawal for irrigation (of crops or forests)?
1.5.2.4e Water used for livestock?
1.5.2.5 Forestry surveys
1.5.2.5aNumber of questions on agriculture forestry activities of the household included in the population census questionnaire?
1.5.2.5b Is information on wood energy consumption collected in household surveys?
1.5.2.5cIs a statistical system for forestry related activities present in the country (either as part of agriculture or separate)?
1=Yes 2=No
1.5.3 Agricultural Market Information System
1.5.3.1Do the systems for collecting and disseminating price and related information from the major wholesale markets of agricultural commodities exist in your Office? If “No”, skip to Q1.6.1
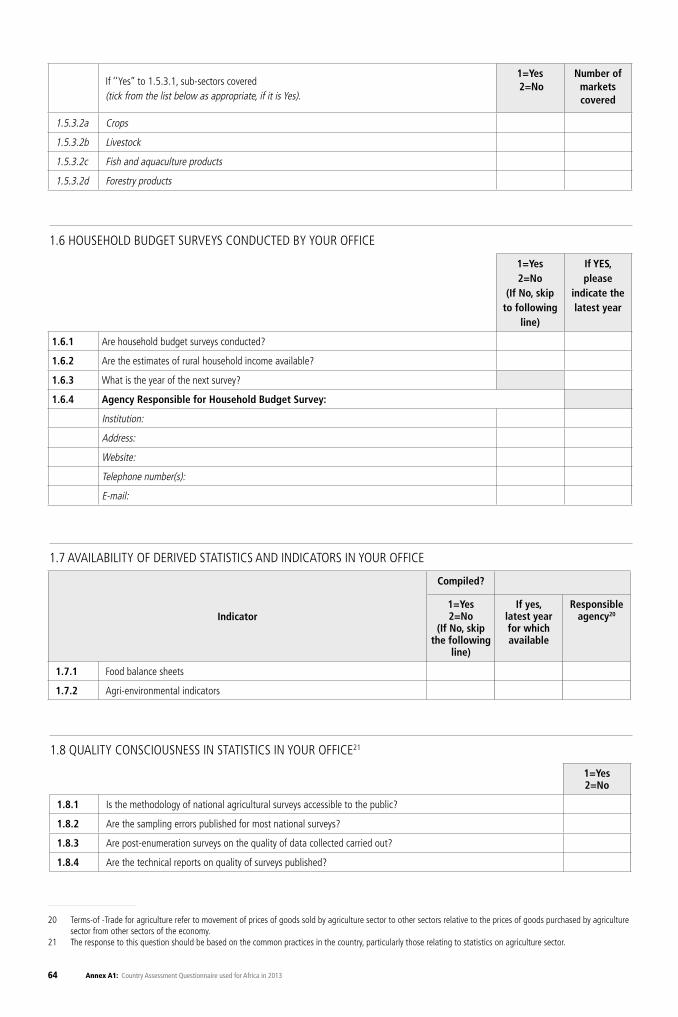
64 Annex A1: Country Assessment Questionnaire used for Africa in 2013
1=Yes 2=No
1.8.1 Is the methodology of national agricultural surveys accessible to the public?
1.8.2 Are the sampling errors published for most national surveys?
1.8.3 Are post-enumeration surveys on the quality of data collected carried out?
1.8.4 Are the technical reports on quality of surveys published?
If ‘’Yes’’ to 1.5.3.1, sub-sectors covered (tick from the list below as appropriate, if it is Yes).
1=Yes 2=No
Number of markets covered
1.5.3.2a Crops
1.5.3.2b Livestock
1.5.3.2c Fish and aquaculture products
1.5.3.2d Forestry products
1=Yes 2=No
(If No, skip to following
line)
If YES, please
indicate the latest year
1.6.1 Are household budget surveys conducted?
1.6.2 Are the estimates of rural household income available?
1.6.3 What is the year of the next survey?
1.6.4 Agency Responsible for Household Budget Survey:
Institution:
Address:
Website:
Telephone number(s):
E-mail:
1.6 HOUSEHOLD BUDGET SURVEYS CONDUCTED BY YOUR OFFICE
1.7 AVAILABILITY OF DERIVED STATISTICS AND INDICATORS IN YOUR OFFICE
1.8 QUALITY CONSCIOUSNESS IN STATISTICS IN YOUR OFFICE21
Indicator
Compiled?
1=Yes 2=No
(If No, skip the following
line)
If yes, latest year for which available
Responsible agency20
1.7.1 Food balance sheets
1.7.2 Agri-environmental indicators
20 Terms-of -Trade for agriculture refer to movement of prices of goods sold by agriculture sector to other sectors relative to the prices of goods purchased by agriculture sector from other sectors of the economy.
21 The response to this question should be based on the common practices in the country, particularly those relating to statistics on agriculture sector.
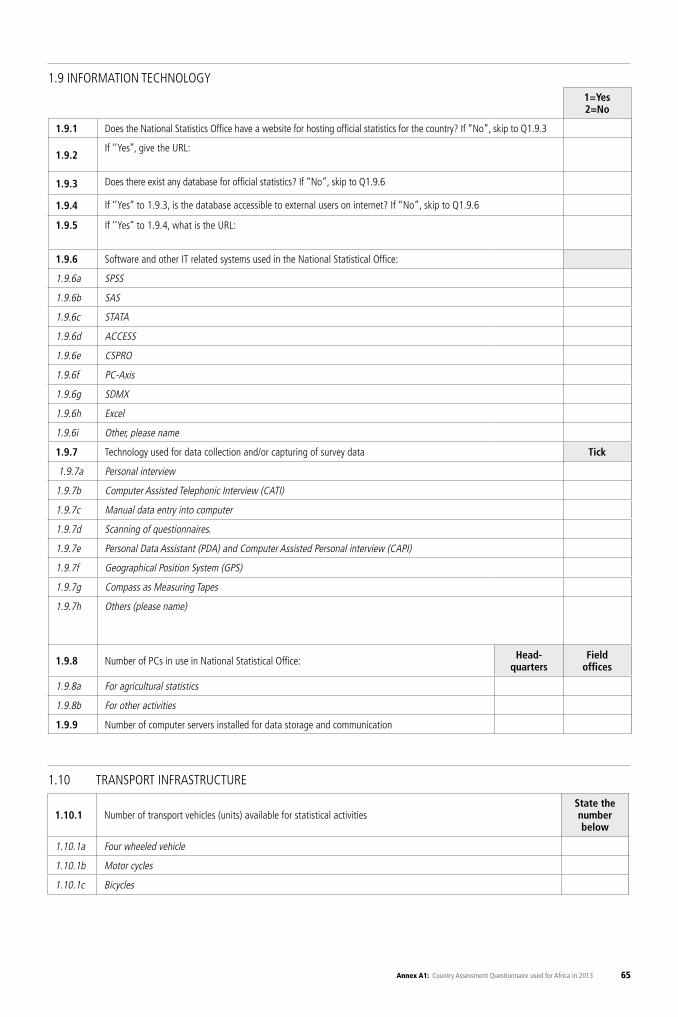
65Annex A1: Country Assessment Questionnaire used for Africa in 2013
1.10.1 Number of transport vehicles (units) available for statistical activitiesState the number below
1.10.1a Four wheeled vehicle
1.10.1b Motor cycles
1.10.1c Bicycles
1.10 TRANSPORT INFRASTRUCTURE
1.9 INFORMATION TECHNOLOGY1=Yes 2=No
1.9.1 Does the National Statistics Office have a website for hosting official statistics for the country? If “No”, skip to Q1.9.3
1.9.2If ‘’Yes’’, give the URL:
1.9.3 Does there exist any database for official statistics? If “No”, skip to Q1.9.6
1.9.4 If ‘’Yes’’ to 1.9.3, is the database accessible to external users on internet? If “No”, skip to Q1.9.6
1.9.5 If ‘’Yes’’ to 1.9.4, what is the URL:
1.9.6 Software and other IT related systems used in the National Statistical Office:
1.9.6a SPSS
1.9.6b SAS
1.9.6c STATA
1.9.6d ACCESS
1.9.6e CSPRO
1.9.6f PC-Axis
1.9.6g SDMX
1.9.6h Excel
1.9.6i Other, please name
1.9.7 Technology used for data collection and/or capturing of survey data Tick
1.9.7a Personal interview
1.9.7b Computer Assisted Telephonic Interview (CATI)
1.9.7c Manual data entry into computer
1.9.7d Scanning of questionnaires.
1.9.7e Personal Data Assistant (PDA) and Computer Assisted Personal interview (CAPI)
1.9.7f Geographical Position System (GPS)
1.9.7g Compass as Measuring Tapes
1.9.7h Others (please name)
1.9.8 Number of PCs in use in National Statistical Office: Head-quarters
Field offices
1.9.8a For agricultural statistics
1.9.8b For other activities
1.9.9 Number of computer servers installed for data storage and communication
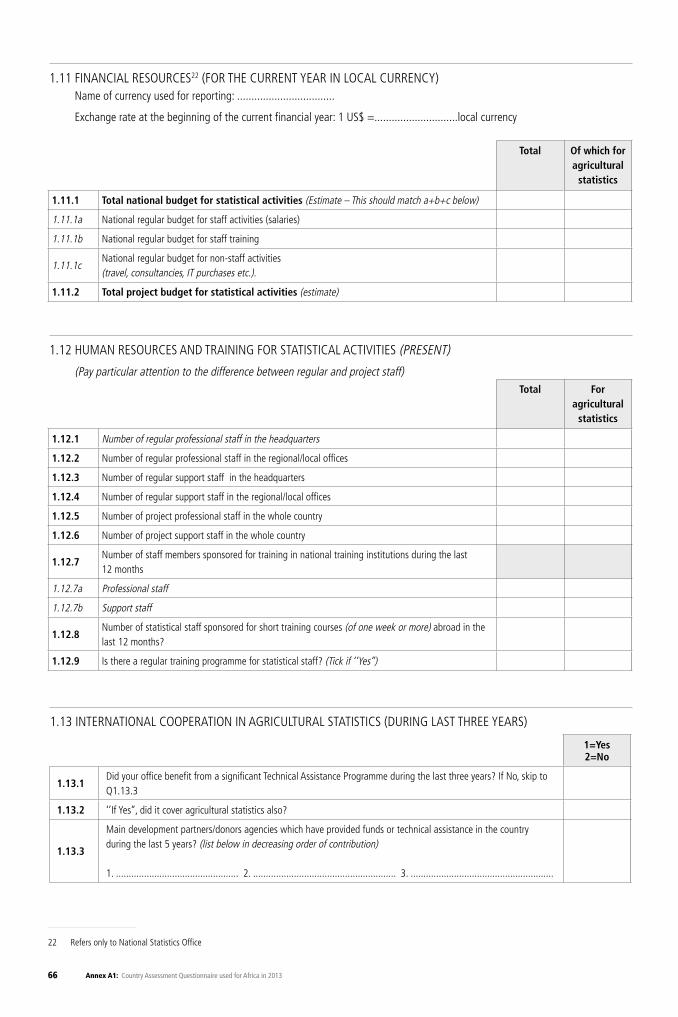
66 Annex A1: Country Assessment Questionnaire used for Africa in 2013
Total Of which for agricultural
statistics
1.11.1 Total national budget for statistical activities (Estimate – This should match a+b+c below)
1.11.1a National regular budget for staff activities (salaries)
1.11.1b National regular budget for staff training
1.11.1cNational regular budget for non-staff activities (travel, consultancies, IT purchases etc.).
1.11.2 Total project budget for statistical activities (estimate)
Total For agricultural
statistics
1.12.1 Number of regular professional staff in the headquarters
1.12.2 Number of regular professional staff in the regional/local offices
1.12.3 Number of regular support staff in the headquarters
1.12.4 Number of regular support staff in the regional/local offices
1.12.5 Number of project professional staff in the whole country
1.12.6 Number of project support staff in the whole country
1.12.7Number of staff members sponsored for training in national training institutions during the last 12 months
1.12.7a Professional staff
1.12.7b Support staff
1.12.8Number of statistical staff sponsored for short training courses (of one week or more) abroad in the last 12 months?
1.12.9 Is there a regular training programme for statistical staff? (Tick if ‘’Yes’’)
1.11 FINANCIAL RESOURCES22 (FOR THE CURRENT YEAR IN LOCAL CURRENCY) Name of currency used for reporting: ..................................
Exchange rate at the beginning of the current financial year: 1 US$ =.............................local currency
1.12 HUMAN RESOURCES AND TRAINING FOR STATISTICAL ACTIVITIES (PRESENT)
(Pay particular attention to the difference between regular and project staff)
22 Refers only to National Statistics Office
1=Yes 2=No
1.13.1Did your office benefit from a significant Technical Assistance Programme during the last three years? If No, skip to Q1.13.3
1.13.2 ‘’If Yes’’, did it cover agricultural statistics also?
1.13.3
Main development partners/donors agencies which have provided funds or technical assistance in the country during the last 5 years? (list below in decreasing order of contribution)
1. ................................................ 2. ........................................................ 3. ........................................................
1.13 INTERNATIONAL COOPERATION IN AGRICULTURAL STATISTICS (DURING LAST THREE YEARS)
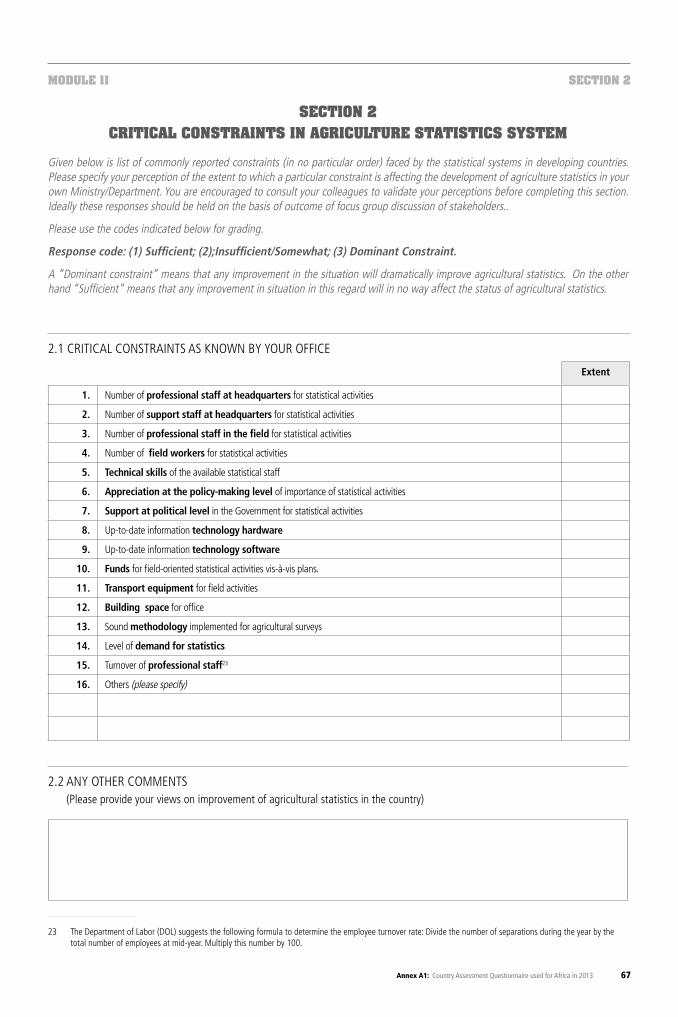
67Annex A1: Country Assessment Questionnaire used for Africa in 2013
23 The Department of Labor (DOL) suggests the following formula to determine the employee turnover rate: Divide the number of separations during the year by the total number of employees at mid-year. Multiply this number by 100.
MODULE 1I SECTION 2
SECTION 2CRITICAL CONSTRAINTS IN AGRICULTURE STATISTICS SYSTEM
Given below is list of commonly reported constraints (in no particular order) faced by the statistical systems in developing countries. Please specify your perception of the extent to which a particular constraint is affecting the development of agriculture statistics in your own Ministry/Department. You are encouraged to consult your colleagues to validate your perceptions before completing this section. Ideally these responses should be held on the basis of outcome of focus group discussion of stakeholders..
Please use the codes indicated below for grading.
Response code: (1) Sufficient; (2);Insufficient/Somewhat; (3) Dominant Constraint.
A “Dominant constraint” means that any improvement in the situation will dramatically improve agricultural statistics. On the other hand “Sufficient” means that any improvement in situation in this regard will in no way affect the status of agricultural statistics.
2.2 ANY OTHER COMMENTS (Please provide your views on improvement of agricultural statistics in the country)
2.1 CRITICAL CONSTRAINTS AS KNOWN BY YOUR OFFICE
Extent
1. Number of professional staff at headquarters for statistical activities
2. Number of support staff at headquarters for statistical activities
3. Number of professional staff in the field for statistical activities
4. Number of field workers for statistical activities
5. Technical skills of the available statistical staff
6. Appreciation at the policy-making level of importance of statistical activities
7. Support at political level in the Government for statistical activities
8. Up-to-date information technology hardware
9. Up-to-date information technology software
10. Funds for field-oriented statistical activities vis-à-vis plans.
11. Transport equipment for field activities
12. Building space for office
13. Sound methodology implemented for agricultural surveys
14. Level of demand for statistics
15. Turnover of professional staff23
16. Others (please specify)
68 Annex A1: Country Assessment Questionnaire used for Africa in 2013
2.3 ABBREVIATIONS USED
THANK YOU FOR ANSWERING THIS QUESTIONNAIRE
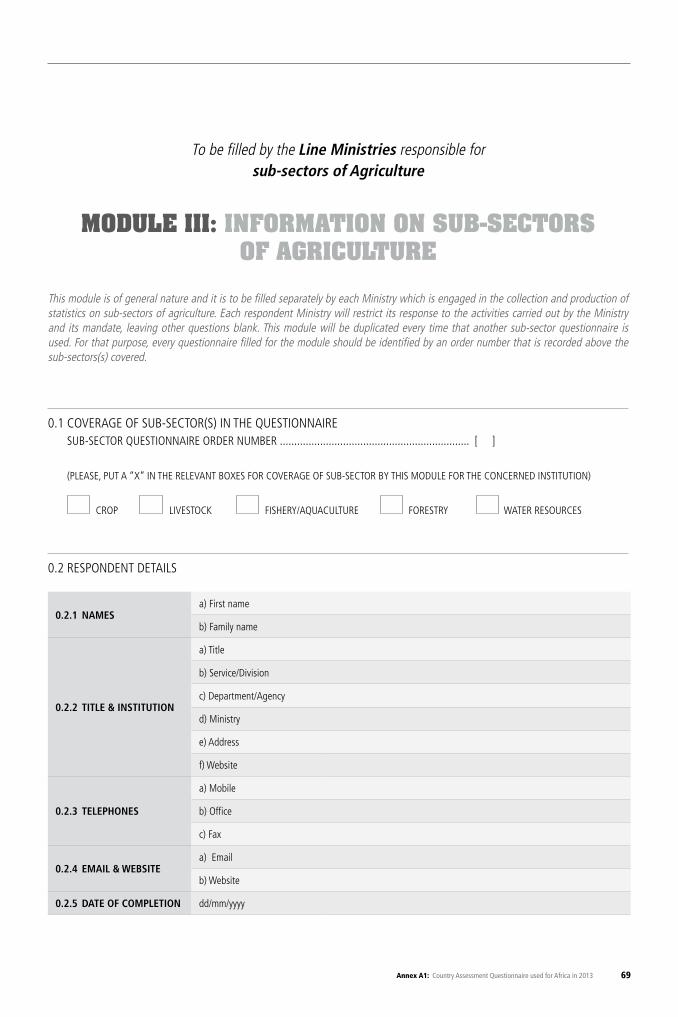
69Annex A1: Country Assessment Questionnaire used for Africa in 2013
To be filled by the Line Ministries responsible forsub-sectors of Agriculture
MODULE III: INFORMATION ON SUB-SECTORS OF AGRICULTURE
This module is of general nature and it is to be filled separately by each Ministry which is engaged in the collection and production of statistics on sub-sectors of agriculture. Each respondent Ministry will restrict its response to the activities carried out by the Ministry and its mandate, leaving other questions blank. This module will be duplicated every time that another sub-sector questionnaire is used. For that purpose, every questionnaire filled for the module should be identified by an order number that is recorded above the sub-sectors(s) covered.
0.2.1 NAMESa) First name
b) Family name
0.2.2 TITLE & INSTITUTION
a) Title
b) Service/Division
c) Department/Agency
d) Ministry
e) Address
f) Website
0.2.3 TELEPHONES
a) Mobile
b) Office
c) Fax
0.2.4 EMAIL & WEBSITEa) Email
b) Website
0.2.5 DATE OF COMPLETION dd/mm/yyyy
0.1 COVERAGE OF SUB-SECTOR(S) IN THE QUESTIONNAIRE SUB-SECTOR QUESTIONNAIRE ORDER NUMBER .................................................................. [ ] (PLEASE, PUT A “X” IN THE RELEVANT BOXES FOR COVERAGE OF SUB-SECTOR BY THIS MODULE FOR THE CONCERNED INSTITUTION) CROP LIVESTOCK FISHERY/AQUACULTURE FORESTRY WATER RESOURCES
0.2 RESPONDENT DETAILS
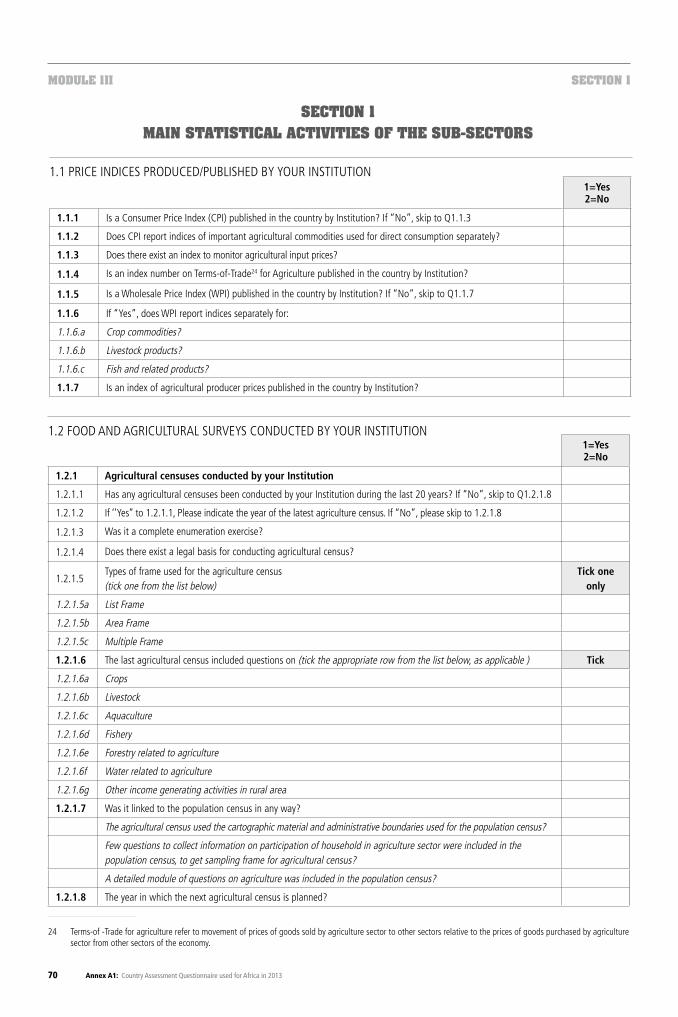
70 Annex A1: Country Assessment Questionnaire used for Africa in 2013
24 Terms-of -Trade for agriculture refer to movement of prices of goods sold by agriculture sector to other sectors relative to the prices of goods purchased by agriculture sector from other sectors of the economy.
1.1 PRICE INDICES PRODUCED/PUBLISHED BY YOUR INSTITUTION
1.2 FOOD AND AGRICULTURAL SURVEYS CONDUCTED BY YOUR INSTITUTION
1=Yes 2=No
1.1.1 Is a Consumer Price Index (CPI) published in the country by Institution? If “No”, skip to Q1.1.3
1.1.2 Does CPI report indices of important agricultural commodities used for direct consumption separately?
1.1.3 Does there exist an index to monitor agricultural input prices?
1.1.4 Is an index number on Terms-of-Trade24 for Agriculture published in the country by Institution?
1.1.5 Is a Wholesale Price Index (WPI) published in the country by Institution? If “No”, skip to Q1.1.7
1.1.6 If “Yes”, does WPI report indices separately for:
1.1.6.a Crop commodities?
1.1.6.b Livestock products?
1.1.6.c Fish and related products?
1.1.7 Is an index of agricultural producer prices published in the country by Institution?
1=Yes 2=No
1.2.1 Agricultural censuses conducted by your Institution
1.2.1.1 Has any agricultural censuses been conducted by your Institution during the last 20 years? If “No”, skip to Q1.2.1.8
1.2.1.2 If ‘’Yes’’ to 1.2.1.1, Please indicate the year of the latest agriculture census. If “No”, please skip to 1.2.1.8
1.2.1.3 Was it a complete enumeration exercise?
1.2.1.4 Does there exist a legal basis for conducting agricultural census?
1.2.1.5Types of frame used for the agriculture census (tick one from the list below)
Tick one only
1.2.1.5a List Frame
1.2.1.5b Area Frame
1.2.1.5c Multiple Frame
1.2.1.6 The last agricultural census included questions on (tick the appropriate row from the list below, as applicable ) Tick
1.2.1.6a Crops
1.2.1.6b Livestock
1.2.1.6c Aquaculture
1.2.1.6d Fishery
1.2.1.6e Forestry related to agriculture
1.2.1.6f Water related to agriculture
1.2.1.6g Other income generating activities in rural area
1.2.1.7 Was it linked to the population census in any way?
The agricultural census used the cartographic material and administrative boundaries used for the population census?
Few questions to collect information on participation of household in agriculture sector were included in the population census, to get sampling frame for agricultural census?
A detailed module of questions on agriculture was included in the population census?
1.2.1.8 The year in which the next agricultural census is planned?
MODULE 1II SECTION 1
SECTION 1MAIN STATISTICAL ACTIVITIES OF THE SUB-SECTORS
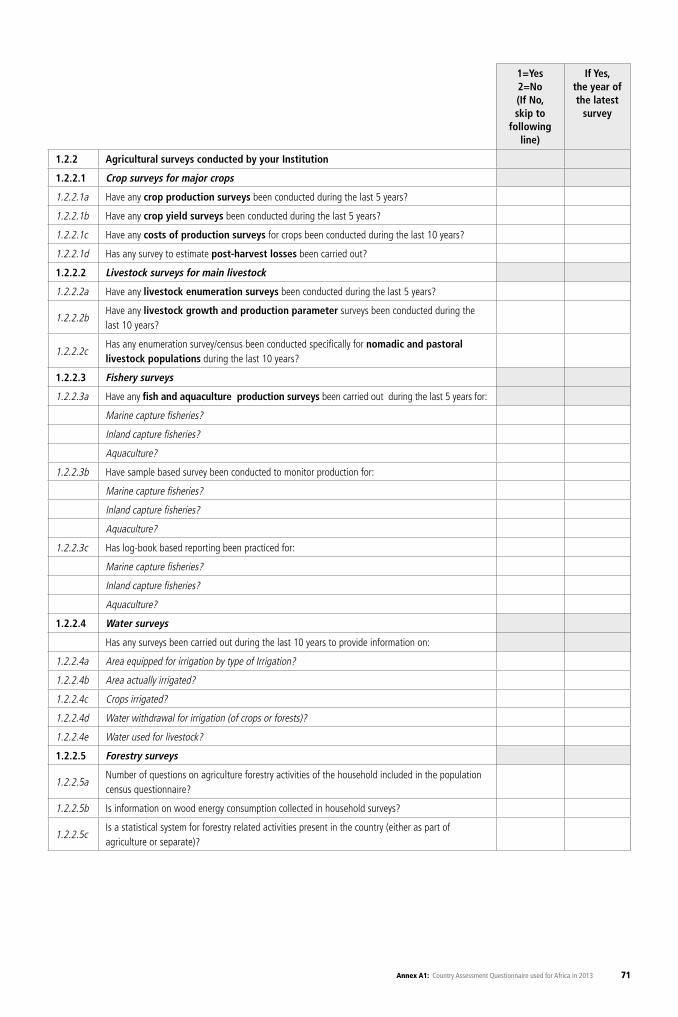
71Annex A1: Country Assessment Questionnaire used for Africa in 2013
1=Yes 2=No(If No, skip to
following line)
If Yes, the year of the latest
survey
1.2.2 Agricultural surveys conducted by your Institution
1.2.2.1 Crop surveys for major crops
1.2.2.1a Have any crop production surveys been conducted during the last 5 years?
1.2.2.1b Have any crop yield surveys been conducted during the last 5 years?
1.2.2.1c Have any costs of production surveys for crops been conducted during the last 10 years?
1.2.2.1d Has any survey to estimate post-harvest losses been carried out?
1.2.2.2 Livestock surveys for main livestock
1.2.2.2a Have any livestock enumeration surveys been conducted during the last 5 years?
1.2.2.2bHave any livestock growth and production parameter surveys been conducted during the last 10 years?
1.2.2.2cHas any enumeration survey/census been conducted specifically for nomadic and pastoral livestock populations during the last 10 years?
1.2.2.3 Fishery surveys
1.2.2.3a Have any fish and aquaculture production surveys been carried out during the last 5 years for:
Marine capture fisheries?
Inland capture fisheries?
Aquaculture?
1.2.2.3b Have sample based survey been conducted to monitor production for:
Marine capture fisheries?
Inland capture fisheries?
Aquaculture?
1.2.2.3c Has log-book based reporting been practiced for:
Marine capture fisheries?
Inland capture fisheries?
Aquaculture?
1.2.2.4 Water surveys
Has any surveys been carried out during the last 10 years to provide information on:
1.2.2.4a Area equipped for irrigation by type of Irrigation?
1.2.2.4b Area actually irrigated?
1.2.2.4c Crops irrigated?
1.2.2.4d Water withdrawal for irrigation (of crops or forests)?
1.2.2.4e Water used for livestock?
1.2.2.5 Forestry surveys
1.2.2.5aNumber of questions on agriculture forestry activities of the household included in the population census questionnaire?
1.2.2.5b Is information on wood energy consumption collected in household surveys?
1.2.2.5cIs a statistical system for forestry related activities present in the country (either as part of agriculture or separate)?
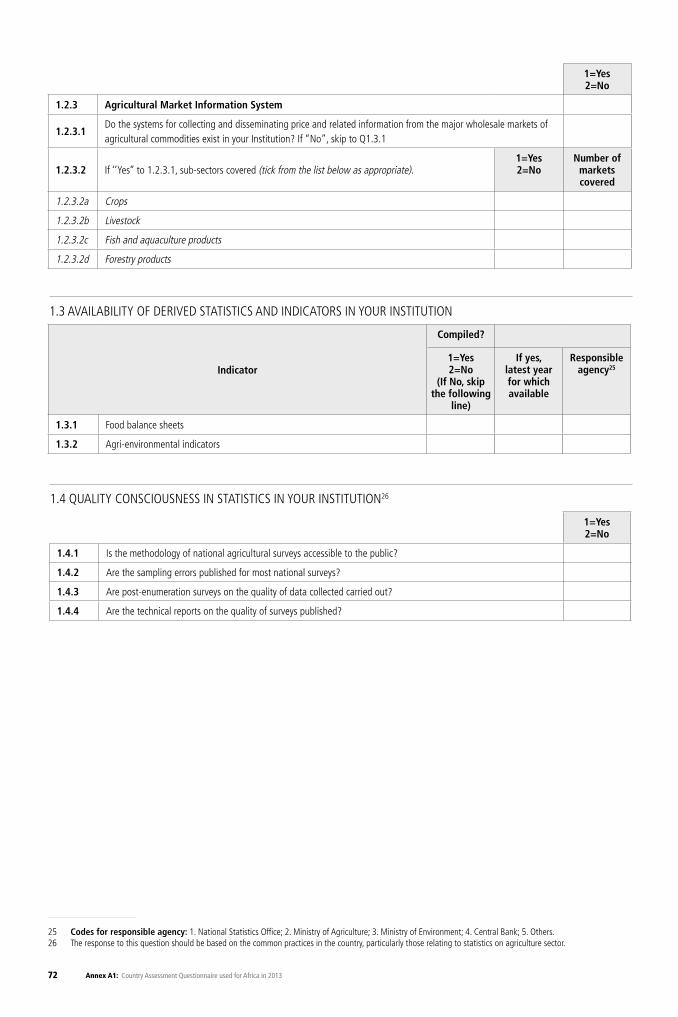
72 Annex A1: Country Assessment Questionnaire used for Africa in 2013
1=Yes 2=No
1.2.3 Agricultural Market Information System
1.2.3.1Do the systems for collecting and disseminating price and related information from the major wholesale markets of agricultural commodities exist in your Institution? If “No”, skip to Q1.3.1
1.2.3.2 If ‘’Yes’’ to 1.2.3.1, sub-sectors covered (tick from the list below as appropriate).1=Yes2=No
Number of markets covered
1.2.3.2a Crops
1.2.3.2b Livestock
1.2.3.2c Fish and aquaculture products
1.2.3.2d Forestry products
1.3 AVAILABILITY OF DERIVED STATISTICS AND INDICATORS IN YOUR INSTITUTION
Indicator
Compiled?
1=Yes 2=No
(If No, skip the following
line)
If yes, latest year for which available
Responsible agency25
1.3.1 Food balance sheets
1.3.2 Agri-environmental indicators
1=Yes 2=No
1.4.1 Is the methodology of national agricultural surveys accessible to the public?
1.4.2 Are the sampling errors published for most national surveys?
1.4.3 Are post-enumeration surveys on the quality of data collected carried out?
1.4.4 Are the technical reports on the quality of surveys published?
1.4 QUALITY CONSCIOUSNESS IN STATISTICS IN YOUR INSTITUTION26
25 Codes for responsible agency: 1. National Statistics Office; 2. Ministry of Agriculture; 3. Ministry of Environment; 4. Central Bank; 5. Others.26 The response to this question should be based on the common practices in the country, particularly those relating to statistics on agriculture sector.
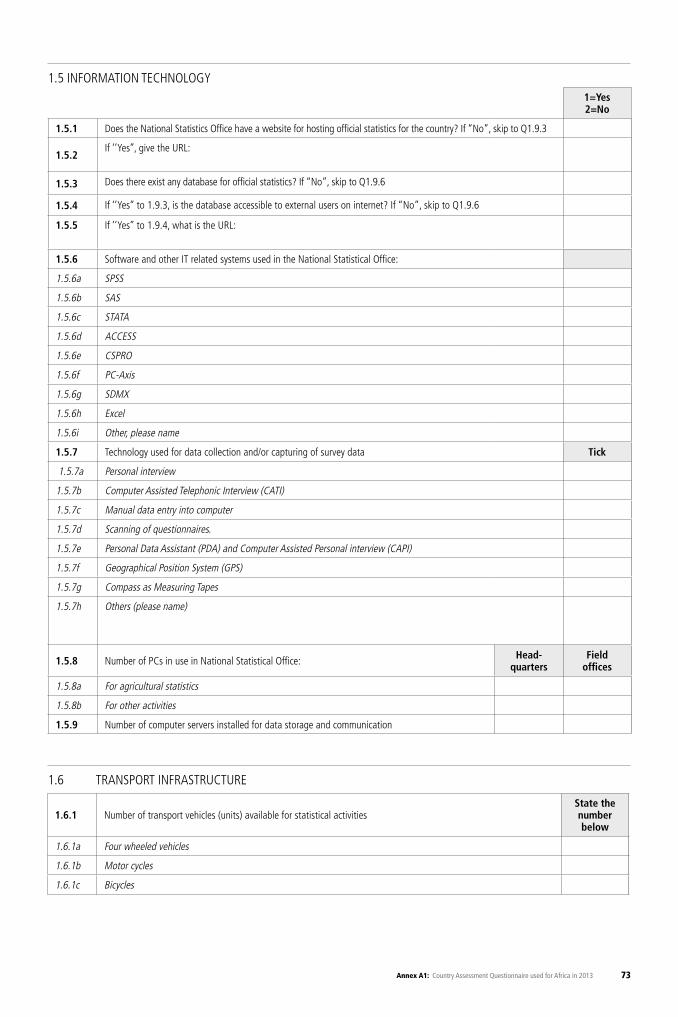
73Annex A1: Country Assessment Questionnaire used for Africa in 2013
1.6.1 Number of transport vehicles (units) available for statistical activitiesState the number below
1.6.1a Four wheeled vehicles
1.6.1b Motor cycles
1.6.1c Bicycles
1.6 TRANSPORT INFRASTRUCTURE
1.5 INFORMATION TECHNOLOGY1=Yes 2=No
1.5.1 Does the National Statistics Office have a website for hosting official statistics for the country? If “No”, skip to Q1.9.3
1.5.2If ‘’Yes’’, give the URL:
1.5.3 Does there exist any database for official statistics? If “No”, skip to Q1.9.6
1.5.4 If ‘’Yes’’ to 1.9.3, is the database accessible to external users on internet? If “No”, skip to Q1.9.6
1.5.5 If ‘’Yes’’ to 1.9.4, what is the URL:
1.5.6 Software and other IT related systems used in the National Statistical Office:
1.5.6a SPSS
1.5.6b SAS
1.5.6c STATA
1.5.6d ACCESS
1.5.6e CSPRO
1.5.6f PC-Axis
1.5.6g SDMX
1.5.6h Excel
1.5.6i Other, please name
1.5.7 Technology used for data collection and/or capturing of survey data Tick
1.5.7a Personal interview
1.5.7b Computer Assisted Telephonic Interview (CATI)
1.5.7c Manual data entry into computer
1.5.7d Scanning of questionnaires.
1.5.7e Personal Data Assistant (PDA) and Computer Assisted Personal interview (CAPI)
1.5.7f Geographical Position System (GPS)
1.5.7g Compass as Measuring Tapes
1.5.7h Others (please name)
1.5.8 Number of PCs in use in National Statistical Office: Head-quarters
Field offices
1.5.8a For agricultural statistics
1.5.8b For other activities
1.5.9 Number of computer servers installed for data storage and communication
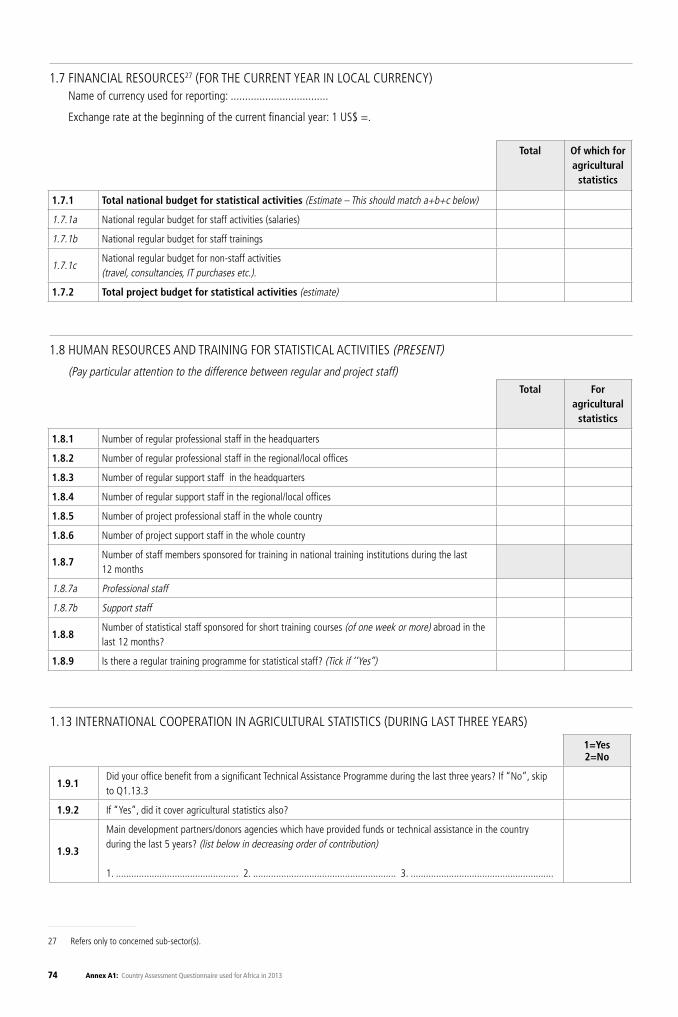
74 Annex A1: Country Assessment Questionnaire used for Africa in 2013
Total Of which for agricultural
statistics
1.7.1 Total national budget for statistical activities (Estimate – This should match a+b+c below)
1.7.1a National regular budget for staff activities (salaries)
1.7.1b National regular budget for staff trainings
1.7.1cNational regular budget for non-staff activities (travel, consultancies, IT purchases etc.).
1.7.2 Total project budget for statistical activities (estimate)
Total For agricultural
statistics
1.8.1 Number of regular professional staff in the headquarters
1.8.2 Number of regular professional staff in the regional/local offices
1.8.3 Number of regular support staff in the headquarters
1.8.4 Number of regular support staff in the regional/local offices
1.8.5 Number of project professional staff in the whole country
1.8.6 Number of project support staff in the whole country
1.8.7Number of staff members sponsored for training in national training institutions during the last 12 months
1.8.7a Professional staff
1.8.7b Support staff
1.8.8Number of statistical staff sponsored for short training courses (of one week or more) abroad in the last 12 months?
1.8.9 Is there a regular training programme for statistical staff? (Tick if ‘’Yes’’)
1.7 FINANCIAL RESOURCES27 (FOR THE CURRENT YEAR IN LOCAL CURRENCY) Name of currency used for reporting: ..................................
Exchange rate at the beginning of the current financial year: 1 US$ =.
1.8 HUMAN RESOURCES AND TRAINING FOR STATISTICAL ACTIVITIES (PRESENT)
(Pay particular attention to the difference between regular and project staff)
1=Yes 2=No
1.9.1Did your office benefit from a significant Technical Assistance Programme during the last three years? If “No”, skip to Q1.13.3
1.9.2 If “Yes”, did it cover agricultural statistics also?
1.9.3
Main development partners/donors agencies which have provided funds or technical assistance in the country during the last 5 years? (list below in decreasing order of contribution)
1. ................................................ 2. ........................................................ 3. ........................................................
1.13 INTERNATIONAL COOPERATION IN AGRICULTURAL STATISTICS (DURING LAST THREE YEARS)
27 Refers only to concerned sub-sector(s).
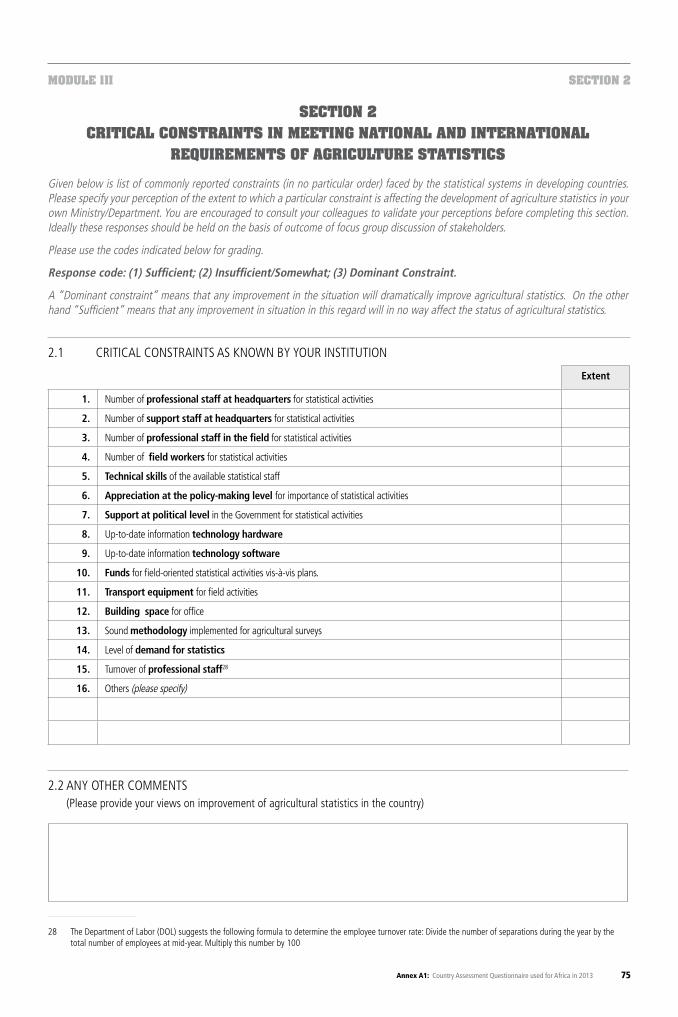
75Annex A1: Country Assessment Questionnaire used for Africa in 2013
28 The Department of Labor (DOL) suggests the following formula to determine the employee turnover rate: Divide the number of separations during the year by the total number of employees at mid-year. Multiply this number by 100
MODULE 1II SECTION 2
SECTION 2CRITICAL CONSTRAINTS IN MEETING NATIONAL AND INTERNATIONAL
REQUIREMENTS OF AGRICULTURE STATISTICS
Given below is list of commonly reported constraints (in no particular order) faced by the statistical systems in developing countries. Please specify your perception of the extent to which a particular constraint is affecting the development of agriculture statistics in your own Ministry/Department. You are encouraged to consult your colleagues to validate your perceptions before completing this section. Ideally these responses should be held on the basis of outcome of focus group discussion of stakeholders.
Please use the codes indicated below for grading.
Response code: (1) Sufficient; (2) Insufficient/Somewhat; (3) Dominant Constraint.
A “Dominant constraint” means that any improvement in the situation will dramatically improve agricultural statistics. On the other hand “Sufficient” means that any improvement in situation in this regard will in no way affect the status of agricultural statistics.
2.2 ANY OTHER COMMENTS (Please provide your views on improvement of agricultural statistics in the country)
2.1 CRITICAL CONSTRAINTS AS KNOWN BY YOUR INSTITUTION
Extent
1. Number of professional staff at headquarters for statistical activities
2. Number of support staff at headquarters for statistical activities
3. Number of professional staff in the field for statistical activities
4. Number of field workers for statistical activities
5. Technical skills of the available statistical staff
6. Appreciation at the policy-making level for importance of statistical activities
7. Support at political level in the Government for statistical activities
8. Up-to-date information technology hardware
9. Up-to-date information technology software
10. Funds for field-oriented statistical activities vis-à-vis plans.
11. Transport equipment for field activities
12. Building space for office
13. Sound methodology implemented for agricultural surveys
14. Level of demand for statistics
15. Turnover of professional staff28
16. Others (please specify)

76 Annex A1: Country Assessment Questionnaire used for Africa in 2013
2.3 ABBREVIATIONS USED
THANK YOU FOR ANSWERING THIS QUESTIONNAIRE
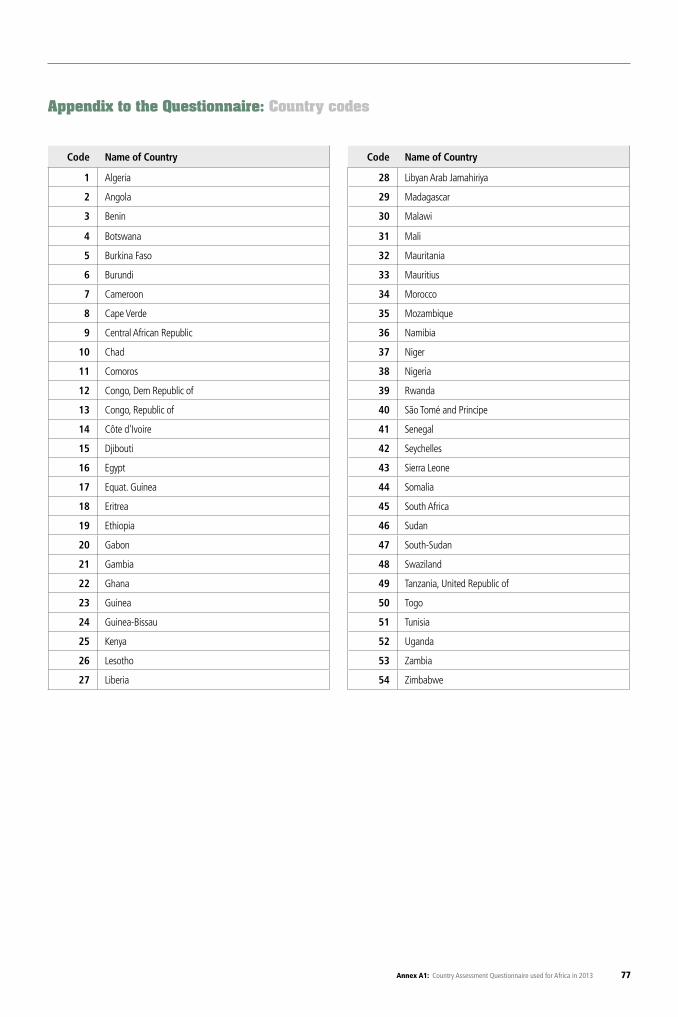
77Annex A1: Country Assessment Questionnaire used for Africa in 2013
Appendix to the Questionnaire: Country codes
Code Name of Country
1 Algeria
2 Angola
3 Benin
4 Botswana
5 Burkina Faso
6 Burundi
7 Cameroon
8 Cape Verde
9 Central African Republic
10 Chad
11 Comoros
12 Congo, Dem Republic of
13 Congo, Republic of
14 Côte d'Ivoire
15 Djibouti
16 Egypt
17 Equat. Guinea
18 Eritrea
19 Ethiopia
20 Gabon
21 Gambia
22 Ghana
23 Guinea
24 Guinea-Bissau
25 Kenya
26 Lesotho
27 Liberia
Code Name of Country
28 Libyan Arab Jamahiriya
29 Madagascar
30 Malawi
31 Mali
32 Mauritania
33 Mauritius
34 Morocco
35 Mozambique
36 Namibia
37 Niger
38 Nigeria
39 Rwanda
40 São Tomé and Principe
41 Senegal
42 Seychelles
43 Sierra Leone
44 Somalia
45 South Africa
46 Sudan
47 South-Sudan
48 Swaziland
49 Tanzania, United Republic of
50 Togo
51 Tunisia
52 Uganda
53 Zambia
54 Zimbabwe
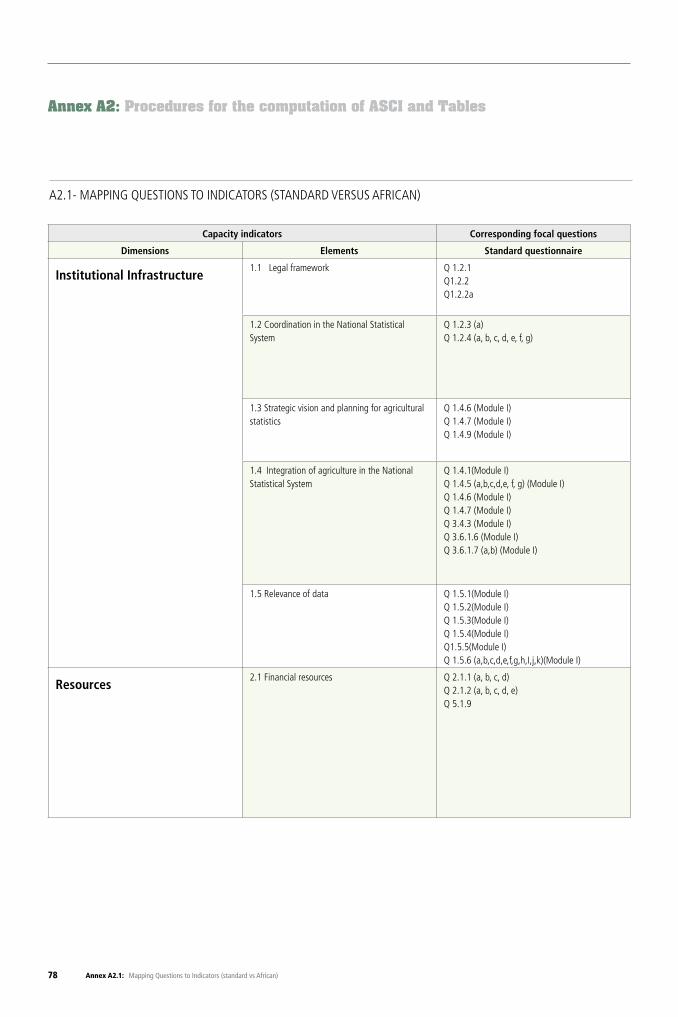
78 Annex A2.1: Mapping Questions to Indicators (standard vs African)
Annex A2: Procedures for the computation of ASCI and Tables
A2.1- MAPPING QUESTIONS TO INDICATORS (STANDARD VERSUS AFRICAN)
Capacity indicators Corresponding focal questions Corresponding focal questionsObservations / Comments
Dimensions Elements Standard questionnaire Africa questionnaire
Institutional Infrastructure1.1 Legal framework Q 1.2.1
Q1.2.2 Q1.2.2a
Q 1.2.1: OK (Module I); operational M1Q1.2.2 : OK (Module I)Q1.2.2a (Module I) there is a difference between the modalities and marks associated to each modality.
We intend to score it as following:1 - Fully adequate + Workable (2 Marks)2 - Somewhat adequate (1 Mark)3 - Somewhat inadequate + Totally inadequate (0 Mark)
1.2 Coordination in the National Statistical System
Q 1.2.3 (a) Q 1.2.4 (a, b, c, d, e, f, g)
Q 1.2.3 (a): there is a difference between the standard questionnaire and our questionnaire.Q 1.2.4 (a, b, c, d, e): OK
Q 1.2.3 (a): For us, we intend to score it as following:1 - Exists and active (5 marks) - This would match and be consistent with the maximum points for Q1.2.3 and Q1.2.3a2 - Exists but not active (2 mark) - This would match and be consistent with the points for Q1.2.3.3 - Does not exist (o mark)
1.3 Strategic vision and planning for agricultural statistics
Q 1.4.6 (Module I)Q 1.4.7 (Module I)Q 1.4.9 (Module I)
Q 1.4.6: OKQ 1.4.7: OKQ 1.4.9: it corresponds to the question 1.4.8 in our questionnaire.
-For this indicator please verify the maximum score ( in our case max score is 12 )
1.4 Integration of agriculture in the National Statistical System
Q 1.4.1(Module I)Q 1.4.5 (a,b,c,d,e, f, g) (Module I)Q 1.4.6 (Module I)Q 1.4.7 (Module I)Q 3.4.3 (Module I)Q 3.6.1.6 (Module I)Q 3.6.1.7 (a,b) (Module I)
1.4.1 : OKQ 1.4.5 (a, b ,c, d ,e) : OKQ 1.4.7 :OKQ 3.1.3: it corresponds to 1.1.5 (module II section 1) in our questionnaire.Q 3.5.1.6: it corresponds to 1.5.1.6 (module II section 1) our questionnaire.Q 3.5.1.7 (a,b): it corresponds to 1.5.1.7 (a,b) (module II section 1) in our questionnaire.
1.5 Relevance of data Q 1.5.1(Module I)Q 1.5.2(Module I)Q 1.5.3(Module I)Q 1.5.4(Module I)Q1.5.5(Module I)Q 1.5.6 (a,b,c,d,e,f,g,h,I,j,k)(Module I)
Q 1.5.1: OKQ 1.5.2: OKQ 1.5.3: OKQ 1.5.4: OKQ 1.5.5: OKQ 1.5.6 (a,b,c,d,e,f,g,h,I,j,k) : OK
For this indicator please verify the maximum score
Resources2.1 Financial resources Q 2.1.1 (a, b, c, d)
Q 2.1.2 (a, b, c, d, e)Q 5.1.9
Q 2.1.1 (a, b, c, d)Q 2.1.2 (a, b, c, d, e): Questions substantially different comparatively to Africa Questionnaires; hence the need of having a proposal of scoring that will be comparable to the standard oneQ 4.1.9 : : it corresponds to 2.1.10 (module III section 2)
Q 2.1.1.a: it corresponds to Q 1.11.1 (M II) .Q 2.1.1.b: it corresponds to Q 1.7.1 M III for Crops and livestock.Q 2.1.1.c: it corresponds to Q 1.7.1 M III for fishery.Q 2.1.1.d: it corresponds to Q 1.7.1 M III for forestry.Q 2.1.2: we will consider this version of question “What percentage of activities relating to agricultural statistics in the country are funded by the national regular budget?“ and we calculate the percentage:
%= sum (1.11.1 (M 11) + 1.7.1 (M 111)) for stat Agri * 100
sum (1.11.1 (M 11) + 1.7.1 (M111)) for total
Q 4.1.9: it corresponds to 2.1.10 (module III section 2): we put the modal answer.
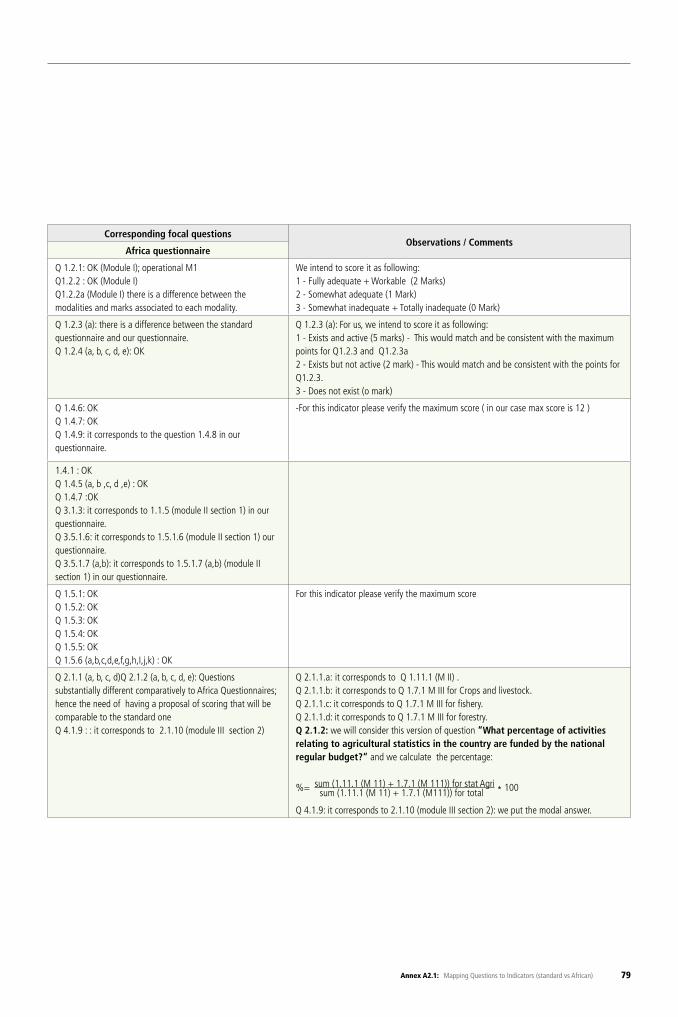
79Annex A2.1: Mapping Questions to Indicators (standard vs African)
Capacity indicators Corresponding focal questions Corresponding focal questionsObservations / Comments
Dimensions Elements Standard questionnaire Africa questionnaire
Institutional Infrastructure1.1 Legal framework Q 1.2.1
Q1.2.2 Q1.2.2a
Q 1.2.1: OK (Module I); operational M1Q1.2.2 : OK (Module I)Q1.2.2a (Module I) there is a difference between the modalities and marks associated to each modality.
We intend to score it as following:1 - Fully adequate + Workable (2 Marks)2 - Somewhat adequate (1 Mark)3 - Somewhat inadequate + Totally inadequate (0 Mark)
1.2 Coordination in the National Statistical System
Q 1.2.3 (a) Q 1.2.4 (a, b, c, d, e, f, g)
Q 1.2.3 (a): there is a difference between the standard questionnaire and our questionnaire.Q 1.2.4 (a, b, c, d, e): OK
Q 1.2.3 (a): For us, we intend to score it as following:1 - Exists and active (5 marks) - This would match and be consistent with the maximum points for Q1.2.3 and Q1.2.3a2 - Exists but not active (2 mark) - This would match and be consistent with the points for Q1.2.3.3 - Does not exist (o mark)
1.3 Strategic vision and planning for agricultural statistics
Q 1.4.6 (Module I)Q 1.4.7 (Module I)Q 1.4.9 (Module I)
Q 1.4.6: OKQ 1.4.7: OKQ 1.4.9: it corresponds to the question 1.4.8 in our questionnaire.
-For this indicator please verify the maximum score ( in our case max score is 12 )
1.4 Integration of agriculture in the National Statistical System
Q 1.4.1(Module I)Q 1.4.5 (a,b,c,d,e, f, g) (Module I)Q 1.4.6 (Module I)Q 1.4.7 (Module I)Q 3.4.3 (Module I)Q 3.6.1.6 (Module I)Q 3.6.1.7 (a,b) (Module I)
1.4.1 : OKQ 1.4.5 (a, b ,c, d ,e) : OKQ 1.4.7 :OKQ 3.1.3: it corresponds to 1.1.5 (module II section 1) in our questionnaire.Q 3.5.1.6: it corresponds to 1.5.1.6 (module II section 1) our questionnaire.Q 3.5.1.7 (a,b): it corresponds to 1.5.1.7 (a,b) (module II section 1) in our questionnaire.
1.5 Relevance of data Q 1.5.1(Module I)Q 1.5.2(Module I)Q 1.5.3(Module I)Q 1.5.4(Module I)Q1.5.5(Module I)Q 1.5.6 (a,b,c,d,e,f,g,h,I,j,k)(Module I)
Q 1.5.1: OKQ 1.5.2: OKQ 1.5.3: OKQ 1.5.4: OKQ 1.5.5: OKQ 1.5.6 (a,b,c,d,e,f,g,h,I,j,k) : OK
For this indicator please verify the maximum score
Resources2.1 Financial resources Q 2.1.1 (a, b, c, d)
Q 2.1.2 (a, b, c, d, e)Q 5.1.9
Q 2.1.1 (a, b, c, d)Q 2.1.2 (a, b, c, d, e): Questions substantially different comparatively to Africa Questionnaires; hence the need of having a proposal of scoring that will be comparable to the standard oneQ 4.1.9 : : it corresponds to 2.1.10 (module III section 2)
Q 2.1.1.a: it corresponds to Q 1.11.1 (M II) .Q 2.1.1.b: it corresponds to Q 1.7.1 M III for Crops and livestock.Q 2.1.1.c: it corresponds to Q 1.7.1 M III for fishery.Q 2.1.1.d: it corresponds to Q 1.7.1 M III for forestry.Q 2.1.2: we will consider this version of question “What percentage of activities relating to agricultural statistics in the country are funded by the national regular budget?“ and we calculate the percentage:
%= sum (1.11.1 (M 11) + 1.7.1 (M 111)) for stat Agri *
100 sum (1.11.1 (M 11) + 1.7.1 (M111)) for total
Q 4.1.9: it corresponds to 2.1.10 (module III section 2): we put the modal answer.
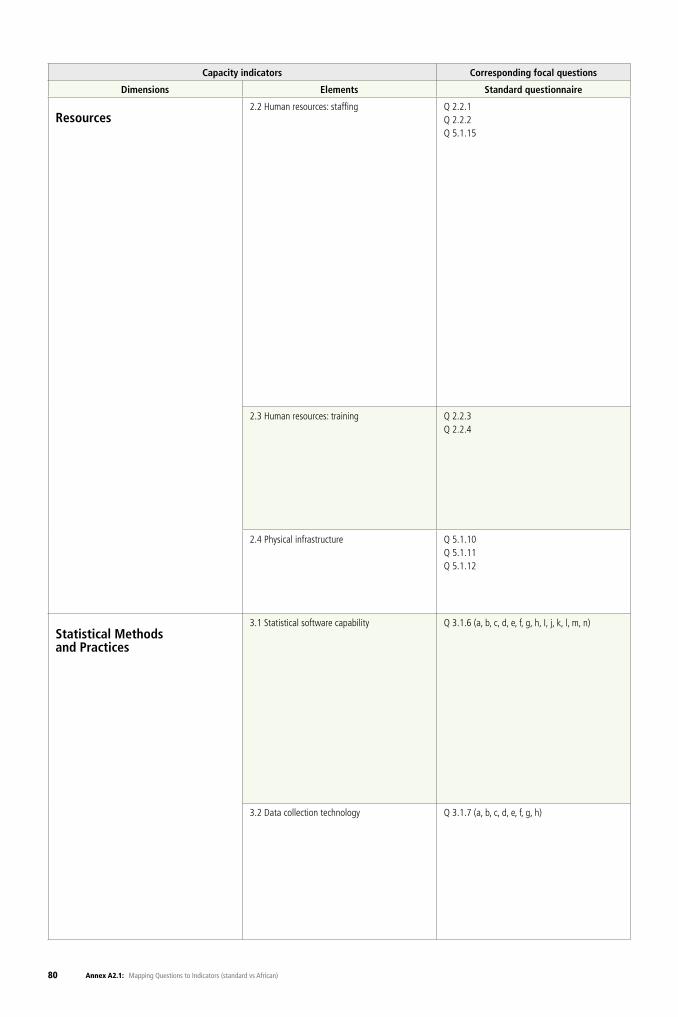
80 Annex A2.1: Mapping Questions to Indicators (standard vs African)
Capacity indicators Corresponding focal questions Corresponding focal questionsObservations / Comments
Dimensions Elements Standard questionnaire Africa questionnaire
Resources2.2 Human resources: staffing Q 2.2.1
Q 2.2.2Q 5.1.15
Q 2.2.1 & Q 2.2.2: Questions substantially different comparatively to Africa Questionnaires; hence the need of having a proposal of scoring that will be comparable to the standard one.Q 4.1.15 : it corresponds to 2.1.15 of module III section 2.
Suggestion :We calculate the number of posts filed:For NSO :[Sum ( Q 1.12.1+…+ Q 1.12.6 ) (For agriculture statistics )]/ [Sum ( Q 1.12.1+…+ Q 1.12.6 ) (for the Total)]*100
For Sub sector: [Sum( Q 1.8.1+…+ Q 1.8.6 ) (For agriculture statistics )]/ [Sum( Q 1.8.1+…+ Q 1.8.6 ) (for the Total)]*100
The formula is For NSO :0,5* [Sum ( Q 1.12.1+…+ Q 1.12.4 ) (For agriculture statistics )]/ [Sum ( Q 1.12.1+…+ Q 1.12.4 ) (for the Total)*100]+ 0,5* Country score on staff turnover
For Sub sector:0,5* [Sum ( Q 1.8.1+…+ Q 1.8.4 ) (For agriculture statistics )]/ [Sum ( Q 1.8.1+…+ Q 1.8.4 ) (for the Total)*100]+ 0,5* Country score on staff turnover
We calculate the average for sub-sectors and the total average.2.1.15: we calculate the score on turnover for each sub-sector then we calculate the average for sub-sectors and the total average.
The indicator is: 0.5*First part of indicator+0.5*second part(turn over)
2.3 Human resources: training Q 2.2.3Q 2.2.4
Q 3.12.3: it corresponds to 1.12.9 M II and 1.8.9 M III.Q 3.12.4: it corresponds to Q1.12.7 (a, b) M II and Q 1.8.7 (a, b) module III.
Suggestion: The formula is If we have a number in the Q 1.8.9 we have YES for the Q 2.2.3.- Number of person trained = 1.12.8 M II 1.8.1 M III- We don’t have the number of post filed but in our case we use the sum of post in Q 1.12.1 to 1.12.4 M II and 1.8.1 to 1.8.4 M III.
We keep the same formula, just we calculate a sub-indicator for each sub sector then we calculate the average for sub-sectors and the total average.
2.4 Physical infrastructure Q 5.1.10Q 5.1.11Q 5.1.12
Q 4.1.10: it corresponds to 2.1.11 M III section 2.Q 4.1.11: it corresponds to 2.1.12 M III section 2.Q5.1.12 does not exist in the version of Africa questionnaire
We used only the first two questions. The maximum score shall therefore be 8 for Africa.The modalities are not the same as in the questionnaire that Africa used.Suggestion:1 – Sufficient = Not at all+Relevant (4 marks)2 - Somewhat (2 marks)3 – Significant+Dominant (0 mark)
Statistical Methods and Practices
3.1 Statistical software capability Q 3.1.6 (a, b, c, d, e, f, g, h, I, j, k, l, m, n) Q 3.8.6: it corresponds to 1.9.6 M II and 1.5.6 du M III section 1.
1 - ACCESS is mainly used for Data processing. A proposal to consider it together with CSPRO.
2 - EXCEL is mainly for a multiple use. Africa has considered it singularly.
Suggestion:we would have the following grouping and scoring (Max. 4 marks):
3.1.6a. Data analysis: SPSS, SAS, STATA (1 Marks)3.1.6b. Data processing: CSPRO, ACCESS (1 Marks)3.1.6c. PC-AXIS, Oracle, SDMX (1 Marks)3.1.6d. Others - EXCEL (1 Mark)
We applied the formula for each sub-sector and we calculated the average of all sub-sectors and the total average.
3.2 Data collection technology Q 3.1.7 (a, b, c, d, e, f, g, h) Q 3.8.7: it corresponds to 1.9.7 M II and 1.5.7 M III section 1 with some difference in proposals.
Suggestion:(a) and/or (c) 1 mark(b) 1 mark(d) 2 marks(e) 2 marks(f) 2 marks(g) 1 mark
We keep the same formula we applied it for each sub-sector and we calculated the average of all sub-sectors and the total average.
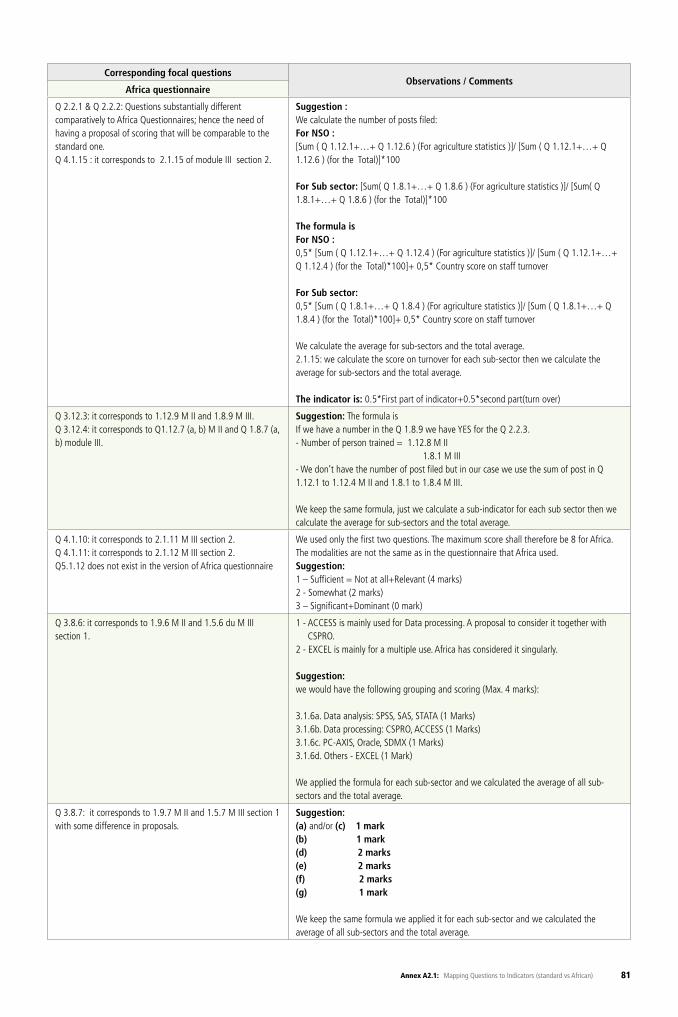
81Annex A2.1: Mapping Questions to Indicators (standard vs African)
Capacity indicators Corresponding focal questions Corresponding focal questionsObservations / Comments
Dimensions Elements Standard questionnaire Africa questionnaire
Resources2.2 Human resources: staffing Q 2.2.1
Q 2.2.2Q 5.1.15
Q 2.2.1 & Q 2.2.2: Questions substantially different comparatively to Africa Questionnaires; hence the need of having a proposal of scoring that will be comparable to the standard one.Q 4.1.15 : it corresponds to 2.1.15 of module III section 2.
Suggestion :We calculate the number of posts filed:For NSO :[Sum ( Q 1.12.1+…+ Q 1.12.6 ) (For agriculture statistics )]/ [Sum ( Q 1.12.1+…+ Q 1.12.6 ) (for the Total)]*100
For Sub sector: [Sum( Q 1.8.1+…+ Q 1.8.6 ) (For agriculture statistics )]/ [Sum( Q 1.8.1+…+ Q 1.8.6 ) (for the Total)]*100
The formula is For NSO :0,5* [Sum ( Q 1.12.1+…+ Q 1.12.4 ) (For agriculture statistics )]/ [Sum ( Q 1.12.1+…+ Q 1.12.4 ) (for the Total)*100]+ 0,5* Country score on staff turnover
For Sub sector:0,5* [Sum ( Q 1.8.1+…+ Q 1.8.4 ) (For agriculture statistics )]/ [Sum ( Q 1.8.1+…+ Q 1.8.4 ) (for the Total)*100]+ 0,5* Country score on staff turnover
We calculate the average for sub-sectors and the total average.2.1.15: we calculate the score on turnover for each sub-sector then we calculate the average for sub-sectors and the total average.
The indicator is: 0.5*First part of indicator+0.5*second part(turn over)
2.3 Human resources: training Q 2.2.3Q 2.2.4
Q 3.12.3: it corresponds to 1.12.9 M II and 1.8.9 M III.Q 3.12.4: it corresponds to Q1.12.7 (a, b) M II and Q 1.8.7 (a, b) module III.
Suggestion: The formula is If we have a number in the Q 1.8.9 we have YES for the Q 2.2.3.- Number of person trained = 1.12.8 M II 1.8.1 M III- We don’t have the number of post filed but in our case we use the sum of post in Q 1.12.1 to 1.12.4 M II and 1.8.1 to 1.8.4 M III.
We keep the same formula, just we calculate a sub-indicator for each sub sector then we calculate the average for sub-sectors and the total average.
2.4 Physical infrastructure Q 5.1.10Q 5.1.11Q 5.1.12
Q 4.1.10: it corresponds to 2.1.11 M III section 2.Q 4.1.11: it corresponds to 2.1.12 M III section 2.Q5.1.12 does not exist in the version of Africa questionnaire
We used only the first two questions. The maximum score shall therefore be 8 for Africa.The modalities are not the same as in the questionnaire that Africa used.Suggestion:1 – Sufficient = Not at all+Relevant (4 marks)2 - Somewhat (2 marks)3 – Significant+Dominant (0 mark)
Statistical Methods and Practices
3.1 Statistical software capability Q 3.1.6 (a, b, c, d, e, f, g, h, I, j, k, l, m, n) Q 3.8.6: it corresponds to 1.9.6 M II and 1.5.6 du M III section 1.
1 - ACCESS is mainly used for Data processing. A proposal to consider it together with CSPRO.
2 - EXCEL is mainly for a multiple use. Africa has considered it singularly.
Suggestion:we would have the following grouping and scoring (Max. 4 marks):
3.1.6a. Data analysis: SPSS, SAS, STATA (1 Marks)3.1.6b. Data processing: CSPRO, ACCESS (1 Marks)3.1.6c. PC-AXIS, Oracle, SDMX (1 Marks)3.1.6d. Others - EXCEL (1 Mark)
We applied the formula for each sub-sector and we calculated the average of all sub-sectors and the total average.
3.2 Data collection technology Q 3.1.7 (a, b, c, d, e, f, g, h) Q 3.8.7: it corresponds to 1.9.7 M II and 1.5.7 M III section 1 with some difference in proposals.
Suggestion:(a) and/or (c) 1 mark(b) 1 mark(d) 2 marks(e) 2 marks(f) 2 marks(g) 1 mark
We keep the same formula we applied it for each sub-sector and we calculated the average of all sub-sectors and the total average.

82 Annex A2.1: Mapping Questions to Indicators (standard vs African)
Capacity indicators Corresponding focal questions Corresponding focal questionsObservations / Comments
Dimensions Elements Standard questionnaire Africa questionnaire
Statistical Methods and Practices
3.3 Information technology infrastructure Q 3.1.8Q 2.2.2Q 3.1.9
Q3.1.9: it corresponds to Q1.9.9 in M II and Q 1.5.9 in M III section 1.
Number of PCs in use in National Statistical Office (for agric. Stat):- For M II 1.9.8.a- For M III 1.5.8.aNumber of persons in use in National Statistical Office (for agric. Stat):- For M II : sum of Q 1.12.1 and 1.12.3- For M III : sum of 1.8.1 and 1.8.3
We keep the same formula we applied it for each sub-sector and we calculated the average of all sub-sectors and the total average.
3.4 General statistical infrastructure Q 3.2.1Q 3.2.2Q 3.2.3Q 3.2.4Q 3.2.5Q 3.2.6Q 3.2.7
These questions do not exist in Africa questionnaire; hence no possibility to generate the related capacity indicator.
3.5 Adoption of international standards Q 3.3Q 3.8.8
Q 3.3: it corresponds to Q1.3 M II section 1 and Q 1.2.9 M II (for SNC).
No problem and no verification for this indicator.
3.6 General statistical activities Q 3.4.2 Q 3.4.4Q 3.8.2Q 3.8.4Q 3.5.1Q 3.5.5Q 3.7.2
Q 3.1.2: it corresponds to Q 1.1.4 M II section 1.Q 3.1.4: it corresponds to Q1.1.6 M II section 1.Q 3.2.2: it corresponds to Q1.2.3 M II section 1.Q 3.2.4: it corresponds to Q1.2.5 M II section 1.Q 3.4.1: it corresponds to Q1.4.1 M II section 1.Q 3.4.5: it corresponds to Q1.4.5 M II section 1.Q 3.6.2: it corresponds to Q1.6.2 M II section 1.
No problem and no verification for this indicator.
3.7 Agricultural markets and price information Q 3.5.2Q 3.5.3Q 3.5.5/3.5.7Q 3.5.6/3.5.8 (a, b, c)Q 3.6.3.1Q 3.6.3.2 (a, b, c, d)
Q 3.4.2: it corresponds to Q1.4.2 M II section 1 and Q 1.1.1 M III section 1.Q 3.4.3: it corresponds to Q 1.4.3 M II section 1 and Q1.1.3 M III sec 1.Q 3.4.6: it corresponds to Q 1.4.6 M II section 1 and Q1.1.6 M III sec 1.Q 3.4.7: it corresponds to Q 1.4.7 M II section 1 and Q1.1.7 M III sec1.Q 3.5.3.1: it corresponds to Q 1.5.3.1 M II section 1 and 1.2.3.1 M III sec 1.Q 3.5.3.2 (a, b, c, d) : it correspond to Q 1.5.3.2 du M II section 1 and 1.2.3.2 M III sec 1.
This question appears in Module 2 and Module 3 but we only consider the response one time.I.e.: if the answer “yes” appears at least once.
3.8 Agricultural surveys Q 3.6.1.2Q 3.6.2.1 (a, b, c, d, e)Q 3.6.2.2 (a, b, c, d)Q 3.6.2.3 (a, b, c ,d)Q 3.6.2.4 (a, b, c, d)Q 3.6.2.5 (a, b, c)
Q 3.6.1.2: it corresponds to Q 1.5.1.2 M II section 1 and Q1.2.1.1 M III sec 1.Q 3.6.2.1 (a, b, c ,d) : it corresponds to Q 1.5.2.1 M II section 1 and Q1.2.2.1 M III sec 1.Q 3.5.2.2 (a, b, c, d): it corresponds to Q 1.5.2.2 M II section 1 and Q1.2.2.2 M III sec 1.Q 3.6.2.3 (a, b, c ,d) : it corresponds to Q 1.5.2.3 M II section 1 and Q1.2.2.3 M III sec 1.Q 3.6.2.4 (a, b, c, d): it corresponds to Q 1.5.2.4 M II section 1 and Q1.2.2.4 M III sec 1.Q 3.6.2.5 (a, b, c) : it corresponds to Q 1.5.2.5 M II section 1 and Q1.2.2.5 M III sec 1.
3.6.2.1a - Does not exist in Africa questionnaire.3.6.2.2c- Does not exist in Africa questionnaire3.6.2.3- Questions different to those of the Africa questionnaire3.6.2.3a- Already taken care of in 3.6.2.3b (to be consistent with what is shown in the questionnaire itself)3.6.2.5- Questions different to those of the Africa questionnaireThis question appears in Module 2 and Module 3 but we only consider the response one time.I.e.: if the answer “yes” appears at least once.
3.9 Analysis and use of data Q 3.8.3 (a,b,c,d,e)Q 3.8.4Q 3.5.4Q 3.9.4Q 3.9.5
Q 3.2.3 (a,b,c,d,e) : it corresponds to Q 1.2.4 MII section 1.Q 3.2.4 : it corresponds to Q 1.2.5 M II section 1 Q 3.4.4 : it corresponds to Q 1.4.4 M II section 1 and Q1.1.4 M III.Q 3.7.4: it corresponds to Q 1.7.1 M II section 1 and Q 1.7.1 M III.Q 3.7.5 it corresponds to Q 1.7.2 M II section 1 and Q1.3.2 M III.
Q 3.2.3 : we used only the first four proposals (a, b, c, d)Q 3.8.4: OK(Q 3.5.4, Q 3.9.4, Q 3.9.5) this question appears in Module 2 and Module 3 but we only consider the response one time.I.e.: if the answer “yes” appears at least once.
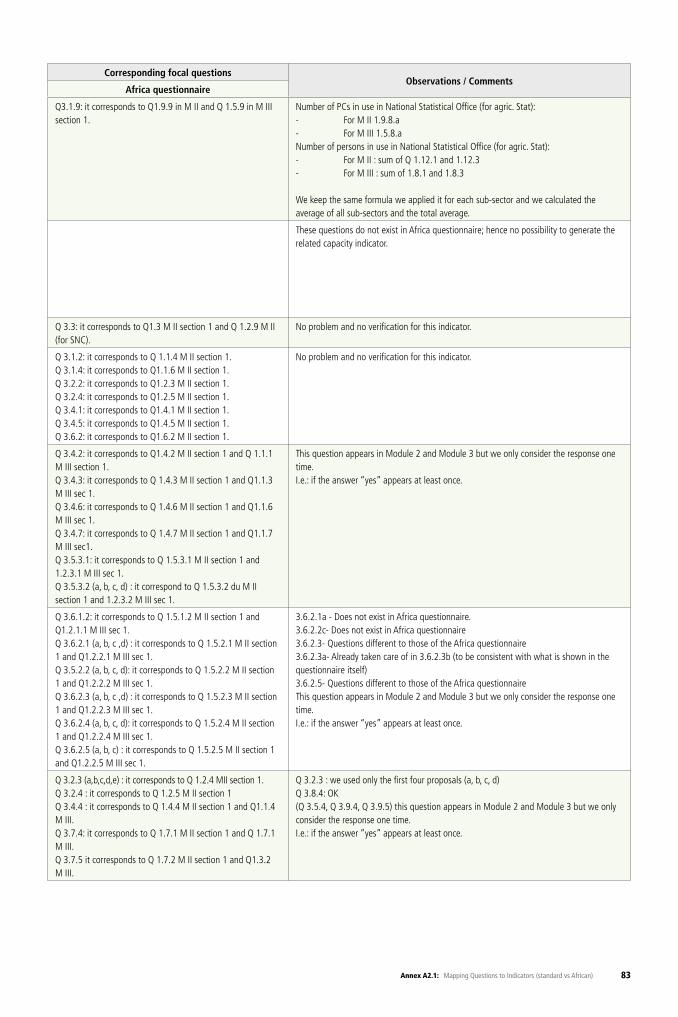
83Annex A2.1: Mapping Questions to Indicators (standard vs African)
Capacity indicators Corresponding focal questions Corresponding focal questionsObservations / Comments
Dimensions Elements Standard questionnaire Africa questionnaire
Statistical Methods and Practices
3.3 Information technology infrastructure Q 3.1.8Q 2.2.2Q 3.1.9
Q3.1.9: it corresponds to Q1.9.9 in M II and Q 1.5.9 in M III section 1.
Number of PCs in use in National Statistical Office (for agric. Stat):- For M II 1.9.8.a- For M III 1.5.8.aNumber of persons in use in National Statistical Office (for agric. Stat):- For M II : sum of Q 1.12.1 and 1.12.3- For M III : sum of 1.8.1 and 1.8.3
We keep the same formula we applied it for each sub-sector and we calculated the average of all sub-sectors and the total average.
3.4 General statistical infrastructure Q 3.2.1Q 3.2.2Q 3.2.3Q 3.2.4Q 3.2.5Q 3.2.6Q 3.2.7
These questions do not exist in Africa questionnaire; hence no possibility to generate the related capacity indicator.
3.5 Adoption of international standards Q 3.3Q 3.8.8
Q 3.3: it corresponds to Q1.3 M II section 1 and Q 1.2.9 M II (for SNC).
No problem and no verification for this indicator.
3.6 General statistical activities Q 3.4.2 Q 3.4.4Q 3.8.2Q 3.8.4Q 3.5.1Q 3.5.5Q 3.7.2
Q 3.1.2: it corresponds to Q 1.1.4 M II section 1.Q 3.1.4: it corresponds to Q1.1.6 M II section 1.Q 3.2.2: it corresponds to Q1.2.3 M II section 1.Q 3.2.4: it corresponds to Q1.2.5 M II section 1.Q 3.4.1: it corresponds to Q1.4.1 M II section 1.Q 3.4.5: it corresponds to Q1.4.5 M II section 1.Q 3.6.2: it corresponds to Q1.6.2 M II section 1.
No problem and no verification for this indicator.
3.7 Agricultural markets and price information Q 3.5.2Q 3.5.3Q 3.5.5/3.5.7Q 3.5.6/3.5.8 (a, b, c)Q 3.6.3.1Q 3.6.3.2 (a, b, c, d)
Q 3.4.2: it corresponds to Q1.4.2 M II section 1 and Q 1.1.1 M III section 1.Q 3.4.3: it corresponds to Q 1.4.3 M II section 1 and Q1.1.3 M III sec 1.Q 3.4.6: it corresponds to Q 1.4.6 M II section 1 and Q1.1.6 M III sec 1.Q 3.4.7: it corresponds to Q 1.4.7 M II section 1 and Q1.1.7 M III sec1.Q 3.5.3.1: it corresponds to Q 1.5.3.1 M II section 1 and 1.2.3.1 M III sec 1.Q 3.5.3.2 (a, b, c, d) : it correspond to Q 1.5.3.2 du M II section 1 and 1.2.3.2 M III sec 1.
This question appears in Module 2 and Module 3 but we only consider the response one time.I.e.: if the answer “yes” appears at least once.
3.8 Agricultural surveys Q 3.6.1.2Q 3.6.2.1 (a, b, c, d, e)Q 3.6.2.2 (a, b, c, d)Q 3.6.2.3 (a, b, c ,d)Q 3.6.2.4 (a, b, c, d)Q 3.6.2.5 (a, b, c)
Q 3.6.1.2: it corresponds to Q 1.5.1.2 M II section 1 and Q1.2.1.1 M III sec 1.Q 3.6.2.1 (a, b, c ,d) : it corresponds to Q 1.5.2.1 M II section 1 and Q1.2.2.1 M III sec 1.Q 3.5.2.2 (a, b, c, d): it corresponds to Q 1.5.2.2 M II section 1 and Q1.2.2.2 M III sec 1.Q 3.6.2.3 (a, b, c ,d) : it corresponds to Q 1.5.2.3 M II section 1 and Q1.2.2.3 M III sec 1.Q 3.6.2.4 (a, b, c, d): it corresponds to Q 1.5.2.4 M II section 1 and Q1.2.2.4 M III sec 1.Q 3.6.2.5 (a, b, c) : it corresponds to Q 1.5.2.5 M II section 1 and Q1.2.2.5 M III sec 1.
3.6.2.1a - Does not exist in Africa questionnaire.3.6.2.2c- Does not exist in Africa questionnaire3.6.2.3- Questions different to those of the Africa questionnaire3.6.2.3a- Already taken care of in 3.6.2.3b (to be consistent with what is shown in the questionnaire itself)3.6.2.5- Questions different to those of the Africa questionnaireThis question appears in Module 2 and Module 3 but we only consider the response one time.I.e.: if the answer “yes” appears at least once.
3.9 Analysis and use of data Q 3.8.3 (a,b,c,d,e)Q 3.8.4Q 3.5.4Q 3.9.4Q 3.9.5
Q 3.2.3 (a,b,c,d,e) : it corresponds to Q 1.2.4 MII section 1.Q 3.2.4 : it corresponds to Q 1.2.5 M II section 1 Q 3.4.4 : it corresponds to Q 1.4.4 M II section 1 and Q1.1.4 M III.Q 3.7.4: it corresponds to Q 1.7.1 M II section 1 and Q 1.7.1 M III.Q 3.7.5 it corresponds to Q 1.7.2 M II section 1 and Q1.3.2 M III.
Q 3.2.3 : we used only the first four proposals (a, b, c, d)Q 3.8.4: OK(Q 3.5.4, Q 3.9.4, Q 3.9.5) this question appears in Module 2 and Module 3 but we only consider the response one time.I.e.: if the answer “yes” appears at least once.
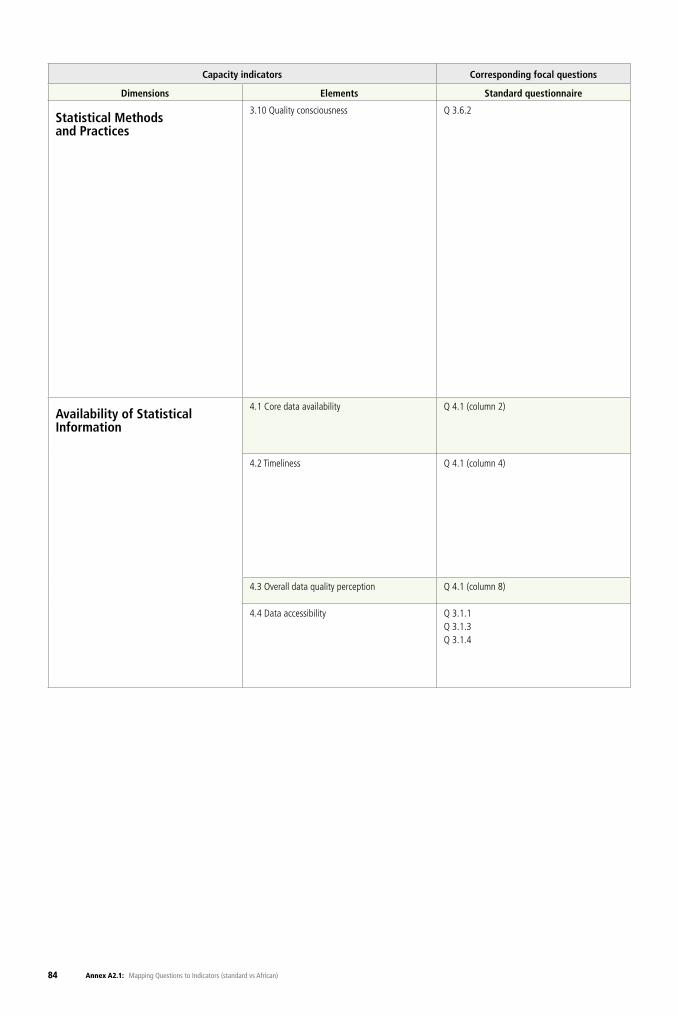
84 Annex A2.1: Mapping Questions to Indicators (standard vs African)
Capacity indicators Corresponding focal questions Corresponding focal questionsObservations / Comments
Dimensions Elements Standard questionnaire Africa questionnaire
Statistical Methods and Practices
3.10 Quality consciousness Q 3.6.2 Q 3.6.2: We don’t have this question in our questionnaire. We reformulate this indicator.Relevant questions:Q 1.8.1, Q 1.8.2, Q 1.8.3 et Q 1.8.4 Module IIQ 1.4.1, Q 1.4.2, Q 1.4.3 et Q 1.4.4 Module III
Scoring :NSO:Q 1.8.1 YES 1 Mark else 0 Mark.Q 1.8.2 YES 1 Mark else 0 Mark.Q 1.8.3 YES 1 Mark else 0 Mark.Q 1.8.4 YES 1 Mark else 0 Mark.Sub-sector:Q 1.4.1 YES 1 Mark else 0 Mark.Q 1.4.2 YES 1 Mark else 0 Mark.Q 1.4.3 YES 1 Mark else 0 Mark.Q 1.4.4 YES 1 Mark else 0 Mark.
The sub-indicator for NSO is: Sub-Indicator 1 =(total NSO score/4)The sub indicator for all sub-sector: Sub-Indicator 2 =(total Sector score/4)The average is: Sum of sub-indicator2 for all sub sector / number of sub sector.The indicator is: if we have sub-sector: ( Sub-Indicator 1+ Sub-Indicator 2)/2Else it is only : Sub-Indicator 1 =(total NSO score/4)
Availability of Statistical Information
4.1 Core data availability Q 4.1 (column 2) Q 2.1 (column 2) : OK We do not consider the answer “not applicable”
the indicator is: (number of “YES”)/(number of “NO”+ number of “YES”)
4.2 Timeliness Q 4.1 (column 4) Q 2.1 (column 4) : OK We look for the modal year.If the modal year is:
1- 2012 3 Marks2- 2011 2 Marks3- 2010 1 Mark4- other 0 Mark
The indicator is : country score / 3 * 100
4.3 Overall data quality perception Q 4.1 (column 8) Q 2.1 (column 8) : OK We look for the modal value.
4.4 Data accessibility Q 3.1.1Q 3.1.3Q 3.1.4
Q 3.8.1: it corresponds to Q 1.9.1 M II section 1 and 1.5.1 M III section 1.Q 3.8.3: it corresponds to Q 1.9.3 M II section 1 and 1.5.3 M III sec1.Q 3.8.4: it corresponds to Q 1.9.4 M II section 1 and 1.5.4 M III sec 1.
We calculate the indicator for each sub-sector then we calculate the average for sub-sectors and the total average.
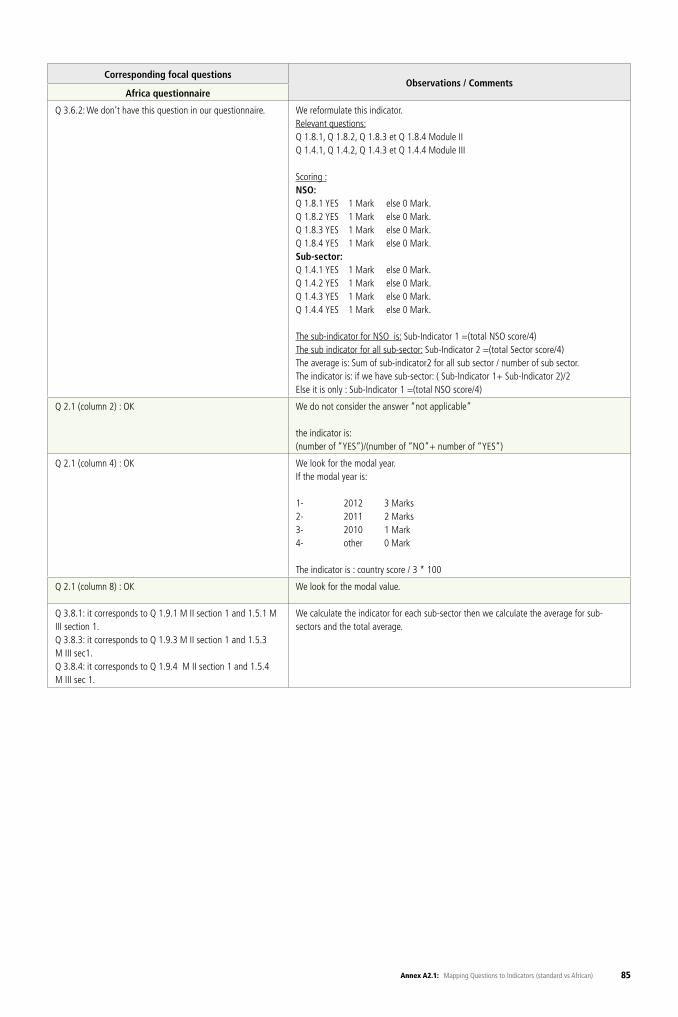
85Annex A2.1: Mapping Questions to Indicators (standard vs African)
Capacity indicators Corresponding focal questions Corresponding focal questionsObservations / Comments
Dimensions Elements Standard questionnaire Africa questionnaire
Statistical Methods and Practices
3.10 Quality consciousness Q 3.6.2 Q 3.6.2: We don’t have this question in our questionnaire. We reformulate this indicator.Relevant questions:Q 1.8.1, Q 1.8.2, Q 1.8.3 et Q 1.8.4 Module IIQ 1.4.1, Q 1.4.2, Q 1.4.3 et Q 1.4.4 Module III
Scoring :NSO:Q 1.8.1 YES 1 Mark else 0 Mark.Q 1.8.2 YES 1 Mark else 0 Mark.Q 1.8.3 YES 1 Mark else 0 Mark.Q 1.8.4 YES 1 Mark else 0 Mark.Sub-sector:Q 1.4.1 YES 1 Mark else 0 Mark.Q 1.4.2 YES 1 Mark else 0 Mark.Q 1.4.3 YES 1 Mark else 0 Mark.Q 1.4.4 YES 1 Mark else 0 Mark.
The sub-indicator for NSO is: Sub-Indicator 1 =(total NSO score/4)The sub indicator for all sub-sector: Sub-Indicator 2 =(total Sector score/4)The average is: Sum of sub-indicator2 for all sub sector / number of sub sector.The indicator is: if we have sub-sector: ( Sub-Indicator 1+ Sub-Indicator 2)/2Else it is only : Sub-Indicator 1 =(total NSO score/4)
Availability of Statistical Information
4.1 Core data availability Q 4.1 (column 2) Q 2.1 (column 2) : OK We do not consider the answer “not applicable”
the indicator is: (number of “YES”)/(number of “NO”+ number of “YES”)
4.2 Timeliness Q 4.1 (column 4) Q 2.1 (column 4) : OK We look for the modal year.If the modal year is:
1- 2012 3 Marks2- 2011 2 Marks3- 2010 1 Mark4- other 0 Mark
The indicator is : country score / 3 * 100
4.3 Overall data quality perception Q 4.1 (column 8) Q 2.1 (column 8) : OK We look for the modal value.
4.4 Data accessibility Q 3.1.1Q 3.1.3Q 3.1.4
Q 3.8.1: it corresponds to Q 1.9.1 M II section 1 and 1.5.1 M III section 1.Q 3.8.3: it corresponds to Q 1.9.3 M II section 1 and 1.5.3 M III sec1.Q 3.8.4: it corresponds to Q 1.9.4 M II section 1 and 1.5.4 M III sec 1.
We calculate the indicator for each sub-sector then we calculate the average for sub-sectors and the total average.
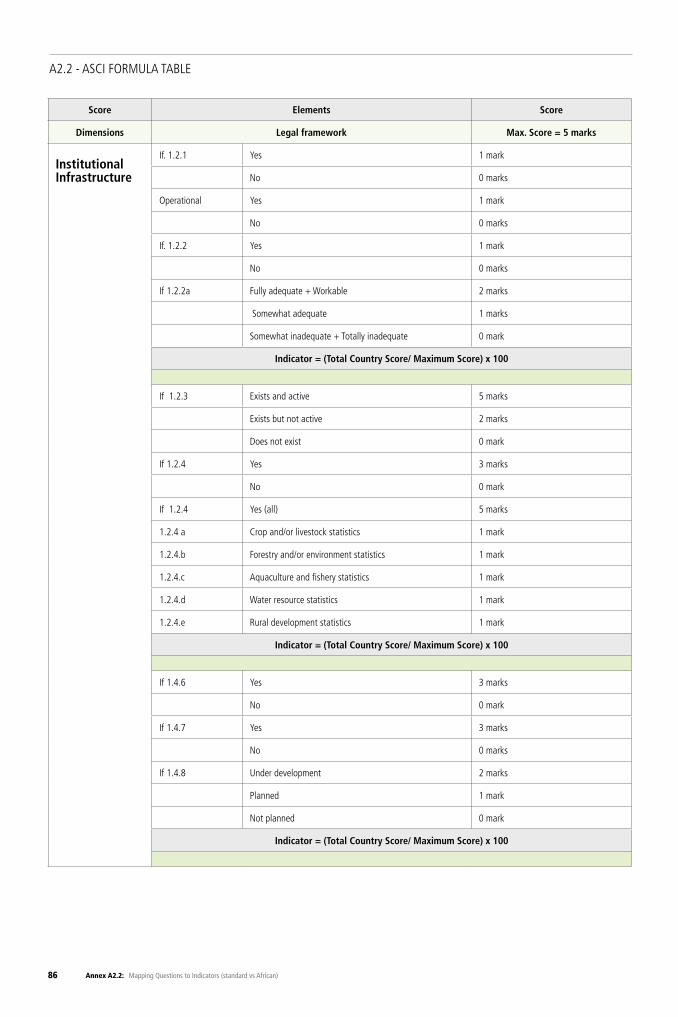
86 Annex A2.2: Mapping Questions to Indicators (standard vs African)
A2.2 - ASCI FORMULA TABLE
Score Elements Score
Dimensions Legal framework Max. Score = 5 marks
Institutional Infrastructure
If. 1.2.1 Yes 1 mark
No 0 marks
Operational Yes 1 mark
No 0 marks
If. 1.2.2 Yes 1 mark
No 0 marks
If 1.2.2a Fully adequate + Workable 2 marks
Somewhat adequate 1 marks
Somewhat inadequate + Totally inadequate 0 mark
Indicator = (Total Country Score/ Maximum Score) x 100
If 1.2.3 Exists and active 5 marks
Exists but not active 2 marks
Does not exist 0 mark
If 1.2.4 Yes 3 marks
No 0 mark
If 1.2.4 Yes (all) 5 marks
1.2.4 a Crop and/or livestock statistics 1 mark
1.2.4.b Forestry and/or environment statistics 1 mark
1.2.4.c Aquaculture and fishery statistics 1 mark
1.2.4.d Water resource statistics 1 mark
1.2.4.e Rural development statistics 1 mark
Indicator = (Total Country Score/ Maximum Score) x 100
If 1.4.6 Yes 3 marks
No 0 mark
If 1.4.7 Yes 3 marks
No 0 marks
If 1.4.8 Under development 2 marks
Planned 1 mark
Not planned 0 mark
Indicator = (Total Country Score/ Maximum Score) x 100
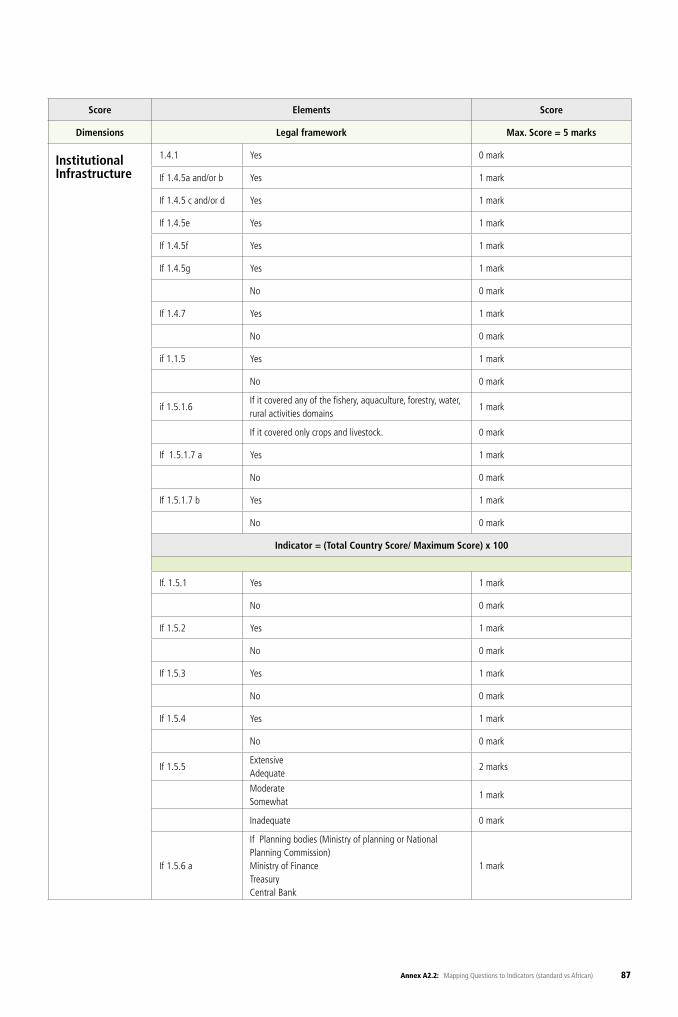
87Annex A2.2: Mapping Questions to Indicators (standard vs African)
Score Elements Score
Dimensions Legal framework Max. Score = 5 marks
Institutional Infrastructure
1.4.1 Yes 0 mark
If 1.4.5a and/or b Yes 1 mark
If 1.4.5 c and/or d Yes 1 mark
If 1.4.5e Yes 1 mark
If 1.4.5f Yes 1 mark
If 1.4.5g Yes 1 mark
No 0 mark
If 1.4.7 Yes 1 mark
No 0 mark
if 1.1.5 Yes 1 mark
No 0 mark
if 1.5.1.6If it covered any of the fishery, aquaculture, forestry, water, rural activities domains
1 mark
If it covered only crops and livestock. 0 mark
If 1.5.1.7 a Yes 1 mark
No 0 mark
If 1.5.1.7 b Yes 1 mark
No 0 mark
Indicator = (Total Country Score/ Maximum Score) x 100
If. 1.5.1 Yes 1 mark
No 0 mark
If 1.5.2 Yes 1 mark
No 0 mark
If 1.5.3 Yes 1 mark
No 0 mark
If 1.5.4 Yes 1 mark
No 0 mark
If 1.5.5ExtensiveAdequate
2 marks
ModerateSomewhat
1 mark
Inadequate 0 mark
If 1.5.6 a
If Planning bodies (Ministry of planning or National Planning Commission)Ministry of FinanceTreasuryCentral Bank
1 mark
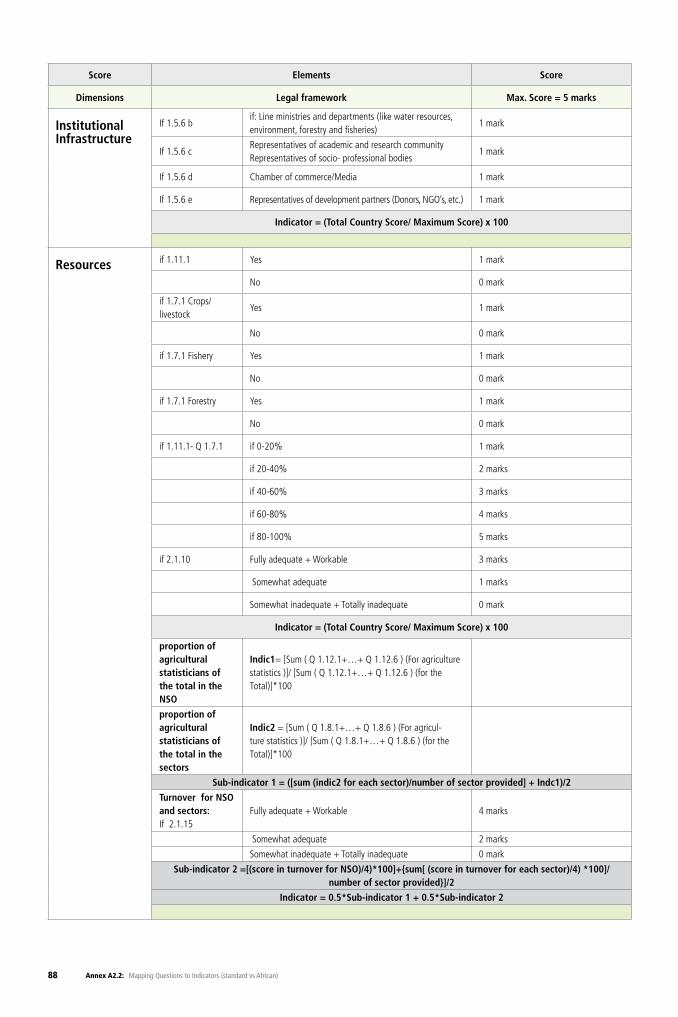
88 Annex A2.2: Mapping Questions to Indicators (standard vs African)
Score Elements Score
Dimensions Legal framework Max. Score = 5 marks
Institutional Infrastructure
If 1.5.6 bif: Line ministries and departments (like water resources, environment, forestry and fisheries)
1 mark
If 1.5.6 cRepresentatives of academic and research communityRepresentatives of socio- professional bodies
1 mark
If 1.5.6 d Chamber of commerce/Media 1 mark
If 1.5.6 e Representatives of development partners (Donors, NGO’s, etc.) 1 mark
Indicator = (Total Country Score/ Maximum Score) x 100
Resources if 1.11.1 Yes 1 mark
No 0 mark
if 1.7.1 Crops/livestock
Yes 1 mark
No 0 mark
if 1.7.1 Fishery Yes 1 mark
No 0 mark
if 1.7.1 Forestry Yes 1 mark
No 0 mark
if 1.11.1- Q 1.7.1 if 0-20% 1 mark
if 20-40% 2 marks
if 40-60% 3 marks
if 60-80% 4 marks
if 80-100% 5 marks
if 2.1.10 Fully adequate + Workable 3 marks
Somewhat adequate 1 marks
Somewhat inadequate + Totally inadequate 0 mark
Indicator = (Total Country Score/ Maximum Score) x 100
proportion of agricultural statisticians of the total in the NSO
Indic1= [Sum ( Q 1.12.1+…+ Q 1.12.6 ) (For agriculture statistics )]/ [Sum ( Q 1.12.1+…+ Q 1.12.6 ) (for the Total)]*100
proportion of agricultural statisticians of the total in the sectors
Indic2 = [Sum ( Q 1.8.1+…+ Q 1.8.6 ) (For agricul-ture statistics )]/ [Sum ( Q 1.8.1+…+ Q 1.8.6 ) (for the Total)]*100
Sub-indicator 1 = ([sum (indic2 for each sector)/number of sector provided] + Indc1)/2
Turnover for NSO and sectors: If 2.1.15
Fully adequate + Workable 4 marks
Somewhat adequate 2 marks
Somewhat inadequate + Totally inadequate 0 mark
Sub-indicator 2 =[(score in turnover for NSO)/4)*100]+{sum[ (score in turnover for each sector)/4) *100]/ number of sector provided}]/2
Indicator = 0.5*Sub-indicator 1 + 0.5*Sub-indicator 2
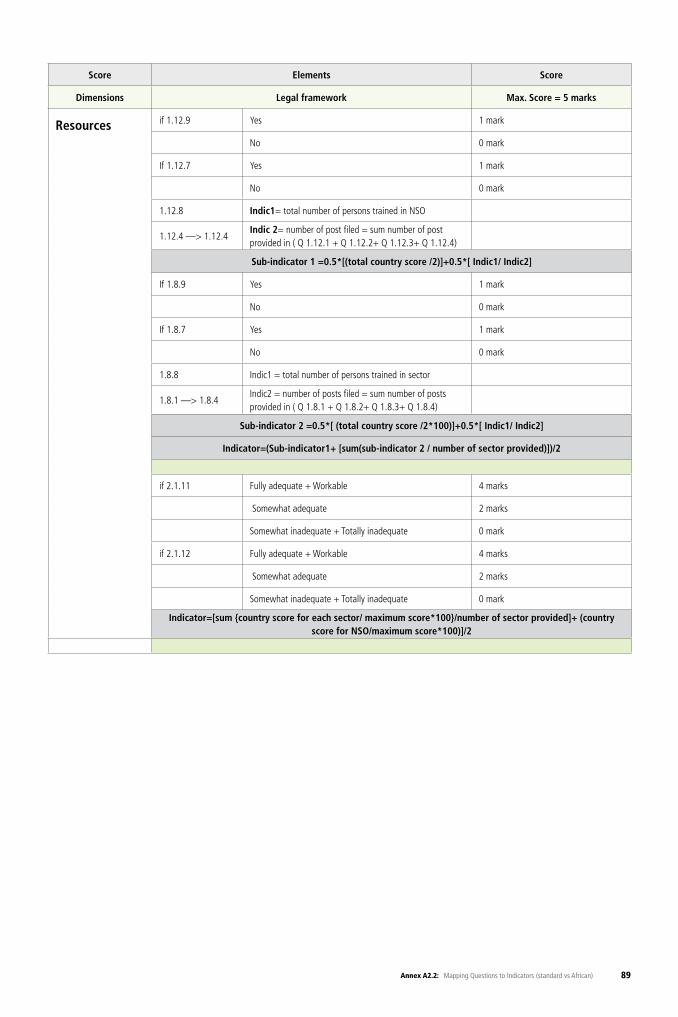
89Annex A2.2: Mapping Questions to Indicators (standard vs African)
Score Elements Score
Dimensions Legal framework Max. Score = 5 marks
Resources if 1.12.9 Yes 1 mark
No 0 mark
If 1.12.7 Yes 1 mark
No 0 mark
1.12.8 Indic1= total number of persons trained in NSO
1.12.4 —> 1.12.4Indic 2= number of post filed = sum number of post provided in ( Q 1.12.1 + Q 1.12.2+ Q 1.12.3+ Q 1.12.4)
Sub-indicator 1 =0.5*[(total country score /2)]+0.5*[ Indic1/ Indic2]
If 1.8.9 Yes 1 mark
No 0 mark
If 1.8.7 Yes 1 mark
No 0 mark
1.8.8 Indic1 = total number of persons trained in sector
1.8.1 —> 1.8.4Indic2 = number of posts filed = sum number of posts provided in ( Q 1.8.1 + Q 1.8.2+ Q 1.8.3+ Q 1.8.4)
Sub-indicator 2 =0.5*[ (total country score /2*100)]+0.5*[ Indic1/ Indic2]
Indicator=(Sub-indicator1+ [sum(sub-indicator 2 / number of sector provided)])/2
if 2.1.11 Fully adequate + Workable 4 marks
Somewhat adequate 2 marks
Somewhat inadequate + Totally inadequate 0 mark
if 2.1.12 Fully adequate + Workable 4 marks
Somewhat adequate 2 marks
Somewhat inadequate + Totally inadequate 0 mark
Indicator=[sum {country score for each sector/ maximum score*100}/number of sector provided]+ (country score for NSO/maximum score*100)]/2
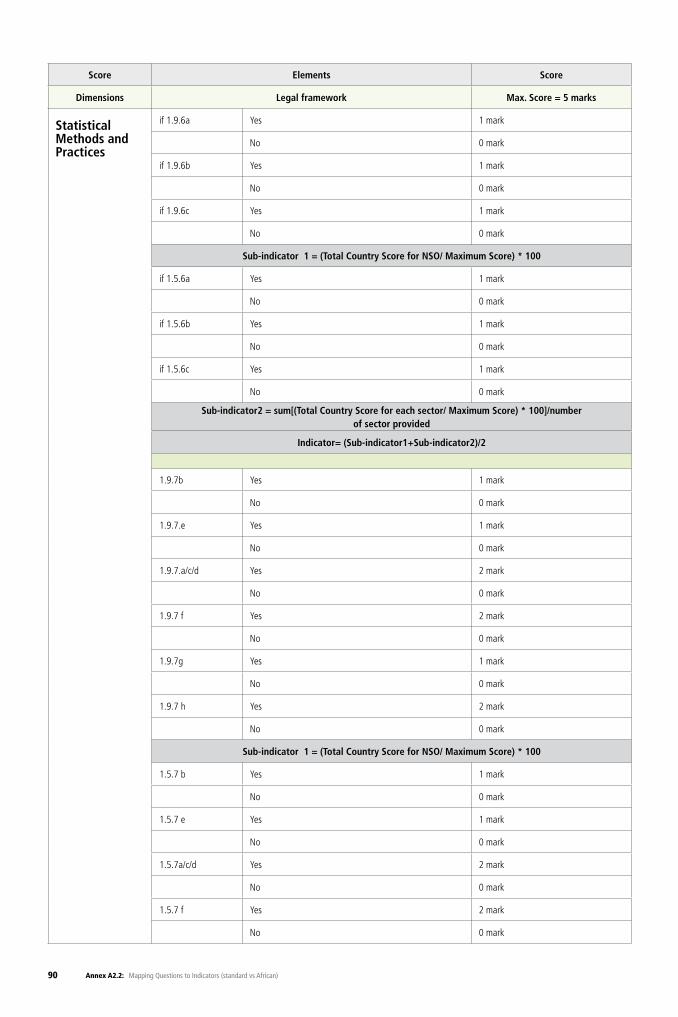
90 Annex A2.2: Mapping Questions to Indicators (standard vs African)
Score Elements Score
Dimensions Legal framework Max. Score = 5 marks
Statistical Methods and Practices
if 1.9.6a Yes 1 mark
No 0 mark
if 1.9.6b Yes 1 mark
No 0 mark
if 1.9.6c Yes 1 mark
No 0 mark
Sub-indicator 1 = (Total Country Score for NSO/ Maximum Score) * 100
if 1.5.6a Yes 1 mark
No 0 mark
if 1.5.6b Yes 1 mark
No 0 mark
if 1.5.6c Yes 1 mark
No 0 mark
Sub-indicator2 = sum[(Total Country Score for each sector/ Maximum Score) * 100]/number of sector provided
Indicator= (Sub-indicator1+Sub-indicator2)/2
1.9.7b Yes 1 mark
No 0 mark
1.9.7.e Yes 1 mark
No 0 mark
1.9.7.a/c/d Yes 2 mark
No 0 mark
1.9.7 f Yes 2 mark
No 0 mark
1.9.7g Yes 1 mark
No 0 mark
1.9.7 h Yes 2 mark
No 0 mark
Sub-indicator 1 = (Total Country Score for NSO/ Maximum Score) * 100
1.5.7 b Yes 1 mark
No 0 mark
1.5.7 e Yes 1 mark
No 0 mark
1.5.7a/c/d Yes 2 mark
No 0 mark
1.5.7 f Yes 2 mark
No 0 mark
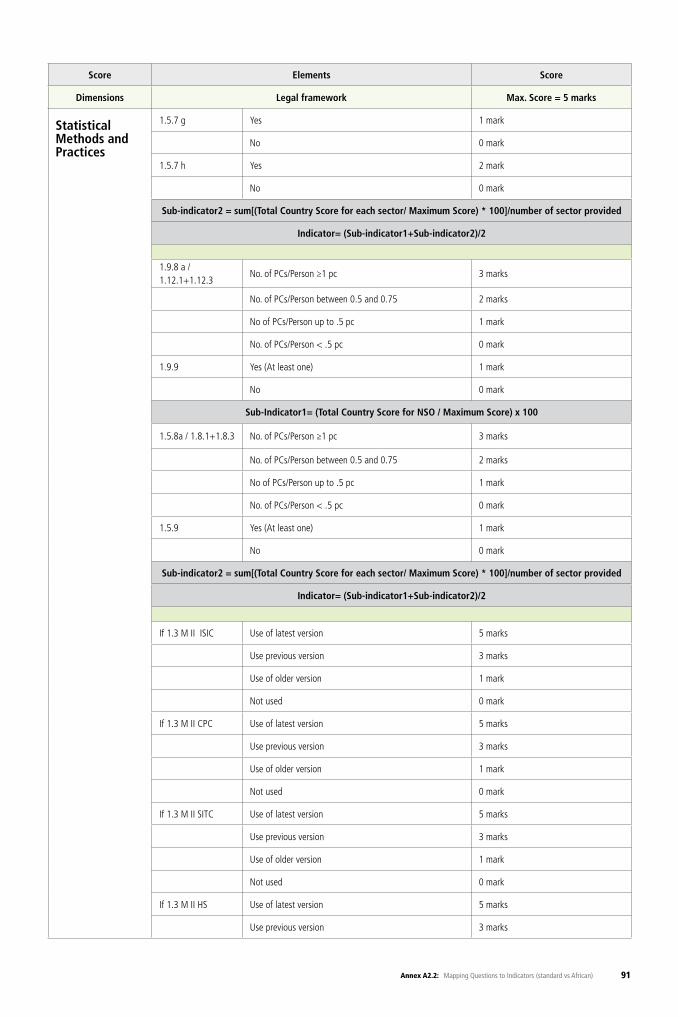
91Annex A2.2: Mapping Questions to Indicators (standard vs African)
Score Elements Score
Dimensions Legal framework Max. Score = 5 marks
Statistical Methods and Practices
1.5.7 g Yes 1 mark
No 0 mark
1.5.7 h Yes 2 mark
No 0 mark
Sub-indicator2 = sum[(Total Country Score for each sector/ Maximum Score) * 100]/number of sector provided
Indicator= (Sub-indicator1+Sub-indicator2)/2
1.9.8 a / 1.12.1+1.12.3
No. of PCs/Person ≥1 pc 3 marks
No. of PCs/Person between 0.5 and 0.75 2 marks
No of PCs/Person up to .5 pc 1 mark
No. of PCs/Person < .5 pc 0 mark
1.9.9 Yes (At least one) 1 mark
No 0 mark
Sub-Indicator1= (Total Country Score for NSO / Maximum Score) x 100
1.5.8a / 1.8.1+1.8.3 No. of PCs/Person ≥1 pc 3 marks
No. of PCs/Person between 0.5 and 0.75 2 marks
No of PCs/Person up to .5 pc 1 mark
No. of PCs/Person < .5 pc 0 mark
1.5.9 Yes (At least one) 1 mark
No 0 mark
Sub-indicator2 = sum[(Total Country Score for each sector/ Maximum Score) * 100]/number of sector provided
Indicator= (Sub-indicator1+Sub-indicator2)/2
If 1.3 M II ISIC Use of latest version 5 marks
Use previous version 3 marks
Use of older version 1 mark
Not used 0 mark
If 1.3 M II CPC Use of latest version 5 marks
Use previous version 3 marks
Use of older version 1 mark
Not used 0 mark
If 1.3 M II SITC Use of latest version 5 marks
Use previous version 3 marks
Use of older version 1 mark
Not used 0 mark
If 1.3 M II HS Use of latest version 5 marks
Use previous version 3 marks

92 Annex A2.2: Mapping Questions to Indicators (standard vs African)
Score Elements Score
Dimensions Legal framework Max. Score = 5 marks
Statistical Methods and Practices
Use of older version 1 mark
Not used 0 mark
If 1.2.9 SNA 2008 Yes 4 marks
1.2.9 SNA 1993 Yes 2 marks
1.2.9 SNA 1968 Yes 1 mark
Indicator = 0.75*[ % score on classification ]+0.25*[% score on SNA ]x 100
if 1.1.4 / 1.1.6 Yes 1 mark
No 0 mark
if 1.2.3 If one year lag 2 mark
If two years lag 1 mark
More than 2 lag 0 mark
if 1.2.5 Yes 1 mark
No 0 mark
if 1.4.1 Yes 1 mark
No 0 mark
If 1.4.5 Yes 1 mark
No 0 mark
If 1.6.2 Yes 1 mark
No 0 mark
Indicator = (Total Country score /Maximum Score) x 100
Q1.4.2 MII-Q 1.1.1 MIII
Yes 1 mark
No 0 mark
Q 1.4.3 MII-Q 1.1.3MIII
Yes 1 mark
No 0 mark
Q 1.4.6 MII-Q1.1.6 MIII
Crops 1 mark
Livestock 1 mark
Fish and related products 1 mark
If no separate reports on crop, livestock or fish or no WPI 0 mark
If 1.4.7 MII-1.1.7 MIII
Yes 1 mark
No 0 mark
If 1.5.3.1 MII- 1.2.3.1 M III
Yes 1 mark
No 0 mark
if 1.5.3.2a MII–1.2.3.2a MIII
Crops 1 mark
if 1.5.3.2b MII–1.2.3.2b MIII
Livestock 1 mark
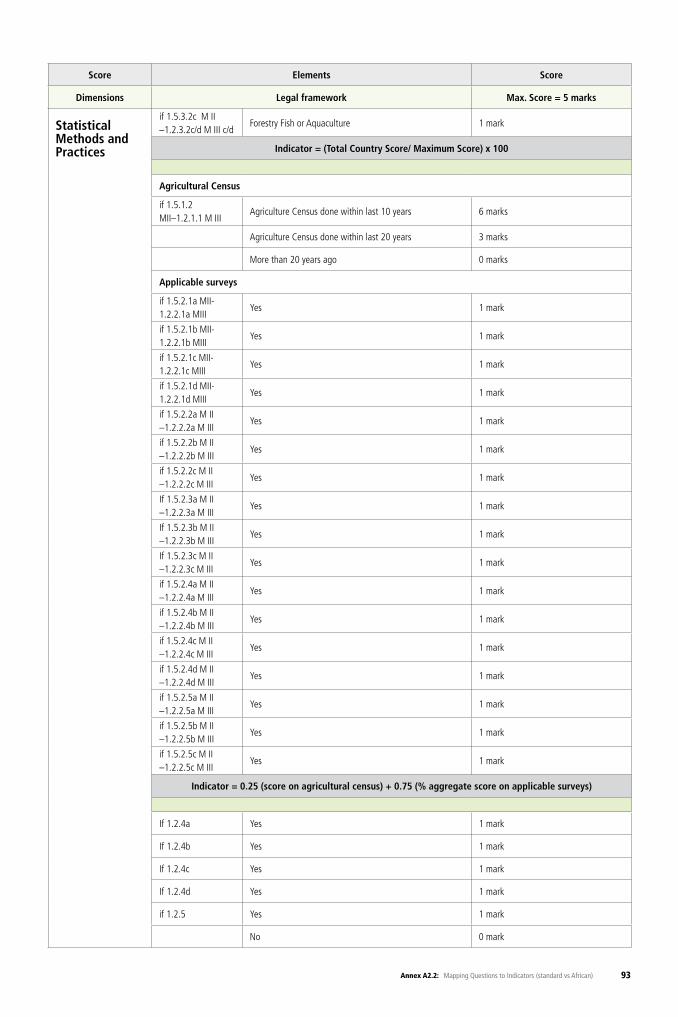
93Annex A2.2: Mapping Questions to Indicators (standard vs African)
Score Elements Score
Dimensions Legal framework Max. Score = 5 marks
Statistical Methods and Practices
if 1.5.3.2c M II –1.2.3.2c/d M III c/d
Forestry Fish or Aquaculture 1 mark
Indicator = (Total Country Score/ Maximum Score) x 100
Agricultural Census
if 1.5.1.2 MII–1.2.1.1 M III
Agriculture Census done within last 10 years 6 marks
Agriculture Census done within last 20 years 3 marks
More than 20 years ago 0 marks
Applicable surveys
if 1.5.2.1a MII- 1.2.2.1a MIII
Yes 1 mark
if 1.5.2.1b MII- 1.2.2.1b MIII
Yes 1 mark
if 1.5.2.1c MII- 1.2.2.1c MIII
Yes 1 mark
if 1.5.2.1d MII- 1.2.2.1d MIII
Yes 1 mark
if 1.5.2.2a M II –1.2.2.2a M III
Yes 1 mark
if 1.5.2.2b M II –1.2.2.2b M III
Yes 1 mark
if 1.5.2.2c M II –1.2.2.2c M III
Yes 1 mark
If 1.5.2.3a M II –1.2.2.3a M III
Yes 1 mark
If 1.5.2.3b M II –1.2.2.3b M III
Yes 1 mark
If 1.5.2.3c M II –1.2.2.3c M III
Yes 1 mark
if 1.5.2.4a M II –1.2.2.4a M III
Yes 1 mark
if 1.5.2.4b M II –1.2.2.4b M III
Yes 1 mark
if 1.5.2.4c M II –1.2.2.4c M III
Yes 1 mark
if 1.5.2.4d M II –1.2.2.4d M III
Yes 1 mark
if 1.5.2.5a M II –1.2.2.5a M III
Yes 1 mark
if 1.5.2.5b M II –1.2.2.5b M III
Yes 1 mark
if 1.5.2.5c M II –1.2.2.5c M III
Yes 1 mark
Indicator = 0.25 (score on agricultural census) + 0.75 (% aggregate score on applicable surveys)
If 1.2.4a Yes 1 mark
If 1.2.4b Yes 1 mark
If 1.2.4c Yes 1 mark
If 1.2.4d Yes 1 mark
if 1.2.5 Yes 1 mark
No 0 mark
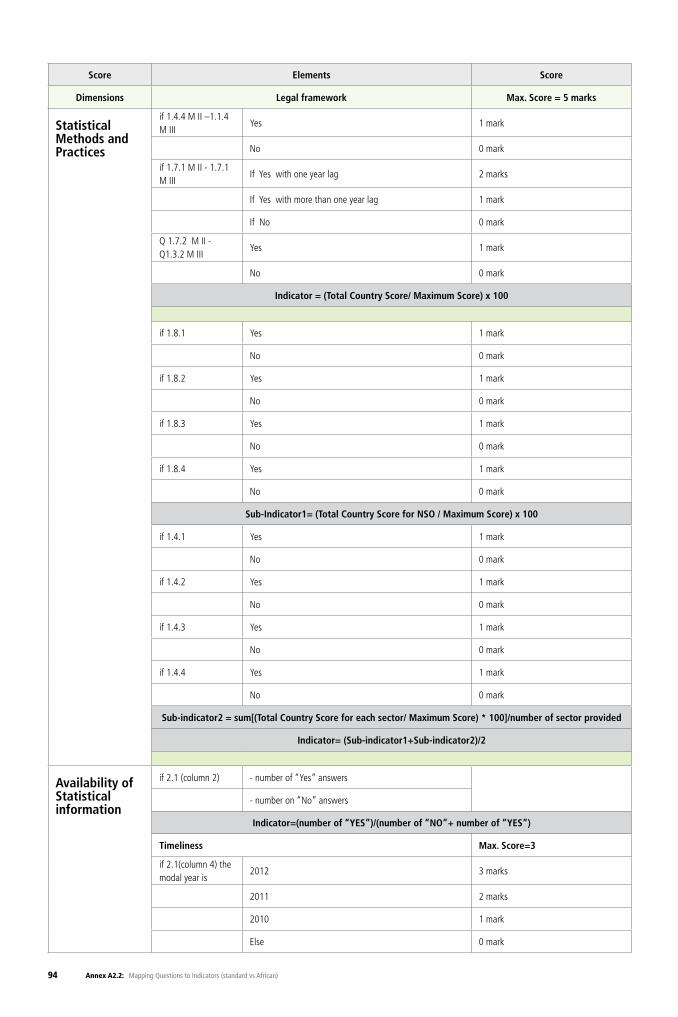
94 Annex A2.2: Mapping Questions to Indicators (standard vs African)
Score Elements Score
Dimensions Legal framework Max. Score = 5 marks
Statistical Methods and Practices
if 1.4.4 M II –1.1.4 M III
Yes 1 mark
No 0 mark
if 1.7.1 M II - 1.7.1 M III
If Yes with one year lag 2 marks
If Yes with more than one year lag 1 mark
If No 0 mark
Q 1.7.2 M II - Q1.3.2 M III
Yes 1 mark
No 0 mark
Indicator = (Total Country Score/ Maximum Score) x 100
if 1.8.1 Yes 1 mark
No 0 mark
if 1.8.2 Yes 1 mark
No 0 mark
if 1.8.3 Yes 1 mark
No 0 mark
if 1.8.4 Yes 1 mark
No 0 mark
Sub-Indicator1= (Total Country Score for NSO / Maximum Score) x 100
if 1.4.1 Yes 1 mark
No 0 mark
if 1.4.2 Yes 1 mark
No 0 mark
if 1.4.3 Yes 1 mark
No 0 mark
if 1.4.4 Yes 1 mark
No 0 mark
Sub-indicator2 = sum[(Total Country Score for each sector/ Maximum Score) * 100]/number of sector provided
Indicator= (Sub-indicator1+Sub-indicator2)/2
Availability of Statistical information
if 2.1 (column 2) - number of “Yes” answers
- number on “No” answers
Indicator=(number of “YES”)/(number of “NO”+ number of “YES”)
Timeliness Max. Score=3
if 2.1(column 4) the modal year is
2012 3 marks
2011 2 marks
2010 1 mark
Else 0 mark
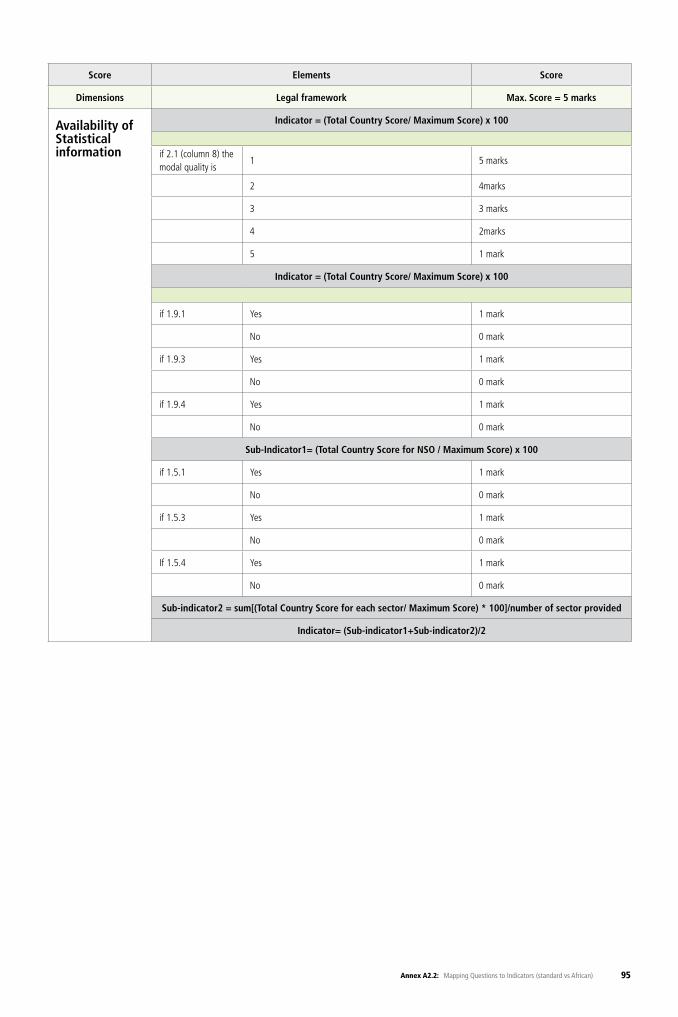
95Annex A2.2: Mapping Questions to Indicators (standard vs African)
Score Elements Score
Dimensions Legal framework Max. Score = 5 marks
Availability of Statistical information
Indicator = (Total Country Score/ Maximum Score) x 100
if 2.1 (column 8) the modal quality is
1 5 marks
2 4marks
3 3 marks
4 2marks
5 1 mark
Indicator = (Total Country Score/ Maximum Score) x 100
if 1.9.1 Yes 1 mark
No 0 mark
if 1.9.3 Yes 1 mark
No 0 mark
if 1.9.4 Yes 1 mark
No 0 mark
Sub-Indicator1= (Total Country Score for NSO / Maximum Score) x 100
if 1.5.1 Yes 1 mark
No 0 mark
if 1.5.3 Yes 1 mark
No 0 mark
If 1.5.4 Yes 1 mark
No 0 mark
Sub-indicator2 = sum[(Total Country Score for each sector/ Maximum Score) * 100]/number of sector provided
Indicator= (Sub-indicator1+Sub-indicator2)/2
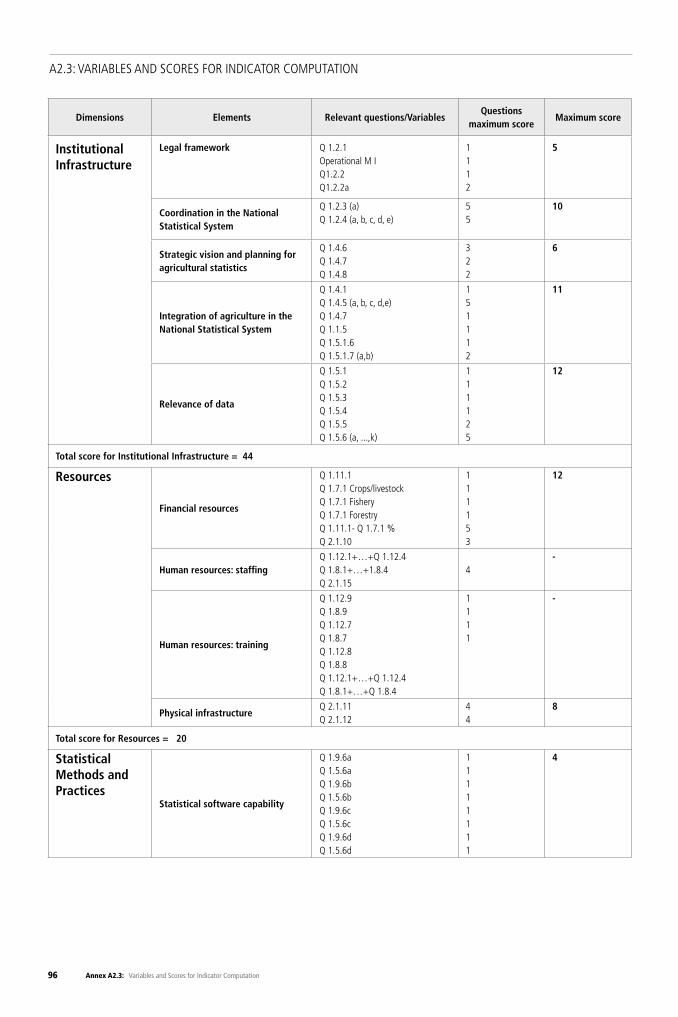
96 Annex A2.3: Variables and Scores for Indicator Computation
A2.3: VARIABLES AND SCORES FOR INDICATOR COMPUTATION
Dimensions Elements Relevant questions/VariablesQuestions
maximum scoreMaximum score
Institutional Infrastructure
Legal framework Q 1.2.1Operational M IQ1.2.2 Q1.2.2a
1112
5
Coordination in the National Statistical System
Q 1.2.3 (a)Q 1.2.4 (a, b, c, d, e)
55
10
Strategic vision and planning for agricultural statistics
Q 1.4.6 Q 1.4.7Q 1.4.8
322
6
Integration of agriculture in the National Statistical System
Q 1.4.1 Q 1.4.5 (a, b, c, d,e) Q 1.4.7Q 1.1.5Q 1.5.1.6Q 1.5.1.7 (a,b)
151112
11
Relevance of data
Q 1.5.1Q 1.5.2Q 1.5.3Q 1.5.4Q 1.5.5Q 1.5.6 (a, ...,k)
111125
12
Total score for Institutional Infrastructure = 44
Resources
Financial resources
Q 1.11.1Q 1.7.1 Crops/livestockQ 1.7.1 FisheryQ 1.7.1 ForestryQ 1.11.1- Q 1.7.1 %Q 2.1.10
111153
12
Human resources: staffingQ 1.12.1+…+Q 1.12.4Q 1.8.1+…+1.8.4Q 2.1.15
4-
Human resources: training
Q 1.12.9Q 1.8.9Q 1.12.7Q 1.8.7Q 1.12.8Q 1.8.8Q 1.12.1+…+Q 1.12.4Q 1.8.1+…+Q 1.8.4
1111
-
Physical infrastructureQ 2.1.11Q 2.1.12
44
8
Total score for Resources = 20
Statistical Methods and Practices
Statistical software capability
Q 1.9.6aQ 1.5.6aQ 1.9.6bQ 1.5.6bQ 1.9.6cQ 1.5.6cQ 1.9.6dQ 1.5.6d
11111111
4
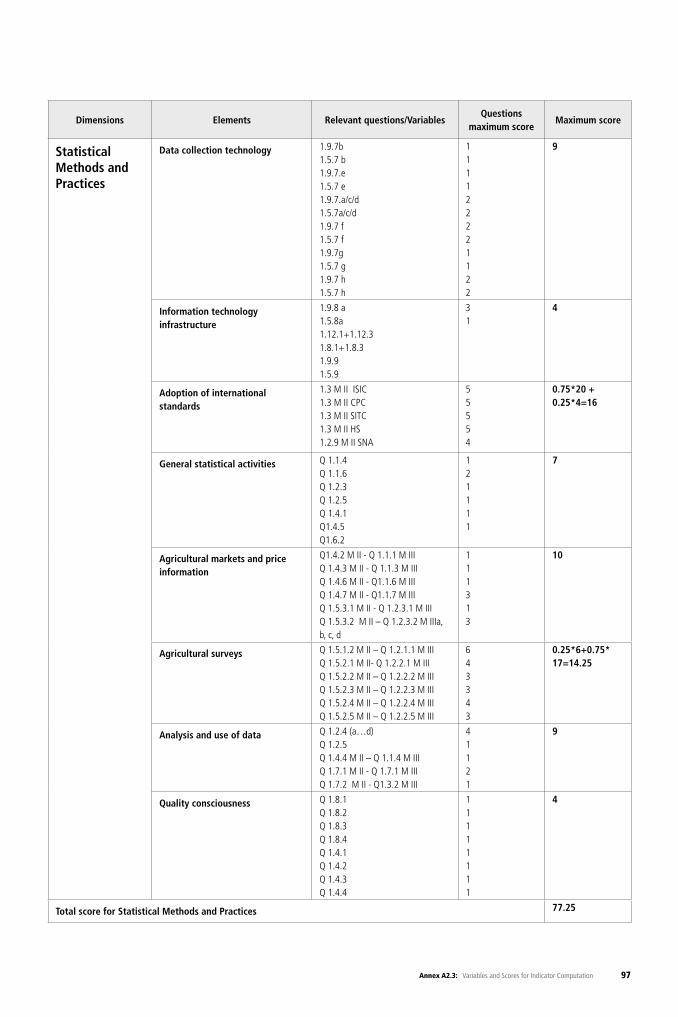
97Annex A2.3: Variables and Scores for Indicator Computation
Dimensions Elements Relevant questions/VariablesQuestions
maximum scoreMaximum score
Statistical Methods and Practices
Data collection technology 1.9.7b1.5.7 b1.9.7.e1.5.7 e1.9.7.a/c/d1.5.7a/c/d1.9.7 f1.5.7 f1.9.7g1.5.7 g1.9.7 h1.5.7 h
111122221122
9
Information technology infrastructure
1.9.8 a1.5.8a1.12.1+1.12.31.8.1+1.8.31.9.91.5.9
31
4
Adoption of international standards
1.3 M II ISIC1.3 M II CPC1.3 M II SITC1.3 M II HS1.2.9 M II SNA
55554
0.75*20 + 0.25*4=16
General statistical activities Q 1.1.4Q 1.1.6Q 1.2.3Q 1.2.5Q 1.4.1Q1.4.5Q1.6.2
121111
7
Agricultural markets and price information
Q1.4.2 M II - Q 1.1.1 M IIIQ 1.4.3 M II - Q 1.1.3 M IIIQ 1.4.6 M II - Q1.1.6 M IIIQ 1.4.7 M II - Q1.1.7 M IIIQ 1.5.3.1 M II - Q 1.2.3.1 M IIIQ 1.5.3.2 M II – Q 1.2.3.2 M IIIa, b, c, d
111313
10
Agricultural surveys Q 1.5.1.2 M II – Q 1.2.1.1 M IIIQ 1.5.2.1 M II- Q 1.2.2.1 M IIIQ 1.5.2.2 M II – Q 1.2.2.2 M IIIQ 1.5.2.3 M II – Q 1.2.2.3 M IIIQ 1.5.2.4 M II – Q 1.2.2.4 M IIIQ 1.5.2.5 M II – Q 1.2.2.5 M III
643343
0.25*6+0.75* 17=14.25
Analysis and use of data Q 1.2.4 (a…d)Q 1.2.5Q 1.4.4 M II – Q 1.1.4 M IIIQ 1.7.1 M II - Q 1.7.1 M IIIQ 1.7.2 M II - Q1.3.2 M III
41121
9
Quality consciousness Q 1.8.1Q 1.8.2Q 1.8.3Q 1.8.4Q 1.4.1Q 1.4.2Q 1.4.3Q 1.4.4
11111111
4
Total score for Statistical Methods and Practices 77.25
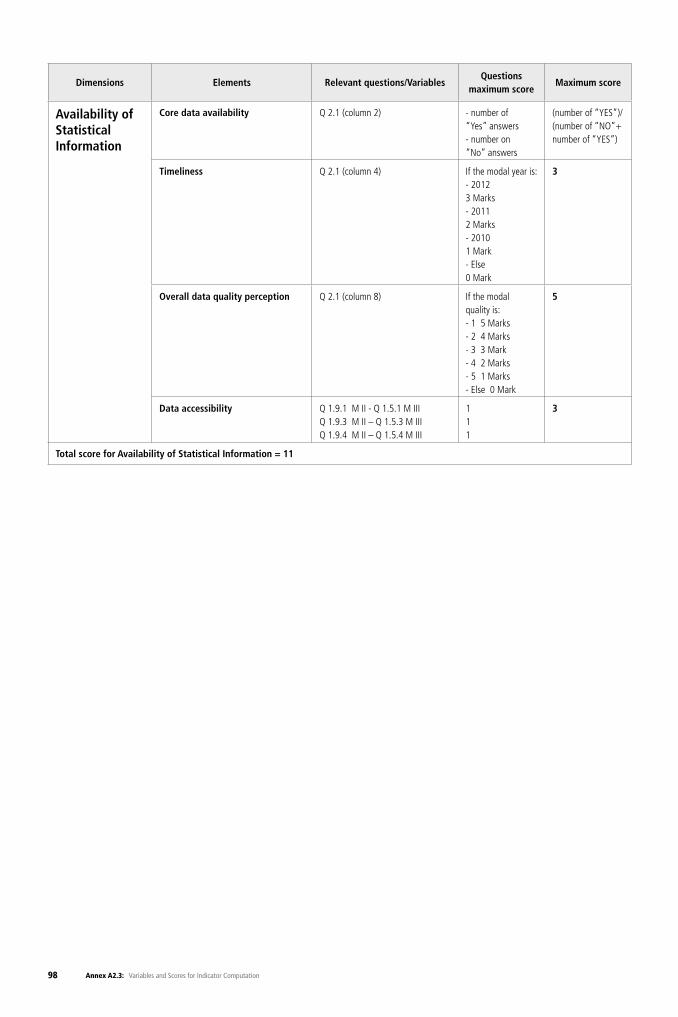
98 Annex A2.3: Variables and Scores for Indicator Computation
Dimensions Elements Relevant questions/VariablesQuestions
maximum scoreMaximum score
Availability of Statistical Information
Core data availability Q 2.1 (column 2) - number of “Yes” answers- number on “No” answers
(number of “YES”)/(number of “NO”+ number of “YES”)
Timeliness Q 2.1 (column 4) If the modal year is:- 2012 3 Marks- 2011 2 Marks- 2010 1 Mark- Else 0 Mark
3
Overall data quality perception Q 2.1 (column 8) If the modal quality is:- 1 5 Marks- 2 4 Marks- 3 3 Mark- 4 2 Marks- 5 1 Marks- Else 0 Mark
5
Data accessibility Q 1.9.1 M II - Q 1.5.1 M IIIQ 1.9.3 M II – Q 1.5.3 M IIIQ 1.9.4 M II – Q 1.5.4 M III
111
3
Total score for Availability of Statistical Information = 11
99Annex A2.3: Variables and Scores for Indicator Computation
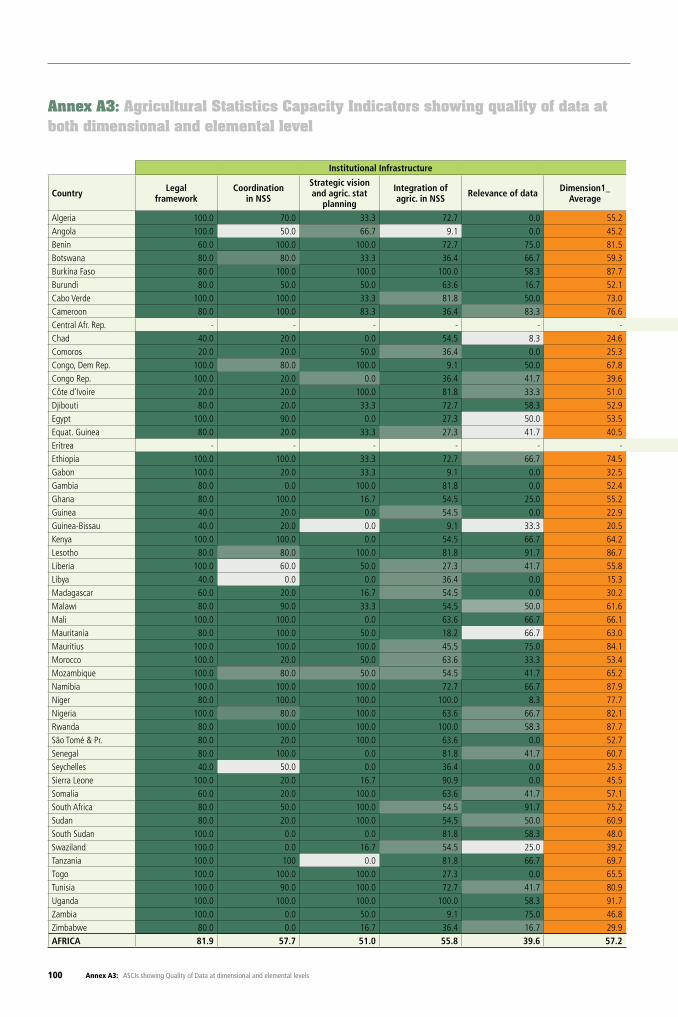
100 Annex A3: ASCIs showing Quality of Data at dimensional and elemental levels
Annex A3: Agricultural Statistics Capacity Indicators showing quality of data at both dimensional and elemental level
Institutional Infrastructure Resources
Country Legalframework
Coordinationin NSS
Strategic vision and agric. stat
planning
Integration of agric. in NSS Relevance of data Dimension1_
Average Financial Resources
Human Resources:Staffing
Human Resources:Training
Physical Infrastructure
Dimension2_Average
Algeria 100.0 70.0 33.3 72.7 0.0 55.2 0.0 0.0 0.0 0.0 0.0Angola 100.0 50.0 66.7 9.1 0.0 45.2 0.0 0.0 0.0 0.0 0.0Benin 60.0 100.0 100.0 72.7 75.0 81.5 8.3 25.0 6.4 37.5 19.3Botswana 80.0 80.0 33.3 36.4 66.7 59.3 33.3 69.2 50.0 75.0 56.9Burkina Faso 80.0 100.0 100.0 100.0 58.3 87.7 50.0 18.3 6.3 15.6 22.6Burundi 80.0 50.0 50.0 63.6 16.7 52.1 8.3 13.8 0.0 25.0 11.8Cabo Verde 100.0 100.0 33.3 81.8 50.0 73.0 75.0 43.8 23.8 43.8 46.6Cameroon 80.0 100.0 83.3 36.4 83.3 76.6 8.3 50.0 38.8 25.0 30.5Central Afr. Rep. - - - - - - - - - - -Chad 40.0 20.0 0.0 54.5 8.3 24.6 0.0 0.0 0.0 0.0 0.0Comoros 20.0 20.0 50.0 36.4 0.0 25.3 25.0 14.3 0.0 25.0 16.1Congo, Dem Rep. 100.0 80.0 100.0 9.1 50.0 67.8 0.0 0.0 0.0 25.0 6.3Congo Rep. 100.0 20.0 0.0 36.4 41.7 39.6 25.0 9.2 6.0 12.5 13.2Côte d’Ivoire 20.0 20.0 100.0 81.8 33.3 51.0 41.7 16.6 43.0 37.5 34.7Djibouti 80.0 20.0 33.3 72.7 58.3 52.9 33.3 14.6 0.0 4.2 13.0Egypt 100.0 90.0 0.0 27.3 50.0 53.5 8.3 50.0 37.7 50.0 36.5Equat. Guinea 80.0 20.0 33.3 27.3 41.7 40.5 0.0 0.0 25.0 0.0 6.3Eritrea - - - - - - - - - - -Ethiopia 100.0 100.0 33.3 72.7 66.7 74.5 41.7 0.6 96.3 0.0 34.6Gabon 100.0 20.0 33.3 9.1 0.0 32.5 41.7 36.0 44.0 3.1 31.2Gambia 80.0 0.0 100.0 81.8 0.0 52.4 0.0 0.0 0.0 0.0 0.0Ghana 80.0 100.0 16.7 54.5 25.0 55.2 66.7 62.5 18.2 50.0 49.4Guinea 40.0 20.0 0.0 54.5 0.0 22.9 25.0 12.6 15.4 7.5 15.1Guinea-Bissau 40.0 20.0 0.0 9.1 33.3 20.5 0.0 0.0 0.0 0.0 0.0Kenya 100.0 100.0 0.0 54.5 66.7 64.2 25.0 13.0 46.9 50.0 33.7Lesotho 80.0 80.0 100.0 81.8 91.7 86.7 16.7 27.8 51.5 25.0 30.2Liberia 100.0 60.0 50.0 27.3 41.7 55.8 16.7 54.2 8.3 50.0 32.3Libya 40.0 0.0 0.0 36.4 0.0 15.3 0.0 0.0 0.0 0.0 0.0Madagascar 60.0 20.0 16.7 54.5 0.0 30.2 0.0 18.8 0.0 12.5 7.8Malawi 80.0 90.0 33.3 54.5 50.0 61.6 58.3 50.6 13.4 75.0 49.3Mali 100.0 100.0 0.0 63.6 66.7 66.1 41.7 24.4 7.3 25.0 24.6Mauritania 80.0 100.0 50.0 18.2 66.7 63.0 8.3 14.8 0.0 50.0 18.3Mauritius 100.0 100.0 100.0 45.5 75.0 84.1 66.7 51.0 59.4 87.5 66.1Morocco 100.0 20.0 50.0 63.6 33.3 53.4 25.0 20.0 6.4 25.0 19.1Mozambique 100.0 80.0 50.0 54.5 41.7 65.2 66.7 11.6 25.4 37.5 35.3Namibia 100.0 100.0 100.0 72.7 66.7 87.9 50.0 56.8 22.5 50.0 44.8Niger 80.0 100.0 100.0 100.0 8.3 77.7 0.0 0.0 0.0 37.5 9.4Nigeria 100.0 80.0 100.0 63.6 66.7 82.1 25.0 37.5 0.0 62.5 31.3Rwanda 80.0 100.0 100.0 100.0 58.3 87.7 50.0 25.7 45.8 50.0 42.9São Tomé & Pr. 80.0 20.0 100.0 63.6 0.0 52.7 16.7 9.4 41.7 75.0 35.7Senegal 80.0 100.0 0.0 81.8 41.7 60.7 58.3 22.1 12.6 57.5 37.6Seychelles 40.0 50.0 0.0 36.4 0.0 25.3 25.0 12.5 0.0 50.0 21.9Sierra Leone 100.0 20.0 16.7 90.9 0.0 45.5 16.7 22.0 0.0 25.0 15.9Somalia 60.0 20.0 100.0 63.6 41.7 57.1 0.0 0.0 0.0 25.0 6.3South Africa 80.0 50.0 100.0 54.5 91.7 75.2 50.0 50.7 26.2 100.0 56.7Sudan 80.0 20.0 100.0 54.5 50.0 60.9 0.0 0.0 0.0 12.5 3.1South Sudan 100.0 0.0 0.0 81.8 58.3 48.0 16.7 0.0 0.0 50.0 16.7Swaziland 100.0 0.0 16.7 54.5 25.0 39.2 16.7 33.2 0.0 50.0 25.0Tanzania 100.0 100 0.0 81.8 66.7 69.7 0.0 56.3 0.0 25.0 20.3Togo 100.0 100.0 100.0 27.3 0.0 65.5 16.7 17.6 0.0 28.1 15.6Tunisia 100.0 90.0 100.0 72.7 41.7 80.9 33.3 19.7 15.9 25.0 23.5Uganda 100.0 100.0 100.0 100.0 58.3 91.7 33.3 50.1 19.0 50.0 38.1Zambia 100.0 0.0 50.0 9.1 75.0 46.8 91.7 49.0 25.9 33.3 50.0Zimbabwe 80.0 0.0 16.7 36.4 16.7 29.9 0.0 0.0 0.0 50.0 12.5AFRICA 81.9 57.7 51.0 55.8 39.6 57.2 25.3 22.8 16.1 33.3 24.4
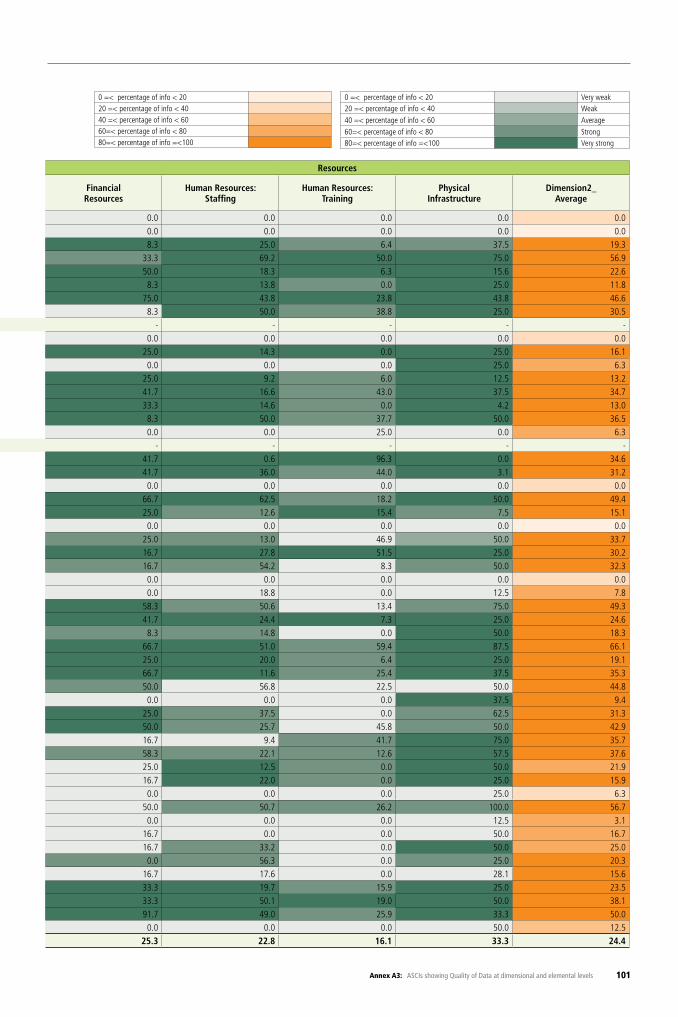
101Annex A3: ASCIs showing Quality of Data at dimensional and elemental levels
Institutional Infrastructure Resources
Country Legalframework
Coordinationin NSS
Strategic vision and agric. stat
planning
Integration of agric. in NSS Relevance of data Dimension1_
Average Financial Resources
Human Resources:Staffing
Human Resources:Training
Physical Infrastructure
Dimension2_Average
Algeria 100.0 70.0 33.3 72.7 0.0 55.2 0.0 0.0 0.0 0.0 0.0Angola 100.0 50.0 66.7 9.1 0.0 45.2 0.0 0.0 0.0 0.0 0.0Benin 60.0 100.0 100.0 72.7 75.0 81.5 8.3 25.0 6.4 37.5 19.3Botswana 80.0 80.0 33.3 36.4 66.7 59.3 33.3 69.2 50.0 75.0 56.9Burkina Faso 80.0 100.0 100.0 100.0 58.3 87.7 50.0 18.3 6.3 15.6 22.6Burundi 80.0 50.0 50.0 63.6 16.7 52.1 8.3 13.8 0.0 25.0 11.8Cabo Verde 100.0 100.0 33.3 81.8 50.0 73.0 75.0 43.8 23.8 43.8 46.6Cameroon 80.0 100.0 83.3 36.4 83.3 76.6 8.3 50.0 38.8 25.0 30.5Central Afr. Rep. - - - - - - - - - - -Chad 40.0 20.0 0.0 54.5 8.3 24.6 0.0 0.0 0.0 0.0 0.0Comoros 20.0 20.0 50.0 36.4 0.0 25.3 25.0 14.3 0.0 25.0 16.1Congo, Dem Rep. 100.0 80.0 100.0 9.1 50.0 67.8 0.0 0.0 0.0 25.0 6.3Congo Rep. 100.0 20.0 0.0 36.4 41.7 39.6 25.0 9.2 6.0 12.5 13.2Côte d’Ivoire 20.0 20.0 100.0 81.8 33.3 51.0 41.7 16.6 43.0 37.5 34.7Djibouti 80.0 20.0 33.3 72.7 58.3 52.9 33.3 14.6 0.0 4.2 13.0Egypt 100.0 90.0 0.0 27.3 50.0 53.5 8.3 50.0 37.7 50.0 36.5Equat. Guinea 80.0 20.0 33.3 27.3 41.7 40.5 0.0 0.0 25.0 0.0 6.3Eritrea - - - - - - - - - - -Ethiopia 100.0 100.0 33.3 72.7 66.7 74.5 41.7 0.6 96.3 0.0 34.6Gabon 100.0 20.0 33.3 9.1 0.0 32.5 41.7 36.0 44.0 3.1 31.2Gambia 80.0 0.0 100.0 81.8 0.0 52.4 0.0 0.0 0.0 0.0 0.0Ghana 80.0 100.0 16.7 54.5 25.0 55.2 66.7 62.5 18.2 50.0 49.4Guinea 40.0 20.0 0.0 54.5 0.0 22.9 25.0 12.6 15.4 7.5 15.1Guinea-Bissau 40.0 20.0 0.0 9.1 33.3 20.5 0.0 0.0 0.0 0.0 0.0Kenya 100.0 100.0 0.0 54.5 66.7 64.2 25.0 13.0 46.9 50.0 33.7Lesotho 80.0 80.0 100.0 81.8 91.7 86.7 16.7 27.8 51.5 25.0 30.2Liberia 100.0 60.0 50.0 27.3 41.7 55.8 16.7 54.2 8.3 50.0 32.3Libya 40.0 0.0 0.0 36.4 0.0 15.3 0.0 0.0 0.0 0.0 0.0Madagascar 60.0 20.0 16.7 54.5 0.0 30.2 0.0 18.8 0.0 12.5 7.8Malawi 80.0 90.0 33.3 54.5 50.0 61.6 58.3 50.6 13.4 75.0 49.3Mali 100.0 100.0 0.0 63.6 66.7 66.1 41.7 24.4 7.3 25.0 24.6Mauritania 80.0 100.0 50.0 18.2 66.7 63.0 8.3 14.8 0.0 50.0 18.3Mauritius 100.0 100.0 100.0 45.5 75.0 84.1 66.7 51.0 59.4 87.5 66.1Morocco 100.0 20.0 50.0 63.6 33.3 53.4 25.0 20.0 6.4 25.0 19.1Mozambique 100.0 80.0 50.0 54.5 41.7 65.2 66.7 11.6 25.4 37.5 35.3Namibia 100.0 100.0 100.0 72.7 66.7 87.9 50.0 56.8 22.5 50.0 44.8Niger 80.0 100.0 100.0 100.0 8.3 77.7 0.0 0.0 0.0 37.5 9.4Nigeria 100.0 80.0 100.0 63.6 66.7 82.1 25.0 37.5 0.0 62.5 31.3Rwanda 80.0 100.0 100.0 100.0 58.3 87.7 50.0 25.7 45.8 50.0 42.9São Tomé & Pr. 80.0 20.0 100.0 63.6 0.0 52.7 16.7 9.4 41.7 75.0 35.7Senegal 80.0 100.0 0.0 81.8 41.7 60.7 58.3 22.1 12.6 57.5 37.6Seychelles 40.0 50.0 0.0 36.4 0.0 25.3 25.0 12.5 0.0 50.0 21.9Sierra Leone 100.0 20.0 16.7 90.9 0.0 45.5 16.7 22.0 0.0 25.0 15.9Somalia 60.0 20.0 100.0 63.6 41.7 57.1 0.0 0.0 0.0 25.0 6.3South Africa 80.0 50.0 100.0 54.5 91.7 75.2 50.0 50.7 26.2 100.0 56.7Sudan 80.0 20.0 100.0 54.5 50.0 60.9 0.0 0.0 0.0 12.5 3.1South Sudan 100.0 0.0 0.0 81.8 58.3 48.0 16.7 0.0 0.0 50.0 16.7Swaziland 100.0 0.0 16.7 54.5 25.0 39.2 16.7 33.2 0.0 50.0 25.0Tanzania 100.0 100 0.0 81.8 66.7 69.7 0.0 56.3 0.0 25.0 20.3Togo 100.0 100.0 100.0 27.3 0.0 65.5 16.7 17.6 0.0 28.1 15.6Tunisia 100.0 90.0 100.0 72.7 41.7 80.9 33.3 19.7 15.9 25.0 23.5Uganda 100.0 100.0 100.0 100.0 58.3 91.7 33.3 50.1 19.0 50.0 38.1Zambia 100.0 0.0 50.0 9.1 75.0 46.8 91.7 49.0 25.9 33.3 50.0Zimbabwe 80.0 0.0 16.7 36.4 16.7 29.9 0.0 0.0 0.0 50.0 12.5AFRICA 81.9 57.7 51.0 55.8 39.6 57.2 25.3 22.8 16.1 33.3 24.4
0 =< percentage of info < 20 20 =< percentage of info < 4040 =< percentage of info < 60 60=< percentage of info < 8080=< percentage of info =<100
0 =< percentage of info < 20 Very weak20 =< percentage of info < 40 Weak
40 =< percentage of info < 60 Average
60=< percentage of info < 80 Strong80=< percentage of info =<100 Very strong
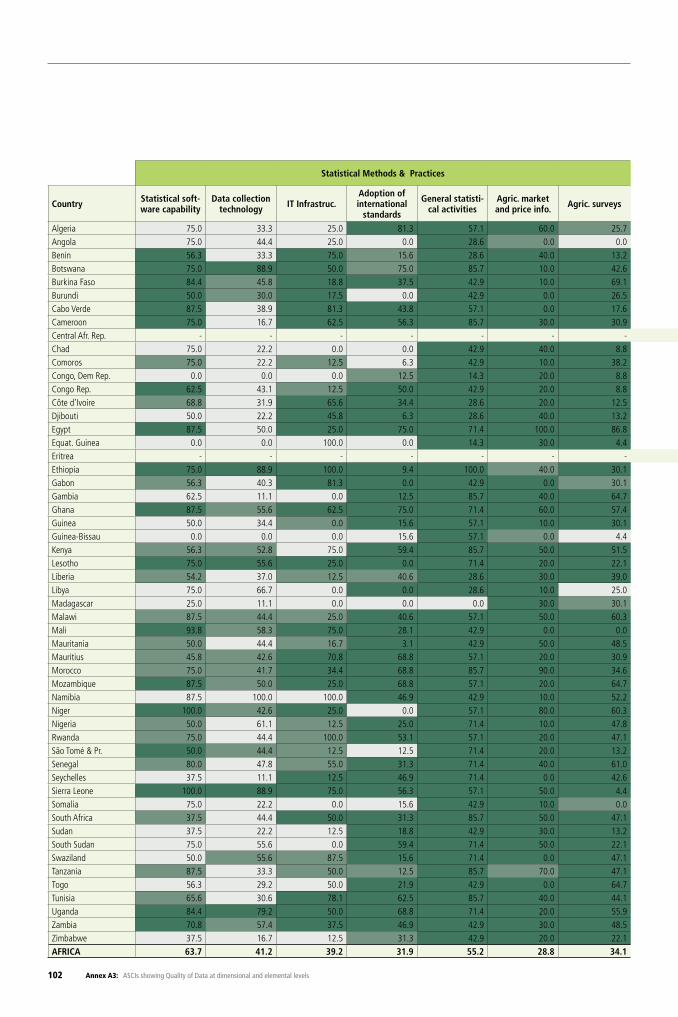
102 Annex A3: ASCIs showing Quality of Data at dimensional and elemental levels
Statistical Methods & Practices Statistical Methods & Practices Availability of Statistical Information Country level Indicator
Country Statistical soft-ware capability
Data collection technology IT Infrastruc.
Adoption of international
standards
General statisti-cal activities
Agric. market and price info. Agric. surveys Analysis and
use of dataQuality Con-sciousness
Dimension 3_Average
Core data availability Timeliness
Overall data quality per-
ception
Data accessibility
Dimension 4_Average Avg. Countries
Algeria 75.0 33.3 25.0 81.3 57.1 60.0 25.7 55.6 25.0 48.7 67.6 100.0 100.0 100.0 91.9 49.2Angola 75.0 44.4 25.0 0.0 28.6 0.0 0.0 22.2 0.0 21.7 3.5 0.0 0.0 16.7 5.0 20.1Benin 56.3 33.3 75.0 15.6 28.6 40.0 13.2 44.4 56.3 40.3 78.9 100.0 60.0 75.0 78.5 52.8Botswana 75.0 88.9 50.0 75.0 85.7 10.0 42.6 77.8 50.0 61.7 66.7 66.7 80.0 33.3 61.7 60.3Burkina Faso 84.4 45.8 18.8 37.5 42.9 10.0 69.1 55.6 46.9 45.7 82.5 100.0 80.0 87.5 87.5 58.6Burundi 50.0 30.0 17.5 0.0 42.9 0.0 26.5 11.1 62.5 26.7 29.8 66.7 60.0 73.3 57.5 35.3Cabo Verde 87.5 38.9 81.3 43.8 57.1 0.0 17.6 11.1 6.3 38.2 28.1 66.7 80.0 50.0 56.2 50.9Cameroon 75.0 16.7 62.5 56.3 85.7 30.0 30.9 33.3 0.0 43.4 47.4 66.7 40.0 100.0 63.5 52.3Central Afr. Rep. - - - - - - - - - - - - - - - -Chad 75.0 22.2 0.0 0.0 42.9 40.0 8.8 22.2 12.5 24.8 38.5 0.0 60.0 50.0 37.1 22.5Comoros 75.0 22.2 12.5 6.3 42.9 10.0 38.2 0.0 37.5 27.2 31.6 66.7 60.0 0.0 39.6 27.0Congo, Dem Rep. 0.0 0.0 0.0 12.5 14.3 20.0 8.8 33.3 25.0 12.7 36.8 66.7 80.0 0.0 45.9 30.1Congo Rep. 62.5 43.1 12.5 50.0 42.9 20.0 8.8 22.2 43.8 34.0 48.6 33.3 40.0 50.0 43.0 33.1Côte d’Ivoire 68.8 31.9 65.6 34.4 28.6 20.0 12.5 33.3 15.6 34.5 50.7 100.0 60.0 37.5 62.1 43.3Djibouti 50.0 22.2 45.8 6.3 28.6 40.0 13.2 22.2 33.3 29.1 45.6 100.0 80.0 44.4 67.5 38.6Egypt 87.5 50.0 25.0 75.0 71.4 100.0 86.8 88.9 50.0 70.5 85.5 66.7 100.0 83.3 83.9 62.9Equat. Guinea 0.0 0.0 100.0 0.0 14.3 30.0 4.4 33.3 0.0 20.2 3.9 100.0 40.0 0.0 36.0 25.1Eritrea - - - - - - - - - - - - - - - -Ethiopia 75.0 88.9 100.0 9.4 100.0 40.0 30.1 88.9 75.0 67.5 64.4 100.0 80.0 100.0 86.1 66.5Gabon 56.3 40.3 81.3 0.0 42.9 0.0 30.1 55.6 21.9 36.5 26.3 100.0 80.0 45.8 63.0 39.4Gambia 62.5 11.1 0.0 12.5 85.7 40.0 64.7 11.1 100.0 43.1 31.0 100.0 80.0 16.7 56.9 39.9Ghana 87.5 55.6 62.5 75.0 71.4 60.0 57.4 66.7 50.0 65.1 90.7 100.0 60.0 100.0 87.7 64.1Guinea 50.0 34.4 0.0 15.6 57.1 10.0 30.1 77.8 25.0 33.3 87.7 66.7 80.0 56.7 72.8 34.8Guinea-Bissau 0.0 0.0 0.0 15.6 57.1 0.0 4.4 11.1 0.0 9.8 20.3 66.7 80.0 0.0 41.7 16.3Kenya 56.3 52.8 75.0 59.4 85.7 50.0 51.5 66.7 25.0 58.0 62.9 100.0 40.0 75.0 69.5 57.1Lesotho 75.0 55.6 25.0 0.0 71.4 20.0 22.1 77.8 100.0 49.6 78.9 0.0 80.0 66.7 56.4 55.8Liberia 54.2 37.0 12.5 40.6 28.6 30.0 39.0 44.4 37.5 36.0 58.8 66.7 80.0 44.4 62.5 44.6Libya 75.0 66.7 0.0 0.0 28.6 10.0 25.0 0.0 0.0 22.8 0.0 0.0 0.0 100.0 25.0 17.3Madagascar 25.0 11.1 0.0 0.0 0.0 30.0 30.1 33.3 12.5 15.8 30.3 66.7 80.0 16.7 48.4 23.6Malawi 87.5 44.4 25.0 40.6 57.1 50.0 60.3 44.4 12.5 46.9 49.1 66.7 60.0 66.7 60.6 53.2Mali 93.8 58.3 75.0 28.1 42.9 0.0 0.0 44.4 50.0 43.6 82.5 100.0 80.0 75.0 84.4 52.7Mauritania 50.0 44.4 16.7 3.1 42.9 50.0 48.5 22.2 16.7 32.7 100.0 100.0 60.0 44.4 76.1 44.9Mauritius 45.8 42.6 70.8 68.8 57.1 20.0 30.9 33.3 29.2 44.3 56.8 100.0 80.0 22.2 64.7 61.0Morocco 75.0 41.7 34.4 68.8 85.7 90.0 34.6 44.4 21.9 55.2 87.7 100.0 100.0 70.8 89.6 54.5Mozambique 87.5 50.0 25.0 68.8 57.1 20.0 64.7 66.7 87.5 58.6 25.7 100.0 60.0 66.7 63.1 56.7Namibia 87.5 100.0 100.0 46.9 42.9 10.0 52.2 44.4 0.0 53.8 20.8 100.0 80.0 100.0 75.2 63.8Niger 100.0 42.6 25.0 0.0 57.1 80.0 60.3 77.8 62.5 56.1 91.2 66.7 60.0 100.0 79.5 56.8Nigeria 50.0 61.1 12.5 25.0 71.4 10.0 47.8 44.4 62.5 42.8 73.7 33.3 80.0 100.0 71.8 54.9Rwanda 75.0 44.4 100.0 53.1 57.1 20.0 47.1 66.7 50.0 57.0 55.4 100.0 80.0 16.7 63.0 62.5São Tomé & Pr. 50.0 44.4 12.5 12.5 71.4 20.0 13.2 66.7 25.0 35.1 73.7 66.7 60.0 50.0 62.6 44.2Senegal 80.0 47.8 55.0 31.3 71.4 40.0 61.0 55.6 30.0 52.4 80.0 100.0 60.0 43.3 70.8 55.0Seychelles 37.5 11.1 12.5 46.9 71.4 0.0 42.6 11.1 50.0 31.5 57.4 66.7 80.0 50.0 63.5 34.1Sierra Leone 100.0 88.9 75.0 56.3 57.1 50.0 4.4 88.9 12.5 59.2 42.1 66.7 60.0 100.0 67.2 49.7Somalia 75.0 22.2 0.0 15.6 42.9 10.0 0.0 44.4 0.0 23.3 0.0 0.0 0.0 100.0 25.0 28.2South Africa 37.5 44.4 50.0 31.3 85.7 50.0 47.1 77.8 87.5 56.8 45.9 100.0 100.0 83.3 82.3 65.6Sudan 37.5 22.2 12.5 18.8 42.9 30.0 13.2 22.2 37.5 26.3 70.2 100.0 60.0 16.7 61.7 36.4South Sudan 75.0 55.6 0.0 59.4 71.4 50.0 22.1 0.0 50.0 42.6 0.0 - - 66.7 33.3 37.8Swaziland 50.0 55.6 87.5 15.6 71.4 0.0 47.1 77.8 62.5 51.9 43.9 0.0 80.0 33.3 39.3 41.9Tanzania 87.5 33.3 50.0 12.5 85.7 70.0 47.1 55.6 43.8 53.9 45.6 66.7 80.0 83.3 68.9 54.1Togo 56.3 29.2 50.0 21.9 42.9 0.0 64.7 22.2 18.8 34.0 62.2 66.7 60.0 50.0 59.7 42.5Tunisia 65.6 30.6 78.1 62.5 85.7 40.0 44.1 88.9 3.1 55.4 53.4 100.0 100.0 50.0 75.9 59.1Uganda 84.4 79.2 50.0 68.8 71.4 20.0 55.9 22.2 68.8 57.8 56.1 66.7 80.0 29.2 58.0 62.0Zambia 70.8 57.4 37.5 46.9 42.9 30.0 48.5 11.1 33.3 42.0 43.9 100.0 100.0 44.4 72.1 50.0Zimbabwe 37.5 16.7 12.5 31.3 42.9 20.0 22.1 22.2 18.8 24.9 69.8 66.7 100.0 50.0 71.6 32.3AFRICA 63.7 41.2 39.2 31.9 55.2 28.8 34.1 43.4 35.5 41.4 51.6 72.5 69.0 56.5 62.1 -
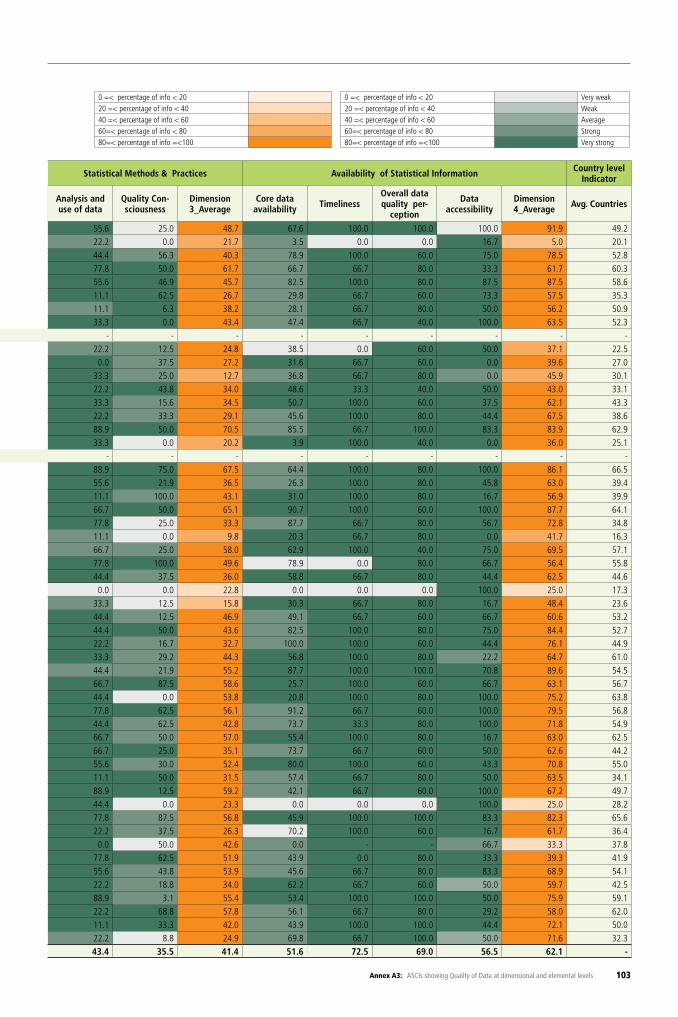
103Annex A3: ASCIs showing Quality of Data at dimensional and elemental levels
Statistical Methods & Practices Statistical Methods & Practices Availability of Statistical Information Country level Indicator
Country Statistical soft-ware capability
Data collection technology IT Infrastruc.
Adoption of international
standards
General statisti-cal activities
Agric. market and price info. Agric. surveys Analysis and
use of dataQuality Con-sciousness
Dimension 3_Average
Core data availability Timeliness
Overall data quality per-
ception
Data accessibility
Dimension 4_Average Avg. Countries
Algeria 75.0 33.3 25.0 81.3 57.1 60.0 25.7 55.6 25.0 48.7 67.6 100.0 100.0 100.0 91.9 49.2Angola 75.0 44.4 25.0 0.0 28.6 0.0 0.0 22.2 0.0 21.7 3.5 0.0 0.0 16.7 5.0 20.1Benin 56.3 33.3 75.0 15.6 28.6 40.0 13.2 44.4 56.3 40.3 78.9 100.0 60.0 75.0 78.5 52.8Botswana 75.0 88.9 50.0 75.0 85.7 10.0 42.6 77.8 50.0 61.7 66.7 66.7 80.0 33.3 61.7 60.3Burkina Faso 84.4 45.8 18.8 37.5 42.9 10.0 69.1 55.6 46.9 45.7 82.5 100.0 80.0 87.5 87.5 58.6Burundi 50.0 30.0 17.5 0.0 42.9 0.0 26.5 11.1 62.5 26.7 29.8 66.7 60.0 73.3 57.5 35.3Cabo Verde 87.5 38.9 81.3 43.8 57.1 0.0 17.6 11.1 6.3 38.2 28.1 66.7 80.0 50.0 56.2 50.9Cameroon 75.0 16.7 62.5 56.3 85.7 30.0 30.9 33.3 0.0 43.4 47.4 66.7 40.0 100.0 63.5 52.3Central Afr. Rep. - - - - - - - - - - - - - - - -Chad 75.0 22.2 0.0 0.0 42.9 40.0 8.8 22.2 12.5 24.8 38.5 0.0 60.0 50.0 37.1 22.5Comoros 75.0 22.2 12.5 6.3 42.9 10.0 38.2 0.0 37.5 27.2 31.6 66.7 60.0 0.0 39.6 27.0Congo, Dem Rep. 0.0 0.0 0.0 12.5 14.3 20.0 8.8 33.3 25.0 12.7 36.8 66.7 80.0 0.0 45.9 30.1Congo Rep. 62.5 43.1 12.5 50.0 42.9 20.0 8.8 22.2 43.8 34.0 48.6 33.3 40.0 50.0 43.0 33.1Côte d’Ivoire 68.8 31.9 65.6 34.4 28.6 20.0 12.5 33.3 15.6 34.5 50.7 100.0 60.0 37.5 62.1 43.3Djibouti 50.0 22.2 45.8 6.3 28.6 40.0 13.2 22.2 33.3 29.1 45.6 100.0 80.0 44.4 67.5 38.6Egypt 87.5 50.0 25.0 75.0 71.4 100.0 86.8 88.9 50.0 70.5 85.5 66.7 100.0 83.3 83.9 62.9Equat. Guinea 0.0 0.0 100.0 0.0 14.3 30.0 4.4 33.3 0.0 20.2 3.9 100.0 40.0 0.0 36.0 25.1Eritrea - - - - - - - - - - - - - - - -Ethiopia 75.0 88.9 100.0 9.4 100.0 40.0 30.1 88.9 75.0 67.5 64.4 100.0 80.0 100.0 86.1 66.5Gabon 56.3 40.3 81.3 0.0 42.9 0.0 30.1 55.6 21.9 36.5 26.3 100.0 80.0 45.8 63.0 39.4Gambia 62.5 11.1 0.0 12.5 85.7 40.0 64.7 11.1 100.0 43.1 31.0 100.0 80.0 16.7 56.9 39.9Ghana 87.5 55.6 62.5 75.0 71.4 60.0 57.4 66.7 50.0 65.1 90.7 100.0 60.0 100.0 87.7 64.1Guinea 50.0 34.4 0.0 15.6 57.1 10.0 30.1 77.8 25.0 33.3 87.7 66.7 80.0 56.7 72.8 34.8Guinea-Bissau 0.0 0.0 0.0 15.6 57.1 0.0 4.4 11.1 0.0 9.8 20.3 66.7 80.0 0.0 41.7 16.3Kenya 56.3 52.8 75.0 59.4 85.7 50.0 51.5 66.7 25.0 58.0 62.9 100.0 40.0 75.0 69.5 57.1Lesotho 75.0 55.6 25.0 0.0 71.4 20.0 22.1 77.8 100.0 49.6 78.9 0.0 80.0 66.7 56.4 55.8Liberia 54.2 37.0 12.5 40.6 28.6 30.0 39.0 44.4 37.5 36.0 58.8 66.7 80.0 44.4 62.5 44.6Libya 75.0 66.7 0.0 0.0 28.6 10.0 25.0 0.0 0.0 22.8 0.0 0.0 0.0 100.0 25.0 17.3Madagascar 25.0 11.1 0.0 0.0 0.0 30.0 30.1 33.3 12.5 15.8 30.3 66.7 80.0 16.7 48.4 23.6Malawi 87.5 44.4 25.0 40.6 57.1 50.0 60.3 44.4 12.5 46.9 49.1 66.7 60.0 66.7 60.6 53.2Mali 93.8 58.3 75.0 28.1 42.9 0.0 0.0 44.4 50.0 43.6 82.5 100.0 80.0 75.0 84.4 52.7Mauritania 50.0 44.4 16.7 3.1 42.9 50.0 48.5 22.2 16.7 32.7 100.0 100.0 60.0 44.4 76.1 44.9Mauritius 45.8 42.6 70.8 68.8 57.1 20.0 30.9 33.3 29.2 44.3 56.8 100.0 80.0 22.2 64.7 61.0Morocco 75.0 41.7 34.4 68.8 85.7 90.0 34.6 44.4 21.9 55.2 87.7 100.0 100.0 70.8 89.6 54.5Mozambique 87.5 50.0 25.0 68.8 57.1 20.0 64.7 66.7 87.5 58.6 25.7 100.0 60.0 66.7 63.1 56.7Namibia 87.5 100.0 100.0 46.9 42.9 10.0 52.2 44.4 0.0 53.8 20.8 100.0 80.0 100.0 75.2 63.8Niger 100.0 42.6 25.0 0.0 57.1 80.0 60.3 77.8 62.5 56.1 91.2 66.7 60.0 100.0 79.5 56.8Nigeria 50.0 61.1 12.5 25.0 71.4 10.0 47.8 44.4 62.5 42.8 73.7 33.3 80.0 100.0 71.8 54.9Rwanda 75.0 44.4 100.0 53.1 57.1 20.0 47.1 66.7 50.0 57.0 55.4 100.0 80.0 16.7 63.0 62.5São Tomé & Pr. 50.0 44.4 12.5 12.5 71.4 20.0 13.2 66.7 25.0 35.1 73.7 66.7 60.0 50.0 62.6 44.2Senegal 80.0 47.8 55.0 31.3 71.4 40.0 61.0 55.6 30.0 52.4 80.0 100.0 60.0 43.3 70.8 55.0Seychelles 37.5 11.1 12.5 46.9 71.4 0.0 42.6 11.1 50.0 31.5 57.4 66.7 80.0 50.0 63.5 34.1Sierra Leone 100.0 88.9 75.0 56.3 57.1 50.0 4.4 88.9 12.5 59.2 42.1 66.7 60.0 100.0 67.2 49.7Somalia 75.0 22.2 0.0 15.6 42.9 10.0 0.0 44.4 0.0 23.3 0.0 0.0 0.0 100.0 25.0 28.2South Africa 37.5 44.4 50.0 31.3 85.7 50.0 47.1 77.8 87.5 56.8 45.9 100.0 100.0 83.3 82.3 65.6Sudan 37.5 22.2 12.5 18.8 42.9 30.0 13.2 22.2 37.5 26.3 70.2 100.0 60.0 16.7 61.7 36.4South Sudan 75.0 55.6 0.0 59.4 71.4 50.0 22.1 0.0 50.0 42.6 0.0 - - 66.7 33.3 37.8Swaziland 50.0 55.6 87.5 15.6 71.4 0.0 47.1 77.8 62.5 51.9 43.9 0.0 80.0 33.3 39.3 41.9Tanzania 87.5 33.3 50.0 12.5 85.7 70.0 47.1 55.6 43.8 53.9 45.6 66.7 80.0 83.3 68.9 54.1Togo 56.3 29.2 50.0 21.9 42.9 0.0 64.7 22.2 18.8 34.0 62.2 66.7 60.0 50.0 59.7 42.5Tunisia 65.6 30.6 78.1 62.5 85.7 40.0 44.1 88.9 3.1 55.4 53.4 100.0 100.0 50.0 75.9 59.1Uganda 84.4 79.2 50.0 68.8 71.4 20.0 55.9 22.2 68.8 57.8 56.1 66.7 80.0 29.2 58.0 62.0Zambia 70.8 57.4 37.5 46.9 42.9 30.0 48.5 11.1 33.3 42.0 43.9 100.0 100.0 44.4 72.1 50.0Zimbabwe 37.5 16.7 12.5 31.3 42.9 20.0 22.1 22.2 18.8 24.9 69.8 66.7 100.0 50.0 71.6 32.3AFRICA 63.7 41.2 39.2 31.9 55.2 28.8 34.1 43.4 35.5 41.4 51.6 72.5 69.0 56.5 62.1 -
0 =< percentage of info < 20 20 =< percentage of info < 4040 =< percentage of info < 60 60=< percentage of info < 8080=< percentage of info =<100
0 =< percentage of info < 20 Very weak20 =< percentage of info < 40 Weak40 =< percentage of info < 60 Average60=< percentage of info < 80 Strong80=< percentage of info =<100 Very strong
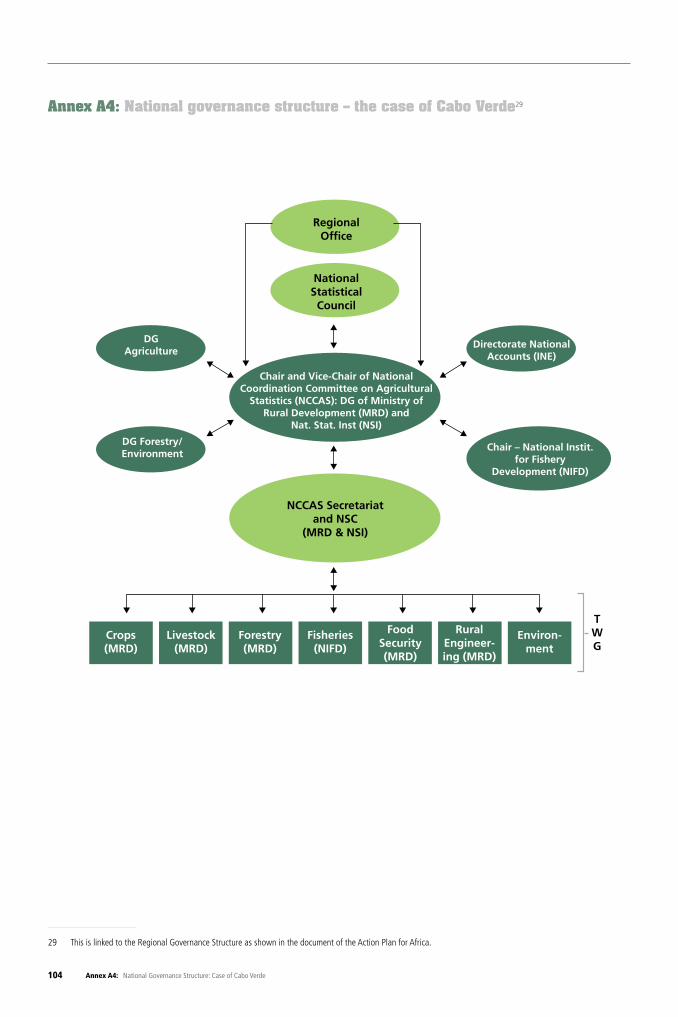
104 Annex A4: National Governance Structure: Case of Cabo Verde
Annex A4: National governance structure – the case of Cabo Verde29
29 This is linked to the Regional Governance Structure as shown in the document of the Action Plan for Africa.
Crops (MRD)
Livestock(MRD)
Forestry(MRD)
Fisheries (NIFD)
Food Security (MRD)
Rural Engineer-ing (MRD)
Environ-ment
NCCAS Secretariat and NSC
(MRD & NSI)
Chair and Vice-Chair of National Coordination Committee on Agricultural
Statistics (NCCAS): DG of Ministry of Rural Development (MRD) and
Nat. Stat. Inst (NSI)
National Statistical
Council
DGAgriculture
Directorate National Accounts (INE)
DG Forestry/ Environment
Chair – National Instit. for Fishery
Development (NIFD)
TWG
RegionalOffice
Country Assessment of Agricultural Statistical Systems in Africa Measuring the Capacity of African Countries to Produce Timely, Reliable and Sustainable Agricultural Statistics 105
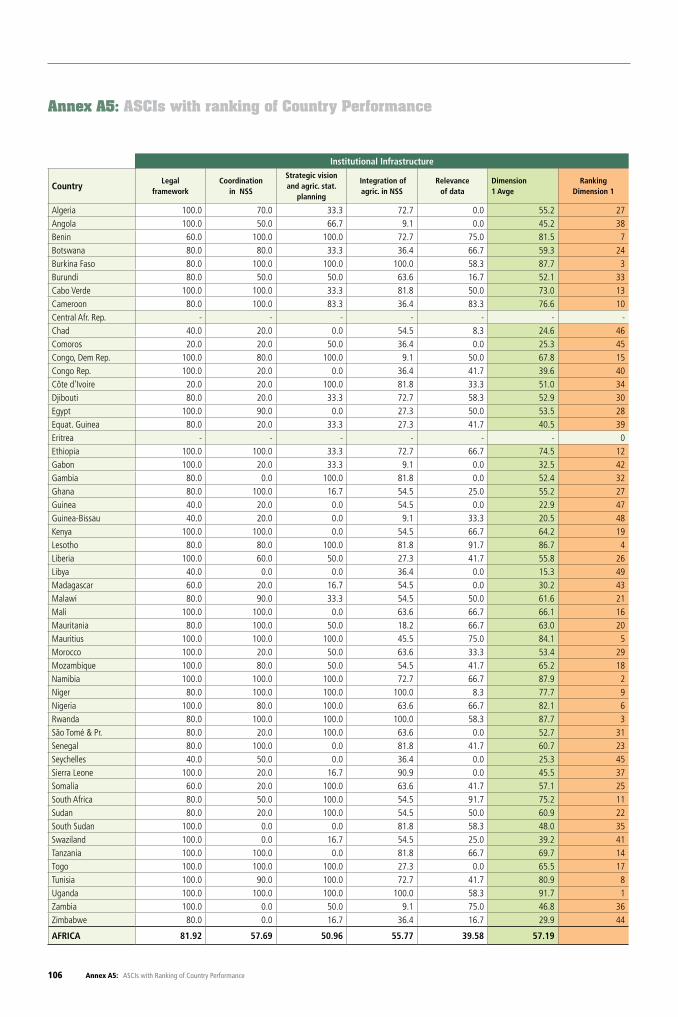
106 Annex A5: ASCIs with Ranking of Country Performance
Annex A5: ASCIs with ranking of Country Performance
Institutional Infrastructure Resources
CountryLegal
framework Coordination
in NSS
Strategic vision and agric. stat.
planning
Integration of agric. in NSS
Relevance of data
Dimension 1 Avge
Ranking Dimension 1
Financial resources Human res: staffing Human res: training Physical infrastructure Dimension 2 Avge Ranking Dimension 2
Algeria 100.0 70.0 33.3 72.7 0.0 55.2 27 0.0 0.0 0.0 0.0 0.0 45Angola 100.0 50.0 66.7 9.1 0.0 45.2 38 0.0 0.0 0.0 0.0 0.0 45Benin 60.0 100.0 100.0 72.7 75.0 81.5 7 8.3 25.0 6.4 37.5 19.3 29Botswana 80.0 80.0 33.3 36.4 66.7 59.3 24 33.3 69.2 50.0 75.0 56.9 2Burkina Faso 80.0 100.0 100.0 100.0 58.3 87.7 3 50.0 18.3 6.3 15.6 22.6 26Burundi 80.0 50.0 50.0 63.6 16.7 52.1 33 8.3 13.8 0.0 25.0 11.8 40Cabo Verde 100.0 100.0 33.3 81.8 50.0 73.0 13 75.0 43.8 23.8 43.8 46.6 7Cameroon 80.0 100.0 83.3 36.4 83.3 76.6 10 8.3 50.0 38.8 25.0 30.5 21Central Afr. Rep. - - - - - - - - - - - - -Chad 40.0 20.0 0.0 54.5 8.3 24.6 46 0.0 0.0 0.0 0.0 0.0 45Comoros 20.0 20.0 50.0 36.4 0.0 25.3 45 25.0 14.3 0.0 25.0 16.1 33Congo, Dem Rep. 100.0 80.0 100.0 9.1 50.0 67.8 15 0.0 0.0 0.0 25.0 6.3 43Congo Rep. 100.0 20.0 0.0 36.4 41.7 39.6 40 25.0 9.2 6.0 12.5 13.2 37Côte d'Ivoire 20.0 20.0 100.0 81.8 33.3 51.0 34 41.7 16.6 43.0 37.5 34.7 15Djibouti 80.0 20.0 33.3 72.7 58.3 52.9 30 33.3 14.6 0.0 4.2 13.0 38Egypt 100.0 90.0 0.0 27.3 50.0 53.5 28 8.3 50.0 37.7 50.0 36.5 12Equat. Guinea 80.0 20.0 33.3 27.3 41.7 40.5 39 0.0 0.0 25.0 0.0 6.3 43Eritrea - - - - - - 0 - - - - - 0Ethiopia 100.0 100.0 33.3 72.7 66.7 74.5 12 41.7 0.6 96.3 0.0 34.6 16Gabon 100.0 20.0 33.3 9.1 0.0 32.5 42 41.7 36.0 44.0 3.1 31.2 20Gambia 80.0 0.0 100.0 81.8 0.0 52.4 32 0.0 0.0 0.0 0.0 0.0 45Ghana 80.0 100.0 16.7 54.5 25.0 55.2 27 66.7 62.5 18.2 50.0 49.4 5Guinea 40.0 20.0 0.0 54.5 0.0 22.9 47 25.0 12.6 15.4 7.5 15.1 36Guinea-Bissau 40.0 20.0 0.0 9.1 33.3 20.5 48 0.0 0.0 0.0 0.0 0.0 45Kenya 100.0 100.0 0.0 54.5 66.7 64.2 19 25.0 13.0 46.9 50.0 33.7 17Lesotho 80.0 80.0 100.0 81.8 91.7 86.7 4 16.7 27.8 51.5 25.0 30.2 22Liberia 100.0 60.0 50.0 27.3 41.7 55.8 26 16.7 54.2 8.3 50.0 32.3 18Libya 40.0 0.0 0.0 36.4 0.0 15.3 49 0.0 0.0 0.0 0.0 0.0 45Madagascar 60.0 20.0 16.7 54.5 0.0 30.2 43 0.0 18.8 0.0 12.5 7.8 42Malawi 80.0 90.0 33.3 54.5 50.0 61.6 21 58.3 50.6 13.4 75.0 49.3 6Mali 100.0 100.0 0.0 63.6 66.7 66.1 16 41.7 24.4 7.3 25.0 24.6 24Mauritania 80.0 100.0 50.0 18.2 66.7 63.0 20 8.3 14.8 0.0 50.0 18.3 31Mauritius 100.0 100.0 100.0 45.5 75.0 84.1 5 66.7 51.0 59.4 87.5 66.1 1Morocco 100.0 20.0 50.0 63.6 33.3 53.4 29 25.0 20.0 6.4 25.0 19.1 30Mozambique 100.0 80.0 50.0 54.5 41.7 65.2 18 66.7 11.6 25.4 37.5 35.3 14Namibia 100.0 100.0 100.0 72.7 66.7 87.9 2 50.0 56.8 22.5 50.0 44.8 8Niger 80.0 100.0 100.0 100.0 8.3 77.7 9 0.0 0.0 0.0 37.5 9.4 41Nigeria 100.0 80.0 100.0 63.6 66.7 82.1 6 25.0 37.5 0.0 62.5 31.3 19Rwanda 80.0 100.0 100.0 100.0 58.3 87.7 3 50.0 25.7 45.8 50.0 42.9 9São Tomé & Pr. 80.0 20.0 100.0 63.6 0.0 52.7 31 16.7 9.4 41.7 75.0 35.7 13Senegal 80.0 100.0 0.0 81.8 41.7 60.7 23 58.3 22.1 12.6 57.5 37.6 11Seychelles 40.0 50.0 0.0 36.4 0.0 25.3 45 25.0 12.5 0.0 50.0 21.9 27Sierra Leone 100.0 20.0 16.7 90.9 0.0 45.5 37 16.7 22.0 0.0 25.0 15.9 34Somalia 60.0 20.0 100.0 63.6 41.7 57.1 25 0.0 0.0 0.0 25.0 6.3 43South Africa 80.0 50.0 100.0 54.5 91.7 75.2 11 50.0 50.7 26.2 100.0 56.7 3Sudan 80.0 20.0 100.0 54.5 50.0 60.9 22 0.0 0.0 0.0 12.5 3.1 44South Sudan 100.0 0.0 0.0 81.8 58.3 48.0 35 16.7 0.0 0.0 50.0 16.7 32Swaziland 100.0 0.0 16.7 54.5 25.0 39.2 41 16.7 33.2 0.0 50.0 25.0 23Tanzania 100.0 100.0 0.0 81.8 66.7 69.7 14 0.0 56.3 0.0 25.0 20.3 28Togo 100.0 100.0 100.0 27.3 0.0 65.5 17 16.7 17.6 0.0 28.1 15.6 35Tunisia 100.0 90.0 100.0 72.7 41.7 80.9 8 33.3 19.7 15.9 25.0 23.5 25Uganda 100.0 100.0 100.0 100.0 58.3 91.7 1 33.3 50.1 19.0 50.0 38.1 10Zambia 100.0 0.0 50.0 9.1 75.0 46.8 36 91.7 49.0 25.9 33.3 50.0 4Zimbabwe 80.0 0.0 16.7 36.4 16.7 29.9 44 0.0 0.0 0.0 50.0 12.5 39
AFRICA 81.92 57.69 50.96 55.77 39.58 57.19 25.32 22.79 16.13 33.28 24.38
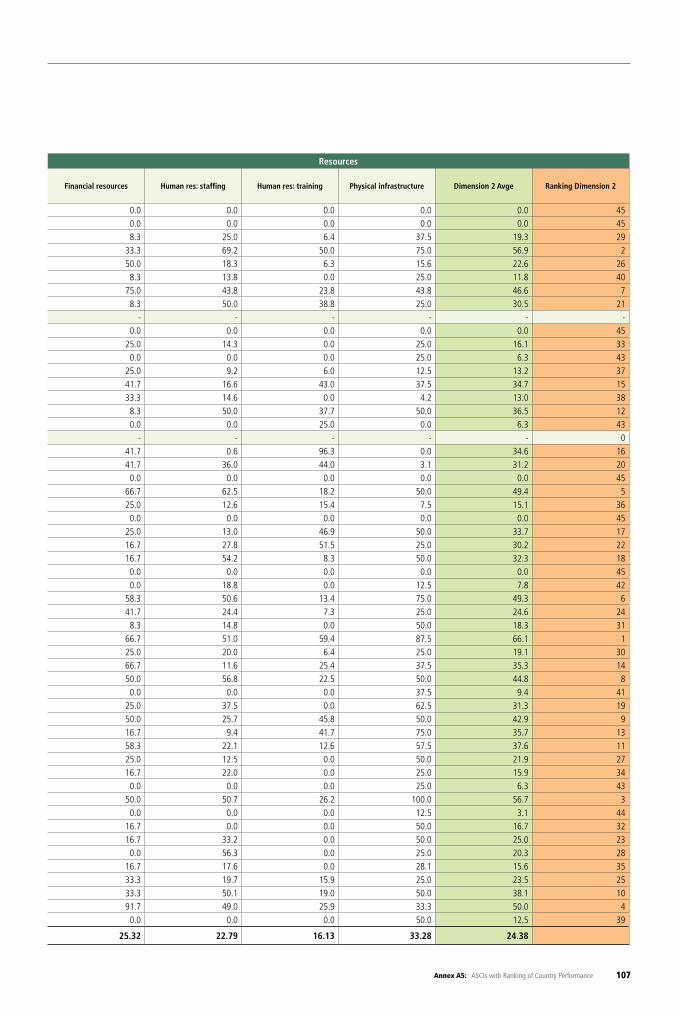
107Annex A5: ASCIs with Ranking of Country Performance
Institutional Infrastructure Resources
CountryLegal
framework Coordination
in NSS
Strategic vision and agric. stat.
planning
Integration of agric. in NSS
Relevance of data
Dimension 1 Avge
Ranking Dimension 1
Financial resources Human res: staffing Human res: training Physical infrastructure Dimension 2 Avge Ranking Dimension 2
Algeria 100.0 70.0 33.3 72.7 0.0 55.2 27 0.0 0.0 0.0 0.0 0.0 45Angola 100.0 50.0 66.7 9.1 0.0 45.2 38 0.0 0.0 0.0 0.0 0.0 45Benin 60.0 100.0 100.0 72.7 75.0 81.5 7 8.3 25.0 6.4 37.5 19.3 29Botswana 80.0 80.0 33.3 36.4 66.7 59.3 24 33.3 69.2 50.0 75.0 56.9 2Burkina Faso 80.0 100.0 100.0 100.0 58.3 87.7 3 50.0 18.3 6.3 15.6 22.6 26Burundi 80.0 50.0 50.0 63.6 16.7 52.1 33 8.3 13.8 0.0 25.0 11.8 40Cabo Verde 100.0 100.0 33.3 81.8 50.0 73.0 13 75.0 43.8 23.8 43.8 46.6 7Cameroon 80.0 100.0 83.3 36.4 83.3 76.6 10 8.3 50.0 38.8 25.0 30.5 21Central Afr. Rep. - - - - - - - - - - - - -Chad 40.0 20.0 0.0 54.5 8.3 24.6 46 0.0 0.0 0.0 0.0 0.0 45Comoros 20.0 20.0 50.0 36.4 0.0 25.3 45 25.0 14.3 0.0 25.0 16.1 33Congo, Dem Rep. 100.0 80.0 100.0 9.1 50.0 67.8 15 0.0 0.0 0.0 25.0 6.3 43Congo Rep. 100.0 20.0 0.0 36.4 41.7 39.6 40 25.0 9.2 6.0 12.5 13.2 37Côte d'Ivoire 20.0 20.0 100.0 81.8 33.3 51.0 34 41.7 16.6 43.0 37.5 34.7 15Djibouti 80.0 20.0 33.3 72.7 58.3 52.9 30 33.3 14.6 0.0 4.2 13.0 38Egypt 100.0 90.0 0.0 27.3 50.0 53.5 28 8.3 50.0 37.7 50.0 36.5 12Equat. Guinea 80.0 20.0 33.3 27.3 41.7 40.5 39 0.0 0.0 25.0 0.0 6.3 43Eritrea - - - - - - 0 - - - - - 0Ethiopia 100.0 100.0 33.3 72.7 66.7 74.5 12 41.7 0.6 96.3 0.0 34.6 16Gabon 100.0 20.0 33.3 9.1 0.0 32.5 42 41.7 36.0 44.0 3.1 31.2 20Gambia 80.0 0.0 100.0 81.8 0.0 52.4 32 0.0 0.0 0.0 0.0 0.0 45Ghana 80.0 100.0 16.7 54.5 25.0 55.2 27 66.7 62.5 18.2 50.0 49.4 5Guinea 40.0 20.0 0.0 54.5 0.0 22.9 47 25.0 12.6 15.4 7.5 15.1 36Guinea-Bissau 40.0 20.0 0.0 9.1 33.3 20.5 48 0.0 0.0 0.0 0.0 0.0 45Kenya 100.0 100.0 0.0 54.5 66.7 64.2 19 25.0 13.0 46.9 50.0 33.7 17Lesotho 80.0 80.0 100.0 81.8 91.7 86.7 4 16.7 27.8 51.5 25.0 30.2 22Liberia 100.0 60.0 50.0 27.3 41.7 55.8 26 16.7 54.2 8.3 50.0 32.3 18Libya 40.0 0.0 0.0 36.4 0.0 15.3 49 0.0 0.0 0.0 0.0 0.0 45Madagascar 60.0 20.0 16.7 54.5 0.0 30.2 43 0.0 18.8 0.0 12.5 7.8 42Malawi 80.0 90.0 33.3 54.5 50.0 61.6 21 58.3 50.6 13.4 75.0 49.3 6Mali 100.0 100.0 0.0 63.6 66.7 66.1 16 41.7 24.4 7.3 25.0 24.6 24Mauritania 80.0 100.0 50.0 18.2 66.7 63.0 20 8.3 14.8 0.0 50.0 18.3 31Mauritius 100.0 100.0 100.0 45.5 75.0 84.1 5 66.7 51.0 59.4 87.5 66.1 1Morocco 100.0 20.0 50.0 63.6 33.3 53.4 29 25.0 20.0 6.4 25.0 19.1 30Mozambique 100.0 80.0 50.0 54.5 41.7 65.2 18 66.7 11.6 25.4 37.5 35.3 14Namibia 100.0 100.0 100.0 72.7 66.7 87.9 2 50.0 56.8 22.5 50.0 44.8 8Niger 80.0 100.0 100.0 100.0 8.3 77.7 9 0.0 0.0 0.0 37.5 9.4 41Nigeria 100.0 80.0 100.0 63.6 66.7 82.1 6 25.0 37.5 0.0 62.5 31.3 19Rwanda 80.0 100.0 100.0 100.0 58.3 87.7 3 50.0 25.7 45.8 50.0 42.9 9São Tomé & Pr. 80.0 20.0 100.0 63.6 0.0 52.7 31 16.7 9.4 41.7 75.0 35.7 13Senegal 80.0 100.0 0.0 81.8 41.7 60.7 23 58.3 22.1 12.6 57.5 37.6 11Seychelles 40.0 50.0 0.0 36.4 0.0 25.3 45 25.0 12.5 0.0 50.0 21.9 27Sierra Leone 100.0 20.0 16.7 90.9 0.0 45.5 37 16.7 22.0 0.0 25.0 15.9 34Somalia 60.0 20.0 100.0 63.6 41.7 57.1 25 0.0 0.0 0.0 25.0 6.3 43South Africa 80.0 50.0 100.0 54.5 91.7 75.2 11 50.0 50.7 26.2 100.0 56.7 3Sudan 80.0 20.0 100.0 54.5 50.0 60.9 22 0.0 0.0 0.0 12.5 3.1 44South Sudan 100.0 0.0 0.0 81.8 58.3 48.0 35 16.7 0.0 0.0 50.0 16.7 32Swaziland 100.0 0.0 16.7 54.5 25.0 39.2 41 16.7 33.2 0.0 50.0 25.0 23Tanzania 100.0 100.0 0.0 81.8 66.7 69.7 14 0.0 56.3 0.0 25.0 20.3 28Togo 100.0 100.0 100.0 27.3 0.0 65.5 17 16.7 17.6 0.0 28.1 15.6 35Tunisia 100.0 90.0 100.0 72.7 41.7 80.9 8 33.3 19.7 15.9 25.0 23.5 25Uganda 100.0 100.0 100.0 100.0 58.3 91.7 1 33.3 50.1 19.0 50.0 38.1 10Zambia 100.0 0.0 50.0 9.1 75.0 46.8 36 91.7 49.0 25.9 33.3 50.0 4Zimbabwe 80.0 0.0 16.7 36.4 16.7 29.9 44 0.0 0.0 0.0 50.0 12.5 39
AFRICA 81.92 57.69 50.96 55.77 39.58 57.19 25.32 22.79 16.13 33.28 24.38
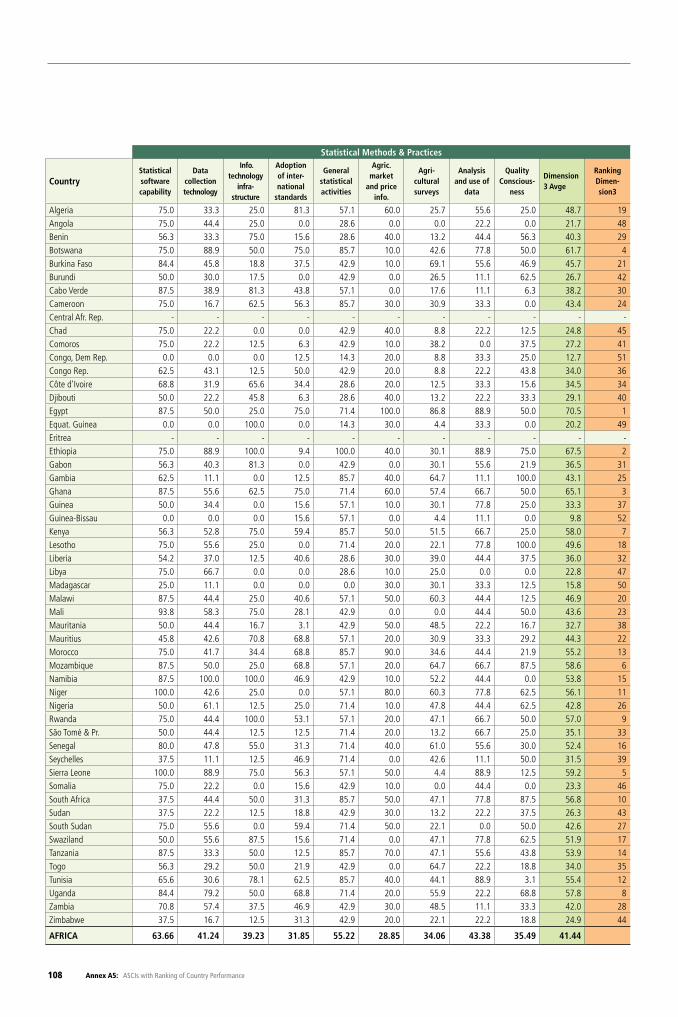
108 Annex A5: ASCIs with Ranking of Country Performance
Statistical Methods & Practices Availability of Statistical Information
Overall AvgeRanking
overall AvgeCountryStatistical software capability
Data collection technology
Info. technology
infra- structure
Adoption of inter-national
standards
General statistical activities
Agric. market
and price info.
Agri- cultural surveys
Analysis and use of
data
Quality Conscious-
ness
Dimension 3 Avge
Ranking Dimen-sion3
Core data availability
TimelinessOverall data
quality perception
Data accessibility
Dimension 4 AvgeRanking
Dimension4
Algeria 75.0 33.3 25.0 81.3 57.1 60.0 25.7 55.6 25.0 48.7 19 67.6 100.0 100.0 100.0 91.9 1 49.2 27Angola 75.0 44.4 25.0 0.0 28.6 0.0 0.0 22.2 0.0 21.7 48 3.5 0.0 0.0 16.7 5.0 48 20.1 50Benin 56.3 33.3 75.0 15.6 28.6 40.0 13.2 44.4 56.3 40.3 29 78.9 100.0 60.0 75.0 78.5 10 52.8 21Botswana 75.0 88.9 50.0 75.0 85.7 10.0 42.6 77.8 50.0 61.7 4 66.7 66.7 80.0 33.3 61.7 30 60.3 9Burkina Faso 84.4 45.8 18.8 37.5 42.9 10.0 69.1 55.6 46.9 45.7 21 82.5 100.0 80.0 87.5 87.5 4 58.6 11Burundi 50.0 30.0 17.5 0.0 42.9 0.0 26.5 11.1 62.5 26.7 42 29.8 66.7 60.0 73.3 57.5 34 35.3 39Cabo Verde 87.5 38.9 81.3 43.8 57.1 0.0 17.6 11.1 6.3 38.2 30 28.1 66.7 80.0 50.0 56.2 37 50.9 24Cameroon 75.0 16.7 62.5 56.3 85.7 30.0 30.9 33.3 0.0 43.4 24 47.4 66.7 40.0 100.0 63.5 24 52.3 23Central Afr. Rep. - - - - - - - - - - - - - - - - - - -Chad 75.0 22.2 0.0 0.0 42.9 40.0 8.8 22.2 12.5 24.8 45 38.5 0.0 60.0 50.0 37.1 44 22.5 49Comoros 75.0 22.2 12.5 6.3 42.9 10.0 38.2 0.0 37.5 27.2 41 31.6 66.7 60.0 0.0 39.6 42 27.0 46Congo, Dem Rep. 0.0 0.0 0.0 12.5 14.3 20.0 8.8 33.3 25.0 12.7 51 36.8 66.7 80.0 0.0 45.9 39 30.1 44Congo Rep. 62.5 43.1 12.5 50.0 42.9 20.0 8.8 22.2 43.8 34.0 36 48.6 33.3 40.0 50.0 43.0 40 33.1 42Côte d'Ivoire 68.8 31.9 65.6 34.4 28.6 20.0 12.5 33.3 15.6 34.5 34 50.7 100.0 60.0 37.5 62.1 29 43.3 31Djibouti 50.0 22.2 45.8 6.3 28.6 40.0 13.2 22.2 33.3 29.1 40 45.6 100.0 80.0 44.4 67.5 21 38.6 36Egypt 87.5 50.0 25.0 75.0 71.4 100.0 86.8 88.9 50.0 70.5 1 85.5 66.7 100.0 83.3 83.9 7 62.9 5Equat. Guinea 0.0 0.0 100.0 0.0 14.3 30.0 4.4 33.3 0.0 20.2 49 3.9 100.0 40.0 0.0 36.0 45 25.1 47Eritrea - - - - - - - - - - - - - - - - - - -Ethiopia 75.0 88.9 100.0 9.4 100.0 40.0 30.1 88.9 75.0 67.5 2 64.4 100.0 80.0 100.0 86.1 5 66.5 1Gabon 56.3 40.3 81.3 0.0 42.9 0.0 30.1 55.6 21.9 36.5 31 26.3 100.0 80.0 45.8 63.0 26 39.4 35Gambia 62.5 11.1 0.0 12.5 85.7 40.0 64.7 11.1 100.0 43.1 25 31.0 100.0 80.0 16.7 56.9 35 39.9 34Ghana 87.5 55.6 62.5 75.0 71.4 60.0 57.4 66.7 50.0 65.1 3 90.7 100.0 60.0 100.0 87.7 3 64.1 3Guinea 50.0 34.4 0.0 15.6 57.1 10.0 30.1 77.8 25.0 33.3 37 87.7 66.7 80.0 56.7 72.8 14 34.8 40Guinea-Bissau 0.0 0.0 0.0 15.6 57.1 0.0 4.4 11.1 0.0 9.8 52 20.3 66.7 80.0 0.0 41.7 41 16.3 52Kenya 56.3 52.8 75.0 59.4 85.7 50.0 51.5 66.7 25.0 58.0 7 62.9 100.0 40.0 75.0 69.5 19 57.1 12Lesotho 75.0 55.6 25.0 0.0 71.4 20.0 22.1 77.8 100.0 49.6 18 78.9 0.0 80.0 66.7 56.4 36 55.8 15Liberia 54.2 37.0 12.5 40.6 28.6 30.0 39.0 44.4 37.5 36.0 32 58.8 66.7 80.0 44.4 62.5 28 44.6 29Libya 75.0 66.7 0.0 0.0 28.6 10.0 25.0 0.0 0.0 22.8 47 0.0 0.0 0.0 100.0 25.0 47 17.3 51Madagascar 25.0 11.1 0.0 0.0 0.0 30.0 30.1 33.3 12.5 15.8 50 30.3 66.7 80.0 16.7 48.4 38 23.6 48Malawi 87.5 44.4 25.0 40.6 57.1 50.0 60.3 44.4 12.5 46.9 20 49.1 66.7 60.0 66.7 60.6 31 53.2 20Mali 93.8 58.3 75.0 28.1 42.9 0.0 0.0 44.4 50.0 43.6 23 82.5 100.0 80.0 75.0 84.4 6 52.7 22Mauritania 50.0 44.4 16.7 3.1 42.9 50.0 48.5 22.2 16.7 32.7 38 100.0 100.0 60.0 44.4 76.1 11 44.9 28Mauritius 45.8 42.6 70.8 68.8 57.1 20.0 30.9 33.3 29.2 44.3 22 56.8 100.0 80.0 22.2 64.7 23 61.0 8Morocco 75.0 41.7 34.4 68.8 85.7 90.0 34.6 44.4 21.9 55.2 13 87.7 100.0 100.0 70.8 89.6 2 54.5 18Mozambique 87.5 50.0 25.0 68.8 57.1 20.0 64.7 66.7 87.5 58.6 6 25.7 100.0 60.0 66.7 63.1 25 56.7 14Namibia 87.5 100.0 100.0 46.9 42.9 10.0 52.2 44.4 0.0 53.8 15 20.8 100.0 80.0 100.0 75.2 13 63.8 4Niger 100.0 42.6 25.0 0.0 57.1 80.0 60.3 77.8 62.5 56.1 11 91.2 66.7 60.0 100.0 79.5 9 56.8 13Nigeria 50.0 61.1 12.5 25.0 71.4 10.0 47.8 44.4 62.5 42.8 26 73.7 33.3 80.0 100.0 71.8 16 54.9 17Rwanda 75.0 44.4 100.0 53.1 57.1 20.0 47.1 66.7 50.0 57.0 9 55.4 100.0 80.0 16.7 63.0 26 62.5 6São Tomé & Pr. 50.0 44.4 12.5 12.5 71.4 20.0 13.2 66.7 25.0 35.1 33 73.7 66.7 60.0 50.0 62.6 27 44.2 30Senegal 80.0 47.8 55.0 31.3 71.4 40.0 61.0 55.6 30.0 52.4 16 80.0 100.0 60.0 43.3 70.8 18 55.0 16Seychelles 37.5 11.1 12.5 46.9 71.4 0.0 42.6 11.1 50.0 31.5 39 57.4 66.7 80.0 50.0 63.5 24 34.1 41Sierra Leone 100.0 88.9 75.0 56.3 57.1 50.0 4.4 88.9 12.5 59.2 5 42.1 66.7 60.0 100.0 67.2 22 49.7 26Somalia 75.0 22.2 0.0 15.6 42.9 10.0 0.0 44.4 0.0 23.3 46 0.0 0.0 0.0 100.0 25.0 47 28.2 45South Africa 37.5 44.4 50.0 31.3 85.7 50.0 47.1 77.8 87.5 56.8 10 45.9 100.0 100.0 83.3 82.3 8 65.6 2Sudan 37.5 22.2 12.5 18.8 42.9 30.0 13.2 22.2 37.5 26.3 43 70.2 100.0 60.0 16.7 61.7 30 36.4 38South Sudan 75.0 55.6 0.0 59.4 71.4 50.0 22.1 0.0 50.0 42.6 27 0.0 - - 66.7 33.3 46 37.8 37Swaziland 50.0 55.6 87.5 15.6 71.4 0.0 47.1 77.8 62.5 51.9 17 43.9 0.0 80.0 33.3 39.3 43 41.9 33Tanzania 87.5 33.3 50.0 12.5 85.7 70.0 47.1 55.6 43.8 53.9 14 45.6 66.7 80.0 83.3 68.9 20 54.1 19Togo 56.3 29.2 50.0 21.9 42.9 0.0 64.7 22.2 18.8 34.0 35 62.2 66.7 60.0 50.0 59.7 32 42.5 32Tunisia 65.6 30.6 78.1 62.5 85.7 40.0 44.1 88.9 3.1 55.4 12 53.4 100.0 100.0 50.0 75.9 12 59.1 10Uganda 84.4 79.2 50.0 68.8 71.4 20.0 55.9 22.2 68.8 57.8 8 56.1 66.7 80.0 29.2 58.0 33 62.0 7Zambia 70.8 57.4 37.5 46.9 42.9 30.0 48.5 11.1 33.3 42.0 28 43.9 100.0 100.0 44.4 72.1 15 50.0 25Zimbabwe 37.5 16.7 12.5 31.3 42.9 20.0 22.1 22.2 18.8 24.9 44 69.8 66.7 100.0 50.0 71.6 17 32.3 43
AFRICA 63.66 41.24 39.23 31.85 55.22 28.85 34.06 43.38 35.49 41.44 51.62 72.55 69.02 56.46 62.05 -
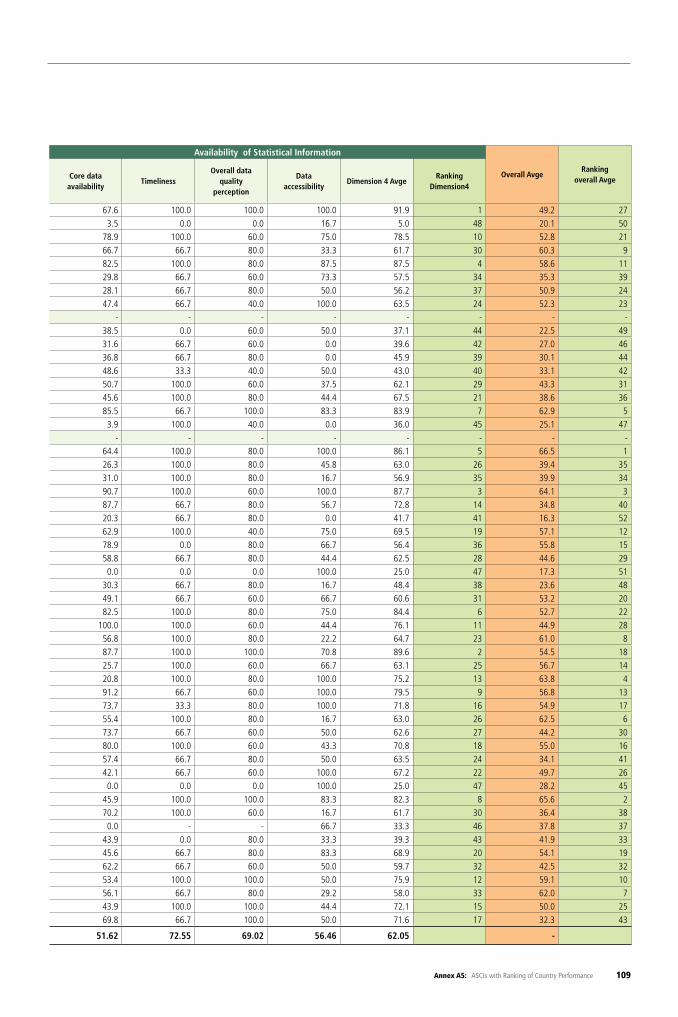
109Annex A5: ASCIs with Ranking of Country Performance
Statistical Methods & Practices Availability of Statistical Information
Overall AvgeRanking
overall AvgeCountryStatistical software capability
Data collection technology
Info. technology
infra- structure
Adoption of inter-national
standards
General statistical activities
Agric. market
and price info.
Agri- cultural surveys
Analysis and use of
data
Quality Conscious-
ness
Dimension 3 Avge
Ranking Dimen-sion3
Core data availability
TimelinessOverall data
quality perception
Data accessibility
Dimension 4 AvgeRanking
Dimension4
Algeria 75.0 33.3 25.0 81.3 57.1 60.0 25.7 55.6 25.0 48.7 19 67.6 100.0 100.0 100.0 91.9 1 49.2 27Angola 75.0 44.4 25.0 0.0 28.6 0.0 0.0 22.2 0.0 21.7 48 3.5 0.0 0.0 16.7 5.0 48 20.1 50Benin 56.3 33.3 75.0 15.6 28.6 40.0 13.2 44.4 56.3 40.3 29 78.9 100.0 60.0 75.0 78.5 10 52.8 21Botswana 75.0 88.9 50.0 75.0 85.7 10.0 42.6 77.8 50.0 61.7 4 66.7 66.7 80.0 33.3 61.7 30 60.3 9Burkina Faso 84.4 45.8 18.8 37.5 42.9 10.0 69.1 55.6 46.9 45.7 21 82.5 100.0 80.0 87.5 87.5 4 58.6 11Burundi 50.0 30.0 17.5 0.0 42.9 0.0 26.5 11.1 62.5 26.7 42 29.8 66.7 60.0 73.3 57.5 34 35.3 39Cabo Verde 87.5 38.9 81.3 43.8 57.1 0.0 17.6 11.1 6.3 38.2 30 28.1 66.7 80.0 50.0 56.2 37 50.9 24Cameroon 75.0 16.7 62.5 56.3 85.7 30.0 30.9 33.3 0.0 43.4 24 47.4 66.7 40.0 100.0 63.5 24 52.3 23Central Afr. Rep. - - - - - - - - - - - - - - - - - - -Chad 75.0 22.2 0.0 0.0 42.9 40.0 8.8 22.2 12.5 24.8 45 38.5 0.0 60.0 50.0 37.1 44 22.5 49Comoros 75.0 22.2 12.5 6.3 42.9 10.0 38.2 0.0 37.5 27.2 41 31.6 66.7 60.0 0.0 39.6 42 27.0 46Congo, Dem Rep. 0.0 0.0 0.0 12.5 14.3 20.0 8.8 33.3 25.0 12.7 51 36.8 66.7 80.0 0.0 45.9 39 30.1 44Congo Rep. 62.5 43.1 12.5 50.0 42.9 20.0 8.8 22.2 43.8 34.0 36 48.6 33.3 40.0 50.0 43.0 40 33.1 42Côte d'Ivoire 68.8 31.9 65.6 34.4 28.6 20.0 12.5 33.3 15.6 34.5 34 50.7 100.0 60.0 37.5 62.1 29 43.3 31Djibouti 50.0 22.2 45.8 6.3 28.6 40.0 13.2 22.2 33.3 29.1 40 45.6 100.0 80.0 44.4 67.5 21 38.6 36Egypt 87.5 50.0 25.0 75.0 71.4 100.0 86.8 88.9 50.0 70.5 1 85.5 66.7 100.0 83.3 83.9 7 62.9 5Equat. Guinea 0.0 0.0 100.0 0.0 14.3 30.0 4.4 33.3 0.0 20.2 49 3.9 100.0 40.0 0.0 36.0 45 25.1 47Eritrea - - - - - - - - - - - - - - - - - - -Ethiopia 75.0 88.9 100.0 9.4 100.0 40.0 30.1 88.9 75.0 67.5 2 64.4 100.0 80.0 100.0 86.1 5 66.5 1Gabon 56.3 40.3 81.3 0.0 42.9 0.0 30.1 55.6 21.9 36.5 31 26.3 100.0 80.0 45.8 63.0 26 39.4 35Gambia 62.5 11.1 0.0 12.5 85.7 40.0 64.7 11.1 100.0 43.1 25 31.0 100.0 80.0 16.7 56.9 35 39.9 34Ghana 87.5 55.6 62.5 75.0 71.4 60.0 57.4 66.7 50.0 65.1 3 90.7 100.0 60.0 100.0 87.7 3 64.1 3Guinea 50.0 34.4 0.0 15.6 57.1 10.0 30.1 77.8 25.0 33.3 37 87.7 66.7 80.0 56.7 72.8 14 34.8 40Guinea-Bissau 0.0 0.0 0.0 15.6 57.1 0.0 4.4 11.1 0.0 9.8 52 20.3 66.7 80.0 0.0 41.7 41 16.3 52Kenya 56.3 52.8 75.0 59.4 85.7 50.0 51.5 66.7 25.0 58.0 7 62.9 100.0 40.0 75.0 69.5 19 57.1 12Lesotho 75.0 55.6 25.0 0.0 71.4 20.0 22.1 77.8 100.0 49.6 18 78.9 0.0 80.0 66.7 56.4 36 55.8 15Liberia 54.2 37.0 12.5 40.6 28.6 30.0 39.0 44.4 37.5 36.0 32 58.8 66.7 80.0 44.4 62.5 28 44.6 29Libya 75.0 66.7 0.0 0.0 28.6 10.0 25.0 0.0 0.0 22.8 47 0.0 0.0 0.0 100.0 25.0 47 17.3 51Madagascar 25.0 11.1 0.0 0.0 0.0 30.0 30.1 33.3 12.5 15.8 50 30.3 66.7 80.0 16.7 48.4 38 23.6 48Malawi 87.5 44.4 25.0 40.6 57.1 50.0 60.3 44.4 12.5 46.9 20 49.1 66.7 60.0 66.7 60.6 31 53.2 20Mali 93.8 58.3 75.0 28.1 42.9 0.0 0.0 44.4 50.0 43.6 23 82.5 100.0 80.0 75.0 84.4 6 52.7 22Mauritania 50.0 44.4 16.7 3.1 42.9 50.0 48.5 22.2 16.7 32.7 38 100.0 100.0 60.0 44.4 76.1 11 44.9 28Mauritius 45.8 42.6 70.8 68.8 57.1 20.0 30.9 33.3 29.2 44.3 22 56.8 100.0 80.0 22.2 64.7 23 61.0 8Morocco 75.0 41.7 34.4 68.8 85.7 90.0 34.6 44.4 21.9 55.2 13 87.7 100.0 100.0 70.8 89.6 2 54.5 18Mozambique 87.5 50.0 25.0 68.8 57.1 20.0 64.7 66.7 87.5 58.6 6 25.7 100.0 60.0 66.7 63.1 25 56.7 14Namibia 87.5 100.0 100.0 46.9 42.9 10.0 52.2 44.4 0.0 53.8 15 20.8 100.0 80.0 100.0 75.2 13 63.8 4Niger 100.0 42.6 25.0 0.0 57.1 80.0 60.3 77.8 62.5 56.1 11 91.2 66.7 60.0 100.0 79.5 9 56.8 13Nigeria 50.0 61.1 12.5 25.0 71.4 10.0 47.8 44.4 62.5 42.8 26 73.7 33.3 80.0 100.0 71.8 16 54.9 17Rwanda 75.0 44.4 100.0 53.1 57.1 20.0 47.1 66.7 50.0 57.0 9 55.4 100.0 80.0 16.7 63.0 26 62.5 6São Tomé & Pr. 50.0 44.4 12.5 12.5 71.4 20.0 13.2 66.7 25.0 35.1 33 73.7 66.7 60.0 50.0 62.6 27 44.2 30Senegal 80.0 47.8 55.0 31.3 71.4 40.0 61.0 55.6 30.0 52.4 16 80.0 100.0 60.0 43.3 70.8 18 55.0 16Seychelles 37.5 11.1 12.5 46.9 71.4 0.0 42.6 11.1 50.0 31.5 39 57.4 66.7 80.0 50.0 63.5 24 34.1 41Sierra Leone 100.0 88.9 75.0 56.3 57.1 50.0 4.4 88.9 12.5 59.2 5 42.1 66.7 60.0 100.0 67.2 22 49.7 26Somalia 75.0 22.2 0.0 15.6 42.9 10.0 0.0 44.4 0.0 23.3 46 0.0 0.0 0.0 100.0 25.0 47 28.2 45South Africa 37.5 44.4 50.0 31.3 85.7 50.0 47.1 77.8 87.5 56.8 10 45.9 100.0 100.0 83.3 82.3 8 65.6 2Sudan 37.5 22.2 12.5 18.8 42.9 30.0 13.2 22.2 37.5 26.3 43 70.2 100.0 60.0 16.7 61.7 30 36.4 38South Sudan 75.0 55.6 0.0 59.4 71.4 50.0 22.1 0.0 50.0 42.6 27 0.0 - - 66.7 33.3 46 37.8 37Swaziland 50.0 55.6 87.5 15.6 71.4 0.0 47.1 77.8 62.5 51.9 17 43.9 0.0 80.0 33.3 39.3 43 41.9 33Tanzania 87.5 33.3 50.0 12.5 85.7 70.0 47.1 55.6 43.8 53.9 14 45.6 66.7 80.0 83.3 68.9 20 54.1 19Togo 56.3 29.2 50.0 21.9 42.9 0.0 64.7 22.2 18.8 34.0 35 62.2 66.7 60.0 50.0 59.7 32 42.5 32Tunisia 65.6 30.6 78.1 62.5 85.7 40.0 44.1 88.9 3.1 55.4 12 53.4 100.0 100.0 50.0 75.9 12 59.1 10Uganda 84.4 79.2 50.0 68.8 71.4 20.0 55.9 22.2 68.8 57.8 8 56.1 66.7 80.0 29.2 58.0 33 62.0 7Zambia 70.8 57.4 37.5 46.9 42.9 30.0 48.5 11.1 33.3 42.0 28 43.9 100.0 100.0 44.4 72.1 15 50.0 25Zimbabwe 37.5 16.7 12.5 31.3 42.9 20.0 22.1 22.2 18.8 24.9 44 69.8 66.7 100.0 50.0 71.6 17 32.3 43
AFRICA 63.66 41.24 39.23 31.85 55.22 28.85 34.06 43.38 35.49 41.44 51.62 72.55 69.02 56.46 62.05 -
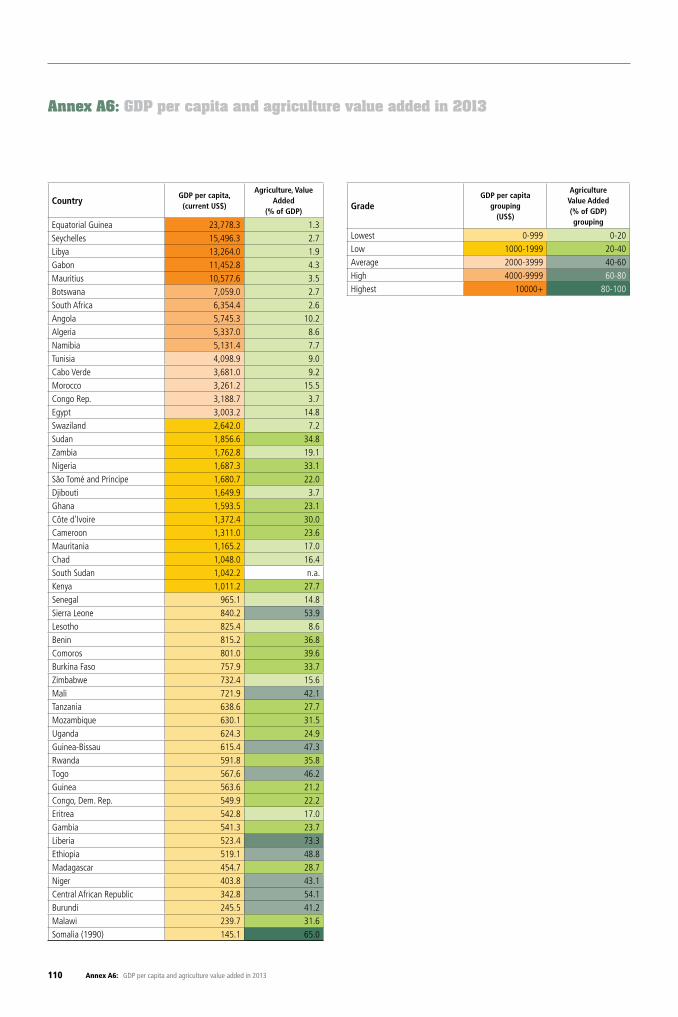
110 Annex A6: GDP per capita and agriculture value added in 2013
Annex A6: GDP per capita and agriculture value added in 2013
CountryGDP per capita, (current US$)
Agriculture, Value Added
(% of GDP)
Equatorial Guinea 23,778.3 1.3Seychelles 15,496.3 2.7Libya 13,264.0 1.9Gabon 11,452.8 4.3Mauritius 10,577.6 3.5Botswana 7,059.0 2.7South Africa 6,354.4 2.6Angola 5,745.3 10.2Algeria 5,337.0 8.6Namibia 5,131.4 7.7Tunisia 4,098.9 9.0Cabo Verde 3,681.0 9.2Morocco 3,261.2 15.5Congo Rep. 3,188.7 3.7Egypt 3,003.2 14.8Swaziland 2,642.0 7.2Sudan 1,856.6 34.8Zambia 1,762.8 19.1Nigeria 1,687.3 33.1São Tomé and Principe 1,680.7 22.0Djibouti 1,649.9 3.7Ghana 1,593.5 23.1Côte d'Ivoire 1,372.4 30.0Cameroon 1,311.0 23.6Mauritania 1,165.2 17.0Chad 1,048.0 16.4South Sudan 1,042.2 n.a.Kenya 1,011.2 27.7Senegal 965.1 14.8Sierra Leone 840.2 53.9Lesotho 825.4 8.6Benin 815.2 36.8Comoros 801.0 39.6Burkina Faso 757.9 33.7Zimbabwe 732.4 15.6Mali 721.9 42.1Tanzania 638.6 27.7Mozambique 630.1 31.5Uganda 624.3 24.9Guinea-Bissau 615.4 47.3Rwanda 591.8 35.8Togo 567.6 46.2Guinea 563.6 21.2Congo, Dem. Rep. 549.9 22.2Eritrea 542.8 17.0Gambia 541.3 23.7Liberia 523.4 73.3Ethiopia 519.1 48.8Madagascar 454.7 28.7Niger 403.8 43.1Central African Republic 342.8 54.1Burundi 245.5 41.2Malawi 239.7 31.6Somalia (1990) 145.1 65.0
GradeGDP per capita
grouping(US$)
Agriculture Value Added(% of GDP) grouping
Lowest 0-999 0-20Low 1000-1999 20-40Average 2000-3999 40-60High 4000-9999 60-80Highest 10000+ 80-100
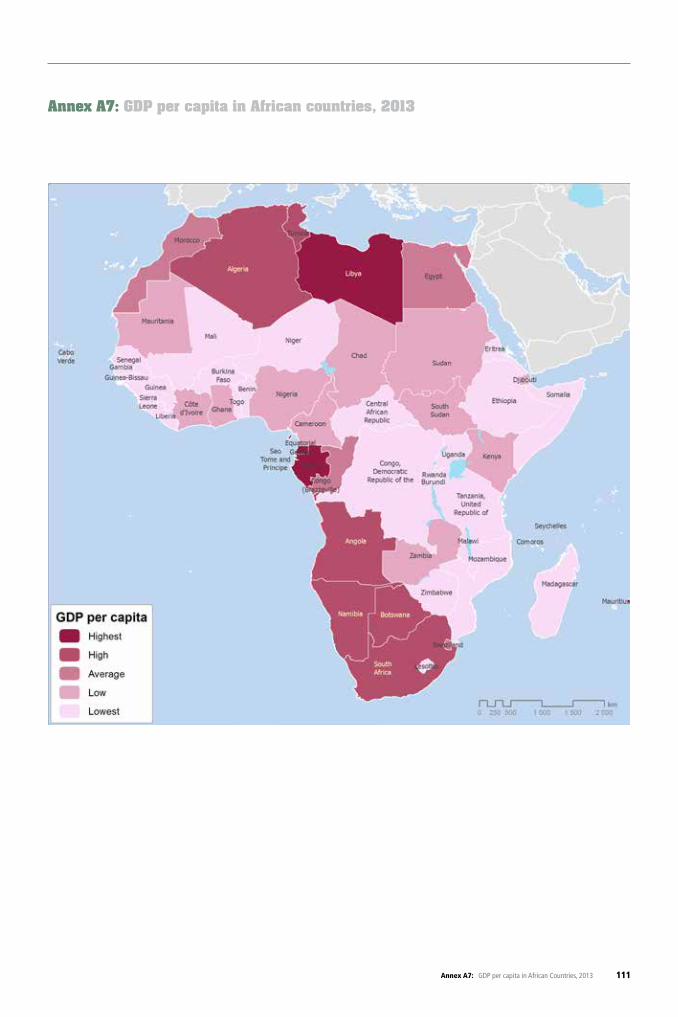
111Annex A7: GDP per capita in African Countries, 2013
Annex A7: GDP per capita in African countries, 2013


Chapter x Xxxxxxxxxxxxxx xxxxxxxxxxx114
Country Assessment of Agricultural Statistical Systems in Africa Measuring the Capacity of African Countries to Produce Timely, Reliable and Sustainable Agricultural Statistics 115

Chapter x Xxxxxxxxxxxxxx xxxxxxxxxxx116
Statistics DepartmentChief Economist ComplexAfrican Development BankImmeuble du Centre de commerce international d’AbidjanAvenue Jean-Paul II01 BP 1387 Abidjan 01Abidjan, Côte d’Ivoire
Tel: (225) 20 26 33 25
Email : [email protected] Internet : http://www.afdb.org