Embed Size (px)
Citation preview
1
COUNTRY ECONOMIC REVIEW 2018
GRENADA
GRENADA ECONOMIC BRIEF 2018
2
Disclaimer Copyright © Caribbean Development Bank (CDB). The opinions, findings, interpretations and conclusions expressed in this publication are those of the staff of CDB and do not necessarily reflect the official policy or position of CDB, its Board of Directors, or the countries they represent.
This work may be reproduced, with attribution to CDB, for any non-commercial purpose. The use of CDB's name for any purpose other than for attribution, and the use of CDB's logo shall be subject to a separate written licence agreement between CDB and the user and is not authorized as part of this licence. No derivative work is allowed.
CDB does not necessarily own each component of the content contained within this document and therefore does not warrant that the use of any third-party owned individual component or part contained in this work will not infringe on the rights of those third parties. Any risks of claims resulting from such infringement rest solely with the user. CDB does not guarantee the accuracy of the data included in this work.
Any dispute related to the use of the works of CDB that cannot be settled amicably shall be submitted to arbitration pursuant to the UNCITRAL rules. Nothing herein shall constitute or be deemed to constitute a waiver of the privileges and immunities of CDB, all of which are specifically reserved.

$ refers to Eastern Caribbean Dollars throughout. US$1 = EC$2.70
3
GRENADA ECONOMIC BRIEF 2018
OVERVIEW Gross domestic product (GDP) grew by 5.2% in 2018, driven by increased economic activity in the construction, tourism, private education and manufacturing sectors. As a result, the unemployment rate fell. Consumer prices rose by 2.8%. Fiscal performance was strong in 2018, underpinned by the Fiscal Responsibility Act (FRA). The primary surplus increased to 6.2% of GDP. Public debt as a percentage of GDP declined to 62.7%. The external current account deficit widened, largely as a result of rising aggregate demand and international commodity prices. The financial sector remained sound, stable, and well capitalised. Loan quality improved as non˗performing loans (NPLs) fell; but there was also a drop in domestic credit, despite ample liquidity in credit markets.
KEY DEVELOPMENTS IN 2018 In 2018 Grenada continued to be the fastest growing economy in the Region (see Chart 1). Growth was estimated at 5.2% for the year, which translates to a five-year average of 5.0%. This strong outcome was driven by rising economic activity in the construction; private education and manufacturing sectors, and was above the Government of Grenada’s (GOGR) forecast in the 2017 Budget.
The construction sector expanded once more. Economic activity in the construction sector in 2018 was 14.9% higher than the previous year. Growth was driven by the ongoing implementation of some key projects including the St. George’s University Expansion Project, Silver Sands Resort (Phase One) and the Parliament Building (Phase One).
Chart 1: Real GDP Growth
Source: GOGR, CDB estimates. The tourism sector expanded once more. Based on data for the first nine months of 2018, stay-over arrivals rose 10.3% over the same period in 2017, with all major source markets supplying more customers. Cruise ship passenger arrivals were an estimated 27.2% higher than the same period in 2017. These developments enabled further growth in the hotel and restaurant sector, which also benefited from Grenada hosting several regional and international events, including the Grenada Invitational Athletics Meet, Dive Fest, Pure Grenada Music Festival and SpiceMas.
The private education and agriculture sectors produced mixed results. Private education, which constituted the largest share of GDP (19.8%) in 2018, expanded by 4.3%. Manufacturing sector activity was up 2.0%. However, data for the first six months of 2018 indicate a fall in agricultural production compared with the same period in 2017, which was attributed to adverse weather patterns affecting major crops such as nutmeg and cocoa. In 2018, inflation rose while unemployment fell. The Consumer Price Index increased by 2.8%, driven by higher international oil and food prices, as well as by rising U.S. inflation. In addition, the 2018 Labour Force Survey indicates that the unemployment rate fell from
0.0
1.0
2.0
3.0
4.0
5.0
6.0
7.0
8.0
2014 2015 2016 2017 2018
Real
GD
P G
row
th (%
)

GRENADA ECONOMIC BRIEF 2018
4
23.6% in 2017, to 20.9% in 2018 (see Chart 2). Chart 2: Unemployment
Source: GOGR. Fiscal performance continued to improve in 2018. At the end of the year, the primary balance (after grants) was estimated at $199.9 million (mn) or 6.2% of GDP, which exceeds the 3.5% of GDP required by the fiscal rule (see Chart 3). This outcome is higher than the $172.6 mn recorded in 2017. In addition, the overall surplus (after grants) rose to $136.3 mn (or 4.2% of GDP) in 2018, which is higher than the $91.6 mn outcome for 2017. Both the primary and overall positions were better than projected, thanks to reductions in GOGR’s discretionary spending and enhanced tax compliance and enforcement. Total Revenue and Grants increased in 2018 to $849.8 mn, while total expenditure rose to $713.5 mn. Expenditure on goods and services shrank by 9.6% relative to 2017. Personal emoluments were 4.0% higher, due largely to a 3% salary uplift at the start of the year. There was also a 5.7% expansion in transfers, reflecting a larger Government contribution to the National Insurance Scheme and pension payments. However, as a result of debt restructuring and reprofiling, interest payments were 21.9% less than the 2017 outturn. Chart 3: Fiscal and Debt Performance
Source: GOGR.
Debt stayed on the downward trajectory. Total public sector debt fell by 6.2 percentage points to 62.7% of GDP in 2018. The financial system was stable, sound, and well capitalised in 2018. Notwithstanding, the sector is still challenged by poor credit supply. Based on data up to June 2018, domestic credit declined. The capital adequacy ratio also fell, from 13.8% in 2017, to 13.1% in September 2018; however, this remains comfortably above the regulatory requirement. Credit quality has improved markedly in recent years. As at September 2018, the NPLs ratio was 2.6%, which was below the 5.0% prudential limit for the second successive year and represents the lowest figure recorded since June 2009. Liquid assets, as a percentage of total assets, increased by four percentage points to 44.9% in the nine months to September 2018. The current account deficit worsened in 2018, although international reserves remain adequate (see Chart 4). The deficit widened to 7.4% of GDP, relative to 6.7% in 2017. Based on data up to June 2018, this deterioration reflected a growing trade deficit as a result of a faster growth in imports relative to exports. The expansion in imports was attributed to the increase in oil prices, as well as higher import demand. Exports were adversely impacted by poor performance in the agricultural sector. International reserves remained adequate, at 3.4 months as at end 2018.
0.0
5.0
10.0
15.0
20.0
25.0
30.0
35.0
2014 2015 2016 2017 2018Une
mpl
oym
ent R
ate
(%)
-2.0
0.0
2.0
4.0
6.0
8.0
0
20
40
60
80
100
2014 2015 2016 2017 2018
% o
f GD
P
% o
f GD
P
Debt Primary Balance (Right Axis)

GRENADA ECONOMIC BRIEF 2018
5
Chart 4: Gross Foreign Reserves
Source:The International Monetary Fund (IMF), GOGR. OUTLOOK The medium-term outlook for Grenada is positive. For 2019, the Caribbean Development Bank (CDB) projects economic growth of 4.5%, with similar outcomes expected over the medium term. The construction, tourism, agriculture and private education sectors will also drive performance. In terms of construction, there should be further momentum from major road network upgrades and ongoing private sector projects. The tourism sector should continue to expand as a result of increased room capacity and higher demand. The agriculture sector should recover, reflecting the start of projects aimed at mitigating the effects of weather conditions. Notwithstanding, economic growth is still expected to be tempered by the decline in private sector credit in 2018.
Fiscal performances in 2019 should continue to benefit from GOGR’s adherence to the Fiscal Responsibility Act (FRA). The primary and overall surpluses are projected to be 5.5% and 3.5% of GDP, respectively. This would represent continued adherence to GOGR’s policy of fiscal sustainability. In addition, debt sustainability is expected to be restored over the medium term by means of
further fiscal consolidation. Public debt is projected to be 59.6% in 2019.
0
0.5
1
1.5
2
2.5
3
3.5
4
4.5
2014 2015 2016 2017 2018
Mon
ths
of Im
port
s
Reserves Three Months Benchmark
GRENADA ECONOMIC BRIEF 2018
6
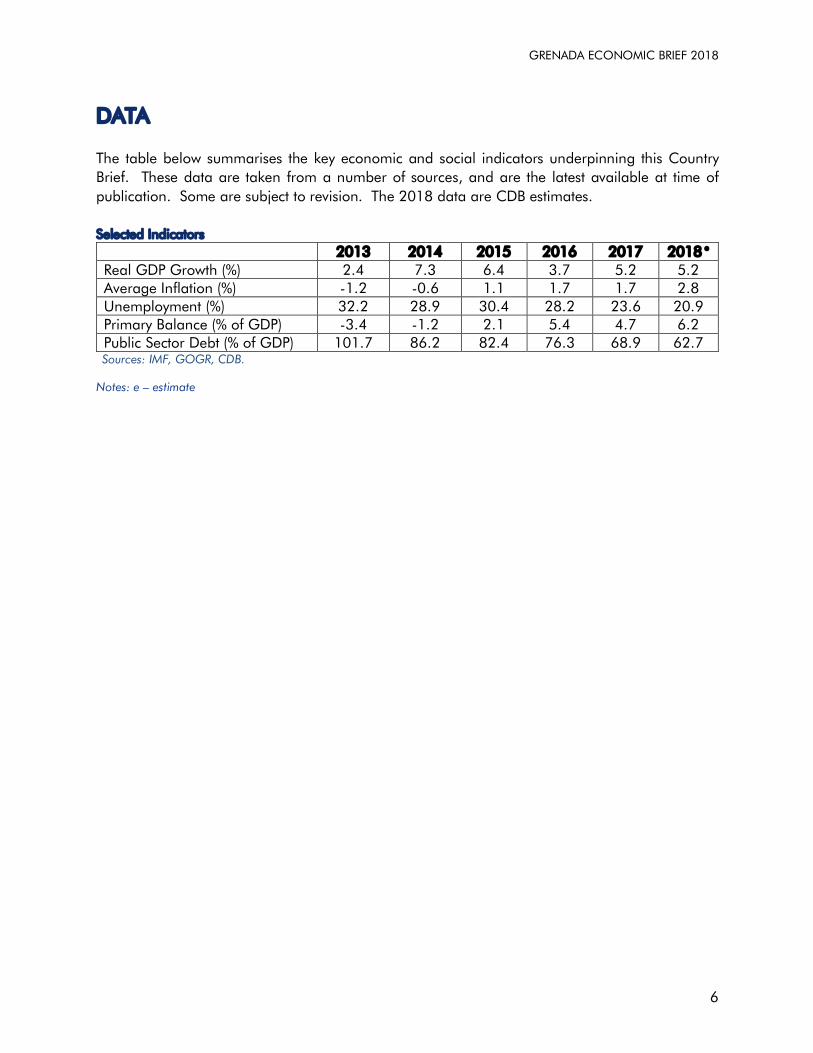
DATA The table below summarises the key economic and social indicators underpinning this Country Brief. These data are taken from a number of sources, and are the latest available at time of publication. Some are subject to revision. The 2018 data are CDB estimates. Selected Indicators
2013 2014 2015 2016 2017 2018 e Real GDP Growth (%) 2.4 7.3 6.4 3.7 5.2 5.2 Average Inflation (%) -1.2 -0.6 1.1 1.7 1.7 2.8 Unemployment (%) 32.2 28.9 30.4 28.2 23.6 20.9 Primary Balance (% of GDP) -3.4 -1.2 2.1 5.4 4.7 6.2 Public Sector Debt (% of GDP) 101.7 86.2 82.4 76.3 68.9 62.7 Sources: IMF, GOGR, CDB.
Notes: e – estimate