Embed Size (px)
Citation preview

Country ReportCôte d’Ivoire: By the numbers
[email protected] | AnalyseAfrica.com
A macroeconomic data and trends report on Côte d’Ivoire
In association with


3
Country Report | Côte d’Ivoire: By the numberswww.AnalyseAfrica.com
ContentsExecutive summary 4
Background 5Land, Resources, Population Politics 7 Governance, Political Stability Economy 9 GDP composition, GDP growth, Focus on: Agriculture, The National Development Plans
Central Intelligence AgencyfDi MarketsEuropean Forest InstituteFood and Agriculture Organization of the United NationsFund for PeaceInternational Labour OrganizationInternational Monetary FundInternational Telecommunication Union
About the dataThe report is based on data extracted from the Analyse Africa database, a service from the Financial Times. Report released March 2017.
Analyse Africa aggregates macroeconomic data from world renowned sources into one digital data platform. It features over 1.93 million data records for 5000+ indicators from 2000 to the most recent year available. The data sources in this report, listed below, were accessed via www.AnalyseAfrica.com:
Foreign Direct Investment 13 Who invests in Côte d’Ivoire? Trade 14 Trade partners Doing Business in Côte d’Ivoire 16
Banking and Finance 17
Infrastructure 18Quality of infrastructure, Focus on: Electricity
Inter-Parliamentary Union La Direction Générale du Conseil du Café CacaoMo Ibrahim FoundationPolitical Terror ScaleTransparency International United Nations Statistics DivisionUnited Nations Educational, Scientific and Cultural Organization (UNESCO)
The World BankUNAIDSUnited States Energy Information AdministrationWorld Economic ForumWorld Health Organization
Additional research was undertaken to supplement the report.
Labour 20 Telecommunications 21
Telephones and broadband Education 22 Literacy, Women in education Healthcare 24 Public health

Country Report | Côte d’Ivoire: By the numbers
4www.AnalyseAfrica.com
Executive summary
Growing PopulationCôte d’Ivoire has an estimated population of 23.25 million which has been growing at an average of 2.32% during the last decade.
Infant mortality has fallen from approximately 87 deaths per 1000 births in 2007 to 57 deaths in 2016.
Peaceful elections in 2015The political environment has been more stable in recent years, with improvements in both the Mo Ibrahim Index and Fragile States Index.
Fastest growing economy in sub-Saharan AfricaIn 2017, GDP is forecast to grow by 8% – the fastest rate in sub-Saharan Africa – reaching $38.4 billion.
The largest sector in Côte d’Ivoire’s economy, in terms of value added, is the services sector, accounting for almost half (48.7%) of total value added in 2015.
Côte d’Ivoire is the largest producer in the world of cocoa beans, harvesting 1.43 million tonnes in 2014 (32.2% of world production).
World’s largest exporter of cocoa beans Côte d’Ivoire is a net exporter. Exports totalled $11.84 billion in 2015, with cocoa (43.3%) as the largest export commodity. Imports totalled $9.53 billion. Mineral fuels was the country’s largest import commodity, accounting for over one fifth (22%) of total imports.
Agriculture is the largest sector of employment Approximately 8.38 million people are employed, 56% of which are employed in the agriculture sector.
There are more mobile phone subscriptions than peopleThe number of mobile phone subscriptions has increased by approximately 23 million between 2005 and 2015 – totalling 25.4 million.
Record year for Foreign Direct InvestmentInbound Greenfield FDI projects peaked in 2016, amounting to 33 projects. Building & Construction Materials and Communications are key sectors for Greenfield FDI.

5
Country Report | Côte d’Ivoire: By the numberswww.AnalyseAfrica.com
Land
Côte d’Ivoire has a geographic area of 322,463 sq km (318,003 sq km of land and a water area of 4460 sq km), the 69th largest globally. The country shares land borders with Burkina Faso, Ghana, Guinea, Liberia and Mali, totalling 3458 km.
Just under two thirds (64.8%) of land in Côte d’Ivoire is used for agricultural purposes (41.5% dedicated to permanent pasture, 14.2% for permanent crops, and 9.1% for arable land); 32.7% is forest area; and the remaining 2.5% is made up of built-up areas, roads and other transportation means, barren and waste land.
Côte d’Ivoire’s capital city is Yamoussoukro, while the economic centre and largest city is Abidjan.
DEMOGRAPHICS
Nationality Ivorian
Ethnic groups Akan (32.1%), Voltaique or Gur (15%), Northern Mande (12.4%), Krou (9.8%), Southern Mande
(9%), and 21.7% identify as ‘other’ or ‘unspecified’
Languages French (official) and 60 native dialects, of which
Dioula is the most widely spoken
Religion Muslim: 40.2%, Catholic: 19.4%, Evangelical:
19.3%, Methodist: 2.5%, other Christian: 4.5%, animist or no religion: 12.8%, other religion/
unspecified: 1.4%
Birth rate28.2 births out of every 1000 people
(2016 estimate)
Source: The World Factbook 2016. Washington, DC: Central Intelligence Agency, 2016
Resources
Côte d’Ivoire’s main natural resources are petroleum, natural gas, diamonds, manganese, iron ore, copper, gold, nickel, cocoa beans, cashew nuts, timber, coffee and palm oil. Côte d’Ivoire has been affected by deforestation. Between 1960 and 2010, the country’s forest cover fell from 12 million hectares to 2.5 million hectares as the agriculture sector and cocoa production expanded. Deforestation rates remain high (around 4%), posing a threat to the provision of environmental services which are essential for the country’s agricultural economy.*
Background
*Source: EU Forest Law Enforcement, Governance and Trade

Country Report | Côte d’Ivoire: By the numbers
6www.AnalyseAfrica.com
Population
In 2016, Côte d’Ivoire had an estimated population of 23.25 million which has been growing at an average of 2.32% during the last decade. The population is forecast to increase to 32.14 million by 2030. Like many other African countries, Côte d’Ivoire has a growing youth population. In 2016, 62.65% of the population was under the age of 24. While this can be a benefit as it provides a large labour pool of working-age people, it poses challenges for the country – notably in education and employment.
Source: International Labour Organization (ILO Department of Statistics)
Chart 1: Total estimated population (m) and growth rate (%), Côte d’Ivoire, 2000-2016
Rate 2007 2016 % change
Birth rate (per 1000 people)
34.69 28.20 -18.70
Fertility rate (per woman)
4.43 3.46 -21.90
Infant mortality rate(per 1000 births)
87.41 57.20 -34.56
Table 1: Estimated birth, fertility and mortality rates and percentage change, Côte d’Ivoire, 2005 and 2016*
Source: The World Factbook 2016. Washington, DC: Central Intelligence Agency, 2016
Côte d’Ivoire has a high infant mortality rate, albeit a declining one. For every 1000 births, 57.2 babies will die before their first birthday. This figure is the eighth highest in west Africa, 21st in Africa and 22nd globally. Mortality has, however, reduced in the last decade. In 2007, Côte d’Ivoire had the fourth highest infant mortality rate in west Africa, the seventh highest in Africa and 16th globally.
Chart 2: Population age breakdown (% of total), Côte d’Ivoire, 2016
Source: International Labour Organization 2016
>65
55-64
15-24
25-54
<14
42.32
30.14
20.33
4.17
3.04
0
5
10
15
20
25
1.5
2.0
2.5Growth
Population
201620142012201020082006200420022000
Popu
latio
n (m
n)
2.36
1.78
2.12
2.422.43
% g
row
th

7
Country Report | Côte d’Ivoire: By the numberswww.AnalyseAfrica.com
PoliticsGovernance
The Mo Ibrahim Index of African Governance is an assessment of the quality of governance in African countries. Côte d’Ivoire’s Index score has improved since 2000, increasing from 39.9 to 52.3. In the 2015 Report, Côte d’Ivoire ranked 21st out of 52 African countries, up five places from its 2014 ranking and 20 places since 2012. In regional terms, it ranked fifth out of 16 west African states in 2015.
The Fragile States Index is a measure of how likely the risk of state failure is based on social, economic, political and military indicators. In 2005, Côte d’Ivoire scored 106 out of 120, ranking as the state most likely to fail both regionally and globally due to the first Ivorian civil war. However, Côte d’Ivoire has made significant progress and in 2016 it ranked as the 21st most stable globally and 15th in Africa. The improvements can be attributed, in part, to the end of the conflict and peaceful elections in 2015.
Location2005 Score
(0-120)2005 African
rank2016 score
(0-120)2016 African
rank
Côte d’Ivoire 106.0 1 97.9 15
DRC^ 105.3 2 110.0 6
Sudan 104.1 3 111.5 4
Somalia 102.3 4 114.0 1
Sierra Leone 102.1 5 91.0 25
Table 3: Fragile States Index, score 0-120 and African rank*, selected African countries, 2005 and 2016
Source: Fragile States Index, Fund for Peace* The number of countries included in the ranking ranges from 28 to 54 depending on the year and data available (1 = worst)^Democratic Republic of the Congo
GOVERNMENT
FormPresidential Republic. This means the
president holds significant power in the government and is independent of the
legislature. The legislature is headed by a Prime Minister who is appointed by the
President. The legislature is currently unicameral with an assembly of 255
members who sit for a five year term.
Head of statePresident Alassane Ouattara (since 4
December 2010, returned on 25 October 2015) and Vice President Daniel Kablan
Duncan (since 10 January 2017)
Head of governmentPrime Minister Amadou Gon Coulibaly (since
10 January 2017)
Suffrage18 years old and above. Voting is universal
Women in governmentWomen hold 23 seats in the Lower House
(9.2%) (2016)
Source: The World Factbook 2016. Washington, DC: Central Intelligence Agency, 2016
LocationAfrican rank
(1-52)West African rank (1-16)
Score (0-100)
Côte d’Ivoire 21 5 52.3
Ghana 8 2 63.9
Mali 25 7 50.6
Nigeria 36 13 46.5
Senegal 10 3 60.8
Table 2: Ibrahim Index of African Governance, score 0-100*, selected west African countries^, 2015
Source: Analyse Africa analysis based on Ibrahim Index of African Governance, Mo Ibrahim Foundation* [0 = low government performance; 100 = high government performance]^ West African region is based on United Nations classification

Country Report | Côte d’Ivoire: By the numbers
8www.AnalyseAfrica.com
Political Stability
Côte d’Ivoire’s recent history has been marked by political turmoil, most notably between 2003 and 2006 during the first Ivorian civil war, and between 2010 and 2011 during the second Ivorian civil war. Political stability has improved with peaceful elections in 2015. There are currently 3400 United Nations peacekeeping troops in the country, with plans for a drawdown by June 2017.
Despite ongoing issues, Côte d’Ivoire has improved across a number of indicators including controlling corruption, effective government and political stability. As Graphic 1 shows, the decade between 2005 and 2015 has been marked by positive change. According to The World Bank’s World Governance Indicators, Côte d’Ivoire has improved its score for political stability from -2.3 in 2005 to -0.86 in 2015. While this is still low, it shows great improvement. In comparison, Botswana – often hailed as Africa’s most democratic country – scored +0.84 for control of corruption, +0.51 for government effectiveness, and +1.03 for political stability and absence of violence and terrorism.
Control of corruption
Government effectiveness
Political stability and absence of violence and terrorism
Did you know?
Ex-Ivorian president Laurent Gbagbo was
the first former head of state to appear at the
International Criminal Court in 2011, facing four charges of crimes against humanity
Graphic 1: Control of corruption, Government effectiveness and Political stability and absence of violence and terrorism, score -2.5 to +2.5*, Côte d’Ivoire, 2005 to 2015
Source: World Governance Indicators, The World Bank* [ -2.5 = weak governance performance; 2.5 = strong governance performance]
2010-1.14
2015-0.42
2010-1.26
2015-0.65
2010-1.56
2015-0.86
2005-1.25
2005-1.36
2005-2.30
In the news
In 2016, a new constitution was approved in efforts
to calm social and political unrest. In January 2017, the country’s first vice
president was nominated, the first of a number of
government reforms
-2.5
-2.5
-2.5
+2.5
+2.5
+2.5

9
Country Report | Côte d’Ivoire: By the numberswww.AnalyseAfrica.com
Economy GDP composition
The largest sector in Côte d’Ivoire’s economy, in terms of value added, is the services sector, accounting for almost half (48.7%) of total value added in 2015. The industry sector contributed 28.6% and the agricultural sector 22.7%.
Between 2012 and 2015, each of the broad sectors have, on average, grown. Agriculture and industry grew by an average of 7.2% per annum, and services by 9.2%.
In 2017, Côte d’Ivoire’s GDP is forecast to total $38.4 billion.
ECONOMY
GDP, current prices (f), $ 2017
38.40bn
GDP per capita, current prices (f), $, 2017
1538
Interest rate, 2017* 4.5%
Inflation (f), 2017 1.5%
Labour force (f), 15+, 2017 9.23m
Unemployment rate (f), 15+, 2017
9.45%
Exports, $, 2015 11.84bn
Imports, $, 2015 9.53bn
Key commodity Cocoa
Government revenue, $, 2016
6.84bn
Government expenditure, $, 2016
8.17bn
Sources: International Labour Organization; International Monetary Fund; The World Factbook 2016. Washington, DC: Central Intelligence Agency, 2016; DESA/UNSD, United Nations Comtrade database
*Data is based on the rate set by the BCEAO as of January 2017 (f) = forecast
Chart 3: Value added by sector (% of total value added), Côte d’Ivoire, 2015
Source: World Development Indicators, The World Bank
48.7%
28.6%
Agriculture
Industry
Services
22.7%
Growth in 2015
Services +39.4%
Industry +8.7%
Agriculture +3.6%
Country Report | Côte d’Ivoire: By the numbers
10www.AnalyseAfrica.com
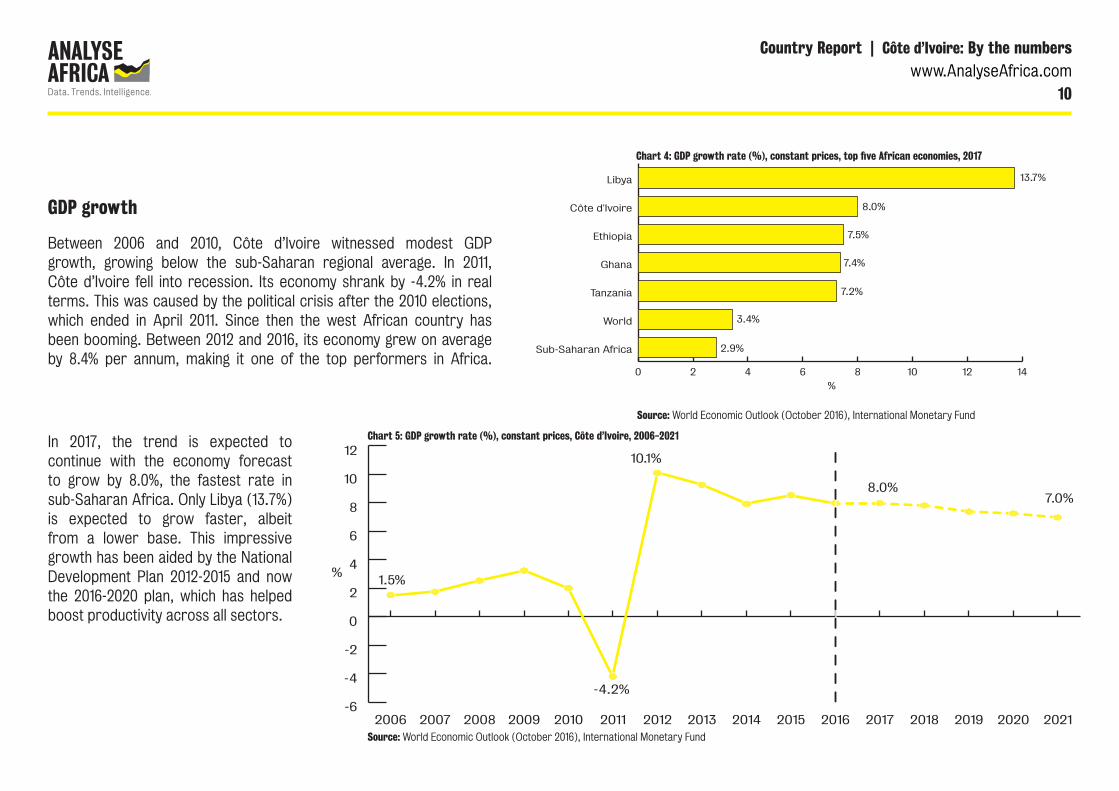
GDP growth Between 2006 and 2010, Côte d’Ivoire witnessed modest GDP growth, growing below the sub-Saharan regional average. In 2011, Côte d’Ivoire fell into recession. Its economy shrank by -4.2% in real terms. This was caused by the political crisis after the 2010 elections, which ended in April 2011. Since then the west African country has been booming. Between 2012 and 2016, its economy grew on average by 8.4% per annum, making it one of the top performers in Africa.
0 2 4 6 8 10 12 14
Sub-Saharan Africa
World
Tanzania
Ghana
Ethiopia
Côte d'Ivoire
Libya
8.0%
7.4%
13.7%
7.2%
7.5%
3.4%
2.9%
%
Chart 5: GDP growth rate (%), constant prices, Côte d’Ivoire, 2006-2021
Chart 4: GDP growth rate (%), constant prices, top five African economies, 2017
Source: World Economic Outlook (October 2016), International Monetary Fund
Source: World Economic Outlook (October 2016), International Monetary Fund
In 2017, the trend is expected to continue with the economy forecast to grow by 8.0%, the fastest rate in sub-Saharan Africa. Only Libya (13.7%) is expected to grow faster, albeit from a lower base. This impressive growth has been aided by the National Development Plan 2012-2015 and now the 2016-2020 plan, which has helped boost productivity across all sectors.
%
-4.2%
10.1%
-6
-4
-2
0
2
4
6
8
10
12
2021202020192018201720162015201420132012201120102009200820072006
7.0%
1.5%
8.0%

11
Country Report | Côte d’Ivoire: By the numberswww.AnalyseAfrica.com
Despite the fact that Côte d’Ivoire is the largest producer in the world it suffers from low productivity. Its crop yields have been falling on average each year, with a yield of 701 kilograms per hectare (kg/ha) in 2000 compared to 522kg/ha in 2014. Mismanagement, crop disease and access to financing all major problems. One of the main objectives of the National Development Plan 2016-2020 is to increase the output of agricultural products.
Focus on: Agriculture
Côte d’Ivoire’s agriculture sector is extremely important, employing approximately 56% of the country’s total workforce in 2016.
The production of crops is a key area within the agriculture sector, contributing nearly 95% to the value of total agriculture production. Cocoa beans are Côte d’Ivoire’s most valuable crop. In 2014, 1.43 million tonnes were harvested (32.2% of world production).
Source: Food and Agriculture Organization of the United Nations
Chart 6: Cocoa bean production, % share, top 5 world producers, 2014
Rest of the world
Cameroon
Brazil
Indonesia
Ghana
Côte d'Ivoire
32.2%
19.3%
16.4
19.8%
6.2%
6.1%
0
100
200
300
400
500
600
700
800
20142012200820042000
701 686
601
542 522
Kkilo
gram
per
hec
ttare
Chart 7: Cocoa bean yield, kilogram per hectare, Côte d’Ivoire, 2000-2014
Source: Food and Agriculture Organization of the United Nations
Did you know?
The minimum price paid to farmers is 1100 CFA francs
($1.79) per kilogram of cocoa for the 2016/2017 season, an increase of 10% compared to
2015/2016
Source: La Direction Générale du Conseil du Café Cacao

Country Report | Côte d’Ivoire: By the numbers
12www.AnalyseAfrica.com
Focus on: The National Development Plans
The National Development Plan 2016-2020 was announced on 9 December, 2015. It follows on from the successful 2012-2015 plan and is based on the lessons learned from the previous period. The main objectives are to help Côte d’Ivoire achieve emerging market status by 2020 and to establish it as one of the best business environments in Africa. Through the plan, the government hopes to increase agricultural output, promote the manufacturing sector, improve the standard of living and tackle poverty.
It is hoped that investment of $50 billion ($18.8 billion for the public sector and $31.2 billion for the private sector) will help achieve GDP growth of at least 8% up to 2020 and increase share of value added in the processing of commodities such as cocoa and coffee.
Between 2010 and 2015, the National Development Plan...
71 social housing
projects constructed
Connected
800 rural towns
to the electric power grid
Built
9291primary school
classrooms
...and
3500secondary
school classrooms
Constructed
45 middle schools
Increased GDP per capita by
21%between 2012 and 2014
Increased jobs in the formal sector by over
70,000 in two years (2012-2014)
Did you know?
In December 2016, the International Monetary Fund
approved $658.9 million to support Côte d’Ivoire’s
National Development Plan 2016-2020

13
Country Report | Côte d’Ivoire: By the numberswww.AnalyseAfrica.com
13
Foreign Direct InvestmentGreenfield FDI projects into Côte d’Ivoire reached a new peak in 2016, totalling 33 projects. This could, in part, be attributed to the lifting of economic sanctions against the country by the United Nations, European Union and the United States after April 2016, as well as reflecting political and economic progress. Chart 8 shows the number of Greenfield FDI projects between 2006 and 2016.
0
5
10
15
20
25
30
35
20162015201420132012201120102009200820072006
Num
ber
of p
roje
cts
Source: fDi Markets*Data excludes retail projects
Chart 8: Greenfield FDI into Côte d’Ivoire, by project numbers, 2006-2016
Others68 projects
Switzerland9 projects
UnitedStates
9 projects
UK10 projects
Morocco17 projects
France27 projects
Côte d’Ivoire’s Greenfield FDI is diverse, receiving investments across 23 sectors in the last 10 years. Financial Services and Food and Tobacco have been the leading sectors since 2006. Combined they account for one third of total inward Greenfield projects. Communications and Business Services are the next most popular sectors for foreign investment.
Other
Business Services
Communications
Food & Tobacco
Financial Services
25
22
17
9
65
Chart 9: Greenfield FDI projects into Côte d’Ivoire, by sector, 2006-2016
Source: fDi Markets
Who invests in Côte d’Ivoire?
France is the leading source market for Greenfield FDI into Côte d’Ivoire due to its historic relationship with the country. Morocco has recently emerged as a key source market, investing annually since 2013. This could be due to six bilateral agreements that were signed in March 2013 to promote co-operation between the two states.

Country Report | Côte d’Ivoire: By the numbers
14www.AnalyseAfrica.com
IMPORTS AND EXPORTS*
Total exports, 2015: $11.84 bn Top export commodities, 2015: Cocoa (43.3%) Mineral fuels (16.8%) Edible fruit and nuts (7.8%)Pearls, precious stones, metal, coins, etc (6.4%)Rubber (4.3%)
Total imports, 2015: $9.53 bn
Top import commodities, 2015:
Mineral fuels (22.2%) Nuclear reactors, boilers, machinery, etc (10.2%) Cereals (6.85%)Vehicles other than railway, tramway (6.8%) Electrical, electronic equipment (4.9%)
*Data based on two digit HS commodity codes
TradeSince 2005, the value of Ivorian exports have increased, on average, by over 5% per annum, totalling $11.84 billion in 2015. However, the value of exports decreased by 8.8% in 2015. This was aided by a weakening of the euro, to which the CFA franc is pegged. Between 2014 and 2015 the euro fell in value from $1.33 to $1.11.
Cocoa bean exports have increased between 2005 and 2015, growing on average by 9.2% per annum. Côte d’Ivoire is the largest exporter in the world of cocoa beans, contributing 48% of the value of global cocoa bean exports in 2015.
0
2
4
6
8
10
12
14
20152014201320122011201020092008200720062005
7.258.15 8.07
9.7810.28 10.28
11.05 10.86
12.08
12.99
11.84
va
lue
of
exp
orts
(U
S$
, b
n)
Chart 10: Total value of exports ($ bn), Côte d’Ivoire, 2005-2015 Chart 11: Total value of cocoa bean exports ($ bn), World total and Côte d’Ivoire, 2005-2015
Source: DESA/UNSD, United Nations Comtrade database Source: DESA/UNSD, United Nations Comtrade database
0
2
4
6
8
10
12
20152014201320122011201020092008200720062005
7.48
10.04
3.553.05
2.042.32
3.022.492.60
1.751.441.421.47
7.317.90
9.41
8.008.02
5.61
4.574.16
3.66
World
Côte d’Ivoire
valu
e o
f e
xpo
rts
(US
$,
bn
)

15
Country Report | Côte d’Ivoire: By the numberswww.AnalyseAfrica.com
NetherlandsBelgium
France
United States
Germany
Italy
China
Nigeria
0.96
0.42
0.76
1.31
0.78
0.72
1.44
1.1
0.38
Imports
Exports
Côte d’Ivoire
(11.7%)
(15.2%)
(4.0%)
(13.8%)
(4.4%)
(12.1%
)(6.4%)
(6.5
%)
(8.1%)
(6.1%)
1.43
Trade partners The Netherlands is Côte d’Ivoire’s largest trading partner in terms of exports (12.1% of the total), while Nigeria is the country’s largest import partner (15.2%).
Cocoa is the largest export to the Netherlands, totalling $1.3 billion. The largest import from Nigeria is mineral fuels, totalling $1.4 billion.
Côte d’Ivoire’s
top 5 export partners accounted
for 39.2% of total Ivorian exports in
2015
Côte d’Ivoire’s
top 5 import partners accounted
for 49% of total Ivorian imports in
2015
Source: DESA/UNSD, United Nations Comtrade database
Graphic 2: Top trade partners, ($ bn and % share), all commodities, Côte d’Ivoire, 2015

Country Report | Côte d’Ivoire: By the numbers
16www.AnalyseAfrica.com
Doing Business in Côte d’IvoireCôte d’Ivoire is ranked 142nd globally and 21st in Africa for ease of doing business, according to the Doing Business 2017 report published by the World Bank.
The west African country has improved its global rank by 23 places since the 2013 report, the fifth largest increase in Africa. It did, however, fall three places when compared to last year’s report.
Despite ranking poorly on the overall ease of doing business, Côte d’Ivoire ranks 50th globally in starting a business category – its highest ranking out of all the sub-categories. There have also been significant improvements in the enforcing contracts and resolving insolvency categories, primarily due to business reforms.
It takes 7 days to start a business
compared to the sub-Saharan average of 27.3
days
Dealing with construction permits
was made more transparent by making
building regulations accessible online
Access to credit information
has improved by establishing a new credit
bureau
Enforcing contracts was made easier by introducing a
simplified fast-track procedure for
small claims that allow for parties’
self-representation
Business Reforms
It takes 55 days to obtain a permanent
electricity connection
compared to the sub-Saharan average of 120.4
days
A new conciliation procedure
has been introduced for companies in financial
difficulties and a simplified preventive settlement procedure for small
companies

17
Country Report | Côte d’Ivoire: By the numberswww.AnalyseAfrica.com
Banking and finance Côte d’Ivoire is regarded as having poor access to financial services. For example, there is a lack of commercial bank branches in the country, with a rate of only two branches per 1000 sq km – ranking the nation 164th in the world. According to the World Economic Forum’s Global Competitiveness Report, 22% of respondents said that access to finance was the most problematic factor for doing business in Côte d’Ivoire.
However, mobile banking has been growing significantly, in part due to a lack of confidence in financial institutions caused by the political crisis and historic problems within the banking sector. The number of registered mobile money accounts increased between 2010 and 2014, as can be seen in Graphic 3. Graphic 3: Registered mobile money accounts per 1000 adults*, Côte d’Ivoire, 2010-2014
Source: Financial Access Survey, International Monetary Fund
2014
2010
*An adult can have more than one registered account
24%
In 2014, more adults in Côte d’Ivoire had mobile
money accounts than bank accounts. The proportion
of adults with a mobile money account was the
5th
highest in the world
15%
Did you know?
Côte d’Ivoire is a member of the West African Economic and Monetary Union (UEMOA), established in 1994. There are
currently seven other members: Benin, Burkina Faso, Guinea-Bissau, Mali, Niger, Senegal and Togo. The Central Bank of West African States (BCEAO) is the monetary institution of
UEMOA
In 2014, the African Development Bank returned its headquarters to Abidjan. It had been temporarily based in
Tunis, Tunisia since the outbreak of unrest in Côte d’Ivoire in 2003
123
733
have a bank account
have a mobile account

Country Report | Côte d’Ivoire: By the numbers
18www.AnalyseAfrica.com
InfrastructureAccording to the Global Competitiveness Report’s executive opinion survey, infrastructure in Côte d’Ivoire is among the best in Africa. It ranks sixth in Africa for overall quality of infrastructure, which includes areas such as transportation, communication and energy.
Côte d’Ivoire performs relatively well for its quality of air, road and port infrastructure.
In the news
In December 2016, the African Development Bank Group approved a loan of $598 million to Côte d’Ivoire aimed at significantly improving urban transport in the city of Abidjan. The project will be implemented between March 2017 and December 2021 and includes:
• the development of 87.9 km of fast urban roads• a 1400m bridge• the rehabilitation of traffic lights at 89 intersections
Location Rating (1-7) African Rank (1-35)Global rank
(0-138)
Rwanda 4.62 1 41
Mauritius 4.58 2 42
Namibia 4.53 3 45
Morocco 4.49 4 50
Kenya 4.30 5 56
Côte d’Ivoire 4.24 6 60
Table 4: Quality of overall infrastructure, rating 1 – 7*, African top 6, 2016
Source: Global Competitiveness Report 2016-2017, World Economic Forum*[1 = extremely underdeveloped; 7 = extensive and efficient]
2nd 2nd
4th
Quality of air infrastructure in Africa
Quality of port infrastructure in Africa
Quality of road infrastructure in Africa
Source: Global Competitiveness Report 2016-2017, World Economic Forum

Focus on: Electricity
In 2016, the National Development Plan was adopted as part of the government’s aim to further develop infrastructure in the country coinciding with the high rate of economic growth. It called for an expansion of the energy sector through $20 billion investment by 2030 by the state and other donors. It also envisions adding 150 mw to the grid annually by 2020. The plan will give priority to hydro-electric projects.
Location Score (0-7)African rank
(1-35)Global rank
(1-138)
Côte d’Ivoire 3.58 8 100
Gambia 3.47 9 101
Mali 2.83 20 116
Liberia 2.82 21 117
Ghana 2.21 27 126
Nigeria 1.44 35 137
Table 5: Quality of electricity supply, rating 1-7*, African rank and global rank, selected west African economies, 2016
Source: Global Competitiveness Report 2016-2017, World Economic Forum *[1 = extremely unreliable; 7 = extremely reliable]
19
Country Report | Côte d’Ivoire: By the numberswww.AnalyseAfrica.com
Côte d’Ivoire had the cheapest electricity in
west Africa in 2016:
13.9c per kWh*
23% of Côte d’Ivoire’s electricity supply
came from renewable sources in 2013
88%of Ivorians in urban areas
have access to electricity
(2012)
Côte d’Ivoire ranks number one in west Africa in terms of its quality of electricity according to the Global Competitiveness Report. In Africa, it ranks eighth with a score of 3.58 (see above). Globally, however, Côte d’Ivoire ranks 100th out of the 138 countries featured in the report.
20001.0 mn kW
20041.2 mn kW
20101.27 mn kW
Graphic 4: Total installed electricity capacity (mn kW), Côte d’Ivoire, 2000-2014
20141.54 mn kW
Source: International Energy Statistics, United States Energy Information Administration
Did you know?Côte d’Ivoire is a net
exporter of electricity. It is estimated that it exported 1.74 billion
kWh in 2016Côte d’Ivoire’s capacity for electricity generation has increased. In 2000, it had a capacity of 1 million kW. By 2014, this had risen to 1.54 million kW – the third greatest capacity in west Africa after Ghana (2.83 million kW) and Nigeria (9.95 million kW).
Sources: Doing Business 2017, The World Bank; World Development Indicators, The World Bank; United States Energy Information Administration*The price of electricity is expressed in US cents

Country Report | Côte d’Ivoire: By the numbers
20www.AnalyseAfrica.com
LabourIn 2017, there will be an estimated 8.38 million people employed in Côte d’Ivoire, with a labour force participation rate of 67%. Of those employed, approximately 62% are male and 38% female (ages 15+).
The total number of people employed in each broad sector has increased annually since 2012, and this trend is expected to continue in the future. The largest sector of employment is agriculture – employing 56% of the total workforce – despite the fact that it only contributes around 18% to GDP.
The share of those employed in agriculture has fallen from 60% in 2012 to 57% in 2016. It is forecast to fall further still to 53% by 2021. Both industry and services are expected to increase their share of employment by 2021, to 6% and 41% respectively.
EMPLOYMENT, 2017
Total, 15+ 8.38m
Total, male, 15+ 5.22m (62%)
Total, female, 15+ 3.15m (38%)
Agriculture, 15+ 4.69m (56%)
Industry, 15+ 0.48m (6%)
Services, 15+ 3.21m (38%)
UNEMPLOYMENT, 2017
Total unemployment, 15+ 0.86m
Youth unemployment, 15+ 0.34m
Unemployment rate, 15+ 9.3%
Youth unemployment rate, 15+ 13.8%
ANNUAL LABOUR COSTS, $
Minimum wage, 2016 1326
0
2
4
6
8
10
2021202020192018201720162015201420132012
9.35
8.38
7.27
Pers
ons (
mn) Services
Industry
Agriculture
Total employment
Chart 12: Employment by sector, persons (m), Côte d’Ivoire, 2012-2021
Source: International Labour Organization (ILO Department of Statistics)
Sources: Doing Business 2017, The World Bank; International Labour Organization (ILO Department of Statistics)

21
Country Report | Côte d’Ivoire: By the numberswww.AnalyseAfrica.com
TelecomsTelephones and broadband The main forms of telecommunications in Côte
d’Ivoire are the radio, television, mobile phones and the internet. Radio stations are owned by both the state and private organisations. As of 2015, there were no privately owned television stations, meaning all televised news is state controlled. Since 2015, Côte d’Ivoire has been installing digital transmitters around the country with plans to switch over to digital broadcasting by 2020.
Like many other African countries, there has been significant uptake of mobile phones. In 2015, it is estimated that there were only 277,248 landlines in Côte d’Ivoire. On the other hand, there were 25.4 million mobile phones. There was an average growth rate in mobile phone subscriptions of 17% between 2007 and 2015.
2.4 mn
7.5 mn
13.2 mn
17.3 mn
19.4 mn
25.4 mn
2005
2007
2009
2011
2013
2015
Internet penetration remains low. There are only an estimated 4.89 million internet users in Côte d’Ivoire, or around 21% of the population.
Similar to the telephone market, internet access in Côte d’Ivoire is dominated by mobile broadband as opposed to fixed wired broadband. The cost of mobile broadband was much cheaper to have in 2014 than fixed broadband.
97.9%of the population were covered by a mobile
network in 2015
Free roamingBy March 2017, roaming
charges between Burkina Faso, Côte d’Ivoire,
Guinea, Mali and Senegal will not apply
Source: International Telecommunication Union
Type Price ($) % of average wage
Mobile broadband* 10.11 9
Fixed broadband^ 37.50 33
Sources: Analyse Africa based on International Telecommunication Union and Doing Business 2017, The World Bank*Data is correct for price of a 500mb plan ^Data is correct for monthly subscription charge
Table 6: Price of mobile and fixed broadband ($) and percentage of average wage, Côte d’Ivoire, 2014
Graphic 5: Number of mobile phone subscriptions (m), Côte d’Ivoire, 2005-2015

Country Report | Côte d’Ivoire: By the numbers
22www.AnalyseAfrica.com
EducationThe education system in Côte d’Ivoire is comprised of three stages; primary education (free and compulsory, lasting six years), secondary education (lasting seven years) and tertiary education. There are a number of private education facilities in Côte d’Ivoire and 11 universities.
According to the World Economic Forum’s Global Competitiveness Report, the quality of primary education in Côte d’Ivoire is improving, although it remains relatively low. In 2016, it ranked seventh in Africa and third in west Africa after Cape Verde and Gambia, improving its rating from 3.05 in 2008 to 4.07.
There are large numbers of Ivorian children not in the education system, and schools suffer from high drop out rates. However, gradual improvements are evident. Enrolment is increasing and dropout rates are declining. In 2015, there were 3.37 million children in primary education, compared to 1.94 million enrolled in 2000, and the number of out of school children had decreased to 0.75 million (from 1.13 million). There are also increasing numbers of girls attending primary school – in 2000 the enrolment rate was 48.28%, whereas in 2015 it had increased to 74.71%.
0.0
0.5
1.0
1.5
2.0
2.5
3.0
3.5
Out of school children of primary age
Enrolment in primary education
201520092000
Num
ber o
f chil
dren
(mn)
3.37
2.38
1.94
1.411.13
0.75
Enrolment in primary education
Out of school children of primary age
Source: UNESCO Institute for Statistics (UIS), January 2017
Chart 14: Enrolment in primary education and number of out-of-school children of primary age (m), Côte d’Ivoire, 2000-2015
0
1
2
3
4
5
Mauritania
Gambia
Nigeria
Côte d'Ivoire
20162014201220102008
Ratin
g (1
-7)
Chart 13: Quality of primary education, rating 1-7*, selected west African countries, 2008-2016
Source: Global Competitiveness Report 2016-2017, World Economic Forum*[ 1 = extremely poor primary education; 7 = excellent primary education]
23
Country Report | Côte d’Ivoire: By the numberswww.AnalyseAfrica.com
Literacy
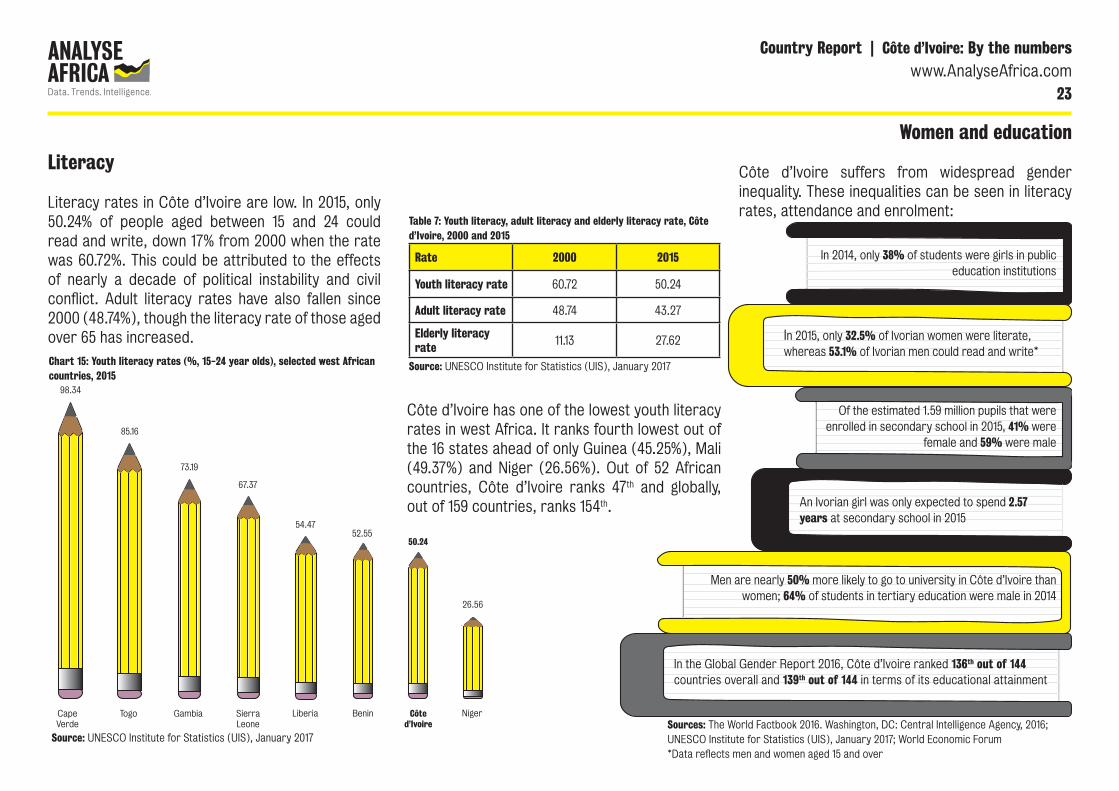
Literacy rates in Côte d’Ivoire are low. In 2015, only 50.24% of people aged between 15 and 24 could read and write, down 17% from 2000 when the rate was 60.72%. This could be attributed to the effects of nearly a decade of political instability and civil conflict. Adult literacy rates have also fallen since 2000 (48.74%), though the literacy rate of those aged over 65 has increased.
Rate 2000 2015
Youth literacy rate 60.72 50.24
Adult literacy rate 48.74 43.27
Elderly literacy rate
11.13 27.62
Sources: The World Factbook 2016. Washington, DC: Central Intelligence Agency, 2016; UNESCO Institute for Statistics (UIS), January 2017; World Economic Forum*Data reflects men and women aged 15 and over
Men are nearly 50% more likely to go to university in Côte d’Ivoire than women; 64% of students in tertiary education were male in 2014
In 2015, only 32.5% of Ivorian women were literate, whereas 53.1% of Ivorian men could read and write*
Of the estimated 1.59 million pupils that were enrolled in secondary school in 2015, 41% were
female and 59% were male
An Ivorian girl was only expected to spend 2.57 years at secondary school in 2015
In 2014, only 38% of students were girls in public education institutions
In the Global Gender Report 2016, Côte d’Ivoire ranked 136th out of 144 countries overall and 139th out of 144 in terms of its educational attainment
Table 7: Youth literacy, adult literacy and elderly literacy rate, Côte d’Ivoire, 2000 and 2015
Cape Verde
Togo Gambia Sierra Leone
Liberia Benin Côte d’Ivoire
Niger
98.34
85.16
73.19
67.37
54.4752.55
50.24
26.56
Source: UNESCO Institute for Statistics (UIS), January 2017
Côte d’Ivoire has one of the lowest youth literacy rates in west Africa. It ranks fourth lowest out of the 16 states ahead of only Guinea (45.25%), Mali (49.37%) and Niger (26.56%). Out of 52 African countries, Côte d’Ivoire ranks 47th and globally, out of 159 countries, ranks 154th.
Chart 15: Youth literacy rates (%, 15-24 year olds), selected west African countries, 2015
Source: UNESCO Institute for Statistics (UIS), January 2017
Women and education
Côte d’Ivoire suffers from widespread gender inequality. These inequalities can be seen in literacy rates, attendance and enrolment:

Country Report | Côte d’Ivoire: By the numbers
24www.AnalyseAfrica.com
Healthcare
Until 2012, the healthcare system in Côte d’Ivoire was free to all Ivorians. However due to unsustainable costs and demand, free healthcare was cut and is now only available to expectant mothers and their children.
Côte d’Ivoire spent 5.72% of its GDP on health in 2014, just below the African average of 6%. This figure has reduced year on year since 2011 from a 6.42% high, despite the ongoing healthcare issues in the country. In 2014, 70.6% of the total amount spent on health in Côte d’Ivoire came from private sources, the fourth highest in west Africa.
The number of medical staff in Côte d’Ivoire is low. This is in part due to political instability within the country and ‘brain drain’. According to the United Nations International Children’s Emergency Fund (UNICEF), thousands of health and medical workers were displaced or left the country because of conflict. In 2010, it was estimated that there were 0.14 physicians and 0.48 nurses and midwives per 1000 people. In comparison, in Egypt there were 3.52 nurses and midwives and 2.83 physicians per 1000 people. However, within west Africa, Côte d’Ivoire had the second highest amount of physicians per 1000 people, behind Cape Verde (0.30 per 1000).
HEALTH
Life expectancy at birth 58.7 years
Infant mortality rate57.2 deaths per 1000 live births. This places
Côte d’Ivoire 22nd globally (2016)
Maternal mortality rate645 deaths per 100,000 live births (2015)
Health expenditure5.7% of GDP (2014)
HIV/Aids prevalence in adults3.17% of 15-49 year olds (2015)
Children under 5 underweight15.7% (2012)
Prevalence of adult obesity8% (2014)
Source: The World Factbook 2016. Washington, DC: Central Intelligence Agency, 2016
LocationLife expectancy
(years)African rank
(1-52)
Morocco 76.9 1
Eritrea 64.9 12
Côte d’Ivoire 58.7 32
Uganda 55.4 41
Chad 50.2 52
Source: The World Factbook 2016. Washington, DC: Central Intelligence Agency, 2016*Includes estimates
Table 8: Life expectancy at birth and African rank, selected African economies, 2016*
Life expectancy in Côte d’Ivoire is low, ranking 32nd in Africa and 203rd globally (out of 224 countries). The average lifespan is 58.7 years old. Females are more likely to outlive males living at 65.4 years to 60.7 years respectively.

25
Country Report | Côte d’Ivoire: By the numberswww.AnalyseAfrica.com
Public health
Top five causes of death, Côte d’Ivoire (2012)
1
2
3
4
5
HIV/Aids
Lower respiratory infections
Malaria
Diarrhoeal diseases
Stroke
HIV/Aids was more prevalent in Côte
d’Ivoire in 2014 than in Nigeria (3.2%),
affecting
3.5% of 15-49 year olds
21,000estimated new HIV/
Aids infections in Côte d’Ivoire in 2015
An estimated
8.7mIvorians had malaria
in 2013with approximately
16,000 dying from the
disease
Did you know?
Despite sharing a border with three of the worst-affected west African
states in 2013, Côte d’Ivoire escaped the Ebola epidemic. This is mainly
due to a vast government awareness campaign, as well as banning
international flights and border crossings from the affected countries
STOP EBOLA
Did you know?
Côte d’Ivoire (66.6 per 1000 births) had a higher
infant mortality rate in 2015 than conflict-ridden South Sudan (60.3 per
1000 births)
Immunisation coverage is increasing. In 2014,
76%of children under 2
were vaccinated against diphtheria but this had
risen to
83%in 2015 In 2015,
31.2% of Ivorians in rural areas did not have
access to clean water
77.5% of Ivorians did not
have access to proper sanitation facilities in 2015
Sources: BBC News; World Development Indicators, The World Bank; World Health Organization; The World Factbook 2016. Washington, DC: Central Intelligence Agency, 2016; UNAIDS

[email protected] | AnalyseAfrica.com
Editor
Glenn Barklie
Analysts James PattersonRachel Woods
Analyse Africa
Published byFinancial Times LimitedNumber One Southwark BridgeLondon, SE1 9HL
Analyse Africa, a service from the Financial Times, is a digital data platform which aggregates macroeconomic data on Africa’s 54 countries from leading global sources. Featuring over 1.93 million data records and 5000+ indicators it allows fast access to quality checked data. Trend changes are highlighted and explained. Data categories include banking & finance, economic potential, education, environment, foreign direct investment, infrastructure, labour, political stability, social dynamics and trade.
www.AnalyseAfrica.com
For further information, please contact:
Disclaimer: This report was created using data from the Analyse Africa database. While care has been taken in programming the analysis and presentation of data, anomalies may occur. The Financial Times Ltd accepts no responsibility for the completeness, accuracy or otherwise of the content of the report. The report does not constitute any form of advice, recommendation, representation or endorsement and is not intended to be relied on in making (or refraining from making) any specific investment or other decisions. Appropriate independent advice should be obtained before making any such decision.
To download the digital version go to: www.cotedivoirereport.analyseafrica.com
Need macroeconomic data on Africa?
Request a demonstration of the Analyse Africa data portal.
www.AnalyseAfrica.com/contact-us
+44 (0)20 7775 6900
This is Africa, a service from the Financial Times, examines African business and politics in a global context, making sense of the relationships that Africa is building with the rest of the world. It challenges international preconceptions about the continent and identifies the opportunities and risks in this dynamic business environment.
For complimentary access to articles register at: www.thisisAfricaonline.com/register
www.ThisisAfricaonline.com

AXA AFRICA SPECIALTY RISKS
There is a significant role for Specialty Risks insurance in the Ivory Coast, especially with regards to major infrastructure and energy projects. To provide some examples, there can be a surety to cover against contractors defaulting during the construction phase; Erection All Risks insurance to cover the risks associated with a large project; Delay in Start Up cover to make up for some of the financial loss when a project is delayed by unforeseen events; and operational covers to fund getting a business back to operational mode after a claim event and even to offset the profitability impact.
Infrastructure, in particular in the energy field, is another major challenge across Africa, with many governments struggling to meet demand. Innovative Insurance products can be offered to the energy industry, beyond providing Physical Damage and Business Interruption.
It is also extremely important to emphasise the impact of Political Risk on businesses in Africa, here too Corporate and Specialty risk insurance can have an important role to play. Political Risk insurance can cover cases where it is not possible to repatriate loan payments or dividends, or where a government contract
Corporate and Specialty insurance, supporting business growth across Africa
is not honoured. Asset risks insurance can protect fixed assets, such as factories, mines and other industrial investments, against expropriation and licence cancellation, or mobile assets against confiscation and wilful destruction. There is Political Violence and Terrorism Insurance providing global war, terrorism and political violence cover, War and Strikes cover for transit risk, and Third Party Terrorism Liability amongst others.
Despite some strong headwinds such as the recent commodity shock or the political instability of some territories, Africa is on its way to growth. The provision of tailored Corporate and Specialty Risks solutions is a crucial de-risking tool to make business growth sustainable and provide investors with the comfort and the protection they need to keep investing in African countries and businesses.
Eric Malterre, Chief Underwriting Officer, AXA Africa Specialty Risks
To contact us please visit www.AXA-ASR.com to find your local representative.
Corporate and Specialty insurance is a segment of the insurance industry specifically designed for unusual and difficult to assess risks that can be challenging to place in traditional markets.
AX11 Advert Amend March 2017 P6_ART.indd 1 21/03/2017 09:18