Embed Size (px)
Citation preview

Natural England Commissioned Report NECR036c
Countryside and Rights of Way (CROW) Act 2000 (Part 1): National Open Access Visitor Survey (2006-2008)
Access Management Report
www.naturalengland.org.uk
First published 12 September 2011

Foreword Natural England commission a range of reports from external contractors to provide evidence and advice to assist us in delivering our duties. The views in this report are those of the authors and do not necessarily represent those of Natural England.
Background The Countryside and Rights of Way (CROW) Act 2000 (Part 1) came into effect across England and Wales between 2004 and 2005. The Act provides a new right of open access allowing people to walk freely over areas of mapped open country (mountain, moor, heath, down) and registered common land.
The National Open Access Monitoring Programme was set up to evaluate the long-term impact of implementing the new access rights by identifying the level of awareness, uptake, use, economic and biodiversity impacts from the introduction of the Open Access rights across England.
The National Open Access Visitor Survey (NOAVS) 2006 - 2008 represents one of the largest elements of the monitoring programme. It was set up to provide site specific and spatial use data of actual users of Access Land. The monitoring techniques developed and tested are to be used to guide the development of standard on-site visitor monitoring approaches and the findings guide integrated access management best practice that can be used to deliver wider Access & Engagement outcomes.
The findings have already been used to inform the reassessment of restrictions on specific sites of biodiversity and land management concern to understand whether positive access management or statutory restrictions are proving effective in protecting sensitive habitats and species to access. The findings are to also inform future Open Access regulation, communication activity and integrated access delivery. The implementation of the Coastal
Access programme and the development of its evaluation and monitoring framework will also be informed.
This Commissioned Report is the main Access Management Report outlining the detailed findings of the NOAVS designed to inform the effectiveness of management across access land implemented via the Access Management Grant Scheme (AMGS). It covers the full three year survey and draws comparisons across the three year period.
This report is being published as part of a package of reports relating to monitoring the impacts of (CROW) Act 2000 (Part 1). These include:
Executive Summary, Communications and Access Management Commissioned Reports of the NOAVS (2006 to 2008) published in three parts NECR036a, NECR036b and NECR036c;
Breeding Bird Survey (BBS) Pilot Study (2006) NECR040; and
Upland Breeding Bird Survey (UBBS) (2007) NECR041.
This report should be cited as:
Johnson, C., Taylor, K., Houldin, C., Race, H. & Birtles, J. 2009. Countryside and Rights of Way (CROW) Act 2000 (Part 1): National Open Access Visitor Survey (2006-2008) - Access Management Report. Natural England Commissioned Report,
Number NECR036c.
Natural England Project Manager - Rob Keane, 3rd Floor, Bridgewater House, 60 Whitworth Street, Manchester, M1 6LT [email protected]
Contractor - Christine Johnson of AECOM, 1 New York Street, Manchester, Lancashire, M1 4HD and Ken Taylor of Asken Ltd, 17 Hayfell Rise, Kendal, Cumbria, LA9 7JP
Keywords - Visitor monitoring, modelling, access, assessment, landscape, upland breeding birds, survey, open access, access management, restrictions, uptake, awareness, CROW ACT 2000, impact long-term, biodiversity, on-site, toolkit, visitor use, levels and patterns, observations, questionnaire, interview, national sample, habitat regulations 2010
Further information This report can be downloaded from the Natural England website: www.naturalengland.org.uk. For information on Natural England publications contact the Natural England Enquiry Service on 0845 600 3078 or e-mail [email protected].
You may reproduce as many individual copies of this report as you like, provided this is not for commercial purposes, and such copies stipulate that copyright remains with Natural England, 1 East Parade, Sheffield, S1 2ET
ISSN 2040-5545
© Natural England and other parties 2011


Canford Heath
Bowland Fell
High Cup Nick Cumbria
CROW Monitoring
Access Management Report: Three Year Monitoring Surveys at Open Access Land (2006-2008)
Natural England
May 2009

Prepared by: ....... Approved by: ................................................. Christine Johnson and Ken Taylor Associate Director Director (Asken)
CROW Monitoring
Access Management Report: Three Year Monitoring Surveys at Open Access Land (2006-2008)
Rev No Comments Date
1 Draft 20.03.09
2 Revised Draft 30.04.09
3 Third Draft 28.05.09
4 Final Report 01.06.09
Lynnfield House, Church Street, Altrincham, Cheshire, WA14 4DZ Telephone: 0161 927 8200 Fax: 0161 927 8499 Website: http://www.fabermaunsell.com Job No 48218 Reference Date Created May 2009 This document has been prepared by Faber Maunsell Limited (“Faber Maunsell”) for the sole use of our client (the “Client”) and in accordance with generally accepted consultancy principles, the budget for fees and the terms of reference agreed between Faber Maunsell and the Client. Any information provided by third parties and referred to herein has not been checked or verified by Faber Maunsell, unless otherwise expressly stated in the document. No third party may rely upon this document without the prior and express written agreement of Faber Maunsell. j:\tprojects\48218talt_crow monitoring\reports\all years combined\final versions\access management report 2006-2008 crow monitoring.doc
1 Introduction ..................................................................................................................... 5 1.1 Background ........................................................................................................... 5 1.2 Objectives ............................................................................................................. 5 1.3 Site Selection ........................................................................................................ 6 1.4 Fieldwork Summary ............................................................................................ 12 1.5 Weighting of Data ............................................................................................... 13 1.6 Report Structure .................................................................................................. 13
2 Visits to Open Access Land ......................................................................................... 16 2.1 Introduction ......................................................................................................... 16 2.2 Visitor Profile ....................................................................................................... 16 2.3 Visitor Demographics .......................................................................................... 16 2.4 Visitor Characteristics ......................................................................................... 20 2.5 Visitor Patterns .................................................................................................... 22 2.6 Visitor Activities ................................................................................................... 28 2.7 Summary ............................................................................................................. 35
3 Using Open Access Land ............................................................................................. 38 3.1 Introduction ......................................................................................................... 38 3.2 Open Access Awareness .................................................................................... 38 3.3 Usage of Sites ..................................................................................................... 44 3.4 Use of Open Access Land – National Sample ................................................... 44
4 Visitors with Dogs ......................................................................................................... 55 4.1 Introduction ......................................................................................................... 55 4.2 Spatial analysis of Dogs on site from Observation Data – within/outside of dog
restriction period ................................................................................................. 66
5 Other Activities on Open Access Land ....................................................................... 69 5.1 Background ......................................................................................................... 69
6 Patterns of Use .............................................................................................................. 72 6.1 Background ......................................................................................................... 72 6.2 National Sample Sites ........................................................................................ 72 6.3 Other Sites .......................................................................................................... 78 6.4 South Pennine Moors ......................................................................................... 78 6.5 North Pennines Area of Outstanding Natural Beauty (AONB) ........................... 80 6.6 Bowland Fell ....................................................................................................... 83 6.7 Sunbiggin Tarn .................................................................................................... 85 6.8 Dorset Heaths ..................................................................................................... 86 6.9 North Norfolk Coast ............................................................................................ 93 6.10 Lancashire .......................................................................................................... 94 6.11 Cumbria .............................................................................................................. 95 6.12 Shropshire ........................................................................................................... 96 6.13 Suffolk ................................................................................................................. 97 6.14 Dorset Downlands............................................................................................... 99 6.15 Visitor Numbers ................................................................................................ 100 6.16 Entry Points ....................................................................................................... 103
7 Summary and Conclusions ........................................................................................ 105 7.1 Introduction ....................................................................................................... 105 7.2 Summary of Findings: National Sample of Sites .............................................. 105 7.3 Implications for Access Management ............................................................... 108 7.4 Comparison of findings from National Sample Survey and Lake District
Sample .............................................................................................................. 109 7.5 Overall Conclusions .......................................................................................... 109
Table of Contents

7.6 Recommendations ............................................................................................ 111
Annex 1 ..................................................................................................................................... 114 Table 1: Key to Local Monitoring Sites shown in Figure 1.3 ......................................... 114 Details of the survey periods – Interviews Recorded .................................................... 116 Questionnaires .............................................................................................................. 117 2006 – National Monitoring Survey ............................................................................... 117 Observation Survey Form 2006 .................................................................................... 128 2007 – National Monitoring Survey ............................................................................... 130 2008 – National Monitoring Survey ............................................................................... 144 Observation record ........................................................................................................ 156 2007 – Local Monitoring Survey.................................................................................... 159 2008 – Local Monitoring Survey.................................................................................... 167 Weighting of Data .......................................................................................................... 175 Estimate of Number of Trips per year ........................................................................... 180 Visitor Numbers ............................................................................................................. 181 Spatial Analysis ............................................................................................................. 183 Dataset Interaction ........................................................................................................ 184 Production of Plots ........................................................................................................ 184 Analysis of Walking Routes ........................................................................................... 185 Access to Each Site ...................................................................................................... 185 Entry and Exit Point Analysis ........................................................................................ 185 Dog Behaviour............................................................................................................... 186
Annex 2 ..................................................................................................................................... 188 Lake District National Park Local Monitoring Survey .................................................... 188
Table 1.1 Site Types Included in the Survey ............................................................................... 11 Table 1.2 Sample for 2006-2008 Survey..................................................................................... 12 Table 2.1 Percentage of Male Respondents by Site Type .......................................................... 17 Table 2.2 Age Group Visitors Interviewed ................................................................................... 17 Table 2.3 Employment status of visitors interviewed .................................................................. 18 Table 2.4 Ethnic Group of Visitors Interviewed ........................................................................... 19 Table 2.5 Group Size of Visitors Interviewed .............................................................................. 20 Table 2.6 Average group size by site type .................................................................................. 20 Table 2.7 Dog in group ................................................................................................................ 21 Table 2.8 Percentage of respondents accompanied by dogs by site type.................................. 21 Table 2.9 Frequency of visiting site ............................................................................................. 22 Table 2.10 Frequency of visiting site, by site characteristics ...................................................... 23 Table 2.11 Estimated annual trips from survey respondents ...................................................... 24 Table 2.12 How did you become aware of the Area of Land? .................................................... 24 Table 2.13 Where have you travelled from to Site? .................................................................... 25 Table 2.14 Proportion Visiting Site while on holiday/away from home by Site Type .................. 25 Table 2.15 Distances travelled to Site ......................................................................................... 26 Table 2.16 Average mileages to site, by site type ....................................................................... 26 Table 2.17 Mode of transport used to Site? ................................................................................ 27 Table 2.18 Mode to site by site type – all years .......................................................................... 27 Table 2.19 Activities participated in at site (all) ........................................................................... 28 Table 2.20 Main reason for being at Site .................................................................................... 29 Table 2.21 Main activity at site by site type ................................................................................. 30 Table 2.22 Reasons for Visiting Site ........................................................................................... 31 Table 2.23 Did the need to get exercise feature in your decision to visit the countryside today?
........................................................................................................................................ 31 Table 2.24 Reasons by Site Type (2006-2008 inclusive) ............................................................ 32 Table 2.25 Duration of Visit to Site .............................................................................................. 33 Table 2.26 Average time spent at site by site type (hours) (NM Sites only) ............................... 33 Table 2.27 Visitor Spend at Site .................................................................................................. 34 Table 2.28 Average Spend at site by Site Type (£) (NM Sites only) ........................................... 35 Table 3.1 Proportion of Visitors Recognising Symbol (NM Sites only) ....................................... 39 Table 3.2 Where Sign has been seen ......................................................................................... 39 Table 3.3 Proportion of Visitors Seeing Sign at the Site being visited (NM Sites only) .............. 40 Table 3.4 What does the symbol represent? .............................................................................. 40 Table 3.5 Awareness of Open Access and Right to Roam ......................................................... 41

Table 3.6 Proportion of Visitors Seeing Sign at the Site being visited (NM Sites only) .............. 43 Table 3.7 Walks on Site, by Year (National Sample only) .......................................................... 44 Table 3.8 Walks on Site, by Main Activity (National Sample only) .............................................. 45 Table 3.9 Proportions of walk on PROW and OAL by site type .................................................. 48 Table 3.10 Distance band of walk (km) ....................................................................................... 50 Table 3.11 Walks at Site by Visitor Type ..................................................................................... 50 Table 3.12 Walks at Site by Visitor Awareness ........................................................................... 51 Table 3.13 Reasons for Staying on PROW ................................................................................. 51 Table 3.14 What influenced your decision to go off Public Rights of Way/off paths? ................. 52 Table 4.1 How long have you been bringing your dog to this area of land for walking? ............. 56 Table 4.2 Timing of Visit by Site Type ......................................................................................... 57 Table 4.3 What aspects about this area of land make it good for bringing a dog here? ............. 58 Table 4.4 Proportion saying “to let dog off lead” by site type ...................................................... 59 Table 4.5 Proportion saying “no restrictions on dogs” by site type ............................................. 60 Table 4.6 Propensity to keep dog(s) on a lead on this site ......................................................... 60 Table 4.7 Propensity to keep dog(s) on a lead on this site by time of visit, AMGS sites ............ 61 Table 4.8 Under what circumstances do you keep your dog(s) on a lead on this site? (NM) –
unprompted responses ................................................................................................... 61 Table 4.9 Under what circumstances do you keep your dog(s) on a lead, to heel off the lead or
free roaming off the lead on this site? (LM – response to „On Lead‟) ............................. 62 Table 4.10 Reasons Given for not keeping dog on lead ............................................................. 63 Table 4.11 What would you say are issues to be aware of when walking with a dog in the
countryside? .................................................................................................................... 63 Table 4.12 Issues mentioned by site type (2006-2008 inclusive) ............................................... 64 Table 4.13 Usage of Open Access Land by People With Dog.................................................... 65 Table 4.14 Usage of Open Access Land by People With Dog.................................................... 65 Table 4.15 Observed Usage of Site - Dogs‟ Location on site ..................................................... 66 Table 4.16 Observed Usage of Site – Dogs on PROW .............................................................. 66 Table 4.17 Observed Usage of Site - Dogs‟ Location on site National Sample ......................... 67 Table 6.1 CROW Impact Assessment National Sample Sites .................................................. 73 Table 6.2 CROW Impact Assessment South Pennine Moors ................................................... 78 Table 6.3 CROW Impact Assessment at Sites in North Pennines AONB .................................. 80 Table 6.4 CROW Impact Assessment at Bowland Fell .............................................................. 83 Table 6.5 CROW Impact Assessment at Sunbiggin Tarn .......................................................... 85 Table 6.6 CROW Impact Assessment at Dorset Heaths ........................................................... 86 Table 6.7 CROW Impact Assessment North Norfolk Coast ...................................................... 93 Table 6.8 CROW Impact Assessment Lancashire .................................................................... 94 Table 6.9 CROW Impact Assessment Cumbria (outside of National Park and North Pennines
AONB) ............................................................................................................................. 95 Table 6.10 CROW Impact Assessment at Shropshire ............................................................... 96 Table 6.11 CROW Impact Assessment at Suffolk ..................................................................... 97 Table 6.12 CROW Impact Assessment at Dorset Downlands ................................................... 99 Table 6.13 Visitor and Dog Indices ........................................................................................... 101 Table 6.14 Visitor Indices .......................................................................................................... 101 Table 6.15 Dog Indices.............................................................................................................. 102 Table 6.16 Visitor and dog indices by site type ......................................................................... 103 Visitor and Dog Indices.............................................................................................................. 182 Figure 1.1 National Sample Sites .................................................................................................. 8 Figure 1.2 National NCA Sites. ..................................................................................................... 9 Figure 1.3 National NCA Sites. ................................................................................................... 10 Figure 2.1 Gender of Visitors Interviewed ................................................................................... 16 Figure 2.2 Health status of visitors interviewed “Any longstanding illness or disability that
impaired their work or things they do” ............................................................................. 18 Figure 2.3 Proportion of Visitors Accompanied by Dogs ............................................................ 22 Figure 2.4 Main reason for being at site, by sample type ........................................................... 29 Figure 2.5 Visitor spend by trip origin .......................................................................................... 34 Figure 3.1 Open Access Symbol Recognition ............................................................................. 38 Figure 3.2 Are you aware that this area of land is Open Access Land? ..................................... 42 Figure 3.3 Proportion of walk on Open Access Land (off PROW) ............................................. 46 Figure 3.4 Respondents‟ Estimate of Proportion of Walk on Open Access Land (off PROW) .. 47 Figure 3.5 Proportion of visitors observed on Open Access Land ............................................. 47

Figure 3.6 Patterns of usage of Open Access Land ................................................................... 48 Figure 3.7 Average Walk Lengths on Open Access Land (km) ................................................. 49 Figure 4.1 Proportion of Visitors Interviewed who were Accompanied by Dogs......................... 55 Figure 4.2 Proportion of Visitors with Dogs by Time of year ....................................................... 56 Interviewing at Open Access Land ................................................................................................ 5 Visitors at Malvern Hills ............................................................................................................... 19 Dog Walking – Severn Ham ........................................................................................................ 22 Heather – Canford Heath ............................................................................................................ 30 Climbing – South Pennine Moors ................................................................................................ 30 Moorland (North Pennines) ......................................................................................................... 36 Urban Site .................................................................................................................................... 36 Open Access Symbol .................................................................................................................. 38 Dog off lead, on path, Canford Heath .......................................................................................... 57

1 Introduction
Faber Maunsell Access Management Report: Three Year Monitoring Surveys at Open Access Land (2006-2008) 5
1.1 Background
The implementation of the Countryside and Rights of Way (CROW) Act 2000 (Part I) created a
new right of public access across England and Wales to areas mapped as Open Access Land.
The new right of access, known as „Open Access‟, is being monitored in England by Natural
England outside of National Parks1 by the carrying out of a monitoring programme to identify
the uptake and impacts from implementation of the legislation. As part of this programme, a
three year „on site monitoring survey‟ has been undertaken to establish public use of the new
right across a selection of representative sites, gathering key customer information on
understanding and awareness of the new right, and the level and pattern of recreational use of
Open Access Land.
In 2005 the Countryside Agency (CA) commissioned ASK for Research to carry out an on-site
monitoring pilot survey to help inform the approach for a further three-year full scale monitoring
contract. Consultants Faber Maunsell in partnership with Asken Ltd were commissioned in
June 2006 to undertake the three years of on-site monitoring at a number of Open Access Land
sites. The monitoring surveys involved undertaking interviews with, and making observations
on, visitors to those sites. Natural England superseded the CA in October 2006 to take the
contract forward.
This report presents the findings from the three year study, and examines trends emerging from
comparisons of surveys conducted each year since 2006.
1.2 Objectives
The three-year study builds on the pilot survey, to provide information to Natural England that
will enable it to:
Capture baseline figures of public use of the new right of access across a selection of sites;
Establish levels of public awareness and understanding of their new rights and
responsibilities;
Profile visitors;
Understand visitor behaviour;
Monitor visitor satisfaction;
Establish trends and changes in visitor levels and patterns of use;
Collate information on levels and patterns of use to enable the future validation of the
predictive model;
Identify potential impacts on sites with biodiversity value;
Identify the effectiveness of different forms of statutory restriction; and
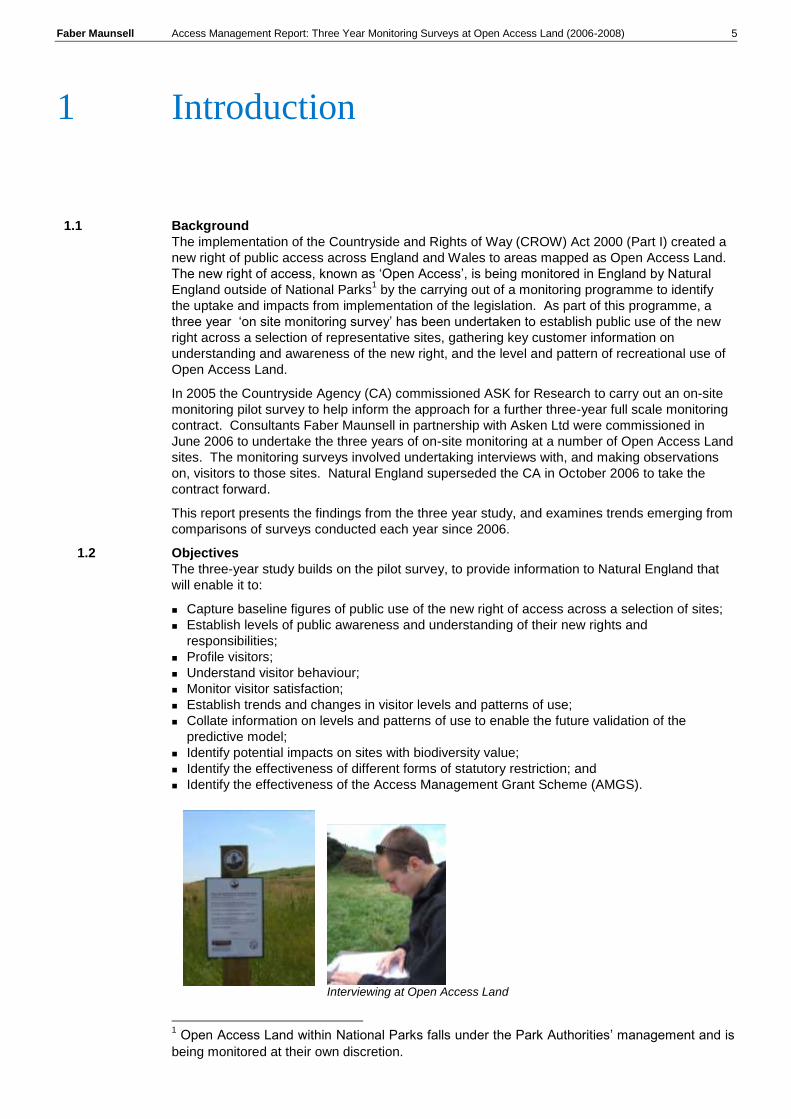
Identify the effectiveness of the Access Management Grant Scheme (AMGS).
Interviewing at Open Access Land
1 Open Access Land within National Parks falls under the Park Authorities‟ management and is
being monitored at their own discretion.
1 Introduction

Faber Maunsell Access Management Report: Three Year Monitoring Surveys at Open Access Land (2006-2008) 6
The report also provides evidence to inform decisions about management of Open Access
Land, including:
The degree to which sites with differing characteristics are visited;
The degree to which visitors utilise Open Access Land and other marked tracks as opposed
to staying on Public Rights of Way (PROW);
The activities people undertake on Open Access Land, including behaviour not included in
the rights conferred by the CROW Act, such as cycling;
Dog behaviour and control at Open Access Land sites; and
The need for restrictions and understanding whether current restrictions are appropriate.
1.3 Site Selection
A large number of sites2 have been included in the survey. These can effectively be considered
as three different samples:
National Sample Sites;
National NCA Sites; and
Local Monitoring Sites.
2 The term „site‟ is used to signify an area of land mapped as Open Access Land. Large sites
may include more than one „location‟ at which surveys were undertaken. For example, surveys
were conducted at several locations around the Canford Heath site to provide a wider
appreciation of the usage.
Nature Conservation Assessment (NCA)
A Nature Conservation Assessment (NCA) and Review Process was developed and
implemented by the Countryside Agency and English Nature (now Natural England) prior to
the commencement of CROW to assess the potential impacts of the new rights of access on
biodiversity.
The aim was to identify sites thought to be sensitive to the possible effects of public access
and, where such effects were considered likely, implement the least restrictive option that
would give such sites appropriate protection. This process has enabled the relevant
authority to decide on the cases where some type of legal restriction of the CROW access
rights or positive access management is necessary in order to protect important wildlife or
habitats.
In its role as CROW relevant authority for all England outside the national parks, Natural
England is reviewing the decisions taken during that original process in order to ensure that
the restrictions or positive access management in place are still appropriate and adequate
and that any additional need to amend restrictions or management is addressed.
Statutory Restrictions
Access rights are subject to a range of national conditions of use, for example, those under
CROW Schedule 2. These are usually referred to as general restrictions.
Certain areas also have local exclusions or restrictions for nature conservation, land
management, fire prevention, public safety or other reasons. Some of these can be applied at
the discretion of those with an interest in the land; others as a result of action by the
authorities.
There is significantly less CROW access land available for people with dogs, for whom
discretionary restrictions are more wide ranging. The great majority are on grouse moors,
where people with dogs are typically excluded all year round under CROW section 23.
However, these restrictions do not apply to Public Rights of Way (PROW) or to mapped Open
Access Land that is subject to statutory rights of public access that existed before CROW
(known as section 15 land)

Faber Maunsell Access Management Report: Three Year Monitoring Surveys at Open Access Land (2006-2008) 7
1.3.1 National Sample Sites
At the start of the project, a sample of 26 sites was selected following a stratified random
sampling procedure, from a database of Open Access Land sites in England outside of National
Parks3. Each of these sites has been surveyed in 2006, 2007 and 2008. The distribution of the
sites is shown in Figure 1.1.
The sample includes:
A range of large, medium and small sites;
Sites close to urban locations and more remote sites; and
Moors/ heaths and lowland/upland sites.
A range of secondary variables, were applied to provide a sample of sites broadly
representative of Open Access Land mapped in England outside of National Parks including:
Government Office Region;
Sites of Special Scientific Interest (SSSI) designation; and
Section 15 land (s15).
The locations within the sites at which surveys were conducted were identified through pre-
survey visits as being those with the optimum potential to record interviews with visitors to the
site.
Information from the surveys at these 26 sites will enable trends of usage of Open Access Land
in general to be monitored.
3 Further information on the sampling strategy can be found in the Fieldwork Report 2006.

Faber Maunsell Access Management Report: Three Year Monitoring Surveys at Open Access Land (2006-2008) 8
Figure 1.1 National Sample Sites
1.3.2 National NCA Sites
For the 2006 survey, six sites of Open Access Land were selected in association with Natural
England. These were selected because of the presence of nature conservation and land
management concerns at each site. As the opening up of land to the public has the potential to
have greater impacts to such areas, their inclusion has provided added value to the study. As
for the National Sample the locations within the areas at which surveys were conducted were
identified through pre-survey visits as being those with the optimum potential to record
interviews with visitors to the area. In 2007 additional sites were surveyed at four of the
National NCA areas. The 2008 surveys were conducted as for 2007.
While these sites cannot be considered as representative of Open Access Land in general the
data collected provides information on specific usage at sensitive sites. These include one

Faber Maunsell Access Management Report: Three Year Monitoring Surveys at Open Access Land (2006-2008) 9
coastal area, which may be of special value in light of the potential future improvement of
access to the English coast within an access corridor being developed by the Coastal Access
project by Natural England. The distribution of the sites is shown in Figure 1.2.
Figure 1.2 National NCA Sites.
1.3.3 Local Monitoring Sites
In 2007, supplementary data was collected outside of the national survey, at a number of sites
via Local Monitoring (LM). A total of 52 sites were included in this Local Monitoring Survey.
This involved access authorities4 carrying out their own data collection at sites identified locally,
to a modified version of the national survey methodology using the Local Visitor Monitoring
Toolkit and funded through the Access Management Grant Scheme (AMGS), by Natural
4 Access authorities are the local highway authorities (generally county and unitary authorities)
and, in National Parks, the National Park Authorities.

Faber Maunsell Access Management Report: Three Year Monitoring Surveys at Open Access Land (2006-2008) 10
England. Training and guidance was provided to all access authorities involved in using the
Toolkit to ensure consistency of approach. Local monitoring was also conducted in 2008, and
included many of the same sites surveyed in 2007. This data has been integrated with that
from the National Survey where practical to supplement the information on visitors to Open
Access Land and lend greater confidence in some of the findings.
Some of these sites are in close proximity to the National NCA sites and where practical the
data has been combined with the National NCA data to analyse patterns of use over a larger
area than would be possible with data from one source only. For example, those National NCA
sites at Upper Teesdale have been combined with sites elsewhere in the North Pennines Area
of Outstanding Natural Beauty (AONB). The distribution of the sites is shown in Figure 1.3. For
key to site names see Annex 1.
Figure 1.3 National NCA Sites.
Access Management Grant Scheme (AMGS)
Access authorities (but not National Park Authorities) may apply for funding through the
Access Management Grant Scheme (AMGS), which was designed as an incentive for
authorities to use their new powers to manage access. This includes funding for on-site
management and infrastructure such as signage, fencing, gates, volunteer costs and
vegetation cutting. Money was also made available to fund monitoring work, where this was
considered valuable.

Faber Maunsell Access Management Report: Three Year Monitoring Surveys at Open Access Land (2006-2008) 11
1.3.4 Site Characteristics
Table 1.1 shows a range of site characteristics for all the 86 sites included in the survey over
the three years where interviews were recorded5. Around two fifths of the sites are moorland
sites and three quarters of sites include areas with biodiversity designations (SSSI, SPA or
SAC). This indicates the importance of access land for biodiversity value and the need to
ensure the most sensitive wildlife areas are protected from the effects of disturbance by people,
through the use of Positive Access Management (PAM) and statutory restrictions. One of the
focuses of this report will be on understanding the effectiveness of nature conservation
restrictions and PAM implemented by Natural England to protect such sites.
Around half of the sites are Registered Common Land (RCL) and a quarter of the sites are s15
land6. This indicates the importance of s15 land, as this had existing access rights prior to
CROW and potentially will have an effect on the degree of change in use occurring on new
access land. The effect of s15 land on change in use is to be considered later on in the report.
Table 1.1 Site Types Included in the Survey
Site Type 2006 2007 2008 Total Sites
Split
Moorland Sites 12 31 35 35 41%
Not Moorland Sites 19 48 46 51 59%
Biodiversity Designated Sites7 16 59 61 66 77%
Non Designated Sites 15 20 20 20 23%
Urban8 9 15 17 17 20%
Not Urban 22 64 64 69 80%
Common Land 16 36 39 39 45%
Not Common Land Site 15 43 42 47 55%
Section 15 11 17 18 18 21%
Not Section 15 Land 20 62 63 68 79%
Other Sites9 6 54 56 61 71%
National Sample Sites 25 25 25 25 29%
Sites with AMGS 14 55 54 58 67%
Sites without AMGS 17 24 27 28 33%
TOTAL 31 79 81 86
The National Sample represents Open Access Land in general while the selected (Other) sites are over represented in the following characteristics:
44% are Moorland Sites - (32% in National Sample);
92% are Biodiversity Designated Sites - (40% in National Sample); and
82% are Sites with Access Management Grant Scheme (AMGS) - 32% in National Sample
The selected (Other) sites are underrepresented in the following characteristics:
43% are Common Land - 52% in National Sample;
15% are Section 15 - 36% in National Sample; and
16% are Urban Sites - 28% in National Sample
5 That is, the site profile reflects the Interview Survey data included in this report
6 Section 15 land is land which already had a right of area-wide public access pre-CROW,
through various other pieces of legislation. 7 Designated Sites include those with SSSI, SPA or SAC.
8 Urban sites defined as those with more than 20,000 people within 2km of the site boundary
9 LM and NCA Sites.
Faber Maunsell Access Management Report: Three Year Monitoring Surveys at Open Access Land (2006-2008) 12
In this report the results for the National Sample Sites are shown separately alongside those for
all sites, to enable comparisons to be made. However, when comparing findings by site
characteristics the National Sample data is pooled together with that from the NCA and LM
sites.
1.4 Fieldwork Summary
Surveys at National Monitoring (NM) sites (the National Sample Sites and the National NCA
Sites) were carried out largely over the summer months of June to September to maximise the
potential to intercept visitors, while surveys at the Local Monitoring sites were conducted
throughout the year. Details of the survey periods can be found in Annex 1, which also
provides further background to the fieldwork, including the survey instruments used each year.
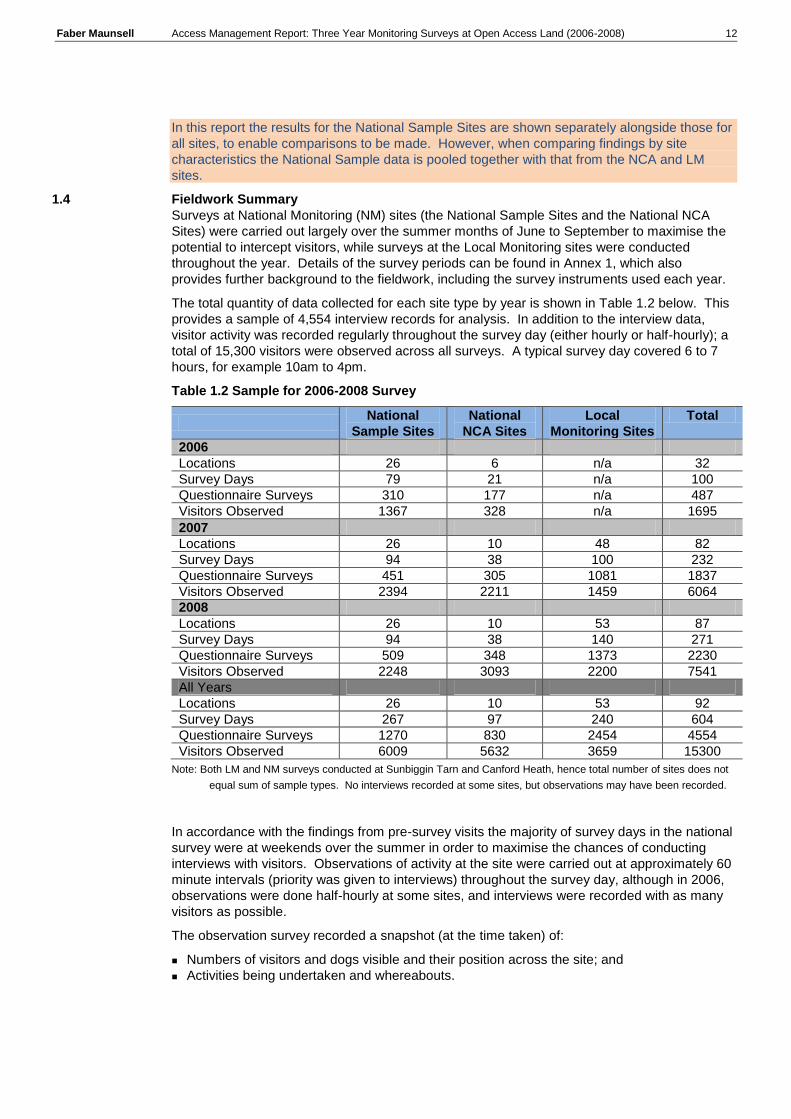
The total quantity of data collected for each site type by year is shown in Table 1.2 below. This
provides a sample of 4,554 interview records for analysis. In addition to the interview data,
visitor activity was recorded regularly throughout the survey day (either hourly or half-hourly); a
total of 15,300 visitors were observed across all surveys. A typical survey day covered 6 to 7
hours, for example 10am to 4pm.
Table 1.2 Sample for 2006-2008 Survey
National
Sample Sites
National
NCA Sites
Local
Monitoring Sites
Total
2006
Locations 26 6 n/a 32
Survey Days 79 21 n/a 100
Questionnaire Surveys 310 177 n/a 487
Visitors Observed 1367 328 n/a 1695
2007
Locations 26 10 48 82
Survey Days 94 38 100 232
Questionnaire Surveys 451 305 1081 1837
Visitors Observed 2394 2211 1459 6064
2008
Locations 26 10 53 87
Survey Days 94 38 140 271
Questionnaire Surveys 509 348 1373 2230
Visitors Observed 2248 3093 2200 7541
All Years
Locations 26 10 53 92
Survey Days 267 97 240 604
Questionnaire Surveys 1270 830 2454 4554
Visitors Observed 6009 5632 3659 15300
Note: Both LM and NM surveys conducted at Sunbiggin Tarn and Canford Heath, hence total number of sites does not
equal sum of sample types. No interviews recorded at some sites, but observations may have been recorded.
In accordance with the findings from pre-survey visits the majority of survey days in the national
survey were at weekends over the summer in order to maximise the chances of conducting
interviews with visitors. Observations of activity at the site were carried out at approximately 60
minute intervals (priority was given to interviews) throughout the survey day, although in 2006,
observations were done half-hourly at some sites, and interviews were recorded with as many
visitors as possible.
The observation survey recorded a snapshot (at the time taken) of:
Numbers of visitors and dogs visible and their position across the site; and
Activities being undertaken and whereabouts.

Faber Maunsell Access Management Report: Three Year Monitoring Surveys at Open Access Land (2006-2008) 13
The questionnaire survey recorded:
Information about the visitor;
Details of the visit;
Where visitors go and their patterns of use across the site;
Visitor awareness and understanding of the implications of CROW access;
Visitor behaviour on site;
Customer profile information; and
Visitor satisfaction and experience of use.
Copies of the questionnaires used for both the two national and local surveys (Toolkit) can be
found in Annex 1.
It should be noted that the surveys were conducted at one location at most of the sites,
identified during site reconnaissance on the basis of having greatest potential to intercept and
observe visitors. In most cases this was close to a main entry point, such as a car park or
visitor centre. At some larger sites more than one interview location was used on a „rolling‟
basis. Observations were limited by the extent of the site that was visible from the chosen
location. Where visitors used other entry points or did not pass in close proximity to the
surveyors (or, indeed, visited before or after interviewing took place), they were not available to
be intercepted or observed.
1.5 Weighting of Data
As described above, the number of survey days in the national monitor increased in 2007 from
that in 2006, and the extent of the Local Monitoring surveys differed between 2007 and 2008.
The number of survey days at a site ranged from 3 to 7 at the NM sites (average 3.7), and from
1 to 7 at the LM sites (average 2.8). In simply combining the data from the different sources
and years, those sites where more survey days were conducted could skew the results.
Therefore the interview survey data has been weighted, by site and by year, to represent an
equivalent number of days per site. The weighting procedure and weighting factors applied to
the data are shown in Annex 1.
1.6 Report Structure
In this report, National Sample Sites and the National NCA Sites were surveyed using the same
survey instruments and are jointly referred to as National Monitoring sites to distinguish these
from the Local Monitoring sites (at which different survey instruments were used). Since data is
drawn from both the National Monitoring and Local Monitoring surveys, where the former is
referred to the abbreviation NM is used, and LM for the latter. Note that in referring to Open
Access Land and Open Access Land sites, any such land within National Parks is not
included10
.
The results are shown for all sites combined, by year, as this maximises the amount of data
available, to identify whether any trends have developed. Alongside these results, the findings
for just the National Sample Sites are shown. The sample size for this data over three years is
sufficiently large, at around 1200 records to provide confidence in the findings to within around
2-3%. Further analysis is presented by the key site characteristics; this includes all sites.
In this report where results are stated to be „significantly different‟ this refers to the 0.05
significance level for comparisons of column proportions (z-tests) and column means (t-tests).
In tables the convention “-” denotes no data and “*” where a percentage is less than 0.5 but
greater than 0. Occasionally where the numbers of respondents is very small and percentages
would not be meaningful, the format “n= “ is used to denote the actual number of people giving
a response.
It should be noted that in the tables and charts presented in the report the number of records on
which the analysis is based is presented and this shows the number of valid records. Although
10
The Lake District National Park Authority conducted its own Local Monitoring Surveys at ten
sites in 2008 using the Toolkit, the results of which are reported in a separate report. A
summary of the findings are included at Annex 2, which highlights any similarities or differences
from those in this report.

Faber Maunsell Access Management Report: Three Year Monitoring Surveys at Open Access Land (2006-2008) 14
the total number of interviews is 4,554, the number of cases is usually less than this due to
missing/incomplete responses, or that different variants of the questionnaire were used at
different times. The data from each source have been integrated where possible; for some
questions the data are presented separately where it is not appropriate to combine them. For
questions asked in NM but not LM the number of cases will not exceed 2100.
Following this introduction, the report is structured as follows:
Chapter 2 Visits to Open Access Land
- How sites are used, broken down by key site characteristics, by year
Chapter 3 Visitors with Dogs
- How sites are used, broken down by key site characteristics, by year
Chapter 4 Inappropriate Use of Open Access Land
- How sites are used, broken down by key site characteristics, by year
- Restrictions Observance
- Patterns of use for those sites where restrictions are in place
Chapter 5 Patterns of Use
- Summary of Site Usage of Open Access Land
- Implications for Access Management.
Chapter 6 Summary and Conclusions
A series of Site Group reports are also available which should be referred to for further detail on
a site by site basis.
A separate report, the Communications Team Report details results from the survey relating to
publicity and awareness. Annex 1 includes further technical information and copies of the
Survey Instruments.

2 Visits to Open Access Land

Faber Maunsell Access Management Report: Three Year Monitoring Surveys at Open Access Land (2006-2008) 16
2.1 Introduction
In this section the pattern of visits to sites is described, by the site characteristics. This includes
data from both the NM and LM sites where available. The data is weighted as described in
Annex 1.11
2.2 Visitor Profile
The profile of visitors to Open Access Land sites is described in terms of their:
Gender;
Age Group;
Employment Status;
Health Status; and
Ethnic Group.
2.3 Visitor Demographics
2.3.1 Gender
Figure 2.1 shows the gender profile of visitors to Open Access land and shows that males are
over represented, forming 59% of the sample. This male dominance has been the case for all
years, although the 2007 sample included a higher proportion of females, 45%, compared with
the other years.
Figure 2.1 Gender of Visitors Interviewed
66%
34%
55%
45%
60%
40%
59%
41%
0% 20% 40% 60% 80% 100%
Male
Female
Male
Female
Male
Female
Male
Female
2006
2007
2008
All
Base: All Data, 2006 430, 2007 1679, 2008 2109 All years 4219 Weighted to equivalent numbers of days per site and retaining overall totals
Table 2.1 shows how the gender split differs by site type. Some site types attract higher
proportions of males, as follows:
Moorland - 69%; and
Sites that were common land pre CROW - 61%. However, higher than average proportions of females were found at urban sites, 47%.
11 Note: In this and subsequent analyses (unless otherwise stated), no attempt has been made
to adjust for frequency of visits. For example, it may be the case that females at urban sites are often walking a dog and do so every day, whereas a male at a moorland site may visit only once a year. In this analysis, each counts as one visit only.
2 Visits to Open Access Land

Faber Maunsell Access Management Report: Three Year Monitoring Surveys at Open Access Land (2006-2008) 17
National Sample Sites
Males - 62%, Females - 38%,
The proportion of males interviewed at National Sample Sites is significantly higher than at
other sites.
Table 2.1 Percentage of Male Respondents by Site Type
Site Type 2006 2007 2008 All Base
% % % %
Moorland Sites 68 69 70 69 1149
Not Moorland Sites 65 51 56 55 3070
Biodiversity Designated Sites 68 55 60 59 3475
Non Designated Sites 62 57 61 60 743
Urban 61 53 56 56 1441
Not Urban 70 57 62 60 2778
Common Land 66 58 61 61 1901
Not Common Land Site 66 54 59 57 2318
Section 15 63 60 64 62 1095
Not Section 15 Land 69 54 59 58 3124
Other Sites 65 55 60 58 3252
National Sample Sites 66 58 61 62 966
Sites with AMGS 65 56 61 59 3323
Sites without AMGS 66 54 58 58 896
TOTAL 66 55 60 59 4219
BASE 430 1679 2109 4219
Weighted to equivalent numbers of days per site and retaining overall totals
2.3.2 Age Group
Table 2.2 shows the age group profile of visitors to Open Access land and shows that around 7
in 10 visitors are aged 45 or over. There are no variations in the age profile by year or by site
characteristics.
Table 2.2 Age Group Visitors Interviewed
2006 %
2007 %
2008 %
All %
National Sample
%
Under 24 3 3 4 3 3
25-34 12 8 8 8 10
35-44 19 18 19 19 19
45+ 66 72 69 70 68
Base 438 1769 2174 4381 972
Weighted to equivalent numbers of days per site and retaining overall totals
National Sample Sites
The age profile of interviewees at National Sample Sites is the same as the whole sample.
2.3.3 Employment Status
The employment status of visitors was recorded in the interview and the results are shown in
Table 2.3. Three in five visitors are employed and a third of visitors are retired. The 2007
sample included a slightly higher proportion of retired people but there are no trends by year.
Retired visitors are less likely to visit moorland sites, 28%.

Faber Maunsell Access Management Report: Three Year Monitoring Surveys at Open Access Land (2006-2008) 18
Table 2.3 Employment status of visitors interviewed
2006 %
2007 %
2008 %
All %
National Sample
%
Employed 68 59 60 60 66
Not Working 3 4 5 5 4
Student 1 2 2 2 1
Retired 28 35 33 33 29
Base 428 1792 2192 4412 958
Weighted to equivalent numbers of days per site and retaining overall totals
National Sample Sites There are slightly more respondents who are employed in the National Sample and fewer retired people compared with the whole sample.
2.3.4 Health Status Respondents were asked whether they had any longstanding illness or disability that impaired their work or the things they did. The majority, 89%, had not. The percentage was slightly higher in 2006 but there is no trend. There are no differences due to site characteristics in the proportions.
Figure 2.2 Health status of visitors interviewed “Any longstanding illness or disability
that impaired their work or things they do”
7%
93%
12%
88%
10%
90%
11%
89%
0% 20% 40% 60% 80% 100%
Yes
No
Yes
No
Yes
No
Yes
No
2006
2007
2008
All
Base 2006 417, 2007, 1417, 2008, 2090, All, 3924
Weighted to equivalent numbers of days per site and retaining overall totals
National Sample Sites
Impaired 10%, no impairment 90%, The proportion of respondents with any health impairment is the same in the National Sample Sites as at other sites.
2.3.5 Ethnic Origin Table 2.4 shows the ethnic groupings of visitors to Open Access Land and shows that the vast majority, 96%, are White British and that this has stayed the same over the three years of the survey. There are no significant correlations between the site characteristics and the ethnicity of visitors.
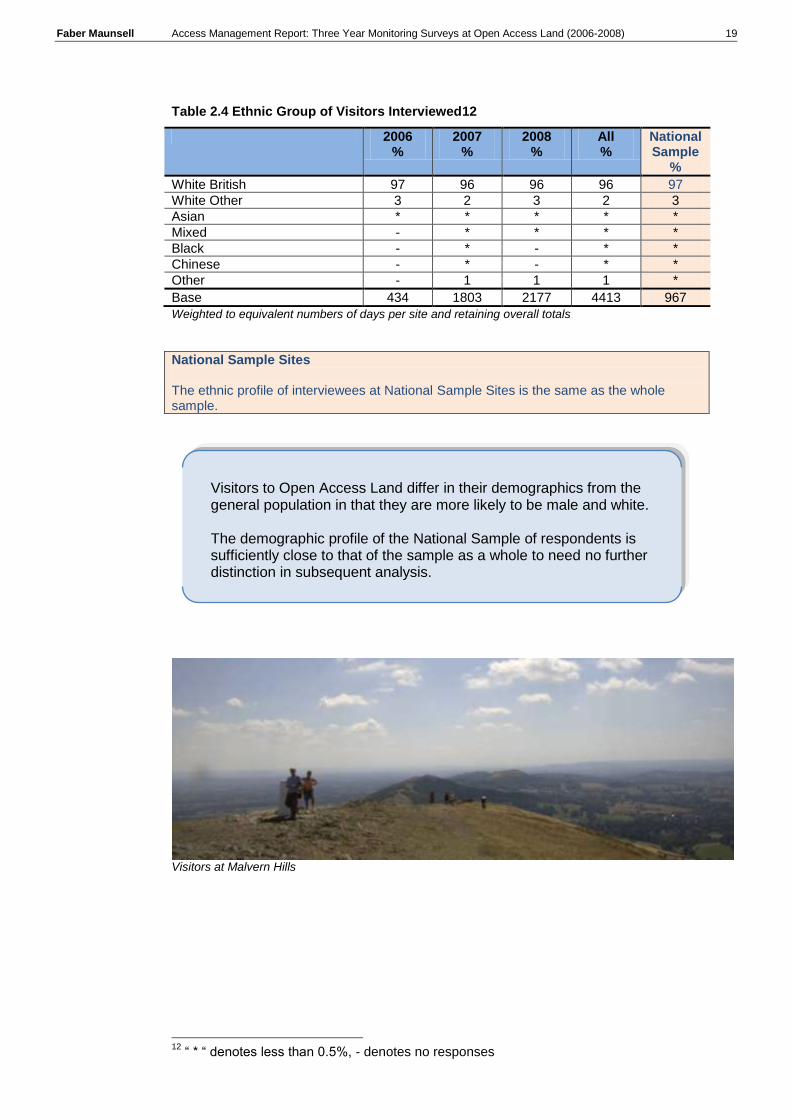
Faber Maunsell Access Management Report: Three Year Monitoring Surveys at Open Access Land (2006-2008) 19
Table 2.4 Ethnic Group of Visitors Interviewed12
2006 %
2007 %
2008 %
All %
National Sample
%
White British 97 96 96 96 97
White Other 3 2 3 2 3
Asian * * * * *
Mixed - * * * *
Black - * - * *
Chinese - * - * *
Other - 1 1 1 *
Base 434 1803 2177 4413 967
Weighted to equivalent numbers of days per site and retaining overall totals
National Sample Sites The ethnic profile of interviewees at National Sample Sites is the same as the whole sample.
Visitors at Malvern Hills
12
“ * “ denotes less than 0.5%, - denotes no responses
Visitors to Open Access Land differ in their demographics from the general population in that they are more likely to be male and white. The demographic profile of the National Sample of respondents is sufficiently close to that of the sample as a whole to need no further distinction in subsequent analysis.

Faber Maunsell Access Management Report: Three Year Monitoring Surveys at Open Access Land (2006-2008) 20
2.4 Visitor Characteristics
2.4.1 Group Size
Table 2.5 shows the group size of visitors to Open Access Land and shows that overall, 45%
arrive on their own and two fifths in pairs. A small proportion, 1% arrive in groups of 10 or
more. The proportion of people arriving alone in 2008 is significantly higher than in other years
and those arriving in pairs significantly higher in 2006. The overall average group size is 2.06
people.
Table 2.5 Group Size of Visitors Interviewed
2006 %
2007 %
2008 %
All %
National Sample
%
Individual 30 41 56 45 42
Two people 56 47 28 40 48
Three people 10 8 10 9 7
4-9 people 3 4 5 4 2
More than 10 1 * 1 1 1
Base 455 1608 1423 3486 988
Average Group Size 2.15 2.01 2.06 2.06 1.90
Weighted to equivalent numbers of days per site and retaining overall totals
As shown in Table 2.6, moorland sites appear to attract larger groups, as the average group size recorded at these was 2.3, and only 27% arrived there alone compared with 37% overall. Urban sites have much smaller average group sizes, 1.8 people, and at these sites over half, 53% arrive on their own.
Table 2.6 Average group size by site type
Site Type 2006 2007 2008 All Base
% % % %
Moorland Sites 2.3 2.3 2.4 2.3 1222
Not Moorland Sites 2.1 1.9 2.0 1.9 3331
Biodiversity Designated Sites 2.3 2.1 2.1 2.1 3783
Non Designated Sites 1.9 1.5 1.8 1.7 770
Urban 2.2 1.8 1.6 1.8 1554
Not Urban 2.1 2.1 2.3 2.2 2999
Common Land 2.2 2.1 2.1 2.1 2033
Not Common Land Site 2.0 1.9 2.0 2.0 2520
Section 15 2.2 2.0 1.9 2.0 1161
Not Section 15 Land 2.1 2.0 2.2 2.1 3392
Other Sites 2.3 2.1 2.1 2.1 3520
National Sample Sites 2.1 1.7 1.9 1.9 1033
Sites with AMGS 2.1 2.1 2.1 2.1 3593
Sites without AMGS 2.2 1.7 1.9 1.9 960
TOTAL 2.1 2.0 2.1 2.1 4553
BASE 455 1608 1423 3486
Weighted to equivalent numbers of days per site and retaining overall totals
National Sample Sites The group size at National Sample Sites is slightly lower than for the whole sample. This is related to the purpose of visit, as shown later.
Faber Maunsell Access Management Report: Three Year Monitoring Surveys at Open Access Land (2006-2008) 21
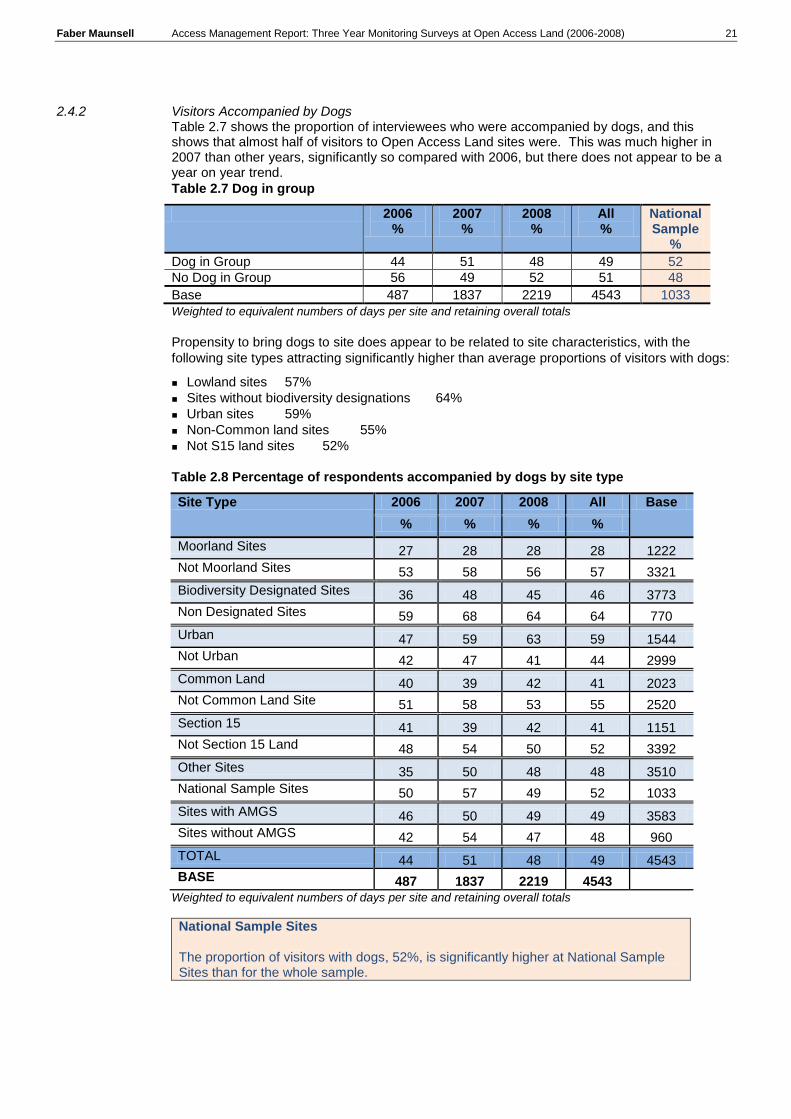
2.4.2 Visitors Accompanied by Dogs Table 2.7 shows the proportion of interviewees who were accompanied by dogs, and this shows that almost half of visitors to Open Access Land sites were. This was much higher in 2007 than other years, significantly so compared with 2006, but there does not appear to be a year on year trend.
Table 2.7 Dog in group
2006 %
2007 %
2008 %
All %
National Sample
%
Dog in Group 44 51 48 49 52
No Dog in Group 56 49 52 51 48
Base 487 1837 2219 4543 1033
Weighted to equivalent numbers of days per site and retaining overall totals
Propensity to bring dogs to site does appear to be related to site characteristics, with the
following site types attracting significantly higher than average proportions of visitors with dogs:
Lowland sites 57%
Sites without biodiversity designations 64%
Urban sites 59%
Non-Common land sites 55%
Not S15 land sites 52%
Table 2.8 Percentage of respondents accompanied by dogs by site type
Site Type 2006 2007 2008 All Base
% % % %
Moorland Sites 27 28 28 28 1222
Not Moorland Sites 53 58 56 57 3321
Biodiversity Designated Sites 36 48 45 46 3773
Non Designated Sites 59 68 64 64 770
Urban 47 59 63 59 1544
Not Urban 42 47 41 44 2999
Common Land 40 39 42 41 2023
Not Common Land Site 51 58 53 55 2520
Section 15 41 39 42 41 1151
Not Section 15 Land 48 54 50 52 3392
Other Sites 35 50 48 48 3510
National Sample Sites 50 57 49 52 1033
Sites with AMGS 46 50 49 49 3583
Sites without AMGS 42 54 47 48 960
TOTAL 44 51 48 49 4543
BASE 487 1837 2219 4543
Weighted to equivalent numbers of days per site and retaining overall totals
National Sample Sites The proportion of visitors with dogs, 52%, is significantly higher at National Sample Sites than for the whole sample.

Faber Maunsell Access Management Report: Three Year Monitoring Surveys at Open Access Land (2006-2008) 22
Dog Walking – Severn Ham
2.4.3 Group Size of Visitors Accompanied by Dogs
Although 49% of visitors overall were accompanied by dogs, this proportion is much higher for
those at the site alone, see Figure 2.3, which shows that at the National Sample sites, 72% of
those alone had one or more dogs with them, and this proportion was also high at other sites,
67%.
Figure 2.3 Proportion of Visitors Accompanied by Dogs
0 20 40 60 80
National Sample Site
Other
Total
72
67
68
38
37
37
Group
Individual
Base NS 1031 Other 3294 Weighted to equivalent numbers of days per site and retaining overall totals
2.5 Visitor Patterns How visitors use Open Access Land is now described in terms of
Frequency of visit;
Awareness of site; and
Access to site.
2.5.1 Frequency of Visit Table 2.9 shows how often people visit the site at which they were interviewed. Overall, one in five visitors is a daily visitor and around one in eight is a first time visitor. The proportion of first time visitors appears to have fallen since the survey started, from 18% in 2006 to 12% in 2008, and in 2007 there was a higher proportion of daily visitors. There is no overall pattern by year.
Table 2.9 Frequency of visiting site
2006 %
2007 %
2008 %
All %
National Sample
%
Daily 15 23 19 20 23
Regularly – more than once a week 16 16 16 16 17
Often – more than monthly 20 24 22 23 25
Infrequently – less than monthly 31 24 31 28 24
First Visit on Survey Day 18 14 12 13 11
Base 471 1456 2155 4082 1020
Weighted to equivalent numbers of days per site and retaining overall totals

Faber Maunsell Access Management Report: Three Year Monitoring Surveys at Open Access Land (2006-2008) 23
National Sample Sites For just the National Sample, the proportion of first time visitors is significantly different to other sites, being only 11%, and the proportion of respondents who visit daily is higher, at 23%. For the National Sample, there has been no trend by year.
Table 2.10 shows the frequency of visits by site type for all years combined. This shows that different sites are more likely to attract first time visitors; at moorland sites 22% are first time visitors and only 7% are daily visitors. Only 7% of visitors to urban sites are first time visitors and a quarter visit daily.
Table 2.10 Frequency of visiting site, by site characteristics
Site Type Daily Regularly Often Infrequently First Time
Row % Row % Row % Row % Row %
Moorland Sites 7 9 21 41 22
Not Moorland Sites 24 19 23 24 10
Biodiversity Designated Sites 17 15 22 30 15
Non Designated Sites 33 20 23 18 6
Urban 26 21 28 18 7
Not Urban 16 13 19 34 17
Common Land 15 14 23 33 16
Not Common Land Site 24 18 22 24 11
Section 15 17 14 26 30 14
Not Section 15 Land 21 17 21 28 13
Other Sites 19 16 22 30 14
National Sample Sites 23 17 25 24 11
Sites with AMGS 19 16 23 29 13
Sites without AMGS 22 17 22 25 13
TOTAL 20 16 23 28 13
BASE 808 658 920 1153 544 Weighted to equivalent numbers of days per site and retaining overall totals
An estimate of the number of trips made per year by visitors has been made (see Annex 1)
whereby daily visits equal 365 per year, monthly visits as 12 per year etc, to provide a
comparison of the relative numbers visiting sites with differing characteristics, as shown in
Table 2.11. Note that this estimate does not represent total visits, as it is only based on those
people interviewed. It does not include group size. This shows that lowland sites attract almost
three times as many visitors per year as moorland sites, with an average of 47 per year. It
would appear that the number of visits per year to moorland sites has increased by year, but
the differences are small and are not significant.
Other site characteristics that appear to influence the number of visits are presence of
biodiversity designations at the site, where fewer visits are made annually, and proximity to
urban populations, where almost twice as many visits are made, 134, compared with
rural/remote sites, 87. The inclusion of AMGS at a site does not appear to influence visitor
numbers.
National Sample Sites The average number of trips made per year increased from 2006 to 2007 but was lower in 2008, with this pattern occurring at both the National Sample of sites and other sites.

Faber Maunsell Access Management Report: Three Year Monitoring Surveys at Open Access Land (2006-2008) 24
Table 2.11 Estimated annual trips from survey respondents
Site Type 2006 2007 2008 All Base
Moorland Sites 42 44 50 47 1084
Not Moorland Sites 107 142 118 126 2998
Biodiversity Designated Sites 62 103 90 92 3322
Non Designated Sites 128 181 157 158 761
Urban 88 140 143 134 1540
Not Urban 83 100 78 87 2542
Common Land 79 76 87 82 1829
Not Common Land Site 95 141 113 123 2253
Section 15 83 88 97 91 1078
Not Section 15 Land 87 124 103 109 3004
Other Sites 44 110 98 100 3062
National Sample Sites 107 137 113 118 1020
Sites with AMGS 76 113 97 101 3135
Sites without AMGS 100 124 117 116 948
TOTAL 85 116 101 105 4082
BASE 471 1456 2155 4082
Weighted to equivalent numbers of days per site and retaining overall totals
2.5.2 Site Awareness
Respondents were asked how they had first learned of the area of land being visited. Almost
two thirds responded that they had always known about the site and a further 14% had been
made aware by friends or family. Just 6% had learned of it through some means of promotion
and a number of other sources were mentioned, many specific to the site, for example, coming
across the site by driving by (see Site Reports for further detail).
Moorland sites were less likely to be known about via local knowledge (i.e. „always known‟);
only half gave this means of becoming aware. Conversely 83% at urban sites knew of them
through local knowledge.
Table 2.12 How did you become aware of the Area of Land?
2006 %
2007 %
2008 %
All %
National Sample
%
Local knowledge / always known 69 66 64 65 81
Friends /Family 14 14 15 14 9
Promotion / press / website 8 6 6 6 4
Other 9 14 15 14 6
Base 459 1815 2210 4484 1013
Weighted to equivalent numbers of days per site and retaining overall totals
National Sample Sites The proportion of visitors interviewed at National Sample sites who had been aware through local knowledge was significantly higher than for the sample as a whole, at 81%. There was no trend by year in the proportions for the National Sample (as for the whole sample).

Faber Maunsell Access Management Report: Three Year Monitoring Surveys at Open Access Land (2006-2008) 25
2.5.3 Trip Origins Over four in five visitors had arrived at the site travelling from home and almost all others from temporary accommodation. These proportions vary considerably for individual sites (see Site Reports) as a quarter of sites draw all their visitors from home addresses.
Table 2.13 Where have you travelled from to Site?
2006 %
2007 %
2008 %
All %
National Sample
%
Home / Live Locally 81 83 81 82 88
On holiday / temporary accommodation
18 17 19 18 11
Other 1 * * * *
Base 466 1828 2211 4505 3491
Weighted to equivalent numbers of days per site and retaining overall totals
National Sample Sites The proportion of visitors interviewed at National Sample sites who had travelled from home, 88% was significantly higher than at other sites.
By site characteristics, the sites significantly more likely to attract people while on holiday are:
Moorland sites 24%
Sites with biodiversity designations 21%.
Urban sites are those least likely to attract people while on holiday, see Table 2.14.
Table 2.14 Proportion Visiting Site while on holiday/away from home by Site Type
Site Type 2006 2007 2008 All Base
% % % %
Moorland Sites 27 22 24 24 1208
Not Moorland Sites 14 15 17 16 3297
Biodiversity Designated Sites 26 19 21 21 3746
Non Designated Sites 3 5 5 5 759
Urban 8 5 5 5 1539
Not Urban 26 23 26 24 2966
Common Land 19 21 21 21 2006
Not Common Land Site 16 14 16 15 2499
Section 15 20 16 13 16 1144
Not Section 15 Land 16 17 20 19 3362
Other Sites 27 18 21 20 3491
National Sample Sites 13 10 10 11 1014
Sites with AMGS 17 18 19 18 3559
Sites without AMGS 21 14 17 17 946
TOTAL 18 17 19 18 4505
BASE 466 1828 2211 4505
Weighted to equivalent numbers of days per site and retaining overall totals

Faber Maunsell Access Management Report: Three Year Monitoring Surveys at Open Access Land (2006-2008) 26
2.5.4 Distance Travelled to Site Around a quarter of people travelled less than a mile to visit the site, and two in five travel less than 2 miles. A further fifth travel between 2 and 5 miles. The average distance for all sites for all years is 13 miles, though some 16% travel much further, more than 20 miles.
Table 2.15 Distances travelled to Site
2006 %
2007 %
2008 %
All %
National Sample %
Up to 1 mile 18 28 27 26 24
1 to 2 miles 18 13 12 13 21
2-5 miles 19 18 19 19 21
5-10 miles 15 14 14 14 14
11-20 miles 11 11 13 12 9
21 -40 miles 10 8 10 9 6
41 -100 miles 8 6 6 6 4
Over 100 miles 1 2 1 1 1
Base 465 1829 2179 4473 1016
Average Distance 13 12 13 13 10
Weighted to equivalent numbers of days per site and retaining overall totals
National Sample Sites The average distance travelled to site in the National Sample is 10 miles, significantly shorter than to other sites surveyed.
On average people travel about twice as far to visit moorland sites (typically 20 miles) as
lowland. Those travelling to urban sites travel half as far as to non urban sites, as might be
expected, with the average distance travelled being 7 miles. Similarly, people travel about
twice as far to sites with biodiversity designations as to those without.
Table 2.16 Average mileages to site, by site type
Site Type 2006 2007 2008 All Base
Moorland Sites 18 21 19 20 1211
Not Moorland Sites 11 9 10 10 3262
Biodiversity Designated Sites 17 13 13 14 3720
Non Designated Sites 7 6 7 6 753
Urban 10 6 7 7 1535
Not Urban 16 15 16 15 2938
Common Land 13 15 15 15 2006
Not Common Land Site 14 10 10 10 2467
Section 15 11 15 13 13 1146
Not Section 15 Land 16 12 12 12 3327
Other Sites 20 13 13 13 3457
National Sample Sites 10 8 10 10 1016
Sites with AMGS 13 13 12 12 3531
Sites without AMGS 13 10 14 12 941
TOTAL 13 12 12 12 4473
BASE 465 1829 2179 4473
Weighted to equivalent numbers of days per site and retaining overall totals

Faber Maunsell Access Management Report: Three Year Monitoring Surveys at Open Access Land (2006-2008) 27
2.5.5 Mode to Site
As might be expected with around a quarter of trips being under a mile, 28% of visitors had
arrived at the site on foot. However, car or other motorised private transport is the main mode
used with more than two thirds of trips being made this way.
The proportion arriving by public transport is low, at 1% and those on cycles account for only
2% of respondents. Visitors on bikes may have been slightly under-represented because they
proved difficult to interview.
Table 2.17 Mode of transport used to Site?
2006 %
2007 %
2008 %
All %
National Sample %
Car / van / campervan 78 62 69 68 74
Public transport (bus/ coach /rail) 1 1 2 1 1
Walked all the way / on foot 19 35 27 28 22
Cycle 3 2 2 2 3
Horse * 1 * * *
Other * - * * *
Base 459 1001 1929 3389 1007
Weighted to equivalent numbers of days per site and retaining overall totals Note: Mode to site not asked at all LM sites.
National Sample Sites
The proportion of visitors who arrive by car or other motorised personal transport is higher at the National Sample of sites at 74% and the proportion arriving on foot is lower, at 22% compared with the sample as a whole. There are no trends by year for the means of access to site.
Moorland sites attract higher proportions of visitors in cars, (76%) and (3%) on public transport,
though only (19%) on foot. Conversely, less than two thirds (62%) arrive at urban sites by car,
and a third (34%) arrive on foot.
Table 2.18 Mode to site by site type – all years
Site Type Car etc Public Transport
On Foot Other Base
Row % % % %
Moorland Sites 76 3 19 2 715
Not Moorland Sites 66 1 31 2 2674
Biodiversity Designated Sites 68 1 28 2 2738
Non Designated Sites 67 1 30 2 651
Urban 62 1 34 3 1492
Not Urban 73 2 24 2 1897
Common Land 74 2 22 2 1541
Not Common Land Site 63 1 34 3 1848
Section 15 74 2 23 2 984
Not Section 15 Land 66 1 31 2 2405
Other Sites 65 1 31 2 2382
National Sample Sites 74 1 22 3 1007
Sites with AMGS 69 1 27 2 2637
Sites without AMGS 64 2 32 3 752
TOTAL 68 1 28 2 3389
BASE 2305 46 960 78 Weighted to equivalent numbers of days per site and retaining overall totals

Faber Maunsell Access Management Report: Three Year Monitoring Surveys at Open Access Land (2006-2008) 28
2.6 Visitor Activities How visitors use Open Access Land is now described in terms of
Activities at Site – all and main;
Site Attractions;
Need to get exercise;
Duration of Visit; and
Visitor Spend.
2.6.1 All Activities
Respondents were asked which activities they had participated in while at the site, and in the
NM survey, what had been their main reasons for visiting. Table 2.19 shows the main reasons
given. Note that these proportions sum to more than 100 as more than one reason could be
given. Dog walking was the most common activity mentioned, by 46%. A third of visitors were
taking a short stroll almost one in five were hiking or taking a more serious walk, and 18% said
they were there to enjoy the scenery or nature.
Table 2.19 Activities participated in at site (all)
2006 %
2007 %
2008 %
All %
National Sample
%
Short Stroll / ambling 38 35 32 33 39
Serious Walking / Hiking 18 19 20 19 14
Dog Walking 38 48 47 46 49
Enjoying Scenery / nature 11 19 20 18 18
Other 23 17 22 20 21
Base 487 1831 2222 4540 1033
Weighted to equivalent numbers of days per site and retaining overall totals Note: will sum to more than 100 as multiple responses allowed
National Sample Sites – all activities The proportion of respondents who visit to take a short stroll is significantly higher at the National Sample sites, 39% and also the proportion of dog walkers is higher, 49%. There is no trend by year in the activities undertaken.
2.6.2 Main Activity
Table 2.20 shows the main reason given for being at the site. Those visiting specifically to walk
a dog form 31% of the sample and there are similar proportions, 21% and 22% for amblers and
hikers. Enjoying the scenery was the main reason for only 3% of visitors and was most often
secondary to the other reasons given.
It should be noted that in the LM survey a main response was not recorded. Where more than
one activity was mentioned these have been grouped as „more than one‟.
A range of responses were provided for other reasons, and these tend to be site specific, for
example, making sandcastles at Brancaster Beach or abseiling at Ilkley Moor; see Site Reports
for further detail13
.
13
The activities undertaken by visitors were also recorded in the observation surveys. In the Site Reports
comparisons from observed data with the activities as stated by respondents are shown, and these tend to
show that identifying a visitor as an ambler/serious walker/dog walker is difficult to do with precision and
hence there are discrepancies.

Faber Maunsell Access Management Report: Three Year Monitoring Surveys at Open Access Land (2006-2008) 29
Table 2.20 Main reason for being at Site
2006 %
2007 %
2008 %
All %
National Sample
%
Short Stroll / ambling 37 20 18 21 29
Serious Walking / Hiking 17 14 30 22 13
Dog Walking 26 46 19 31 42
Enjoying Scenery / nature 3 2 3 3 4
Other 17 7 10 9 11
More than One - 10 20 13 0
Base 487 1831 2222 4540 1033
Weighted to equivalent numbers of days per site and retaining overall totals Note: Main activity not recorded in LM survey
National Sample Sites – main activity The proportion of respondents who visit to take a short stroll is significantly higher at the National Sample sites, 29% and also the proportion of dog walkers is higher, 42%. There is no trend by year in the activities undertaken.
Figure 2.4 Main reason for being at site, by sample type
0
10
20
30
40
50
Short Stroll /
ambling
Serious Walking / Hiking
Dog Walking
Enjoying Scenery / nature
Other More than One
29
13
42
4
11
0
1915
37
29
17
National Sample
Other Sites
Base National Sample 1033, Other Sites 3506
Weighted to equivalent numbers of days per site and retaining overall totals
Lowland sites had higher proportions of dog walkers than did moorland sites; 46% compared
with 17%, and higher proportions visited moorland sites for more serious walks, 35%, and for
ambling, 26%.
Serious walkers are less likely to be found at urban sites (10%) than at more remote sites,
(17%).
Significantly higher proportions of dog walkers are found at urban sites, 48%, than rural or
remote sites. Also, significantly lower proportions of dog walkers are found at sites with
biodiversity designations, 35%, see Table 2.21.

Faber Maunsell Access Management Report: Three Year Monitoring Surveys at Open Access Land (2006-2008) 30
Table 2.21 Main activity at site by site type
Site Type Ambling Hiking Dog Walking
Other Base
Row % % % %
Moorland Sites 26 35 17 22 1218
Not Moorland Sites 19 8 46 27 3322
Biodiversity Designated Sites 21 16 35 27 3770
Non Designated Sites 19 9 54 18 770
Urban 20 10 48 21 1552
Not Urban 22 17 34 28 2987
Common Land 25 22 30 23 2028
Not Common Land Site 18 9 46 28 2511
Section 15 28 23 31 18 1160
Not Section 15 Land 19 12 41 28 3380
Other Sites 19 15 37 29 3506
National Sample Sites 29 13 42 16 1033
Sites with AMGS 20 15 38 28 3582
Sites without AMGS 26 16 40 17 957
TOTAL 21 15 39 26 4540
BASE 953 674 1749 1164 Weighted to equivalent numbers of days per site and retaining overall totals
2.6.3 Reasons for visiting the site rather than elsewhere
Respondents were asked why they chose to visit the survey site, rather than elsewhere. The
analysis is shown here for the three sample types, as the question differed slightly for the LM
surveys.
The most common response, for 32% of visitors, was that it was a pleasant area, with attractive
scenery or landscape. This reason was given by almost half of National Sample respondents.
Many sites have specific attractions, and are included as „other‟ in Table 2.24; for more details
refer to the Site Reports.
Heather – Canford Heath
Climbing – South Pennine Moors

Faber Maunsell Access Management Report: Three Year Monitoring Surveys at Open Access Land (2006-2008) 31
Table 2.22 Reasons for Visiting Site
National Sample
%
NCA Sample
%
Local Monitoring Sample %
All %
Scenery/ Landscape/ pleasant area 47 38 24 32
Always come here 7 7 40 27
Accessibility/ Proximity of the area of land 44 31 7 19
Remoteness / tranquillity of the area of land 4 4 25 17
Other - - 23 14
Exercise * - 19 12
Space for dog to run 26 8 4 10
Wildlife/ botany 9 9 2 5
The area of land is not too busy/ overcrowded 8 13 - 4
En route/ part of a longer route 4 10 2 4
Open Access - - 5 3
Parking provision at the area of land 5 1 * 2
Challenging walk/ climb/ feature 4 4 * 1
Provision of amenities - - 2 1
Cleanliness of the area of land 4 1 * 1
For a Change / Somewhere new, different * 3 1 1
Mentioned Easy/ Accessible walk 1 2 * 1
For the Horse/ Bike Riding * * * * Previous Visit * 1 * * For the Hills * * * * No Cars/ Bikes * * * *
Base 1033 678 2628 4339
Weighted to equivalent numbers of days per site and retaining overall totals
Note: will sum to more than 100 as multiple responses allowed
2.6.4 Getting Exercise
In the NM survey in 2007 and 2008, respondents were asked the extent to which getting
exercise featured in their decision to visit the countryside. As shown in Table 2.23 it featured to
a large extent for more than half of visitors, and to some extent for a further third of visitors.
There are no significant changes by year.
Table 2.23 Did the need to get exercise feature in your decision to visit the countryside
today?
2006 %
2007 %
2008 %
All %
National Sample %
Not at all n/a 12 15 14 12
To some extent n/a 36 35 35 33
To a large extent n/a 52 50 51 55
Base - 484 705 1189 381
Weighted to equivalent numbers of days per site and retaining overall totals Not asked in LM
National Sample Sites Getting exercise is a feature that attracts visitors to National Sample sites to a significantly greater extent than it does to other sites, with 55% saying it did so to a large extent. There are no trends by year.
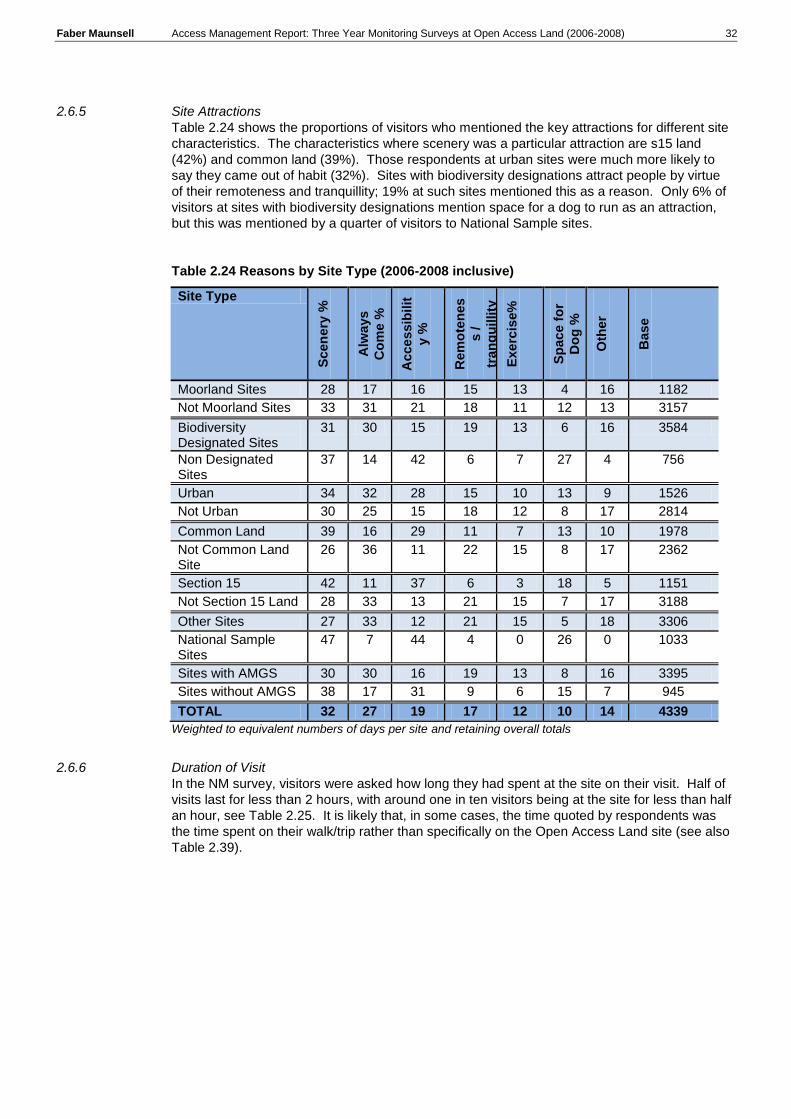
Faber Maunsell Access Management Report: Three Year Monitoring Surveys at Open Access Land (2006-2008) 32
2.6.5 Site Attractions
Table 2.24 shows the proportions of visitors who mentioned the key attractions for different site
characteristics. The characteristics where scenery was a particular attraction are s15 land
(42%) and common land (39%). Those respondents at urban sites were much more likely to
say they came out of habit (32%). Sites with biodiversity designations attract people by virtue
of their remoteness and tranquillity; 19% at such sites mentioned this as a reason. Only 6% of
visitors at sites with biodiversity designations mention space for a dog to run as an attraction,
but this was mentioned by a quarter of visitors to National Sample sites.
Table 2.24 Reasons by Site Type (2006-2008 inclusive)
Site Type
Scen
ery
%
Alw
ays
Co
me %
Acce
ssib
ilit
y %
Rem
ote
nes
s /
tran
qu
illity
%
Exe
rcis
e%
Sp
ac
e f
or
Do
g %
Oth
er
Base
Moorland Sites 28 17 16 15 13 4 16 1182
Not Moorland Sites 33 31 21 18 11 12 13 3157
Biodiversity Designated Sites
31 30 15 19 13 6 16 3584
Non Designated Sites
37 14 42 6 7 27 4 756
Urban 34 32 28 15 10 13 9 1526
Not Urban 30 25 15 18 12 8 17 2814
Common Land 39 16 29 11 7 13 10 1978
Not Common Land Site
26 36 11 22 15 8 17 2362
Section 15 42 11 37 6 3 18 5 1151
Not Section 15 Land 28 33 13 21 15 7 17 3188
Other Sites 27 33 12 21 15 5 18 3306
National Sample Sites
47 7 44 4 0 26 0 1033
Sites with AMGS 30 30 16 19 13 8 16 3395
Sites without AMGS 38 17 31 9 6 15 7 945
TOTAL 32 27 19 17 12 10 14 4339
Weighted to equivalent numbers of days per site and retaining overall totals
2.6.6 Duration of Visit
In the NM survey, visitors were asked how long they had spent at the site on their visit. Half of
visits last for less than 2 hours, with around one in ten visitors being at the site for less than half
an hour, see Table 2.25. It is likely that, in some cases, the time quoted by respondents was
the time spent on their walk/trip rather than specifically on the Open Access Land site (see also
Table 2.39).

Faber Maunsell Access Management Report: Three Year Monitoring Surveys at Open Access Land (2006-2008) 33
Table 2.25 Duration of Visit to Site
2006 %
2007 %
2008 %
All %
National Sample %
Under half an hour 11 10 6 9 12
30-59 minutes 29 29 30 29 35
1 to 2 hours 28 25 25 26 29
2-3 hours 15 14 14 14 11
3-4 hours 7 8 10 9 6
4-5 hours 3 5 7 5 4
5-6 hours 2 4 3 3 1
6 to 7 hours 1 3 2 2 1
More than 7 hours 3 3 2 2 1
Base 468 500 717 1685 1019
Weighted to equivalent numbers of days per site and retaining overall totals
The average duration of visits is around 2.0 hours. Significantly more time is spent per visit at
moorland sites than lowland sites, and also at sites with biodiversity designations, common land
sites, sites with AMGS and sites not in the National Sample. Significantly less time is spent at
urban sites, typically 1.8 hours.
Further analysis shows that those who visit for a serious walk spend almost twice as long at
sites than do other visitor types, at 3.7 hours on average, and dog walkers spend the least time,
at just over an hour.
Table 2.26 Average time spent at site by site type (hours) (NM Sites only)
Site Type 2006 2007 2008 All Base
Moorland Sites 2.4 2.9 3.1 2.8 526
Not Moorland Sites 1.6 1.6 1.8 1.7 1159
Biodiversity Designated Sites 2.1 2.5 2.6 2.4 1104
Non Designated Sites 1.4 1.2 1.3 1.3 580
Urban 1.9 1.9 1.8 1.8 748
Not Urban 1.8 2.2 2.4 2.2 936
Common Land 2.0 2.1 2.2 2.1 1205
Not Common Land Site 1.6 1.9 1.8 1.8 480
Section 15 2.0 2.1 2.1 2.0 906
Not Section 15 Land 1.7 2.0 2.2 2.0 779
Other Sites 2.4 2.9 2.7 2.7 666
National Sample Sites 1.6 1.4 1.7 1.6 1019
Sites with AMGS 2.0 2.3 2.3 2.2 1038
Sites without AMGS 1.6 1.6 1.9 1.7 646
TOTAL 1.9 2.1 2.1 2.0 1685
BASE 468 500 717 1685
Weighted to equivalent numbers of days per site and retaining overall totals
National Sample Sites The average spent at site at National Sample sites is 1.6 hours per visit. There has been no change in the duration by year.

Faber Maunsell Access Management Report: Three Year Monitoring Surveys at Open Access Land (2006-2008) 34
2.6.7 Visitor Spend
Also in the NM survey, visitors were asked how much they would spend on their day out. Note
that respondents were asked to exclude overnight accommodation costs and petrol/fuel costs,
so the figures represent what was spent at the site, as well as locally in connection with the visit
to the site.
The most commonly stated amount is zero, with 31% saying there was no opportunity to spend
anything and 38% said „nothing‟. Of those who did spend something the amount is usually less
than £5, but the overall average of those who spend is £17 per visit. The proportion saying „no
opportunity‟ was higher in 2006 when almost half gave this response. Including zero, the
average spend is £3.40, and this has increased each year, with the amounts in 2007 and 2008
significantly higher than in 2006.
Figure 2.5 shows the visitor spend for those visitors who had travelled from home and those who were away from home. Expenditure is around two and a half times higher for those who are on holiday or away from home while visiting sites.
Table 2.27 Visitor Spend at Site
Approximately how much did/ will your party spend as part of your trip out today (including to this area of land)? (Excluding accommodation and fuel costs, including food/drinks, souvenirs etc, during whole day and evening)
2006 %
2007 %
2008 %
All %
National Sample %
No opportunity 48 27 24 31 25
Nothing 33 40 39 38 47
Up to £5 10 15 15 14 14
£5-£7.50 2 4 3 3 3
£7.50 - £10 3 4 5 4 3
£10 - £20 3 5 7 5 4
£20 -£50 1 1 5 4 2
Over £50 1 1 1 1 *
Unsure / prefer not to say - * * * 1
Base 454 495 716 1665 1004
Average £1.70 £3.50 £4.30 £3.40 £2.60
Average of those who spent something £12.15 £16.46 £18.95 £17.00
£9.73
Weighted to equivalent numbers of days per site and retaining overall totals Note: NM data only
Figure 2.5 Visitor spend by trip origin
£0.00
£5.00
£10.00
£15.00
2006 2007 2008 Total
1.55 2.28 2.61 2.213.1
10.3
6.4 6.2
.5
3.9 3.6 2.93.95.0
11.3
7.8
National Site Home / live locallyNational Site On holiday / temporary accommodationNCA Site Home / live locallyNCA Site On holiday / temporary accommodation
Base: 2006 442, 2207 483, 2008 696 Total 1621 Weighted to equivalent numbers of days per site and retaining overall totals
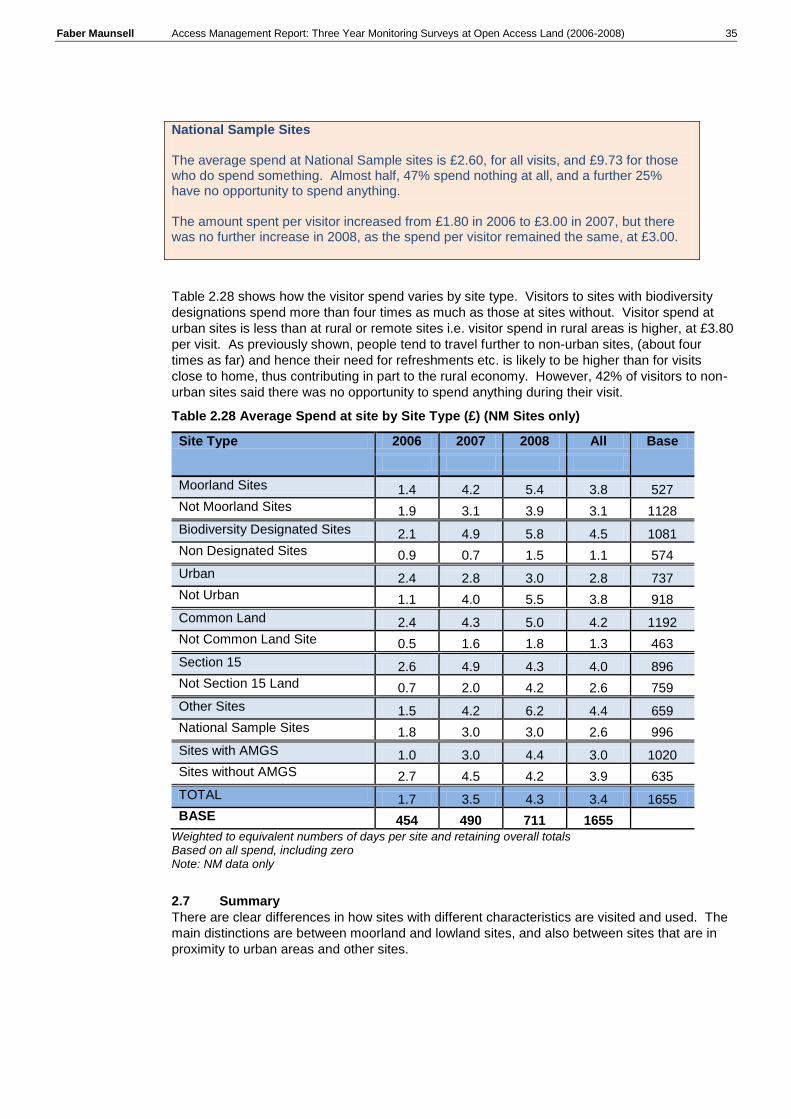
Faber Maunsell Access Management Report: Three Year Monitoring Surveys at Open Access Land (2006-2008) 35
National Sample Sites The average spend at National Sample sites is £2.60, for all visits, and £9.73 for those who do spend something. Almost half, 47% spend nothing at all, and a further 25% have no opportunity to spend anything. The amount spent per visitor increased from £1.80 in 2006 to £3.00 in 2007, but there was no further increase in 2008, as the spend per visitor remained the same, at £3.00.
Table 2.28 shows how the visitor spend varies by site type. Visitors to sites with biodiversity
designations spend more than four times as much as those at sites without. Visitor spend at
urban sites is less than at rural or remote sites i.e. visitor spend in rural areas is higher, at £3.80
per visit. As previously shown, people tend to travel further to non-urban sites, (about four
times as far) and hence their need for refreshments etc. is likely to be higher than for visits
close to home, thus contributing in part to the rural economy. However, 42% of visitors to non-
urban sites said there was no opportunity to spend anything during their visit.
Table 2.28 Average Spend at site by Site Type (£) (NM Sites only)
Site Type 2006 2007 2008 All Base
Moorland Sites 1.4 4.2 5.4 3.8 527
Not Moorland Sites 1.9 3.1 3.9 3.1 1128
Biodiversity Designated Sites 2.1 4.9 5.8 4.5 1081
Non Designated Sites 0.9 0.7 1.5 1.1 574
Urban 2.4 2.8 3.0 2.8 737
Not Urban 1.1 4.0 5.5 3.8 918
Common Land 2.4 4.3 5.0 4.2 1192
Not Common Land Site 0.5 1.6 1.8 1.3 463
Section 15 2.6 4.9 4.3 4.0 896
Not Section 15 Land 0.7 2.0 4.2 2.6 759
Other Sites 1.5 4.2 6.2 4.4 659
National Sample Sites 1.8 3.0 3.0 2.6 996
Sites with AMGS 1.0 3.0 4.4 3.0 1020
Sites without AMGS 2.7 4.5 4.2 3.9 635
TOTAL 1.7 3.5 4.3 3.4 1655
BASE 454 490 711 1655
Weighted to equivalent numbers of days per site and retaining overall totals Based on all spend, including zero Note: NM data only
2.7 Summary
There are clear differences in how sites with different characteristics are visited and used. The
main distinctions are between moorland and lowland sites, and also between sites that are in
proximity to urban areas and other sites.

Faber Maunsell Access Management Report: Three Year Monitoring Surveys at Open Access Land (2006-2008) 36
Moorland (North Pennines) Urban Site
Urban Rural/remote sites
daily visitors 26% 16%
average trips per year 134 87
visited from home 94% 75%
distance travelled to site 6.8 miles 15.4 miles
arriving on foot - 34% 24%
with dog 59% 44%
duration of visit 1.8 hours 2.2 hours
Urban sites attract few first time visitors, with more visits likely to be made daily than at other sites. They attract almost twice as many annual visits per year, and the majority of visits originate from home. Visitors travel half as far to urban sites as other sites, are more likely to arrive on foot and are much more likely to arrive with a dog than at other sites, though spend less time at the site.
Moorland Non Moorland
first time visitors 22% 10%
average trips per year 47 126
visited while on holiday 24% 16%
distance travelled to site 19.7 miles 9.7 miles
arriving on foot - 19% 31%
with dog 28% 57%
duration of visit 2.8 hours 1.7 hours
Moorland sites are much more likely to attract first time visitors, and are more likely to be visited while people are on holiday than are lowland sites. Visitors are more likely to travel further to get there, but less likely to arrive with a dog than at other sites, and spend longer at the site.

3 Using Open Access Land
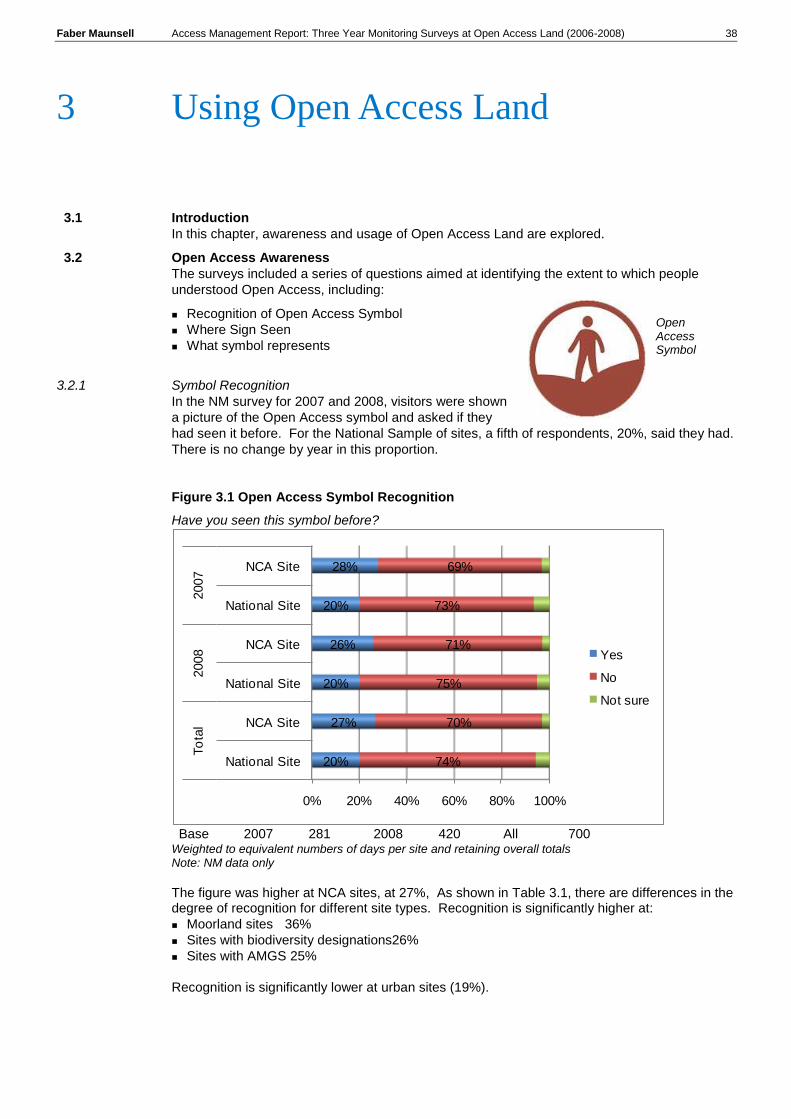
Faber Maunsell Access Management Report: Three Year Monitoring Surveys at Open Access Land (2006-2008) 38
3.1 Introduction
In this chapter, awareness and usage of Open Access Land are explored.
3.2 Open Access Awareness
The surveys included a series of questions aimed at identifying the extent to which people
understood Open Access, including:
Recognition of Open Access Symbol
Where Sign Seen
What symbol represents
3.2.1 Symbol Recognition
In the NM survey for 2007 and 2008, visitors were shown
a picture of the Open Access symbol and asked if they
had seen it before. For the National Sample of sites, a fifth of respondents, 20%, said they had.
There is no change by year in this proportion.
Figure 3.1 Open Access Symbol Recognition
Have you seen this symbol before?
0% 20% 40% 60% 80% 100%
NCA Site
National Site
NCA Site
National Site
NCA Site
National Site
2007
2008
To
tal
28%
20%
26%
20%
27%
20%
69%
73%
71%
75%
70%
74%
Yes
No
Not sure
Base 2007 281 2008 420 All 700
Weighted to equivalent numbers of days per site and retaining overall totals Note: NM data only The figure was higher at NCA sites, at 27%, As shown in Table 3.1, there are differences in the degree of recognition for different site types. Recognition is significantly higher at:
Moorland sites 36%
Sites with biodiversity designations26%
Sites with AMGS 25%
Recognition is significantly lower at urban sites (19%).
3 Using Open Access Land
Open Access Symbol

Faber Maunsell Access Management Report: Three Year Monitoring Surveys at Open Access Land (2006-2008) 39
Table 3.1 Proportion of Visitors Recognising Symbol (NM Sites only)
Site Type 2006 2007 2008 All Base
% % % %
Moorland Sites n/a 32 40 36 361
Not Moorland Sites n/a 18 17 17 844
Biodiversity Designated Sites n/a 25 26 26 800
Non Designated Sites n/a 20 15 17 405
Urban n/a 22 18 19 534
Not Urban n/a 25 27 26 670
Common Land n/a 26 23 24 913
Not Common Land Site n/a 18 21 19 291
Section 15 n/a 26 23 24 657
Not Section 15 Land n/a 20 22 22 548
Other Sites n/a 28 26 27 504
National Sample Sites n/a 20 20 20 700
Sites with AMGS n/a 25 25 25 752
Sites without AMGS n/a 20 19 20 452
TOTAL n/a 24 23 23 1205
BASE 0 496 708 1205
Weighted to equivalent numbers of days per site and retaining overall totals
3.2.2 Seeing the Open Access Symbol
Those who had seen the sign were then asked where they had seen it. Just over a quarter
(26%) had seen it at the interview site, fewer than had seen it at other areas of land (34%).
Four people mentioned having seen it on maps.
Table 3.2 Where Sign has been seen
If yes, where?
2006 %
2007 %
2008 %
All %
National Sample %
At this site on signs / notices n/a 20 30 26 21
On leaflets n/a 2 4 3 4
In books n/a - 4 2 4
At other areas of land n/a 20 44 34 40
Other n/a 10 15 13 12
Base n/a 117 160 277 142
Weighted to equivalent numbers of days per site and retaining overall totals Note: will sum to more than 100 as multiple responses allowed
National Sample Sites Only a fifth (21%) had seen the sign at the site being visited, and two fifths had seen the sign on a different site. The number of cases is too small to infer any findings by year.

Faber Maunsell Access Management Report: Three Year Monitoring Surveys at Open Access Land (2006-2008) 40
Compared with the 26% overall who had seen the sign at the site being visited, significantly
more, had seen it at:
moorland sites, 35%
sites with biodiversity designations 38%,
NCA sites 31% and
AMGS sites, 29%.
Significantly fewer had seen it at s15 sites (20%).
Table 3.3 Proportion of Visitors Seeing Sign at the Site being visited (NM Sites only)
Site Type 2006 2007 2008 All Base
% % % %
Moorland Sites n/a 21 47 35 130
Not Moorland Sites n/a 19 16 17 147
Biodiversity Designated Sites n/a 19 33 27 207
Non Designated Sites n/a 24 20 22 70
Urban n/a 8 18 14 103
Not Urban n/a 26 37 33 174
Common Land n/a 19 27 24 221
Not Common Land Site n/a 22 41 33 56
Section 15 n/a 14 23 19 159
Not Section 15 Land n/a 29 39 35 118
Other Sites n/a 20 40 31 135
National Sample Sites n/a 20 21 21 142
Sites with AMGS n/a 20 36 29 188
Sites without AMGS n/a 20 17 18 89
TOTAL n/a 20 30 26 277
BASE 0 117 160 277
Weighted to equivalent numbers of days per site and retaining overall totals
3.2.3 Sign Representation
Respondents who had seen the sign (or were not sure) were asked what they thought it
represented. Open Access was the most common response with almost two in five saying this,
with no significant change since 2007, see Table 3.4.
A small proportion thought it meant a public footpath, 3%, and 12% said Right to Roam. Of
those who suggested other responses, many did guess that it signified that people were
allowed to walk there but did not specifically refer to Open Access. (For further detail on
awareness and understanding refer to Communication Report).
Table 3.4 What does the symbol represent?
If yes or not sure symbol been seen
2006 %
2007 %
2008 %
All %
National Sample %
Right to Roam n/a 16 9 12 14
Open Access n/a 38 39 39 32
Don't know n/a 3 21 13 13
Something Else n/a 32 7 18 20
Public footpath n/a 2 4 3 4
Base n/a 142 190 332 182
Weighted to equivalent numbers of days per site and retaining overall totals
Note: may not sum to 100 as multiple responses allowed
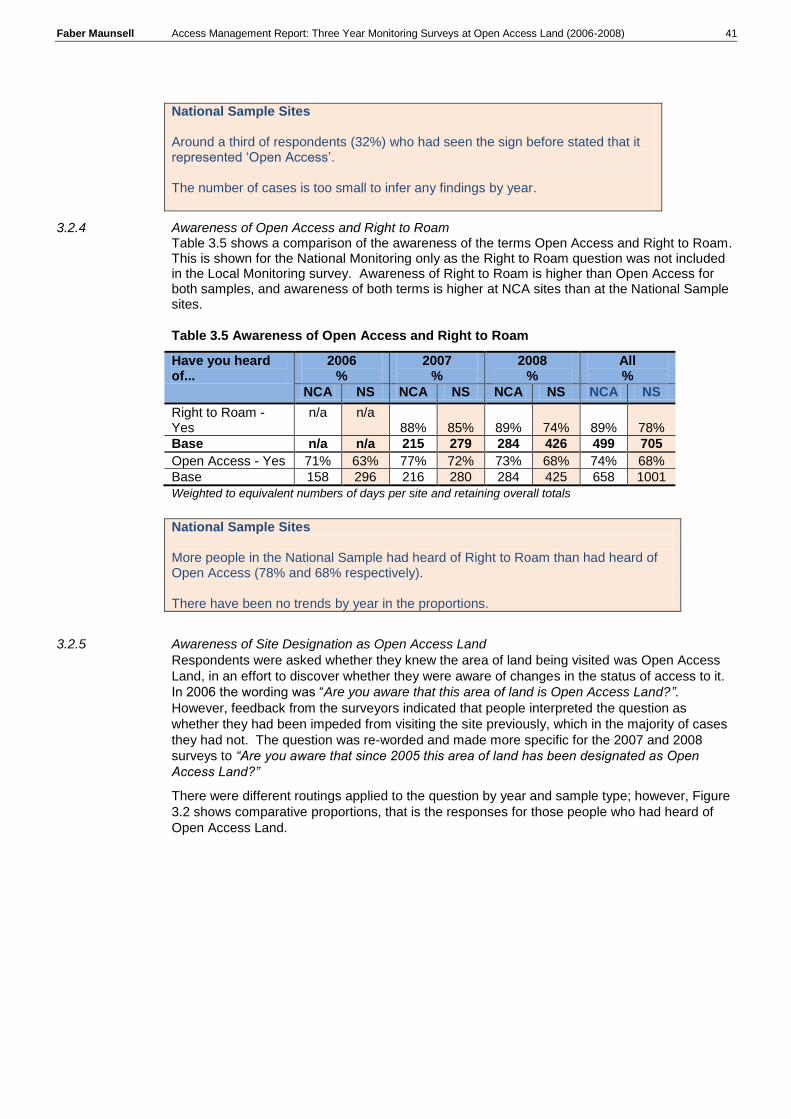
Faber Maunsell Access Management Report: Three Year Monitoring Surveys at Open Access Land (2006-2008) 41
National Sample Sites Around a third of respondents (32%) who had seen the sign before stated that it represented „Open Access‟. The number of cases is too small to infer any findings by year.
3.2.4 Awareness of Open Access and Right to Roam Table 3.5 shows a comparison of the awareness of the terms Open Access and Right to Roam. This is shown for the National Monitoring only as the Right to Roam question was not included in the Local Monitoring survey. Awareness of Right to Roam is higher than Open Access for both samples, and awareness of both terms is higher at NCA sites than at the National Sample sites.
Table 3.5 Awareness of Open Access and Right to Roam
Have you heard of...
2006 %
2007 %
2008 %
All %
NCA NS NCA NS NCA NS NCA NS
Right to Roam - Yes
n/a n/a 88% 85% 89% 74% 89% 78%
Base n/a n/a 215 279 284 426 499 705
Open Access - Yes 71% 63% 77% 72% 73% 68% 74% 68%
Base 158 296 216 280 284 425 658 1001
Weighted to equivalent numbers of days per site and retaining overall totals
National Sample Sites More people in the National Sample had heard of Right to Roam than had heard of Open Access (78% and 68% respectively). There have been no trends by year in the proportions.
3.2.5 Awareness of Site Designation as Open Access Land
Respondents were asked whether they knew the area of land being visited was Open Access
Land, in an effort to discover whether they were aware of changes in the status of access to it.
In 2006 the wording was “Are you aware that this area of land is Open Access Land?”.
However, feedback from the surveyors indicated that people interpreted the question as
whether they had been impeded from visiting the site previously, which in the majority of cases
they had not. The question was re-worded and made more specific for the 2007 and 2008
surveys to “Are you aware that since 2005 this area of land has been designated as Open
Access Land?”
There were different routings applied to the question by year and sample type; however, Figure
3.2 shows comparative proportions, that is the responses for those people who had heard of
Open Access Land.

Faber Maunsell Access Management Report: Three Year Monitoring Surveys at Open Access Land (2006-2008) 42
Figure 3.2 Are you aware that this area of land is Open Access Land?
0% 20% 40% 60% 80%
NCA Site
National Sample Site
LM Site
60%
75%
40%
31%
38%
33%
28%
28%
2008
2007
2006
Base 2006 NS, 110, NCA, 183, LM, 0 2007, NS 175, NCA 222, LM 1258 2008, NS 204
NCA, 283, LM 1440
The data shows that the proportion saying they were aware that they were visiting Open Access
Land was very different in 2006 from 2007 and 2008, reflecting the difference in the question
and so 2006 should be excluded from any trend analysis.
However, the proportion aware has fallen significantly from 37% in 2007 to 29% in 2008, and
the figures are similar for each sample type, though awareness is slightly higher at NCA sites.
But, given that the valid results extend over two years only, it is not possible to infer any trends.
National Sample Sites Around 29% of respondents at National Sample sites that were aware of Open Access, were aware of the site‟s designation as Open Access Land.
For 2007 and 2008, the overall proportion of visitors aware they were at an Open Access site
was 33%. By site characteristics, the types of site significantly more likely to be recognised as
Open Access Land are:
Moorland sites (40%); and
Non-urban sites (36%.
A higher proportion of visitors at sites with AMGS were aware, 34% compared with 28%, at
sites without,

Faber Maunsell Access Management Report: Three Year Monitoring Surveys at Open Access Land (2006-2008) 43
Table 3.6 Proportion of Visitors Seeing Sign at the Site being visited (NM
Sites only)
Site Type 2007 2008 All Base
% % %
Moorland Sites 47 34 40 992 Not Moorland Sites 34 27 30 2591 Biodiversity Designated Sites 38 29 33 3115 Non Designated Sites 35 26 30 467 Urban 26 24 25 1110 Not Urban 42 31 36 2472 Common Land 36 30 32 1459 Not Common Land Site 38 28 33 2124 Section 15 36 35 35 741 Not Section 15 Land 38 27 32 2842 Other Sites 38 29 33 3077 National Sample Sites 31 28 29 506 Sites with AMGS 38 30 34 2954 Sites without AMGS 33 24 28 628 TOTAL 37 29 33 3583
BASE 1656 1927 3583
Further discussion of the awareness and understanding of Open Access can be found in the
Communication Report. This also includes information on the usage of signage at Open
Access Land.
In the three years of the survey, no trends by year regarding
awareness of Open Access have emerged from the findings
from the National Sample of sites.
Just over two thirds are aware of Open Access, fewer than have
heard of Right to Roam.
This suggests that in the first 4 to 5 years after implementation,
CROW has had no discernible effects on usage of these sites,
and that it will take some time for awareness to be raised.
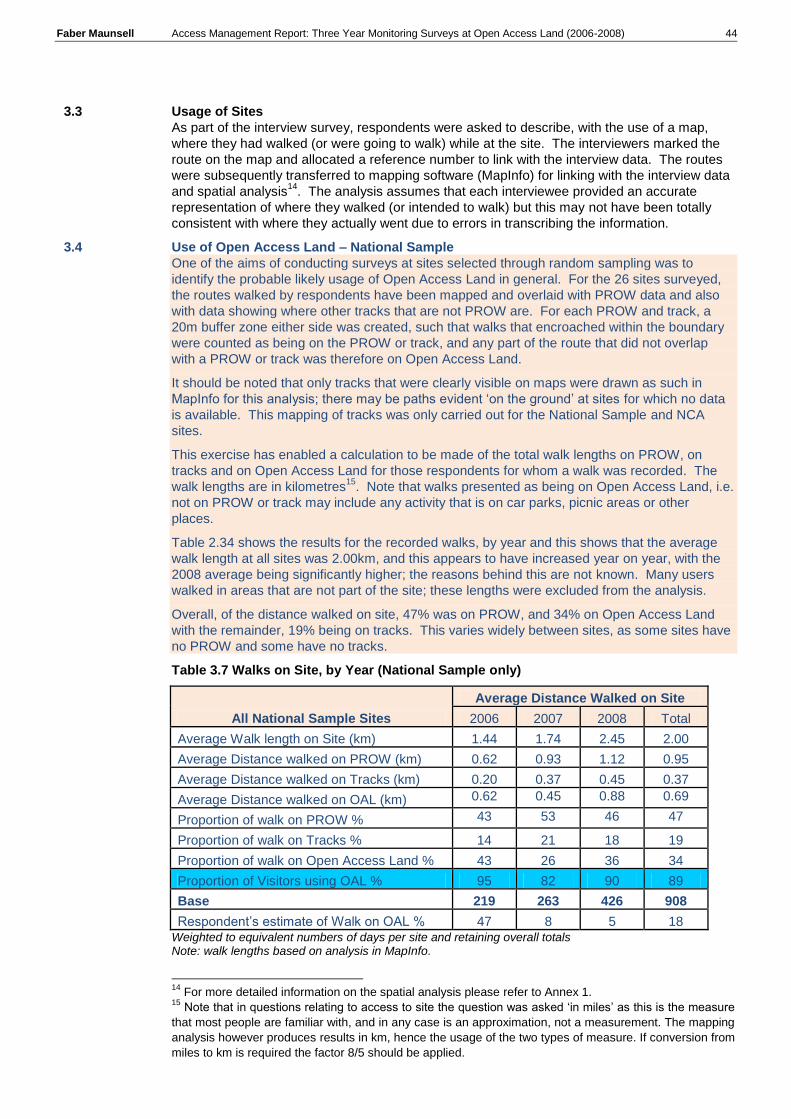
Faber Maunsell Access Management Report: Three Year Monitoring Surveys at Open Access Land (2006-2008) 44
3.3 Usage of Sites
As part of the interview survey, respondents were asked to describe, with the use of a map,
where they had walked (or were going to walk) while at the site. The interviewers marked the
route on the map and allocated a reference number to link with the interview data. The routes
were subsequently transferred to mapping software (MapInfo) for linking with the interview data
and spatial analysis14
. The analysis assumes that each interviewee provided an accurate
representation of where they walked (or intended to walk) but this may not have been totally
consistent with where they actually went due to errors in transcribing the information.
3.4 Use of Open Access Land – National Sample
One of the aims of conducting surveys at sites selected through random sampling was to
identify the probable likely usage of Open Access Land in general. For the 26 sites surveyed,
the routes walked by respondents have been mapped and overlaid with PROW data and also
with data showing where other tracks that are not PROW are. For each PROW and track, a
20m buffer zone either side was created, such that walks that encroached within the boundary
were counted as being on the PROW or track, and any part of the route that did not overlap
with a PROW or track was therefore on Open Access Land.
It should be noted that only tracks that were clearly visible on maps were drawn as such in
MapInfo for this analysis; there may be paths evident „on the ground‟ at sites for which no data
is available. This mapping of tracks was only carried out for the National Sample and NCA
sites.
This exercise has enabled a calculation to be made of the total walk lengths on PROW, on
tracks and on Open Access Land for those respondents for whom a walk was recorded. The
walk lengths are in kilometres15
. Note that walks presented as being on Open Access Land, i.e.
not on PROW or track may include any activity that is on car parks, picnic areas or other
places.
Table 2.34 shows the results for the recorded walks, by year and this shows that the average
walk length at all sites was 2.00km, and this appears to have increased year on year, with the
2008 average being significantly higher; the reasons behind this are not known. Many users
walked in areas that are not part of the site; these lengths were excluded from the analysis.
Overall, of the distance walked on site, 47% was on PROW, and 34% on Open Access Land
with the remainder, 19% being on tracks. This varies widely between sites, as some sites have
no PROW and some have no tracks.
Table 3.7 Walks on Site, by Year (National Sample only)
All National Sample Sites
Average Distance Walked on Site
2006 2007 2008 Total
Average Walk length on Site (km) 1.44 1.74 2.45 2.00
Average Distance walked on PROW (km) 0.62 0.93 1.12 0.95
Average Distance walked on Tracks (km) 0.20 0.37 0.45 0.37
Average Distance walked on OAL (km) 0.62 0.45 0.88 0.69
Proportion of walk on PROW % 43 53 46 47
Proportion of walk on Tracks % 14 21 18 19
Proportion of walk on Open Access Land % 43 26 36 34
Proportion of Visitors using OAL % 95 82 90 89
Base 219 263 426 908
Respondent‟s estimate of Walk on OAL % 47 8 5 18 Weighted to equivalent numbers of days per site and retaining overall totals Note: walk lengths based on analysis in MapInfo.
14
For more detailed information on the spatial analysis please refer to Annex 1. 15
Note that in questions relating to access to site the question was asked „in miles‟ as this is the measure
that most people are familiar with, and in any case is an approximation, not a measurement. The mapping
analysis however produces results in km, hence the usage of the two types of measure. If conversion from
miles to km is required the factor 8/5 should be applied.

Faber Maunsell Access Management Report: Three Year Monitoring Surveys at Open Access Land (2006-2008) 45
As shown in Table 2.35, almost half the sample comprised dog walkers, 45%, with over a
quarter, 28% being amblers and 13% serious walkers. The serious walkers tend to walk much
further on average than other visitors, 4.43km, and there was a slightly higher proportion of
these in 2008 that may account for some of the increased walk length in 2008.
There is no trend by year as to the proportions on/off Open Access Land, that is, there does not
appear to be an increasing tendency to go off PROW and wander across Open Access Land in
the period since the implementation of CROW.
Some 89% of visitors went off PROW (used Open Access Land) at some point during their visit.
The visitor type most likely to utilise Open Access Land are serious walkers, of who 97% used
Open Access Land. However, only 45% of their walk was on Open Access Land compared
with 51% for amblers, and 48% for dog walkers. By virtue of the longer walks made by this
group however, they walk on average 1.54km per site visit on Open Access Land, around three
times as far as do other visitors.
Respondents were asked to give an estimate of their walk that was on Open Access Land, on
PROW and on tracks and, as shown in the tables, the estimates were very wide of the mark,
with the overall estimate for Open Access Land being only 18%. This shows that people have
flawed perceptions of PROW. Somewhat surprisingly, perhaps, serious walkers were the
group to show the widest discrepancy but this may be a reflection of the greater length they
walked, making estimates more difficult; those walking further may also have included in their
estimate the pattern of use when off-site as well as on-site, thus „contaminating‟ the data to a
small degree.
A very high proportion of visitors went off PROW at some point during their visit; 89% over all
years. This is much higher than the proportion of the walk off PROW, which means that many
visitors only go off PROW for a short time or distance. This could include time in car parks and
picnic areas for example.
Reference should be made to the Site Reports to understand how each site is used in respect
of visitors actively using Open Access Land.
Table 3.8 Walks on Site, by Main Activity (National Sample only)
All National Sample Sites
Average Distance Walked on Site
Short Stroll /
Ambling
Serious walking / rambling /
hiking Dog
walking
Enjoying the scenery/
nature/ art Other
PROPORTION BY ACTIVITY 28% 13% 45% 4% 10%
Average Walk length on Site (km) 1.92 4.43 1.42 1.89 1.77
Average Distance walked on PROW (km) 0.97 1.97 0.68 0.89 0.74
Average Distance walked on Tracks (km) 0.33 0.92 0.22 0.4 0.38
Average Distance walked on OAL (km)
0.61 1.54 0.51 0.6 0.64
Proportion of walk on PROW % 51 45 48 47 42
Proportion of walk on Tracks % 17 21 15 21 21
Proportion of walk on Open Access Land % 32 35 36 32 36
Proportion of Visitors using OAL % 88 97 88 88 90
Base 257 116 406 37 92
Respondent‟s estimate of Walk on OAL % 19 9 18 15 23
Weighted to equivalent numbers of days per site and retaining overall totals Note: walk lengths based on analysis in MapInfo.

Faber Maunsell Access Management Report: Three Year Monitoring Surveys at Open Access Land (2006-2008) 46
Note: In the spatial analysis, the mapping software assumed a 20m buffer zone around the line of the
PROW or track to calculate the lengths of walk on PROW or path, with the rest of the walk length then
deemed to be on Open Access Land. The spatial analysis of a walk off PROW or track will include those
who are recorded as being just off a path as well as those who are wandering away from paths
completely.
Visual analysis of the routes plotted and of the observation data suggests that the estimates of usage of
Open Access Land from the spatial analysis are high, that is, the majority of people do actually follow the
general alignments of established routes, and the number of people who wander completely away from
paths and tracks is actually quite small. The patterns of use on a site by site basis are shown in the Site
Reports.
In interpreting the mapping analysis it should be appreciated that there were difficulties on site with
accurate recording of routes, for example where respondents were not clear about where they were going.
In transcribing routes from paper maps to MapInfo further accuracy may have been lost. In 2006, some
interviews were recorded directly onto PDAs (Personal Digital Assistant) carrying mapping software, which
at some sites did not allow maps to be displayed at an appropriate scale, and some respondents had
difficulty in conveying information about their routes.
However, the same approach has been applied to all sites and for all years and therefore we can have
confidence, that although the proportions of respondents using Open Access Land may be slightly
exaggerated, the comparative findings are reliable.
For the LM sites there is no „tracks‟ layer to distinguish where a walk is, hence usage of the site can only be defined as either on PROW or on Open Access Land from the mapping analysis. In the Site Reports, where the walk on tracks can be identified this is shown and is mentioned in the commentary with reference to plots of patterns of use. In the following section, in order to maximise the data available for analysis, wherever a walk is not on PROW it is deemed to be on Open Access Land, for the National Sample sites as well as all others. However, it should be recognised that in practice there is likely to be use on existing tracks, as indicated by the National Sample. For all sites, the proportion of the walk off PROW is 56% as shown in Figure 3.3. There are no trends by year.
Figure 3.3 Proportion of walk on Open Access Land (off PROW)
67%
52%
57%
56%
0% 20% 40% 60% 80%
2006
2007
2008
Total
Base 2006 301 2007 1725 2008 2069 All 4096 Weighted to equivalent numbers of days per site and retaining overall totals Note: based on analysis in MapInfo
3.4.1 Perceptions of Use of Open Access Land
Respondents were asked to estimate how much of their walk was on Open Access Land. As
can be seen in Figure 3.4, over all three years this estimate was 39%, lower than the 55% as
analysed by mapping.
This discrepancy will in some part be due to the presence on some sites of tracks and paths
that are perceived to be PROW, even though they are not. The position may be further
confused in people‟s minds at sites where there are permissive paths. It may also be that some
people might not wish to say they had gone off PROW.

Faber Maunsell Access Management Report: Three Year Monitoring Surveys at Open Access Land (2006-2008) 47
Further detailed information on the use of PROW and Open Access Land can be found in the
Site Reports.
Figure 3.4 Respondents‟ Estimate of Proportion of Walk on Open Access Land (off
PROW)
43%
33%
38%
39%
0% 20% 40% 60%
2006
2007
2008
Total
Base 2006 394 2007 1837 2008 1977 All 4209 Weighted to equivalent numbers of days per site and retaining overall totals
3.4.2 Observed Use of Open Access Land
As well as recording the walks taken by respondents, as part of the observation surveys the
locations of visitors to the site were recorded spatially and on the survey forms as on PROW,
on tracks or on Open Access Land16
.
The results are shown in Figure 3.5 for each year and show that overall, 43% of respondents
were recorded as being on Open Access Land at the time of the observation.
Figure 3.5 Proportion of visitors observed on Open Access Land
66%
47%
34%
43%
0% 20% 40% 60% 80%
2006
2007
2008
Total
Base 2006 1695 2007 6064 2008 7508 All 15267 Observation Survey Data
The recorded walks, the respondents‟ estimates and the observed behaviour are combined in
Figure 3.6, showing the estimated usage of Open Access Land (i.e. off PROW) over the three
years of the survey. In 2006 and 2007 there is broad agreement between the mapped walks
and the observed behaviour, but less so in 2008. It is important to note that the interviewed and
observed visitors are not necessarily the same people, and there may be situations where
observed visitors took routes that meant they were never interviewed.
16
Note: The observation recording form changed from 2006
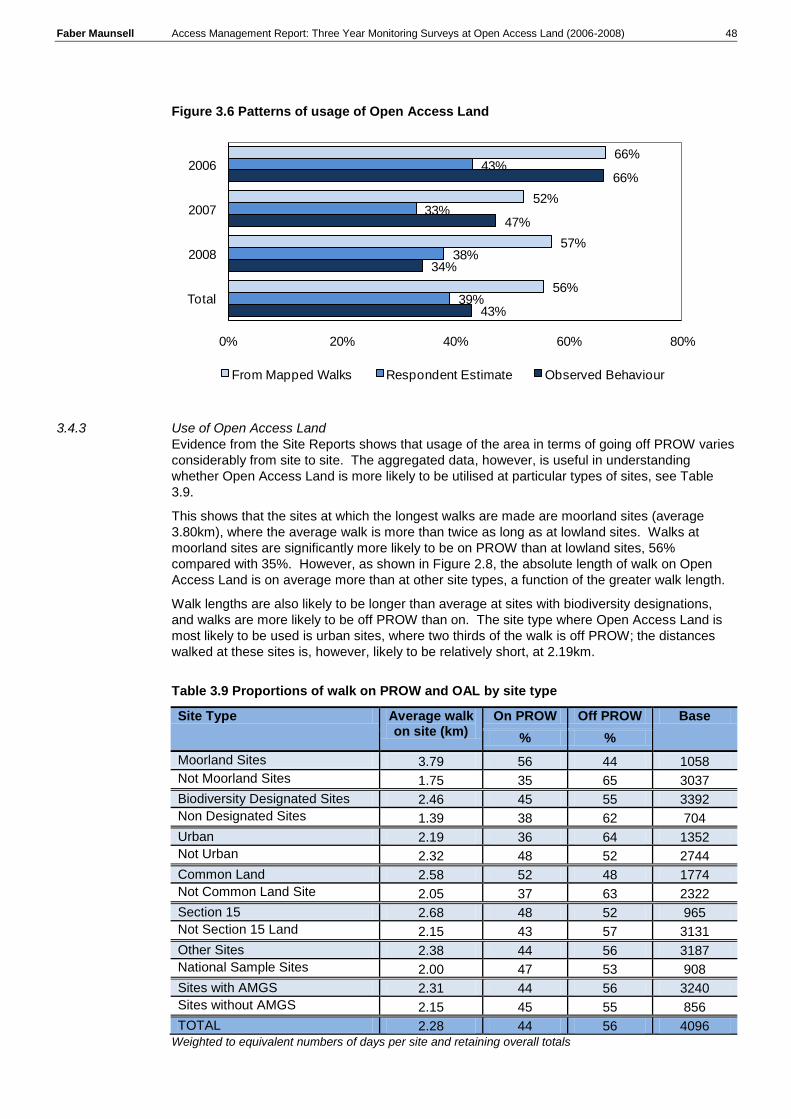
Faber Maunsell Access Management Report: Three Year Monitoring Surveys at Open Access Land (2006-2008) 48
Figure 3.6 Patterns of usage of Open Access Land
66%
52%
57%
56%
43%
33%
38%
39%
66%
47%
34%
43%
0% 20% 40% 60% 80%
2006
2007
2008
Total
From Mapped Walks Respondent Estimate Observed Behaviour
3.4.3 Use of Open Access Land
Evidence from the Site Reports shows that usage of the area in terms of going off PROW varies
considerably from site to site. The aggregated data, however, is useful in understanding
whether Open Access Land is more likely to be utilised at particular types of sites, see Table
3.9.
This shows that the sites at which the longest walks are made are moorland sites (average
3.80km), where the average walk is more than twice as long as at lowland sites. Walks at
moorland sites are significantly more likely to be on PROW than at lowland sites, 56%
compared with 35%. However, as shown in Figure 2.8, the absolute length of walk on Open
Access Land is on average more than at other site types, a function of the greater walk length.
Walk lengths are also likely to be longer than average at sites with biodiversity designations,
and walks are more likely to be off PROW than on. The site type where Open Access Land is
most likely to be used is urban sites, where two thirds of the walk is off PROW; the distances
walked at these sites is, however, likely to be relatively short, at 2.19km.
Table 3.9 Proportions of walk on PROW and OAL by site type
Site Type Average walk on site (km)
On PROW Off PROW Base
% %
Moorland Sites 3.79 56 44 1058
Not Moorland Sites 1.75 35 65 3037
Biodiversity Designated Sites 2.46 45 55 3392
Non Designated Sites 1.39 38 62 704
Urban 2.19 36 64 1352
Not Urban 2.32 48 52 2744
Common Land 2.58 52 48 1774
Not Common Land Site 2.05 37 63 2322
Section 15 2.68 48 52 965
Not Section 15 Land 2.15 43 57 3131
Other Sites 2.38 44 56 3187
National Sample Sites 2.00 47 53 908
Sites with AMGS 2.31 44 56 3240
Sites without AMGS 2.15 45 55 856
TOTAL 2.28 44 56 4096 Weighted to equivalent numbers of days per site and retaining overall totals

Faber Maunsell Access Management Report: Three Year Monitoring Surveys at Open Access Land (2006-2008) 49
Figure 3.7 shows the relative walk lengths at each site type, in km that is not on PROW. Note
that in the mapping analysis the routes are overlaid with PROW to identify the length on PROW
but that no such comparable mapped data exists for tracks and paths that are not PROW for all
sites (see earlier for National Sample Sites)17
.
The shortest average walk lengths on Open Access Land occur at sites without biodiversity
designations, and at the National Sample of sites. The longest walks on Open Access Land
occur at moorland sites, urban sites and those with s15 land.
Figure 3.7 Average Walk Lengths on Open Access Land (km)
0.00 0.30 0.60 0.90 1.20 1.50 1.80
All
Moorland Sites
Not Moorland Sites
Biodiversity Designated Sites
Non Designated Sites
Urban
Not Urban
Common Land
Not Common Land Site
Section 15
Not Section 15 Land
Other Sites
National Sample Sites
Sites with AMGS
Sites without AMGS
1.27
1.66
1.13
1.35
0.87
1.40
1.20
1.23
1.29
1.40
1.22
1.34
1.06
1.29
1.19
Weighted to equivalent numbers of days per site and retaining overall totals Routes walked by respondents. Note: walk may be on path or track
Base: NS, NCA and LM sites
The average walk length when at a site (i.e. within the boundary of an Open Access Land site) is 2.29km. This is often part of a longer walk however, with the total recorded walk length averaging at 3km
18. More than a quarter of walks are less than a km in length, and half are
between 1 and 3km. Only 6% are more than 7km (4.3miles).
17
Note: for the National Sample Sites a mapping layer was created for tracks, but not for the
LM sites. 18
The extent of the walk beyond the site boundary cannot be identified with certainty, as this
will depend on the scale of map used in the survey and whether the surveyor recorded only the
walk on the site.
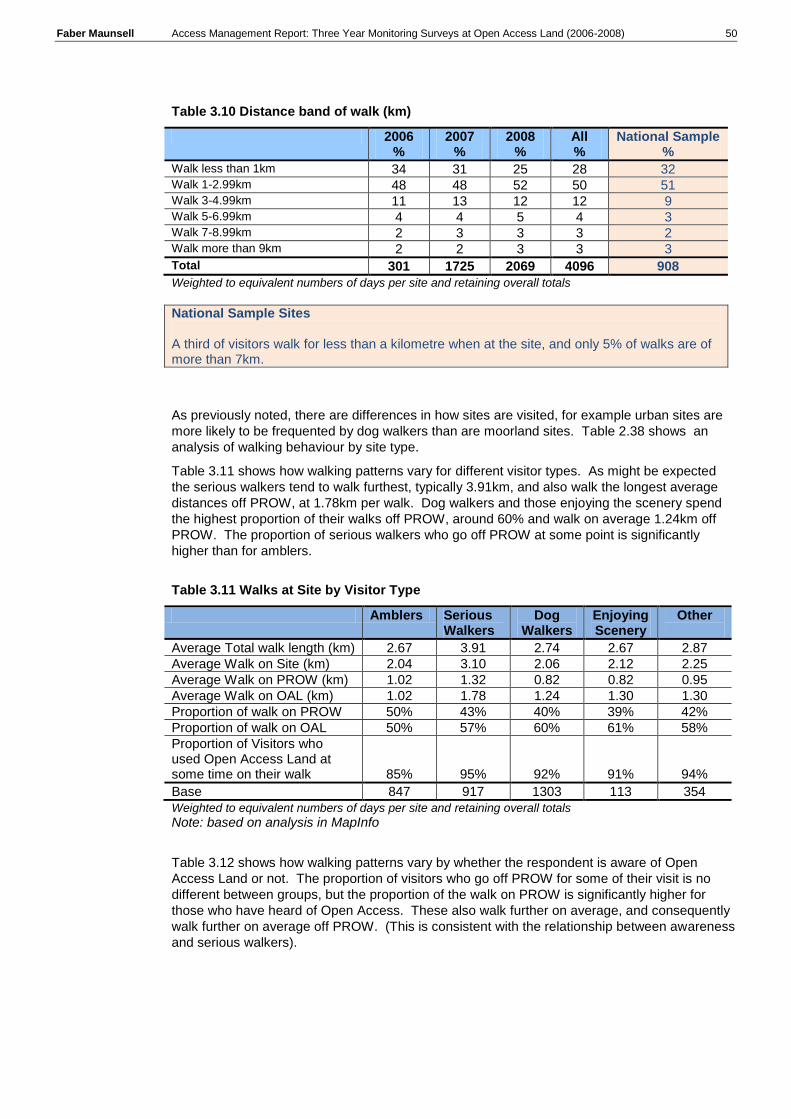
Faber Maunsell Access Management Report: Three Year Monitoring Surveys at Open Access Land (2006-2008) 50
Table 3.10 Distance band of walk (km)
2006 %
2007 %
2008 %
All %
National Sample %
Walk less than 1km 34 31 25 28 32 Walk 1-2.99km 48 48 52 50 51 Walk 3-4.99km 11 13 12 12 9 Walk 5-6.99km 4 4 5 4 3 Walk 7-8.99km 2 3 3 3 2 Walk more than 9km 2 2 3 3 3
Total 301 1725 2069 4096 908
Weighted to equivalent numbers of days per site and retaining overall totals
National Sample Sites A third of visitors walk for less than a kilometre when at the site, and only 5% of walks are of more than 7km.
As previously noted, there are differences in how sites are visited, for example urban sites are
more likely to be frequented by dog walkers than are moorland sites. Table 2.38 shows an
analysis of walking behaviour by site type.
Table 3.11 shows how walking patterns vary for different visitor types. As might be expected
the serious walkers tend to walk furthest, typically 3.91km, and also walk the longest average
distances off PROW, at 1.78km per walk. Dog walkers and those enjoying the scenery spend
the highest proportion of their walks off PROW, around 60% and walk on average 1.24km off
PROW. The proportion of serious walkers who go off PROW at some point is significantly
higher than for amblers.
Table 3.11 Walks at Site by Visitor Type
Amblers Serious Walkers
Dog Walkers
Enjoying Scenery
Other
Average Total walk length (km) 2.67 3.91 2.74 2.67 2.87
Average Walk on Site (km) 2.04 3.10 2.06 2.12 2.25
Average Walk on PROW (km) 1.02 1.32 0.82 0.82 0.95
Average Walk on OAL (km) 1.02 1.78 1.24 1.30 1.30
Proportion of walk on PROW 50% 43% 40% 39% 42%
Proportion of walk on OAL 50% 57% 60% 61% 58%
Proportion of Visitors who used Open Access Land at some time on their walk 85% 95% 92% 91% 94%
Base 847 917 1303 113 354
Weighted to equivalent numbers of days per site and retaining overall totals
Note: based on analysis in MapInfo
Table 3.12 shows how walking patterns vary by whether the respondent is aware of Open
Access Land or not. The proportion of visitors who go off PROW for some of their visit is no
different between groups, but the proportion of the walk on PROW is significantly higher for
those who have heard of Open Access. These also walk further on average, and consequently
walk further on average off PROW. (This is consistent with the relationship between awareness
and serious walkers).
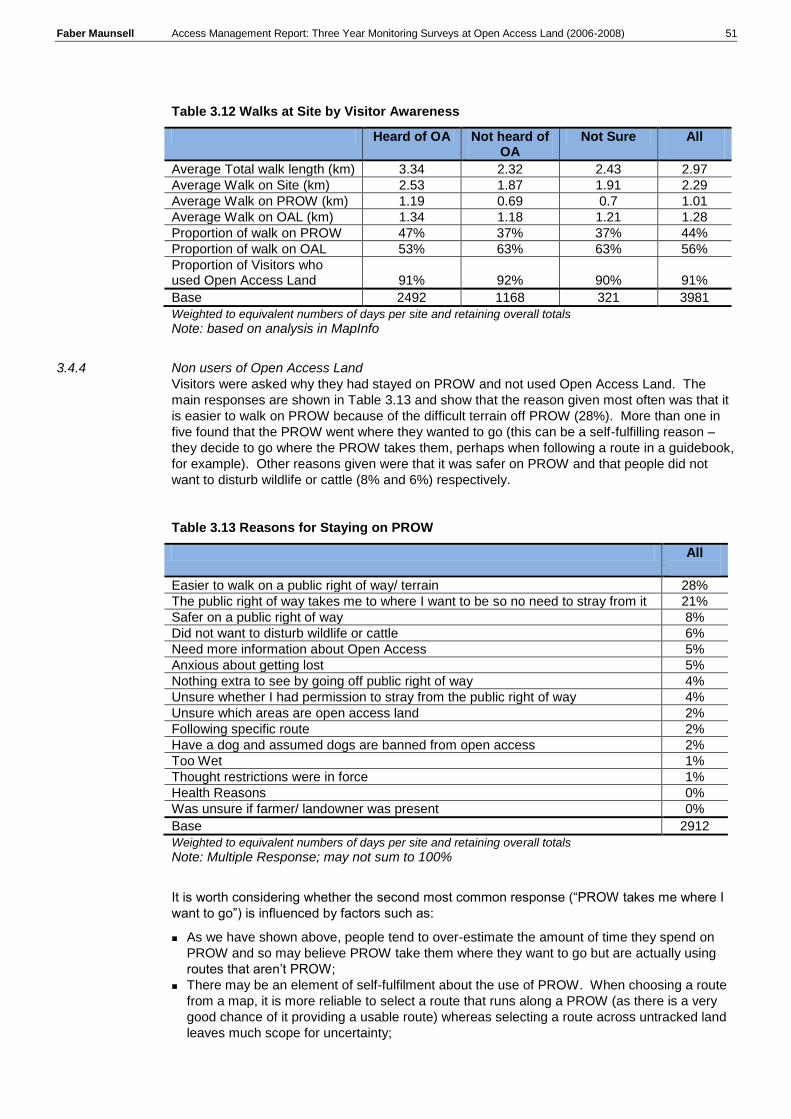
Faber Maunsell Access Management Report: Three Year Monitoring Surveys at Open Access Land (2006-2008) 51
Table 3.12 Walks at Site by Visitor Awareness
Heard of OA Not heard of OA
Not Sure All
Average Total walk length (km) 3.34 2.32 2.43 2.97
Average Walk on Site (km) 2.53 1.87 1.91 2.29
Average Walk on PROW (km) 1.19 0.69 0.7 1.01
Average Walk on OAL (km) 1.34 1.18 1.21 1.28
Proportion of walk on PROW 47% 37% 37% 44%
Proportion of walk on OAL 53% 63% 63% 56%
Proportion of Visitors who used Open Access Land 91% 92% 90% 91%
Base 2492 1168 321 3981
Weighted to equivalent numbers of days per site and retaining overall totals
Note: based on analysis in MapInfo
3.4.4 Non users of Open Access Land
Visitors were asked why they had stayed on PROW and not used Open Access Land. The
main responses are shown in Table 3.13 and show that the reason given most often was that it
is easier to walk on PROW because of the difficult terrain off PROW (28%). More than one in
five found that the PROW went where they wanted to go (this can be a self-fulfilling reason –
they decide to go where the PROW takes them, perhaps when following a route in a guidebook,
for example). Other reasons given were that it was safer on PROW and that people did not
want to disturb wildlife or cattle (8% and 6%) respectively.
Table 3.13 Reasons for Staying on PROW
All
Easier to walk on a public right of way/ terrain 28%
The public right of way takes me to where I want to be so no need to stray from it 21%
Safer on a public right of way 8%
Did not want to disturb wildlife or cattle 6%
Need more information about Open Access 5%
Anxious about getting lost 5%
Nothing extra to see by going off public right of way 4%
Unsure whether I had permission to stray from the public right of way 4%
Unsure which areas are open access land 2%
Following specific route 2%
Have a dog and assumed dogs are banned from open access 2%
Too Wet 1%
Thought restrictions were in force 1%
Health Reasons 0%
Was unsure if farmer/ landowner was present 0%
Base 2912
Weighted to equivalent numbers of days per site and retaining overall totals
Note: Multiple Response; may not sum to 100%
It is worth considering whether the second most common response (“PROW takes me where I
want to go”) is influenced by factors such as:
As we have shown above, people tend to over-estimate the amount of time they spend on
PROW and so may believe PROW take them where they want to go but are actually using
routes that aren‟t PROW;
There may be an element of self-fulfilment about the use of PROW. When choosing a route
from a map, it is more reliable to select a route that runs along a PROW (as there is a very
good chance of it providing a usable route) whereas selecting a route across untracked land
leaves much scope for uncertainty;

Faber Maunsell Access Management Report: Three Year Monitoring Surveys at Open Access Land (2006-2008) 52
Where walkers rely on guidebooks, the guidebook writer has, in effect, selected the route for
them. So, it is the guidebook writer‟s reasons that are relevant; it is likely that they would
want to provide the users of their guide with a route that is easy to follow.
A large number of other reasons were given and many of these are site specific (for further
details, refer to Site Reports). Other common reasons included not wanting to cause erosion or
disturb wildlife. Those with bikes and prams found the PROW more suitable for them, and
some mentioned not having suitable footwear to leave PROW.
3.4.5 Users of Open Access Land
Visitors were also asked why they had used Open Access Land. The main responses are
shown in Table 3.14. The main reason is to utilise other tracks or paths that are not PROW,
mentioned by 12% of respondents.
Table 3.14 What influenced your decision to go off Public Rights of Way/off paths?
All %
National Sample %
There are existing paths/ tracks on the ground off the PROW 12 15
To get to viewpoint/ part of site inaccessible by PROW 8 4
Exercise dog 6 8
More direct route to get where I'm going 5 5
Challenging walk 2 3
I could not easily identify where the Public Rights of Way were on the site
1 1
Wanted to go onto beach 1 1
Utilising my right of access 1 -
Part of set route following 1 1
Avoid path/ area of site due to terrain 1 *
Look at/ Find specific wildlife 1 *
Avoid others * 1
Habit - routine walk * -
Base 1422
Weighted to equivalent numbers of days per site and retaining overall totals
Note: Multiple Response; may not sum to 100%
Around 8% of people went off paths in order to access particular parts of the site that were not
connected by PROW, presumably to get to specific attractions of a site. Those at the site to
„enjoy the scenery‟ were the most likely to go off PROW to get to a viewpoint or part of the site
not accessible by PROW (19%). Only 5% of respondents at moorland sites gave this response
compared with 9% at other sites, while one in ten did so at sites with biodiversity designations.
Around one in 20 of those going off paths did so in order to take the most direct route to where
they wanted to be. A few went off just because they were lost or were not sure where the
PROW was.
Going off PROW to exercise dogs was mentioned at only 3% of those respondents at moorland
sites compared with 8% at lowland sites, and by 4% at sites with biodiversity designations
compared with 10% at other sites. The activities of dogs and visitors with dogs are explored
further in Chapter 3.
National Sample Sites 15% of respondents who went off PROW said that they did so because other paths or tracks were available. Other main reasons were to exercise their dog (8%).

Faber Maunsell Access Management Report: Three Year Monitoring Surveys at Open Access Land (2006-2008) 53
From the range of information recorded in the survey it is evident that people are utilising Open Access Land at the sites surveyed. There are no clear trends in change of use over time, suggesting that more time would need to elapse before changes in behaviour can attributed to CROW. It appears that CROW has legitimised usage of land off PROW rather than changed usage at this early period in the life of the new CROW rights of access.

4 Visitors with Dogs

Faber Maunsell Access Management Report: Three Year Monitoring Surveys at Open Access Land (2006-2008) 55
4.1 Introduction
In this chapter we present a discussion on how sites are used by visitors with dogs, broken
down by key site characteristics, by year. Further details on how individual sites are used can
be found in the Site Reports.
Almost half of visitors interviewed were accompanied by one or more dogs, see Figure 4.1.
Visitors were accompanied by dogs at 92% of the sites surveyed. At five sites, every visitor had
a dog.
Figure 4.1 Proportion of Visitors Interviewed who were Accompanied by Dogs
44%
51%
48%
49%
0% 20% 40% 60% 80% 100%
2006
2007
2008
Total
Weighted to equivalent numbers of days per site and retaining overall totals Base 2006 487 2007 1837 2008 2219 All 4543
National Sample Sites The proportion of visitors with a dog was 52% over all three years. There was no trend by year.
4.1.1 Exclusions
While people can normally walk with dogs on Open Access Land, there may sometimes be an
exclusion of people with dogs altogether, or people may need to keep it on a lead. The
regulations are that while exercising the new access right with a dog, people must use a fixed
lead no more than 2 metres long at all times when in the vicinity of livestock, and from 1st
March to 31st July each year as this is the nesting and lambing season. Dogs may also be
excluded completely from grouse moors (for a period of up to 5 years) and from lambing
enclosures at lambing times. Restrictions do not however apply to PROW that cross areas
where dogs are otherwise excluded, although they must be kept under close control. Further,
the CROW restrictions on dogs do not apply to Section 15 land. At some sites, allowing a dog
to run free/off lead may have been tolerated by the landowner and become a customary
activity, even though no statutory right exists.
Surveys were carried out at some sites during the general period of dog restrictions, as shown
in Figure 4.2. In 2006, the surveys did not commence until after the end of July. The
propensity to bring a dog to the site is significantly higher each year in the period than outside it
(52% compared with 48%). This suggests that dog owners are not deterred from bringing a
4 Visitors with Dogs
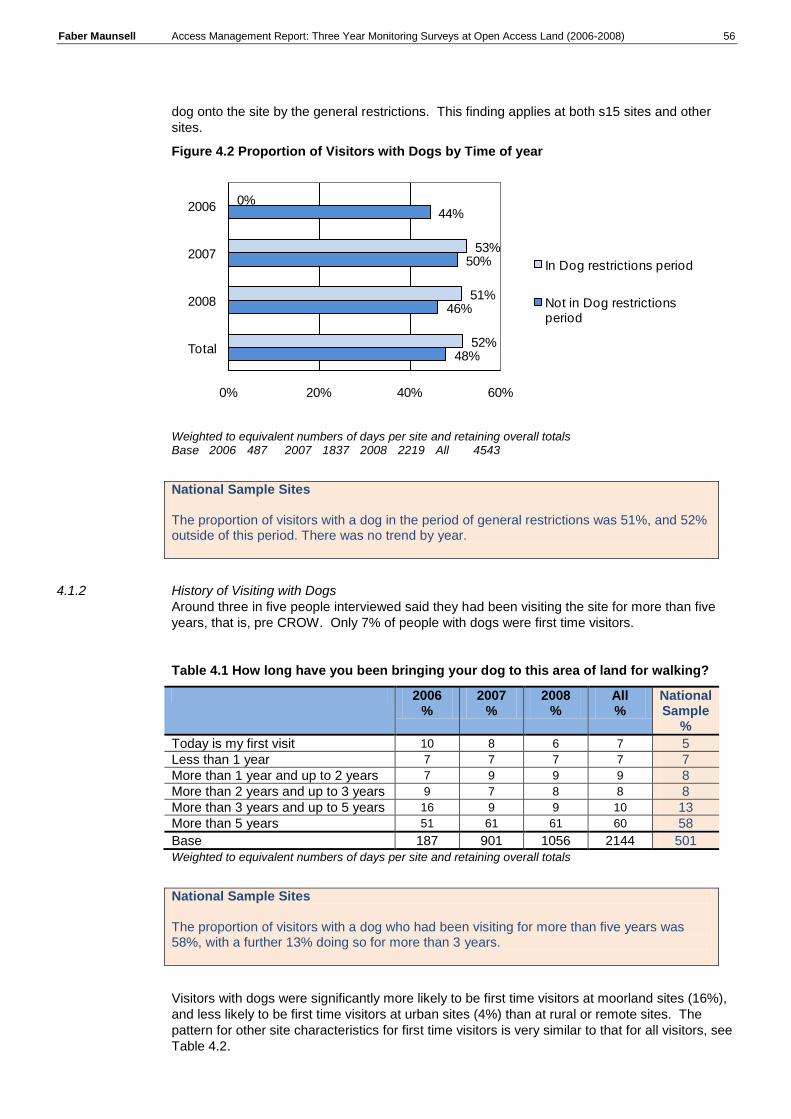
Faber Maunsell Access Management Report: Three Year Monitoring Surveys at Open Access Land (2006-2008) 56
dog onto the site by the general restrictions. This finding applies at both s15 sites and other
sites.
Figure 4.2 Proportion of Visitors with Dogs by Time of year
0%
53%
51%
52%
44%
50%
46%
48%
0% 20% 40% 60%
2006
2007
2008
Total
In Dog restrictions period
Not in Dog restrictions period
Weighted to equivalent numbers of days per site and retaining overall totals Base 2006 487 2007 1837 2008 2219 All 4543
National Sample Sites The proportion of visitors with a dog in the period of general restrictions was 51%, and 52% outside of this period. There was no trend by year.
4.1.2 History of Visiting with Dogs
Around three in five people interviewed said they had been visiting the site for more than five
years, that is, pre CROW. Only 7% of people with dogs were first time visitors.
Table 4.1 How long have you been bringing your dog to this area of land for walking?
2006 %
2007 %
2008 %
All %
National Sample
%
Today is my first visit 10 8 6 7 5
Less than 1 year 7 7 7 7 7
More than 1 year and up to 2 years 7 9 9 9 8
More than 2 years and up to 3 years 9 7 8 8 8
More than 3 years and up to 5 years 16 9 9 10 13
More than 5 years 51 61 61 60 58
Base 187 901 1056 2144 501
Weighted to equivalent numbers of days per site and retaining overall totals
National Sample Sites The proportion of visitors with a dog who had been visiting for more than five years was 58%, with a further 13% doing so for more than 3 years.
Visitors with dogs were significantly more likely to be first time visitors at moorland sites (16%),
and less likely to be first time visitors at urban sites (4%) than at rural or remote sites. The
pattern for other site characteristics for first time visitors is very similar to that for all visitors, see
Table 4.2.

Faber Maunsell Access Management Report: Three Year Monitoring Surveys at Open Access Land (2006-2008) 57
Table 4.2 Timing of Visit by Site Type
Site Type First Visit
%
Less than 2 years
2-5 years
More than 5 years
%
Base
% %
Moorland Sites 16 10 19 55 323
Not Moorland Sites 5 17 17 61 1821
Biodiversity Designated Sites 8 16 16 60 1682
Non Designated Sites 3 17 21 59 463
Urban 4 18 18 60 877
Not Urban 9 14 17 60 1267
Common Land 8 13 17 62 795
Not Common Land Site 6 18 18 58 1349
Section 15 7 13 18 62 448
Not Section 15 Land 7 17 17 59 1696
Other Sites 8 16 16 60 1643
National Sample Sites 5 15 22 58 501
Sites with AMGS 7 16 16 60 1705
Sites without AMGS 6 14 22 58 440
TOTAL 7 16 17 60 2144
Base 148 340 373 1282 Weighted to equivalent numbers of days per site and retaining overall totals
4.1.3 Attractions of Site for Dogs
People with dogs were asked what it was about the
site that made it good for bringing dogs to. The
main reason given was being able to let the dog
run off the lead, mentioned by 61% of people with
dogs. Further analysis shows that the proportion
saying this was significantly lower, 55%, in the
general dog restrictions period, compared with 63%
outside the period. Similarly, while 21% overall
mentioned „there are no restrictions on dogs here‟,
this proportion was only 12% in the general dog
restrictions period compared with 24% at other
times.
Relatively small proportions felt that there being no need to pick up dog mess was an attraction
of the site (2%) and 3% said there were things for the dog to chase at the site.
Dog off lead, on path, Canford Heath

Faber Maunsell Access Management Report: Three Year Monitoring Surveys at Open Access Land (2006-2008) 58
Table 4.3 What aspects about this area of land make it good for bringing a dog here?
In Dog restrictions
period
Not in Dog restrictions period
All %
National Sample %
Able to let dog run off lead 55 63 61 60 No/ not many other dogs 6 11 9 6 No/ not many other people 11 14 13 10 No restrictions on dogs being here 12 24 21 16 Dogs enjoy it here 37 48 45 37
Don't have to pick up dog mess 1 3 2 2
No livestock 8 8 8 6
Things for dogs to chase 2 4 3 1
Nothing in particular - I like the walk/ convenient for me 20 17
18 7
Good exercise/ open spaces 10 5 6 8
Dogs can swim 3 2 2 1
Safe-no traffic or other hazards 10 7 8 11
Dogs/ owners can socialise 4 3 3 6
Other 12 11 11 7
Base 581 1639 2220 533
Weighted to equivalent numbers of days per site and retaining overall totals Note: will sum to more than 100 as multiple responses allowed
There are twenty six sites where there was perceived to be no need to pick up dog mess. Nine
of these sites are in the National Sample, and three are NCA sites (Canford Heath, Bowland
Fells [Jubilee Tower] and Sunbiggin Tarn). The remainder are LM sites: Winfrith Heath in the
Dorset Heaths group may be a problem in this regard as 11 people mentioned this here.
Having things for the dog to chase was mentioned at 28 different sites, of which five were
National Sites, Canford Heath NCA site and 22 LM sites. Sutton Heath in Suffolk is highlighted
as a particularly large number of respondents mentioned it here.
Table 3.4 shows the proportions of people who said the site was good for letting a dog off the
lead, by site characteristics and whether interviewed in the period of general dog restrictions.
This shows that at moorland sites, a significantly lower proportion of visitors gave this response
(48%) compared with lowland sites (63%), and that at moorland sites the time of year made no
difference to the response, whereas at lowland sites people are much more likely to say this
when there are no general dog restrictions (65% compared with 57%).
The same proportion of visitors say they visit the site to let the dog off the lead at National
Sample sites as at all other sites, 61%, but in the period of general dog restrictions this
proportion is higher at National Sample sites, 66%. This suggests that awareness of the
restrictions is lower at these sites. This may be related to there being a higher proportion of
Section 15 land sites in the National Sample since the pattern is very similar.
At sites with biodiversity designations the proportion, who say they visit to let the dog off the
lead is significantly smaller, 50% in the restrictions period compared with both after this period
and with sites without such designations.
At sites with AMGS the proportion who say they visit the site to let the dog off the lead is
smaller, 51% in the period of general dog restrictions than at other sites. This may suggest that
at sites where the AMGS was aimed at dog walkers access management is having some effect,
however there is insufficient data at sites where this occurred to verify this.

Faber Maunsell Access Management Report: Three Year Monitoring Surveys at Open Access Land (2006-2008) 59
Table 4.4 Proportion saying “to let dog off lead” by site type
Site Type In dog restrictions
period
Not in dog restrictions
period
All Base
% % %
Moorland Sites 47 49 48 342
Not Moorland Sites 57 65 63 1878
Biodiversity Designated Sites 50 63 60 1728
Non Designated Sites 70 63 65 492
Urban 56 64 61 913
Not Urban 54 62 61 1306
Common Land 63 65 64 827
Not Common Land Site 50 62 59 1393
Section 15 67 56 60 471
Not Section 15 Land 50 65 61 1749
Other Sites 50 64 61 1687
National Sample Sites 66 57 61 532
Sites with AMGS 51 65 62 1756
Sites without AMGS 66 53 58 463
TOTAL 55 63 61 2221
BASE 582 1639 2221
Weighted to equivalent numbers of days per site and retaining overall totals
Table 3.5 shows similar information as above for the proportions of people who said they
brought the dog because there were perceived to be no restrictions on dogs. Compared with
the overall proportion of 21%, the proportion is significantly lower at moorland sites (12%), and
especially in the period of restrictions, 7%.
At sites with biodiversity designations, 11% of people perceived there to be no restrictions on
dogs being at the site, when interviewed in the period of general dog restrictions.
The restrictions, however, relate to dogs being under control and on leads, though given the
very small proportions who always keep their dogs on leads (see later) it is likely that many
dogs are allowed off leads in the general restrictions periods.

Faber Maunsell Access Management Report: Three Year Monitoring Surveys at Open Access Land (2006-2008) 60
Table 4.5 Proportion saying “no restrictions on dogs” by site type
Site Type In dog restrictions
period
Not in dog restrictions
period
All Base
% % %
Moorland Sites 7 15 12 342
Not Moorland Sites 14 25 22 1878
Biodiversity Designated Sites 11 25 22 1728
Non Designated Sites 16 18 17 492
Urban 11 26 21 913
Not Urban 14 23 21 1306
Common Land 17 22 20 827
Not Common Land Site 9 25 21 1393
Section 15 15 17 16 471
Not Section 15 Land 11 26 22 1749
Other Sites 11 26 22 1687
National Sample Sites 15 17 16 532
Sites with AMGS 13 25 22 1756
Sites without AMGS 12 18 16 463
TOTAL 12 24 21 2221
BASE 582 1639 2221
Weighted to equivalent numbers of days per site and retaining overall totals
4.1.4 Dog Control
Respondents were asked whether they keep their dog on a lead when at the site. Slightly more
people said „Always‟ (8%) than said „Never‟ (7%), but the majority said „sometimes‟ (85%).
Although the proportion saying never has increased from 2006 to 2008 the change by year is
not significant.
Table 4.6 Propensity to keep dog(s) on a lead on this site
2006 %
2007 %
2008 %
All %
National Sample
%
Always 7 8 8 8 7
Never 5 6 8 7 10
Sometimes 88 86 84 85 83
Base 216 919 1059 2194 532
Weighted to equivalent numbers of days per site and retaining overall totals
National Sample Sites The proportion of visitors with a dog who say they never keep their dog on a lead is 10%, with no change by year.
There is a significant difference in the proportion who say „never‟ who visited in the dog
restrictions period, see Table 4.7; 10% said never compared with only 6% visiting at other
times. For those visiting outside the period of general dog restrictions significantly more said
„always‟ at sites without AMGS and only 8% said so. There is insufficient information about the
AMGS and whether this was related to dog control specifically, to be able to conclude whether
the AMGS is a factor here. As shown later, where dogs were always off leads, most
respondents felt that they did have control over their dogs.

Faber Maunsell Access Management Report: Three Year Monitoring Surveys at Open Access Land (2006-2008) 61
Table 4.7 Propensity to keep dog(s) on a lead on this site by time of visit, AMGS sites
In Dog restrictions period Not in Dog restrictions period
All %
No AMGS
AMGS All No AMGS
AMGS All
Always 5 7 7 12 8 9 8
Never 9 10 10 7 6 6 7
Sometimes 85 83 83 82 86 85 84
Base 160 416 576 302 1330 1632 2208
Respondents were asked how they would control their dogs in given circumstances,. The
questions were asked differently in the LM and NM surveys so the results are presented
separately.
In the NM survey people were first asked if they always or never kept those dogs on leads.
Those who did „sometimes‟ or „never‟, were then asked in what circumstances would they put
the dog on a lead. The responses were unprompted, that is unless mentioned spontaneously
no response was recorded. As shown in Table 3.8 the circumstance most likely to prompt
putting the dog on a lead is when livestock is close by, mentioned by 55%; there are no trends
by year.
Other dogs being close by would prompt 44% to put their dog on a lead. There are no
significant differences by year in the proportion who said they would respond if wild birds were
close by, even though the proportion was much higher in 2006 than in 2007 and 2008 (15%
reduced to 9%).
Around one in ten said they would keep their dogs on leads in the nesting season. At the
National Sample of sites this proportion is half, 5%. This suggests low awareness of the
potential risks to breeding birds.
The findings appear to show that people are more likely to respond to issues that would impact
on their dog, rather than on the impact their dog might have.
Table 4.8 Under what circumstances do you keep your dog(s) on a lead on this site?
(NM) – unprompted responses
2006 2007 2008 All National Sample
% % % % %
On access land NOT on a PROW/ when off PROW 3 1 * 1 1
If wild birds are close by 15 8 9 10 8
If signs/ information say to keep on lead 16 7 10 11 10
If other dogs are close by 39 45 46 44 46
If livestock close by 58 47 58 55 55
In nesting season 8 8 12 10 5
In shooting season 5 3 2 3 3
Base (those who sometime keep dog on lead) 190 183 247 619 443
Weighted to equivalent numbers of days per site and retaining overall totals Note: will sum to more than 100 as multiple responses allowed
In the LM surveys people were asked “Under what circumstances do you keep your dog(s) on a
lead, to heel off the lead or free roaming off the lead on this site?” for a list of circumstances.
The proportions who said „On Lead‟ are shown in Table 4.9. There is data from two years only
so no trends can be inferred. If signs or information are present to say keep on a lead, over
three quarters said they would respond, and this is encouraging from an Access Management

Faber Maunsell Access Management Report: Three Year Monitoring Surveys at Open Access Land (2006-2008) 62
perspective, although conversely, a quarter did not say they would, even if asked. A further 9%
said they would keep their dog to heel, though not on a lead if asked to do so by signage,
Almost two thirds said they would keep a dog on a lead if livestock were close by and over half
said they would do so in the nesting season.
Table 4.9 Under what circumstances do you keep your dog(s) on a lead, to heel off the
lead or free roaming off the lead on this site? (LM – response to „On Lead‟)
2006 2007 2008 All LM
% % % %
On access land NOT on a PROW/ when off PROW 0 17 19 18
If wild birds are close by 0 44 51 48
If signs/ information say to keep on lead 0 75 77 76
If other dogs are close by 0 33 33 33
If livestock close by 0 60 68 64
In nesting season 0 48 54 51
In shooting season 0 46 47 47
Base 0 702 759 1461 Weighted to equivalent numbers of days per site and retaining overall totals Note: will sum to more than 100 as multiple responses allowed
The two sets of responses understandably show different results. The first shows how people
think; many would control their dog as they see a need arising, from the presence of livestock
or other dogs. They are less likely to consider nesting birds or wildlife unless they have a prior
knowledge of their needs, so where awareness of wildlife is low this would need to be raised in
order for people to think about controlling their dog.
The second set of responses is interesting in that almost a quarter said they would not put the
dog on a lead even if signs or information said to do so, indicating the limits of the potential to
change behaviours through signage. It should be remembered that regular visitors are those
least likely to look at signs compared with those visiting a site for the first time so raising
awareness is likely to be challenging. More innovative positive access management techniques
to influence dog walkers‟ behaviour therefore might need to be developed or greater use of
wardening may be required.
Respondents in the NM survey who said they would not put their dogs on leads were asked
why this was. Table 4.10 shows the reasons given, with the site they were visiting. Most people
who gave reasons felt their dogs were well trained and could be trusted to behave. Some
comments suggested that they did not perceive any risks from dogs at the site, and one person
felt there should be specific information explaining why.
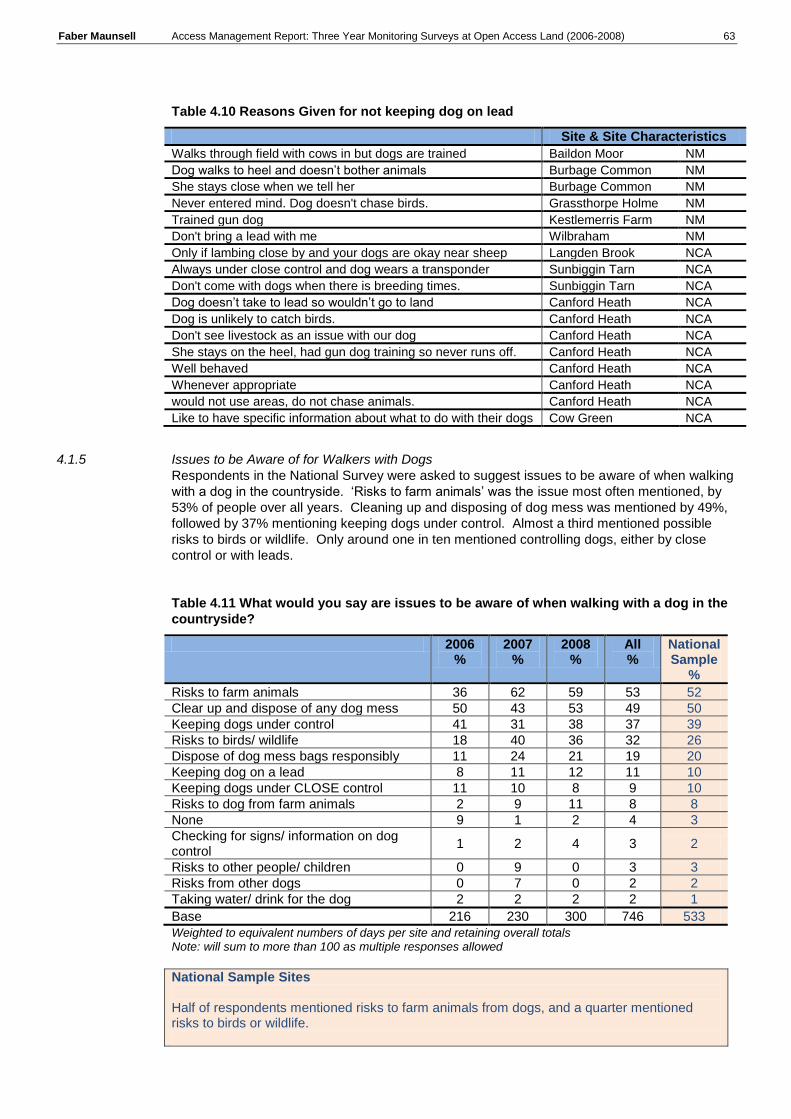
Faber Maunsell Access Management Report: Three Year Monitoring Surveys at Open Access Land (2006-2008) 63
Table 4.10 Reasons Given for not keeping dog on lead
Site & Site Characteristics
Walks through field with cows in but dogs are trained Baildon Moor NM
Dog walks to heel and doesn‟t bother animals Burbage Common NM
She stays close when we tell her Burbage Common NM
Never entered mind. Dog doesn't chase birds. Grassthorpe Holme NM
Trained gun dog Kestlemerris Farm NM
Don't bring a lead with me Wilbraham NM
Only if lambing close by and your dogs are okay near sheep Langden Brook NCA
Always under close control and dog wears a transponder Sunbiggin Tarn NCA
Don't come with dogs when there is breeding times. Sunbiggin Tarn NCA
Dog doesn‟t take to lead so wouldn‟t go to land Canford Heath NCA
Dog is unlikely to catch birds. Canford Heath NCA
Don't see livestock as an issue with our dog Canford Heath NCA
She stays on the heel, had gun dog training so never runs off. Canford Heath NCA
Well behaved Canford Heath NCA
Whenever appropriate Canford Heath NCA
would not use areas, do not chase animals. Canford Heath NCA
Like to have specific information about what to do with their dogs Cow Green NCA
4.1.5 Issues to be Aware of for Walkers with Dogs
Respondents in the National Survey were asked to suggest issues to be aware of when walking
with a dog in the countryside. „Risks to farm animals‟ was the issue most often mentioned, by
53% of people over all years. Cleaning up and disposing of dog mess was mentioned by 49%,
followed by 37% mentioning keeping dogs under control. Almost a third mentioned possible
risks to birds or wildlife. Only around one in ten mentioned controlling dogs, either by close
control or with leads.
Table 4.11 What would you say are issues to be aware of when walking with a dog in the
countryside?
2006 %
2007 %
2008 %
All %
National Sample
%
Risks to farm animals 36 62 59 53 52
Clear up and dispose of any dog mess 50 43 53 49 50
Keeping dogs under control 41 31 38 37 39
Risks to birds/ wildlife 18 40 36 32 26
Dispose of dog mess bags responsibly 11 24 21 19 20
Keeping dog on a lead 8 11 12 11 10
Keeping dogs under CLOSE control 11 10 8 9 10
Risks to dog from farm animals 2 9 11 8 8
None 9 1 2 4 3
Checking for signs/ information on dog control
1 2 4 3 2
Risks to other people/ children 0 9 0 3 3
Risks from other dogs 0 7 0 2 2
Taking water/ drink for the dog 2 2 2 2 1
Base 216 230 300 746 533
Weighted to equivalent numbers of days per site and retaining overall totals Note: will sum to more than 100 as multiple responses allowed
National Sample Sites Half of respondents mentioned risks to farm animals from dogs, and a quarter mentioned risks to birds or wildlife.

Faber Maunsell Access Management Report: Three Year Monitoring Surveys at Open Access Land (2006-2008) 64
The issues mentioned most often have been analysed by site type, see Table 3.12. Visitors to
moorland sites are significantly more likely to mention risks to farm animals, than visitors to
lowland sites (69% and 49% respectively), as are visitors to common land sites (58%).
Clearing up dog mess is significantly less likely to be mentioned at moorland sites (25%) and
non-urban sites (45%), and significantly more likely to be mentioned at common land (53%),
and Section 15 sites (56%).
Keeping dogs under close control is significantly less likely to be mentioned at moorland sites
(27%), and significantly more likely to be mentioned at common land (40%), and sites with
AMGS (41%).
Risks to birds and wildlife are significantly more likely to be mentioned at moorland sites than
lowland (47% compared with 28%) and at sites with biodiversity designations (40%), and at
sites with AMGS (35%).
Table 4.12 Issues mentioned by site type (2006-2008 inclusive)
Site Type Risks to farm
animals %
Clearing up Dog Mess
Keeping dogs under
control
Risks to
birds / wildlife
%
Base
% %
Moorland Sites 69 25 27 47 143
Not Moorland Sites 49 54 39 28 604
Biodiversity Designated Sites 53 47 35 40 371
Non Designated Sites 54 50 38 24 376
Urban 57 53 35 31 377
Not Urban 49 45 38 33 369
Common Land 58 53 40 30 495
Not Common Land Site 44 40 31 35 251
Section 15 54 56 38 28 396
Not Section 15 Land 52 41 35 36 350
Other Sites 52 50 39 26 533
National Sample Sites 56 46 31 46 214
Sites with AMGS 56 50 34 35 464
Sites without AMGS 49 47 41 27 282
TOTAL 53 49 37 68 746 Weighted to equivalent numbers of days per site and retaining overall totals
4.1.6 Walk patterns
Table 4.13 shows the average walks at sites by people with dogs. Most of the walk‟s length,
65%, is off PROW, and almost all, 93% of people with dogs go off PROW at some point during
their visit. There are no trends by year in the degree of use, although walk lengths are
significantly longer in 2007 and 2008 compared with 2006.

Faber Maunsell Access Management Report: Three Year Monitoring Surveys at Open Access Land (2006-2008) 65
Table 4.13 Usage of Open Access Land by People With Dog
2006 2007 2008 Total
National Sample
%
Average Total walk length (km) 2.16 2.42 2.52 2.45 2.12
Average Walk on Site (km) 1.46 1.81 1.98 1.87 1.51
Average Walk on PROW (km) 0.45 0.65 0.69 0.66 0.72
Average Walk on OAL (km) 1.00 1.16 1.29 1.22 0.79
Proportion of walk on PROW 31% 36% 35% 35% 48%
Proportion of walk on OAL 69% 64% 65% 65% 52%
Proportion of Visitors who used Open Access Land at some time on their walk
95% 91% 95% 93% 88%
Base 144 885 1016 2045 482
Weighted to equivalent numbers of days per site and retaining overall totals
National Sample Sites Almost half of the walk lengths of people with dogs are on PROW, and half off. There are no trends by year.
Table 4.14 shows the same information for people with dogs in the period of general dog
restrictions and outside. Walk lengths are generally longer in the restrictions period, but the
proportion spent off PROW is the same. The proportion who use Open Access Land is
however significantly higher, at 94% outside the period of restrictions.
Table 4.14 Usage of Open Access Land by People With Dog
In Dog restrictions
period
Not in Dog restrictions
period
In Dog restrictions period - NS
Not in Dog restrictions period - NS
Average Total walk length (km)
2.53 2.42 2.18 3.56
Average Walk on Site (km)
2.02 1.82 1.69 3.24
Average Walk on PROW (km)
0.71 0.64 0.84 1,49
Average Walk on OAL (km)
1.31 1.18 0.66 1.76
Proportion of walk on PROW 35% 35% 49% 46%
Proportion of walk on OAL 65% 65% 51% 54%
Proportion of Visitors who used Open Access Land at some time on their walk 91% 94%
Base 543 1502 181 171
Weighted to equivalent numbers of days per site and retaining overall totals
National Sample Sites The proportions of walks on and off PROW are no different by time of year, although the average walk lengths are higher outside the periods of general dog restrictions (but note the small sample sizes).

Faber Maunsell Access Management Report: Three Year Monitoring Surveys at Open Access Land (2006-2008) 66
4.2 Spatial analysis of Dogs on site from Observation Data – within/outside of dog
restriction period A total of 15,300 visitors were recorded in the three year observation surveys across all sites.
Of these, 3170 were identified as walking with dogs and 2190 dogs were recorded. This
proportion of people with dogs, 20% is lower than was found in the interview surveys.
It should be noted that it is not always possible to distinguish a dog walker from a serious
walker or ambler when making observations. Dogs may not have been as visible at a distance
as people would be, especially where long grass or other vegetation could obscure them from
view. In understanding the observation data it should be recognised that the position of dogs is
difficult to identify with accuracy given their tendency to move around rather more than the
people they are with. The methodology applied may also mean that fewer dog walkers would
be recorded, since these visitors only spend on average 1.1 hours on a visit, almost half of the
overall average, and hence there is a smaller chance that they will be on site when the
observation was made.
Hence, although the ratio of dogs to visitors is lower than the interview data might suggest, it is
rational and there is a large pool of information available for analysis. Importantly, the data on
dog owner activity is what they actually do, rather than what they say they would do when
asked by a surveyor.
The position of dogs on the site as being on PROW, on tracks or on Open Access Land was
recorded on the observation forms. Dogs were about as likely to be on PROW as off at the
time of observation, as shown in Table 4.15. There is no trend by year. There is no significant
difference in the proportion on PROW by the time of year of the survey.
Table 4.15 Observed Usage of Site - Dogs‟ Location on site
2006 %
2007 %
2008 %
All %
On PROW 54 38 49 46
On Tracks not PROW 0 0 21 7
On Open Access Land 46 62 30 47
Base 569 899 722 2190
Table 4.16 Observed Usage of Site – Dogs on PROW
2006 %
2007 %
2008 %
All %
On PROW – in period of restrictions n/a 52 46 48
On PROW – not in restrictions period 54 34 52 45
Base 569 899 722 2190
No survey in 2006 in restrictions period
Table 4.17 shows the information for dogs observed, in both the period of general dog
restrictions and at other times, for the National Sample of sites only. This shows that three
dogs of the 1075 recorded were on Open Access land where excluded in the period of general
dog restrictions, of which two were off lead and roaming and therefore a potential risk. One of
these was at Decoy Heath, part of Morden Bog & Hyde Heath SSSI and Dorset Heathlands
SPA; the others were at sites with no biodiversity concerns.
There were also three dogs on Open Access land where excluded after the period of general
dog restrictions, all of which were off lead and roaming and one was described as uncontrolled.
Thirteen dogs were noted disturbing livestock, though none disturbing wildlife.

Faber Maunsell Access Management Report: Three Year Monitoring Surveys at Open Access Land (2006-2008) 67
Table 4.17 Observed Usage of Site - Dogs‟ Location on site National Sample
Dogs In Period of dog restriction
Yes No
on PROW
%
on Tracks %
on Access
Land where
Allowed %
on Access
Land where
Excluded %
on PROW
%
on Tracks
%
on Access
Land where
Allowed %
on Access
Land where
Excluded %
On Lead 34 21 37 0 35 10 26 0
Off Lead to heel
34 33 21 33 39 26 35 0
off Lead roaming
33 46 43 67 26 65 39 100
TOTAL DOGS N
172 48 87 3 397 31 334 3
Controlled 12% 10% 30% - 1% 3% 100% -
Uncontrolled - - 6% - - - 1% 33%
Disturbing others
- - 2% - - 3% 2% -
Disturbing livestock
- 2% - - - - 4% -
Disturbing wildlife
- - - - - - - -
Other non control
- - - - - - 1% -
Note: may not sum to 100%
Dogs accompany around half of visitors to Open Access Land, and it appears that the period of general dog restrictions does not deter dog owners from visiting, even though the majority visit with the express intention of letting the dog run off the lead, in what is perceived to be a safe environment for the dog, away from traffic.
Only one in fourteen dogs is always kept on a lead, and one in ten are never on leads, though where this is the case owners mostly believe that their dogs pose no risks and are controlled. This is supported by the observation data which showed that the majority of dogs are controlled, and there were relatively few dogs on areas with exclusions. The data suggests that around a quarter of visitors would not put their dogs on leads even if signage requested them to. People with dogs are more likely to perceive risks to their dog that might induce them to put the dog on a lead, rather than that the dog might be a potential risk to birds or other wildlife.
People with dogs are no more likely to stick to PROW than other visitors.

5 Other Activities on Open Access Land
Faber Maunsell Access Management Report: Three Year Monitoring Surveys at Open Access Land (2006-2008) 69
5.1 Background
CROW legislation restricts use of Open Access Land to certain activities. Part I of the CROW
Act grants a general right of public access to „access land‟ for the purposes of open-air
recreation. The rights are for access on foot. Rights to do other activities, such as camping or
cycling, horse riding, are not conferred by the CROW Act, although they may be
permitted/tolerated locally or through other legislation applying to the land. Another general
restriction is „organised games‟ but the law is unclear on this point so no attempt has been
made to assess whether anyone was engaged in an organised game. Similarly, the law is
unclear about what constitutes an activity undertaken primarily for a commercial purpose
(another of the general restrictions) and no attempt was made to identify any such activities, if
indeed they could be identified at all.
In additions to the general restrictions, there will sometimes be local restrictions on the new
rights for reasons such as land management, public safety, nature conservation and heritage
preservation.
It should be noted that the activities which members of the public have a right to do may differ
when on PROW. As already noted, it is not unlawful for a dog owner to take his or her dog
unleashed (but under close control) along a PROW even though the dog may be banned from
surrounding areas or be required to be on a lead. Further examples are that there is a right to
ride a horse or a bike on bridleway, and there is a right to drive a motorised vehicle on a byway
open to all traffic. Another complication is that on some types of Section 15 land (i.e. so-called
urban commons), it is lawful to ride a horse anywhere but not to cycle. This aspect is discussed
in the Site Reports, where relevant.
5.1.1 Survey Findings
As part of the surveys, behaviour of visitors was recorded as part of the observation survey.
However, what may be inappropriate at one site may be legitimate or tolerated at another
depending on pre existing rights. For example, one of the NM sites has long been in use as a
public park.
The types of behaviour that may be inappropriate, in addition to the dog behaviour discussed in
Chapter 3 recorded in the survey were
picking flowers
fire risk activity
walking through restricted areas
using a motorised vehicle where not permitted
using a non-motorised vehicle where not permitted
people disturbing nesting birds.
It should be noted that it was often difficult in the observation surveys to record with certainty
whether an activity was inappropriate.
Of the more than 15,000 visitors observed, 43 were observed picking flowers, 17 of whom were
doing so on Open Access Land. This was at the following sites:
The Comp (NM Site)
Brancaster Beach (North Norfolk Coast).
Nineteen visitors were observed in activities that may pose a fire risk (e.g. having a barbeque),
and of these 15 were on Open Access Land. The sites where this occurred were:
Decoy Heath (NM Site)
Burbage Common (NM Site)
Alresford (NM Site)
5 Other Activities on Open Access
Land
Faber Maunsell Access Management Report: Three Year Monitoring Surveys at Open Access Land (2006-2008) 70
Brancaster Beach (North Norfolk Coast)
27 visitors were observed walking in areas with restrictions, 22 of whom were on Open Access
Land. The sites where this occurred were:
Eggardon Hill (Dorset)
Brancaster Beach (North Norfolk Coast)
Coldberry (North Pennines AONB)
Jubilee Tower (Bowland Fell)
Browns Houses (Lancashire)
Blanchland (North Pennines AONB)
Driving motorised vehicles appear to be the main type of inappropriate activity recorded. This
was noted at 8 sites, with 59 visitors overall using motorised vehicles where not permitted, at
the following sites
Alresford (NM)
Brancaster Beach (North Norfolk Coast)
Coldberry (North Pennines AONB)
Decoy Heath
Ewefell Mire (Sunbiggin Tarn)
Middleham Low Moor
North Walney (Cumbria)
Whitworth Higher End Moor (NM)
It is important to note that no attempt was made to establish whether the driver had any legal
right to be driving on the site. For example, the owner of the land or someone acting with his
permission, is entitled to drive on land, as too are people with a lawful purpose or in an
emergency. Non Motorised vehicles were seen less often, with fewer incidences recorded; 12
in total of which 7 were on Open Access Land at:
Decoy Heath (NM)
Eggardon Hill (Dorset)
Malvern Hills (NM)
Note that, in law, a bicycle is a non-motorised vehicle, but in this report, the term applies to
other non-motorised vehicles, rather than bicycles.
Just one incidence of someone disturbing nesting birds was observed and this was at Bowness
Common / Solway Moss (Cumbria).
At some sites, waterbodies could be seen and some were used for fishing; it has been
assumed that this was done under appropriate permits and licences. At a number of sites,
„other inappropriate activities‟ were noted but insufficient details were recorded to enable any
meaningful analysis. For further details on inappropriate behaviour please refer to Site
Reports.
Whilst inappropriate behaviour cannot be condoned, it is pertinent to note that it was evident in only a very small proportion of total observed activities. Further, it is important to note that achieving 100% compliance with a particular management measure may not necessarily be a block to achieving site management objectives and may be too costly to achieve.

6 Patterns of Use

Faber Maunsell Access Management Report: Three Year Monitoring Surveys at Open Access Land (2006-2008) 72
6.1 Background
In this section we present a brief summary of the patterns of use recorded at each of the sites
surveyed, together with a commentary on the impacts and implications of CROW. Full
information for each site can be found in the site reports.
Tables 6.1 to 6.12 summarise the assessments of the likely impact of CROW, for the following
site groups;
National Sample Sites;
South Pennine Moors;
North Pennines AONB;
Bowland Fells;
Sunbiggin Tarn;
Canford Heath and other sites in the Dorset Heathlands;
North Norfolk Coast;
Sites in Lancashire;
Sites in Cumbria (outside of North Pennines);
Sites in Shropshire;
Sites in Suffolk; and
Sites in Dorset outside of the Dorset Heaths SAC.
6.2 National Sample Sites
Table 6.1 shows the assessments of the likely impacts of CROW for the National Sample of 26
sites, together with an indication of how this conclusion was met, and any residual concerns for
access management. This assessment has been made on the basis of the information
available from the surveys and site data. NE may have access to other information with which
to use the interview and spatial data for further analysis. For example, there may be
management measures in place that have had the effect of managing impacts, leading to a
conclusion that there are no residual concerns (which would mean, by implication, that the
measures are being successful). It is also implicit in the assessments that the pattern of use
identified during the surveys is assumed to be typical; this may be the case or it may provide an
overestimate of use, given that the busiest times and locations were selected for survey.
Of the 26 sites, two thirds (n=17) have no residual concerns. At almost a quarter of sites (n=6)
there are concerns over the impact of dogs; roaming dogs may impact on wildlife, or stock, and
limiting agricultural use. At one site (Middleham Low Moor) there is the potential for inter-user
conflict if use increases. At one site, Waldridge Fell, a residual concern is habitat erosion from
heavy use. The high proportion of first time visitors may give rise to concerns at one other site.
Further information on the sites with residual concerns is presented below.
6 Patterns of Use

Faber Maunsell Access Management Report: Three Year Monitoring Surveys at Open Access Land (2006-2008) 73
Table 6.1 CROW Impact Assessment National Sample Sites
Site Name National Sample
Sites
Assessment of likely impact of CROW
19Key considerations in
arriving at conclusion Residual concerns
Adleymoor Common No impact Existing use, pre-CROW Increasing use and dogs roaming free in nesting/lambing season
Alresford Low impact Most users stay on PROW Sensitive areas are unattractive to users
Roaming dogs may affect wildlife and sheep
Baildon Moor No impact Existing use, pre-CROW None
Burbage Common No impact Existing use, pre-CROW None
Decoy Heath Low impact Most users stay on PROW
Roaming dogs may affect wildlife
Doddington North Moor
No impact Low level of use Most users stay on PROW
None
Dunnockshaw Woodland
Low impact Evidence suggestive of pre-CROW use Low level of use relative to site size Resilient vegetation type
None
Grassthorpe Holme No impact Existing use, pre-CROW None
Kestlemerris Farm No impact Low level of use Existing use, pre-CROW
None
Long Ridge Crags No impact Low level of use None
Malvern Hills No impact Existing use, pre-CROW None
Merrow Downs Low impact Existing use, pre-CROW None
Middleham Low Moor
Low impact Existing use, pre-CROW Inter-user conflict if use increases
Moorside No impact Existing use, pre-CROW None
Ringmere Plantation No impact Low level of use None
Sandyford Moor No impact Low level of use None
Severn Ham No impact Existing use, pre-CROW Dogs placing limits on agricultural use and causing nutrient enrichment
Silvington Common No impact Existing use, pre-CROW Most users stay on PROW
None
The Comp Uncertain but probably low
Evidence of pre-CROW use unclear High proportion of routes on OAL
Roaming dogs may affect wildlife and sheep
The Mens Low impact Evidence tends to suggest pre-CROW use Resilient vegetation type
High proportion of first time visitors
Waldridge Fell No impact Existing use, pre-CROW Habitat destruction from heavy use
Wardle Brook No impact Low level of use (of the OAL) None
Whitehall Plantation No impact No users None
Whitworth Higher End Moor
No impact Existing use, pre-CROW None
Wilbraham No impact Low level of use None
Wisley Common Uncertain but probably low
Evidence tends to suggest pre-CROW use
Roaming dogs may affect wildlife
19
Note – at some sites, the type of vegetation and nature conservation interests means that fire risk could
be high in drought conditions. In extreme drought conditions, CROW Act provides access authorities with powers to restrict access. However, such circumstances were not encountered during the survey period so we were unable to observe how visitors behave. So, there is a residual concern about fire risk at some sites but without any evidence to say whether this has been affected by CROW. Consequently, such risks are not considered in the Tables.

Faber Maunsell Access Management Report: Three Year Monitoring Surveys at Open Access Land (2006-2008) 74
6.2.1 Concerns - National Sample Sites
In this section we present a brief summary of the patterns of use recorded at those sites where
residual concerns are raised, together with a commentary on the impacts and implications of
CROW. Full information for each site can be found in the site reports.
Six sites have potential concerns over the impact of roaming dogs on wildlife, stock, and the
limits this may place on agricultural use (some aspects of which may be valuable for nature
conservation at some sites). These are:
Adleymoor Common;
Alresford;
Decoy Heath;
Severn Ham;
The Comp; and
Wisley Common.
6.2.2 Patterns of Use: Adleymoor Common
All those observed were walking dogs; after the 31st July, the route followed was „there-back‟
along the track, whilst during the dog restriction period, one interviewee and others seen during
observations took a circular routes around the northern half of the site, Although dogs were
seen off leads, none were observed that were uncontrolled or caused any disturbance. The
southern part of the site appears not to be used at all by visitors.
This is clearly a lightly-used site, with dog walkers being the sole user type (apart from one
„other‟ user). Half the interviewees (n=2) told us that they have been using this site for this
purpose for at least 5 years, whilst the rest had been using the site for between 2 and 5 years.
From a land management perspective, the fact that dogs are being brought onto the site and
allowed to run off lead, including at times when the general restrictions on dogs off lead apply,
could be a cause for concern if there is livestock or ground nesting birds. As it is not nationally
designated it is unlikely and the number of visitors would not be a concern at all, and the dogs
were observed not to be causing any disturbance and, if our interviewees are typical, most were
regular visitors to the site pre-CROW. However, over the three years, the numbers of visitors
has increased slightly, though are still low. If usage continued to grow the risks of sheep
worrying occurring could grow, if new users appear with their dogs and do not exercise the
same degree of control.
It needs to be borne in mind that this area is covered by CROW Section 15; in other words, a
right of public access to it existed prior to the introduction of CROW. Therefore, the implications
arising from CROW access implementation for land management are considered to be nil.
6.2.3 Patterns of Use: Alresford
Observed visitor activity is concentrated around the southern end of Ford Lane. Information
gleaned from interviews and observations support the suggestions made earlier – that there is
little to tempt visitors away from the public right of way and onto the access land. Where
walkers want a longer, circular route, the tendency is to come inland. Without exception,
respondents interviewed during the period of general dog restrictions (1st March to 31st July)
stayed on public rights of way. In the period after 31st July, there was perhaps a greater
tendency to leave public rights of way amongst those visitors not accompanied by dogs.
Although only a quarter of dogs were on leads, those off lead were assessed to be controlled
and not causing any disturbance.
The site contains features that may be sensitive to the presence of the public – it is part of the
Colne Estuary SSSI, which is also a Ramsar site and SPA of value for wintering birds. The site
is also grazed by sheep. However, the fact that nearly all visitors (and all dog walkers) stay on
the public footpath means that implications for nature conservation interests are likely to be low,
provided dogs are kept under control and not allowed to disturb the wintering birds for which the
site is valued. This will also be true for any sheep grazing that may take place on the
saltmarshes.
Therefore there is unlikely to have been a change in pattern of use post CROW and therefore
unlikely to be a significant effect on the designated interest features, wintering and breeding
birds or land management of the site from introduction of the new CROW access rights.

Faber Maunsell Access Management Report: Three Year Monitoring Surveys at Open Access Land (2006-2008) 75
6.2.4 Patterns of Use: Decoy Heath
The pattern of public use across the site is quite diffuse and not constrained to the site
boundaries. Walks were spread across much of the site but with a concentration in the southern
third (and the areas outside the site but contiguous to it). Most visitors kept to the existing
tracks and only a few walked on the heathland itself. The boggy nature of the site deters
people from going off tracks.
There was a marked difference in the proportion of dog walkers interviewed during the survey
season, with them being in the minority during the period of general dog restrictions. Levels of
use during this earlier period appears lighter than later, so it may be that dog walkers choose to
go elsewhere during the period of restrictions. However, observation data show that a large
majority of dogs are let off the lead and a small proportion of these caused disturbance to
others (although no stock or wildlife were observed to be disturbed).
The site is part of Morden Bog & Hyde Heath SSSI and Dorset Heathlands SPA. The
notification is because of the habitat (which is typical of a habitat that is now reduced to 14% of
its former area) and the rare insect and lizard species that this supports. There was a generally
high level of awareness of the open access legislation but a poor understanding of some
aspects of what this meant (for example, over half were not aware that it was legally allowed to
walk off public rights of way on access land). It is uncertain from the data whether this
translates into a greater propensity to adhere to the general restrictions which now apply.
However, it seems reasonable to conclude from the data obtained that the levels and patterns
of people are unlikely to have changed much. Therefore it is unlikely that there has been an
impact on the nature conservation features and integrity of the site resulting from the
introduction of the new rights, because of the tendency of visitors to stick to existing tracks.
Wild fires would be a concern at a site such as this but we are not aware of any heightened risk
or actual occurrence of fires during the monitoring period although there was one observation of
activities being done which carried an unspecified fire risk (ironically enough, observed near to
the Lookout Tower).
The tendency for dogs to be let off leads may be a cause for concern, too. They have already
been observed to cause disturbance to other visitors and, if roaming widely across the site –
even if their owners do stick to the tracks – there could be occurrences of wildlife disturbance.
Over half the interviewees with dogs claim to have been using the site for at least 5 years, so
this may not be a new management challenge resulting from CROW.
6.2.5 Patterns of Use: Severn Ham
Watercourses severely constrain access to the site and everyone entered it via one of two
entrances – one at the north east corner and one on the eastern boundary of the site. Walks
fanned out from these entry points and it appears that visitors carved out a circular route of one
form or another. The routes form a „figure of eight‟ with routes circling the site boundary but
linked across the centre, to one of the main entry points.
Despite the open nature and absence of obstructive vegetation, the majority of the site‟s visitors
stayed on footpaths (70% of people‟s walks were recorded as being on public rights of way); a
minority did leave the public footpaths, including some who walked towards the southern tip of
the site, and who crossed open ground between the river and the mill race, presumably to form
a small circuit.
Strolling/ambling and dog walking were the most popular activities (48% and 38% respectively
of those interviewed) and most of the dogs were not on a lead. Most visits to the site were
short (83% of visits were for <1 hour).
The high level of usage, especially the number of people with unleashed dogs, is likely to limit the land‟s use for agricultural purposes. The nature conservation interest is unlikely to suffer, although nutrient enrichment by dog faeces in the area around the site‟s most popular entry points may be an issue. However, because access rights existed (both area-wide and public rights of way) before CROW, the impact of CROW implementation on land management is likely to be negligible.

Faber Maunsell Access Management Report: Three Year Monitoring Surveys at Open Access Land (2006-2008) 76
6.2.6 Patterns of Use: The Comp
Chalk downland grazed by sheep offers an attractive surface for walkers, as vegetation does
not deter wandering off paths; it is perhaps no coincidence that 81% of walks undertaken by
interviewees were off paths and tracks. Within The Comp itself, visitors tend to stick to the
narrow strip of access land, although at least two (one dog walker, one not accompanied by a
dog) made a circular route by dropping north-eastwards off the escarpment.
There is a greater concentration of walkers around the white horse and associated viewpoint –
an easy walk out from the car park.
Usage appears to be mainly by local people.
The usage of the site by visitors could give rise to concerns about erosion (especially on
steeper parts of the site which are heavily used), disturbance to any ground-nesting birds
(especially by off-leash dogs) and the indirect effects which the public presence may have on
decisions over land management (for example, if sheep grazing is a crucial element in the site‟s
management, the public‟s presence may be an inhibition). The disturbance of livestock noted
during the first survey year is a particular cause for concern, if this sort of disturbance recurs,
although there were no other observations of disturbance.
It is not clear (from the information available) whether the public use has occurred in response
to creation of CROW access rights or whether access existed beforehand, and so it is difficult to
determine what impact its implementation is having.
6.2.7 Patterns of Use: Wisley Common Relatively few of the visitors actually visited the selected site and such use as did occur was along the public footpath. However, the pattern of use should be viewed in the context of the wider block of open access land (i.e. that which lies west of the dual carriageway), not just the part of the site selected. All those interviewed entered over the footbridge over the dual carriageway. From the entry point, a variety of routes were followed. Some of these followed public rights of way; others followed routes across open access land (mainly along the many small tracks that run through the woodland, although this is not possible to ascertain this for certain from the data available). Virtually all areas of the wider site were visited by someone.
The site is notified as a SSSI because of the habitat (which is increasingly rare in the area) and
the rare insect species that this supports. The presence of people and dogs roaming off paths
may have some implications for these nature conservation interests, and wild fires would be a
serious concern in drought conditions. However, the extent to which these possible effects
have changed post-CROW is difficult to determine without a better understanding of pre-CROW
access; information available from interviewees are indicative of a long history of access use.
6.2.8 Patterns of Use: Middleham Low Moor
The majority of those visiting the site who were interviewed follow the main axis of the site,
either along the public rights of way, the track to the north or the upper edge of the slope on the
south side (overlooking Pinker Pond). However, observations showed that visitors overall have
a high tendency to spend time off the public rights of way (97 out of 109 were seen off PROWs
in observations, particularly around Pinker Pond).
Although not previously carrying a right of area-wide public access, evidence suggests that
public use pre-dates CROW (either along public rights of way or de facto area-wide access).
For example, over 80% of interviewees said they had „always known‟ about the site; over half
the dog walkers have been visiting the site for more than 3 years, most for more than 5.
Furthermore, nearly 60% of those responding said that they either did not know or were not
sure that the area had been designated as open country, so CROW is unlikely to have
influenced their visiting patterns. In any event, the number of visitors, other than around Pinker
Pond, is limited given the size of the site.
There are a variety of different people who want to make use of the Low Moor – horse riders,
graziers, local residents and tourists. Managing access to avoid exacerbating any potential
conflicts could become a challenge if level of usage increases. However, the site appears to be

Faber Maunsell Access Management Report: Three Year Monitoring Surveys at Open Access Land (2006-2008) 77
large enough, and pattern of visitor distribution such for it not to be a significant issue at
present.
6.2.9 Patterns of Use: Waldridge Fell
This is a Country Park and well-used by locals. It is equipped with a number of car parks and
these are the starting points for most walks. A small number of visitors approached along
Waldridge Road. Routes followed by visitors fan out across almost the entire site – few parts of
it escape visitors completely.
On the whole, implementation of CROW will have had little or no impact on this site, given its
status as a country park. A possible concern, given the number of visitors, is the risk of routes
spreading and reducing the extent of the habitats for which it is valued and which merit SSSI
designation. For example, heavy use of Wanister Bog could lead to damage of wetland
habitats.
6.2.10 Patterns of Use: The Mens
The survey location is at a car park in the northern part of the site but observations are
restricted by the trees. The few visitors seen were off-PROW. Data from interviewees shows
that visitors spread throughout the site, including following routes through Hawkhurst College
(not Open Access Land). There seems little difference in the routes taken by dog walkers and
walkers not accompanied by dogs.
Given the size of the site, observed visitor levels are relatively low. Also, the type of land use
(woodland) is often able to absorb visitor pressure more easily than many other habitats, even
though it is a nature reserve. Impacts of CROW implementation on land management
depends, to a large extent, on what was the access situation beforehand. Firstly, the site
appears to have been promoted for public access. However, data from the interviewees is a
little equivocal; a lot of those interviewed were visiting for the first time yet a large majority (14
out of 19) had „always known about the site. Further, amongst the dog walkers, most had been
visiting the site for at least 3 years and many for over 5 years. Therefore, it is concluded that, in
practice, CROW access will have had negligible impact on the site and its management.
National Sample Sites
At two thirds (n=18) of the National Sample of sites the assessment of the impact of the
Introduction of CROW is of „no impact‟; that is, usage and the pattern of use is the same as it
was likely to have been before the legislation.
At almost a quarter of the sites (n=6) there is judged to be „low impact‟, and at the remaining
two sites the impact is uncertain, but probably low.

Faber Maunsell Access Management Report: Three Year Monitoring Surveys at Open Access Land (2006-2008) 78
6.3 Other Sites
For each group of sites, Tables 6.2 to 6.12 shows the assessments of the likely impacts of
CROW.
6.4 South Pennine Moors
Two locations were surveyed in the South Pennine Moors.
Table 6.2 CROW Impact Assessment South Pennine Moors
Site Name Assessment of likely impact of CROW
Key considerations in arriving at conclusion
Residual concerns
Ilkley Moor No impact Existing use, pre-CROW Most users stay on PROW in sensitive areas
None
Bingley Moor No impact Most users stay on PROW Existing linear use, pre-CROW
Dog owners allowing dogs to roam off-PROW in dog ban area
6.4.1 Ilkley Moor
Although more interviews were conducted after 31st July than before, the earlier period shows a
more diffuse pattern of use than the later usage (see Plots B and C). Whilst the heaviest usage
is in the area which abuts Ilkley, visitors who were interviewed radiated out along the northern
and north eastern edges of the site; whilst there is some trace of this pattern in the later period,
it is much less pronounced. Walkers with dogs tended to restrict their walks to the core area
adjacent to the town‟s edge (this is section 15 land and so had area-wide access pre-CROW).
A similar pattern of use was evident in the observations of use (see Plots D and E - although
the extent of observations is restricted by the local topography). Usage in the north west and
north eastern extremities is mainly along PROW, along the line of the Dales Way. One section
of non-PROW that attracts a lot of usage is a short section of track in the centre of the site that
runs east-west and links the two promoted routes. This follows a ridge line and runs just south
of High Lanshaw Dam.
In the heavily used area, evidence from both interviews and observations show that users are
much more willing to abandon PROW here than elsewhere, although the PROW still exert a
strong pull (the PROW network is fairly dense in this area).
6.4.2 Patterns of Use: Bingley Moor
Bingley Moor lies to the south of Ilkley Moor but still within the same block of Open Access
Land that comprises Rombald‟s Moor. In this part of the Moor, dogs are banned at the
landowner‟s discretion and seasonally for nature conservation reasons (1st March to 31 July)
although this ban does not apply to PROW. The moor is more gently angled and remoter from
settlements than Ilkley Moor (but Bingley and Riddlesden are close by). Paths and tracks are
sparser than on Ilkley Moor, although the site is bisected by the Dales Way Link.
Plots B and C show the pattern of use by walkers, as reported during interviews. It is
interesting to contrast the pattern of use here to that on the northern half of the moor. Here, all
those interviewed had stayed on the PROW (see Plots B and C), the two PROW running
roughly north-south. The western one is the more popular and it is probably not a coincidence
that this PROW is a promoted route (the Dales Way Link) and is accessible from a public
house, and the southern entry point has information about Open Access Land restrictions. The
easterly one is less well-used, and not used at all by people interviewed after 31st July.
Although still promoted (as the Millennium Way), it has an entry point with fewer attractions.
It follows from the above that dog walkers also stayed on the PROW and were thus not
contravening the specific restriction on bringing dogs onto the Open Access Land. The
observation data supports this view, too, as all walkers were observed as being on the PROW
(see Plots D and E). The Table below and Plot H, however, show that one walker allowed their
dog to roam (presumably off the PROW and therefore in contravention of the exclusion). It was
also observed to be disturbing other people.

Faber Maunsell Access Management Report: Three Year Monitoring Surveys at Open Access Land (2006-2008) 79
6.4.3 Implications for Access Management
The site was identified as being sensitive to public access, primarily because of its importance
for ground nesting birds (which can be disturbed by walkers and dogs, especially during the
time when the birds are prospecting for nest sites, nesting and feeding chicks). Particular
concern was shown about four parts of the site:
The area north west of Addington High Moor;
Doubler South Allotment;
South Morton Moor;
South west around Bingley Moor.
The key concern at these locations, therefore, is the extent to which CROW may have, or may
not have, led to greater disturbance of sensitive bird species to access.
The first two areas of concern can be considered to be part of the northern half of the site (Ilkley
Moor); and the last two within the southern part (Bingley Moor).
At the northern part of the site, there is a greater tendency for people to make use of their right
to wander off paths and tracks. However, the area where this occurs (i.e. close to the main
entry points near to Ilkley) was already legally available for area-wide public access pre-CROW
(section 15 land). This is the area to which walkers with dogs limit their activity, and most have
visited the site for many years. At the fringes, such as across Addingham High Moor, users
appear to stay on the PROW (the Dales Way). There was no evidence of any usage in the
vicinity of Doubler Stones Allotment. At the north eastern part of the site, usage was also along
PROW, with the exception of the link referred to above. Plot B shows this to be within a part of
the SSSI with sensitive features but the areas crossed by this link route was not listed as an
area of concern; However, this may be because heavy usage of the link was not predicted.
Even so, users tend not to wander off the track and the link lies in an area that was accessible
pre-CROW. It seems that the implementation of CROW has not led to significant usage by the
public of sensitive areas of Ilkley Moor.
On the southern part (Bingley Moor), there was no right of public access pre-CRoW, except
along the PROW. All the users interviewed and/or observed were concentrated into the south
western part of the site and none of those interviewed made use of South Morton Moor.
However, people who use the site still limit their use to the PROW, including dog walkers,
despite having the right to wander at will (except dog walkers, due to the restrictions). As was
noted earlier, a large majority of the walkers with dogs have been using the site for several
years. The most significant reasons given for not leaving the PROW is that it was easier and
safer. Others stated that the PROW took the user where they wanted to go, so there was no
reason to leave it.
Given the above observations, it appears that CROW implementation is unlikely to have
brought about any additional adverse impacts on nature conservation interests at this site.
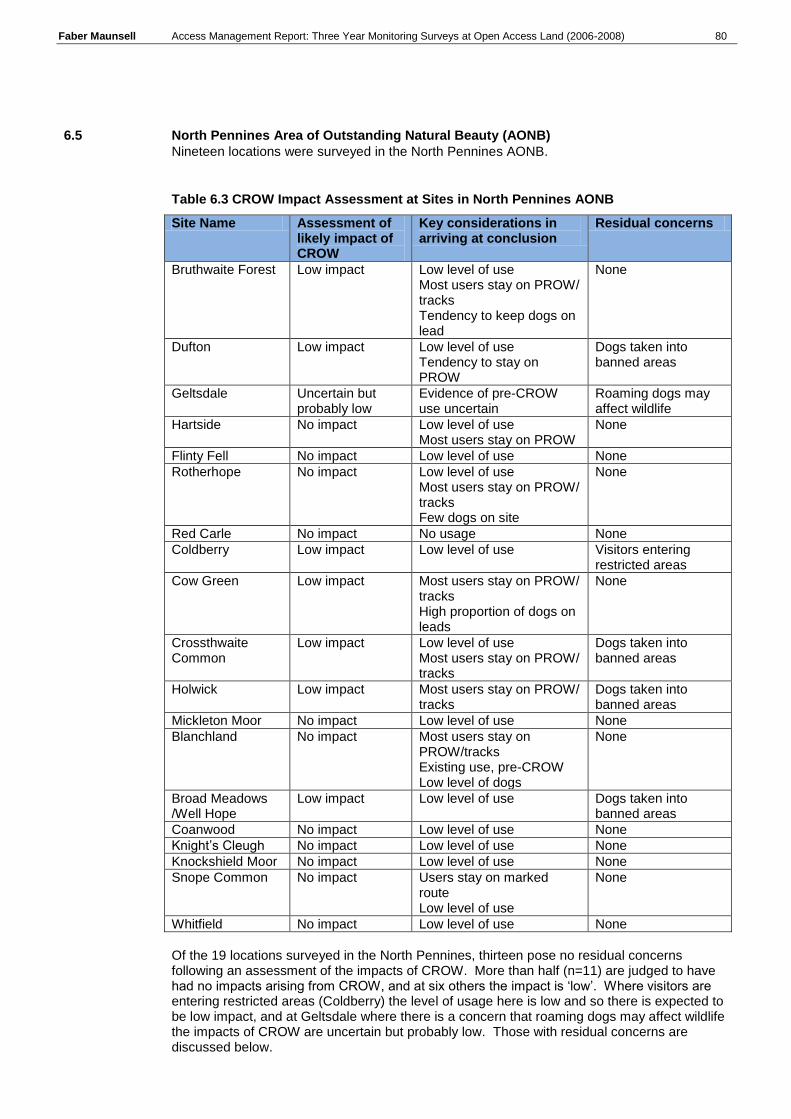
Faber Maunsell Access Management Report: Three Year Monitoring Surveys at Open Access Land (2006-2008) 80
6.5 North Pennines Area of Outstanding Natural Beauty (AONB)
Nineteen locations were surveyed in the North Pennines AONB.
Table 6.3 CROW Impact Assessment at Sites in North Pennines AONB
Site Name Assessment of likely impact of CROW
Key considerations in arriving at conclusion
Residual concerns
Bruthwaite Forest Low impact Low level of use Most users stay on PROW/ tracks Tendency to keep dogs on lead
None
Dufton Low impact Low level of use Tendency to stay on PROW
Dogs taken into banned areas
Geltsdale Uncertain but probably low
Evidence of pre-CROW use uncertain
Roaming dogs may affect wildlife
Hartside No impact Low level of use Most users stay on PROW
None
Flinty Fell No impact Low level of use None
Rotherhope No impact Low level of use Most users stay on PROW/ tracks Few dogs on site
None
Red Carle No impact No usage None
Coldberry Low impact Low level of use Visitors entering restricted areas
Cow Green Low impact Most users stay on PROW/ tracks High proportion of dogs on leads
None
Crossthwaite Common
Low impact Low level of use Most users stay on PROW/ tracks
Dogs taken into banned areas
Holwick Low impact Most users stay on PROW/ tracks
Dogs taken into banned areas
Mickleton Moor No impact Low level of use None
Blanchland No impact Most users stay on PROW/tracks Existing use, pre-CROW Low level of dogs
None
Broad Meadows /Well Hope
Low impact Low level of use Dogs taken into banned areas
Coanwood No impact Low level of use None
Knight‟s Cleugh No impact Low level of use None
Knockshield Moor No impact Low level of use None
Snope Common No impact Users stay on marked route Low level of use
None
Whitfield No impact Low level of use None
Of the 19 locations surveyed in the North Pennines, thirteen pose no residual concerns following an assessment of the impacts of CROW. More than half (n=11) are judged to have had no impacts arising from CROW, and at six others the impact is „low‟. Where visitors are entering restricted areas (Coldberry) the level of usage here is low and so there is expected to be low impact, and at Geltsdale where there is a concern that roaming dogs may affect wildlife the impacts of CROW are uncertain but probably low. Those with residual concerns are discussed below.

Faber Maunsell Access Management Report: Three Year Monitoring Surveys at Open Access Land (2006-2008) 81
6.5.1 Patterns of Use: Dufton
As with some of the other sites in the North Pennines, there are relatively few records of
people‟s walks to give confidence in describing patterns of use. Based on the data obtained
(both through interviews and observations), it is evident that most walkers stay on the PROW –
particularly the Pennine Way. However, one interviewee with a dog had walked a considerable
distance over Open Access Land where dogs were not allowed (whether on lead or off lead).
A number of visitors were observed to be engaged in „other activities‟ (although the activity is
not recorded), one of them off PROW.
6.5.2 Implications for Access Management
The relatively small number of visitors, assuming this to be representative, over such a large
area is unlikely to have significant impacts on site management, especially as the majority stay
on PROW. There is some cause for concern over the disregarding of the dog ban by at least
one dog walker, and this may have implications for enforcement of this restriction.
6.5.1 Patterns of Use: Geltsdale
Interviewees reported a wide variety of different routes followed. Routes used were all in the
valley or on its east side – no interviewees had ventured onto Castle Carrick Fell although some
had followed the road along its base. The majority of usage was in the hills and valleys west of
Castle Carrock – Talkin Fell, Kelty Fell, Simmerson Hill – much of this usage being on PROW
but also onto Open Access Land across hillsides.
Those venturing further afield included trips southwards along the breast of the slopes leading
to King‟s Forest of Geltsdale (much of this use was on PROW), some going as far as Lord‟s
Seat and Middle top, and onto Cold Fell and the Tindale Fells. Other groups walked north
eastwards towards Tindale Tarn (see Bruthwaite Forest report).
Observations made at the site showed that the vast majority of people visiting the site were
staying on public highways (either roads, PROW or UCRs). This was true of both people with
or without dogs and whether the walk was within or outside of the period of general dog
restrictions. Only one group was observed off highways and they were on a track.
When passing through sensitive areas, people generally stayed on PROW. The only exception was in the group that visited the summit of Cold Fell, which cannot be accessed on PROW.
6.5.2 Implications for Access Management
Compared to many Local Monitoring sites in the North Pennines, this is well-used and visitors
make much use of their right to walk on Open Access Land, as well as using PROW. It is not
possible to determine to what extent this pattern of behaviour is as a result of CROW
implementation or was already well-established before then on existing tracks. However, the
number of people going off-PROW, penetrating deep into the hills, and some of them with dogs,
may have implications for site management – both for nature conservation and for grouse
management. However, the numbers are not large, given the size of the site and so impacts
are expected to be low.
6.5.3 Patterns of Use: Coldberry
The few recordings of where visitors to Coldberry walked during their visit show that a number
of the visitors walked across the excluded areas. Although some of the walks were on PROW
(and so unaffected by restrictions on Open Access Land), many spent at least part of their visit
on land over which their right of access had been excluded. Many were attracted to the
Hudeshope Beck for picnics and „other activities‟, where much of the walking activity was also
concentrated – in amongst the spoil heaps and old workings.
Other than that, the only other routes taken by interviewees were through the hush (Coldberry
Gutter) (which restrictions do not debar), across Coldberry Moss and on Hardberry Hill, where
the triangulation point may act as an attractor.
6.5.4 Implications for Access Management
The relatively small number of visitors, assuming this to be representative, over such a large
area is unlikely to have significant impacts on site management. There is cause for concern
over the disregarding of the restrictions on public access by a number of visitors, and this may
have implications for enforcement, with a number of circular routes developing, and for
achieving the objectives for site management.

Faber Maunsell Access Management Report: Three Year Monitoring Surveys at Open Access Land (2006-2008) 82
6.5.5 Patterns of Use: Crossthwaite Common
Use of the site itself is confined to the PROW (note that the route shown by several
interviewees has them following a line that runs alongside the PROW and it is likely that their
route actually followed the PROW). However, there was more variation in where people went
when not crossing the site. Many followed the Pennine Way for the short distance to Middleton
or southwards towards Thringarth. A minority of walkers took alternatives – one group heading
up the Tees Valley, and others taking tracks or PROW north westwards and north towards
Holwick. All interviewees showed their route to be on a track (Rake Gill) or PROW. One of the
groups who used a track across Crossthwaite Common had a dog with them, even though this
is an area from which dogs are excluded. Observations were comparatively limited but the
evidence available supports the assertion about the tendency to stay on linear routes.
6.5.6 Implications for Access Management
The comparatively low level of use and the strong tendency to stay on PROW suggest that the
implementation of CROW will have caused little change to patterns of use by the public.
Consequently, there will have been low impact on land management and nature conservation
interests.
6.5.7 Patterns of Use: Holwick
Most of the visitors to Holwick appeared to be involved in a relatively long walk, choosing from a
variety of possibilities which has resulted in no particular concentration of walks in any one
area. However, although walks were widely spread, there was a tendency for greater activity
along the Tees Valley, following the Pennine Way and routes on the eastern side of the valley.
Other routes took the walker south onto the Crossthwaite Common area (see site reports).
Much of this activity was along PROW.
Groups with dogs seem to follow similar routes to those without dogs and patterns of use do not
appear to alter whether the general dog restrictions are in force or not. However, one group
with a dog was observed on an area of Open Access Land from which people with dogs were
excluded.
During the survey period, no-one was seen rock climbing, so it is not possible to comment on
whether the voluntary restriction agreement is being honoured.
6.5.8 Implications for Access Management
The strong tendency for users to stay on PROW means that changes of use following the
implementation of CROW are likely to be low. As a consequence, the effects on black grouse
populations are likely to be low. In general, it seems that there is little to suggest that the
voluntarily restricted climbing routes agreed with the BMC for safeguarding the ledge/rock flora
interests at this location are not working. However, there were no rock climbers during the
surveys and only 10 dogs (half of which were on leads), so it is difficult to draw firm
conclusions.
6.5.9 Patterns of Use: Broad Meadows
There is insufficient data to make any meaningful observations about patterns of use.
6.5.10 Implications for Access Management
It is dangerous to draw too many conclusions from one interview. It seems reasonable to
conclude that use of the site is light and this, in itself, means that implications for site
management are likely to be low. It is pertinent to note that the one person interviewed was
dog walking in an area from which dogs were banned, suggesting that there would be some
concern over the enforcement of the dog ban.

Faber Maunsell Access Management Report: Three Year Monitoring Surveys at Open Access Land (2006-2008) 83
6.6 Bowland Fell
Four locations were surveyed within the Bowland Fells site.
Table 6.4 CROW Impact Assessment at Bowland Fell
Site Name Assessment of likely impact of CROW
Key considerations in arriving at conclusion
Residual concerns
Jubilee Tower Little impact Existing use, pre-CROW Effectiveness of shooting restrictions
Langden Brook Little impact Most users stay on PROW/ targeted desire lines
Need for on-going visitor management
Parlick No impact Existing use, pre-CROW Users appear to stay on PROW
Roaming dogs may affect sheep
Whitendale No impact Existing use, pre-CROW Users appear to stay on PROW Low level of use
None
Of the four sites surveyed in the Bowland Fells, although CROW was judged to have little or no impact there are nonetheless residual concerns at three sites.
6.6.1 Patterns of Use: Jubilee Tower
The largest number of visitors were observed in the car park adjacent to Jubilee Tower (and
roadside verges) and many of these did not venture onto the Open Access Land. For those
who did venture beyond the confines of the car park, the most commonly followed route was
north easterly up the hillside, following the line of the fence on its left (where there is a faint
track). No people were observed to be accompanied by dogs; dogs are banned from this area.
Results from interviewees confirm the popularity of the route alongside the fence as a means of
cresting the broad ridge that runs approximately east-west between Clougha and Ward Stone.
On reaching this, many walkers turned either left or right along the ridge, returning to the car
park by a variety of routes (down through Tarnbrook in the east and via Clougha in the west).
Other groups of walkers picked their way along the network of PROW below Jubilee Tower to
make a circular route that may or may not include crossing some of the Open Access Land.
Very few dogs were taken onto the Open Access Land. Only one interviewee was recorded to
have taken a dog onto the main ridge and they did so following a narrow corridor of land that is
covered by an access agreement and so not affected by CROW restrictions. The only other
activity considered inappropriate was a group of walkers ignoring temporary closures for game
shooting.
6.6.2 Implications for Access Management
Based on the surveys, there is something of an issue to be resolved about the implementation
and enforcement of restrictions during shooting days (although the dog restrictions appear to be
working). Otherwise, the tendency of visitors to stick to a small number of reasonably well-
defined routes (mostly on land which had access prior to CROW) means that impact on land
management and nature conservation interests of CROW is low.
6.6.3 Patterns of Use: Langden Brook
Observations show that all observed visitors were seen to be following the PROW up and down
the valley. However, when considering the observation data at this site, it is important to note
that sightlines are quite limited other than up the valley. Nonetheless, the flanking hillsides are
steep and clad in high bracken and heather, so are not likely to induce people away from the
path (and nearly half the respondents who stayed wholly on PROW gave “Easier to walk on” as
their reason for not leaving the PROW). Interviews, though, reveal more about where people
walk whilst beyond the confines of the deeply-incised valley. This confirms the popularity of the

Faber Maunsell Access Management Report: Three Year Monitoring Surveys at Open Access Land (2006-2008) 84
valley route but also shows a significant number of people venturing on to the surrounding high
ridges.
The most commonly followed route takes the walker to Langden Castle. For those going
beyond the Castle, routes taken mainly go south between Bleadale Nab and Sykes Fell,
towards the Cairn at the head of Bleadale Water. By trending east to the shooting lodge on
Hareden Fell, it is possible to return via Hareden Brook. Other routes followed continue up
Langden Brook beyond the Castle, and further south beyond the cairn at the head of Bleadale
Water to exit the area near Parlick, or continuing further west and exiting the area at
Hazelhurst. During the period of general dog restrictions, one group reported that they had
taken a route north over Grieve Clough and a group with a dog ventured into the pathless area
around Within Clough.
6.6.4 Implications for Access Management
On the whole, the pattern of behaviour suggests that the measures used to channel visitors
along pre-determined and preferred desire lines is having some success, with very few walkers
straying outside the line of a small number of routes. Indeed, the majority stick to the line of the
PROW for much of their route through the Langden Valley. As a result, impacts on land
management and nature conservation interests are likely to be low. There appears to be some
need for on-going visitor management to ensure that the small number of visitors who leave the
PROW, especially those with dogs, do not cause unacceptable disturbance to ground nesting
birds.
6.6.5 Patterns of Use: Parlick
The ridge formed by Parlick, Blindhurst Fell and Fair Snape Fell form the central core of many
people‟s walking routes, with circular routes formed by turning left or right at Fair Snape. The
left hand (westerly) route drops off the Open Access Land and returns via PROWs; the right
hand (easterly) route continues over Wolf Fell and Saddle Fell before dropping down to the
lower ground and back along PROW. This means that footfall on the open moorland is
restricted to very few routes. There are some walkers who do not conform to this general
pattern, dog walkers amongst them. For example, one group continued north to Fiensdale
Head, another (with dog) continued around Brown Berry Plain and another (also with dog)
confined their activities to the eastern slopes of Parlick.
Observations tend to support the data gleaned from interviewees, although the tendency is for
observed walkers to be more tightly clustered along the PROW and the slopes of Parlick. All
observed dog walkers were on PROW.
6.6.6 Implications for Access Management
Much of this area carried public access rights pre-CROW (through a combination of access
agreements, an access order and PROW) and it is likely there has been little change post
CROW implementation. Access rights around Parlick itself are new, however evidence
suggests that the freedom of access existed pre-CROW, even if not the right. Therefore,
although the free-roaming dogs may have implications for sheep grazing, the long-standing
pattern of public use of the site for access prior to CROW suggests that CROW implementation
has had no significant effect on land management.

Faber Maunsell Access Management Report: Three Year Monitoring Surveys at Open Access Land (2006-2008) 85
6.7 Sunbiggin Tarn
Table 6.5 CROW Impact Assessment at Sunbiggin Tarn
Site Name Assessment of likely impact of CROW
Key considerations in arriving at conclusion
Residual concerns
Sunbiggin Tarn Low impact Most users stay on PROW/promoted route Most users stay on PROW in sensitive areas
Continue promotion of current C2C route Dog walkers in sensitive areas
6.7.1 Patterns of Use: Sunbiggin Tarn
The site receives many visitors although due to its size there are still many areas that are
relatively ill-frequented. A key feature of the pattern of use is the heavy traffic which flows along
the route of the Coast to Coast path, including its variants in this vicinity. This bias increases in
the eastern part of the site as it is likely that only walkers of the Coast to Coast route will be
captured by a survey undertaken around Sunbiggin Tarn area. Visitor patterns in the western
part of the site show rather greater variability although even here, the Coast to Coast route is
the most prominent line followed.
North of this line lies the main concentration of limestone pavement, also the site of the NNR,
on Great Asby Scar. Visitor patterns here are very sparse, with only a few routes being
followed (several of them PROW). Dog walkers are relatively infrequent in this part of the site.
In contrast, Little Asby Scar is more popular amongst dog walkers (including during the period
when dogs should be kept on leads), who seem to wander here at will, as there are no PROW
to follow.
Looking specifically at the sensitive features identified in the access assessment, it does seem
that the route to the west and south of Sunbiggin Tarn is now being used reasonably heavily by
Coast to Coast users. The passage across Ewefell Mire appears to be limited to the edges of
the block, with no-one crossing the Mire itself. It is not possible, with the information available,
whether the other sensitive features have been protected from trampling. However, if these are
primarily in the limestone pavement areas, then Great Asby Scar seems to be exposed to little
risk, whereas Little Asby Scar may be exposed to more significant risk of damage, although in
both cases, usage of these areas is not heavy.
6.7.2 Implications for Access Management The Coast to Coast route has long been popular and so the traffic it carries is not a function of CROW. However, it does seem that the change in the marked route on Harveys Map has prompted a re-direction of route followers, showing that those following set routes are responsive to changes. The new route is also shown on on-site signage (maps of Open Access Land in the area – see photo alongside) and this will add further encouragement to stay on the preferred route. Given that this new route was devised to protect sensitive features elsewhere, it appears to have had some success.
Elsewhere, it is clear that other routes are followed which lead off PROW and onto the Open Access Land, some of which may be sensitive to trampling. However, the usage of such areas is not heavy and so any damage that does occur is likely to be limited. Further, much of this access appears to have existed pre-CROW.
It is concluded, therefore, that the implementation of CROW is likely to be having little adverse effect on the management of the land at Sunbiggin Tarn, given that the alternative route remains as the one promoted in literature about the Coast to Coast path.

Faber Maunsell Access Management Report: Three Year Monitoring Surveys at Open Access Land (2006-2008) 86
6.8 Dorset Heaths
Fourteen sites were surveyed in the Dorset Heaths SPA.
Table 6.6 CROW Impact Assessment at Dorset Heaths
Site Name Assessment of likely impact of CROW
Key considerations in arriving at conclusion
Residual concerns
Canford Heath Little impact Existing use, pre-CROW Roaming dogs may affect wildlife and other users Nutrient enrichment around entry points Stock keeping not feasible
Arne/Coombe Heath
Uncertain but probably minimal
Low level of use by dog walkers Most users stay on tracks
None
Avon Heath No impact Existing use, pre-CROW Nutrient enrichment
Dewlands Common
Uncertain but probably minimal
Evidence of existing use, pre-CROW
Dogs inhibiting maintenance of grazing
Ferndown Uncertain but probably minimal
Evidence of pre-CROW use unclear but suggests well-established use
Dogs inhibiting re-introduction of grazing
Great Ovens Uncertain but possibly some exacerbation of existing problems
1/3rd
of dog walkers coming to site for under 5 years High level of awareness that site is Open Access Land
Nutrient enrichment Dogs inhibiting re-introduction of grazing
Lions Hill No impact Existing use, pre-CROW Low level of use
Roaming dogs may affect wildlife
Lytchetts No impact Existing use, pre-CROW Urban influences may inhibit introduction of appropriate management
Parley No impact Evidence of existing use, pre-CROW
Urban influences may inhibit introduction of appropriate management
Stoborough Heath Uncertain but probably minimal
Low level of use Evidence of existing use, pre-CROW Most users stay on tracks
Roaming dogs may affect wildlife
Town Common Little impact Existing use, pre-CROW Dogs inhibiting re-introduction of grazing
Turbary Common No impact Existing use, pre-CROW Urban influences may inhibit introduction of appropriate management
Upton Heath No impact Existing use, pre-CROW Illegal activities Roaming dogs may affect wildlife
Winfrith Heath No impact Evidence of existing use, pre-CROW
Roaming dogs may affect wildlife and ability to apply appropriate management

Faber Maunsell Access Management Report: Three Year Monitoring Surveys at Open Access Land (2006-2008) 87
Note that the National Sample Site of Decoy Heath borders the site of Great Ovens to the North. Of the fourteen areas surveyed in the Dorset Heathlands (including Canford Heath), only one is judged to have no residual concerns arising from public access, even though CROW legislation has had little impact on the degree of public access and patterns of use. This is largely because of existing use, pre-CROW.
6.8.1 Patterns of Use: Canford Heath
When routes used by interviewees are mapped, it is revealed that virtually every part of the site
is visited and that the pattern is quite uniformly dispersed, although there is a tendency for a
few routes across the centre and west of the site to receive heavier volumes of visitors. Also,
walks tend to fan out from a number of key entry points – opposite the cemetery at the west,
from the northeast (by Eastlands Farm) and to a lesser extent from the southeast (and across
the golf course). Most of the observed behaviour of dogs being off-lead and roaming is focused
near to the entry points, although this may be more a function of the observation method than a
bias in behaviour patterns. However, it would correspond with dog walkers taking their dogs
out for what is perhaps just a „toilet stop‟.
6.8.2 Implications for Access Management
The level of use, high proportion of people with dogs (and with many dogs off-lead) and the
fact that all parts of the site are used by the public suggest that this could have a major
impact on land management and nature conservation at the site (in particular ground nesting
birds) and nutrient enrichment near the heavily used site entry points due to dog faeces.
However, public access to the site has a long history and it is doubtful if the site‟s Open
Access Land designation has affected usage significantly given that relatively few people are
aware of the open access designation.
Therefore it is likely that there has been only a minimal change in levels and patterns of use
and that there has not been an adverse significant impact of the sensitive biodiversity
features of the site from the introduction of CROW.
This does not mean that there are not existing concerns from long standing access to the
site, which have already been mentioned. This site also has fire concerns related to access
issues.
6.8.3 Patterns of Use: Arne/Coombe Heath
There seems to be something of a „standard‟ route which visitors to Arne follow: entering the
site from the car park/picnic area at the centre, visitors follow the track southwards towards the
Met Station, do a loop around Coombe Heath and then return to the car park, staying to the
track throughout. There were only two exceptions to this pattern, both involving a slightly
different loop around the Heath; one of these variants was on tracks and only one interviewee
left the tracks. None of the interviewed or observed visitors ventured onto contiguous areas of
Open Access Land – Arne Hill and Grip Heath.
6.8.4 Implications for Access Management
The low level of walkers with dogs and the high propensity for people to stay on tracks means
that impacts of CROW implementation on the sensitive biodiversity features, in particular
ground nesting birds, is likely to be low. Further, it is likely that there has not been a significant
change in access use – indications are that public access to this site is well-established. Two
out of the 3 dog walkers were observed to keep their dog on a lead providing some evidence to
suggest that the general dog restrictions are being observed.
6.8.5 Patterns of Use: Avon Heath At David‟s Hill, visitors stayed almost exclusively on existing tracks and the bridleway, and most of the tracks received some visitors. The only areas where people appeared to stray from the tracks is near the Visitor Centre in the south west corner of the site.
At Boundary Lane/Country Park, similar comments apply – all the site receives visitors but access is mostly along existing tracks. In this case, the exception to the „stay on track‟ rule is in
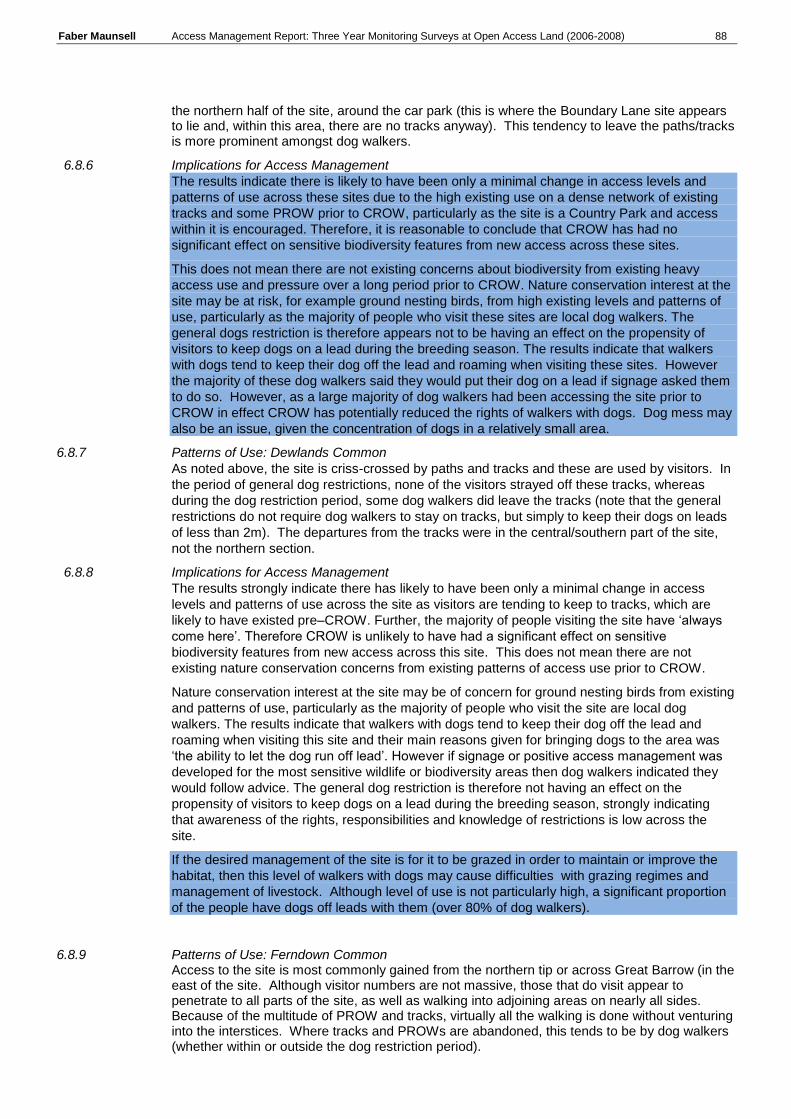
Faber Maunsell Access Management Report: Three Year Monitoring Surveys at Open Access Land (2006-2008) 88
the northern half of the site, around the car park (this is where the Boundary Lane site appears to lie and, within this area, there are no tracks anyway). This tendency to leave the paths/tracks is more prominent amongst dog walkers.
6.8.6 Implications for Access Management
The results indicate there is likely to have been only a minimal change in access levels and
patterns of use across these sites due to the high existing use on a dense network of existing
tracks and some PROW prior to CROW, particularly as the site is a Country Park and access
within it is encouraged. Therefore, it is reasonable to conclude that CROW has had no
significant effect on sensitive biodiversity features from new access across these sites.
This does not mean there are not existing concerns about biodiversity from existing heavy
access use and pressure over a long period prior to CROW. Nature conservation interest at the
site may be at risk, for example ground nesting birds, from high existing levels and patterns of
use, particularly as the majority of people who visit these sites are local dog walkers. The
general dogs restriction is therefore appears not to be having an effect on the propensity of
visitors to keep dogs on a lead during the breeding season. The results indicate that walkers
with dogs tend to keep their dog off the lead and roaming when visiting these sites. However
the majority of these dog walkers said they would put their dog on a lead if signage asked them
to do so. However, as a large majority of dog walkers had been accessing the site prior to
CROW in effect CROW has potentially reduced the rights of walkers with dogs. Dog mess may
also be an issue, given the concentration of dogs in a relatively small area.
6.8.7 Patterns of Use: Dewlands Common
As noted above, the site is criss-crossed by paths and tracks and these are used by visitors. In
the period of general dog restrictions, none of the visitors strayed off these tracks, whereas
during the dog restriction period, some dog walkers did leave the tracks (note that the general
restrictions do not require dog walkers to stay on tracks, but simply to keep their dogs on leads
of less than 2m). The departures from the tracks were in the central/southern part of the site,
not the northern section.
6.8.8 Implications for Access Management
The results strongly indicate there has likely to have been only a minimal change in access
levels and patterns of use across the site as visitors are tending to keep to tracks, which are
likely to have existed pre–CROW. Further, the majority of people visiting the site have „always
come here‟. Therefore CROW is unlikely to have had a significant effect on sensitive
biodiversity features from new access across this site. This does not mean there are not
existing nature conservation concerns from existing patterns of access use prior to CROW.
Nature conservation interest at the site may be of concern for ground nesting birds from existing
and patterns of use, particularly as the majority of people who visit the site are local dog
walkers. The results indicate that walkers with dogs tend to keep their dog off the lead and
roaming when visiting this site and their main reasons given for bringing dogs to the area was
„the ability to let the dog run off lead‟. However if signage or positive access management was
developed for the most sensitive wildlife or biodiversity areas then dog walkers indicated they
would follow advice. The general dog restriction is therefore not having an effect on the
propensity of visitors to keep dogs on a lead during the breeding season, strongly indicating
that awareness of the rights, responsibilities and knowledge of restrictions is low across the
site.
If the desired management of the site is for it to be grazed in order to maintain or improve the
habitat, then this level of walkers with dogs may cause difficulties with grazing regimes and
management of livestock. Although level of use is not particularly high, a significant proportion
of the people have dogs off leads with them (over 80% of dog walkers).
6.8.9 Patterns of Use: Ferndown Common Access to the site is most commonly gained from the northern tip or across Great Barrow (in the east of the site. Although visitor numbers are not massive, those that do visit appear to penetrate to all parts of the site, as well as walking into adjoining areas on nearly all sides. Because of the multitude of PROW and tracks, virtually all the walking is done without venturing into the interstices. Where tracks and PROWs are abandoned, this tends to be by dog walkers (whether within or outside the dog restriction period).

Faber Maunsell Access Management Report: Three Year Monitoring Surveys at Open Access Land (2006-2008) 89
6.8.10 Implications for Access Management
Like many of the sites in the Dorset Heaths, this is a „local‟ site popular with dog walkers and
vulnerable to a range of impacts associated with the urban fringe. Consequently, public
access is a major factor in site management and may inhibit the introduction of some
management measures that would improve its condition (e.g. stock grazing). However, the
evidence suggests that none of these difficulties can be attributed to the implementation of
CROW, because of the pre-existing situation that probably obtained here.
6.8.11 Patterns of Use: Great Ovens
Most visitors confine themselves to the boundaries of the site but a small proportion enter the
woodland area to the north, either on public footpaths or along tracks through the woods. A
couple of groups (one with a dog outside the dog restriction period and one without a dog within
the dog restriction periods) crossed over to the Decoy Heath site and followed tracks there.
6.8.12 Implications for Access Management
It appears that this is a popular site amongst nearby residents for dog walking, an activity
conducted regularly and frequently throughout the year. The presence of people and their
unleashed dogs could have implications for ground-nesting birds and may present a challenge
for managing the grazing regime for maintaining habitat conditions. Nutrient enrichment by dog
faeces may be evident around the south eastern boundary of the site. Although, two thirds of
dog walkers have been bringing their dog onto the site for at least 5 years a third have started
bringing their dog here since CROW was implemented. This suggests that there may have
been an increase in new visitors to the site. If so, the existing concerns about the impact of
people and their dogs may have been exacerbated.
6.8.13 Patterns of Use: Lions Hill It is interesting to note that the southern two thirds of the site, south of the PROW which crosses the site, received no visitors. All activity was concentrated in the northern third. Entry to the site was primarily from along the PROW, entering from the east. Although many walkers followed the PROW and the tracks, many left these to walk across the areas in-between. With the exception of one group not accompanied by a dog, all those straying off PROW and tracks had dogs with them.
6.8.14 Implications for Access Management
Usage of this site appears relatively light, given the close proximity of major urban areas. If it is
representative of site usage, impacts of public access in the southern part of the site will be
minimal. In the northern part, the tendency of dog walkers to stray off PROW and tracks, and to
let their dogs run freely, may pose a concern for wildlife at the site. However, there appears to
be a long history of public access to the site, with many dog walkers having brought their dogs
here for more than 5 years and many visitors (the vast majority of them living locally) claim to
have always known about the site. Consequently, it is concluded that CROW implementation
has not had a significant effect on biodiversity features of the site as there is likely to have been
no significant change in access use.
6.8.15 Pattern of Use: Lytchetts
This is a small site of simple shape (rectangular) and patterns of use are correspondingly
straightforward. Visitors enter the site from the eastern boundary, walk around the site and
then exit (probably by the same point). None of those interviewed went outside the boundaries
of the site but visits were made to all parts of it.
6.8.16 Implications for Access Management
It is likely that this site has been open to the public for many years on a de facto basis, and
CROW designation is likely to have had no effect on usage or site management.
6.8.17 Pattern of Use: Parley
Although interviewees‟ entry to the site was through only two points, walks took them to all parts
of the site. Although tracks and PROW were used, there was also a high tendency for people
to stray off these into the areas in-between. This tendency was more pronounced amongst dog
walkers. It can be reasonably inferred from the observation data that around three quarters of

Faber Maunsell Access Management Report: Three Year Monitoring Surveys at Open Access Land (2006-2008) 90
these dogs were off-lead, despite interviews being undertaken within the period of general dog
restrictions (when dogs are meant to be kept on a lead of 2m or less).
6.8.18 Implications for Access Management
It is clear that the presence of people living nearby and using this site for recreation has led to a
decline in its condition through neglect and lack of management. Grazing appears to be one
way of restoring the condition but is likely to be difficult under current circumstances. CROW‟s
implementation is unlikely to have changed the pattern of public access at the site (there is
evidence to suggest that this site has been viewed by many of its visitors as an open access
area for years before CROW); however, it may add complications to the introduction of
measures needed to restore the site.
6.8.19 Patterns of Use: Stoborough Heath There is a strong tendency at this site for visitors to stay on PROW or tracks on the western half of the site. No-one was seen, or was interviewed, who was going/had been on the eastern part (Stoborough Green). The public footpath that bisects the western half of the site was the most travelled, as observed and reported by interviewees, although the track that runs approximately northwest-southeast was also well-used.
The only people to have left the PROW and tracks were dog walkers. Their routes enter into all
parts of the site apart from the southern section near Creech Bottom.
6.8.20 Implications for Access Management
The data are not conclusive about the pre-CROW access situation but the tendency for visitors
to stay on PROW and tracks means that any adverse affects attributable to CROW on
biodiversity concerns across the site is likely to be low.
6.8.21 Patterns of Use: Town Common Access to the site is usually gained from points along the south western boundary, where it abuts residential areas. Most of the walking activity is concentrated in the portion of the site close to the urban fringe. This is an area with many tracks and features of historic interest (tumuli, enclosures) as well as more modern infrastructure.
Some walkers went beyond the fringe of the town, but stayed mainly to tracks. None of the interviewees ventured across or even onto the dismantled railway.
The pattern of use does not appear to differ markedly whether dog restrictions are in force or not (although these only apply to non-s15 land).
6.8.22 Implications for Access Management
Given that the majority of the site had area-wide access prior to CROW implementation, and
that the earlier access regime takes primacy over CROW, there is unlikely to have been any
change in access use to that part of the site. On the remaining parts, and as with many of the
other urban fringe sites amongst the Dorset Heaths, pre-CROW access was probably
prevalent, meaning that (as with the rest of the site) little has changed.
6.8.23 Patterns of Use: Turbary Common This relatively small site, surrounded by urban developments, is entered at many points by visitors. Walks take the visitors to all parts of the site, with particular concentration in the central part and relatively quieter areas in the east.
6.8.24 Implications for Access Management
As this is essentially an urban open space with a well-established tradition of public access,
albeit part of it a SSSI, designation as Open Access Land can have had only a negligible effect
on the sensitive biodiversity features and the site‟s management.
This does not mean there are not existing access concerns originating prior to CROW
implementation, as it is a heavily used site and used by dog walkers with a propensity to let
their dog off the lead. This level of use could affect the introduction of grazing needed to
maintain the site‟s biodiversity interest.
6.8.25 Patterns of Use: Upton Heath This is clearly a very busy site, with many visitors interviewed and observed. There are many points of entry used, from all sides of the site, although the most popular ones are from the north (from Hill View and Corfe Mullen) and from the west (from the adjoining area of Beacon Heath).

Faber Maunsell Access Management Report: Three Year Monitoring Surveys at Open Access Land (2006-2008) 91
All parts of the site experience some visits but there does appear to be a pattern of walks (which do not vary with the general dog restrictions). Heavy usage is found:
Along the dismantled railway;
In the neck of land at the north of the site, near the car park;
In the south west corner, adjacent to the disused pits;
A circular route around the heart of the site; and
Various paths which link the above features.
Some walkers vary from these standard alignments, mainly walkers with dogs.
6.8.26 Implications for Access Management
This appears to be a site with particularly challenging management problems, originating from
the public‟s presence – level of use, high number of off-lead dogs, illegal activities. The extent
to which these factors arise from CROW is likely to be negligible, given that many of the visitors
are unaware of Open Access, most dog walkers had been visiting the site for more than 5 years
and it is reasonable to suppose that perpetrators of illegal activities do not care. Therefore it is
likely that there has been only a minimal change in levels and patterns of use and that there
has not been an adverse significant impact of the sensitive biodiversity features of the site from
the introduction of CROW.
This does not mean that there are not existing concerns from long standing access to the site,
which have already been mentioned.
6.8.27 Patterns of Use: Winfrith Heath Interviewees typically entered the site from locations off the minor road that forms the eastern boundary to the site. From the points in the south, walkers tend to funnel themselves along the track that runs north-north-west. The northern part of the site contains a dense network of small tracks and visitors make heavy use of these, as well as parts in-between. Both dog walkers and those without dogs demonstrate this behaviour. A number of walkers follow lines running parallel to the minor road, although there is nothing on the OS base map to suggest there are tracks to follow. Observation data supports the interview data.
No interviewees visited the southern part of the site (to east and west of Blacknoll). A few groups extended their walk beyond the site‟s confines in the north west, around Tadnoll.
6.8.28 Implications for Access Management
As with many of the Dorset Heathland sites, Winfrith Heath is used heavily by local dog walkers
and the presence of dogs may pose a risk to the nature conservation value of the site, either
directly through disturbance or indirectly due to the adverse effect that this has on decisions
about appropriate site management (e.g. whether to graze with livestock or not). However, the
evidence also suggests that this has been the situation here since before CROW and that the
new access legislation has not altered this significantly.
The risk of erosion caused by horse riders is noted in the SSSI condition assessment but
CROW does not confer any right to ride a horse or cycle on Open Access Land, so its
implementation cannot be attributed as the cause.
6.8.29 Dorset Heaths - Summary From the analysis of the Dorset Heath sites, the following conclusions can be drawn:
The majority of sites have been heavily used by visitors prior to the implementation of
CROW. The principal user group is local dog walkers, due to their very close proximity to
conurbations, who in the main have been visiting for more than 5 years.
The long history of access means that it is likely that there has not been a significant change
in access levels and patterns of use across the Dorset Heaths monitoring sites as a result of
CROW implementation. Therefore it is likely there has not been a significant adverse impact
on the integrity of these sites and on the features for which they are designated from the
implementation of CROW.
This does not mean there has not been existing long term concerns and issues from existing
high levels and patterns of access use. The tendency of dog owner to let their dogs off the
lead in the breeding season could be affecting sensitive biodiversity features such as ground
nesting birds. Concern comes mostly from dogs being allowed to roam freely across the

Faber Maunsell Access Management Report: Three Year Monitoring Surveys at Open Access Land (2006-2008) 92
more sensitive biodiversity areas of a site where ground nesting birds may be present and
attempting to prospect, breed and nest.
The majority of these site have existing access management in place or have been recently
funded by the AMGS. These monitoring site reports can now be used to understand the
effectiveness of existing management and guide potentially a more strategic approach to
managing these sites and integrating access, biodiversity and landscape objectives at the
SPA level rather than the site level.

Faber Maunsell Access Management Report: Three Year Monitoring Surveys at Open Access Land (2006-2008) 93
6.9 North Norfolk Coast
Two sites were surveyed on the North Norfolk Coast.
Table 6.7 CROW Impact Assessment North Norfolk Coast
Site Name Assessment of likely impact of CROW
Key considerations in arriving at conclusion
Residual concerns
Brancaster Beach Low impact Existing use, pre-CROW Poor control of dogs
Holme Dunes Low impact Existing use, pre-CROW Poor control of dogs
6.9.1 Patterns of Use: Holme Dunes
At the time of writing (March 2009) a portion of the central part of the site and a thin strip at the
south edge were closed to public access, although these are for land management/commercial
reasons not because of sensitive wildlife. A small number of visitors strayed into the restricted
area. The National Trail runs along the northern edge of this restricted area and carries much
of the visitor traffic, as they pass between the western and eastern extremities of the site. In
addition, many visitors walk along the foreshore sands north of the National Trail. Some also
approached the site along public footpaths which run northwards from the main coastal road,
where it passes through Holme next the Sea and Thornham.
6.9.2 Implications for Access Management
It seems that this is a popular site amongst people who are conscious of its wildlife value and
the need to avoid disturbance (e.g. bird watching was the main reason for visiting the site for
nearly half the visitors interviewed). The wildlife for which the site is valued is at risk of
disturbance from people and, in particular, dogs. Many visitors brought dogs with them and a
high percentage of these (29%) were off lead and roaming, and many were regarded by the
surveyors as being out of control. This suggests that there is reason for concern at the effects
on wildlife. Further, there is evidence to show that some visitors are likely to ignore restrictions,
whether general restrictions or site-specific ones. However, the extent to which this is a new
threat to wildlife is less clear. Only 3 dog walkers were visiting for the first time, compared to 15
who had been visiting the site for 3 years or more. Further, half the people interviewed had
„always known‟ about the site and 52 interviewees visit at least once a year.
Therefore it is likely that there has been only a minimal change in levels and patterns of use
and that there has not been an adverse significant impact of the sensitive biodiversity features
of the site from the introduction of CROW. However this does not mean that there are not
existing concerns from long standing access to the site, which may need addressing through
better access management across the site.
6.9.3 Patterns of Use: Brancaster Beach
The PROW on the site tend to run perpendicular to the road – i.e. they give access to the coast
but not along it. However, there is a public footpath which follows the southern (inland)
boundary of the site from the car park westwards.
The open access rights have been restricted over a narrow strip of land at the western side of
the car park area (on the grounds of them being necessary to protect sensitive wildlife),
although these were not in force when the site was visited at the time of writing (March 2009).
However, surveyors reported some potentially misleading „No Access‟ signs.
The data obtained from interviewees suggest that the majority of visitors to Brancaster Beach
are holidaymakers looking to experience a classic day on the beach. Their pattern of behaviour
is fairly homogeneous – they drive to the car park, walk to various points on the beach close to
the car park and leave after a period of time. Very few extend their walk beyond the section of
the site around the car park, although a few walked to the site from Brancaster and others were
observed in the complex of channels and saltmarsh that lie between the golf course and
Brancaster.
No-one entered the areas shown as being sensitive for nature conservation (at the western end
of the site and beyond the channel which forms Brancaster Harbour).

Faber Maunsell Access Management Report: Three Year Monitoring Surveys at Open Access Land (2006-2008) 94
6.9.4 Implications for Access Management
Wildlife interests are perhaps less pronounced at this site than Holme Dunes, however, they are
still of high biodiversity value in relation to wading birds and where there are sensitive areas
here, visitors did not enter them. Whether this is due to the signs or because the sensitive
areas are not where people want to go is hard to determine from the data available. Although
many people had heard of Open Access and recognised that their right of access could be
restricted, two thirds did not know that Brancaster Beach had been designated as Open Access
Land. A common response from people who were asked why they left public rights of way was
that they believed they‟d always had a right to go onto the beach. In other words, designation
of the area as Open Access land has made little difference in the minds of people visiting
Brancaster Beach.
In numerical terms and percentage terms, dog owners appear to exercise less control over their
dogs, and more disturbance (of other visitors) was observed, than at Holme Dunes. This could
have implications on wading bird populations, especially as a third of visitors with dogs were on
their first visit here. Questioning of dog walkers revealed a similar range of attitudes as those at
Holme Dunes. A majority said they never keep their dogs on a lead at this location and few
saw risks to wildlife as an important issue here. Only a few would be moved to put their dog on
a lead in the bird breeding season or if birds are nearby, although two thirds said they would if
signs told them to. As long as they stay out of the sensitive areas (as seems to be the case
based on the surveys), then this may not be a cause for greater concern than at present.
However, if the high percentage of first time visitors with dogs is indicative of an increase in
usage resulting from CROW, and if these new visitors exhibit different patterns of use than
long-time visitors, then disturbance may reach new levels and be of concern.
Therefore it is likely that there has been only a minimal change in levels and patterns of use
and that there has not been an adverse significant impact of the sensitive biodiversity features
of the site from the introduction of CROW. However this does not mean that there are not
existing concerns from long standing access to the site, which may need addressing through
better access management across the site.
6.10 Lancashire
One site was surveyed in Lancashire (other than Bowland Fells), at Jenny Brown‟s
Point/Warton Sands.
Table 6.8 CROW Impact Assessment Lancashire
Site Name Assessment of likely impact of CROW
Key considerations in arriving at conclusion
Residual concerns
Jenny Brown‟s /Brown‟s Houses
No impact Visitors avoid sensitive areas Most users stay on PROW
None
Few interviewees (particularly at Brown‟s Houses) were aware of the land‟s status as Open
Access Land but even so they mainly stayed on the „dry land‟ of the headland. A few ventured
onto the marsh areas, including beyond Quicksand Pool, even though access rights are
restricted beyond this on the grounds of preservation of “sensitive wildlife”. However, interviews
revealed that many people extend their walk well beyond the coastal route. Routes used by
walkers fan out south and east towards Warton Crag, Warton village and Millhead, mainly along
PROW or minor public roads.
6.10.1 Implications for Access Management
Few interviewees (particularly at Brown‟s Houses) were aware of the land‟s status as Open
Access Land but even so they mainly stayed on the „dry land‟ of the headland. A few ventured
onto the marsh areas, including beyond Quicksand Pool, even though access rights are
restricted beyond this on the grounds of preservation of “sensitive wildlife”. However, interviews
revealed that many people extend their walk well beyond the coastal route. Routes used by
walkers fan out south and east towards Warton Crag, Warton village and Millhead, mainly along
public rights of way or minor public roads.

Faber Maunsell Access Management Report: Three Year Monitoring Surveys at Open Access Land (2006-2008) 95
6.10.2 Implications for Biodiversity and Land Management
Level of use is not excessive and most people limit their walks to existing highways. The
restrictions imposed over sensitive areas are generally respected by visitors. Therefore, it is
unlikely that designation of the land as Open Access Land will have had an effect on wildlife or
land management.
6.11 Cumbria
Six sites were surveyed in Cumbria (other than in the National Park and North Pennines
AONB).
Table 6.9 CROW Impact Assessment Cumbria (outside of National Park and North
Pennines AONB)
Site Name Assessment of likely impact of CROW
Key considerations in arriving at conclusion
Residual concerns
Bowness Common
No impact Low level of use None
Drigg Coast Low impact Existing use, pre-CROW Relatively low level of use
Roaming dogs may affect wildlife and sheep
High Park/ Whillimoor
No impact Low level of use None
North Walney Low impact Existing use, pre-CROW Most users stay on tracks
Roaming dogs may affect wildlife
The Helm No impact Existing use, pre-CROW Roaming dogs may affect sheep
Wan Fell No impact Low level of use Dogs inhibiting re-introduction of grazing
At two of the six sites, the impacts of CROW are assessed as nil (at Bowness Common and
High Park/Whillimoor Fell) due to their low level of use.
6.11.1 Patterns of Use: Drigg Coast The car park at the road end is the main launching point for forays onto the coast by Drigg. Walkers typically walk a circuit involving going to the waterline, following it north or south, then coming inland to return on a route parallel to the shore (or vice versa). Some visitors were probably on the Cumbria Coastal Way and followed this route from/to the north and along the Shore road.
It was evident that dog walkers were inclined to walk further out towards the sea and so beyond the site‟s boundary, wandering freely on the foreshore.
6.11.2 Implications for Access Management
The high proportion of visitors with dogs who let them run freely may be a cause for concern
from both a nature conservation and livestock management perspective. In practice, the
number of visitors, spread over a large site (including the beach area), may be low enough to
mean that the impact is small. Further, this site has probably had open access for many years
so the additional impact of CROW is likely to be low.
6.11.3 Patterns of Use: North Walney The local topography dictates that people have to approach the site from its south west corner. From there, an access corridor is formed by the shoreline on the west and Barrow Airfield on the right; everyone is funnelled along this corridor until the site opens out. From this point, walkers typically continue along the shore line – some actually rounding the end of the spit – although most double back earlier. Most of the routes followed make use of minor tracks and paths (non-PROW). There appears to be no difference between routes followed by people with or without dogs, except perhaps a greater tendency for dog walkers to walk up along the western beach.
6.11.4 Implications for Access Management
The visitor profile is consistent with that of many „local‟ sites – used regularly as a resource by
local people - and consequently is likely to have been well-established pre-CROW.

Faber Maunsell Access Management Report: Three Year Monitoring Surveys at Open Access Land (2006-2008) 96
If people do generally stay on the tracks in the southern part of the site, then impacts on land
management and nature conservation interests are likely to be low. The fact that most dog
walkers allow their dogs to roam freely may be a concern. However, none of the access
pressure appears to be directly a result of CROW implementation.
6.11.5 Patterns of Use: The Helm Interviews were undertaken at the northern end of the site, at an area where parking is possible on verges. All visitors, walkers and dog walkers alike, find routes to left or right but most either follow the path that climbs up onto the whaleback ridge or one that runs parallel to the minor road the crosses the western side of the Helm. The two routes (one off-sire to the west and one off-site to the east) may be used by some to make up a circular walk.
There is little walking outside these four main route lines. Where they are abandoned, this is by
dog walkers and they stay on the western slope of the Helm (where there are many sheep
tracks and minor paths).
6.11.6 Implications for Access Management
Sheep grazing on the western slopes of the Helm may be compromised slightly by the large
number of unleashed dogs brought onto the site. However, given the long history of public
access to this site, it is unlikely that its designation as Open Access Land has affected the way
the land is managed.
6.11.7 Patterns of Use: Wan Fell
The small amount of data recorded shows that access was obtained from the B6413, along the
quarry road. The walkers did not venture far into the area, although wandered around freely
within this part of the site. However, there is insufficient information to suggest that this is a
normal pattern of use.
6.11.8 Implications for Access Management
This level of use is unlikely to be having any direct effect on nature conservation interests at this
site. It is interesting to note that the reason given for one of the SSSI units being in poor
condition is undergrazing. Lack of grazing can sometimes arise from a fear that sheep will be
worried by dogs brought onto site by visitors and allowed to roam free. While this does happen
here, the pressure from visitors‟ dogs seems unlikely to be sufficient to generate such concern.
It is concluded, therefore, that CROW implementation has had no effect on the nature
conservation interests and land management of the site.
6.12 Shropshire
Two sites were surveyed in Shropshire.
Table 6.10 CROW Impact Assessment at Shropshire
Site Name Assessment of likely impact of CROW
Key considerations in arriving at conclusion
Residual concerns
Long Mynd No impact Existing use, pre-CROW Most users stay on PROW
None
Stiperstones Some evidence for increased use
A proportion of first time visitors but who stick to PROW
Dogs roaming off PROW
6.12.1 Patterns of Use: Stiperstones
Most people observed at the site were on the paths, which are well-defined and plentiful, and
the heather (which tends to obscure the underlying loose rocks) deters straying. The
observations show that this generalisation applied to both dog walkers and those without dogs.
The path that runs along the central spine of the ridge and the bridleway at the eastern side
appear to carry the most traffic but with many linking paths used, presumably to allow walkers
to complete a circular walk of some kind, rather than a „there-back‟ route. Some of the walks
extended outside the site boundary.
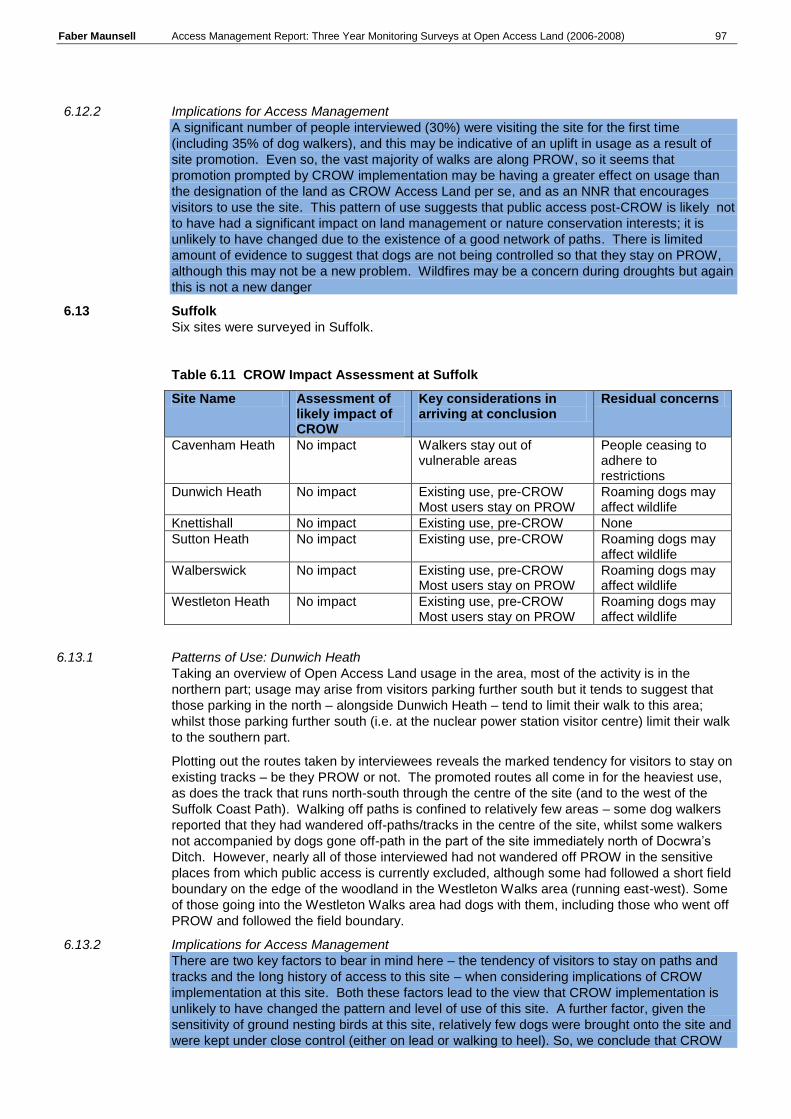
Faber Maunsell Access Management Report: Three Year Monitoring Surveys at Open Access Land (2006-2008) 97
6.12.2 Implications for Access Management
A significant number of people interviewed (30%) were visiting the site for the first time
(including 35% of dog walkers), and this may be indicative of an uplift in usage as a result of
site promotion. Even so, the vast majority of walks are along PROW, so it seems that
promotion prompted by CROW implementation may be having a greater effect on usage than
the designation of the land as CROW Access Land per se, and as an NNR that encourages
visitors to use the site. This pattern of use suggests that public access post-CROW is likely not
to have had a significant impact on land management or nature conservation interests; it is
unlikely to have changed due to the existence of a good network of paths. There is limited
amount of evidence to suggest that dogs are not being controlled so that they stay on PROW,
although this may not be a new problem. Wildfires may be a concern during droughts but again
this is not a new danger
6.13 Suffolk
Six sites were surveyed in Suffolk.
Table 6.11 CROW Impact Assessment at Suffolk
Site Name Assessment of likely impact of CROW
Key considerations in arriving at conclusion
Residual concerns
Cavenham Heath No impact Walkers stay out of vulnerable areas
People ceasing to adhere to restrictions
Dunwich Heath No impact Existing use, pre-CROW Most users stay on PROW
Roaming dogs may affect wildlife
Knettishall No impact Existing use, pre-CROW None
Sutton Heath No impact Existing use, pre-CROW Roaming dogs may affect wildlife
Walberswick No impact Existing use, pre-CROW Most users stay on PROW
Roaming dogs may affect wildlife
Westleton Heath No impact Existing use, pre-CROW Most users stay on PROW
Roaming dogs may affect wildlife
6.13.1 Patterns of Use: Dunwich Heath
Taking an overview of Open Access Land usage in the area, most of the activity is in the
northern part; usage may arise from visitors parking further south but it tends to suggest that
those parking in the north – alongside Dunwich Heath – tend to limit their walk to this area;
whilst those parking further south (i.e. at the nuclear power station visitor centre) limit their walk
to the southern part.
Plotting out the routes taken by interviewees reveals the marked tendency for visitors to stay on
existing tracks – be they PROW or not. The promoted routes all come in for the heaviest use,
as does the track that runs north-south through the centre of the site (and to the west of the
Suffolk Coast Path). Walking off paths is confined to relatively few areas – some dog walkers
reported that they had wandered off-paths/tracks in the centre of the site, whilst some walkers
not accompanied by dogs gone off-path in the part of the site immediately north of Docwra‟s
Ditch. However, nearly all of those interviewed had not wandered off PROW in the sensitive
places from which public access is currently excluded, although some had followed a short field
boundary on the edge of the woodland in the Westleton Walks area (running east-west). Some
of those going into the Westleton Walks area had dogs with them, including those who went off
PROW and followed the field boundary.
6.13.2 Implications for Access Management
There are two key factors to bear in mind here – the tendency of visitors to stay on paths and
tracks and the long history of access to this site – when considering implications of CROW
implementation at this site. Both these factors lead to the view that CROW implementation is
unlikely to have changed the pattern and level of use of this site. A further factor, given the
sensitivity of ground nesting birds at this site, relatively few dogs were brought onto the site and
were kept under close control (either on lead or walking to heel). So, we conclude that CROW

Faber Maunsell Access Management Report: Three Year Monitoring Surveys at Open Access Land (2006-2008) 98
has probably not brought about any additional adverse impacts on biodiversity interests or land
management at this site.
6.13.3 Patterns of Use: Walberswick Common The good network of PROW across the site seems to supply visitors with the vast majority of their needs for suitable routes to follow. The disused railway which carries the promoted route seems to act as a psychological barrier and no-one reported venturing north of this line. However, many walked along this route and the PROW fanning off it, with the two bridleways (running roughly in parallel) at the eastern edge of the site being the most popular. The entry point to the west of Heath House was the most commonly used and provides users with a choice of triangular routes along the PROW which many follow.
Off-PROW activity is relatively common in the centre of the Common (including over the „island‟
of non-Access land, especially amongst dog walkers, while peripheral areas are more the
domain of walkers without dogs.
6.13.4 Implications for Access Management
There seems to be a high tendency to stay on PROW at this site, perhaps a reflection of the
health of the heather, its height deterring people from walking through it, and the high number
of non-locals who may feel more comfortable following clear routes. In this respect, the
mapping of the site as Open Access Land has probably had minimal impact. Dogs are a
particular concern at this site and, in the observation survey, two dogs were observed to be
roaming (which is taken to mean off PROW) and 80% of people interviewed only keep their
dogs on leads some of the time. This pattern of behaviour is unlikely to be attributable to
CROW but remains a residual concern.
6.13.5 Patterns of Use Sutton Heath
Analysis of the data from the survey suggest that this is a typical local dog-walking site.
Observations show that the majority of dogs were allowed off-lead.
Patterns of use appear to conform to a relatively simple design – people enter from the main
entry point in the western extremity of the site, walk around the site and then exit at the same
point. Whilst within the site, though, they fan out in all directions and so visit virtually every part
of the site (including some areas not designated as Open Access Land). Dog walkers and
those without dogs both adhere to this simple approach.
6.13.6 Implications for Access Management
The main concern with public access to this site from a biodiversity perspective is the risk of
disturbance of ground-nesting birds by free-roaming dogs. (Fire risk could be a concern in
periods of very dry weather but no observations were made of inappropriate behaviour
constituting fire risks.) The extent to which these concerns are attributable to CROW depends
on how the public‟s use of the site has changed as a result of it being mapped as Open Access
Land. Evidence from the interviews suggests that the pattern of access use (especially by dog
walkers) is well-established.
Given the above observations, it appears that CROW implementation is unlikely to have
brought about any additional adverse impacts on nature conservation interests at this site.
However there remains a residual concern over free-roaming dogs, even though CROW is
unlikely to have added to this concern.
6.13.7 Patterns of Use Cavenham Heath
This site is not heavily used but is, according to the justification for its designation as a
statutorily protected site, vulnerable to public access. It seems reasonable to infer, therefore,
that the vulnerability is more likely to arise from dogs rather than people. It is encouraging to
note that no dog walking activity was recorded or observed in the Tuddenham Heath area or on
Cavenham Heath north of the Icknield Way Path (also seen to be sensitive for nature
conservation). Visitor activity seems to be confined to that part of the site that is least sensitive
from a nature conservation perspective).
6.13.8 Implications for Access Management
The main concern (which seems to have arisen as a result of CROW implementation) at this
site is the risks to ground-nesting birds, and in particularly the stone-curlew (which is now rare),

Faber Maunsell Access Management Report: Three Year Monitoring Surveys at Open Access Land (2006-2008) 99
from disturbance by people and their dogs. If the interview responses and observations are
representative, walkers (neither interviewed or observed) whether with or without dogs are not
venturing into the sensitive areas.
Given the above, it appears that CROW restrictions are working and so implementation is
unlikely to have brought about any additional adverse impacts on biodiversity interests at this
site. The choice of routes taken by dog walkers should remain a concern and so the
continuation of the current regime would seem to offer the best way forward.
6.13.9 Patterns of Use: Knettishall Heath All bar one group of people interviewed at this site had entered from the main car park and picnic area in the north east of the site. From here, people spread out across the site, mostly along tracks and PROW. The most commonly followed route was north-south through the centre of the site with people peeling off left and right to explore different parts of the site but, as previously noted, typically along paths and tracks. Dog walkers were the most adventurous – travelling further into the corners of the site and some of the areas in-between the tracks.
Some visitors ventured into the area north of the site following routes along the tracks there and the river bank, even though these routes are neither on Open Access Land or PROW.
6.13.10 Implications for Access Management
Given that the site is a Country Park of long standing, it appears that CROW implementation is
unlikely to have brought about any additional adverse impacts on nature conservation interests
at this site.
6.14 Dorset Downlands
Six sites were surveyed in Dorset, other than the Dorset Heaths sites.
Table 6.12 CROW Impact Assessment at Dorset Downlands
Site Name Assessment of likely impact of CROW
Key considerations in arriving at conclusion
Residual concerns
Eggardon Hill No impact Existing use, pre-CROW
Erosion leading to damage of SAM
Fontmell Down No impact Existing use, pre-CROW Low level of use
Restrictions to safeguard dog walkers from cattle may not be fully ineffective
Hambury Tout / Lulworth
Low impact Existing use, pre-CROW Most users stay on PROW
Heavy usage
Higher Hill Plush / Nettlescombe
No impact Low level of use Most users stay on PROW
None
Purbeck Ridge/Godlingston Hill
No impact Most users stay on PROW None
The Giant, Cerne Abbas
No impact Existing use, pre-CROW Most users stay on PROW
If presence of dogs cause sheep grazing to stop, conservation value may be compromised
6.14.1 Patterns of Use: Eggardon Hill
The focus of visitor attention is clearly the hill fort, and many people‟s walks simply circle the
earthworks that surround the fort. However, some people follow the edge of the escarpment
and drop down the slope along the bridleway down to North Eggardon Farm; from there, linking
to the PROW network to the west or returning up the slope to the fort. A few people also
walked north westwards towards Bell Stone.
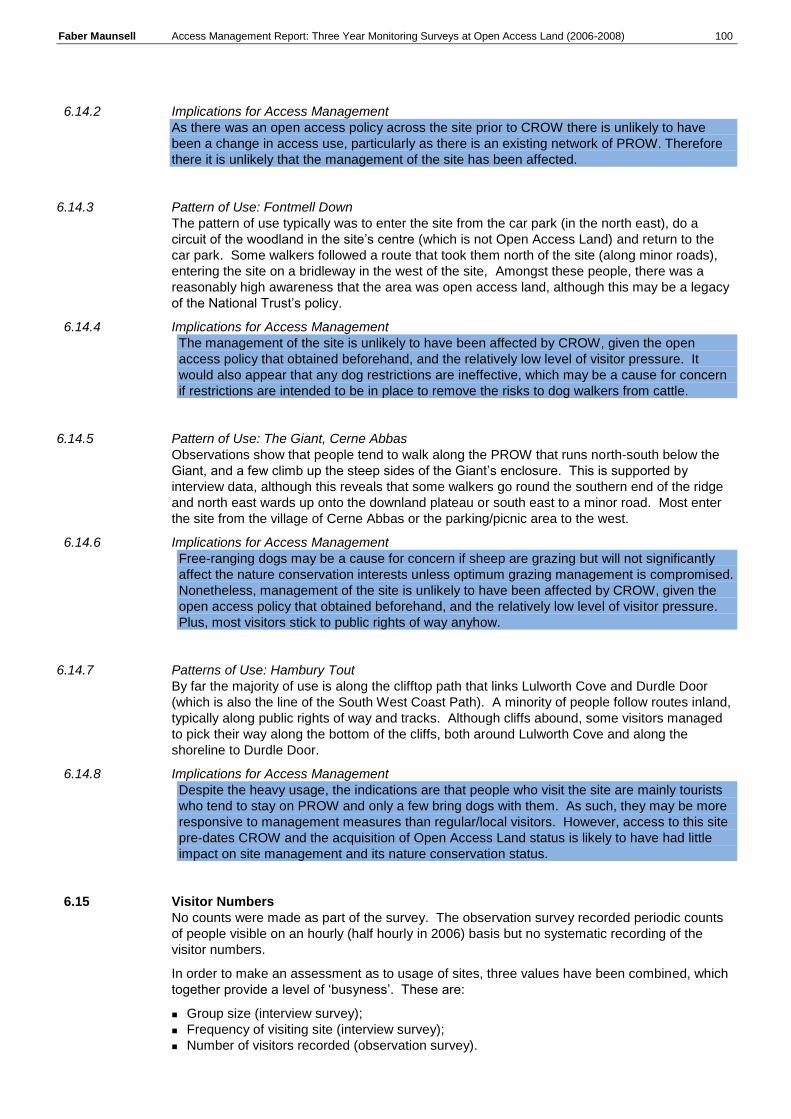
Faber Maunsell Access Management Report: Three Year Monitoring Surveys at Open Access Land (2006-2008) 100
6.14.2 Implications for Access Management
As there was an open access policy across the site prior to CROW there is unlikely to have
been a change in access use, particularly as there is an existing network of PROW. Therefore
there it is unlikely that the management of the site has been affected.
6.14.3 Pattern of Use: Fontmell Down
The pattern of use typically was to enter the site from the car park (in the north east), do a
circuit of the woodland in the site‟s centre (which is not Open Access Land) and return to the
car park. Some walkers followed a route that took them north of the site (along minor roads),
entering the site on a bridleway in the west of the site, Amongst these people, there was a
reasonably high awareness that the area was open access land, although this may be a legacy
of the National Trust‟s policy.
6.14.4 Implications for Access Management
The management of the site is unlikely to have been affected by CROW, given the open
access policy that obtained beforehand, and the relatively low level of visitor pressure. It
would also appear that any dog restrictions are ineffective, which may be a cause for concern
if restrictions are intended to be in place to remove the risks to dog walkers from cattle.
6.14.5 Pattern of Use: The Giant, Cerne Abbas
Observations show that people tend to walk along the PROW that runs north-south below the
Giant, and a few climb up the steep sides of the Giant‟s enclosure. This is supported by
interview data, although this reveals that some walkers go round the southern end of the ridge
and north east wards up onto the downland plateau or south east to a minor road. Most enter
the site from the village of Cerne Abbas or the parking/picnic area to the west.
6.14.6 Implications for Access Management
Free-ranging dogs may be a cause for concern if sheep are grazing but will not significantly
affect the nature conservation interests unless optimum grazing management is compromised.
Nonetheless, management of the site is unlikely to have been affected by CROW, given the
open access policy that obtained beforehand, and the relatively low level of visitor pressure.
Plus, most visitors stick to public rights of way anyhow.
6.14.7 Patterns of Use: Hambury Tout
By far the majority of use is along the clifftop path that links Lulworth Cove and Durdle Door
(which is also the line of the South West Coast Path). A minority of people follow routes inland,
typically along public rights of way and tracks. Although cliffs abound, some visitors managed
to pick their way along the bottom of the cliffs, both around Lulworth Cove and along the
shoreline to Durdle Door.
6.14.8 Implications for Access Management
Despite the heavy usage, the indications are that people who visit the site are mainly tourists
who tend to stay on PROW and only a few bring dogs with them. As such, they may be more
responsive to management measures than regular/local visitors. However, access to this site
pre-dates CROW and the acquisition of Open Access Land status is likely to have had little
impact on site management and its nature conservation status.
6.15 Visitor Numbers
No counts were made as part of the survey. The observation survey recorded periodic counts
of people visible on an hourly (half hourly in 2006) basis but no systematic recording of the
visitor numbers.
In order to make an assessment as to usage of sites, three values have been combined, which
together provide a level of „busyness‟. These are:
Group size (interview survey);
Frequency of visiting site (interview survey);
Number of visitors recorded (observation survey).

Faber Maunsell Access Management Report: Three Year Monitoring Surveys at Open Access Land (2006-2008) 101
As part of the interview survey, people were asked how often they visit the site, and how many
people were in their party and from this variable an estimate of the number of trips made
annually has been made.
For the observation survey data, the total number of visitors observed is factored down by the
number of survey days conducted to give an equal number of days per site. This is then
factored up by 260, to give an estimate of the number of visitors per year. (A factor of 365
would produce a high estimate, given that the surveys took place mostly in the summer months.
Further details on the approach can be found in Annex 1).The average of the estimates, from
the interview and observation surveys are then found. For all sites this produced values in the
range 0 to 91303. The 20th, 40
th, 60
th and 80
th percentile values for this range are shown in
Table 5.13 below. The same approach was taken for dogs at the site; here the range for all
sites is 0 to 9533. Indices are then applied such that 1= results in the lowest group, below 20th
percentile, 2= results between the 20th and 40
th percentiles etc.
Table 6.13 Visitor and Dog Indices
Percentile Visitor Numbers Dogs Index Description
0 0 0 1 Very low use
0.2 213 30 2 Low use
0.4 1386 283 3 Average use
0.6 3415 683 4 High use
0.8 5366 1916 5 Very high use
A Visitor Index (VI) of 1 indicates that annual visitors numbers are small, possibly less than 213
people per year, or less than one per day, whereas a site with a VI of 5 is very busy, with more
than 5366 visitors annually. The indices have been assessed for each year to assess if any
trends in usage can be ascertained, but note that the results are indicative only. As the indices
are based on relative averages the figure for all years may not itself be an average of the
individual years. Sites not surveyed in any year have no index. Table 6.14 shows the Visitor
Indices for the site groups, and shows that Canford Heath has very high use, at value 5, as
does the North Norfolk Coast.
Table 6.14 Visitor Indices
2006 2007 2008 All
National Sample Sites 2.6 2.8 2.9 2.9
North Norfolk Coast 3.0 4.5 5.0 5.0
Canford Heath 4.0 5.0 5.0 5.0
Shropshire
4.0 5.0 4.5
Bowland Fells 3.0 3.5 3.8 4.0
Sunbiggin Tarn 3.0 5.0 4.0 4.0
South Pennine Moors 4.0 4.0 4.0 4.0
Dorset Heaths
3.4 3.4 3.5
Suffolk
2.5 4.0 3.3
Dorset Downs
3.2 2.4 3.0
Lancashire
3.0 3.0 3.0
Cumbria
3.2 2.3 2.8
North Pennines AONB 4.0 2.2 1.9 1.9

Faber Maunsell Access Management Report: Three Year Monitoring Surveys at Open Access Land (2006-2008) 102
National Sample Sites
The average Visitor Index for all the National Sample sites is 2.9, but individual sites
range from VI 1 to VI5. The indices appear to show a year on year increase, but there
are in sufficient sites to say whether these differences are significant.
The North Pennine Sites have the lowest Visitor Indices, with only Cow Green having a Visitor
Index of 5, and half of these sites having a Visitor Index of 1.
Table 6.15 shows the Dog Indices for the site groups, and this also shows that Canford Heath
has very high use, at value 5. Other sites with high numbers of dogs are the North Norfolk
Coast and the Dorset Heaths sites. The North Pennines AONB has the fewest dogs.
Table 6.15 Dog Indices
2006 2007 2008 All
National Sample Sites 3.0 2.9 3.0 3.0
North Norfolk Coast 5.0 5.0 5.0 5.0
Canford Heath 4.0 4.0 4.5 4.5
Shropshire
4.1 4.2 4.3
Bowland Fells
4.0 3.0 4.0
Sunbiggin Tarn 4.0 3.0 3.0 3.5
South Pennine Moors
3.6 2.8 3.3
Dorset Heaths
3.2 3.2 3.3
Suffolk 4.0 4.0 2.0 3.0
Dorset Downs
3.0 2.4 2.8
Lancashire 2.0 2.0 1.8 2.5
Cumbria
2.5 2.5 2.5
North Pennines AONB 3.0 1.8 1.5 1.6
National Sample Sites
The average Dog Index for all the National Sample sites is 3.0, but individual sites
range from DI 1 to DI 5. The indices do not show a year on year change.
By site type the following differences in Visitor and Dog Indices are noted, see Table 6.16.
Moorland sites have both few dogs and fewer visitors than lowland sites;
Sites with biodiversity designations have more visitors but only slightly more dogs than other
sites;
Urban sites have many more people and particularly more dogs;

Faber Maunsell Access Management Report: Three Year Monitoring Surveys at Open Access Land (2006-2008) 103
Table 6.16 Visitor and dog indices by site type
Site Type Visitor Index Dog Index
Moorland Sites 2.3 2.1
Not Moorland Sites 2.9 3.4
Biodiversity Designated Sites 2.9 2.9
Non Designated Sites 2.4 2.8
Urban 3.4 3.7
Not Urban 2.5 2.6
Common Land 2.9 3.0
Not Common Land Site 2.5 2.7
Section 15 3.3 3.2
Not Section 15 Land 2.5 2.7
Sites with AMGS 2.9 3.0
Sites without AMGS 2.4 2.7
TOTAL
6.16 Entry Points
Using a similar approach to the indices above, analysis has been carried out of the entry points
for each site20
. For all sites, mapping analysis identified the number of routes passing through
each entry point to the area of Open Access Land. The maximum for any entry point for each
was then identified, and hence the average maximum for all sites. This formed the upper range
of a five point scale denoting levels of use, as follows:
Index 5 – 24 or more
Index 4 – 17-23
Index 3 – 11-16
Index 2 – 6-10
Index 1 - 5 or fewer
This information indicates which parts of the routes are likely to be most heavily used, and can
be used in models for predicting patterns of use.
20
As advised by Rob Keane, Nature Conservation & Monitoring Specialist, NE

7 Summary and Conclusions
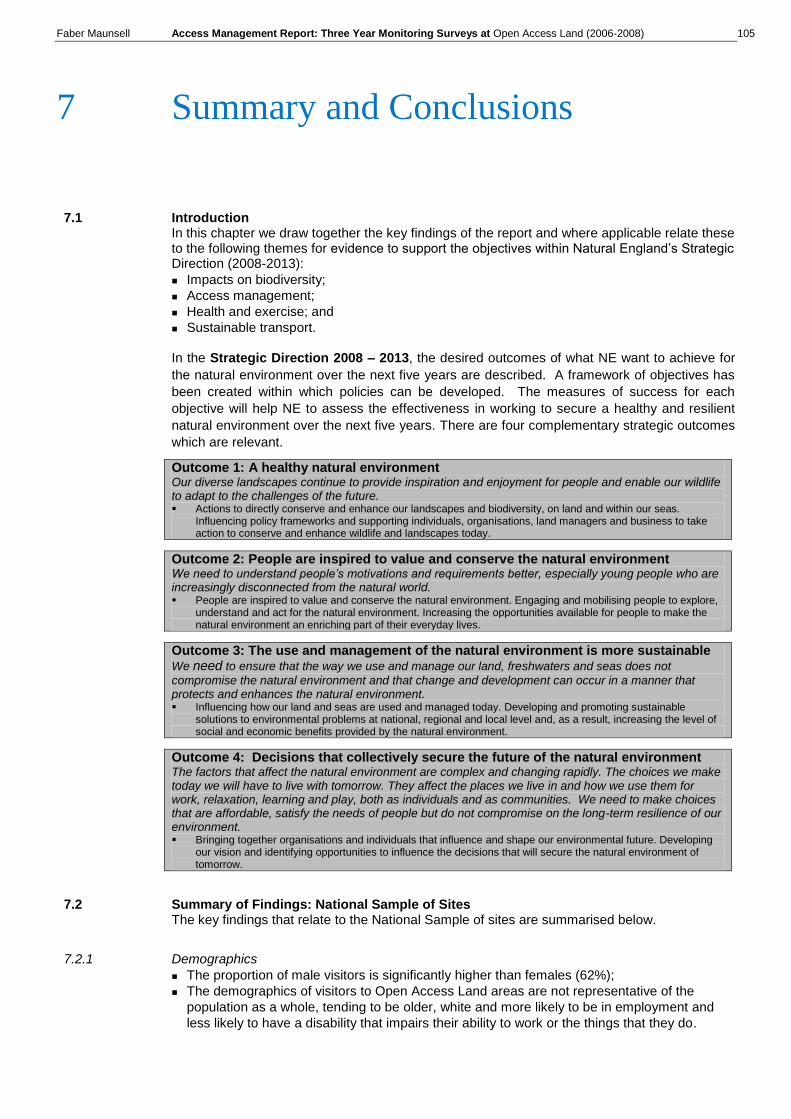
Faber Maunsell Access Management Report: Three Year Monitoring Surveys at Open Access Land (2006-2008) 105
7.1 Introduction In this chapter we draw together the key findings of the report and where applicable relate these to the following themes for evidence to support the objectives within Natural England‟s Strategic Direction (2008-2013):
Impacts on biodiversity;
Access management;
Health and exercise; and
Sustainable transport. In the Strategic Direction 2008 – 2013, the desired outcomes of what NE want to achieve for
the natural environment over the next five years are described. A framework of objectives has
been created within which policies can be developed. The measures of success for each
objective will help NE to assess the effectiveness in working to secure a healthy and resilient
natural environment over the next five years. There are four complementary strategic outcomes
which are relevant.
Outcome 1: A healthy natural environment Our diverse landscapes continue to provide inspiration and enjoyment for people and enable our wildlife to adapt to the challenges of the future. Actions to directly conserve and enhance our landscapes and biodiversity, on land and within our seas.
Influencing policy frameworks and supporting individuals, organisations, land managers and business to take action to conserve and enhance wildlife and landscapes today.
Outcome 2: People are inspired to value and conserve the natural environment We need to understand people’s motivations and requirements better, especially young people who are increasingly disconnected from the natural world. People are inspired to value and conserve the natural environment. Engaging and mobilising people to explore,
understand and act for the natural environment. Increasing the opportunities available for people to make the natural environment an enriching part of their everyday lives.
Outcome 3: The use and management of the natural environment is more sustainable We need to ensure that the way we use and manage our land, freshwaters and seas does not
compromise the natural environment and that change and development can occur in a manner that protects and enhances the natural environment. Influencing how our land and seas are used and managed today. Developing and promoting sustainable
solutions to environmental problems at national, regional and local level and, as a result, increasing the level of social and economic benefits provided by the natural environment.
Outcome 4: Decisions that collectively secure the future of the natural environment The factors that affect the natural environment are complex and changing rapidly. The choices we make today we will have to live with tomorrow. They affect the places we live in and how we use them for work, relaxation, learning and play, both as individuals and as communities. We need to make choices that are affordable, satisfy the needs of people but do not compromise on the long-term resilience of our environment. Bringing together organisations and individuals that influence and shape our environmental future. Developing
our vision and identifying opportunities to influence the decisions that will secure the natural environment of tomorrow.
7.2 Summary of Findings: National Sample of Sites The key findings that relate to the National Sample of sites are summarised below.
7.2.1 Demographics
The proportion of male visitors is significantly higher than females (62%);
The demographics of visitors to Open Access Land areas are not representative of the
population as a whole, tending to be older, white and more likely to be in employment and
less likely to have a disability that impairs their ability to work or the things that they do.
7 Summary and Conclusions

Faber Maunsell Access Management Report: Three Year Monitoring Surveys at Open Access Land (2006-2008) 106
Outcome 2: CROW has had no discernible effect on the diversity of visitors to the natural environment where there is access land, based on the National Sample of sites.
7.2.2 Visitor Patterns
More than half of visitors are accompanied by dogs;
Sites with large populations close by have higher proportions of visitors accompanied by
dogs than those further away;
Almost a quarter of people visit an Open Access Land site on a daily basis;
Almost nine out of ten visits are made from home, with an average of 10 miles being travelled
to site;
Almost three quarters of visits to site are made by car (or other motorised transport): 22%
walk all the way to the site, 3% cycle and 1% of visits are made by public transport.
Outcome 3: Although the majority of visits are made by car, the distances travelled are not great. A quarter of trips are made by sustainable means, and there will be health benefits associated with the walking and cycling trips.
7.2.3 Visitor Activities
More than two fifths of visitors said their main reason for being at the site was to walk a dog;
and 13% were there for a „serious‟ walk; three in ten are there to take a short stroll;
The scenery and an attractive landscape are the main reason for choosing a site for almost
half of respondents;
Over half, 55% said that getting exercise featured to a large extent in their decision to visit
the countryside, and a further 33% said it did so to some extent;
Almost half of visits last under an hour, with dog walkers spending about a third as long as
do serious walkers.
Health and Exercise: While dog walkers may not walk as far as serious walkers while at sites, they make far more trips, typically daily. Getting exercise, as well as exercising a dog is a positive attraction of the natural environment
7.2.4 Visitor Habits
The majority of visits to Open Access Land involve no local expenditure; for the quarter of
people who do spend anything, the average is just under £10;
Those who visit sites when on holiday tend to spend around three times as much as those
who travel from home.
Support for rural economy: Since most trips are made relatively close to home, and expenditure levels are low there are only a limited number of visits that give rise to a benefit to rural economies from sites typical of the National Sample. Expenditure tends to be higher by people making trips while on holiday, and hence spending may be higher at sites that attract holiday makers. While expenditure is higher at other sites outside the National Sample, there is no evidence to suggest this is any effect of CROW.
7.2.5 Visitor Awareness of Open Access
One in five visitors said they had seen the Open Access symbol before when shown it;
Of these, a fifth had seen it while at the site at which they were interviewed, fewer than had
seen it at other sites;
Almost a third who had seen the sign knew that it represented Open Access;
68% have heard of Open Access, fewer than have heard of Right to Roam;
Less than 3 in ten respondents were aware they were at a site designated as Open Access
Land;
Awareness has not increased over the three years of the survey.
Outcome 2: At the current time, early in the life of Open Access, CROW has had limited effect on the way people are experiencing Open Access Land. .

Faber Maunsell Access Management Report: Three Year Monitoring Surveys at Open Access Land (2006-2008) 107
7.2.6 Patterns of use
The average distance walked on Open Access Land sites is 2km;
Of this, almost half, 47% is on PROW, 19% is on other paths or tracks and the remainder on
Open Access Land, although spatial information shows that few wander completely away
from paths;
High proportions, 89% utilise Open Access Land at some point during their visit;
There are no differences in the proportions of a walk spent on or off PROW by visitor type,
but serious walkers walk the longest distance off PROW, by virtue of the longer walks made;
Respondents tend to under-estimate much of their walk is off PROW, and in many cases do
not distinguish between PROW and other tracks;
Many people find it easier to walk on PROW because of unsuitable terrain;
The presence of other tracks is the main reason people go off PROW, mentioned by 15%
who went off PROW, followed by 8% who do so to exercise their dog;
There are no trends by year of the survey in the utilisation of Open Access Land.
Outcome 1: Many individuals generally do not understand the basis of the rights they are exercising when on Open Access Land and so are not always able to respond to measures applied to protect the environment. Many thought the routes they were following were PROW when they were tracks across Open Access Land. Even if they were on Open Access Land, the understanding of what this entitled them to do was poor in many cases. Consequently, they are not always likely to able to respond to measures applied to protect the environment, if these are predicated on the assumption that people know that they are on Open Access Land or on PROW. Outcome 3: Despite the apparent high utilisation of Open Access Land, the data indicates that there has been no significant change in the levels and patterns of use, and the usage is probably the same as in the Pre - CROW situation.
7.2.7 Visitors with dogs
There is no discernible difference in the propensity to bring dogs to Open Access land sites
in the period of general dog restrictions or at other times;
Almost three fifths had been bringing dogs to the site for more than five years (i.e. pre
CROW);
Three fifths said being able to let the dog off the lead was the main attraction for a dog at the
site;
One in ten dogs is never put on a lead; 7% are always on leads;
Dog owners claim that the proximity of livestock would prompt 55% of them who sometimes
or never have the dog on lead to use a lead; 46% would do in the presence of other dogs;
One in ten said they would use leads if requested to by signage;
Many of those who would not use leads claimed their dog was controllable without one;
The issues most mentioned regarding dogs and the countryside were risks to farm animals
and clearing up dog mess (52% and 50% respectively);
A quarter of respondents mentioned risks to birds or wildlife from dogs.
Biodiversity: At some sites dogs may pose risks to biodiversity hence the restrictions and positive access management applied to sensitive sites. The data show that for the National Sample, the period of general restrictions makes no difference as to whether dogs are at sites or on leads. There is an inherent conflict between the general restrictions on dogs (i.e. to keep dogs on leads at certain times) and the reasons why many dog owners visit sites (i.e. to let their dog run free, off-lead). Outcome 1: Dog walkers are most likely to visit sites very often (daily or weekly), are least likely to read signs, and are often not aware of the Open Access Land status of the sites they visit. This means that influencing their behaviour (e.g. by communicating good practice messages to them and providing reasons through positive messages why a person should keep to the general restrictions on dogs) will be difficult. It is likely to require more direct intervention such as wardening, or zoning, and/or innovative thinking, leading to a range of positive access management techniques.

Faber Maunsell Access Management Report: Three Year Monitoring Surveys at Open Access Land (2006-2008) 108
7.3 Implications for Access Management
The potential impacts of the new rights of access on biodiversity were assessed prior to CROW
through Nature Conservation Assessments (NCA) carried out on all designated sites in England
to identify and implement the least restrictive option that would give such sites appropriate
protection. On many sites, measures were introduced to avoid or minimise the possible
impacts that a new right of public access might have on biodiversity.
Surveys were conducted at 63 such locations, through the National Monitoring and Local
Monitoring programme over three years. The situation at each site was that which obtained
after the implementation of CROW; there was no baseline data to allow a „before and after‟
comparison to be made. Consequently, it has been necessary to make inferences about pre-
CROW use to allow some sort of assessment to be made. In making assessments of the
impacts of CROW, the extent of pre-existing use has been judged in relation to a number of bits
of data:
Whether the land carried existing area-wide access rights (i.e. it is section 15 land);
Whether PROW crossed the site;
The appearance of tracks and paths across the site, as seen in aerial photography (using
Google Earth);
Answers to specific questions in the survey, notably:
o Length of time a dog walker had been bringing their dog to the site (particularly
if over 5 years, or between 3 and 5 years);
o Proportion of first time visitors;
o The proportion of people who had „always known‟ about the site;
o The proportion of people who gave as their reason for coming to the site as
being „always come here‟.
This cannot be a precise measure but, where the above indicators show a high degree of
corroboration, confidence can be placed in the inference.
Based on this approach to assessing the probable impacts of CROW implementation on site
management, a number of conclusions can be drawn. In summary, these are:
Overall, impacts of CROW implementation is likely to be nil or low at most sites (54 of the 63
sites). At the other nine sites, impacts were uncertain due to lack of corroboration in the
evidence used but in most of these cases, the likelihood is that impacts would be minimal. At
only two sites (Stiperstones and Great Ovens) was there indications of increased use in
recent times that could be attributable to CROW, although these tended to be an
exacerbation of existing problems rather than new ones;
Where designated sites are in poor condition and a reason for this is given in the site
condition assessments, factors other than legitimate public access are quoted as the cause
in virtually all cases. One exception, identified by inference, is the influence that the
presence of the public‟s dogs might have on selection of management methods where
livestock are needed for grazing in order to maintain biodiversity;
This does not mean that there are not pre existing visitor pressures or residual concerns for
land managers that can be attributed to public access, just that CROW implementation is not
a direct cause, per se. The most common residual concerns are:
o Control of dogs/management of dog owners
o Effectiveness of restrictions (on people with and without dogs)
o Heavy use causing damage to important sensitive features
o Need for continued visitor management
o „urban influences‟ (e.g. dogs, litter dumping/fly tipping).
The spatial visitor data collected can now be used by Natural England for future assessments
or reassessments of sites, as it will provide some of the inputs into predictive computer models
and enable the spatial relationship between people levels and patterns of use and position of
sensitive biodiversity areas, management points and restrictions to better understand and
inform the effectiveness of positive access management and restrictions developed to influence
visitor behaviour on the most sensitive sites.

Faber Maunsell Access Management Report: Three Year Monitoring Surveys at Open Access Land (2006-2008) 109
7.4 Comparison of findings from National Sample Survey and Lake District Sample
The surveys conducted in the National Survey included no Open Access Land within a National
Park, as such land falls under the Park Authorities‟ management and is being monitored at their
own discretion. The Lake District (LD) National Park Authority undertook Local Monitoring
using the Toolkit in 2008. A summary of these sites can be found in Annex 2, and the Lake
District Case Study presents reports for each of the 10 sites. An overview of the main
differences from the National Sample Survey is presented below:
Almost two thirds of visitors to the LD sites were holiday makers; 88% of trips to National
Sample sites originated from home;
A quarter of visits in the LD were first time visits compared with 11% at National Sample
sites;
Only 9% of visitors interviewed were at the site alone, compared with the 42% in the National
Sample;
Only 7% were visiting sites in the LD to walk a dog as their main purpose, compared with
42% in the National Sample;
There were no notable differences in the demographics of visitors. There were no differences
in the awareness of Open Access Land or in whether respondents knew they were at an area of
Open Access Land.
Although there is no directly comparable data from the National Sample, comparing the data
with that from the Local Monitoring data from outside National Parks there appears to be a
greater propensity to keep dogs on leads for given circumstances in the LD.
Visitors walk longer distances at the Lake District sites, but the usage of land off PROW on areas of Open Access land is very similar.
7.5 Overall Conclusions The method used to sample the usage of Open Access Land is robust and confidence can be
placed in the findings. Visitors to the countryside are not representative of the population as a
whole, with older, white, male and employed people without physical impairments being over
represented.
There is little evidence to suggest any significant change in the pattern of use of Open Access
Land over the three years of the survey.
CROW implementation has been assessed, using information available through the survey, as
probably having no or a limited effect on change of use and hence on biodiversity in terms of
the levels and patterns of use at most sites. The main reasons for making this assessment are:
Existing use, pre-CROW, means that any problems are not new ones
Tendency for people to stay on PROW and tracks
Low level of use
Where there are residual concerns, the behaviour of dog owners is the most common.
From an access management point of view, dog walkers are perhaps the most challenging type
of user. This is because:
Dog walking is the most common activity undertaken on Open Access Land (note that in
addition to those who describe themselves as „dog walkers‟, there will be other user types
who happen to have dogs with them);
The dog has potential to cause adverse impacts on wildlife, livestock and, in some
circumstances, soil nutrient status. The presence of dogs can also inhibit the introduction of
appropriate land management measures;
A significant proportion of dog walkers visit Open Access Land sites specifically because
they can let their dog off the lead, irrespective of whether dog restrictions are in place or not;
Dog walkers have a higher tendency to walk off-PROW than other types;
Dog walkers are less influenced by signs and on-site information than other types of user
and so are difficult to influence.
Faber Maunsell Access Management Report: Three Year Monitoring Surveys at Open Access Land (2006-2008) 110
However, most dog walkers have an inherent acceptance of the need to keep dogs on leads
under some circumstances, as evidenced by the high proportion of dog owners who accepted
this when questioned. The challenge is to ensure people understand when those particular
circumstances obtain. Standard methods such as signs and leaflets may not achieve the
desired results and more direct approaches may be needed (e.g. personal approaches by
wardens/rangers).
People‟s understanding of the rights they are exercising when visiting these sites is poor. Many
people knew of Open Access but only in a general way; further, estimates of the proportion of
walks completed on PROW or Open Access Land differed significantly from the proportion
assessed through mapping. This means that their behaviour is probably best managed „on-the-
ground‟ rather than via messages linked to „Open Access Land‟ and „public rights of way‟, and
through guidebooks/leaflets. There is little to be gained from promoting good practice that
operates along the lines of “when on PROW you can do X” and “when on Open Access Land
you can do Y”: a more strategic approach is required working at the site level. Clear indications
of where people can go and more subtle positive management techniques, such as location of
car parks, stiles/gates, and stream crossings are likely to be more effective at influencing where
people walk.
The data can be used when looking at the possible effectiveness of a range of positive access
management techniques can be used, such as zoning a site into areas of biodiversity or land
management sensitivity, e.g. ground nesting bird assemblages, habitat sensitive to erosion.
For example, the spatial visitor use data can be overlaid with the sensitivity zoned areas to
guide or improve positive access management techniques to be employed across the site or
sites at major decision making points (e.g. at junctions in path and PROW networks).
Even so, it is important that wider considerations are not forgotten – people may take routes for
reasons not affected by on-the-ground measures (such as if following a self-guided route, or
aiming for a particular destination). However, as the results indicate, there is a lack of
awareness of the general dog restriction (i.e. the need to keep dogs on a short fixed lead during
the breeding season and close proximity to livestock) and long standing visitors and dog
walkers may strongly feel that their rights have been reduced by CROW if restrictions are
implemented forcibly, as they have always let their dog of the lead and come for a walk to do
so. The data can be interrogated to help determine the best approach to be used in devising
positive management measures.
Therefore rather than implementing awareness of the general dog restriction across the whole
site this could be guided by understanding the spatial relationship between visitors and the
zoned sensitivity biodiversity areas.
Some sites could have areas where there is a dog walking area, where dogs are encouraged to
be let off the lead, and „no go‟ areas, where people are asked not to walk with their dog. An
integrated approach would be needed so that published guides allow the user to choose
appropriate routes walks and with on-the-ground way marking/ colour coding to reinforce the
messages, linked to primary information interpretation boards at major entry points to guide
visitors away from the most sensitive biodiversity zoned areas (as used at Canford Heath). All
this can be done with positive access management without the need for further restrictions.
The majority of these sites will have existing access management in place or have been
recently funded by the Access Management Grant Scheme (AMGS). The monitoring site
reports can now be used to understand the effectiveness of existing management and guide
potentially a more strategic approach to managing these sites and integrating access,
biodiversity and landscape objectives at the SPA level, rather than the site level. Apart from on
urban sites, people have a strong tendency to stay on what they believe to be PROW (although
they may be just tracks or permissive paths). This is because people find it easier to walk on
paths than not and because PROW take them where they want to go. So, by creating a
recognisable path to where people may want to go, (e.g. to attractive features like viewpoints),
visitors can be channelled along preferred routes and away from sensitive features. Where
people go off paths, for example for bird watching rather than to access specific locations these
would be harder to manage, and signage may be required.
.

Faber Maunsell Access Management Report: Three Year Monitoring Surveys at Open Access Land (2006-2008) 111
Walking as a means of exercise, sustaining or leading to better health and well-being, is a
motivation (to a greater or lesser extent) for many users. It may be possible to exploit this
motivation when considering how land is managed.
Two thirds of respondents had travelled less than 5 miles to reach the site at which they were
interviewed. This information may have relevance to NE‟s proposals for provision of Green
Infrastructure and developments of appropriate targets. The reasons given for visiting Open
Access Land sites may also have relevance to the design of green infrastructure where built as
part of major residential developments (and assessment of the impacts of such developments).
7.6 Recommendations
The information collected through the National and Local monitoring programme has allowed
levels and patterns of use to be monitored over time, in the early life of the CROW legislation.
Although the findings have shown that to date the effects have been few, the results have
established a baseline against which future trends can be measured.
The information collected can be combined with other information from other sources, for
example the Upland Breeding Bird Survey, to provide an understanding of whether the
introduction of CROW has generally had an impact on sensitive wildlife areas and biodiversity
on access land.
The spatial use information collected by the monitoring approach has now been tested on over
80 sites and shown to provide valuable information on patterns of use. This could be applied
across NNRS and other types of sensitive landscapes to understand the relationship between
people, and especially dogs, and sensitive biodiversity areas across a site.
Visual analysis of the routes plotted and of the observation data suggests that estimates of usage of Open Access Land from the spatial analysis are high, that is, the majority of people do actually follow the general alignments of established routes, and the number of people who wander completely away from paths and tracks is actually quite low.
On the whole, uptake of the new CROW rights in the first 4-5 years has been slow, and awareness is generally poor at this stage. How this develops over the longer term could be monitored with future surveys, possibly at five yearly intervals to track levels of awareness and levels of use.
The results indicate that access use has not changed considerably and for most sites there has been little change in patterns of use. This generally indicates that there is unlikely to have been an effect on the nature conservation/sensitive feature/land management of the site and therefore potentially no significant impact on the biodiversity or bird populations of the site or across access land as a whole and designated sites.
The spatial information gathered for each of the sites will provide an excellent evidence base of spatial visitor use, for Natural England to now make sound judgements when reassessing those sites that have Positive Access Management and /or restrictions to protect biodiversity concerns sites and land management sites.

Faber Maunsell Access Management Report: Three Year Monitoring Surveys at Open Access Land (2006-2008) 112
The survey should be repeated in the future using a survey method as close as possible to the current survey to allow comparisons to be made over time. Ideally, this should be at intervals of (say) 5 years and include the National Parks, so a consistent method is used across all access land. The datasets created about the use of Open Access Sites around the country are a very valuable resource; some of the data, such as that showing where people walked, are not available elsewhere in similar abundance. Much more intelligence can be gained from the data, should NE want to undertake or commission further detailed analysis. Areas that merit further research include:
Isolating the data on people with dogs, so that a better understanding is gained as to how
their patterns of behaviour differ from others. This may assist in deciding how best to target
this user type;
Coastal sites, as this may have relevance to imminent changes in coastal access arising
from implementation of the Marine and Coastal Access Bill;
On designated sites, the search for any links between condition assessments and public
access. There is scope to investigate further the link between management measures applied at sites (e.g. via AMGS), the pattern of visitor behaviour and the indicators of biodiversity health. An example of this is the report produced recently (Asken 2008) examining the effect of public access on the breeding success of hen harriers in the Bowland Fells (which made use of data from the national monitoring survey collected in 2007) and research paper assessing visitor monitoring and modelling on access land across Rombalds Moor, Ilkley, which also used the National Visitor monitoring data to understand the accuracy of the Predictive Site Use Model and understand the effect of restrictions and positive access management (Keane, 2009). The outcomes of this survey, and any further detailed analyses undertaken, may hold valuable lessons for NE site managers contemplating whether or not to dedicate for public access areas of National Nature Reserves which do not all currently carry such rights. When considering applications for built developments that involve its inclusion in residential developments, the preferences of local residents in terms of informal access to green space as expressed in this survey should be taken into account. Similarly, the data may be of value when assessing the impacts of developments that will lead to the loss or major modification of green infrastructure.
The impacts of CROW in terms of biodiversity protection and land management concerns are largely low and on the whole unlikely to have had a significant effect, as the uptake of public access in the first 4 -5 years has been slow and use is not significantly different from the pre CROW situation in the majority of cases.
It is therefore probably too early to evaluate the current restrictions definitively and the recommendation would be to continue to monitor at the most sensitive sites.

Annex 1

Table 1: Key to Local Monitoring Sites shown in Figure 1.3
ID Site Name
1 Avon Heath – Boundary Lane (Dorset Heaths)
2 Avon Heath – Country Park (Dorset Heaths)
3 Blanchland (North Pennines AONB)
4 Bowness Common / Solway Moss (Cumbria)
5 Broad Meadows/ Well Hope (North Pennines AONB)
6 Browns Houses (Lancashire)
7 Bruthwaite Forest /Hallbankgate Side (North Pennines AONB)
8 Cavenham Heath (Suffolk)
9 Coldberry (North Pennines AONB)
10 Coombe Heath / Arne (Dorset Heaths)
11 Crossthwaite Common (incl South) (North Pennines AONB)
12 David‟s Hill (Dorset Heaths)
13 Dewlands Common (Dorset Heaths)
14 Drigg Coast (Cumbria)
15 Dufton / High Cup Nick (North Pennines AONB)
16 Dunwich Heath (Suffolk)
17 Eggardon Hill (Dorset)
18 Ferndown Common (Dorset Heaths)
19 Flinty Fell (North Pennines AONB)
20 Fontmell Down (Dorset)
21 Geltsdale (North Pennines AONB)
22 Great Ovens (Dorset Heaths)
23 Hanbury Tout / Lulworth (Dorset Heaths)
24 Hartside North / South (North Pennines AONB)
25 High Park / Whillimoor Fell (Cumbria)
26 Higher Hill Plush / Nettlescombe (Dorset Heaths)
27 Jenny Brown's Point (Lancashire)
28 Knettishall Common (Suffolk)
29 Lions Hill (Dorset Heaths)
30 Lytchetts (Dorset Heaths)
31 Mickleton Moor (North Pennines AONB)
32 Middleton Teesdale
33 North Walney (Cumbria)
34 Parley (Dorset Heaths)
35 Purbeck Ridge / Godlingston Hill (Dorset)
36 Rotherhope Fell (North Pennines AONB)
37 Snope Common (North Pennines AONB)
40 Stiperstones / Shooting Bay / Knolls CP(Shropshire)
41 Stoborough Heath (Dorset Heaths)
Annex 1
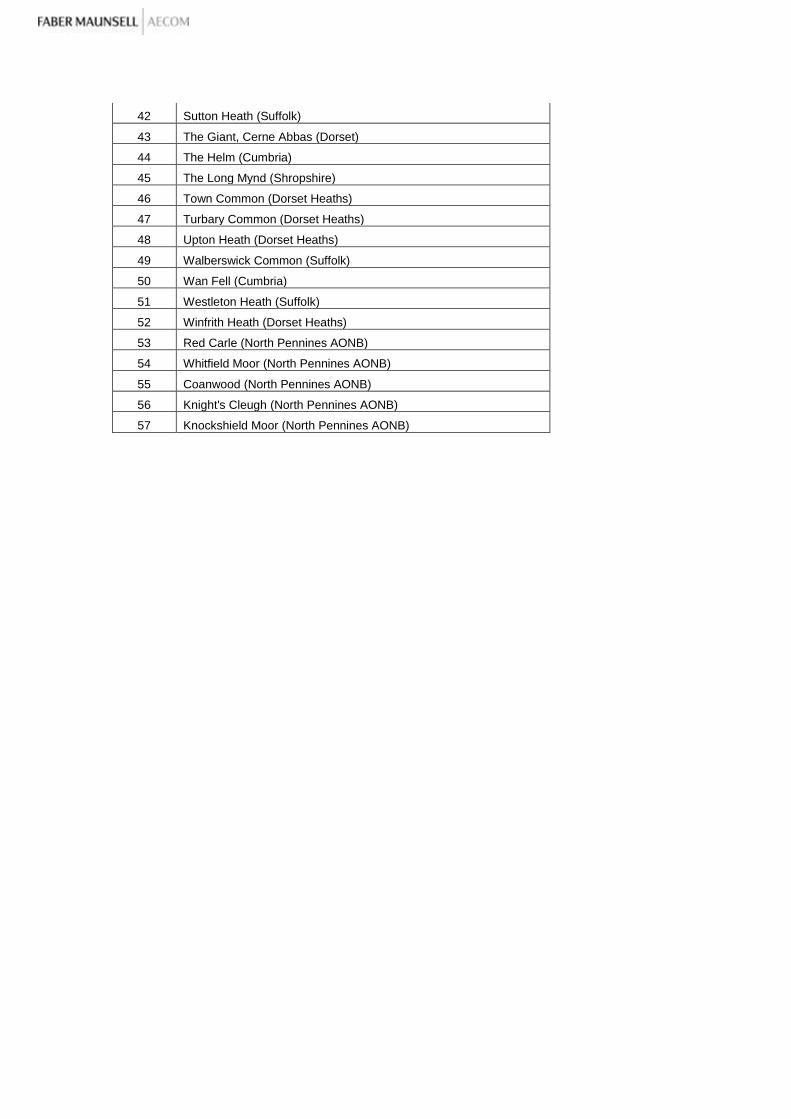
42 Sutton Heath (Suffolk)
43 The Giant, Cerne Abbas (Dorset)
44 The Helm (Cumbria)
45 The Long Mynd (Shropshire)
46 Town Common (Dorset Heaths)
47 Turbary Common (Dorset Heaths)
48 Upton Heath (Dorset Heaths)
49 Walberswick Common (Suffolk)
50 Wan Fell (Cumbria)
51 Westleton Heath (Suffolk)
52 Winfrith Heath (Dorset Heaths)
53 Red Carle (North Pennines AONB)
54 Whitfield Moor (North Pennines AONB)
55 Coanwood (North Pennines AONB)
56 Knight's Cleugh (North Pennines AONB)
57 Knockshield Moor (North Pennines AONB)

Details of the survey periods – Interviews Recorded
Sample Type
Survey Year
2006 2007 2008 Total
Count Count Count Count
National Site June 0 90 121 211
July 0 112 169 281
August 197 117 130 444
September 113 105 89 307
October 0 27 0 27
Total 310 451 509 1270
NCA Site June 0 21 47 68
July 0 58 113 171
August 123 59 86 268
September 54 121 102 277
October 0 46 0 46
Total 177 305 348 830
LM Site January 0 7 32 39
February 0 0 80 80
March 0 0 209 209
April 0 0 7 7
June 0 0 23 23
July 0 34 169 203
August 0 191 285 476
September 0 249 173 422
October 0 347 236 583
November 0 221 133 354
December 0 32 26 58
Total 0 1081 1373 2454
Total January 0 7 32 39
February 0 0 80 80
March 0 0 209 209
April 0 0 7 7
May 0 0 0 0
June 0 111 191 302
July 0 204 451 655
August 320 367 501 1188
September 167 475 364 1006
October 0 420 236 656
November 0 221 133 354
December 0 32 26 58
Total 487 1837 2230 4554

Questionnaires
2006 – National Monitoring Survey Countryside Agency Public Use of Access Land – Visitor Survey
INDICATE POSITION OF INTERVIEW LOCATION
1 On ProW Number of Dogs in group: INPUT SITE
CODE:
2 On Access Land – on a path or
track Number of horses in group:
3 On Access Land – elsewhere Number of mountain bikes: 1 Individual
Record time and date
Number of other bikes: 2 Group
Number of other items, eg wheelchairs/pushchairs:
Number in Group
Interviewer:
Good Morning/afternoon/evening My name is …………………………….from Faber Maunsell. We are conducting a survey on behalf of the Countryside Agency.
The information you provide will help the Agency in improving and managing public access to the
countryside and in providing information about new recreational opportunities to visitors. IF GROUP – Could I ask which of your party is the next person to have a birthday? OR IF GROUP HAS ORGANISER/LEADER – INTERVIEW ORGANISER/LEADER Responses should reflect the individual. Random sampling approach should therefore be adopted – No self selection. If respondent asks how long it will take: Will take around 15 minutes to complete. The surveys are being conducted under the Market Research Society Code of Conduct and any personal information you provide is fully confidential.
Section 1 –Visit to this area of land
The survey is about THIS AREA OF LAND we are currently on, as shown on this map (HAND MAP A) . Unless otherwise instructed responses are unprompted.
Q1.1 About how often do you visit this area of land? one only
1 First visit today GO TO Q1.4
2 Daily 6 Monthly
3 Several times a week 7 Several times a year
4 Weekly 8 Once a year
5 Several times a month 9 Less often
Q1.2 What days and times do you normally visit this area of land? all that apply
Weekdays Saturdays Sundays Repeat “Any more?” until respondent has indicated all times applicable
Early mornings 1 11 21
Mid mornings 2 12 22
Lunchtimes 3 13 23
Afternoon 4 14 24
Evenings 5 15 25
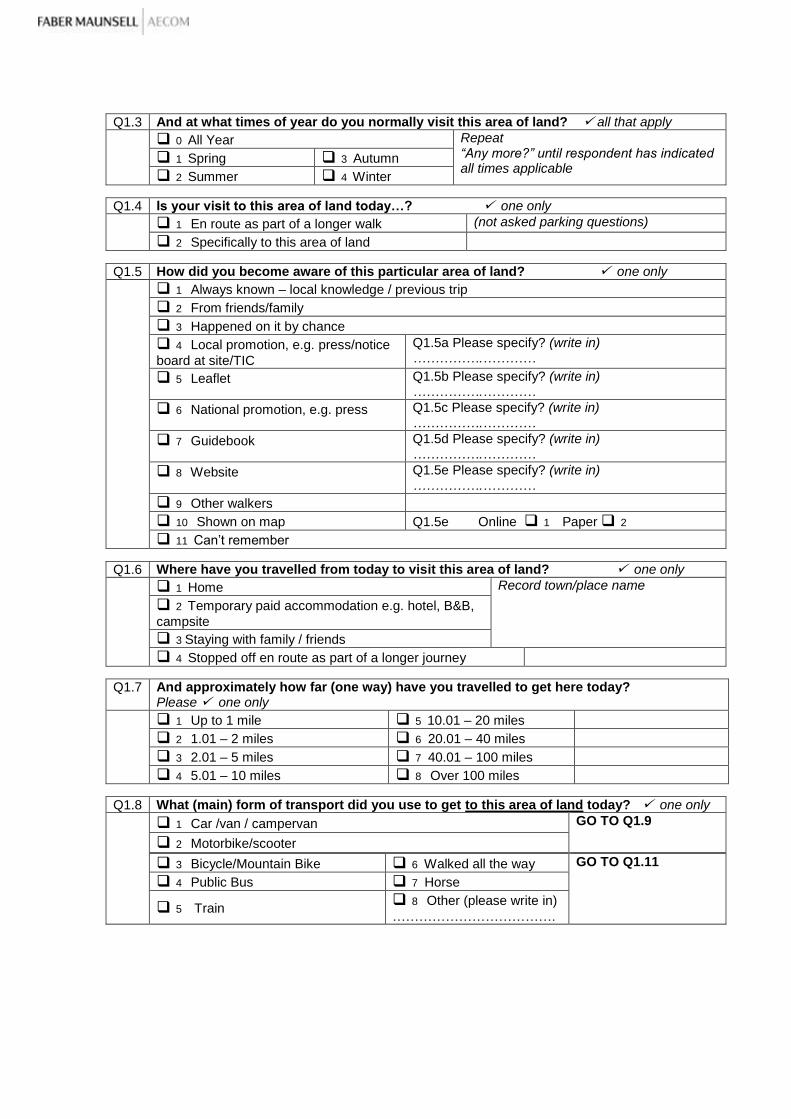
Q1.3 And at what times of year do you normally visit this area of land? all that apply
0 All Year Repeat “Any more?” until respondent has indicated all times applicable
1 Spring 3 Autumn 2 Summer 4 Winter
Q1.4 Is your visit to this area of land today…? one only
1 En route as part of a longer walk (not asked parking questions)
2 Specifically to this area of land
Q1.5 How did you become aware of this particular area of land? one only
1 Always known – local knowledge / previous trip
2 From friends/family
3 Happened on it by chance
4 Local promotion, e.g. press/notice
board at site/TIC
Q1.5a Please specify? (write in) …………….…………
5 Leaflet Q1.5b Please specify? (write in) …………….…………
6 National promotion, e.g. press Q1.5c Please specify? (write in) …………….…………
7 Guidebook Q1.5d Please specify? (write in) …………….…………
8 Website Q1.5e Please specify? (write in) …………….…………
9 Other walkers
10 Shown on map Q1.5e Online 1 Paper 2
11 Can‟t remember
Q1.6 Where have you travelled from today to visit this area of land? one only
1 Home Record town/place name
2 Temporary paid accommodation e.g. hotel, B&B,
campsite
3 Staying with family / friends 4 Stopped off en route as part of a longer journey
Q1.7 And approximately how far (one way) have you travelled to get here today? Please one only
1 Up to 1 mile 5 10.01 – 20 miles
2 1.01 – 2 miles 6 20.01 – 40 miles
3 2.01 – 5 miles 7 40.01 – 100 miles
4 5.01 – 10 miles 8 Over 100 miles
Q1.8 What (main) form of transport did you use to get to this area of land today? one only
1 Car /van / campervan GO TO Q1.9
2 Motorbike/scooter
3 Bicycle/Mountain Bike 6 Walked all the way GO TO Q1.11
4 Public Bus 7 Horse
5 Train 8 Other (please write in)
……………………………….

WHERE CAR USED TO ACCESS SITE ONLY
Q1.9 Where did you park? Please one only
1 Car park by area of land
2 Parking spaces away from area of land
3 On road
4 Off road, not in designated space, e.g. verge, gate, field etc
5 Did not park 6 Other
Q1.10 On a scale of 1 to 5, where 1 is very poor and 5 is very good how would you describe parking arrangements for this area of land in terms of…..? SHOWCARD A Please one for each statement
Very Poor
Poor Neither good
nor poor
Good Very Good
a Condition of surface 1 2 3 4 5
b Danger from passing traffic 1 2 3 4 5
c Signage 1 2 3 4 5
d Capacity of car park 1 2 3 4 5
e Overall parking provision 1 2 3 4 5
Q1.11 On a scale of 1 to 5, where 1 is very poor and 5 is very good how would you describe getting on to this area of land in terms of……? SHOWCARD A ENSURE PEOPLE REFERRING TO LAND SHOWN ON MAP one for each statement
Very Poor Poor
Neither good
nor poor Good Very Good
a Being able to find the area of land 1 2 3 4 5
b Being able to find the entry point to the area of land
1 2 3 4 5
c Accessing the area of land easily without obstructions
1 2 3 4 5
IF Q1.11 (a, b or c) = POOR or VERY POOR:
Q1.12 Which difficulties have you encountered in getting on to this area of land? Please all that apply
1 Overgrown vegetation
2 Locked gate
3 Difficult wall/ fence to climb over
4 Lack of clear signage
5 Other (please write in) …………………………………………….

Section 2
Q2.1 What kinds of information about this area of land would you have found useful prior to your visit today? Unprompted
if None, GO TO Q2.2 Repeat “Any more?” until respondent says no
Not mentioned Slightly useful Very Useful
A Up to date maps - Online 0 1 2
B Up to date maps - Printed 0 1 2
C Information to notify the public that it is open access land
0 1 2
D Where local amenities are 0 1 2
E Information about wildlife in the area 0 1 2
F Extent of Open Access areas 0 1 2
G History of area 0 1 2
H Guides/Routes e.g. climbing, walking distances
0 1 2
I Rules / regulations / restrictions 0 1 2
J Points of interest 0 1 2
K Geography of area 0 1 2
L Travel information / bus times / parking 0 1 2
M Access for people with a disability/people with limited mobility
0 1 2
N Weather forecast 0 1 2
O Other (please write in) …………………………...
0 1 2
Q2.2
What activities are you doing at this area of land today? Please all that apply Unprompted Repeat “Any more?” until respondent says No
1 Short stroll/ambling 7 Rock Climbing
2 Serious walking/rambling/hiking 8 Photography/drawing/painting
3 Dog walking 9 Bike riding
4 Enjoying the scenery/nature 10 Horse riding
5 Running/jogging 11 Bird watching/nature watch/botany
6 Sitting down/resting/picnics 12 Football/ ball games
13 Using my new right of access 14 Other
RECORD
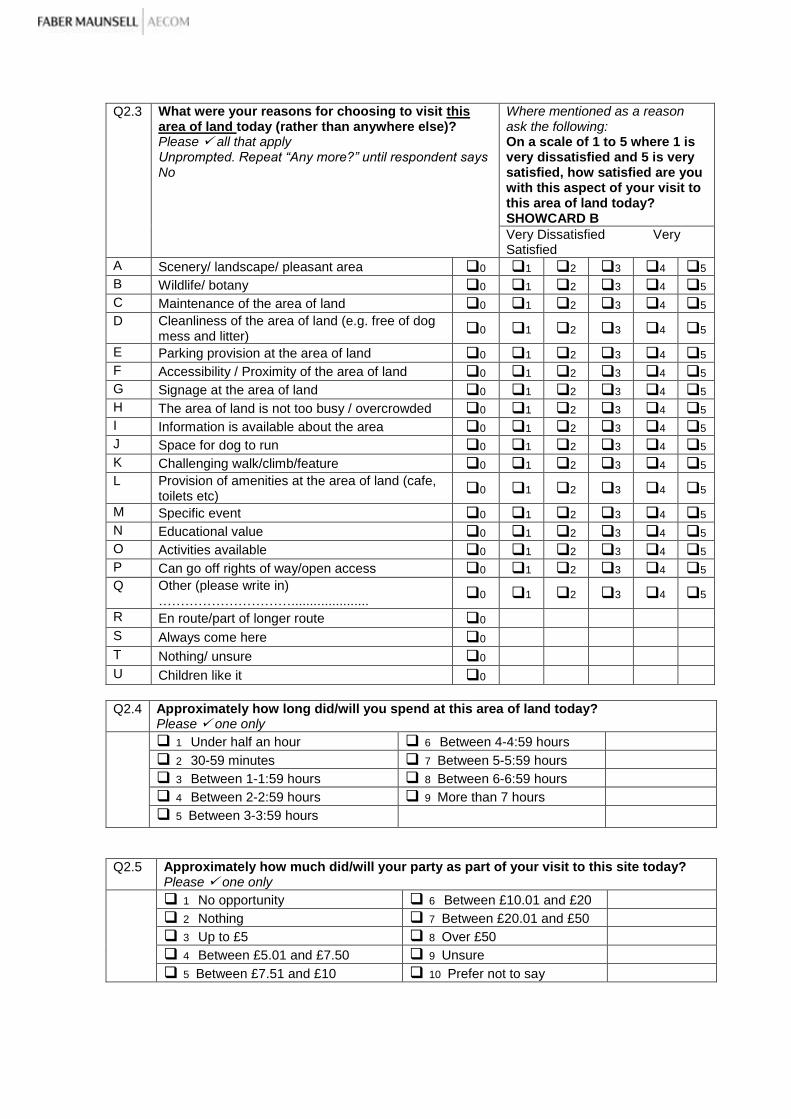
Q2.3 What were your reasons for choosing to visit this area of land today (rather than anywhere else)? Please all that apply Unprompted. Repeat “Any more?” until respondent says No
Where mentioned as a reason ask the following: On a scale of 1 to 5 where 1 is very dissatisfied and 5 is very satisfied, how satisfied are you with this aspect of your visit to this area of land today? SHOWCARD B
Very Dissatisfied Very Satisfied
A Scenery/ landscape/ pleasant area 0 1 2 3 4 5
B Wildlife/ botany 0 1 2 3 4 5
C Maintenance of the area of land 0 1 2 3 4 5
D Cleanliness of the area of land (e.g. free of dog mess and litter) 0 1 2 3 4 5
E Parking provision at the area of land 0 1 2 3 4 5
F Accessibility / Proximity of the area of land 0 1 2 3 4 5
G Signage at the area of land 0 1 2 3 4 5
H The area of land is not too busy / overcrowded 0 1 2 3 4 5
I Information is available about the area 0 1 2 3 4 5
J Space for dog to run 0 1 2 3 4 5
K Challenging walk/climb/feature 0 1 2 3 4 5
L Provision of amenities at the area of land (cafe, toilets etc) 0 1 2 3 4 5
M Specific event 0 1 2 3 4 5
N Educational value 0 1 2 3 4 5
O Activities available 0 1 2 3 4 5
P Can go off rights of way/open access 0 1 2 3 4 5
Q Other (please write in) ………………………….....................
0 1 2 3 4 5
R En route/part of longer route 0 S Always come here 0 T Nothing/ unsure 0 U Children like it 0
Q2.4 Approximately how long did/will you spend at this area of land today? Please one only
1 Under half an hour 6 Between 4-4:59 hours
2 30-59 minutes 7 Between 5-5:59 hours
3 Between 1-1:59 hours 8 Between 6-6:59 hours
4 Between 2-2:59 hours 9 More than 7 hours
5 Between 3-3:59 hours
Q2.5 Approximately how much did/will your party as part of your visit to this site today? Please one only
1 No opportunity 6 Between £10.01 and £20
2 Nothing 7 Between £20.01 and £50
3 Up to £5 8 Over £50
4 Between £5.01 and £7.50 9 Unsure
5 Between £7.51 and £10 10 Prefer not to say

Q2.6 What facilities did you expect to find at this area of land today? Please all that apply Unprompted - Repeat “Any more?” until respondent says No
1 Toilets 8 Café/ refreshments
2 Dog poo bins 9 Picnic tables / seating
3 Rubbish bins 10 Bird hides
4 Car park 11 Information about where
you can and cannot go
5 Visitor centre, info boards
6 Information about the site and
attractions 12 Information about animals
and wildlife on the site
7 Health and safety information
about the site 14 Other (please write in)
………………………….............
Section 3 - Site Awareness
GIS Mapping Showing map of area of land to respondent (combination of paper and PDA), record the following information: Interview location
Interviewee’s Entry Point Route taken (by direction) Interviewee’s Exit point (if known)
Q3.1 Have you heard of Open Access? Please one only
1 Yes
2 No GO TO Q3.3
3 Not sure
For Q3.1, IF = 1 or 3
Q3.2 Are you aware that this area of land is Open Access Land? Please one only
1 Yes
2 No
3 Not sure
Q3.3
To what extent do you believe the following statements about Open Access to be true? SHOWCARD C
Please one per row only
Definitely True
Partially true
Definitely False
Don‟t know
a All farm land has been opened up to the public 1 2 3 4
b All grassland has been opened to the public 1 2 3 4
c People can walk across mapped open access land without the need to stick to paths
1 2 3 4
d You can go off paths if you don't interfere with wildlife
1 2 3 4
e My right of access to open access land may sometimes be restricted for nature conservation/,public safety, and land management reasons
1 2 3 4
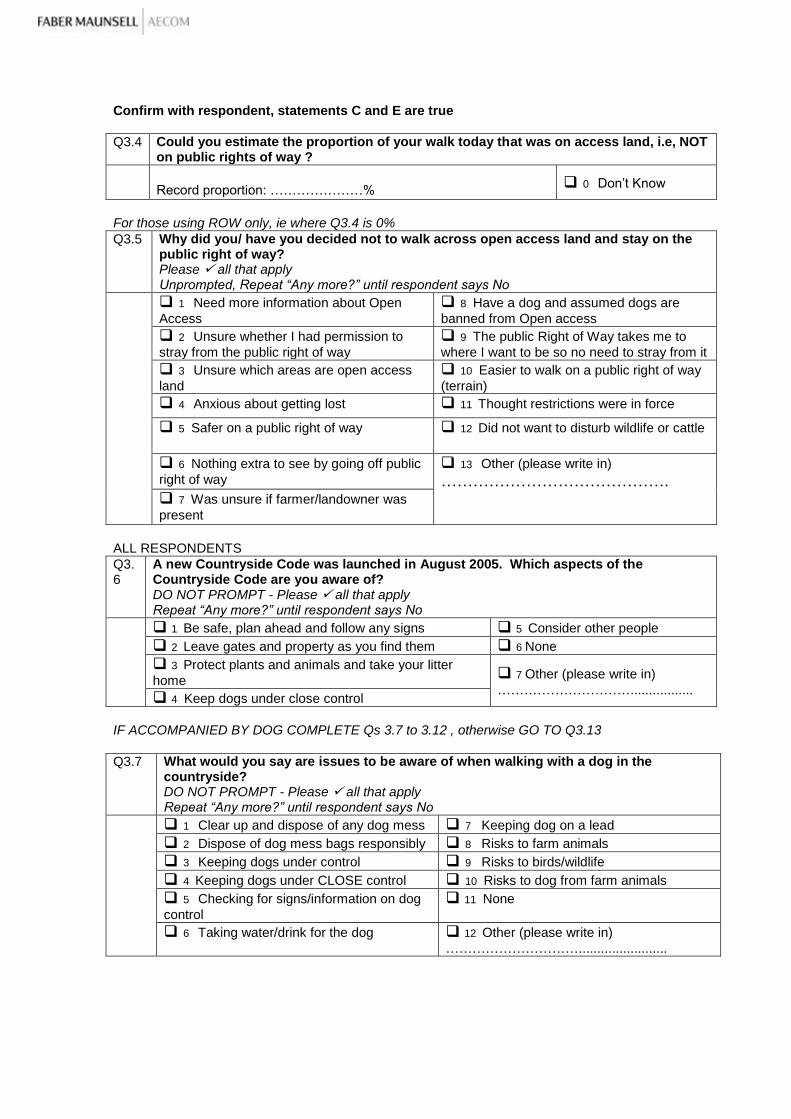
Confirm with respondent, statements C and E are true
Q3.4 Could you estimate the proportion of your walk today that was on access land, i.e, NOT on public rights of way ?
Record proportion: …………………%
0 Don‟t Know
For those using ROW only, ie where Q3.4 is 0%
Q3.5 Why did you/ have you decided not to walk across open access land and stay on the public right of way? Please all that apply Unprompted, Repeat “Any more?” until respondent says No
1 Need more information about Open
Access
8 Have a dog and assumed dogs are
banned from Open access
2 Unsure whether I had permission to
stray from the public right of way
9 The public Right of Way takes me to
where I want to be so no need to stray from it
3 Unsure which areas are open access
land
10 Easier to walk on a public right of way
(terrain)
4 Anxious about getting lost 11 Thought restrictions were in force
5 Safer on a public right of way 12 Did not want to disturb wildlife or cattle
6 Nothing extra to see by going off public
right of way 13 Other (please write in)
……………………………………. 7 Was unsure if farmer/landowner was
present ALL RESPONDENTS
Q3.6
A new Countryside Code was launched in August 2005. Which aspects of the Countryside Code are you aware of? DO NOT PROMPT - Please all that apply Repeat “Any more?” until respondent says No
1 Be safe, plan ahead and follow any signs 5 Consider other people 2 Leave gates and property as you find them 6 None
3 Protect plants and animals and take your litter
home 7 Other (please write in)
…………………………................. 4 Keep dogs under close control
IF ACCOMPANIED BY DOG COMPLETE Qs 3.7 to 3.12 , otherwise GO TO Q3.13
Q3.7 What would you say are issues to be aware of when walking with a dog in the countryside? DO NOT PROMPT - Please all that apply Repeat “Any more?” until respondent says No
1 Clear up and dispose of any dog mess 7 Keeping dog on a lead
2 Dispose of dog mess bags responsibly 8 Risks to farm animals 3 Keeping dogs under control 9 Risks to birds/wildlife
4 Keeping dogs under CLOSE control 10 Risks to dog from farm animals
5 Checking for signs/information on dog
control 11 None
6 Taking water/drink for the dog 12 Other (please write in)
…………………………........................
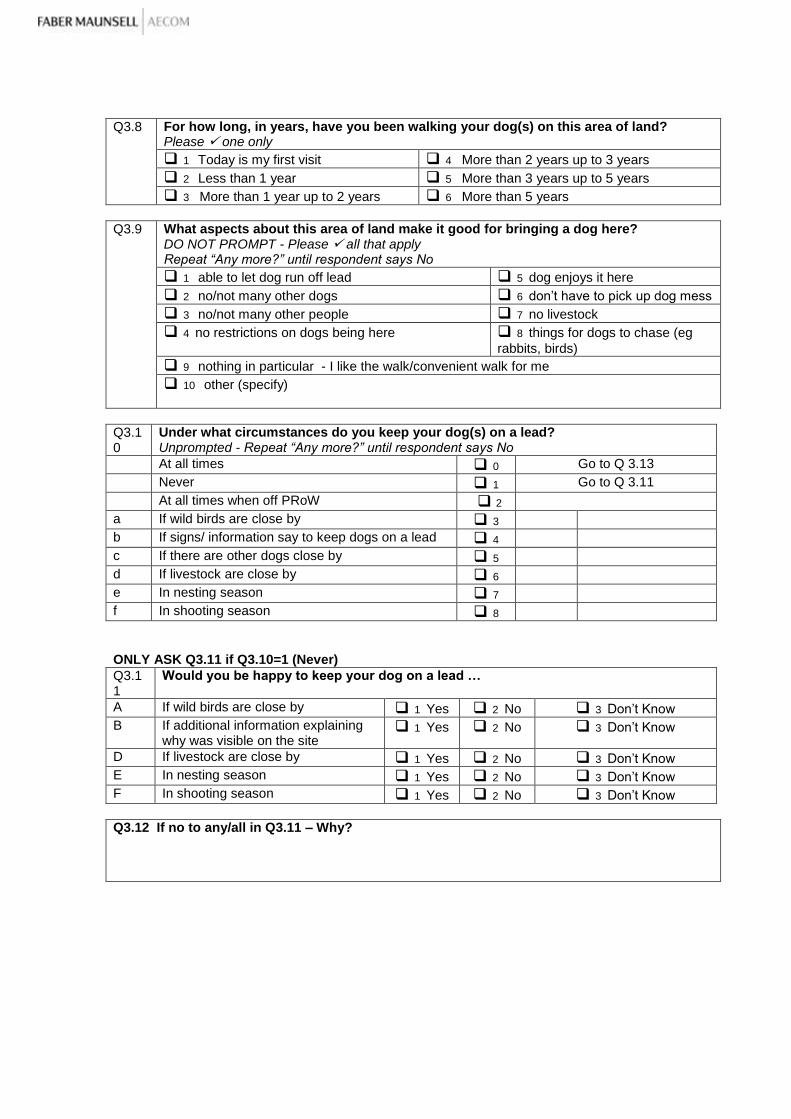
Q3.8 For how long, in years, have you been walking your dog(s) on this area of land? Please one only
1 Today is my first visit 4 More than 2 years up to 3 years
2 Less than 1 year 5 More than 3 years up to 5 years
3 More than 1 year up to 2 years 6 More than 5 years
Q3.9 What aspects about this area of land make it good for bringing a dog here? DO NOT PROMPT - Please all that apply Repeat “Any more?” until respondent says No
1 able to let dog run off lead 5 dog enjoys it here
2 no/not many other dogs 6 don‟t have to pick up dog mess 3 no/not many other people 7 no livestock
4 no restrictions on dogs being here 8 things for dogs to chase (eg
rabbits, birds) 9 nothing in particular - I like the walk/convenient walk for me
10 other (specify)
Q3.10
Under what circumstances do you keep your dog(s) on a lead? Unprompted - Repeat “Any more?” until respondent says No
At all times 0 Go to Q 3.13
Never 1 Go to Q 3.11
At all times when off PRoW 2
a If wild birds are close by 3
b If signs/ information say to keep dogs on a lead 4
c If there are other dogs close by 5
d If livestock are close by 6
e In nesting season 7
f In shooting season 8
ONLY ASK Q3.11 if Q3.10=1 (Never)
Q3.11
Would you be happy to keep your dog on a lead …
A If wild birds are close by 1 Yes 2 No 3 Don‟t Know
B If additional information explaining why was visible on the site
1 Yes 2 No 3 Don‟t Know
D If livestock are close by 1 Yes 2 No 3 Don‟t Know
E In nesting season 1 Yes 2 No 3 Don‟t Know
F In shooting season 1 Yes 2 No 3 Don‟t Know
Q3.12 If no to any/all in Q3.11 – Why?

ALL RESPONDENTS
Q3.13
Are there any types of information or signage you would find useful at this area of land but that have not been seen? UNPROMPTED Repeat “Any more?” until respondent says No
If mentioned, How useful would you find them?
Not mentioned
Slightly useful
Very Useful
a Footpath signs/ Direction sign posts /Finger posts /Waymarkers
0 1 2
b Map / information board 0 1 2
c Danger signs 0 1 2
d Signs or information relating to Open Access 0 1 2
e Distance markers 0 1 2
f Parking signs 0 1 2
g Access point markers 0 1 2
h Suggested walks 0 1 2 i Other 0 1 2
Q3.14 Which of the following sources of publicity would you find most useful in influencing future visits to open access land? SHOWCARD D Please one only
a Local Newspaper 1
b Parish News Articles 2
c National Press - Articles 3
d National TV - programmes 4
e National Radio - programmes 5
f Local TV - programmes 6
g Local Radio - programmes 7
h TV Adverts 8
i Billboards 9
j Other (please specify)
10
Q3.15 Overall, on a scale of 1 to 5 where 1 is very dissatisfied and 5 is very satisfied, how satisfied are you with your visit to this area of land today? SHOWCARD B Please one only
1 Very dissatisfied
2 Dissatisfied
3 Neither satisfied not dissatisfied
4 Satisfied
5 Very Satisfied
Q3.16 Finally, do you have any other comments about your visit to this area of land? Please probe fully (for example any history with the area of land, their experience or expectations etc). Repeat “Any more?” until respondent says No
……………………………………………………………………………………………………………. ……………………………………………………………………………………………………………. …………………………………………………………………………………………………………….
COLLECT MAP BACK FROM RESPONDENT
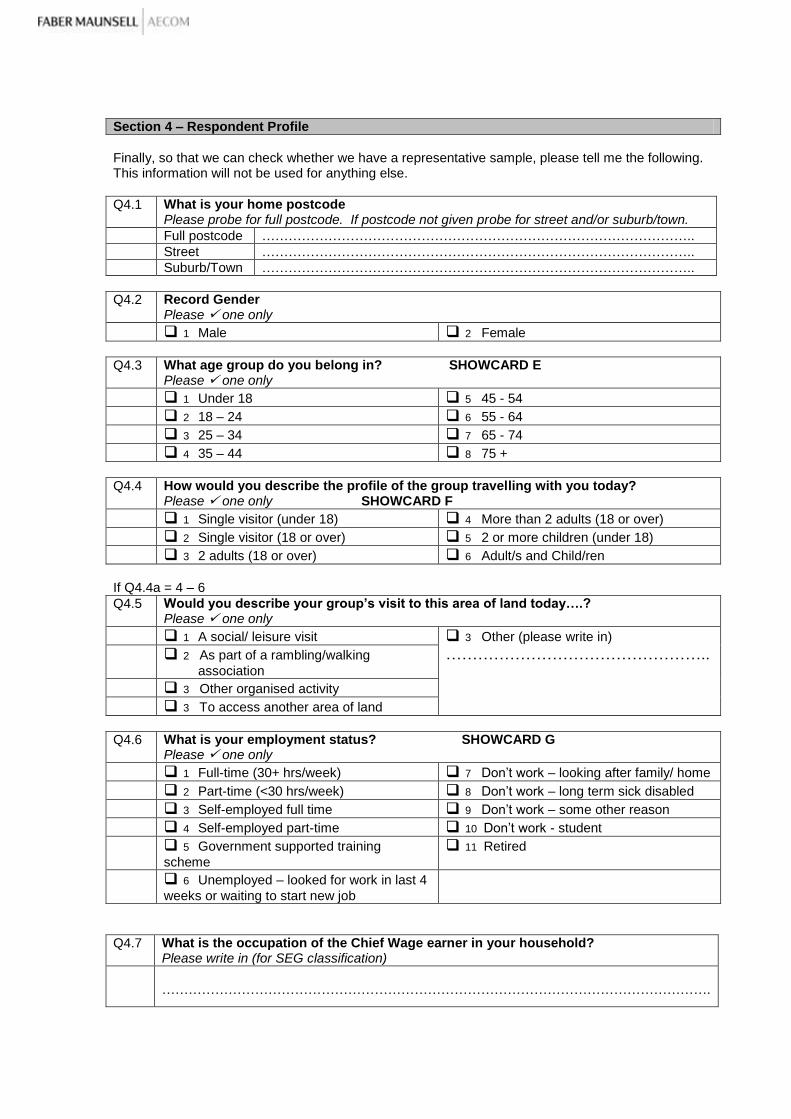
Section 4 – Respondent Profile
Finally, so that we can check whether we have a representative sample, please tell me the following. This information will not be used for anything else.
Q4.1 What is your home postcode Please probe for full postcode. If postcode not given probe for street and/or suburb/town.
Full postcode ……………………………………………………………………………………..
Street ……………………………………………………………………………………..
Suburb/Town ……………………………………………………………………………………..
Q4.2 Record Gender Please one only
1 Male 2 Female
Q4.3 What age group do you belong in? SHOWCARD E Please one only
1 Under 18 5 45 - 54
2 18 – 24 6 55 - 64
3 25 – 34 7 65 - 74
4 35 – 44 8 75 +
Q4.4 How would you describe the profile of the group travelling with you today? Please one only SHOWCARD F
1 Single visitor (under 18) 4 More than 2 adults (18 or over)
2 Single visitor (18 or over) 5 2 or more children (under 18)
3 2 adults (18 or over) 6 Adult/s and Child/ren
If Q4.4a = 4 – 6
Q4.5 Would you describe your group‟s visit to this area of land today….? Please one only
1 A social/ leisure visit 3 Other (please write in)
………………………………………….. 2 As part of a rambling/walking
association 3 Other organised activity 3 To access another area of land
Q4.6 What is your employment status? SHOWCARD G Please one only
1 Full-time (30+ hrs/week) 7 Don‟t work – looking after family/ home
2 Part-time (<30 hrs/week) 8 Don‟t work – long term sick disabled
3 Self-employed full time 9 Don‟t work – some other reason
4 Self-employed part-time 10 Don‟t work - student
5 Government supported training
scheme
11 Retired
6 Unemployed – looked for work in last 4
weeks or waiting to start new job
Q4.7 What is the occupation of the Chief Wage earner in your household? Please write in (for SEG classification)
…………………………………………………………………………………………………………….
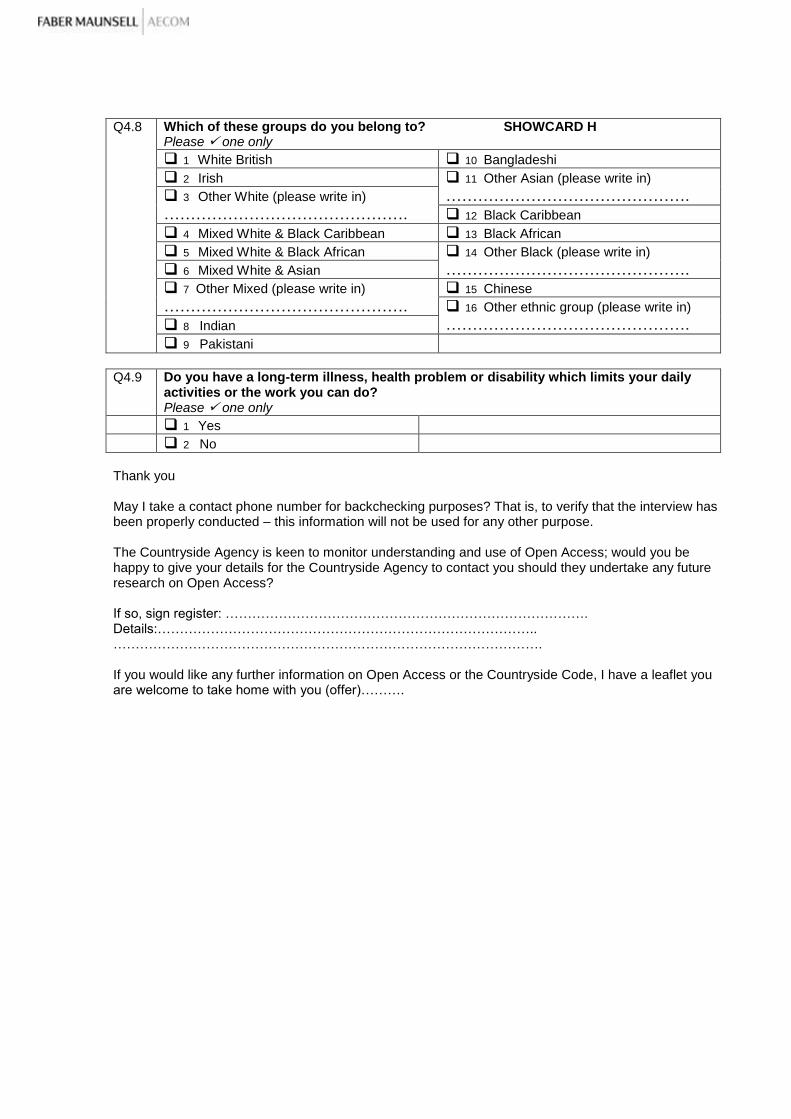
Q4.8 Which of these groups do you belong to? SHOWCARD H Please one only
1 White British 10 Bangladeshi
2 Irish 11 Other Asian (please write in)
………………………………………. 3 Other White (please write in)
………………………………………. 12 Black Caribbean
4 Mixed White & Black Caribbean 13 Black African
5 Mixed White & Black African 14 Other Black (please write in)
………………………………………. 6 Mixed White & Asian
7 Other Mixed (please write in) ……………………………………….
15 Chinese
16 Other ethnic group (please write in)
………………………………………. 8 Indian 9 Pakistani
Q4.9 Do you have a long-term illness, health problem or disability which limits your daily activities or the work you can do? Please one only
1 Yes
2 No
Thank you May I take a contact phone number for backchecking purposes? That is, to verify that the interview has been properly conducted – this information will not be used for any other purpose. The Countryside Agency is keen to monitor understanding and use of Open Access; would you be happy to give your details for the Countryside Agency to contact you should they undertake any future research on Open Access? If so, sign register: ………………………………………………………………………. Details:………………………………………………………………………….. ……………………………………………………………………………………. If you would like any further information on Open Access or the Countryside Code, I have a leaflet you are welcome to take home with you (offer)……….
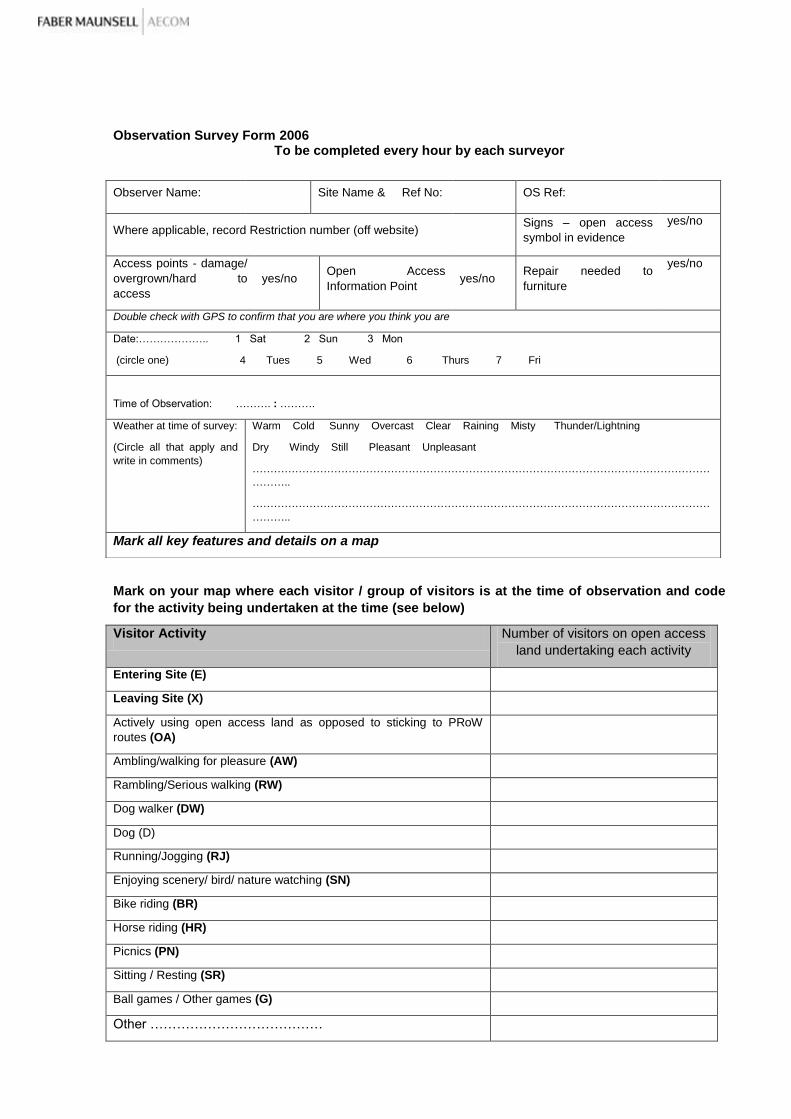
Observation Survey Form 2006 To be completed every hour by each surveyor
Mark on your map where each visitor / group of visitors is at the time of observation and code
for the activity being undertaken at the time (see below)
Visitor Activity Number of visitors on open access
land undertaking each activity
Entering Site (E)
Leaving Site (X)
Actively using open access land as opposed to sticking to PRoW
routes (OA)
Ambling/walking for pleasure (AW)
Rambling/Serious walking (RW)
Dog walker (DW)
Dog (D)
Running/Jogging (RJ)
Enjoying scenery/ bird/ nature watching (SN)
Bike riding (BR)
Horse riding (HR)
Picnics (PN)
Sitting / Resting (SR)
Ball games / Other games (G)
Other …………………………………
Observer Name: Site Name & Ref No: OS Ref:
Where applicable, record Restriction number (off website) Signs – open access
symbol in evidence
yes/no
Access points - damage/
overgrown/hard to
access
yes/no Open Access
Information Point yes/no
Repair needed to
furniture
yes/no
Double check with GPS to confirm that you are where you think you are
Date:……………….. 1 Sat 2 Sun 3 Mon
(circle one) 4 Tues 5 Wed 6 Thurs 7 Fri
Time of Observation: ………. : ……….
Weather at time of survey:
(Circle all that apply and
write in comments)
Warm Cold Sunny Overcast Clear Raining Misty Thunder/Lightning
Dry Windy Still Pleasant Unpleasant
…………………………………………………………………………………………………………………
………..
…………………………………………………………………………………………………………………
………..
Mark all key features and details on a map
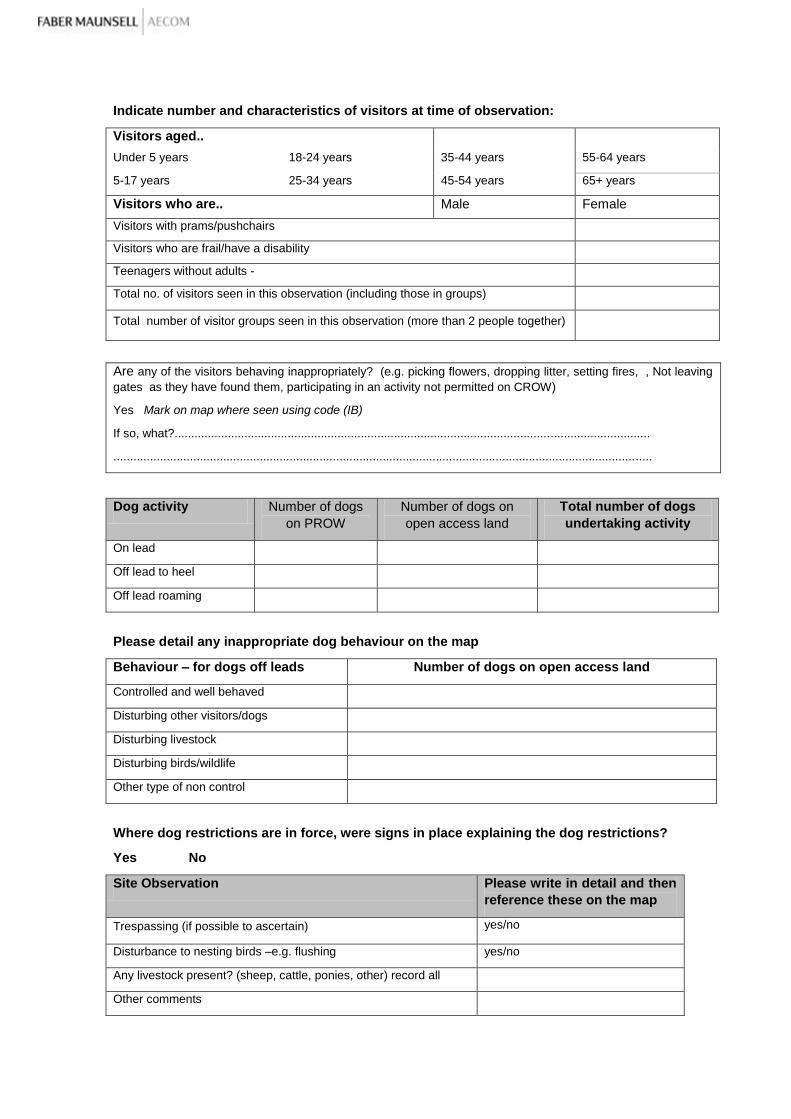
Indicate number and characteristics of visitors at time of observation:
Visitors aged..
Under 5 years 18-24 years 35-44 years 55-64 years
5-17 years 25-34 years 45-54 years 65+ years
Visitors who are.. Male Female
Visitors with prams/pushchairs
Visitors who are frail/have a disability
Teenagers without adults -
Total no. of visitors seen in this observation (including those in groups)
Total number of visitor groups seen in this observation (more than 2 people together)
Are any of the visitors behaving inappropriately? (e.g. picking flowers, dropping litter, setting fires, , Not leaving
gates as they have found them, participating in an activity not permitted on CROW)
Yes Mark on map where seen using code (IB)
If so, what?...............................................................................................................................................
..................................................................................................................................................................
Dog activity Number of dogs
on PROW
Number of dogs on
open access land
Total number of dogs
undertaking activity
On lead
Off lead to heel
Off lead roaming
Please detail any inappropriate dog behaviour on the map
Behaviour – for dogs off leads Number of dogs on open access land
Controlled and well behaved
Disturbing other visitors/dogs
Disturbing livestock
Disturbing birds/wildlife
Other type of non control
Where dog restrictions are in force, were signs in place explaining the dog restrictions?
Yes No
Site Observation Please write in detail and then
reference these on the map
Trespassing (if possible to ascertain) yes/no
Disturbance to nesting birds –e.g. flushing yes/no
Any livestock present? (sheep, cattle, ponies, other) record all
Other comments

2007 – National Monitoring Survey Natural England Public Use of Access Land Visitor Survey Year 2 (2007)
INDICATE POSITION OF INTERVIEW LOCATION ON MAP
1 On Public Right of Way Number of Dogs in group: INPUT SITE
CODE:
2 On Access Land – on an unofficial path
or track Number of horses in group:
3 On Access Land – elsewhere Number of mountain bikes: 1 Individual
Record time: and date:
Number of other bikes: 2 Group
Number of other items, eg wheelchairs/pushchairs:
Number in Group
Interviewer:
1 On Entry 2 Part way
through walk/ visit 3 On Exit
Good Morning/afternoon/evening My name is …………………………….from Faber Maunsell. We are conducting a recreation survey on behalf of Natural England at a number of sites. The information you provide will help improve the provision of public access in the countryside. IF RESPONDENT STATES THEY HAVE ALREADY DONE THE SURVEY LAST YEAR: Because the survey aims to track changes from year to year, the information you give will be of great importance in monitoring changes over time and of great value to the survey. RESPONDENT SELECTION IF GROUP – Could I ask which of your party, the next person to have a birthday is? OR IF GROUP HAS ORGANISER/LEADER – INTERVIEW ORGANISER/LEADER Responses should reflect the individual. Random sampling approach should therefore be adopted – No self selection. If respondent asks how long it will take: Will take around 15 minutes to complete. The surveys are being conducted under the Market Research Society Code of Conduct and any personal information you provide is fully confidential.
Section 1 –Visit to this area of land
To clarify, the survey is about THIS AREA OF LAND we are currently on, as shown on this map (HAND MAP A). Unless otherwise instructed responses are unprompted.
Q1.1 About how often do you visit this area of land? one only
1 First visit today GO TO Q1.4
2 Daily 6 Monthly
3 Several times a week 7 Several times a year
4 Weekly 8 Once a year
5 Several times a month 9 Less often

Q1.2 What days and times do you normally visit this area of land? all that apply
Weekdays Saturdays Sundays Repeat “Any more?” until respondent has indicated all times applicable
Early mornings 1 11 21
Mid mornings 2 12 22
Lunchtimes 3 13 23
Afternoon 4 14 24
Evenings 5 15 25
Q1.3 And at what times of year do you normally visit this area of land? all that apply
0 All Year Repeat “Any more?” until respondent has indicated all times applicable
1 Spring 3 Autumn 2 Summer 4 Winter
Q1.4 How did you become aware of this particular area of land? one only
1 Always known – local knowledge / previous trip
2 From friends/family
3 Happened on it by chance
4 Local promotion, e.g. press/notice
board at site/TIC
Q1.5a Please specify? (write in) …………….……………………………………………
5 Leaflet Q1.5b Please specify? (write in) …………….……………………………………………
6 National promotion, e.g. press Q1.5c Please specify? (write in) …………….……………………………………………
7 Guidebook Q1.5d Please specify? (write in) …………….……………………………………………
8 Website Q1.5e Please specify? (write in) …………….……………………………………………
9 Other walkers
10 Shown on map Q1.5e Online 1 Paper 2
11 Can‟t remember
Q1.5 Where have you travelled from today to visit this area of land? one only
1 Home Record town/place name:
2 Temporary paid accommodation e.g. hotel, B&B, campsite
3 Staying with family / friends 4 Stopped off en route as part of a longer journey
Q1.6 And approximately how far (one way) have you travelled to get here today? Please one only
1 Up to 1 mile 5 10.01 – 20 miles
2 1.01 – 2 miles 6 20.01 – 40 miles
3 2.01 – 5 miles 7 40.01 – 100 miles
4 5.01 – 10 miles 8 Over 100 miles
Q1.7 What (main) form of transport did you use to get to this area of land today? one only
1 Car /van / campervan 5 Train
2 Motorbike/scooter 6 Walked all the way
3 Bicycle/Mountain Bike 7 Horse
4 Public Bus 8 Other (please write in)
………………………………………..

Q1.8 On a scale of 1 to 5, where 1 is very poor and 5 is very good how would you describe getting on to this area of land in terms of……? SHOWCARD A ENSURE PEOPLE ARE REFERRING TO LAND SHOWN ON MAP one for each statement
Very Poor Poor
Neither good nor
poor Good Very Good
A Being able to find the area of land 1 2 3 4 5
B Being able to find the entry point to the area of land
1 2 3 4 5
C Accessing the area of land easily without obstructions
1 2 3 4 5
IF Q1.8 (a, b or c) = POOR or VERY POOR:
Q1.9 Which difficulties have you encountered in getting on to this area of land? Please all that apply
1 Overgrown vegetation
2 Locked gate
3 Difficult wall/ fence to climb over
4 Lack of clear signage
5 Other (please write in)
…………………………………………….…………………………………………….…………….
Section 2 General
Q2.1 What kinds of information about this area of land would you have found useful prior to your visit today? Unprompted
if None, GO TO Q2.2 Repeat “Any more?” until respondent says no
Not mentioned
Slightly useful
Very Useful
A Up to date maps - Online 0 1 2
B Up to date maps - Printed 0 1 2
C Information to notify the public that it is open access land 0 1 2 D Where local amenities are 0 1 2
E Information about wildlife in the area 0 1 2
F Extent of Open Access areas 0 1 2
G History of area 0 1 2
H Guides/Routes e.g. climbing, walking distances 0 1 2
I Rules / regulations / restrictions 0 1 2
J Points of interest 0 1 2
K Geography of area 0 1 2
L Travel information / bus times / parking 0 1 2
M Access for people with a disability/people with limited mobility
0 1 2
N Weather forecast 0 1 2
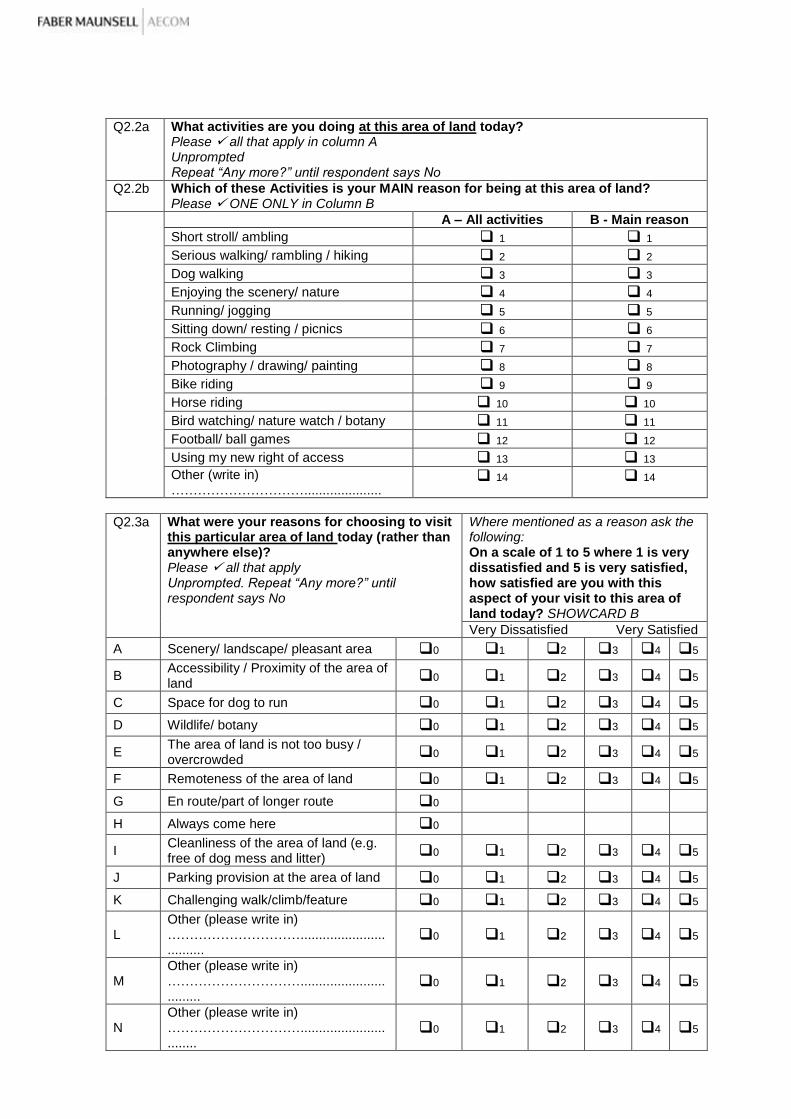
Q2.2a What activities are you doing at this area of land today? Please all that apply in column A Unprompted Repeat “Any more?” until respondent says No
Q2.2b Which of these Activities is your MAIN reason for being at this area of land? Please ONE ONLY in Column B
A – All activities B - Main reason
Short stroll/ ambling 1 1
Serious walking/ rambling / hiking 2 2
Dog walking 3 3
Enjoying the scenery/ nature 4 4
Running/ jogging 5 5
Sitting down/ resting / picnics 6 6
Rock Climbing 7 7
Photography / drawing/ painting 8 8
Bike riding 9 9
Horse riding 10 10
Bird watching/ nature watch / botany 11 11
Football/ ball games 12 12
Using my new right of access 13 13
Other (write in) ………………………….....................
14 14
Q2.3a What were your reasons for choosing to visit this particular area of land today (rather than anywhere else)? Please all that apply Unprompted. Repeat “Any more?” until respondent says No
Where mentioned as a reason ask the following: On a scale of 1 to 5 where 1 is very dissatisfied and 5 is very satisfied, how satisfied are you with this aspect of your visit to this area of land today? SHOWCARD B
Very Dissatisfied Very Satisfied
A Scenery/ landscape/ pleasant area 0 1 2 3 4 5
B Accessibility / Proximity of the area of land 0 1 2 3 4 5
C Space for dog to run 0 1 2 3 4 5
D Wildlife/ botany 0 1 2 3 4 5
E The area of land is not too busy / overcrowded 0 1 2 3 4 5
F Remoteness of the area of land 0 1 2 3 4 5
G En route/part of longer route 0
H Always come here 0
I Cleanliness of the area of land (e.g. free of dog mess and litter) 0 1 2 3 4 5
J Parking provision at the area of land 0 1 2 3 4 5
K Challenging walk/climb/feature 0 1 2 3 4 5
L Other (please write in) ………………………….................................
0 1 2 3 4 5
M Other (please write in) …………………………................................
0 1 2 3 4 5
N Other (please write in) …………………………...............................
0 1 2 3 4 5

Q2.4 Approximately how long did/will you spend at this area of land today? Please one only
1 Under half an hour 6 Between 4-4:59 hours
2 30-59 minutes 7 Between 5-5:59 hours
3 Between 1-1:59 hours 8 Between 6-6:59 hours
4 Between 2-2:59 hours 9 More than 7 hours
5 Between 3-3:59 hours
Q2.5 Approximately how much did/ will your party spend as part of your trip out today (including to this area of land)? (Excluding accommodation and fuel costs, including food/drinks, souvenirs etc, during whole day and evening) Please one only SHOWCARD C
1 No opportunity 6 Between £10.01 and £20
2 Nothing 7 Between £20.01 and £50
3 Up to £5 8 Over £50
4 Between £5.01 and £7.50 9 Unsure
5 Between £7.51 and £10 10 Prefer not to say
Q2.6 What facilities would you want to find at this area of land today? Please all that apply Unprompted - Repeat “Any more?” until respondent says No
1 Toilets 8 Café/ refreshments
2 Dog poo bins 9 Picnic tables / seating
3 Rubbish bins 10 Bird hides
4 Car park 11 Information about where you can and
cannot go 5 Visitor centre, info boards
6 Information about the site and
attractions 12 Information about animals and wildlife on
the site
7 Health and safety information
about the site 13 None
14 Other (please write in)
………………………….............….............…...................
Section 3 Visitor Patterns of Use
Can you please show me on this map:
Where you entered this area of land? Mark with E
Where you will leave the area of land? Mark with X
Where you WALKED? Draw SOLID line, clearly indicating whether on or off PROW
Where you CYCLED? Draw DASHED line, clearly indicating whether on or off PROW
Where you RODE A HORSE? Draw a LINE WITH ARROWS, clearly indicating whether on or off PROW
Where you undertook any other activities (e.g. picnics, games, rock climbing) Mark each activity on map, clearly indicating whether on or off PROW
Record on map where interview is taking place with „I‟ ENSURE MAP IS FULLY ANNOTATED AND MARKED WITH TIME/DATE OF INTERVIEW

Section 4 Site Awareness
Q4.1 SHOWCARD D Have you seen this symbol before? Please one only
1 Yes If Yes - Where?
1 On this site on signs/notices
2 On leaflets
3 In books
4 At other areas of land
5 Other (please write in)
…………………………………………
2 No GO TO Q4.3
3 Not sure
Q4.2 What does the symbol represent? Please all that apply
1 Right to Roam GO TO Q4.4
2 Open Access GO TO Q4.3, THEN Q4.5
3 Other (please write in)
……………………………………………………………………………………………………..
4 Don‟t know
Q4.3 Have you heard of Right to Roam? Please one only
1 Yes 2 No 3 Not sure
Q4.4 Have you heard of Open Access? Please one only
1 Yes 3 Not sure
2 No IF No Read statement below and then GO to Q4.7
If No: Since 2005 this area of land has been designated as Open Access Land. This means people can walk across mapped areas of open access land without the need to stick to paths, though their right of access may sometimes be restricted for nature conservation, public safety, and land management reasons. Go TO Q4.7
Q4.5 Based on your current understanding and awareness of Open Access, do you think each of the following statements are true, false, or don‟t you know? SHOWCARD E Please one per row only
True False Don‟t know
A All farm land has been opened up to the public
1 2 3
B All grassland has been opened to the public
1 2 3
C People can walk across mapped open access land without the need to stick to paths
1 2 3
D My right of access to open access land may sometimes be restricted for nature conservation/,public safety, and/or land management reasons
1 2 3
*Confirm with respondent, statements C and D are true

Q4.6 Are you aware that since 2005 this area of land has been designated as Open Access Land? Please one only
1 Yes 2 No 3 Not sure
ALL ANSWER:
Q4.7 Can you mention any specific restrictions that may apply to Open Access Land? Write in. Probe fully. Record detailed response.
………………………………………………………………………………………………… ………………………………………………………………………………………………………………………………………………………………………………………………………………………………………………………………………………………………………………
Q4.8 For your visit to this area of land today, could you estimate the proportion of your walk/visit that was ...
On a Public Right of Way …………...…% On other unofficial paths or tracks ………………% OFF Public Rights of Way / Paths / Tracks i.e. on access land ………………%
0 Don‟t Know
For those using Public Rights of Way only:
Q4.8a Why have you stayed on Public Rights of Way and not crossed open access land? Please all that apply Unprompted, Repeat “Any more?” until respondent says No
1 Need more information about Open
Access
8 Have a dog and assumed dogs are
banned from Open access
2 Unsure whether I had permission to
stray from the public right of way
9 The public Right of Way takes me to
where I want to be so no need to stray from it
3 Unsure which areas are open access
land
10 Easier to walk on a public right of
way (terrain)
4 Anxious about getting lost 11 Thought restrictions were in force
5 Safer on a public right of way 12 Did not want to disturb wildlife or
cattle
6 Nothing extra to see by going off public
right of way 13 Other (please write in)
……………………………………. 7 Was unsure if farmer/landowner was
present
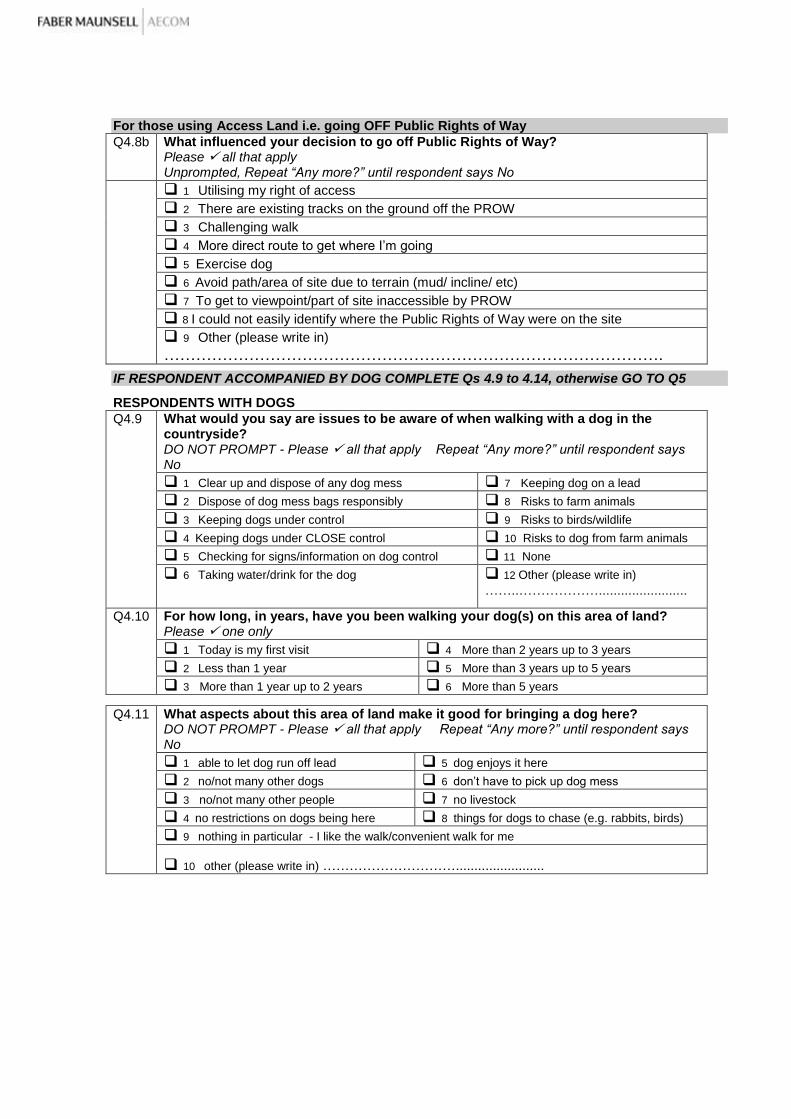
For those using Access Land i.e. going OFF Public Rights of Way
Q4.8b What influenced your decision to go off Public Rights of Way? Please all that apply Unprompted, Repeat “Any more?” until respondent says No
1 Utilising my right of access
2 There are existing tracks on the ground off the PROW 3 Challenging walk
4 More direct route to get where I‟m going
5 Exercise dog 6 Avoid path/area of site due to terrain (mud/ incline/ etc) 7 To get to viewpoint/part of site inaccessible by PROW 8 I could not easily identify where the Public Rights of Way were on the site
9 Other (please write in)
………………………………………………………………………………….
IF RESPONDENT ACCOMPANIED BY DOG COMPLETE Qs 4.9 to 4.14, otherwise GO TO Q5
RESPONDENTS WITH DOGS
Q4.9 What would you say are issues to be aware of when walking with a dog in the countryside? DO NOT PROMPT - Please all that apply Repeat “Any more?” until respondent says No
1 Clear up and dispose of any dog mess 7 Keeping dog on a lead
2 Dispose of dog mess bags responsibly 8 Risks to farm animals 3 Keeping dogs under control 9 Risks to birds/wildlife
4 Keeping dogs under CLOSE control 10 Risks to dog from farm animals
5 Checking for signs/information on dog control 11 None
6 Taking water/drink for the dog 12 Other (please write in)
……..………………........................
Q4.10 For how long, in years, have you been walking your dog(s) on this area of land? Please one only
1 Today is my first visit 4 More than 2 years up to 3 years
2 Less than 1 year 5 More than 3 years up to 5 years
3 More than 1 year up to 2 years 6 More than 5 years
Q4.11 What aspects about this area of land make it good for bringing a dog here? DO NOT PROMPT - Please all that apply Repeat “Any more?” until respondent says No
1 able to let dog run off lead 5 dog enjoys it here
2 no/not many other dogs 6 don‟t have to pick up dog mess 3 no/not many other people 7 no livestock
4 no restrictions on dogs being here 8 things for dogs to chase (e.g. rabbits, birds) 9 nothing in particular - I like the walk/convenient walk for me
10 other (please write in) …………………………........................

Q4.12 Under what circumstances do you keep your dog(s) on a lead at this site? Unprompted - Repeat “Any more?” until respondent says No
At all times 0 Go to Q 5
Never 1 Go to Q 4.13
At all times when off PRoW 2
If wild birds are close by 3
If signs/ information say to keep dogs on a lead 4
If there are other dogs close by 5
If livestock are close by 6
In bird breeding season 7
In shooting season 8
ONLY ASK Q4.13 if Q4.12=1 (Never)
Q4.13 Would you be happy to keep your dog on a lead …
A If wild birds are close by 1 Yes 2 No 3 Don‟t Know
B If additional information explaining why was visible on the site
1 Yes 2 No 3 Don‟t Know
D If livestock are close by 1 Yes 2 No 3 Don‟t Know
E In bird breeding season 1 Yes 2 No 3 Don‟t Know
F In shooting season 1 Yes 2 No 3 Don‟t Know
Q4. 14 If no to any/all in Q4.13 – Why?
Section 5 Information and Signage
ALL RESPONDENTS
Q5 What types of information or signage have you found useful at this area of land today? (tick all that apply)
Not seen any signage or information 0
Footpath signs/ Direction sign posts /Finger posts /Way markers 1 Map / information board 2 Danger signs 3
Signs/information relating to Open Access 4
Suggested walks 5
Open Access Symbol 6
Distance markers 7
Access point markers 8
Other information or signage (please write in) ………………………………….………………………………….
9

Q5.1 Which of the following sources of publicity would you find most useful in influencing future visits to open access land? SHOWCARD E Please all that apply
Publicity Please specify
A Local Newspaper 1
B Parish News Articles 2
C National Newspapers – Articles 3
D National TV – programmes 4
E National Radio – programmes 5
F Local TV – programmes 6
G Local Radio – programmes 7
H TV Adverts 8
I Billboards 9
J Internet 10 K Magazines 11 L Membership organisations 12 K Other (please specify)
13
Section 6 Satisfaction
Q6 Overall, on a scale of 1 to 5 where 1 is very dissatisfied and 5 is very satisfied, how satisfied are you with your visit to this area of land today? SHOWCARD B Please one only
1 Very dissatisfied Ask why dissatisfied – record at Q6.2
2 Dissatisfied
3 Neither satisfied not dissatisfied
4 Satisfied 5 Very Satisfied
Q6.1 To what extent did the need to get exercise feature in your decision to visit the countryside today? SHOWCARD F Please one only
1 Not at all 2 To some extent 3 To a large extent
Q6.2 Finally, do you have any other comments about your visit to this area of land? Please probe fully (for example any history with the area of land, their experience or expectations, parking issues etc). Repeat “Any more?” until respondent says No
……………………………………………………………………………………………………………. ……………………………………………………………………………………………………………. …………………………………………………………………………………………………………….
COLLECT MAP BACK FROM RESPONDENT
Section 7 – Respondent Profile
Finally, so that we can check whether we have a representative sample, please tell me the following. This information will not be used for anything else.
Q7 What is your home postcode Please probe for full postcode. If postcode not given probe for street and/or suburb/town.
Full postcode ……………………………………………………………………………………..
Street ……………………………………………………………………………………..
Suburb/Town ……………………………………………………………………………………..

Q7.1 Record Gender Please one only
1 Male 2 Female
Q7.2 What age group do you belong in? SHOWCARD G Please one only
1 Under 18 5 45 - 54
2 18 – 24 6 55 - 64
3 25 – 34 7 65 - 74
4 35 – 44 8 75 +
Q7.3 How would you describe the profile of the group travelling with you today? Please one only SHOWCARD H
1 Single visitor (under 18) 4 More than 2 adults (18 or over)
2 Single visitor (18 or over) 5 2 or more children (under 18)
3 2 adults (18 or over) 6 Adult/s and Child/ren
Q7.4 Would you describe your group‟s visit to this area of land today….? Please one only
1 A social/ leisure visit
2 As part of a rambling/walking association or other club/group
Which one? …………………….. 3 Other organised activity: What? ……………………………………………….. 4 To access another area of land 5 Other (please write in)
…………………………………………..
Q7.5 What is your employment status? SHOWCARD I Please one only
1 Full-time (30+ hrs/week) 7 Don‟t work – looking after family/
home
2 Part-time (<30 hrs/week) 8 Don‟t work – long term sick
disabled
3 Self-employed full time 9 Don‟t work – some other reason
4 Self-employed part-time 10 Don‟t work - student
5 Government supported training scheme 11 Retired
6 Unemployed – looked for work in last 4
weeks or waiting to start new job
Q7.6 What is the occupation of the Chief Wage earner in your household? Please write in (for SEG classification)
…………………………………………………………………………………………………………….

Q7.8 Which of these groups do you belong to? SHOWCARD J Please one only
1 White British 10 Bangladeshi
2 Irish 11 Other Asian (please write in)
………………………………………. 3 Other White (please write in)
………………………………………. 12 Black Caribbean
4 Mixed White & Black Caribbean 13 Black African
5 Mixed White & Black African 14 Other Black (please write in)
………………………………………. 6 Mixed White & Asian
7 Other Mixed (please write in) ……………………………………….
15 Chinese
16 Other ethnic group (please write in)
………………………………………. 8 Indian 9 Pakistani
Q7.9 Do you have a long-term illness, health problem or disability which limits your daily activities or the work you can do? Please one only
1 Yes
2 No
Thank you, May I take a contact phone number for back checking purposes? That is, to verify that the interview has been properly conducted – this information will not be used for any other purpose. Natural England is keen to monitor understanding and use of Open Access; would you be happy to give your details for Natural England to contact you should they undertake any future research on Open Access? If so, sign: …………………………………………………………………………….………….……………. Name: …………………………………………………………………………….………….………………… Address:…………………………………………………………………………………….………….………. …………………………………………………………………………………….……….………….………… …………………………………………………………………………….………….……….………….……… If you would like any further information on Open Access, I have a leaflet you are welcome to take home with you (offer)……….
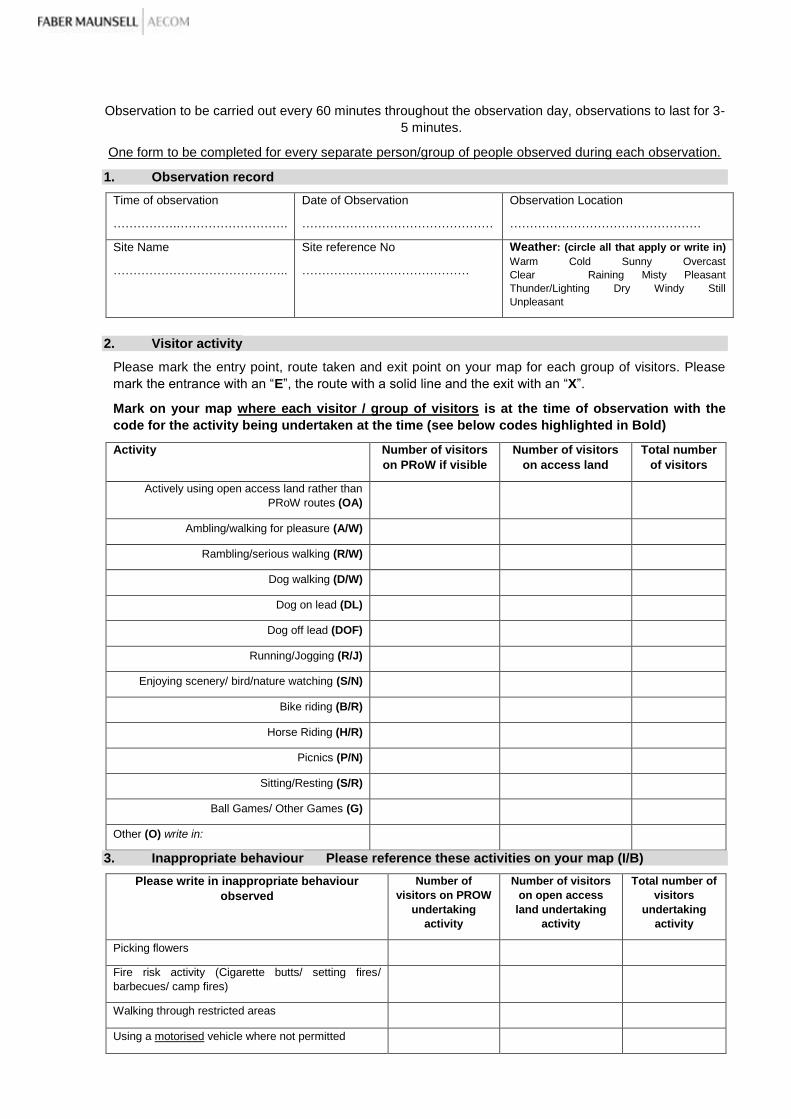
Observation to be carried out every 60 minutes throughout the observation day, observations to last for 3-
5 minutes.
One form to be completed for every separate person/group of people observed during each observation.
1. Observation record
Time of observation
…………….……………………….
Date of Observation
…………………………………………
Observation Location
…………………………………………
Site Name
……………………………………..
Site reference No
……………………………………
Weather: (circle all that apply or write in)
Warm Cold Sunny Overcast
Clear Raining Misty Pleasant
Thunder/Lighting Dry Windy Still
Unpleasant
2. Visitor activity
Please mark the entry point, route taken and exit point on your map for each group of visitors. Please
mark the entrance with an “E”, the route with a solid line and the exit with an “X”.
Mark on your map where each visitor / group of visitors is at the time of observation with the
code for the activity being undertaken at the time (see below codes highlighted in Bold)
Activity Number of visitors
on PRoW if visible
Number of visitors
on access land
Total number
of visitors
Actively using open access land rather than
PRoW routes (OA)
Ambling/walking for pleasure (A/W)
Rambling/serious walking (R/W)
Dog walking (D/W)
Dog on lead (DL)
Dog off lead (DOF)
Running/Jogging (R/J)
Enjoying scenery/ bird/nature watching (S/N)
Bike riding (B/R)
Horse Riding (H/R)
Picnics (P/N)
Sitting/Resting (S/R)
Ball Games/ Other Games (G)
Other (O) write in:
3. Inappropriate behaviour Please reference these activities on your map (I/B)
Please write in inappropriate behaviour
observed
Number of
visitors on PROW
undertaking
activity
Number of visitors
on open access
land undertaking
activity
Total number of
visitors
undertaking
activity
Picking flowers
Fire risk activity (Cigarette butts/ setting fires/
barbecues/ camp fires)
Walking through restricted areas
Using a motorised vehicle where not permitted

Using a non-motorised vehicle where not permitted
Disturbing nesting birds (flushing)
Other
4. Dog activity and adherence to any restrictions in place
Activity / Behaviour Number of
dogs on Rights
of Way
undertaking
each activity
Number of
dogs on open
access land
where dogs
allowed
Number of dogs
on open access
land where dogs
are excluded
Total number of
dogs
undertaking
activity
On lead
Off lead to heel
Off lead roaming
Controlled and well behaved (i.e.
responsive to commands where
given)
Uncontrolled and poorly
behaved (i.e. unresponsive to
commands where given)
Disturbing other visitors/dogs
Disturbing livestock
Disturbing birds/wildlife
Other type of non control
5. Use of Site Signage, Information and Access Infrastructure
Use of Signage and information (visibly stopping to observe or read - please detail on map)
Open Access Symbol (OA/S)
Open Access Restrictions notice (OA/R)
Open Access management information (advisory) (OA/M)
Open Access information point (OA/IP)
Other (Please detail) …………………………………………………………………………………………………………………………………………………………… …………………………………………………………………………………………………………………………………………………………… ……………………………………………………………………………………………………………………………………………………………
Use of Site Access Infrastructure (Please detail on map)
Stile (S)
Gate (G)
Kissing Gate (KG)
Car Park (CP)
Other (Please detail) …………………………………………………………………………………………………………………………………………………………… …………………………………………………………………………………………………………………………………………………………… ………………………………………………………………………………………………………………………………………………
……………
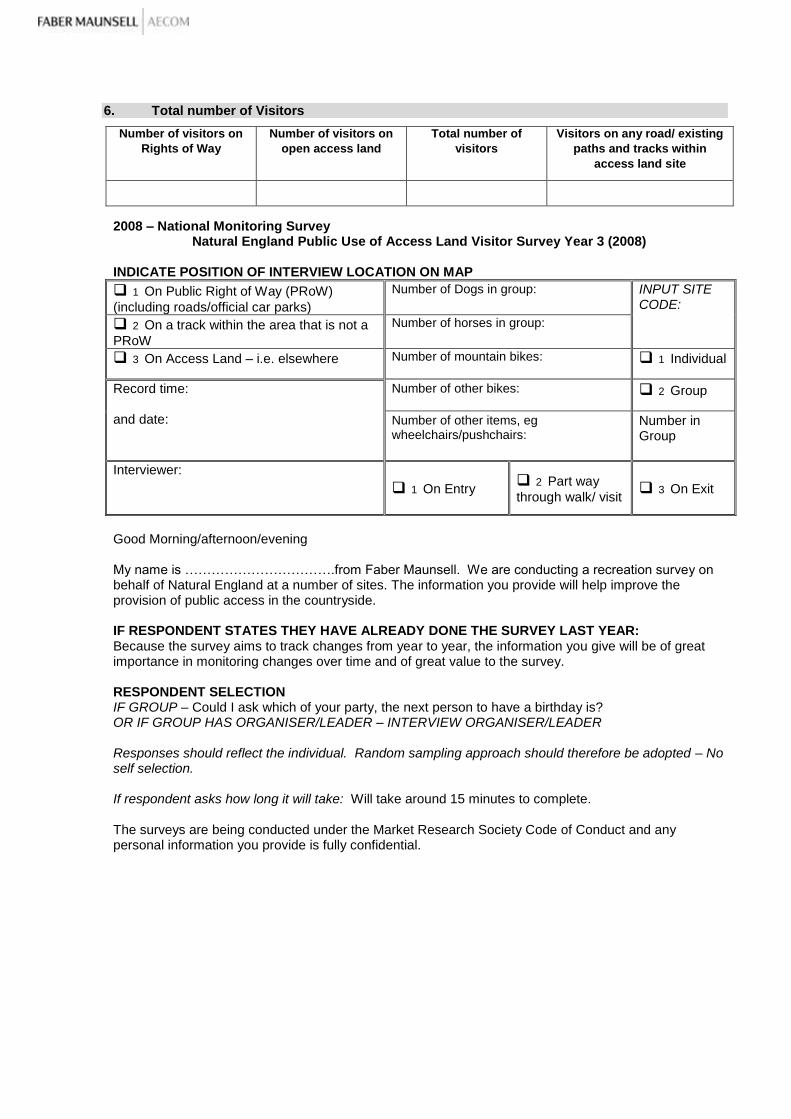
6. Total number of Visitors
Number of visitors on
Rights of Way
Number of visitors on
open access land
Total number of
visitors
Visitors on any road/ existing
paths and tracks within
access land site
2008 – National Monitoring Survey Natural England Public Use of Access Land Visitor Survey Year 3 (2008)
INDICATE POSITION OF INTERVIEW LOCATION ON MAP
1 On Public Right of Way (PRoW)
(including roads/official car parks)
Number of Dogs in group: INPUT SITE CODE:
2 On a track within the area that is not a
PRoW Number of horses in group:
3 On Access Land – i.e. elsewhere Number of mountain bikes: 1 Individual
Record time: and date:
Number of other bikes: 2 Group
Number of other items, eg wheelchairs/pushchairs:
Number in Group
Interviewer:
1 On Entry 2 Part way
through walk/ visit 3 On Exit
Good Morning/afternoon/evening My name is …………………………….from Faber Maunsell. We are conducting a recreation survey on behalf of Natural England at a number of sites. The information you provide will help improve the provision of public access in the countryside. IF RESPONDENT STATES THEY HAVE ALREADY DONE THE SURVEY LAST YEAR: Because the survey aims to track changes from year to year, the information you give will be of great importance in monitoring changes over time and of great value to the survey. RESPONDENT SELECTION IF GROUP – Could I ask which of your party, the next person to have a birthday is? OR IF GROUP HAS ORGANISER/LEADER – INTERVIEW ORGANISER/LEADER Responses should reflect the individual. Random sampling approach should therefore be adopted – No self selection. If respondent asks how long it will take: Will take around 15 minutes to complete. The surveys are being conducted under the Market Research Society Code of Conduct and any personal information you provide is fully confidential.

Section 1 –Visit to this area of land
To clarify, the survey is about THIS AREA OF LAND we are currently on, as shown on this map (HAND MAP A). Unless otherwise instructed responses are unprompted.
Q1.1 About how often do you visit this area of land? one only
1 First visit today GO TO Q1.4
2 Daily 6 Monthly
3 Several times a week 7 Several times a year
4 Weekly 8 Once a year
5 Several times a month 9 Less often
Q1.2 What days and times do you normally visit this area of land? all that apply
Weekdays Saturdays Sundays Repeat “Any more?” until respondent has indicated all times applicable
Early mornings 1 11 21
Mid mornings 2 12 22
Lunchtimes 3 13 23
Afternoon 4 14 24
Evenings 5 15 25
Q1.3 And at what times of year do you normally visit this area of land? all that apply
0 All Year Repeat “Any more?” until respondent has indicated all times applicable
1 Spring 3 Autumn 2 Summer 4 Winter
Q1.4 How did you become aware of this particular area of land? one only
1 Always known – local knowledge / previous trip
2 From friends/family
3 Happened on it by chance
4 Local promotion, e.g.
press/notice board at site/TIC
Q1.4a Please specify? (write in) …………….……………………………………………
5 Leaflet Q1.4b Please specify? (write in) …………….……………………………………………
6 National promotion, e.g. press Q1.4c Please specify? (write in) …………….……………………………………………
7 Guidebook Q1.4d Please specify? (write in) …………….……………………………………………
8 Website Q1.4e Please specify? (write in) …………….……………………………………………
9 Other walkers
10 Shown on map Q1.4f Online 1 Paper 2
11 Can‟t remember
Q1.5 Where have you travelled from today to visit this area of land? one only
1 Home Record town/place name:
2 Temporary paid accommodation e.g. hotel, B&B, campsite
3 Staying with family / friends 4 Stopped off en route as part of a longer journey

Q1.6 And approximately how far (one way) have you travelled to get here today? Please one only
1 Up to 1 mile 5 10.01 – 20 miles
2 1.01 – 2 miles 6 20.01 – 40 miles
3 2.01 – 5 miles 7 40.01 – 100 miles
4 5.01 – 10 miles 8 Over 100 miles
Q1.7 What (main) form of transport did you use to get to this area of land today? one only
1 Car /van / campervan 5 Train
2 Motorbike/scooter 6 Walked all the way
3 Bicycle/Mountain Bike 7 Horse
4 Public Bus 8 Other (please write in)
………………………………………..
Q1.8 On a scale of 1 to 5, where 1 is very poor and 5 is very good how would you describe getting on to this area of land in terms of……? SHOWCARD A ENSURE PEOPLE ARE REFERRING TO LAND SHOWN ON MAP one for each statement
Very Poor Poor
Neither good nor
poor Good Very Good
A Being able to find the area of land 1 2 3 4 5
B Being able to find the entry point to the area of land
1 2 3 4 5
C Accessing the area of land easily without obstructions
1 2 3 4 5
IF Q1.8 (A, B or C) = POOR or VERY POOR:
Q1.9 Which difficulties have you encountered in getting on to this area of land? Please all that apply
1 Overgrown vegetation
2 Locked gate
3 Difficult wall/ fence to climb over
4 Lack of clear signage
5 Other (please write in)
…………………………………………….…………………………………………….…………….

Section 2 General
Q2.1 What kinds of information about this area of land would you have found useful prior to your visit today? Unprompted
if None, GO TO Q2.2 Repeat “Any more?” until respondent says no
Not mentioned Slightly useful
Very Useful
A Up to date maps - Online 0 1 2
B Up to date maps - Printed 0 1 2
C Information to notify the public that it is open access land
0 1 2
D Where local amenities are 0 1 2
E Information about wildlife in the area 0 1 2
F Extent of Open Access areas 0 1 2
G History of area 0 1 2
H Guides/Routes e.g. climbing, walking distances 0 1 2
I Rules / regulations / restrictions 0 1 2
J Points of interest 0 1 2
K Geography of area 0 1 2
L Travel information / bus times / parking 0 1 2
M Access for people with a disability/people with limited mobility
0 1 2
N Weather forecast 0 1 2
Q2.2a What activities are you doing at this area of land today? Please all that apply in column A Unprompted Repeat “Any more?” until respondent says No
Q2.2b Which of these Activities is your MAIN reason for being at this area of land? Please ONE ONLY in Column B
A – All activities B - Main reason
Short stroll/ ambling 1 1
Serious walking/ rambling / hiking 2 2
Dog walking 3 3
Enjoying the scenery/ nature 4 4
Running/ jogging 5 5
Sitting down/ resting / picnics 6 6
Rock Climbing 7 7
Photography / drawing/ painting 8 8
Bike riding 9 9
Horse riding 10 10
Bird watching/ nature watch / botany 11 11
Football/ ball games 12 12
Using my new right of access 13 13
Other (write in) ………………………….....................
14 14
Q2.3a
What were your reasons for choosing to visit this particular area of land today (rather than anywhere else)? Please all that apply
Where mentioned as a reason ask the following: On a scale of 1 to 5 where 1 is very dissatisfied and 5 is very satisfied,

Unprompted. Repeat “Any more?” until respondent says No
how satisfied are you with this aspect of your visit to this area of land today? SHOWCARD B
Very Dissatisfied Very Satisfied
A Scenery/ landscape/ pleasant area 0 1 2 3 4 5
B Accessibility / Proximity of the area of land 0 1 2 3 4 5
C Space for dog to run 0 1 2 3 4 5
D Wildlife/ botany 0 1 2 3 4 5
E The area of land is not too busy / overcrowded 0 1 2 3 4 5
F Remoteness of the area of land 0 1 2 3 4 5
G En route/part of longer route 0
H Always come here 0
I Cleanliness of the area of land (e.g. free of dog mess and litter) 0 1 2 3 4 5
J Parking provision at the area of land 0 1 2 3 4 5
K Challenging walk/climb/feature 0 1 2 3 4 5
L Other (please write in) ………………………….................................
0 1 2 3 4 5
M Other (please write in) …………………………................................
0 1 2 3 4 5
N Other (please write in) …………………………...............................
0 1 2 3 4 5
Q2.4 Approximately how long did/will you spend at this area of land today? Please one only
1 Under half an hour 6 Between 4-4:59 hours
2 30-59 minutes 7 Between 5-5:59 hours
3 Between 1-1:59 hours 8 Between 6-6:59 hours
4 Between 2-2:59 hours 9 More than 7 hours
5 Between 3-3:59 hours
Q2.5 Approximately how much did/ will your party spend as part of your trip out today (including to this area of land)? (Excluding accommodation and fuel costs, including food/drinks, souvenirs etc, during whole day and evening) Please one only SHOWCARD C
1 No opportunity 6 Between £10.01 and £20
2 Nothing 7 Between £20.01 and £50
3 Up to £5 8 Over £50
4 Between £5.01 and £7.50 9 Unsure
5 Between £7.51 and £10 10 Prefer not to say

Q2.6 What facilities would you want to find at this area of land today? Please all that apply Unprompted - Repeat “Any more?” until respondent says No
1 Toilets 8 Café/ refreshments
2 Dog poo bins 9 Picnic tables / seating
3 Rubbish bins 10 Bird hides
4 Car park 11 Information about where you can and
cannot go 5 Visitor centre, info boards
6 Information about the site and
attractions 12 Information about animals and wildlife on
the site
7 Health and safety information
about the site 13 None
14 Other (please write in)
………………………….............….............…...................
Section 3 Visitor Patterns of Use
Can you please show me on this map:
Where you entered this area of land? Mark with E
Where you will leave the area of land? Mark with X
Where you WALKED? Draw SOLID line, clearly indicating whether on or off PROW/other paths
Where you CYCLED? Draw DASHED line, clearly indicating whether on or off PROW/other paths
Where you RODE A HORSE? Draw a LINE WITH ARROWS, clearly indicating whether on or off PROW/other paths
Where you undertook any other activities (e.g. picnics, games, rock climbing) Mark each activity on map, clearly indicating whether on or off PROW/other paths
Record on map where interview is taking place with „I‟ ENSURE MAP IS FULLY ANNOTATED AND MARKED WITH TIME/DATE OF INTERVIEW
Section 4 Site Awareness
Q4.1 SHOWCARD D Have you seen this symbol before? Please one only
1 Yes If Yes - Where? Tick all that apply
1 At this site on signs/
notices
2 On
leaflets 4 At other areas of land 3 In
books 5 Other (please write in)
…………………………………………
3 Not sure
2 No GO TO Q4.3
Q4.2 What does the symbol represent? Please all that apply
1 Right to Roam 2 Open Access
3 Other (please write in)
……………………………………………………………………………………………………..
4 Don‟t know

Q4.3 Do NOT ask if Q4.2 = 1 Have you heard of Right to Roam? Please one only
1 Yes 2 No 3 Not sure
Q4.4 Do NOT ask if Q4.2 = 2 Have you heard of Open Access? Please one only
1 Yes 3 Not sure
2 No
Q4.5 Based on your current understanding and awareness of Open Access, do you think each of the following statements are true, false, or don‟t you know? SHOWCARD E Please one per row only
True False Don‟t know
A All farm land has been opened up to the public
1 2 3
B All grassland has been opened to the public 1 2 3
C People can walk across mapped open access land without the need to stick to PROW
1 2 3
D My right of access to open access land may sometimes be restricted for nature conservation/,public safety, and/or land management reasons
1 2 3
*Confirm with respondent, statements C and D are true
Q4.6 Are you aware that since 2005 this area of land has been designated as Open Access Land? Please one only
1 Yes 2 No 3 Not sure
ALL ANSWER:
Q4.7 Can you mention any specific restrictions that may apply to Open Access Land? Write in. Probe fully. Record detailed response.
……………………………………………………………………………………………………………. ……………………………………………………………………………………………………………. ……………………………………………………………………………………………………………. …………………………………………………………………………………………………………….
If Q4.6=No: Since 2005 this area of land has been designated as Open Access Land. This means people can walk across mapped areas of open access land without the need to stick to public rights of way, though their right of access may sometimes be restricted for nature conservation, public safety, and land management reasons.
Q4.8 Refer to Map For your visit to this area of land today, could you estimate the proportion of your walk/visit that was/will be ...
On a Public Right of Way, public road or official car park …………...…% On other tracks within the area that are not PRoW ………………% OFF Public Rights of Way / Tracks i.e. on open access land ………………%
0 Don‟t Know
For those only using Public Rights of Way:
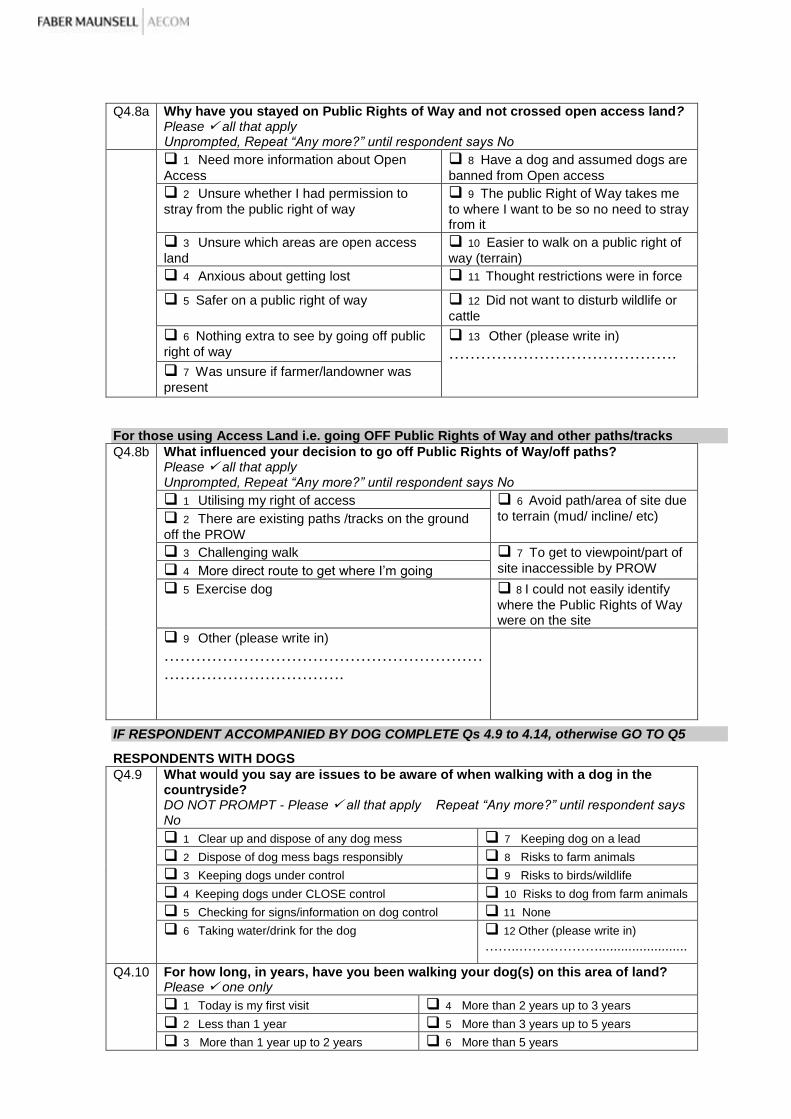
Q4.8a Why have you stayed on Public Rights of Way and not crossed open access land? Please all that apply Unprompted, Repeat “Any more?” until respondent says No
1 Need more information about Open
Access
8 Have a dog and assumed dogs are
banned from Open access
2 Unsure whether I had permission to
stray from the public right of way
9 The public Right of Way takes me
to where I want to be so no need to stray from it
3 Unsure which areas are open access
land
10 Easier to walk on a public right of
way (terrain)
4 Anxious about getting lost 11 Thought restrictions were in force
5 Safer on a public right of way 12 Did not want to disturb wildlife or
cattle
6 Nothing extra to see by going off public
right of way 13 Other (please write in)
……………………………………. 7 Was unsure if farmer/landowner was
present For those using Access Land i.e. going OFF Public Rights of Way and other paths/tracks
Q4.8b What influenced your decision to go off Public Rights of Way/off paths? Please all that apply Unprompted, Repeat “Any more?” until respondent says No
1 Utilising my right of access 6 Avoid path/area of site due
to terrain (mud/ incline/ etc) 2 There are existing paths /tracks on the ground
off the PROW 3 Challenging walk 7 To get to viewpoint/part of
site inaccessible by PROW 4 More direct route to get where I‟m going
5 Exercise dog 8 I could not easily identify
where the Public Rights of Way were on the site
9 Other (please write in)
………………………………………………………………………………….
IF RESPONDENT ACCOMPANIED BY DOG COMPLETE Qs 4.9 to 4.14, otherwise GO TO Q5
RESPONDENTS WITH DOGS
Q4.9 What would you say are issues to be aware of when walking with a dog in the countryside? DO NOT PROMPT - Please all that apply Repeat “Any more?” until respondent says No
1 Clear up and dispose of any dog mess 7 Keeping dog on a lead
2 Dispose of dog mess bags responsibly 8 Risks to farm animals 3 Keeping dogs under control 9 Risks to birds/wildlife
4 Keeping dogs under CLOSE control 10 Risks to dog from farm animals
5 Checking for signs/information on dog control 11 None
6 Taking water/drink for the dog 12 Other (please write in)
……..………………........................
Q4.10 For how long, in years, have you been walking your dog(s) on this area of land? Please one only
1 Today is my first visit 4 More than 2 years up to 3 years
2 Less than 1 year 5 More than 3 years up to 5 years
3 More than 1 year up to 2 years 6 More than 5 years

Q4.11 What aspects about this area of land make it good for bringing a dog here? DO NOT PROMPT - Please all that apply Repeat “Any more?” until respondent says No
1 able to let dog run off lead 5 dog enjoys it here
2 no/not many other dogs 6 don‟t have to pick up dog mess 3 no/not many other people 7 no livestock
4 no restrictions on dogs being here 8 things for dogs to chase (e.g. rabbits, birds) 9 nothing in particular - I like the walk/convenient walk for me
10 other (please write in) …………………………........................
Q4.12 Under what circumstances do you keep your dog(s) on a lead at this site? Unprompted - Repeat “Any more?” until respondent says No
Always 0 Go to Q 5
Never 1 Go to Q 4.13
At all times when off PRoW 2
If wild birds are close by 3
If signs/ information say to keep dogs on a lead 4
If there are other dogs close by 5
If livestock are close by 6
In bird breeding season 7
In shooting season 8
ONLY ASK Q4.13 if Q4.12=1 (Never)
Q4.13 Would you be happy to keep your dog on a lead …
A If wild birds are close by 1 Yes 2 No 3 Don‟t Know
B If additional information explaining why was visible on the site
1 Yes 2 No 3 Don‟t Know
D If livestock are close by 1 Yes 2 No 3 Don‟t Know
E In bird breeding season 1 Yes 2 No 3 Don‟t Know
F In shooting season 1 Yes 2 No 3 Don‟t Know
Q4. 14 If no to any/all in Q4.13 – Why would you not keep your on a lead?
Section 5 Information and Signage
ALL RESPONDENTS
Q5 What types of information or signage have you found useful at this area of land today? (tick all that apply)
Not seen any signage or information 0
Footpath signs/ Direction sign posts /Finger posts /Way markers 1 Map / information board 2 Danger signs 3
Signs/information relating to Open Access 4
Suggested walks 5
Open Access Symbol 6
Distance markers 7
Access point markers 8
Other information or signage (please write in) ………………………………….………………………………….
9

Q5.1 Which of the following sources of publicity would you find most useful in influencing future visits to open access land? SHOWCARD F Please all that apply
Publicity
Please specify (programme/publication etc)
A Local Newspaper 1
B Parish News Articles 2
C National Newspapers – Articles 3
D National TV – programmes 4
E National Radio – programmes 5
F Local TV – programmes 6
G Local Radio – programmes 7
H TV Adverts 8
I Billboards 9
J Internet 10 K Magazines 11 L Membership organisations 12 K Other (please specify)
13
Section 6 Satisfaction
Q6 Overall, on a scale of 1 to 5 where 1 is very dissatisfied and 5 is very satisfied, how satisfied are you with your visit to this area of land today? SHOWCARD B Please one only
1 Very dissatisfied Ask why dissatisfied – record at Q6.2
2 Dissatisfied
3 Neither satisfied not dissatisfied
4 Satisfied 5 Very Satisfied
Q6.1 To what extent did the need to get exercise feature in your decision to visit the countryside today? SHOWCARD G Please one only
1 Not at all 2 To some extent 3 To a large extent
Q6.2 Finally, do you have any other comments about your visit to this area of land? Please probe fully (for example any history with the area of land, their experience or expectations, parking issues etc). Repeat “Any more?” until respondent says No
……………………………………………………………………………………………………………. ……………………………………………………………………………………………………………. …………………………………………………………………………………………………………….
COLLECT MAP BACK FROM RESPONDENT
Section 7 – Respondent Profile
Finally, so that we can check whether we have a representative sample, please tell me the following. This information will not be used for anything else.
Q7 What is your home postcode Please probe for full postcode. If postcode not given probe for street and/or suburb/town.
Full postcode ……………………………………………………………………………………..
Street ……………………………………………………………………………………..
Suburb/Town ……………………………………………………………………………………..

Q7.1 Record Gender Please one only
1 Male 2 Female
Q7.2 What age group do you belong in? SHOWCARD H Please one only
1 Under 18 5 45 - 54
2 18 – 24 6 55 - 64
3 25 – 34 7 65 - 74
4 35 – 44 8 75 +
Q7.3 How would you describe the profile of the group travelling with you today? Please one only SHOWCARD I
1 Single visitor (under 18) 4 More than 2 adults (18 or over)
2 Single visitor (18 or over) 5 2 or more children (under 18)
3 2 adults (18 or over) 6 Adult/s and Child/ren
Q7.4 Would you describe your group‟s visit to this area of land today….? Please one only
1 A social/ leisure visit
2 As part of a rambling/walking association or other club/group
Which one? …………………….. 3 Other organised activity: What? ……………………………………………….. 4 To access another area of land 5 Other (please write in)
…………………………………………..
Q7.5 What is your employment status? SHOWCARD J Please one only
1 Full-time (30+ hrs/week) 7 Don‟t work – looking after family/
home
2 Part-time (<30 hrs/week) 8 Don‟t work – long term sick
disabled
3 Self-employed full time 9 Don‟t work – some other reason
4 Self-employed part-time 10 Don‟t work - student
5 Government supported training scheme 11 Retired
6 Unemployed – looked for work in last 4
weeks or waiting to start new job
Q7.6 What is the occupation of the Chief Wage earner in your household? Please write in (for SEG classification)
…………………………………………………………………………………………………………….
Q7.8 Which of these groups do you belong to? SHOWCARD K Please one only
1 White British 10 Bangladeshi
2 Irish 11 Other Asian (please write in)
………………………………………. 3 Other White (please write in)
………………………………………. 12 Black Caribbean
4 Mixed White & Black Caribbean 13 Black African
5 Mixed White & Black African 14 Other Black (please write in)
………………………………………. 6 Mixed White & Asian
7 Other Mixed (please write in) ……………………………………….
15 Chinese
16 Other ethnic group (please write in)

8 Indian ………………………………………. 9 Pakistani
Q7.9 Do you have a long-term illness, health problem or disability which limits your daily activities or the work you can do? Please one only
1 Yes
2 No
Thank you, May I take a contact phone number for back checking purposes? That is, to verify that the interview has been properly conducted – this information will not be used for any other purpose. Natural England is keen to monitor understanding and use of Open Access; would you be happy to give your details for Natural England to contact you should they undertake any future research on Open Access? If so, sign: …………………………………………………………………………….………….……………. Name: …………………………………………………………………………….………….………………… Address:…………………………………………………………………………………….………….………. …………………………………………………………………………………….……….………….………… …………………………………………………………………………….………….……….………….………

Observations to be carried out every 60 minutes throughout the observation day. Each observation to cover 5-10 minute period,
recording direction of movements of observed visitors, over all visible land within SITE BOUNDARY as shown on map. Check for
any site restrictions / closures.
Observation record Time of observation
…………….……………………….
Date of Observation
…………………………………………
Observation Location
…………………………………………
Site Name
……………………………………..
Site reference No
……………………………………
Weather: (circle all that apply or write in)
Warm Cold Sunny Overcast
Clear Raining Misty Pleasant
Thunder/Lighting Dry Windy Still
Unpleasant
Mark on your map where each visitor / group of visitors and dogs is over the time of observation
with the code for the activity being undertaken at the time (see below codes highlighted in Bold).
Mark entry point with an “E”, the route with a solid line, and the exit with an “X” and the route
with a solid line.
Ensure distinction between Public Rights of Way (PROW) and other paths/tracks that are not
PROW.
7. Visitor activity
Note: Count each group only once per Observation.
If location of activity changes over observation period
record the starting position as on PROW/other
path/on access land etc.
Number of
visitors on
PROW/
public
roads
Number of
visitors on
other
tracks/
paths
Number of
visitors on
access land (i.e.
wandering, not on or
following any visible
path)
Total
numbe
r of
visitors
Actively using open access land or tracks/paths
rather than PRoW (OA)
Ambling/walking for pleasure (A/W)
Rambling/serious walking (R/W)
Dog walker (D/W)
Dog on lead (DL)
Dog off lead (DOF)
Running/Jogging (R/J)
Enjoying scenery/ bird/nature watching (S/N)
Bike riding (B/R)
Horse Riding (H/R)
Picnics (P/N)
Sitting/Resting (S/R)
Ball Games/ Other Games (G)
Other (O) write in:
8. Behaviour without statutory rights
9. Reference these activities on your map with codes
Number of
visitors on
PROW/
public
roads
Number of
visitors on
other
tracks/
paths
Number of
visitors on
access land (i.e.
wandering, not on or
following any visible
path)
Total
numbe
r of
visitors
Picking flowers (P/F)
Fire risk activity (Dropping cigarette butts/ setting fires/
barbecues/ camp fires) (F/R)
Walking through restricted areas (W/R)
Using a motorised vehicle where not permitted (M/V)
Using a non-motorised vehicle where not permitted
(N/V)
Disturbing nesting birds (flushing) (D/B)

Other
10. Dog activity and adherence to any restrictions in place
Record number of dogs by
location and behaviour
Number of
dogs on
PROW /
public roads
Number of
Dogs on
other tracks/
paths
Number of dogs on open
access land (i.e. wandering off
paths) where dogs
Total
number of
dogs …
allowed are excluded
On lead
Off lead to heel
Off lead roaming
Controlled and well behaved (i.e.
responsive to commands where
given)
Uncontrolled and poorly behaved
(i.e. unresponsive to commands
where given)
Disturbing other visitors/dogs
Disturbing livestock
Disturbing birds/wildlife
Other type of non control
Use of Signage and information (visibly stopping to observe or read - please detail on map and write in numbers seen over observation period)
Open Access Symbol (just the symbol) (OA/S)
Open Access Restrictions notice (just about site-specific restrictions) (OA/R)
Open Access management information (advisory) (OA/M)
Open Access information point (OA/IP)
Other (Please detail) …………………………………………………………………………………………………………………………………………………………… …………………………………………………………………………………………………………………………………………………………… ……………………………………………………………………………………………………………………………………………………………
Use of Site Access Infrastructure - Please detail on map and write in numbers seen over
observation period)
Stile (S)
Gate (G)
Kissing Gate (KG)
Car Park (CP)
Other (Please detail) …………………………………………………………………………………………………………………………………………………………… …………………………………………………………………………………………………………………………………………………………… ………………………………………………………………………………………………………………………………………………
……………

Summary - Total number of Visitors
Observation
Period
Number of visitors
on PROW / roads
Number of visitors
on other tracks/
paths
Number of visitors on
access land (i.e.
wandering, not on or
following any visible path)
Total number of
visitors
At start
After 5/10 mins

Faber Maunsell Access Management Report: Three Year Monitoring Surveys at Open Access Land (2006-2008) 159
2007 – Local Monitoring Survey Visitor Questionnaire number: ……………………… Date:……. /
………….
/………….
Site name: ………………………………………….. OS REF:
……………………
…………
Day: 1 Monday 2 Tuesday 3
Wednesday 4 Thursday 5
Friday 6 Saturday 7
Sunday
Interview: 1 On Entry 2 Part
way through visit/walk 3 On
Exit
Interviewer name: ……………… Site reference
or survey Unit
No:
………………
…..
Time: …… : …… 1 Respondent has dog(s) 2 No dog
with
respondent
Good Morning/afternoon/evening, Can you spare some time to take part in a short survey about your visit today?
Q1 Do you live locally, are you on a day trip from home or are you on holiday?
1 Live locally
2 Day trip from home
3 On holiday/ staying away from home
Q2 How far did you travel here today from your starting point this morning?
1 Up to 1 mile 5 10.1 -20 miles 2 1.1-2 miles 6 20.1 -40 miles 3 2.1 -5 miles 7 40.1 -100 miles 4 5.1 -10 miles 8 Over 100 miles
Q3 How long have you been visiting this area of land?
1 Today is my first visit
2 Less than 1 year
3 More than 1 year and up to 2 years
4 More than 2 years and up to 3 years
5 More than 3 years and up to 5 years
6 More than 5 years
Q4 About how often do you visit this area of land? (code one)
1 First visit today 6 Monthly
2 Daily 7 Several times a year
3 Several times a
week 8 Once a year
4 Weekly 9 Less often
5 Several times a month
Q5 Could you tell me how you originally became aware of this area of land?
1 Local knowledge/ Always known
2 Friends/family
3 Promotion/press/website/information
4 Other (write in) …………………………………………
Q6 What activities do you plan to do here today? (or have you done while here?)
1 Short stroll/ ambling
2 Dog walking
3 Serious walking/ rambling/ hiking
4 Enjoying the scenery/nature
5 Other (write in)
………………………………… …………………………………
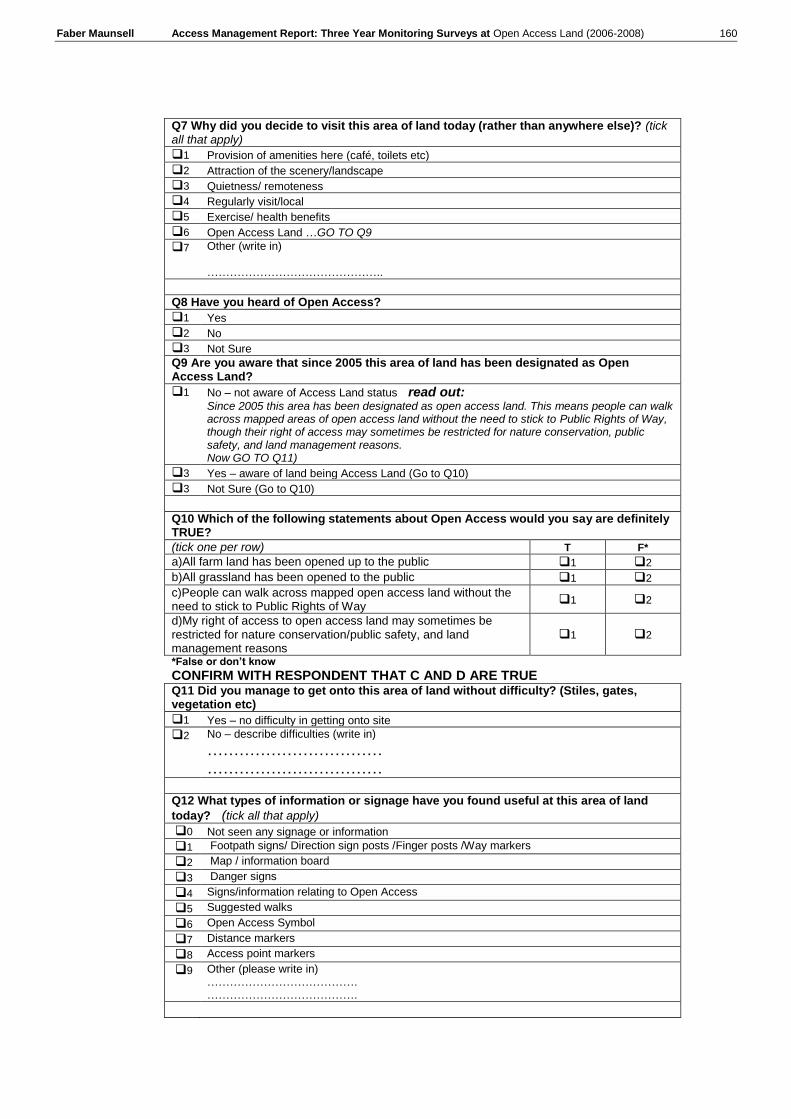
Faber Maunsell Access Management Report: Three Year Monitoring Surveys at Open Access Land (2006-2008) 160
Q7 Why did you decide to visit this area of land today (rather than anywhere else)? (tick all that apply)
1 Provision of amenities here (café, toilets etc)
2 Attraction of the scenery/landscape
3 Quietness/ remoteness
4 Regularly visit/local
5 Exercise/ health benefits
6 Open Access Land …GO TO Q9
7 Other (write in) ………………………………………..
Q8 Have you heard of Open Access?
1 Yes
2 No
3 Not Sure
Q9 Are you aware that since 2005 this area of land has been designated as Open Access Land?
1 No – not aware of Access Land status read out: Since 2005 this area has been designated as open access land. This means people can walk across mapped areas of open access land without the need to stick to Public Rights of Way, though their right of access may sometimes be restricted for nature conservation, public safety, and land management reasons. Now GO TO Q11)
3 Yes – aware of land being Access Land (Go to Q10)
3 Not Sure (Go to Q10)
Q10 Which of the following statements about Open Access would you say are definitely TRUE?
(tick one per row) T F*
a)All farm land has been opened up to the public 1 2
b)All grassland has been opened to the public 1 2
c)People can walk across mapped open access land without the need to stick to Public Rights of Way
1 2
d)My right of access to open access land may sometimes be restricted for nature conservation/public safety, and land management reasons
1 2
*False or don‟t know
CONFIRM WITH RESPONDENT THAT C AND D ARE TRUE Q11 Did you manage to get onto this area of land without difficulty? (Stiles, gates, vegetation etc)
1 Yes – no difficulty in getting onto site
2 No – describe difficulties (write in)
…………………………… ……………………………
Q12 What types of information or signage have you found useful at this area of land
today? (tick all that apply)
0 Not seen any signage or information
1 Footpath signs/ Direction sign posts /Finger posts /Way markers
2 Map / information board
3 Danger signs
4 Signs/information relating to Open Access
5 Suggested walks
6 Open Access Symbol
7 Distance markers
8 Access point markers
9 Other (please write in) …………………………………. ………………………………….

Faber Maunsell Access Management Report: Three Year Monitoring Surveys at Open Access Land (2006-2008) 161
Q13 Could anything be done to improve your visit today? (tick all that apply)
0 No – no improvements needed
1 More facilities (picnic areas, toilets)
2 Better parking
3 Easier to get into the site (stiles/gates)
4 Better signage/information
5 Better maintenance/keeping of site
6 Other (please write in) ………………………………….
Q14 For your visit today, please estimate the proportions of your walk on this site that was on:…? SHOW MAP
Public rights of way %
Existing tracks and paths that are not public rights of way % Open access land with no obvious paths %
IF 100% on PROW, ASK Q15, otherwise GO TO SECTION 2
Q15 Why did you/ have you decided not to walk across open access land and stay on the public right of way? (tick all that apply)
1 Need more information about Open Access
2 Unsure whether I had permission to stray from the public right of way
3 Unsure which areas are open access land
4 Anxious about getting lost
5 Safer on a public right of way
6 Nothing extra to see by going off public right of way
7 Was unsure if farmer/landowner was present
8 Have a dog and assumed dogs are banned from Open access
9 The Public Right of Way takes me to where I want to be so no need to stray from it
10 Easier to walk on a public right of way (terrain)
11 Thought restrictions were in force
12 Did not want to disturb wildlife or cattle
13 Other (please write in) …………………………………………………………………………………………
SECTION 2
SHOW MAP OF SITE Looking at this area shown on the map (POINT OUT BOUNDARY) Please can you show me on the map where you started your walk or visit today? And the finish point of your walk (or visit)
And can you indicate the route taken/likely to be taken while on this area of land? Mark entry point with “E”
Mark route with a solid line Mark exit point with “X”
RESPONDENTS WITH NO DOGS – GO STRAIGHT TO QUESTION 19
RESPONDENTS WITHDOG(S): Q16onwards
Q16 How long have you been bringing your dog to this area of land for walking?
1 Today is my first visit
2 Less than 1 year
3 More than 1 year and up to 2 years
4 More than 2 years and up to 3 years
5 More than 3 years and up to 5 years
6 More than 5 years

Faber Maunsell Access Management Report: Three Year Monitoring Surveys at Open Access Land (2006-2008) 162
Q17 What aspects about this area of land make it good for bringing a dog here? DO NOT PROMPT - Please all that apply Repeat “Any more?” until respondent says No
1 able to let dog run off lead
2 no/not many other dogs
3 no/not many other people
4 no restrictions on dogs being here
5 dog enjoys it here
6 don‟t have to pick up dog mess
7 no livestock
8 things for dogs to chase (eg rabbits, birds)
9 nothing in particular/ I like the walk/ convenient walk for me
10 Other (please write in) …………………………………………………………………………………………………………………………………… ..
Q18 Under what circumstances do you keep your dog(s) on a lead, to heel off the lead, or free roaming off the lead on this site?
On a public right of Way
1 On lead 2 To heel off the lead
3 Free Roaming
On access land NOT on a PROW
1 On lead 2 To heel off the lead
3 Free Roaming
If wild birds are close by
1 On lead 2 To heel off the lead
3 Free Roaming
If signs/ information say to keep on lead
1 On lead 2 To heel off the lead
3 Free Roaming
If other dogs are close by
1 On lead 2 To heel off the lead
3 Free Roaming
If livestock close by
1 On lead 2 To heel off the lead
3 Free Roaming
In nesting season
1 On lead 2 To heel off the lead
3 Free Roaming
In shooting season
1 On lead 2 To heel off the lead
3 Free Roaming
ASK ALL Finally, so that we can check whether we have a representative sample, please answer the following questions. This information will not be used for anything else. Q19 Which of these best describes your age group?
1 0-15 4 35-44
2 16-24 5 45-59
3 25-34 6 60+
Q20 Which of these best describes your employment status?
1 Employed 3 Student
2 Not working 4 Retired
Q21 Do you have any longstanding illness or disability? (Code one only) 1 Yes 2 No Specify (please write in)
………………………………………..........

Faber Maunsell Access Management Report: Three Year Monitoring Surveys at Open Access Land (2006-2008) 163
Q22 Which of these best describes your ethnic grouping?
1 White British 4 Mixed
2 White other 5 Black
3 Asian 6 Chinese
9 Other – specify
…………………………………………………………………….
Q23 Finally, could you give me your home postcode?
Thank you

Faber Maunsell Access Management Report: Three Year Monitoring Surveys at Open Access Land (2006-2008) 164
SURVEYOR TO COMPLETE FROM OBSERVATION Record Gender of Respondent
1 Male
2 Female
Group Record Total Number of people in Group Number of people in Group with mobility difficulties
Number of dogs in group
(One form to be completed by observer once every 60 minutes throughout the observation day)
11. Observation record
Time observation commenced
…………….………………………
.
Date of Observation
…………………………………………
Site or Survey Unit reference
No
…………………………………
…
Site Name
…………………………………….
.
Site Location (Grid Reference)
…………………………………….
.
Weather: (circle all that apply or
write in) Warm Cold Sunny
Overcast Clear Raining
Misty Pleasant
Thunder/Lighting Dry Windy
Still Unpleasant
12. Total number of Visitors. Snapshot at time of observation
At start of observation, count total number of visitors, then assess how many are using access land,
PRoW or other tracks)
Total number of
visitors
Number of visitors on
Rights of Way
Number of visitors on
open access land
Visitors on any road/
existing paths and
tracks within access
land site
13. Inappropriate behaviour. Snapshot at time of observation (Please reference these activities on your map (I/B))
Please write in inappropriate behaviour
observed
Total number
of visitors
undertaking
activity
Number of
visitors on
PROW
undertaking
activity
Number of
visitors on
open access
land
undertaking
activity
Picking flowers
Fire risk activity (Cigarette butts/ setting fires/
barbecues/ camp fires)
Walking through restricted areas
Using a motorised vehicle where not permitted
Using a non-motorised vehicle where not permitted
Disturbing nesting birds (flushing)
Other – specify
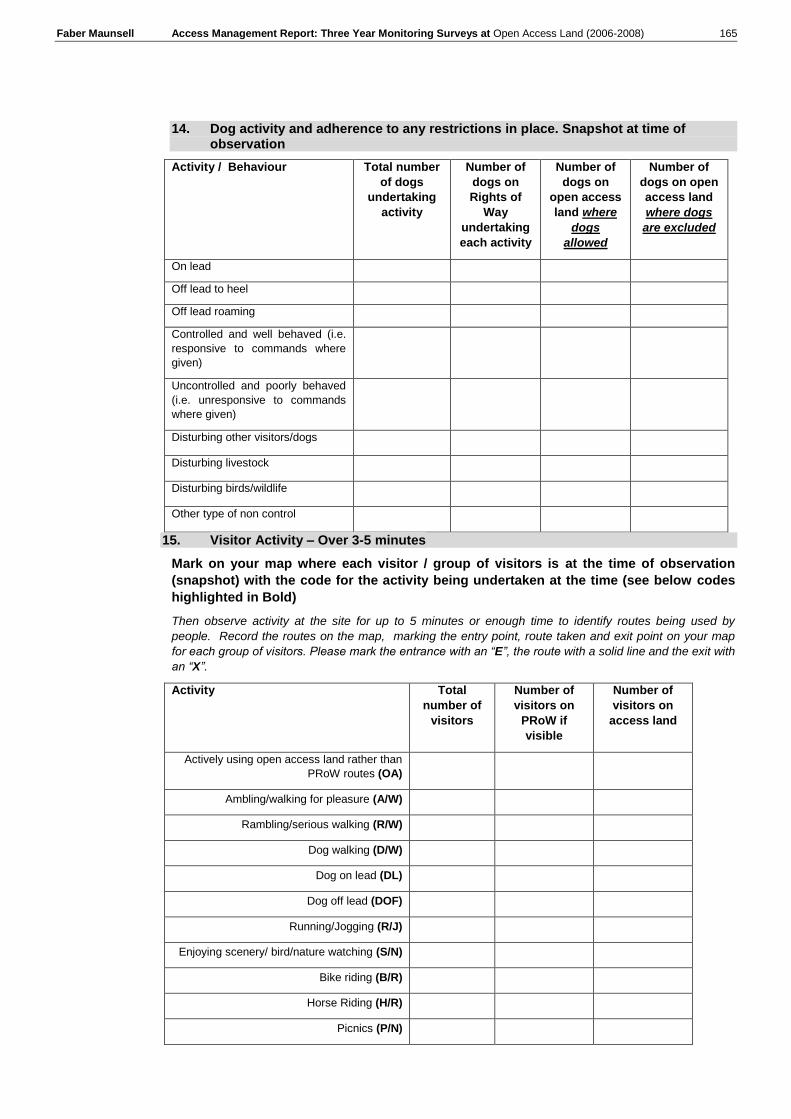
Faber Maunsell Access Management Report: Three Year Monitoring Surveys at Open Access Land (2006-2008) 165
14. Dog activity and adherence to any restrictions in place. Snapshot at time of observation
Activity / Behaviour Total number
of dogs
undertaking
activity
Number of
dogs on
Rights of
Way
undertaking
each activity
Number of
dogs on
open access
land where
dogs
allowed
Number of
dogs on open
access land
where dogs
are excluded
On lead
Off lead to heel
Off lead roaming
Controlled and well behaved (i.e.
responsive to commands where
given)
Uncontrolled and poorly behaved
(i.e. unresponsive to commands
where given)
Disturbing other visitors/dogs
Disturbing livestock
Disturbing birds/wildlife
Other type of non control
15. Visitor Activity – Over 3-5 minutes
Mark on your map where each visitor / group of visitors is at the time of observation
(snapshot) with the code for the activity being undertaken at the time (see below codes
highlighted in Bold)
Then observe activity at the site for up to 5 minutes or enough time to identify routes being used by
people. Record the routes on the map, marking the entry point, route taken and exit point on your map
for each group of visitors. Please mark the entrance with an “E”, the route with a solid line and the exit with
an “X”.
Activity Total
number of
visitors
Number of
visitors on
PRoW if
visible
Number of
visitors on
access land
Actively using open access land rather than
PRoW routes (OA)
Ambling/walking for pleasure (A/W)
Rambling/serious walking (R/W)
Dog walking (D/W)
Dog on lead (DL)
Dog off lead (DOF)
Running/Jogging (R/J)
Enjoying scenery/ bird/nature watching (S/N)
Bike riding (B/R)
Horse Riding (H/R)
Picnics (P/N)

Faber Maunsell Access Management Report: Three Year Monitoring Surveys at Open Access Land (2006-2008) 166
Sitting/Resting (S/R)
Ball Games/ Other Games (G)
Other (O) write in:
16. Use of Site Signage, Information and Access Infrastructure
Use of Signage and information (visibly stopping to observe or read - please detail on map)
Open Access Symbol (OA/S)
Open Access Restrictions notice (OA/R)
Open Access management information (advisory) (OA/M)
Open Access information point (OA/IP)
Other (Please detail) …………………………………………………………………………………………………………………………………………………………… …………………………………………………………………………………………………………………………………………………………… ……………………………………………………………………………………………………………………………………………………………
Use of Site Access Infrastructure (Please detail on map)
Stile (S)
Gate (G)
Kissing Gate (KG)
Car Park (CP)
Other (Please detail)
……………………………………………………………………………………………...........................................................……
……………………………… ………………………………………………………………………………………………………………………………………..……
……………………………… ………………………………………………………………………………………………………………………………………..……
………………………………
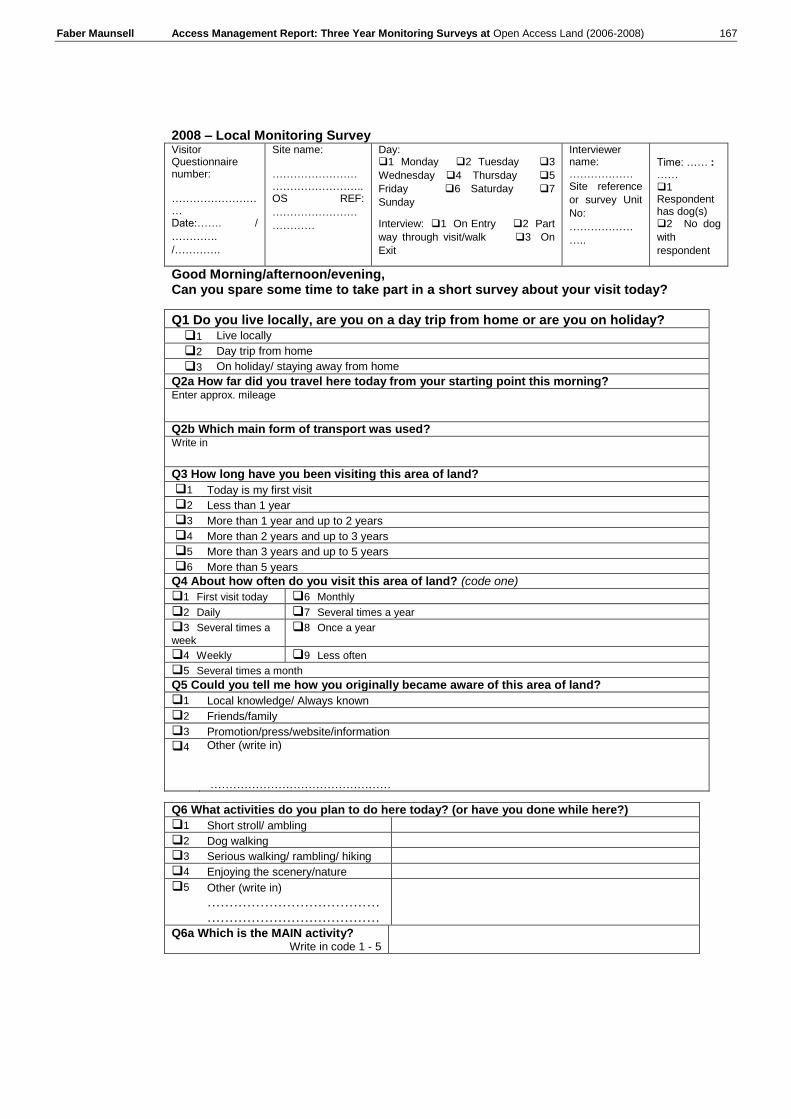
Faber Maunsell Access Management Report: Three Year Monitoring Surveys at Open Access Land (2006-2008) 167
2008 – Local Monitoring Survey Visitor Questionnaire number: ……………………… Date:……. /
………….
/………….
Site name: ………………………………………….. OS REF:
……………………
…………
Day: 1 Monday 2 Tuesday 3
Wednesday 4 Thursday 5
Friday 6 Saturday 7
Sunday
Interview: 1 On Entry 2 Part
way through visit/walk 3 On
Exit
Interviewer name: ……………… Site reference
or survey Unit
No:
………………
…..
Time: …… : …… 1 Respondent has dog(s) 2 No dog
with
respondent
Good Morning/afternoon/evening, Can you spare some time to take part in a short survey about your visit today?
Q1 Do you live locally, are you on a day trip from home or are you on holiday?
1 Live locally
2 Day trip from home
3 On holiday/ staying away from home
Q2a How far did you travel here today from your starting point this morning? Enter approx. mileage
Q2b Which main form of transport was used? Write in
Q3 How long have you been visiting this area of land?
1 Today is my first visit
2 Less than 1 year
3 More than 1 year and up to 2 years
4 More than 2 years and up to 3 years
5 More than 3 years and up to 5 years
6 More than 5 years
Q4 About how often do you visit this area of land? (code one)
1 First visit today 6 Monthly
2 Daily 7 Several times a year
3 Several times a
week 8 Once a year
4 Weekly 9 Less often
5 Several times a month
Q5 Could you tell me how you originally became aware of this area of land?
1 Local knowledge/ Always known
2 Friends/family
3 Promotion/press/website/information
4 Other (write in) …………………………………………
Q6 What activities do you plan to do here today? (or have you done while here?)
1 Short stroll/ ambling
2 Dog walking
3 Serious walking/ rambling/ hiking
4 Enjoying the scenery/nature
5 Other (write in)
………………………………… …………………………………
Q6a Which is the MAIN activity? Write in code 1 - 5

Faber Maunsell Access Management Report: Three Year Monitoring Surveys at Open Access Land (2006-2008) 168
Q7 Why did you decide to visit this area of land today (rather than anywhere else)? (tick all that apply)
1 Provision of amenities here (café, toilets)
2 Attraction of the scenery/landscape
3 Quietness/ remoteness
4 Regularly visit/local
5 Exercise/ health benefits
6 Open Access Land …GO TO Q9
7 Other (write in) ………………………………………..
Q8 Have you heard of Open Access?
1 Yes
2 No
3 Not Sure
Q9 Would you say the following statements about Open Access are TRUE or FALSE?
(tick one per row) T F DK
a)All farm land has been opened up to the public 1 2
3
b)All grassland has been opened to the public 1 2
3
c)People can walk across mapped open access land without the need to stick to Public Rights of Way
1 2 3
d)My right of access to open access land may sometimes be restricted for nature conservation/public safety, and land management reasons
1 2 3
CONFIRM WITH RESPONDENT THAT C AND D ARE TRUE Q10 Are you aware that since 2005 this area of land has been designated as Open Access Land?
1 Yes
2 No - read statement
3 Not Sure - read statement
If not aware - read out: Since 2005 this area has been designated as open access land. This means people can walk across mapped areas of open access land without the need to stick to Public Rights of Way, though their right of access may sometimes be restricted for nature conservation, public safety, and land management reasons.
Q11 Did you manage to get onto this area of land without difficulty? (Stiles, gates, vegetation etc)
1 Yes – no difficulty in getting onto site
2 No – describe difficulties (write in)
…………………………… ……………………………
Q12 What types of information or signage have you found useful at this area of land today? (tick all that apply)
0 Not seen any signage or information
1 Footpath signs/ Direction sign posts /Finger posts /Way markers
2 Map / information board
3 Danger signs
4 Signs/information relating to Open Access
5 Suggested walks
6 Open Access Symbol
7 Distance markers
8 Access point markers
9 Other (please write in) …………………………………. ………………………………….

Faber Maunsell Access Management Report: Three Year Monitoring Surveys at Open Access Land (2006-2008) 169
Q13 Could anything be done to improve your visit today? (tick all that apply)
0 No – no improvements needed
1 More facilities (picnic areas, toilets)
2 Better parking
3 Easier to get into the site (stiles/gates)
4 Better signage/information
5 Better maintenance/keeping of site
6 Other (please write in) ………………………………….
Q14 For your visit today, please estimate the proportions of your walk on this site that was on:…? SHOW MAP
Public rights of way %
Existing tracks and paths that are not public rights of way
%
Open access land with no obvious paths
%
IF 100% on PROW, ASK Q15, otherwise GO TO SECTION 2
Q15 Why did you/ have you decided not to walk across open access land and stay on the public right of way? (tick all that apply)
1 Need more information about Open Access
2 Unsure whether I had permission to stray from the public right of way
3 Unsure which areas are open access land
4 Anxious about getting lost
5 Safer on a public right of way
6 Nothing extra to see by going off public right of way
7 Was unsure if farmer/landowner was present
8 Have a dog and assumed dogs are banned from Open access
9 The Public Right of Way takes me to where I want to be so no need to stray from it
10 Easier to walk on a public right of way (terrain)
11 Thought restrictions were in force
12 Did not want to disturb wildlife or cattle
13 Other (please write in) …………………………………………………………………………………………
SECTION 2 SHOW MAP OF SITE Looking at this area shown on the map (POINT OUT BOUNDARY) Please can you show me on the map where you started your walk or visit today? And the finish point of your walk (or visit)
And can you indicate the route taken/likely to be taken while on this area of land? Mark entry point with “E”
Mark route with a solid line Mark exit point with “X”
RESPONDENTS WITH NO DOGS – GO STRAIGHT TO QUESTION 19
RESPONDENTS WITHDOG(S): Q16onwards
Q16 How long have you been bringing your dog to this area of land for walking?
1 Today is my first visit
2 Less than 1 year
3 More than 1 year and up to 2 years
4 More than 2 years and up to 3 years
5 More than 3 years and up to 5 years
6 More than 5 years

Faber Maunsell Access Management Report: Three Year Monitoring Surveys at Open Access Land (2006-2008) 170
Q17 What aspects about this area of land make it good for bringing a dog here? DO NOT PROMPT - Please all that apply Repeat “Any more?” until respondent says No
1 able to let dog run off lead
2 no/not many other dogs
3 no/not many other people
4 no restrictions on dogs being here
5 dog enjoys it here
6 don‟t have to pick up dog mess
7 no livestock
8 things for dogs to chase (eg rabbits, birds)
9 nothing in particular/ I like the walk/ convenient walk for me
1
0 Other (please write in) …………………………………………………………………………………………………………………………………… ..
Q18 Under what circumstances do you keep your dog(s) on a lead, to heel off the lead, or free roaming off the lead on this site?
On a public right of Way
1 On lead 2 To heel off the lead
3 Free Roaming
On access land NOT on a PROW
1 On lead 2 To heel off the lead
3 Free Roaming
If wild birds are close by
1 On lead 2 To heel off the lead
3 Free Roaming
If signs/ information say to keep on lead
1 On lead 2 To heel off the lead
3 Free Roaming
If other dogs are close by
1 On lead 2 To heel off the lead
3 Free Roaming
If livestock close by
1 On lead 2 To heel off the lead
3 Free Roaming
In nesting season
1 On lead 2 To heel off the lead
3 Free Roaming
In shooting season
1 On lead 2 To heel off the lead
3 Free Roaming
ASK ALL Finally, so that we can check whether we have a representative sample, please answer the following questions. This information will not be used for anything else. Q19 Which of these best describes your age group?
1 Under 18 5 45 – 54
2 18 - 24 6 55 – 64
3 25 – 34 7 65 – 74
4 35 - 44 8 75+
Q20 Which of these best describes your employment status?
1 Employed 3 Student
2 Not working 4 Retired
Q21 Do you have any longstanding illness or disability? (Code one only) 1 Yes 2 No Specify (please write in)
………………………………………..........

Faber Maunsell Access Management Report: Three Year Monitoring Surveys at Open Access Land (2006-2008) 171
Q22 Which of these best describes your ethnic grouping?
1 White British 4 Mixed
2 White other 5 Black
3 Asian 6 Chinese
9 Other – specify
……………………………………………………………………. Q23 Finally, could you give me your home postcode?
Thank you SURVEYOR TO COMPLETE FROM OBSERVATION Record Gender of Respondent
1 Male
2 Female
Group Record Total Number of people in Group Number of people in Group with mobility difficulties
Number of dogs in group

Faber Maunsell Access Management Report: Three Year Monitoring Surveys at Open Access Land (2006-2008) 172
(One form to be completed by observer once every 60 minutes throughout the observation day –
observation to cover 5-10 minute period, recording direction of movements of observed visitors on all
visible land within SITE BOUNDARY as shown on map. Check for any site restrictions / closures)
17. Observation record
Time observation commenced
…………….……………………….
Date of Observation
…………………………………………
Site or Survey Unit reference
No
……………………………………
Site Name
……………………………………..
Site Location (Grid Reference)
……………………………………..
Weather: (circle all that apply or
write in) Warm Cold Sunny
Overcast Clear Raining
Misty Pleasant
Thunder/Lighting Dry Windy
Still Unpleasant
18. Total number of Visitors. Snapshot at time of observation
At start of observation, count total number of visitors within site boundary then assess how many are
using access land, PROW or other tracks) Repeat at end of observation period.
Observation Period Number of
visitors on Rights
of Way
Number of
Visitors on other
tracks / paths
within access
land site
Number of visitors on
open access land (i.e.
wandering, not on or
following any visible path)
Total
number of
visitors
At Start
After 5/10 mins
Mark on your map where each visitor / group of visitors and dogs is over the time of
observation with the code for the activity being undertaken at the time (see below codes
highlighted in Bold). Mark entry point with an “E”, the route with a solid line, and the
exit with an “X” and the route with a solid line.
Ensure distinction between Public Rights of Way (PROW) and other paths/tracks that are
not PROW.
19. Visitor activity
Note: Count each group only once per Observation. If
location of activity changes over observation period record
the starting position as on PROW/other path/on access land
etc.
Number of
visitors on
PROW/
public
roads
Number of
visitors on
other
tracks/
paths
Number of
visitors on
access land (i.e.
wandering, not on
or following any
visible path)
Total
numbe
r of
visitor
s
Actively using open access land or tracks/paths rather than
PROW (OA)
Ambling/walking for pleasure (A/W)
Rambling/serious walking (R/W)
Dog walker (D/W)
Dog on lead (DL)
Dog off lead (DOF)
Running/Jogging (R/J)
Enjoying scenery/ bird/nature watching (S/N)
Bike riding (B/R)
Horse Riding (H/R)

Faber Maunsell Access Management Report: Three Year Monitoring Surveys at Open Access Land (2006-2008) 173
Picnics (P/N)
Sitting/Resting (S/R)
Ball Games/ Other Games (G)
Other (O) write in:
J:\TProjects\48218TALT_CROW Monitoring\Reports\All years combined\Final Versions\Access Management Report 2006-2008 CROW Monitoring.doc
20. Behaviour without statutory rights
21. Reference these activities on your map with codes
Number of
visitors on
PROW/
public
roads
Number of
visitors on
other
tracks/
paths
Number of
visitors on
access land (i.e.
wandering, not on
or following any
visible path)
Total
numbe
r of
visitor
s Picking flowers (P/F)
Fire risk activity (Dropping cigarette butts/ setting fires/
barbecues/ camp fires) (F/R)
Walking through restricted areas (W/R)
Using a motorised vehicle where not permitted (M/V)
Using a non-motorised vehicle where not permitted (N/V)
Disturbing nesting birds (flushing) (D/B)
Other
22. Dog activity and adherence to any restrictions in place
Record number of dogs by location and
behaviour
Number of
dogs on
PROW /
public
roads
Number of
Dogs on
other
tracks/
paths
Number of dogs on open
access land (i.e. wandering
off paths) where dogs
Total
number of
dogs …
allowed are
excluded
On lead
Off lead to heel
Off lead roaming
Controlled and well behaved (i.e.
responsive to commands where given)
Uncontrolled and poorly behaved (i.e.
unresponsive to commands where given)
Disturbing other visitors/dogs
Disturbing livestock
Disturbing birds/wildlife
Other type of non control

Faber Maunsell Access Management Report: Three Year Monitoring Surveys at Open Access Land (2006-2008) 174
Use of Signage and information (visibly stopping to observe or read - please detail on map and write in numbers seen over observation period)
Open Access Symbol (just the symbol) (OA/S)
Open Access Restrictions notice (just about site-specific restrictions) (OA/R)
Open Access management information (advisory) (OA/M)
Open Access information point (OA/IP)
Other (Please detail) …………………………………………………………………………………………………………………………………………………………… …………………………………………………………………………………………………………………………………………………………… ……………………………………………………………………………………………………………………………………………………………
Use of Site Access Infrastructure - Please detail on map and write in numbers seen over
observation period)
Stile (S) Gate (G)
Car Park (CP) Kissing Gate (KG)
Other (Please detail) …………………………………………………………………………………………………………………………………………………………… …………………………………………………………………………………………………………………………………………………………… ……………………………………………………………………………………………………………………………………………
………………

Faber Maunsell Access Management Report: Three Year Monitoring Surveys at Open Access Land (2006-2008) 175
Weighting of Data
The number of survey days in the National Monitoring increased in 2007 from that in 2006, and
the extent of the Local Monitoring surveys differed between 2007 and 2008. The number of
survey days at a site ranged from 3 to 7 at the NM sites (average 3.7), and from 1 to 7 at the
LM sites (average 2.8). In simply combining the data from the different sources and years,
those sites where more survey days were conducted could skew the results. Therefore the
interview survey data has been weighted, by site and by year, to represent an equivalent
number of days per site.
The following procedure demonstrates how the survey data has been weighted to an equivalent
number of days per site.
In the example, the total number of interviews recorded was 35, at four sites, each from a
different number of survey days: 3.5 on average. The interview rates varied from 0.5 per day to
4.67 per day. Had only one day‟s survey been conducted at each site, 11.07 interviews would
have been expected. However the total interviews was 35; the ratio of total interviews to
interviews per day is 3.16. The weight to be applied is therefore:
3.16 x (1/ Z) where Z= number of survey days at that site
Survey Days (Z) Interviews
Interviews per day
1 / survey days Weight
Weighted Interviews
Site A 2 7 3.50 0.50 1.58 11.07
Site B 3 14 4.67 0.33 1.05 14.76
Site C 4 2 0.50 0.25 0.79 1.58
Site D 5 12 2.40 0.20 0.63 7.59
TOTAL 14 35 11.07 35
3.16
So at Site A, where only two survey days were conducted, the weighting factor is greater than
1, whereas at Site 5 it is less than one as more than the average number of days were
surveyed.
For the CROW Surveys, the number of interviews by year is:
2006 487
2007 1837
2008 2230
To retain the number of interviews by year the weightings are calculated separately for each
year. The weights are shown in the table below.

Faber Maunsell Access Management Report: Three Year Monitoring Surveys at Open Access Land (2006-2008) 176
National Sample Sites
2006 2007 2008
Days Ints Weight Day
s Ints Weight Days Ints Weight
1 Adleymoor Common 3 1 1.069 3 1 0.848 3 2 1.119
2 Alresford 3 18 1.069 4 16 0.636 4 12 0.839
3 Baildon Moor 3 8 1.069 3 9 0.848 3 8 1.119
5 Burbage Common 3 56 1.069 3 61 0.848 3 73 1.119
7 Decoy Heath 3 10 1.069 4 27 0.636 4 9 0.839
8 Dunnockshaw Woodland 3 10 1.069 6 26 0.424 6 11 0.559
10 Grassthorpe Holme 3 9 1.069 4 35 0.636 4 35 0.839
11 Kestlemerris Farm 3 10 1.069 4 1 0.636 4 2 0.839
12 Malvern Hills 4 59 0.802 7 134 0.363 7 177 0.479
13 Merrow Downs 3 17 1.069 3 14 0.848 3 66 1.119
14 Middleham Low Moor 3 10 1.069 4 14 0.636 4 5 0.839
15 Moorside 3 21 1.069 3 17 0.848 3 15 1.119
17 Severn Ham 3 21 1.069 3 47 0.848 3 25 1.119
18 Silvington Common 3 4 1.069 3 3 0.848 3 2 1.119
20 The Comp 3 9 1.069 3 0 0.848 3 9 1.119
21 The Mens 3 5 1.069 3 8 0.848 3 11 1.119
23 Waldridge Fell 3 16 1.069 3 14 0.848 3 14 1.119
24 Wardle Brook 3 12 1.069 3 17 0.848 3 18 1.119
25 Whitworth Higher End Moor 3 5 1.069 3 4 0.848 3 2 1.119
26 Wisley Common 3 6 1.069 3 0 0.848 3 13 1.119
32 Wilbraham 3 0 1.069 3 1 0.848 3 0 1.119
33 Doddington North Moor 3 0 1.069 3 2 0.848 3 0 1.119
34 Long Ridge Crags 3 1 1.069 3 0 0.848 3 0 1.119
35 Sandyford Moor 3 1 1.069 6 0 0.424 6 0 0.559
36 Ringmere Plantation 3 1 1.069 3 0 0.848 3 0 1.119
97 Whitehall Plantation 3 0 1.069 3 0 0.848 3 0 1.119

Faber Maunsell Access Management Report: Three Year Monitoring Surveys at Open Access Land (2006-2008) 177
2006 2007 2008
Days Ints Weight Days Ints
Weight Days Ints
Weight
Bowland Fells
4 Jubilee Tower N 4 30 0.802 4 10 0.636 4 16 0.839
31 Langden Brook N
0 0 - 3 37 0.848 3 22 1.119
37 Parlick L 0 0 - 2 12 1.272 2 27 1.678
38 Whitendale L 0 0 - 3 32 0.848 2 6 1.678
Sunbiggin Tarn
9 Sunbiggin Tarn N 3 36 1.069 4 46 0.636 4 34 0.839
9 Sunbiggin Tarn L 0 0 - 1 4 2.544 1 4 3.356
North Norfolk Coast
16 Holme Dunes N 4 20 0.802 4 8 0.636 4 61 0.839
29 Brancaster Beach N
0 0 - 4 50 0.636 3 51 0.839
South Pennine Moors
19 Ilkley Moor N 4 17 0.802 4 7 0.636 4 14 0.839
28 Bingley Moor N 0 0 - 3 15 0.848 3 10 1.119
Canford Heath
6 Canford Heath N 3 37 1.069 6 61 0.424 6 89 0.559
6 Canford Heath L 0 0 - 1 49 2.544 4 125 0.839
North Pennines AONB
22 Cow Green N 3 37 1.069 3 60 0.848 3 34 1.119
30 Holwick N 0 0 - 3 11 0.848 3 17 1.119
63 Bruthwaite Forest /Hallbankgate Side L
0 0 - 2 10 1.272 3 23
1.119
64 Geltsdale L 0 0 - 2 34 1.272 3 52 1.119
65 Blanchland L 0 0 - 3 26 0.848 3 20 1.119
66 Hartside North / South L
0 0 - 2 4 1.272 3 4 1.119
67 Flinty Fell L 0 0 - 1 0 2.544 2 1 1.678
68 Rotherhope Fell L 0 0 - 3 8 0.848 1 3 3.356
69 Red Carle L 0 0 3 0 0.848 3 0 1.119
70 Dufton / High Cup Nick L
0 0 1 5 2.544 2 16 1.678
71 Mickleton Moor L
0 0 1 0 2.544 4 2 0.839
72 Coldberry L 0 0 1 2 2.544 4 6 0.839
73 Crossthwaite Common (incl South) L
0 0 4 16 0.636 7 18 0.479
74 Whitfield Moor L 0 0 0 2 0 1.678
86 Broad Meadows/ Well Hope L
0 0 0 0 1 1 3.356
87 Snope Common L
0 0 0 0 1 1 3.356
93 Coanwood L 0 0 0 0 1 0 3.356
94 Knight's Cleugh L
0 0 0 0 1 0 3.356
95 Knockshield Moor L
0 0 0 0 1 0 3.356
96 Middleton Teesdale L
0 0 0 0 1 8 3.356
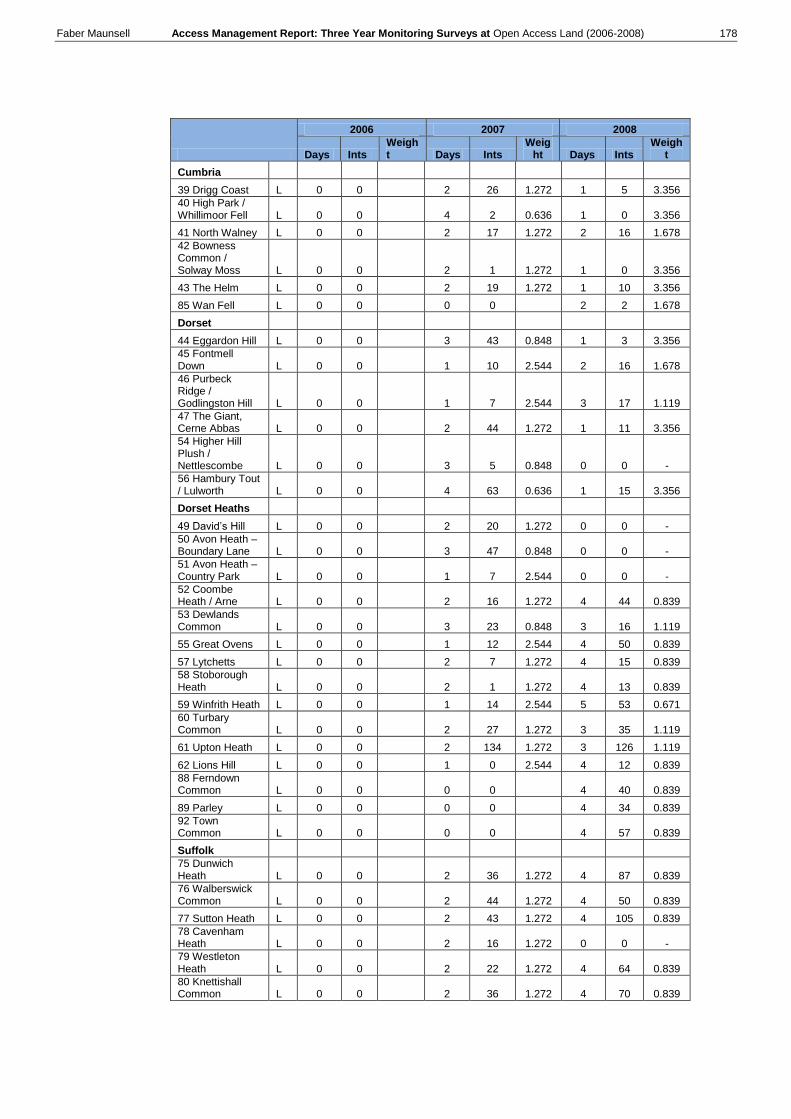
Faber Maunsell Access Management Report: Three Year Monitoring Surveys at Open Access Land (2006-2008) 178
2006 2007 2008
Days Ints Weight Days Ints
Weight Days Ints
Weight
Cumbria
39 Drigg Coast L 0 0 2 26 1.272 1 5 3.356
40 High Park / Whillimoor Fell L 0 0 4 2 0.636 1 0 3.356
41 North Walney L 0 0 2 17 1.272 2 16 1.678
42 Bowness Common / Solway Moss L 0 0 2 1 1.272 1 0 3.356
43 The Helm L 0 0 2 19 1.272 1 10 3.356
85 Wan Fell L 0 0 0 0 2 2 1.678
Dorset
44 Eggardon Hill L 0 0 3 43 0.848 1 3 3.356
45 Fontmell Down L 0 0 1 10 2.544 2 16 1.678
46 Purbeck Ridge / Godlingston Hill L 0 0 1 7 2.544 3 17 1.119
47 The Giant, Cerne Abbas L 0 0 2 44 1.272 1 11 3.356
54 Higher Hill Plush / Nettlescombe L 0 0 3 5 0.848 0 0 -
56 Hambury Tout / Lulworth L 0 0 4 63 0.636 1 15 3.356
Dorset Heaths
49 David‟s Hill L 0 0 2 20 1.272 0 0 -
50 Avon Heath – Boundary Lane L 0 0 3 47 0.848 0 0 -
51 Avon Heath – Country Park L 0 0 1 7 2.544 0 0 -
52 Coombe Heath / Arne L 0 0 2 16 1.272 4 44 0.839
53 Dewlands Common L 0 0 3 23 0.848 3 16 1.119
55 Great Ovens L 0 0 1 12 2.544 4 50 0.839
57 Lytchetts L 0 0 2 7 1.272 4 15 0.839
58 Stoborough Heath L 0 0 2 1 1.272 4 13 0.839
59 Winfrith Heath L 0 0 1 14 2.544 5 53 0.671
60 Turbary Common L 0 0 2 27 1.272 3 35 1.119
61 Upton Heath L 0 0 2 134 1.272 3 126 1.119
62 Lions Hill L 0 0 1 0 2.544 4 12 0.839
88 Ferndown Common L 0 0 0 0 4 40 0.839
89 Parley L 0 0 0 0 4 34 0.839
92 Town Common L 0 0 0 0 4 57 0.839
Suffolk
75 Dunwich Heath L 0 0 2 36 1.272 4 87 0.839
76 Walberswick Common L 0 0 2 44 1.272 4 50 0.839
77 Sutton Heath L 0 0 2 43 1.272 4 105 0.839
78 Cavenham Heath L 0 0 2 16 1.272 0 0 -
79 Westleton Heath L 0 0 2 22 1.272 4 64 0.839
80 Knettishall Common L 0 0 2 36 1.272 4 70 0.839

Faber Maunsell Access Management Report: Three Year Monitoring Surveys at Open Access Land (2006-2008) 179
2006 2007 2008
Days Ints Weight Days Ints
Weight Days Ints
Weight
Lancashire
81 Browns Houses L 0 0 2 24 1.272 0 0 -
82 Jenny Brown's Point L 0 0 2 13 1.272 1 9 3.356
Shropshire
83 Stiperstones L 0 0 3 73 0.848 2 35 1.678
84 The Long Mynd L 0 0 3 27 0.848 3 46 1.119

Faber Maunsell Access Management Report: Three Year Monitoring Surveys at Open Access Land (2006-2008) 180
Estimate of Number of Trips per year
An estimate of the number of trips made per year by visitors has been made whereby daily
visits equal 365 per year, monthly visits as 12 per year etc, to provide a comparison of the
relative numbers visiting sites. Note that this estimate does not represent total visits, as it is
only based on those people interviewed. It does not include group size.
Estimates based on trips per year as follows:
Daily 365
Several Times a week 130
Weekly 52
Several Times a month 25
Monthly 12
Several Times a year 6
Once a year 1
Less Often 0.5
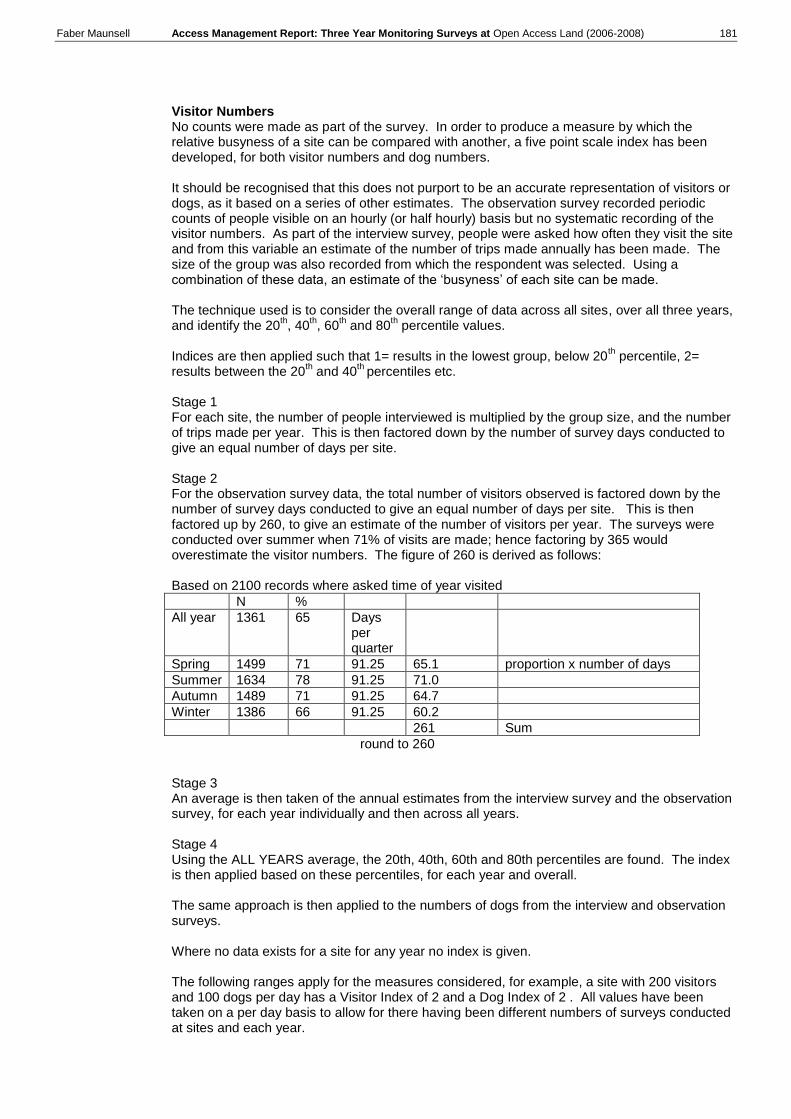
Faber Maunsell Access Management Report: Three Year Monitoring Surveys at Open Access Land (2006-2008) 181
Visitor Numbers No counts were made as part of the survey. In order to produce a measure by which the relative busyness of a site can be compared with another, a five point scale index has been developed, for both visitor numbers and dog numbers. It should be recognised that this does not purport to be an accurate representation of visitors or dogs, as it based on a series of other estimates. The observation survey recorded periodic counts of people visible on an hourly (or half hourly) basis but no systematic recording of the visitor numbers. As part of the interview survey, people were asked how often they visit the site and from this variable an estimate of the number of trips made annually has been made. The size of the group was also recorded from which the respondent was selected. Using a combination of these data, an estimate of the „busyness‟ of each site can be made. The technique used is to consider the overall range of data across all sites, over all three years, and identify the 20
th, 40
th, 60
th and 80
th percentile values.
Indices are then applied such that 1= results in the lowest group, below 20
th percentile, 2=
results between the 20th and 40
th percentiles etc.
Stage 1 For each site, the number of people interviewed is multiplied by the group size, and the number of trips made per year. This is then factored down by the number of survey days conducted to give an equal number of days per site. Stage 2 For the observation survey data, the total number of visitors observed is factored down by the number of survey days conducted to give an equal number of days per site. This is then factored up by 260, to give an estimate of the number of visitors per year. The surveys were conducted over summer when 71% of visits are made; hence factoring by 365 would overestimate the visitor numbers. The figure of 260 is derived as follows: Based on 2100 records where asked time of year visited
N %
All year 1361 65 Days per quarter
Spring 1499 71 91.25 65.1 proportion x number of days
Summer 1634 78 91.25 71.0
Autumn 1489 71 91.25 64.7
Winter 1386 66 91.25 60.2
261 Sum
round to 260
Stage 3 An average is then taken of the annual estimates from the interview survey and the observation survey, for each year individually and then across all years. Stage 4 Using the ALL YEARS average, the 20th, 40th, 60th and 80th percentiles are found. The index is then applied based on these percentiles, for each year and overall. The same approach is then applied to the numbers of dogs from the interview and observation surveys. Where no data exists for a site for any year no index is given. The following ranges apply for the measures considered, for example, a site with 200 visitors and 100 dogs per day has a Visitor Index of 2 and a Dog Index of 2 . All values have been taken on a per day basis to allow for there having been different numbers of surveys conducted at sites and each year.

Faber Maunsell Access Management Report: Three Year Monitoring Surveys at Open Access Land (2006-2008) 182
Visitor and Dog Indices
Percentile Visitor Numbers Dogs Index Description
0 0 0 1 Very low use
0.2 213 30 2 Low use
0.4 1386 283 3 Average use
0.6 3415 683 4 High use
0.8 5366 1916 5 Very high use
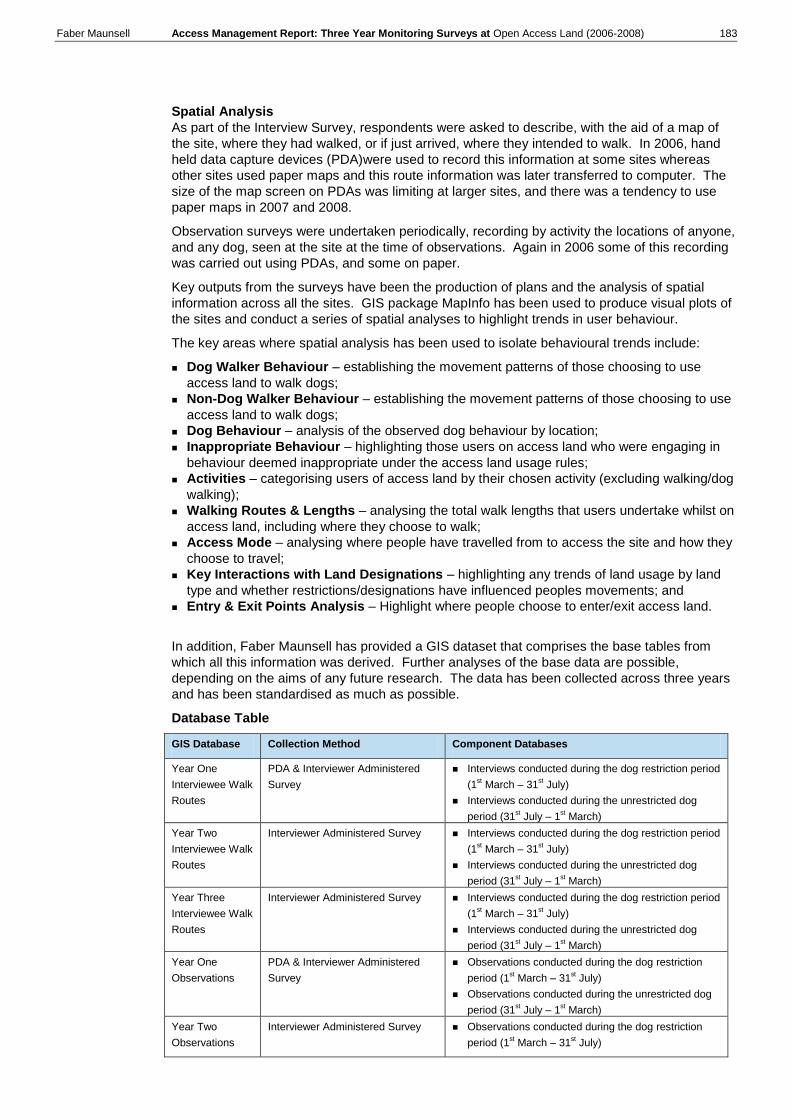
Faber Maunsell Access Management Report: Three Year Monitoring Surveys at Open Access Land (2006-2008) 183
Spatial Analysis
As part of the Interview Survey, respondents were asked to describe, with the aid of a map of
the site, where they had walked, or if just arrived, where they intended to walk. In 2006, hand
held data capture devices (PDA)were used to record this information at some sites whereas
other sites used paper maps and this route information was later transferred to computer. The
size of the map screen on PDAs was limiting at larger sites, and there was a tendency to use
paper maps in 2007 and 2008.
Observation surveys were undertaken periodically, recording by activity the locations of anyone,
and any dog, seen at the site at the time of observations. Again in 2006 some of this recording
was carried out using PDAs, and some on paper.
Key outputs from the surveys have been the production of plans and the analysis of spatial
information across all the sites. GIS package MapInfo has been used to produce visual plots of
the sites and conduct a series of spatial analyses to highlight trends in user behaviour.
The key areas where spatial analysis has been used to isolate behavioural trends include:
Dog Walker Behaviour – establishing the movement patterns of those choosing to use
access land to walk dogs;
Non-Dog Walker Behaviour – establishing the movement patterns of those choosing to use
access land to walk dogs;
Dog Behaviour – analysis of the observed dog behaviour by location;
Inappropriate Behaviour – highlighting those users on access land who were engaging in
behaviour deemed inappropriate under the access land usage rules;
Activities – categorising users of access land by their chosen activity (excluding walking/dog
walking);
Walking Routes & Lengths – analysing the total walk lengths that users undertake whilst on
access land, including where they choose to walk;
Access Mode – analysing where people have travelled from to access the site and how they
choose to travel;
Key Interactions with Land Designations – highlighting any trends of land usage by land
type and whether restrictions/designations have influenced peoples movements; and
Entry & Exit Points Analysis – Highlight where people choose to enter/exit access land.
In addition, Faber Maunsell has provided a GIS dataset that comprises the base tables from
which all this information was derived. Further analyses of the base data are possible,
depending on the aims of any future research. The data has been collected across three years
and has been standardised as much as possible.
Database Table
GIS Database Collection Method Component Databases
Year One
Interviewee Walk
Routes
PDA & Interviewer Administered
Survey
Interviews conducted during the dog restriction period
(1st March – 31
st July)
Interviews conducted during the unrestricted dog
period (31st July – 1
st March)
Year Two
Interviewee Walk
Routes
Interviewer Administered Survey Interviews conducted during the dog restriction period
(1st March – 31
st July)
Interviews conducted during the unrestricted dog
period (31st July – 1
st March)
Year Three
Interviewee Walk
Routes
Interviewer Administered Survey Interviews conducted during the dog restriction period
(1st March – 31
st July)
Interviews conducted during the unrestricted dog
period (31st July – 1
st March)
Year One
Observations
PDA & Interviewer Administered
Survey
Observations conducted during the dog restriction
period (1st March – 31
st July)
Observations conducted during the unrestricted dog
period (31st July – 1
st March)
Year Two
Observations
Interviewer Administered Survey Observations conducted during the dog restriction
period (1st March – 31
st July)

Faber Maunsell Access Management Report: Three Year Monitoring Surveys at Open Access Land (2006-2008) 184
Observations conducted during the unrestricted dog
period (31st July – 1
st March)
Year Three
Observations
Interviewer Administered Survey Observations conducted during the dog restriction
period (1st March – 31
st July)
Observations conducted during the unrestricted dog
period (31st July – 1
st March)
Dataset Interaction
The spatial analysis conducted during this research required a number of interactions with
existing GIS databases to be isolated. Natural England provided a series of existing datasets
that were used in the analysis. The datasets included:
National Public Rights of Way GIS dataset;
National Access Land Site Boundaries;
Area Management Grant System Case Officer Boundaries;
Landscape Character Type Designations;
Section 15 Areas;
Areas of Outstanding Natural Beauty (AONB) Area Boundaries;
Fire Safety Restrictions;
Discretionary Restrictions;
Nature Conservation Restrictions;
SAC Designations;
SPA Designations;
Sites of Specific Scientific Interest (SSSi) Boundaries; and
Vulnerable Features Boundaries.
In addition, Faber Maunsell created some datasets for use in the analysis that were considered
useful, including:
An „other tracks‟ layer – showing those track on each of the National Sample and NCA site
that were present but not designated PROW; and
Additional Local Monitoring Areas boundaries – included based on returns from the Local
Authorities.
Note that the tracks layer was not coded for the LM sites. Note also that the PROW layer as supplied was incomplete; that is, some PROW shown on paper copies of OS maps were not present on the GIS layer. For the NM sites these were added to the PROW layer for analysis purposes but there may be instances for LM sites where the PROW layer is incomplete.
Production of Plots
Plots for each site have been produced using the interviewee‟s route information as follows:
Walk Routes
Walkers accompanied by Dogs Dataset in General Dog Restriction Period (March to July);
Walkers unaccompanied by Dogs Dataset in General Dog Restriction Period (March to July);
Walkers accompanied by Dogs outside General Dog Restriction Period (March to July);; and
Walkers unaccompanied by Dogs Dataset outside Dog Restriction Period.
Appropriate/Inappropriate Behaviour
A range of behaviours that access land users were engaging in were recorded as a key part of
the observation survey process. Based on these categorisations, spatial plots of each site were
created, showing where Access Land users were located. The recorded behaviours were
categorised into two classes:
Appropriate behaviour: behaviour that users are entitled to engage in on Access Land; and
Inappropriate behaviour: behaviour the users are not entitled to engage in on Access Land.

Faber Maunsell Access Management Report: Three Year Monitoring Surveys at Open Access Land (2006-2008) 185
These two types of behaviours are shown below. There were a total of eight appropriate
behaviours recorded across the survey periods and six inappropriate behaviours.
Appropriate and Inappropriate Behaviours
Appropriate Behaviours Inappropriate Behaviour
Ball Games
Biking
Horse Riding
Picnics
Running
Enjoying Scenery
Sitting and Resting
Other
Walking on Restrictions
Picking flowers
Non-Motorised Vehicle Use
Motorised Vehicle Use
Fire Risk
Other
Analysis of Walking Routes
The walk route data has been used in conjunction with the following datasets:
Public Rights of Way (PROW) Spatial Data Layer;
„Other‟ Tracks (but not rights of way) Layer; and
Restrictions/Land Types Layer.
Walk Routes on PROW, ’Other’ Tracks and Access Land
The PROW and the „other‟ tracks layers were created using the standard line drawing tool.
However, in order to account for interviewer recording error, the line based datasets were
converted into regions. A 20m buffer was created around both line datasets, so that that line
analysis could be conducted on the walk routes datasets.
The data layers were used to identify where participants were walking and how much of their
relative journey was on each track, path or access land. For instance, a line length analysis on
the walk route dataset, when cross-referenced against the PROW layer and the „other‟ tracks
layer, would establish how much of that persons journey was on a PROW, an „other‟ track and
on access land.
Access to Each Site
The interview survey recorded the home postcodes of respondents, and which mode had been
used to get to the site (though not for some of the LM Sites). Origin plots of the postcodes and
the modes used have been created for each site.
Entry and Exit Point Analysis
Using Mapinfo, a count was made of the number of recorded walk routes intersecting with the
site boundary at an access point to produce an entry/exit point count. A buffer was set around
the access point of 50m to allow for vagaries of recording.
The counts for each site were analysed, and the maximum identified. The average maximum
over all sites was then identified – this was 23. A five point scale is then derived, such that 1=
very low, 2= low, 3 = medium, 4 = busy 5= very busy using the figure of 23 as the value at
which a site is denoted as very busy, as follows:
Very Low1 0-6
Low 2 6-11
Medium 3 11-17
Busy 4 17-23
Very busy5 +23

Faber Maunsell Access Management Report: Three Year Monitoring Surveys at Open Access Land (2006-2008) 186
Plots show each entry point and the level of entries/exits, both in figures, and colour coded to the thematic scheme above.
Dog Behaviour
Surveyors were asked to record the observed behaviour of dogs that they saw at each site.
The number of possible behaviours changes slightly between the three years because the
questionnaire was refined over time. These behaviours can be categorised into those involving
the owner and those not involving the owner.
Recording of Dog Behaviour Years One to Three
Year One Year Two Year Three
Involving Owner
Off-Lead to Heel
Off-Lead Roaming
On-Lead
Not Involving Owner
Controlled
Disturbing Birds
Disturbing Others
Disturbing Livestock
Disturbing Visitors
Involving Owner
Off-Lead to Heel
Off-Lead Roaming
On-Lead
Not Involving Owner
Controlled
Disturbing Livestock
Disturbing Others
Disturbing Wildlife
Uncontrolled
Involving Owner
Off-Lead to Heel
Off-Lead Roaming
On-Lead
Not Involving Owner
Controlled
Disturbing Livestock
Disturbing Other Dogs
Disturbing Others
Disturbing Wildlife
Uncontrolled

Annex 2
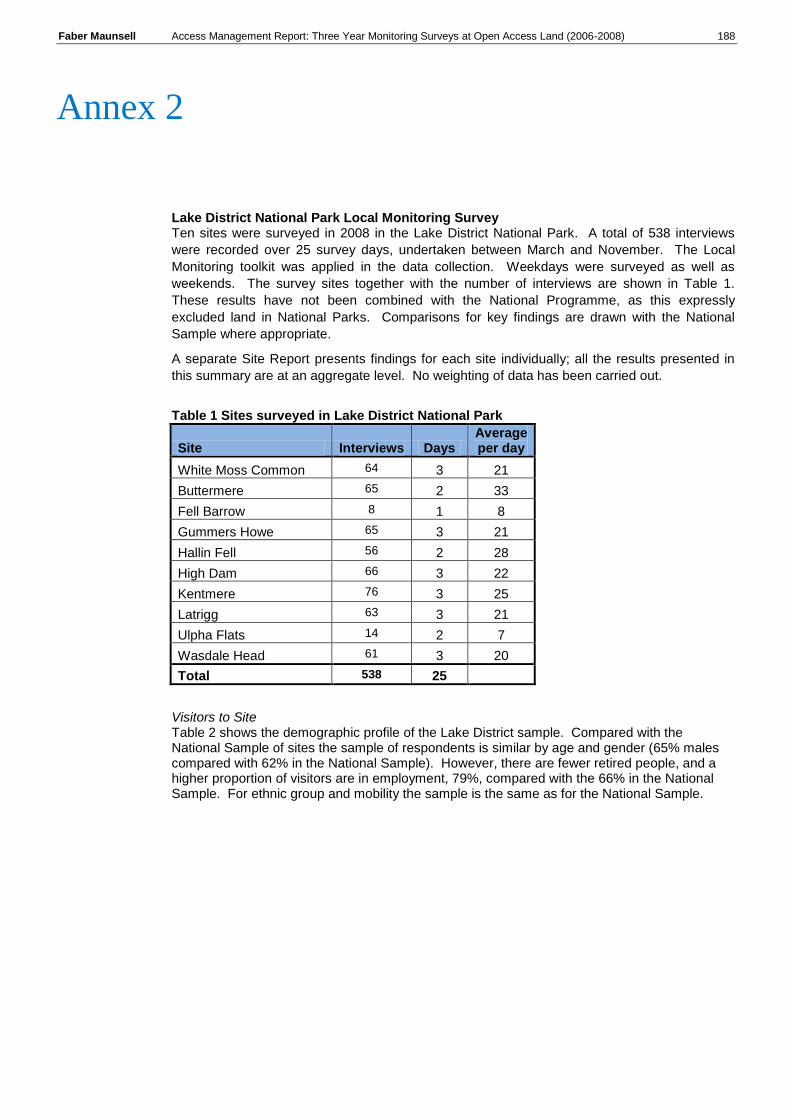
Faber Maunsell Access Management Report: Three Year Monitoring Surveys at Open Access Land (2006-2008) 188
Lake District National Park Local Monitoring Survey Ten sites were surveyed in 2008 in the Lake District National Park. A total of 538 interviews
were recorded over 25 survey days, undertaken between March and November. The Local
Monitoring toolkit was applied in the data collection. Weekdays were surveyed as well as
weekends. The survey sites together with the number of interviews are shown in Table 1.
These results have not been combined with the National Programme, as this expressly
excluded land in National Parks. Comparisons for key findings are drawn with the National
Sample where appropriate.
A separate Site Report presents findings for each site individually; all the results presented in
this summary are at an aggregate level. No weighting of data has been carried out.
Table 1 Sites surveyed in Lake District National Park
Site Interviews Days Average per day
White Moss Common 64 3 21
Buttermere 65 2 33
Fell Barrow 8 1 8
Gummers Howe 65 3 21
Hallin Fell 56 2 28
High Dam 66 3 22
Kentmere 76 3 25
Latrigg 63 3 21
Ulpha Flats 14 2 7
Wasdale Head 61 3 20
Total 538 25
Visitors to Site Table 2 shows the demographic profile of the Lake District sample. Compared with the National Sample of sites the sample of respondents is similar by age and gender (65% males compared with 62% in the National Sample). However, there are fewer retired people, and a higher proportion of visitors are in employment, 79%, compared with the 66% in the National Sample. For ethnic group and mobility the sample is the same as for the National Sample.
Annex 2

Faber Maunsell Access Management Report: Three Year Monitoring Surveys at Open Access Land (2006-2008) 189
Table 2 Visitors to Site
Count Column N %
What age group do you belong in? 0-15 4 *
16-24 26 5
25-34 56 11
35-44 150 28
45-59 197 37
60+ 96 18
What is your employment status? Employed 366 79
Not Working 14 3
Student 17 4
Retired 68 15
Do you have any longstanding illness or disability?
Yes 43 10
No 381 90
Which of these groups do you belong to?
White British 480 96
White other 11 2
Asian 5 1
Mixed 3 1
Black 1 *
Chinese 1 *
Gender Male 341 65
Female 181 35
Base All 538
Table 3 shows that almost two thirds, 65% of visitors were holiday-makers, and a further 14% were on a day trip from home. These proportions are much higher than for the National Sample, where 88% of trips originated from people living locally. Those travelling on day trips had travelled an average of 52 miles to get to the survey location, with 6% travelling more than 100 miles, and those from holiday accommodation 18 miles on average. Table 3 Distance Travelled to Site (miles) by Visitor Type
Do you live locally, are you on a day trip from home or are you on holiday?
Mean Distance Travelled to Site (miles) Valid N Column N %
Live locally 13.7 113 21
Day trip from home 52.1 77 14
On holiday / staying away from home
18.1 346 65
Total 22.1 536
A quarter (26%) of visits were being made for the first time for all visitors, see Table 4, but for people who lived locally this proportion was 6%, and for holiday makers, 33%. Over half, 58% said they had been visiting the area for more than 5 years, and this was the case for 79% of those living locally.

Faber Maunsell Access Management Report: Three Year Monitoring Surveys at Open Access Land (2006-2008) 190
Table 4 Visits to Site
How long have you been visiting this area of land?
Do you live locally, are you on a day trip from home or are you on holiday?
Live locally %
Day trip from home
%
On holiday / staying away from home
% Total
%
Today is my first visit 6 24 33 26%
Less than 1 year 2 4 5 4%
More than 1 year and up to 2 years 4 5 4 4%
More than 2 years and up to 3 years 4 4 4 4%
More than 3 years and up to 5 years 4 4 2 3%
More than 5 years 79% 59 51 58
All 113 77 346 536
Row N % 21% 14% 65% 100%
Table 5 shows that more than a third, 36% said they had always known about the site they were visiting; 63% of those living locally. Respondents on a day trip were those most likely to have found out via some means of promotion, 17% compared with 5% of locals and 13% of holiday-makers.
Table 5 Site Promotion
How did you originally become aware of this particular area of land?
Do you live locally, are you on a day trip from home or are you on holiday?
Live locally %
Day trip from home
%
On holiday / staying away from home
% Total
%
Local knowledge / Always known 63 30 29 36
Friends / family 16 25 32 27%
Promotion / Press / website
5 17 13 12%
Other 16 29 26 24
All Count 113 77 346 536
Row N % 21% 14% 65% 100%
There are differences in the pattern of visits by trip origin, see Table 6. Of those who live locally, 7% visit daily and a further 4% more than once a week. This pattern of visits is very different to that for the National Sample where 23% of visits are made daily and 11% are first time visits..

Faber Maunsell Access Management Report: Three Year Monitoring Surveys at Open Access Land (2006-2008) 191
Table 6 Frequency of Visit
About how often do you visit this area of land?
Do you live locally, are you on a day trip from home or are you on holiday?
Live locally %
Day trip from home
%
On holiday / staying away from home
% Total
%
Daily 7 0 0 2%
Regularly – more than once a week 4 0 1 1%
Often – more than monthly, less than weekly
19 9 4 8
Infrequently – less than monthly 63 68 60 62
First time visit today 7% 23 35 27
All Count 113 77 346 536
Row N % 21% 14% 65% 100%
More than half of interviewees (53%) were at the site to take a short stroll, with 31% saying they were there for a serious walk or hike, see Figure 1, showing all the responses given. Almost a third of people gave more than one reason for visiting; just 7% were there purely to walk a dog although 17% mentioned this in total. The scenery was the main reason for being at the site for just 2% though 15% mentioned this overall. Only 9% of visitors interviewed were at the site alone, compared with the 42% in the National Sample. This reflects the purpose of the visit; far more dog walkers were included in the National Sample (42%), who have a greater tendency to visit alone. Table 7 shows the activities of visitors recorded in the observation survey. There are fewer dog walkers observed, 6% than suggested by the interview survey, though as these tend to be at the site for less time there is less potential that they will be observed. It is not always possible to identify amblers from ramblers, however, the observed data matches the interview data well. Figure 1 Activities at Site
0 10 20 30 40 50 60
Short stroll/ ambling
Serious walking/ rambling/ hiking
Dog walking
Enjoying the scenery/ nature
Other
Bike riding
Photography/ drawing/ painting
Running/ jogging
Other outdoor activity/sport
Rock climbing
Getting some exercise
53
31
17
15
3
3
2
1
1
0
0
All Sites Base 538 Multiple response - may sum to more than 100

Faber Maunsell Access Management Report: Three Year Monitoring Surveys at Open Access Land (2006-2008) 192
Table 7 Activities Observed: Observation Survey
Visitors Observed Column % Ambling 773 49 Rambling 377 24 Dog Walking 88 6 Jogging 4 0
Enjoying scenery/nature 65 4
Bike Riding 27 2
Horse Riding 7 0
Picnics 72 5
Sitting 144 9
Ball or Other Games 11 1
Other Activity 0 0
TOTAL 1568
The remoteness and tranquillity of the site were the main reasons mentioned for visiting, by 53% of visitors, and a fifth, 21% mentioned the scenery and landscape. One in six people mentioned getting exercise. Other reasons specific to each site were recorded. Nine people specifically mentioned Wainwright as their inspiration, Table 8 Attractions of Site
Count Column % Remoteness / tranquillity of the area of land 283 53 Scenery/ Landscape/ pleasant area 112 21 Exercise 86 16 Always come here 65 12 Mentioned Easy/ Accessible walk 44 8 Accessibility/ Proximity of the area of land 32 6 En route/ part of a longer route 30 6 Previous Visit 8 1 For the Hills 5 1 For a Change / Somewhere new, different 5 1 Challenging walk/ climb/ feature 4 1 Space for dog to run 3 1 Parking provision at the area of land 3 1
Base 538
Two thirds, 66% of visitors said they had heard of Open Access. This is a similar proportion as for the National Sample, 68%. By purpose of visit, dog walkers appear to have the greatest awareness, contrasting with the results from the National Sample, but note that here the sample size is very small and this proportion should be treated with caution.

Faber Maunsell Access Management Report: Three Year Monitoring Surveys at Open Access Land (2006-2008) 193
Table 9 Awareness of Open Access
Have you heard of Open Access?
Main Reason for being at site
Short stroll/
ambling
Serious walking/
rambling / hiking
Dog walking
Enjoying the
scenery/ nature
Other
More than one
Total
Yes Count 122 88 28 5 17 79 339
Column N % 62% 66% 78% 38% 74% 71% 66%
No Count 61 41 8 8 6 27 151
Column N % 31% 31% 22% 62% 26% 24% 29%
Not Sure Count 15 5 0 0 0 5 25
Column N % 8% 4% 0% 0% 0% 5% 5%
Total Count 198 134 36 13 23 111 515
Column N % 100% 100% 100% 100%
100%
100% 100%
Under a third of respondents were aware that the site being visited was Open Access Land, 31% (see Table 10). There are no significant differences by reason of visit. This is not dissimilar to the National Sample.
Table 10 Awareness of Status of Area as Open Access
Are you aware that since 2005 this area of land has been designated as Open
Access Land?
Main Reason for being at site
Short stroll/
ambling
Serious walking/
rambling / hiking
Dog walking
Enjoying the
scenery/ nature
Other
More than one
Total
Yes Count 60 37 10 2 6 43 158
Column N % 32% 29% 29% 15% 26% 36% 31%
No Count 112 83 23 9 17 75 319
Column N % 60% 64% 66% 69% 74% 63% 63%
Not sure Count 14 9 2 2 0 2 29
Column N % 8% 7% 6% 15% 0% 2% 6%
Total Count 186 129 35 13 23 120 506
Column N % 100% 100% 100% 100%
100%
100% 100%

Faber Maunsell Access Management Report: Three Year Monitoring Surveys at Open Access Land (2006-2008) 194
Dogs at Site Although only 7% of respondents were at the site specifically to walk a dog, 25% of interviewees had a dog with them, see Table 11. This proportion was higher, though not significantly so, between March and July, in the period of general dog restrictions. From the observation survey, 54 dogs were recorded in total; 24 of these in the period of general dog restrictions. No dogs were recorded as being uncontrolled; a third were on leads, a fifth to heel and the remaining roaming. There were 1568 visitors observed, suggesting there are about 30 visitors for every dog.
Table 11 Dogs at Site in Period of Restrictions: Visitor Interview
Survey in Dog Restrictions Period
In Dog restrictions period
Not in Dog restrictions period Total
Dog in Group Dog in Group Count 52 83 135
Column N % 29% 23% 25%
No Dog in Group Count 129 274 403
Column N % 71% 77% 75%
Total Count 181 357 538
Column N % 100% 100% 100%
Table 12 Dogs at Site in Period of Restrictions: Observation Survey
In restrictions period
Not in restrictions period All
Dog on lead 6 25% 12 40% 18 33%
Dog off lead to heel 8 33% 3 10% 11 20%
Dog off lead roaming 10 42% 15 50% 25 46%
Dogs (n) 24
30
54 Controlled 4 17% 4 13% 8 15%
Uncontrolled 0 0% 0 0% 0 0%
Disturbing other people 0 0% 0 0% 0 0%
Disturbing livestock 0 0% 0 0% 0 0%
Disturbing Wildlife 0 0% 0 0% 0 0%
Other non control 0 0% 0 0% 0 0%
Dogs were observed at all the sites except Fellbarrow. When asked why the site was good for bringing a dog to, being able to run off the lead was the most usual response, mentioned by 55% of those who responded. The dog‟s enjoyment was also mentioned by 51% of respondents, see Table 13.

Faber Maunsell Access Management Report: Three Year Monitoring Surveys at Open Access Land (2006-2008) 195
Table 13 Why is site good for bringing a dog
What aspects about this area of land make it good for bringing a dog here? Count
Column N %
Able to let dog run off lead 65 55
No/ not many other dogs 14 12
No/ not many other people 17 14
No restrictions on dogs being here 45 38
Dogs enjoy it here 61 51
Don't have to pick up dog mess 3 3
No livestock 29 24
Things for dogs to chase 2 2
Nothing in particular - I like the walk/ convenient for me 28 24
Other 3 3
Good exercise/ open spaces 3 3
Dogs can swim 15 13
Safe-no traffic or other hazards 3 3
Multiple response - sum to more than 100%
Almost two fifths, 38% of respondents said they had been walking dogs at the site for more than 5 years, and a further fifth, more than two years. Only one person of the 112 asked said they never had their dog on a lead, and this person had been visiting for more than 5 years. Table 14 How long have you been
Count Column N %
For how long, in years, have you been walking your dog(s) on this area of land?
Today is my first visit 31 28
Less than 1 year 7 6
More than 1 year up to 2 years 10 9
More than 2 years up to 3 years 13 12
More than 3 years up to 5 years 8 7
More than 5 years 43 38
Total 112 100
Respondents were asked how they would control their dog in given situations: Table 15 shows that 93% said they would put their dog on a lead if signs or information were present asking them to do so. Note: there is no comparable data from the National Sample as this was asked differently. However, this response contrasts with the Local Monitoring survey for the 53 sites surveyed, when 76% gave this answer. For each of the circumstances mentioned, the intention to put the dog on a lead is higher for those interviewed in the Lake District National Park than at other surveyed sites. Almost 90% said they would use a lead when livestock were close by, and three quarters would in the shooting season (even though there is little shooting in the areas of the Lake District surveyed). Almost three fifths would do so if wild birds were close by.

Faber Maunsell Access Management Report: Three Year Monitoring Surveys at Open Access Land (2006-2008) 196
Table 15 Proportion who said they would use a lead if...
% Count
On a public right of way 36% 105
On access land NOT on a PROW 46% 96
If wild birds are close by 59% 102
If signs/information say to keep on lead 93% 104
If other dogs are close by 41% 104
If livestock close by 89% 109
In nesting season 66% 101
In shooting season 75% 88
Multiple response - sum to more than 100%
Use of Open Access Land Respondents were asked to estimate the proportion of their walk that was on public rights of
way, on tracks that are not PROW and on Open Access Land with no obvious paths. Almost
one in seven, 14% were unable to make a guess at all.
Of those who did make an estimate, almost three quarters, 73% said their entire walk was on
PROW, 5% said their entire walk was on tracks and 1% estimated that their entire walk was on
land with no obvious tracks.
Analysis of the walk lengths has been conducted, including the total walk recorded in the
interview; the length of walk that crossed an area mapped as Open Access Land, and that
where PROW were used on the area of Open Access land site.
The average distance recorded by interviewees was 3.14km. Of this, 1.55km was within areas
of land mapped as Open Access Land, of which 0.79km was on PROW (51%) and the
remaining 0.76km not on PROW. It should be noted that some interview locations were not
actually on areas of Open Access land. Also note that walks may be on paths or tracks that are
not PROW; no mapping is available to analyse against.
Table 16 Walks at Site
Dog in Group
Dog in Group No Dog in Group Total
Mean Valid N Mean Valid N Mean Valid N
Walk total distance 3.14 128 3.13 378 3.14 506
Walk on site distance 1.49 127 1.57 358 1.55 485
walk on PROW .82 127 .78 358 .79 485
Walk on OAL .67 127 .79 358 .76 485
Proportion on PROW 55%
50%
51% Proportion on OAL 45%
50%
49%
Note: walk lengths based on analysis in MapInfo.
The average walk length at National Sample sites was much less, at 2km, although the proportion off PROW was very similar at 53%.

Faber Maunsell Access Management Report: Three Year Monitoring Surveys at Open Access Land (2006-2008) 197
Around 1 in 14 respondents (7%) estimated that none of their walk was on PROW, and 8%
judged that half of their walk was on PROW. A high proportion, 95% thought that none of their
walk was on Open Access land with no obvious paths,
People were asked why they had stayed on paths or PROW and not used land without paths or
PROW. The most often given response was that “The public right of way takes me to where I
want to be so no need to stray from it” (28%) and “Easier to walk on a public right of way/
terrain” (28%). Almost a quarter (23%) mentioned that it was safer on a PROW. Almost one in
ten (9%) said they needed more information about Open Access, and 7% said they were
unsure if they had permission to stray from the path.
Table 17 Why Stay on Paths/PROW
Dog in Group Base:
Dog in Group
No Dog in
Group Total
Those who
thought they
had not used OAL
Count Count Count 445 Need more information about Open Access 8 31 39 9% Unsure whether I had permission to stray from the public right of way
10 20 30 7%
Unsure which areas are open access land 8 24 32 7% Anxious about getting lost 5 30 35 8% Safer on a public right of way 23 79 102 23% Nothing extra to see by going off public right of way 9 35 44 10% Was unsure if farmer/ landowner was present 0 1 1 0% Have a dog and assumed dogs are banned from open access
3 0 3 1%
The public right of way takes me to where I want to be so no need to stray from it
27 99 126 28%
Easier to walk on a public right of way/ terrain 33 93 126 28% Did not want to disturb wildlife or cattle 4 7 11 2% Following specific route 2 9 11 2% Too Wet 2 5 7 2%
Summary Respondents at the surveys conducted in the Lake District National Park differ from those at the National Sample sites, in that they are much less likely to have travelled from home, and hence make less frequent visits to the surveyed sites. They are however similar in demographics. There are fewer visits solely for dog walking. Awareness of Open Access appears to be higher amongst the Lake District respondents, and where visitors are accompanied by dogs, the propensity to control dogs appears to be greater. Visitors walk longer distances at the Lake District sites, but the usage of land off PROW on areas of Open Access land is very similar.