Embed Size (px)
Citation preview
County of Prince William, Virginia
Comprehensive Annual Financial Report for the Fiscal Year Ended June 30, 2013
BOARD OF COUNTY SUPERVISORS
Corey A. Stewart, Chairman (at large)
W.S. Wally Covington, III, Vice‐Chairman, Brentsville District
Maureen S. Caddigan, Potomac District
Pete Candland, Gainesville District John D. Jenkins, Neabsco District Michael C. May, Occoquan District Martin E. Nohe, Coles District
Frank J. Principi, Woodbridge District
COUNTY EXECUTIVE
Melissa S. Peacor
DIRECTOR OF FINANCE
Steven A. Solomon
Prepared by the Department of Finance


This Report Prepared By:
Department of Finance One County Complex Court
Prince William, Virginia 22192‐9201
(703) 792‐6700
DIRECTOR OF FINANCE
Steven A. Solomon
DEPUTY FINANCE DIRECTOR Michelle L. Attreed
FINANCE DEPARTMENT STAFF
Rene L. Gapasin, Financial Reporting & Control Division Chief
Steve Ferlotti, Tax Administration Division Chief
Adam Manne, Purchasing Division Chief
Allison C. Lindner, Real Estate Assessments Division Chief
Allen B. Scarbrough, Treasury Manager
Lori Gray, Risk Management Division Chief
Bhavana Nichani, Chief Accountant
Sharon R. Gill Paul R. Fitzgerald Helen A. Hutchings‐Bogart Irasela Flores
Natalie Berger Lisa R. Murray Sharon A. Bagford Mandy M. McGee

TABLE OF CONTENTS
Introductory Section Letter of Transmittal ........................................................................................................ 1 Certificate of Achievement for Excellence in Financial Reporting ................................... 15 Organization of Prince William County Government ....................................................... 16
Financial Section Report of Independent Auditor ...................................................................................... 19 Management’s Discussion and Analysis ......................................................................... 23 Basic Financial Statements Government‐Wide Financial Statements: Exhibit 1 Statement of Net Position ............................................................... 38 Exhibit 2 Statement of Activities .................................................................... 40 Fund Financial Statements: Governmental Fund Financial Statements Exhibit 3 Balance Sheet .................................................................................. 42 Exhibit 4 Reconciliation of the Balance Sheet of Governmental Funds to the Statement of Position .............................................................. 43 Exhibit 5 Statement of Revenues, Expenditures and Changes in Fund Balances ......................................................................................... 44 Exhibit 6 Reconciliation of the Statement of Revenues, Expenditures and Changes in Fund Balances of Governmental Funds to the Statement of Activities ................................................................... 45 Proprietary Fund Financial Statements Exhibit 7 Statement of Fund Net Position ...................................................... 46 Exhibit 8 Statement of Revenues, Expenses, and Changes in Fund Net Position ................................................................................... 47 Exhibit 9 Statement of Cash Flows ................................................................. 48 Fiduciary Fund Financial Statements Exhibit 10 Statement of Fiduciary Net Position................................................ 50 Exhibit 11 Statement of Changes in Fiduciary Net Position ............................. 51 Component Unit Financial Statements Exhibit 12 Combining Statement of Net Position ............................................. 52 Exhibit 13 Combining Statement of Activities .................................................. 54
TABLE OF CONTENTS (cont’d) Notes to Financial Statements Note 1 – Summary of Significant Accounting Policies ......................................... 57 Note 2 – Cash and Investments ........................................................................... 71 Note 3 – Property Taxes Receivable .................................................................... 79 Note 4 – Unearned Revenue ............................................................................... 80 Note 5 – Investment in Direct Financing Leases/Accounts Receivable ............... 81 Note 6 – Due From and To Other Governmental Units ....................................... 82 Note 7 – Interfund Receivables, Payables and Transfers .................................... 83 Note 8 – Receivables/Payables with Component Units ...................................... 85 Note 9 – Capital Assets ........................................................................................ 86 Note 10 – Joint Ventures ....................................................................................... 91 Note 11 – Long‐Term Debt .................................................................................... 92 Note 12 – Fund Balances/Net Position .................................................................. 98 Note 13 – Landfill/Closure and Postclosure Care Cost .......................................... 99 Note 14 – Defined Benefit Pension Plans .............................................................. 99 Note 15 – Other Post‐Employment Benefit (OPEB) Plans ..................................... 105 Note 16 – OPEB Master Trust Fund ....................................................................... 113 Note 17 – Interjurisdictional Agreement ............................................................... 116 Note 18 – Related Organizations ........................................................................... 116 Note 19 – Commitments and Contingencies ......................................................... 118 Note 20 – Self Insurance ........................................................................................ 118 Note 21 – Subsequent Events ............................................................................... 119
Required Supplementary Information (Unaudited) Schedule 1 Schedule of Budgetary Revenues, Budgetary Expenditures, and and Changes in Budgetary Fund Balance – Budget and Actual – General Fund ................................................................... 123 Schedule 2 Schedule of Funding Progress – Post‐Employment Benefit Plans .................................................................................. 128 Supplementary Information Nonmajor Governmental Funds Schedule 3 Combining Balance Sheet – Special Revenue Funds ....................... 132 Schedule 4 Combining Statement of Revenues, Expenditures and Changes in Fund Balances – Special Revenue Funds ....................................... 134 Schedule 5 Schedule of Budgetary Revenues, Budgetary Expenditures and Changes In Budgetary Fund Balance – Budget and Actual – Transportation Districts ................................................................. 136
TABLE OF CONTENTS (cont’d) Schedule 6 Schedule of Budgetary Revenues, Budgetary Expenditures and Changes in Budgetary Fund Balance – Budget and Actual – Stormwater Management District/Gypsy Moth Levy .................... 137 Schedule 7 Schedule of Budgetary Revenues, Budgetary Expenditures and Changes In Budgetary Fund Balance – Budget and Actual – Development Fee Services ............................................................. 138 Schedule 8 Schedule of Budgetary Revenues, Budgetary Expenditures and Changes In Budgetary Fund Balance – Budget and Actual – Housing .......................................................................................... 139 Internal Service Funds Schedule 9 Combining Statement of Net Position ............................................. 141 Schedule 10 Combining Statement of Revenues, Expenses and Changes in Net Position ................................................................................ 142
Schedule 11 Combining Statement of Cash Flows ............................................... 143 Fiduciary & Agency Funds Schedule 12 Statement of Fiduciary Net Position – OPEB Master Trust ............. 147 Schedule 13 Statement of Changes in Fiduciary Net Position – OPEB Master Trust ......................................................................... 148
Schedule 14 Statement of Fiduciary Net Position – Private Purpose Trust ......... 149 Schedule 15 Statement of Changes in Fiduciary Net Position – Private Purpose Trust ..................................................................... 150
Schedule 16 Combining Statement of Fiduciary Net Position ............................. 151 Schedule 17 Combining Statement of Changes in Assets and Liabilities ............. 152 Discretely Presented Component Unit – Adult Detention Center (ADC) Schedule 18 Combining Balance Sheet ............................................................... 154 Schedule 19 Combining Statement of Revenues, Expenditures and Changes in Fund Balances ........................................................................... 155 Schedule 20 Schedule of Revenues, Expenditures and Changes In Fund Balance – Budget and Actual – General Operating Fund............... 156
Debt Obligations Schedule 21 Schedule of Bonds, Capital Leases, and Other Long‐Term Debt – Governmental Funds .......................................................... 158
Schedule 22 Schedule of Bonds, Capital Leases, and Other Long‐Term Debt – Enterprise Funds ............................................................... 164

TABLE OF CONTENTS (cont’d)
Statistical Section Table 1 Net Position by Component ................................................................ 166 Table 2 Changes in Net Position ...................................................................... 168 Table 3 Fund Balances, Governmental Funds ................................................. 170 Table 4 Changes in Fund Balances, Governmental Funds ............................... 172 Table 5 Changes in Net Position, Supplemental Retirement Plan................... 174 Table 6 General Governmental Revenues by Source ...................................... 176 Table 6A General Governmental Tax Revenues by Source ............................... 176 Table 7 Assessed Value and Actual Value of Taxable Real Property ............... 178 Table 7A Commercial to Total Assessment Ratio, Construction and Bank Deposits .................................................................................... 178 Table 8 Direct and Overlapping Real Estate Tax Rates .................................... 180 Table 9 Principal Real Property Tax Payers ..................................................... 182 Table 10 Real Property Tax Levies and Collections ........................................... 183 Table 11 Ratios of Outstanding Debt by Type, Primary Government and Component Units .............................................................................. 184 Table 12 Ratios of General Bonded Debt Outstanding ..................................... 186 Table 13 Direct and Overlapping Governmental Activities Debt ...................... 187 Table 14 Debt Ratio Information ....................................................................... 188 Table 15 Revenue Bond Coverage for Solid Waste System Revenue Bonds ..... 190 Table 16 Demographic and Economic Statistics ................................................ 191 Table 16A Comparative Demographic Statistics .................................................. 191 Table 17 Principal Employers ............................................................................ 192 Table 18 Full‐Time Equivalent County Government Employees by Function ... 193 Table 19 Operating Indicators by Function ....................................................... 194 Table 20 Capital Asset Statistics by Function .................................................... 195 Table 21 Personal Property Tax Rates and Assessments .................................. 196 Table 22 General Governmental Expenditures by Function ............................. 198 Table 22A Capital Projects Expenditures by Function ......................................... 198 Table 23 Miscellaneous Statistical Data ............................................................ 200 Table 24 Schedule of Surety Bonds ................................................................... 201

TABLE OF CONTENTS (cont’d)
Compliance Section Schedule of Expenditures of Federal Awards ......................................................... 203 Notes to Schedule of Expenditures of Federal Awards .......................................... 211 Report of Independent Auditor’s on Internal Control Over Financial Reporting and on Compliance and Other Matters Based on an Audit of Financial Statements Performed in Accordance with Government Auditing Standards ........................ 213
Report of Independent Auditor’s on Compliance for Each Major Program and On Internal Control Over Compliance Required By OMB Circular A‐133 ...... 215
Schedule of Findings and Questioned Costs .......................................................... 217 Corrective Action Plan ............................................................................................ 220


December 23, 2013
Mr. Chairman, Members of the Board of County Supervisors, and Citizens of the County of Prince William, Virginia:
We are pleased to present the Comprehensive Annual Financial Report of Prince William County (County) for
the fiscal year ended June 30, 2013. The Code of Virginia requires that all general‐purpose local governments publish, within five months of the close of each fiscal year, a complete set of financial statements presented in conformity with accounting principles generally accepted in the United States of America and audited in accordance with governmental auditing standards generally accepted in the United States of America by a firm of licensed certified public accountants.
This report consists of management’s representations concerning the finances of the County. Consequently,
management assumes full responsibility for the completeness and reliability of all of the information presented in this report. To provide a reasonable basis for making these representations, management of the County has established a comprehensive internal control framework that is designed both to protect the government’s assets from loss, theft, or misuse and to compile sufficient reliable information for the preparation of the County’s financial statements in conformity with Generally Accepted Accounting Principles (GAAP). Because the cost of internal controls should not outweigh their benefits, the County’s comprehensive framework of internal controls has been designed to provide reasonable, rather than absolute, assurance that the financial statements will be free from material misstatement. As management, we assert that, to the best of our knowledge and belief, this financial report is complete and reliable in all material respects.
The County’s financial statements have been audited by Cherry Bekaert LLP, a firm of licensed certified public
accountants. The goal of the independent audit was to provide reasonable assurance that the financial statements of the County for the fiscal year ended June 30, 2013, are free of material misstatement. The independent audit involved examining, on a test basis, evidence supporting the amounts and disclosures in the financial statements; assessing the accounting principles used and significant estimates made by management; and evaluating the overall financial statement presentation. The independent auditor concluded, based upon its audit, that there was a reasonable basis for rendering an unmodified opinion that the County’s financial statements for the fiscal year ended June 30, 2013, are fairly presented in conformity with GAAP. The independent auditor’s report is presented as the first component of the financial section of this report.
The independent audit of the financial statements of the County was part of a broader, federally mandated
“Single Audit” designed to meet the special needs of federal grantor agencies. The standards governing Single Audit engagements require the independent auditor to report not only on the fair presentation of the financial statements, but also on the audited government’s internal controls and compliance with legal
Melissa S. Peacor County Executive
Steven A. Solomon Director of Finance
COUNTY OF PRINCE WILLIAM
1 County Complex Court, Prince William, Virginia 22192-9201 (703) 792-6000 Metro 631-1703 FAX (703) 792-7484
BOARD OF COUNTY SUPERVISORS Corey A. Stewart, Chairman W.S. Wally Covington, III , Vice Chairman Maureen S. Caddigan Pete Candland Martin E. Nohe John D. Jenkins Michael C. May Frank J. Principi
1
requirements, with special emphasis on internal controls and legal requirements involving the administration of federal awards.
GAAP require that management provide a narrative introduction, overview and analysis to accompany the
basic financial statements in the form of Management’s Discussion and Analysis (MD&A). This letter of transmittal is designed to complement the MD&A and should be read in conjunction with it. The County’s MD&A can be found immediately following the report of the independent auditors.
Profile of the Government
Prince William County was discovered by Captain John Smith during an expedition up the Potomac River in
1608. The first known colonial settlement was founded in 1722. In 1730, the Virginia General Assembly carved out an area and named it Prince William County, after the second son of England’s King George II.
The County is located in Northern Virginia, approximately 35 miles southwest of Washington, D.C. and
encompasses an area of 348 square miles, of which 18.8 percent is federally owned land. As of April 1, 2010, the U.S. Census Bureau reported the County’s population at 402,002 persons. According to the Metropolitan Washington Council of Governments (MWCOG), Prince William’s population constitutes 8.2 percent of the Washington‐Metropolitan region’s five million people. Prince William’s location in Metropolitan Washington, D.C. and the availability of excellent transportation by way of regional, national and international airports, freight and passenger rail services and interstate and highway roadways is a catalyst for growth in the County, which continues to provide numerous economic advantages. Within the County’s boundaries are the independent cities of Manassas and Manassas Park and the incorporated towns of Dumfries, Haymarket, Occoquan and Quantico. The towns elect their own mayors and councils, but rely on the County government for many of their services.
The County exercises local governing powers granted to it by the Virginia General Assembly. Since 1972, the
County has operated under the County Executive form of government, as provided in Section 15.2‐500 et seq. VA Code Ann. The policy‐determining body of the County is an eight‐member Board of County Supervisors (Board). Residents in each of the County’s seven magisterial districts elect one member of the Board to serve a term of four years. The eighth member of the Board is elected at‐large by County residents to serve a four‐year term as Chairman. An election was held on November 8, 2011 and the current board members took office in January 2012 and will serve until December 31, 2015.
The County provides a full range of local government services including police, fire and rescue, court services,
education, development administration, libraries, parks and recreational services, health and social services, public improvements, planning and general administration. The County’s School Board, Convention and Visitors Bureau, and Adult Detention Center all have a financial benefit/burden relationship with the County. All of these discretely presented component units issue separately audited financial statements, with the exception of the Adult Detention Center. Sanitation services are provided through a legally separate water and sewer service authority, known as the Prince William County Service Authority. The Service Authority’s operations and capital funds are principally financed by user charges and bond issues. The Authority is solely responsible for all of its outstanding debt. The Authority is not a component unit of the County. Additional information on discretely presented component units and all other entities can be found in Note (1A) in the notes to the financial statements.
The annual budget serves as the foundation for the County’s financial planning and control. Policies governing this process are outlined in the Principles of Sound Financial Management and in the Financial and Program Planning Ordinance. During July through November, all agencies are required to report on prior fiscal year performance in achieving adopted agency outcomes and service levels for review, analysis and recommendations to the Office of Management and Budget (OMB). Department directors meet with budget staff to review prior year performance and upcoming fiscal year goals, objectives, activities, outcomes and service levels. If needed, agencies are required to submit budget increase requests and responses to performance budget targets to OMB in early December. The County Executive presents to the Board a proposed fiscal plan on or before March 1 of each year for the fiscal year beginning July 1.
2

After an extensive review and deliberation process and two public hearings to receive citizen input, the Board makes its decisions on the proposed Fiscal Plan and adopts the Fiscal Plan in mid‐April. The education component of the plan must be adopted on or before May 1, and the non‐education
component must be adopted before July 1 of each year in accordance with the Code of Virginia. The annual budget serves as an integral part of the County’s System for Results‐Oriented Government. Prince William County’s model of effective and efficient government is shown below. The County’s Comprehensive Annual Financial Report is required by its Principles of Sound Financial Management and the Code of Virginia and demonstrates accountability for results in this system.
Prince William County System for Results‐Oriented Government
Local Economy
The Prince William County economy is an important segment of the Washington, D.C. metropolitan area
economy, arguably one of the most dynamic in the world. The area’s economy has proved more resilient than many other parts of the country over the last year. The Prince William County economy during the first half of fiscal 2013 continued a strengthening trend, showing little impact of the federal government’s sequestration to date. The residential real estate market continued to improve in terms of average sold price, number of sales and average days on the market. Unemployment in the County continued to be well below the national rate, but is still high by recent standards. Foreclosure activity, as measured by monthly Courthouse recordings, continued to improve as the year progressed, with fewer than 400 for 2013 through June—an average of less than 70 per month. This is a great improvement over the worst period of the recent downturn, when a record 18,000 foreclosures were recorded in years 2006 to 2010. This trend continues downward from 2012, when fewer than 1,000 foreclosures were recorded. Latest at‐place employment data from the Virginia Employment Commission (1st Quarter 2013) indicate continued growth in establishments, employment and wages in the County. Job growth in Prince William, year‐over‐year, led all Northern Virginia
3

communities. Prince William County’s commercial inventory continues to be elevated in terms of historic vacancy rates; this may be due more to long‐term business planning in anticipation of Defense Department draw‐downs, rather than an immediate reaction to sequestration. That notwithstanding, the Prince William economy appears to be continuing its strengthening trend, even as the impact of sequestration on the local economy has yet to be fully ascertained.
Retail sales continued at a robust pace, with 41 consecutive months of year‐over‐year increases as of June
2013. Never before has the County experienced this many continuous months of increases in sales volume. This upward trend reflects the increased consumer confidence here locally in Prince William County, which mirrors trends seen nationally during 2013.
The local housing market, after a major downturn in 2007 and 2008, stabilized in 2010 and since then has
gained steady momentum through July 2013. The average sold price for a home in Prince William County was $349,256 in July 2013, a year‐over‐year increase of 12.7 percent and an increase of $144,878 (70.9%) since February 2009. As the number of foreclosures continues to drop, expectations are that the average home prices will continue to rise – though a return to the prosperous days of double digit annual appreciation are not anticipated in the near future. The residential real estate outlook is for continued modestly improving conditions over the next several years.
The apartment sector of the County’s residential market has been particularly strong. Tightened mortgage
credit standards required to purchase homes has resulted in increased demand for rental property and higher rents. Additionally, few new apartment units have been built in the County over the last several years further compounding the imbalance between supply and demand. Recently, however, activity in this market segment has accelerated with a number of new projects, either announced or begun. The expectation going forward, as new units are brought to market, apartment values should continue to trend higher over the short term. As the market adjusts to the increase supply of apartment housing, growth rates in rental rates should flatten out along with valuations.
The commercial real estate market in Prince William County remained slightly worse overall in 2013 from one
year earlier. According to Costar Realty Group, a multiple listing service for commercial property, Prince William County commercial inventory included 43.6 million square feet of space in 1,913 buildings. Since 2009, some 1.56 million square feet of commercial space has been added to the inventory, a growth rate of 3.7 percent. Vacancy rates moved slightly higher, year‐over‐year, led by increases in Flex, Industrial and Retail vacancy. In June 2013, a total of 3.72 million square feet of vacant space (including Retail) was reported by Costar, a vacancy rate of 8.5 percent. This represents a modest increase of 118,158 square feet since June 2012, when the total vacancy rate was 8.3 percent; vacant commercial space has declined by 428,170 square feet (‐2.6%) since 2009. Expectations are that the commercial real estate market will improve over the course of the next few years, as the local economy grows.
Prince William County’s population is currently estimated at 418,385 (as of June 30, 2013). Population growth
has been at a slower pace than in past years, particularly before the economic downturn, when annual increases approached 5 percent. Nevertheless, the County will continue to expand its population base as the real estate market continues to strengthen. The Metropolitan Washington Council of Governments predicts the County’s population will grow by over 217,000 people or an increase of 61 percent between the years 2005 and 2040, while the region in total is expected to grow by only 36 percent. The County continues to be a young, family‐oriented community, with approximately one‐third of its households married with children. Despite progress in attracting jobs to the County, Prince William continues to export nearly two‐thirds (62.5%) of its labor force to jobs outside the County, accounting for the twelfth longest commute in the United States. According to 2011 Census data, Metropolitan Washington ranked first in the United States for median household income, with 10 of the region's counties in the top 20 nationwide. Prince William County’s median household income of $95,156 is 88 percent above the national median of $50,502 and 54 percent above the state‐wide median of $61,882. Prince William County had the 7th highest median household income in the United States; 10 percent higher than the metropolitan Washington D.C. median household income of $86,680. This ranking further underscores Prince William County’s continued status as a community of choice.
4
Employment in the County continues to improve in terms of establishments, jobs and wages. According to the
Virginia Employment Commission, at‐place establishments in Prince William County (8,052 in the 1st Quarter 2013) grew by 4.5% year‐over‐year and by 14.7% since 2008. In Northern Virginia, at‐place establishments (72,361 in the 1st Quarter 2013) grew by 3.1% year‐over‐year and by 7.2% since 2008. In Virginia, at‐place establishments (238,971 in the 1st Quarter 2013) grew by 2.9% year‐over‐year and by 4.1% since 2008. Establishments in Prince William County account for 11.1% of all establishments in Northern Virginia and 3.4% of all establishments in the Commonwealth.
At‐place employment in Prince William County (114,273 in the 1st Quarter 2013) increased by 4.0% year‐over‐
year and by 11.8% since 2008. By comparison, Northern Virginia employment grew by 1.0% in the last year and 2.7% since 2008. Employment in the Commonwealth grew by 1.0% in the last year, but declined by 1.1% since 2008. At‐place employment in Prince William County accounted for 9.9% of all jobs in Northern Virginia and 3.2% of all jobs in the Commonwealth.
The average weekly wage in Prince William County ($831 in the 1st Quarter 2013) is unchanged year‐over‐
year but has grown by 9.1% since 2008. At‐place average weekly wages in Northern Virginia ($1,411 in the 1st Quarter 2013) increased by 0.4% in the last year and grew by 11.4% since 2008. In Virginia, weekly wages ($1,028 in the 1st Quarter 2013) increased by 0.9% year‐over‐year and grew by 12.0% since 2008.
The impact of the housing downturn continues to be felt in those industries related to housing; however,
some ground has been regained in terms of at‐place employment. Construction employment, for example, declined in Prince William County by over 7,000 jobs (‐44.2%) between September 2005 and February 2010. Since that low point, Construction employment has increased by 3,040 jobs (34.0%). Likewise, jobs in finance and insurance and real estate experienced a net loss of over 800 jobs (22.2%) since their respective peak months of the real estate boom, but have increased by 409 jobs (13.9%) since that low point. Continued improvement in the local real estate market give hope that employment in these sectors will continue to improve as well. Prince William County’s unemployment rate was 5.1 percent in June 2013, well below the statewide rate of 6 percent and the national rate of 7.6 percent in June 2013. By comparison, Prince William County’s unemployment rate was the same 5.1 percent in June 2012.
Since the real estate boom years of 2001‐2006, when home values were increasing at double digit rates in
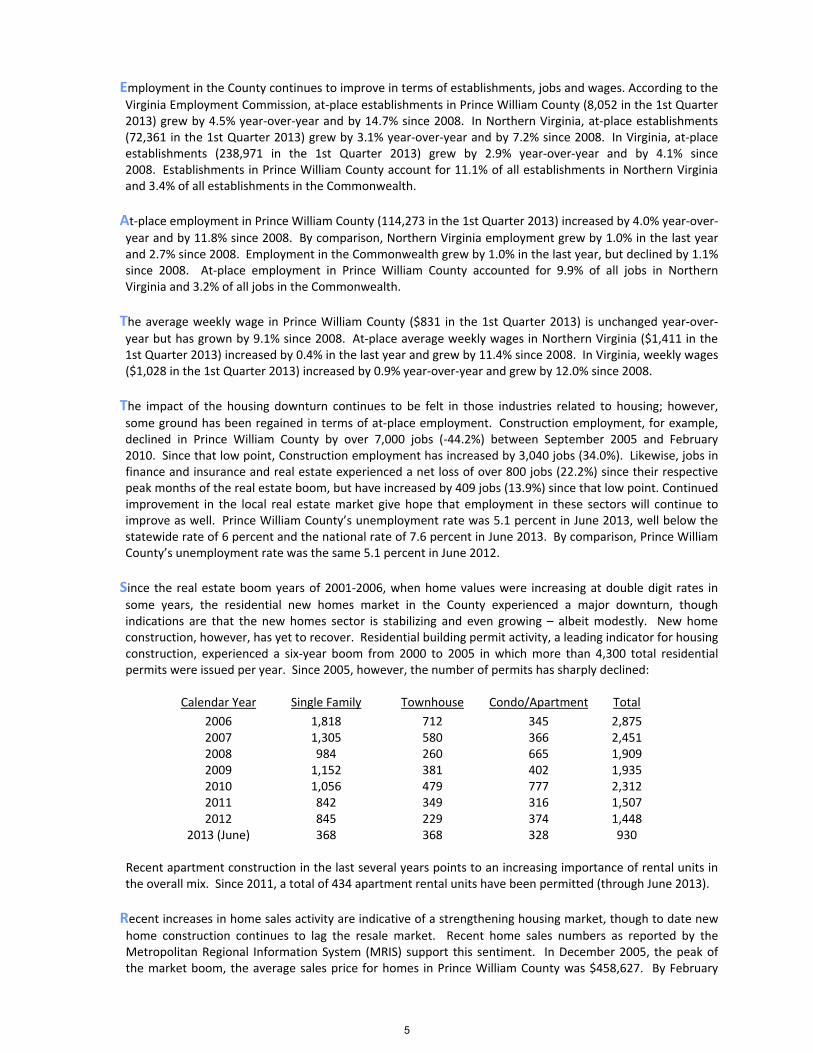
some years, the residential new homes market in the County experienced a major downturn, though indications are that the new homes sector is stabilizing and even growing – albeit modestly. New home construction, however, has yet to recover. Residential building permit activity, a leading indicator for housing construction, experienced a six‐year boom from 2000 to 2005 in which more than 4,300 total residential permits were issued per year. Since 2005, however, the number of permits has sharply declined:
Calendar Year Single Family Townhouse Condo/Apartment Total
2006 1,818 712 345 2,875 2007 1,305 580 366 2,451 2008 984 260 665 1,909 2009 1,152 381 402 1,935 2010 1,056 479 777 2,312 2011 842 349 316 1,507 2012 845 229 374 1,448
2013 (June) 368 368 328 930 Recent apartment construction in the last several years points to an increasing importance of rental units in the overall mix. Since 2011, a total of 434 apartment rental units have been permitted (through June 2013).
Recent increases in home sales activity are indicative of a strengthening housing market, though to date new
home construction continues to lag the resale market. Recent home sales numbers as reported by the Metropolitan Regional Information System (MRIS) support this sentiment. In December 2005, the peak of the market boom, the average sales price for homes in Prince William County was $458,627. By February
5

2009, the average sales price for a home in the County was $204,378, a decrease of 55 percent. By June 2013, however, the average price of a sold home in Prince William County had climbed to $352,542, a 72.5% increase since February 2009. The total units sold in June was 696, compared to 617 homes sold one year earlier; the average days on the market in June 2013 was 30 days for all homes sold in Prince William County, compared to 43 days one year earlier.
About 77 percent of the County’s real estate tax base consists of residential housing, approximately 22
percent is comprised of commercial, industrial, agricultural and public service properties and less than 1 percent is undeveloped land. As values of homes and people’s investment in the community increased, the Board of County Supervisors was responsive by dramatically adjusting the real estate tax rate lower from $1.34 in fiscal year 2001 to $0.758 per $100 of assessed value in fiscal year 2007. In fiscal year 2008, in response to revenue shortfalls and expectations of continuation of vital County services, Prince William County adopted a real estate tax rate of $0.97 effective for fiscal year 2009. Since 2010, the Prince William County real estate tax rate has been as follows:
FY2010 ‐ $1.212 per $100 of assessed value
FY2011 ‐ $1.236 per $100 of assessed value
FY2012 ‐ $1.204 per $100 of assessed value
FY2013 ‐ $1.209 per $100 of assessed value
FY2014 ‐ $1.181 per $100 of assessed value
Despite recent fiscal challenges to the County’s ability to provide services, strategic goal areas and critical service needs of the community continue to be the primary focus.
One of Prince William County’s strategic goals is to maintain an economic development climate that will
attract and foster the expansion of industries that create high‐wage jobs, diversify the non‐residential tax base, and encourage people to live in, work in and visit the County. In that regard, the County’s Department of Economic Development works diligently with targeted industries to attract new businesses and foster expansion of existing businesses. Since the inclusion of economic development in the strategic goals of County (in the mid‐1990’s), 412 new and expanding companies have announced their intention to invest more than $4.9 billion and add approximately 16,000 jobs to the Prince William County economy. Of these announcements, 309 (75%) were targeted industry businesses accounting for $4.2 billion (84%) of the total investment and 12,000 (75%) of the total jobs.
Recognizing the particular strengths of Prince William County and seizing upon market demands, Prince
William County has targeted the life sciences, federal government agencies and contractors, and data center markets. These efforts have proven successful in generating significant capital investments and job opportunities in Prince William County.
Prince William County remains the focal point of the life sciences industry within Northern Virginia, despite
the dip in investments within life science companies and the subsequent reduced market demand for life science space. Anchored by George Mason University’s (GMU) Life Sciences Campus, Prince William County has a growing cluster of life science companies sited near the GMU campus.
The ground‐breaking research coming from GMU creates community awareness and significant economic
development opportunities. To date, 19 life sciences industry announcements have yielded a cumulative total intent to invest $232 million and add 701 new jobs.
With Prince William County’s proximity to Quantico Marine Corps Base, Fort Belvoir, the National
Reconnaissance Office (NRO), and Washington DC, along with the addition of the FBI Northern Virginia Resident Agency in the County, the federal government and contractors who support the missions of federal agencies remain a key industry for economic development. Since the mid‐1990’s, 104 economic development projects involving government contractors or federal agencies have delivered a cumulative announced intent to invest of over $327 million and to create 3,702 new jobs in the County.
6

Prince William County’s competitive tax structure, affordable power and water availability, and fiber optic
availability, make it an ideal location for data center clients seeking a location in the Mid‐Atlantic region. Further strengthening Prince William County’s position is the availability of large land parcels and minimal natural disaster threats, which allows clients to meet the high security standards that today’s data market demands. Currently, there are eight data center facilities operating in Prince William County. To date, there have been 17 projects involving the construction or expansion of data center facilities in the County. These projects have yielded announcements totally nearly $3.3 billion in capital investment and 578 new jobs.
Areas of particular interest in Prince William County include: Innovation Technology Park, and the Potomac
Communities. These two areas are home to 25 percent of the total investment announcements within the County since 1997.
Innovation Technology Park is anchored by George Mason Universities Life Sciences Campus. It is home to a
growing life sciences cluster that, in addition to George Mason University, includes American Type Culture Collection (ATCC), Mediatech, Inc., and the Mason/National Institute of Health (NIH) Biomedical Research Laboratory. Also present is an emerging forensic science/criminal justice cluster that includes: the FBI Northern Virginia Resident Agency, the Virginia Department of Forensic Science’s Northern Laboratory, and the Prince William County Police Western District Station. Since the mid‐1990’s, 56 economic development projects have been announced within Innovation Technology Park. Cumulatively, these projects delivered $719.9 million of announced investment and 2,560 new jobs.
The Potomac Communities includes a number of new office developments that cater to the growing demand
to provide companies greater access to the Northern Virginia labor market while maintaining close proximity to Washington, DC and nearby federal facilities – such as Quantico Marine Corps Base, Fort Belvoir and the Pentagon. With infrastructure improvements to local roadways and new commercial office space coming to market, the Potomac Communities provides several opportunities for those looking to locate or expand in the County. A key growth driver in Prince William County, the Potomac Communities area has seen 56 economic development projects announced since the mid‐1990’s, carrying a cumulative intent to create 2,146 jobs and invest $501.7 million.
With the struggles facing the national economy, and businesses continuing to navigate through the challenges
that lie ahead, economic development results have slowed throughout the country, and Prince William County is no exception. However, the County continues to see interest, particularly in targeted markets, and there is optimism that as the economy strengthens, Prince William County will see a number of new and expanding businesses grow within the community.
Prince William County’s close proximity to the federal government and affiliated contractor industries has
largely insulated it from the severity of normal business cycle troughs. While the County is by no means immune from economic downturns, their depth and duration tend to be ameliorated by the fairly constant uptrend in federal spending and procurement. The County depends heavily on residential housing and consumer spending to maintain its prosperity and levels of local government services. These two sectors were severely impacted by the recent economic downturn; recent trends point to improving conditions in local consumer and real estate activity, even in the presence of continued consumer worries. As previously noted, the County has seen 41 consecutive months of sales tax revenue increases and the twelve‐month moving average is at an all‐time high.
As Prince William County enters fiscal year 2014, the local economy continues to outperform the national
economy but, in light of the importance of the real estate market to the overall health of the local economy, a cautionary note is still in order. During the most recent real estate boom, the dramatic increase in housing values created wealth, which in turn led to dramatic increases in consumer spending. Nowhere was this more apparent than in Northern Virginia and Prince William County, both of which were major recipients of this good fortune. After a rather severe correction in the housing market, current conditions suggest that a market expansion is occurring again, though at a more moderate pace than during the previous housing
7
market boom. However, any sharp rise in mortgage interest rates could impact the direction of the market. In addition, the impact of defense‐related drawdowns in the federal budget, as well as the prospect of long‐term sequestration of federal resources in general, has yet to be fully ascertained. The impact of the federal government on the regional and local economy cannot be overlooked.
The County’s proximity to the nation’s capital and its enviable participation in the Northern Virginia economy
give it a resiliency to withstand challenges from other sectors. However, major wild‐cards, such as the looming budgetary sequestration within the federal government and economic uncertainties in the Eurozone (e.g., Greece and Spain, among others), are still problematic to the global and national economies, which in turn may well impact Prince William County, by virtue of its position in the regional economy. Expectations and/or hopes going forward are for moderate growth and longer‐term prospects providing a more optimistic scenario.
Long‐term Financial Planning
The County adopted Principles of Sound Financial Management in 1988 and from time to time updates and
amends its Principles through the Board of County Supervisors, the latest update being December 2012. The Principles provide overarching guidance for prudent fiscal management. In 1989, the Board of County Supervisors also codified the Financial and Program Planning Ordinance. The purpose of this ordinance was to provide a framework for planning government services, allocating resources to those services, and providing accountability for achievement of budgeted service levels. Following these Principles and the Ordinance has enhanced the County’s image and credibility with the public, investors and credit rating agencies.
Credit ratings are tied strongly not only to the financial management of a local government, but also to the
economic climate and to this end, the County continues to be viewed by rating agencies as a key economic engine in the Metropolitan area, and holds a AAA status from all three major credit rating agencies, a measure that only 71 of the roughly 18,000 (or 0.4 percent) local governments throughout the country have achieved. The County’s superior bond ratings and outstanding credit affirms its status as a fiscally responsible and sound local government.
A significant factor in the County’s AAA bond rating from Fitch Ratings, Aaa bond rating from Moody’s
Investors Service and AAA bond rating by Standard and Poor’s is management’s consistency in implementing and adhering to multi‐year financial plans. As outlined in the Financial Planning and Program Ordinance and the Principles of Sound Financial Management, the County is to present to the Board a five‐year revenue and expenditure projection during the annual budget process. This projection process helps the Board gauge the multi‐year impacts of fiscal decisions and weigh the corresponding implications of tax rates and other revenue sources. A five‐year budget plan prepared by the Prince William County Schools is combined with the five‐year budget plan prepared by the County to give a total picture of the General Fund requirements. The most recent five‐year budget plan was approved by the Board in April 2013 for fiscal year 2014 to fiscal year 2018. Integral to establishment of five‐year plans is the County‐School Revenue Sharing Agreement, which was adopted by the Board of County Supervisors and the County School Board in 1998. The Agreement splits the County’s General Revenues, with the exception of recordation taxes that are earmarked for roads, with the School System. The historical split has been 56.75 percent to the School System and 43.25 percent to the County through fiscal 2013. This percentage changes to 57.23 percent to the School System and 42.77 percent to the County for fiscal 2014 to help address the growing needs of the Schools.
The Fiscal Plan implements the Board’s policy guidance and works to achieve the community’s Vision and
Strategic Goals. The Vision set forth in the County’s Strategic Plan states:
“Prince William County is a community of choice with a strong, diverse economic base, where families and individuals choose to live and work and business choose to locate.”
8

In order to achieve this vision, the Board adopted five strategic goals in its 2013 to 2016 Strategic Plan (adopted in January 2013): Economic Development; Education; Human Services, Public Safety and Transportation. The Fiscal Plan and Five‐Year Budget Plan rely on input from the community to build a community of choice as expressed in the Vision and to address each of these important goals.
During the past several years, as Prince William County has addressed the impacts of the Great Recession,
focus has been given to a comprehensive analysis of all County government programs and services, and funding the needs of the community through the County’s capital and operating budgets. As such, the Board of County Supervisors has had to make tough decisions that were necessary to best position the County for the changing economic future. Throughout the country, local governments are dealing with the reality of a “New Normal” and here in Prince William County our governing body has balanced the needs and desires of the community with their willingness and ability to pay for those services. Decisions made by the Board and work done by staff to support those decisions have allowed for reinvestment in the County to ensure Prince William remains a community of choice. For the third year in a row, Prince William was named as one of the best places in the nation for young people and 90% of the County’s residents give the County high marks, 90% say their quality of life meets their expectations, 85% say Prince William County government can be trusted to do the right thing and 90 percent believe the County organization is efficient and effective.
Each year, the County prepares a six‐year Capital Improvements Program (CIP), which is adopted by the Board
and published concurrently with the Adopted Fiscal Plan. The CIP specifies those capital improvements and construction projects, which are scheduled for funding over the next six years, in order to maintain or enhance the County’s capital assets and delivery of services. The County’s adopted policy documents, including the Strategic Plan, the Comprehensive Plan, and the Principles of Sound Financial Management guide the development of the CIP.
Capital improvement projects over the next six years total just over $1.2 billion. The major projects address
education, transportation, community development and public safety needs, all of which are key areas in the County’s Strategic Plan, and which combined, total 98 percent of the CIP. The 2014‐2019 Capital Improvement Program provides $28 million for two new libraries; $20 million for various parks and recreation projects, including sport field improvements, trail development, new parks and the landfill park redevelopment; $35 million for a new fire station to be built near the corner of Prince William Parkway and Davis Ford Road and the reconstruction and renovation of three existing fire and rescue stations; $27 million for a new police station; and $137 million for numerous road projects. In addition, the CIP includes $27 million for various technology improvements to County systems and $29 million for solid waste projects at the County’s landfill as well as watershed management and dam safety projects. The School System’s Capital Program totaling almost $920 million for 2014 to 2019 is presented to the Board under separate cover and is integrated into the County’s CIP.
Relevant Financial Policies
As outlined in the Principles of Sound Financial Management, the current expenditures will be funded with
current revenues and other resources, such as turnback (the projected under‐expenditure of current budget appropriations). The County will not balance the current budget at the expense of meeting future years’ expenditures; that is, the County will not accrue future years’ revenues or roll over short‐term debt to avoid planned retirement, nor shall unassigned General Fund balance be used to finance current operations, except in emergencies.
Major Initiatives
The County’s major initiatives are focused on enhancing its strategic goals and maintaining itself as a
community of choice. Some of the initiatives of the five Strategic Goals are highlighted as follows:
Economic Development – The Economic Development Strategic Goal calls for the County to provide a robust,
diverse economy with more quality jobs and an expanded commercial tax base. The leadership and foresight of Prince William County to support business development to bring quality jobs to the citizens and provide
9
strategies for sustained economic growth has enabled the County to become a strategic and vital component of the Northern Virginia economy, as well as that of the Commonwealth of Virginia. Towards that end, the County saw the addition of over 5,079 new jobs and 253 new business establishments during 2012. Twenty‐one deals worked by the Department of Economic Development brought 655 new jobs and $414 million in announced capital investment. According to the Bureau of Labor Statistics, Prince William County had the largest job gains of any large locality in Virginia in 2013 and was the only locality in Virginia to appear on CNN Money’s Top 25 list for “Where the Jobs Are” in both 2012 and 2013, maintaining its #8 ranking among counties nationwide for job growth.
The Prince William Board of County Supervisors announced the launch of the new Prince William Science
Accelerator in December 2012. This innovative facility, made possible through a public‐private partnership, will bring new wet lab space to market for growing companies in the life sciences industry. The 9,000 square foot facility, located in Innovation Technology Park offers spaces that are built‐out to meet the specific needs of the companies who will occupy it. These firms, generally small, fast‐growing life sciences companies, will enter into a license agreement with the County, who holds the master lease for the space.
During fiscal 2013 construction continued at Northern Virginia Community College’s Woodbridge Campus on a
new Arts & Sciences Building, an 84,000 square foot teaching and learning space featuring computer labs, science labs, art studios, lecture space, faculty offices and more with construction completed in August 2013. The college also broke ground on a new Workforce Development Center in September 2013. The planned 50,000 square foot building will be the first comprehensive facility dedicated to supporting the business community by meeting the training needs of its area workers and will include three computer training rooms, three general‐purpose training rooms, a cyber‐security lab, a wet lab and a telework center as well as an 8,000 square foot multi‐purpose space for formal events, exhibits and training activities. This facility will be a major asset in supporting the economic development goals of the Prince William region and Northern Virginia.
In July 2013, the Prince William Board of County Supervisors unanimously approved a re‐work of a new
residential and commercial development project, Potomac Shores, planned for Woodbridge’s Cherry Hill Peninsula. The 2,000 acre development is planned to include an 18‐hole signature Jack Nicklaus golf course, a five‐star luxury resort hotel with a 9,000 square foot conference center; a waterfront retail town center and a new Virginia Rail Express (VRE) train station, servicing the new development via 11 miles of new track connecting the Arkendale Station and the Powell’s Creek Station. The project includes not only 4,000 residential units, a mix of single family, townhomes, apartments and condominiums, but also 3.6 million square feet of commercial and office space.
Education – Education is one of the Board’s Strategic Goals. The goal states that the County will provide an educational environment rich in opportunities to increase educational attainment for workforce readiness, post‐secondary education and lifelong learning. Over the years, the Board of County Supervisors has demonstrated a strong commitment to quality public schools in Prince William County, further evidenced by the School System’s 88 percent satisfaction rating achieved in the County’s most recent Community Survey, conducted in 2012. The School System’s Five‐Year Budget Plan continues to focus resources on the most critical school needs, including accommodating a student membership increase of 11,242 over the next five‐year period; salary scale adjustments for employees as funding permits; repairs and renewals of older facilities; and funding for the debt service on $500.9 million of construction bonds, start‐up costs and operating costs for six new elementary schools, one K‐8 school and one high school as well as additions and/or expansions at eight current schools and the replacement of two elementary schools. Prince William County Schools is the second largest of 132 school divisions in Virginia and one of the 39 largest
school divisions in the country, and provides services to over six percent of the state student enrollment. The official September 2013 student membership count for Prince William County Schools is 85,055 students, up 1,504 students, or 1.8 percent from fiscal year 2013 to 2014.
10
To accommodate the growing student population and provide a replacement state‐of‐the‐art facility for
special education students, two schools opened in the western part of the County in fiscal year 2013 in time for the 2012‐2013 school year ‐‐ Ronald Wilson Reagan Middle School and the PACE West School. The opening of Ronald Wilson Reagan Middle School, located in Haymarket, marked the 16th middle school for the County’s School System. PACE West, located in Gainesville, serves approximately 98 students at the elementary middle and high school levels and offers a program designed for students who need smaller classes but are now surrounded by new technology, a gymnasium, science lab and a family and consumer science lab. PACE is a component of the Northern Virginia Regional Special Education Program and students from the Counties of Prince William and Fauquier, as well as the Cities of Manassas and Manassas Park. In addition, a new elementary school, slated to open in September 2014, is being designed and constructed under U.S. Green Council Guidelines using some recycled and recyclable construction materials. The new elementary school is projected to accommodate up to 850 students in the rapidly growing western portion of the County and will be located at the intersection of Haymarket Drive and Mercury Avenue. Also scheduled to open in September 2014 is a new K‐8 school. This new school will replace the 80‐year old Nokesville Elementary and will include grades six through eight, the first such K‐8 school in the Brenstville District.
The School System remains committed to providing a world‐class education to its students and is a state
leader in producing better student achievement results at a lower taxpayer cost. As testament to the quality of education received by students in Prince William County, all of the County’s schools are accredited under the Commonwealth’s accreditation guidelines, with 95 percent of the schools receiving full accreditation for the 2013‐2014 school year, based on performance during the 2012‐2013 school year, or a three‐year average. In addition, 40 of the County’s schools were named a “School of Excellence” by the Prince William County School Board by being fully accredited by the state, meeting Virginia’s academic Annual Measurable Objectives and achieving an overall score of 90 out of 100 points on the Prince William County Schools Strategic‐Plan based measures. The Scholastic Aptitude Test (SAT) scores for Prince William County students rose eight points from the prior year, in results reported by The College Board. Prince William County students’ combined scores for the critical reading, mathematics and writing portions of the SAT increased to 1498 in 2013 compared to 1490 in 2012 and outperformed the national average in critical reading. Six high schools increased their reading scores, four high schools increased their math scores and three high schools increased their writing scores in 2013. Results released from the college‐readiness benchmark ACT test show the average composite scores of Prince William County students rose as well, beating the national average composite score for the fifth time in five consecutive years. Results for 2012‐2013 show Prince William County students exceeded the national average in all four content areas of English, mathematics, reading and science. Unlike an aptitude or reasoning test, the ACT is designed to be an achievement test, measuring what a student has learned in school and assess their general educational development and ability to complete college‐level work. Finally the Commonwealth’s State Board of Education’s Standards of Learning (SOL) and associated tests in mathematics, science and reading are more demanding than ever, but new results from the Virginia Department of Education show the collective Prince William County student body is meeting or exceeding state pass rates on almost all tests.
Not only is Prince William County seeing success in the classroom, but the School System’s Virtual High School
(VHS) is among the honorees in the Center for Digital Education’s first “Digital Content and Curriculum Achievement Awards”, an award that recognizes schools for their innovation and hard work in implementation of digital content and curriculum. The VHS has enjoyed steady growth since its inception in 2000, with more than 9,000 students having taken at least one of the 22 courses offered in a blended computer‐based and in‐person format. Prince William County Schools also received a top ten ranking in the 2012‐2013 Digital School Districts Survey for the fourth year in a row. The National School Boards Association (NSBA) announced that the School System tied for fifth place in the nation in the Large Student Population Category (more than 15,000 students). This award recognizes schools districts that are using digital technology in an exceptional way.
Human Services – The Human Services Strategic Goal calls for services to individuals and families most at risk,
through innovative and effective leveraging of state and federal funds and community partnerships. The County continues to see demand for services to help the elderly, the intellectually disabled and mentally ill, those in need of medical services who have no insurance, and those facing difficulty sustaining their families
11

due to economic difficulties. The 2014 Fiscal Plan includes a 3.6 percent increase over the 2013 Fiscal Plan for human services including the addition of five case management staff to address the Virginia settlement with the U.S. Department of Justice requiring community‐based services to intellectually disabled residents. Increased funding is also provided to Birmingham Green, a facility that provides housing to the County and region’s most vulnerable adults in need of specialized skilled nursing, dementia and/or other behavioral care.
Public Safety – Public Safety has also been one of the County’s Strategic Goals since the Strategic Plan was first adopted. This goal calls for the County to maintain safe neighborhoods and business areas and provide prompt responses to emergencies. The CIP for fiscal years 2014‐2019 includes funds to design and/or construct the Bacon Race Fire & Rescue Station, reconstruct Coles and Nokesville Fire & Rescue Stations and renovate the Gainesville Fire & Rescue Station. In addition, funding is provided for the construction of a new Central District Police Station – a 50,000 square foot facility slated to open in fiscal 2017 that will provide more efficient service delivery to the mid‐County area and alleviate overcrowding at the other two district stations. Funding is also provided for the public safety records management/EMS system, the E‐911 call trunking system, the public safety voice logging system as well as the installation of a new integrated security system at the Juvenile Detention Center. The FY 2014 operating budget includes a 4.8 percent increase over the FY 2013 budget to include 14 police officers for the staffing plan; 15 police officers to fully staff the middle school resource officer program (an officer at every middle school); a 24‐hour advance life support unit stationed in the western part of the county; a 24‐hour ladder truck stationed in the eastern part of the County; a community corrections study to conduct a needs assessment for the expansion of the Adult Detention Center and replacement of the County’s 800 MHz radio system and the computer‐aided dispatch (CAD) system.
Transportation – The Transportation Strategic Goal calls for the County to provide a multi‐modal
transportation network that supports County and regional connectivity. Over the years, the County has worked to develop a transportation system that gets people to jobs, improves safety, reduces congestion, reduces travel time and enhances its economic development efforts. As the population of the region continues to grow, the County must continue to find ways to fund and/or build the needed transportation projects within the community. As such, the County remains one of few localities to significantly fund transportation at the local level. Citizens have supported these efforts by approving bond referenda in 1988, 1990, 1994, 1998, 2002 and 2006 totaling $556 million.
Prince William County is also a member of the Northern Virginia Transportation Authority (NVTA), an
authority created by the General Assembly in 2002. This nine member authority; made up of the counties of Prince William, Arlington, Fairfax, and Loudoun as well as the cities of Alexandria, Fairfax, Falls Church, Manassas and Manassas Park; offers a common voice for Northern Virginia on transportation and other issues that confront the region. The NVTA is tasked with preparing an unconstrained long‐range regional transportation plan (the most recent is the TransAction 2040 Plan) for Planning District 8, including transportation improvements of regional significance. As a result of new fees and taxes imposed by HB 2313, legislation passed by the General Assembly in April 2013, the NVTA will receive earmarked revenue for projects dedicated to relieving congestion in Northern Virginia, beginning in fiscal 2014 and Prince William County will be privy to a portion of the revenues and benefits.
During fiscal year 2013, 500 new parking spaces were constructed on the old Potomac Rappahannock
Transportation Commission (PRTC) bus garage property on Telegraph Road, providing parking relief for Prince William County commuters. In addition, a new two‐lane roadway was constructed on University Boulevard between Wellington Road and Rollins Ford Road and a pedestrian sidewalk was installed along the northern side of Old Bridge Road between Dillingham Square and Mohican Road.
After years of declining satisfaction that bottomed out in 2005 with only 38 percent of citizens satisfied with
the ease of getting around in the County, citizen satisfaction has improved significantly. In the 2012 Community Survey, 84 percent of citizens were satisfied, marking the sixth survey with improved results. The $137 million CIP for fiscal years 2014‐2019 aims to further advance the transportation strategic goals by including $41.2 million in funding for the widening of Route 1 north to a six‐lane roadway from Neabsco Mills Road to Featherstone Road. Improvements will also be made at the intersections of Neabsco Mills Road and
12

Dale Boulevard with Route 1. The new roadway will feature a 16 foot wide raised median with curb and gutter, on‐road bike lanes, a pedestrian sidewalk and asphalt trail, with majority funding provided by debt authorized by voters in the 2002 and 2006 Road Bond Referenda. Funding is also provided for the widening of Minnieville Road from Spriggs Road to Route 234 (Dumfries Road). This project will complete the four‐lane widening of Minnieville Road from its northern terminus with Old Bridge Road to its southern terminus at Route 234. Also planned is $15 million for a 1,250 space commuter parking garage to be located on the parcel to the north of the existing Potomac Town Center at Stonebridge; $14.1 million for widening the current two‐lane undivided roadway of Route 28 from Linton Hall Road to Fitzwater Drive to a four‐lane divided roadway; $12.4 million for improvements to Rollins Ford Road, including the construction of two 365‐foot bridges spanning Broad Run; and $10.9 million for the widening of Prince William Parkway from Old Bridge Road to Minnieville Road, also approved by voters as part of the 2006 Road Bond Referendum. Other projects in the six‐year CIP include improvements to Fuller Road/Fuller Heights Road, Glenkirk Road, Hornbaker Road, Logmill Road, University Boulevard and the Telegraph Road commuter parking lot.
Awards and Acknowledgments
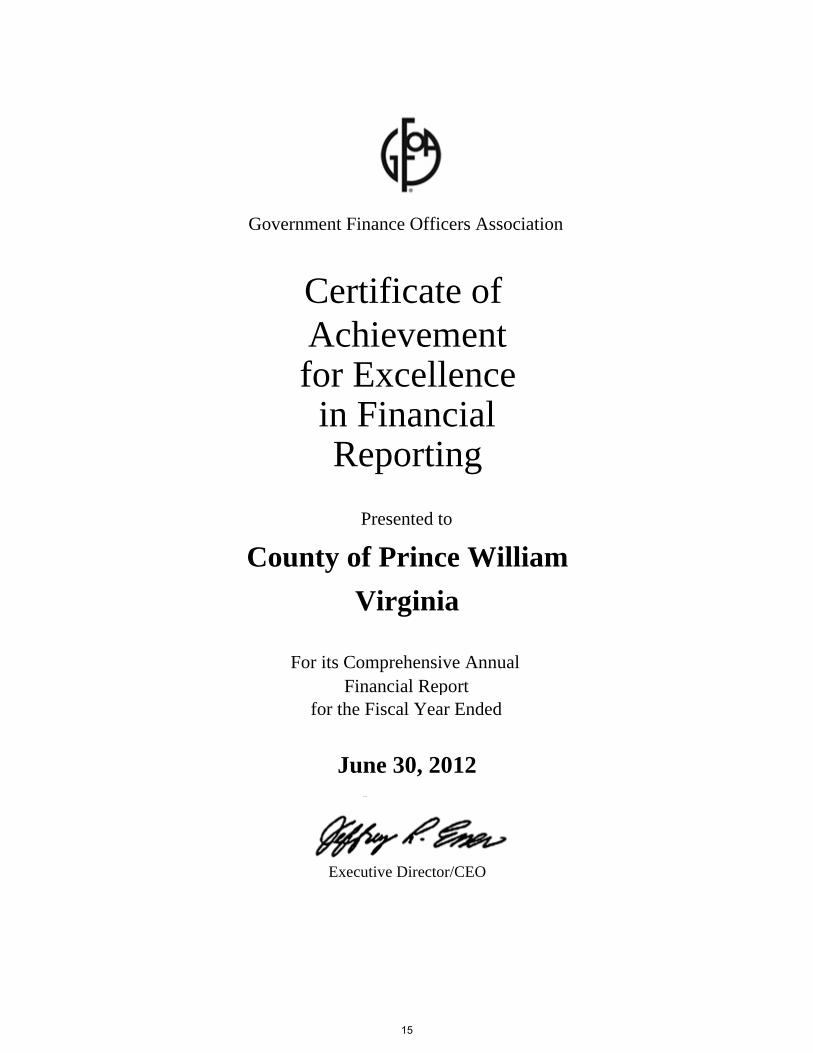
The Government Finance Officers Association (GFOA) of the United States and Canada awarded a Certificate
of Achievement for Excellence in Financial Reporting to Prince William County for its Comprehensive Annual Financial Report for the fiscal year ended June 30, 2012. This was the 32nd consecutive year that the County has received this prestigious award. In order to be awarded a Certificate of Achievement, the County must publish an easily readable and efficiently organized comprehensive annual financial report. This report satisfied both generally accepted accounting principles and applicable legal requirements.
A Certificate of Achievement is valid for a period of one year only. We believe that our current
Comprehensive Annual Financial Report continues to meet the Certificate of Achievement Program’s requirements, and we are submitting it to the GFOA to determine its eligibility for another certificate.
Prince William County received the GFOA’s Distinguished Budget Presentation Award for its annual budget for
the fiscal year beginning July 1, 2012. This was the 27th consecutive year that the County has received this prestigious award. In order to receive this award, the governmental unit must publish a budget document that meets program criteria as a policy document, as a financial plan, as an operations guide and as a communications device.
The County also received for the seventh time the GFOA Award for Outstanding Achievement in Popular
Annual Financial Reporting for the fiscal year ended June 30, 2012. This award program is designed to encourage local governments to extract information from their comprehensive annual financial report to produce high quality popular annual financial reports specifically designed to be readily accessible and easily understandable to the general public and other interested parties without a background in public finance.
Related to adherence to financial policies, the Principles of Sound Financial Management, and strong financial
management practices of the County, the County was recognized in 2013 by the Association of Public Treasurers of the United States and Canada (APT US&C) for its model Investment Policy. This prestigious certification recognizes investment policies that include elements deemed essential to a written investment policy. The benefit of this certification is the trust and confidence that the Board of County Supervisors and the public that it serves receives from knowing that the County has not only taken the time to draft an investment policy, but also the extra professional step of having the APT US&C review and certify the policy.
Many professional staff members in the Financial Reporting and Control Division prepared this report. Their
hard work, professional dedication and continuing efforts to improve the quality of this report are a direct
13
benefit to all that read and use it. We would also like to acknowledge the cooperation and assistance of the County’s departments and agencies throughout the year in the efficient administration of the County’s financial operations.
This Comprehensive Annual Financial Report reflects the County’s commitment to the citizens of Prince
William County, the Board of County Supervisors and the financial community to provide information in conformance with the highest standards of financial accountability.
Respectfully,
Melissa S. Peacor Steven A. Solomon County Executive Director of Finance
14
Certificate of
Presented to
County of Prince William
For its Comprehensive Annual
June 30, 2012
Executive Director/CEO
Financial Reportfor the Fiscal Year Ended
Reportingin Financial
for ExcellenceAchievement
Text38: Virginia
Government Finance Officers Association
15

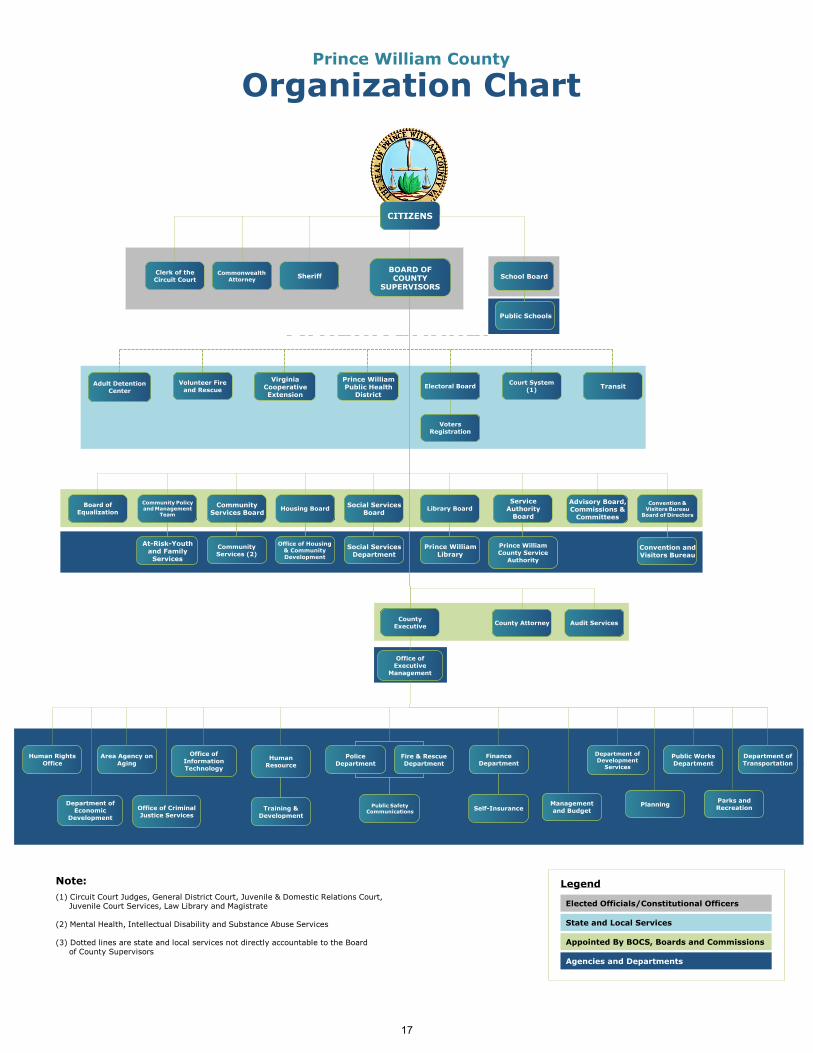
Organization of Prince William County Government
Since 1972, the County has operated under the County Executive form of government, as provided in Section
15.2‐500 et seq. VA Code Ann. The policy‐determining body of the County is an eight‐member Board. Residents in each of the County’s seven magisterial districts elect one member of the Board to serve a term of four years. The eighth member of the Board is elected at‐large by County residents to serve a four‐year term as Chairman. The current board members took office in January 2012 and will serve until December 31, 2015.
The Board appoints a County Executive to act as the County government’s chief administrative officer. The
County Executive serves at the pleasure of the Board, implements its policies, provides organizational leadership for addressing major issues, directs business and administrative procedures, and recommends department heads for appointment by the Board. The Board also appoints a County Attorney to provide legal guidance to the government.
The operation of public schools in the County is vested in an eight‐member School Board, the members of
which are elected and serve a term of four years. The local share of the cost of operating the public schools in the County is met with an appropriation by the Board from the County's General Fund. Operations of the School Board, however, are independent of the Board and the County administration as prescribed by Virginia law. A Superintendent is appointed by the School Board to administer the operations of the County's public schools.
The Board also appoints the members of several separate boards and authorities to administer the operations
of certain services.
Along with the Board, County residents elect three constitutional officers: the Clerk of the Circuit Court for a term of eight years, and the Sheriff and Commonwealth's Attorney each for terms of four years. The Judges of the Circuit Court, the General District Court, and the Juvenile and Domestic Relations District Court are appointed by the Virginia General Assembly. Unlike most other Virginia counties, County residents do not elect a Treasurer and a Commissioner of the Revenue. The Director of Finance, who is appointed by the Board based on a recommendation of the County Executive, carries out the responsibilities of these officers.
On November 8, 2011, elections were held in Prince William County for the Chairman of the Board and the
Supervisors of the seven magisterial districts. The incumbent Chairman of the Board was re‐elected. Six incumbent Supervisors were re‐elected for another four‐year term and one new Supervisor was elected. All re‐elected and elected officials took the oath of office in January 2012.
The administrative offices of the County are located at the McCoart Administrative Building, One County
Complex Court, Prince William, Virginia, 22192. The County’s central telephone number is (703) 792‐6000. TTY users may call (703) 792‐4733 or the Virginia Relay Center at (800) 828‐1120. The County’s official home page is located at www.pwcgov.org.
16
IntroductionProposed FY 2014 Budgeti
ProPosed FY 2014 Budget Prince William County, VA
IntroductionOrganizational Chart
SheriffCommonwealthAttorney
Clerk of theCircuit Court
Department ofDevelopment
Services
Area Agency onAging
Public WorksDepartment
Department ofEconomic
Development
Fire & RescueDepartment
PoliceDepartment
Public SafetyCommunications
Office ofInformationTechnology
Managementand Budget
Department ofTransportation
Self-Insurance
FinanceDepartment
Training &Development
HumanResource
Human RightsOffice
Office ofExecutive
Management
BOARD OFCOUNTY
SUPERVISORS
Public Schools
TransitCourt System
(1)
VotersRegistration
Electoral BoardPrince WilliamPublic Health
District
VirginiaCooperativeExtension
Volunteer Fireand Rescue
Adult DetentionCenter
Convention andVisitors Bureau
Convention &Visitors Bureau
Board of Directors
Advisory Board,Commissions &
Committees
Prince WilliamCounty Service
Authority
ServiceAuthority
Board
Prince WilliamLibrary
Library Board
Social ServicesDepartment
Social ServicesBoard
Office of Housing& CommunityDevelopment
Housing Board
CommunityServices (2)
CommunityServices Board
At-Risk-Youthand Family
Services
Community Policyand Management
Team
Board ofEqualization
Audit ServicesCounty Attorney
CITIZENS
School Board
CountyExecutive
Parks andRecreation
Prince William County Government Organizational Chart
PlanningOffice of CriminalJustice Services
Note:(1) Circuit Court Judges, General District Court, Juvenile & Domestic Relations Court,
Juvenile Court Services, Law Library and Magistrate
(2) Mental Health, Intellectual Disability and Substance Abuse Services
(3) Dotted lines are state and local services not directly accountable to the Boardof County Supervisors
Elected Officials/Constitutional Officers
State and Local Services
Appointed By BOCS, Boards and Commissions
Agencies and Departments
Legend
Organization Chart
Prince William County
Organization Chart
IntroductionProposed FY 2014 Budgeti
ProPosed FY 2014 Budget Prince William County, VA
IntroductionOrganizational Chart
SheriffCommonwealthAttorney
Clerk of theCircuit Court
Department ofDevelopment
Services
Area Agency onAging
Public WorksDepartment
Department ofEconomic
Development
Fire & RescueDepartment
PoliceDepartment
Public SafetyCommunications
Office ofInformationTechnology
Managementand Budget
Department ofTransportation
Self-Insurance
FinanceDepartment
Training &Development
HumanResource
Human RightsOffice
Office ofExecutive
Management
BOARD OFCOUNTY
SUPERVISORS
Public Schools
TransitCourt System
(1)
VotersRegistration
Electoral BoardPrince WilliamPublic Health
District
VirginiaCooperativeExtension
Volunteer Fireand Rescue
Adult DetentionCenter
Convention andVisitors Bureau
Convention &Visitors Bureau
Board of Directors
Advisory Board,Commissions &
Committees
Prince WilliamCounty Service
Authority
ServiceAuthority
Board
Prince WilliamLibrary
Library Board
Social ServicesDepartment
Social ServicesBoard
Office of Housing& CommunityDevelopment
Housing Board
CommunityServices (2)
CommunityServices Board
At-Risk-Youthand Family
Services
Community Policyand Management
Team
Board ofEqualization
Audit ServicesCounty Attorney
CITIZENS
School Board
CountyExecutive
Parks andRecreation
Prince William County Government Organizational Chart
PlanningOffice of CriminalJustice Services
Note:(1) Circuit Court Judges, General District Court, Juvenile & Domestic Relations Court,
Juvenile Court Services, Law Library and Magistrate
(2) Mental Health, Intellectual Disability and Substance Abuse Services
(3) Dotted lines are state and local services not directly accountable to the Boardof County Supervisors
Elected Officials/Constitutional Officers
State and Local Services
Appointed By BOCS, Boards and Commissions
Agencies and Departments
Legend
SheriffCommonwealthAttorney
Clerk of theCircuit Court
Department ofDevelopment
Services
Area Agency onAging
Public WorksDepartment
Department ofEconomic
Development
Fire & RescueDepartment
PoliceDepartment
Public SafetyCommunications
Office ofInformationTechnology
Managementand Budget
Department ofTransportation
Self-Insurance
FinanceDepartment
Training &Development
HumanResource
Human RightsOffice
Office ofExecutive
Management
BOARD OFCOUNTY
SUPERVISORS
Public Schools
TransitCourt System
(1)
VotersRegistration
Electoral BoardPrince WilliamPublic Health
District
VirginiaCooperativeExtension
Volunteer Fireand Rescue
Adult DetentionCenter
Convention andVisitors Bureau
Convention &Visitors Bureau
Board of Directors
Advisory Board,Commissions &
Committees
Prince WilliamCounty Service
Authority
ServiceAuthority
Board
Prince WilliamLibrary
Library Board
Social ServicesDepartment
Social ServicesBoard
Office of Housing& CommunityDevelopment
Housing Board
CommunityServices (2)
CommunityServices Board
At-Risk-Youthand Family
Services
Community Policyand Management
Team
Board ofEqualization
Audit ServicesCounty Attorney
CITIZENS
School Board
CountyExecutive
Parks andRecreation
Prince William County Government Organizational Chart
PlanningOffice of CriminalJustice Services
Note:(1) Circuit Court Judges, General District Court, Juvenile & Domestic Relations Court,
Juvenile Court Services, Law Library and Magistrate
(2) Mental Health, Intellectual Disability and Substance Abuse Services
(3) Dotted lines are state and local services not directly accountable to the Boardof County Supervisors
Elected Officials/Constitutional Officers
State and Local Services
Appointed By BOCS, Boards and Commissions
Agencies and Departments
Legend
SheriffCommonwealthAttorney
Clerk of theCircuit Court
Department ofDevelopment
Services
Area Agency onAging
Public WorksDepartment
Department ofEconomic
Development
Fire & RescueDepartment
PoliceDepartment
Public SafetyCommunications
Office ofInformationTechnology
Managementand Budget
Department ofTransportation
Self-Insurance
FinanceDepartment
Training &Development
HumanResource
Human RightsOffice
Office ofExecutive
Management
BOARD OFCOUNTY
SUPERVISORS
Public Schools
TransitCourt System
(1)
VotersRegistration
Electoral BoardPrince WilliamPublic Health
District
VirginiaCooperativeExtension
Volunteer Fireand Rescue
Adult DetentionCenter
Convention andVisitors Bureau
Convention &Visitors Bureau
Board of Directors
Advisory Board,Commissions &
Committees
Prince WilliamCounty Service
Authority
ServiceAuthority
Board
Prince WilliamLibrary
Library Board
Social ServicesDepartment
Social ServicesBoard
Office of Housing& CommunityDevelopment
Housing Board
CommunityServices (2)
CommunityServices Board
At-Risk-Youthand Family
Services
Community Policyand Management
Team
Board ofEqualization
Audit ServicesCounty Attorney
CITIZENS
School Board
CountyExecutive
Parks andRecreation
Prince William County Government Organizational Chart
PlanningOffice of CriminalJustice Services
Note:(1) Circuit Court Judges, General District Court, Juvenile & Domestic Relations Court,
Juvenile Court Services, Law Library and Magistrate
(2) Mental Health, Intellectual Disability and Substance Abuse Services
(3) Dotted lines are state and local services not directly accountable to the Boardof County Supervisors
Elected Officials/Constitutional Officers
State and Local Services
Appointed By BOCS, Boards and Commissions
Agencies and Departments
Legend
Organization Chart
17

18
Report of Independent Auditor To the Board of County Supervisors County of Prince William, Virginia Report on the Financial Statements
We have audited the accompanying financial statements of the governmental activities, the business-type activities, the aggregate discretely presented component units, each major fund, and the aggregate remaining fund information of the County of Prince William, Virginia (the “County”), as of and for the year ended June 30, 2013, and the related notes to the financial statements, which collectively comprise the County’s basic financial statements as listed in the table of contents. Management’s Responsibility for the Financial Statements
Management is responsible for the preparation and fair presentation of these financial statements in accordance with accounting principles generally accepted in the United States of America; this includes the design, implementation, and maintenance of internal control relevant to the preparation and fair presentation of financial statements that are free from material misstatement, whether due to fraud or error. Auditor’s Responsibility
Our responsibility is to express opinions on these financial statements based on our audit. We did not audit the financial statements of the Prince William County/Manassas Convention and Visitors Bureau (the “CVB”), which represents .01% and .11 %, respectively of the assets and revenues of the aggregate discretely presented component units. Those financial statements were audited by other auditors whose report thereon has been furnished to us, and our opinions, insofar as they related to the amounts included for the CVB, is based solely on the report of the other auditors. We conducted our audit in accordance with auditing standards generally accepted in the United States of America, the standards applicable to financial audits contained in Government Auditing Standards, issued by the Comptroller General of the United States, and the Specifications for Audits of Counties, Cities, and Towns issued by the Auditor of Public Accounts of the Commonwealth of Virginia. Those standards and specifications require that we plan and perform the audit to obtain reasonable assurance about whether the financial statements are free from material misstatement. An audit involves performing procedures to obtain audit evidence about the amounts and disclosures in the financial statements. The procedures selected depend on the auditor’s judgment, including the assessment of the risks of material misstatement of the financial statements, whether due to fraud or error. In making those risk assessments, the auditor considers internal control relevant to the entity’s preparation and fair presentation of the financial statements in order to design audit procedures that are appropriate in the circumstances, but not for the purpose of expressing an opinion on the effectiveness of the entity’s internal control. Accordingly, we express no such opinion. An audit also includes evaluating the appropriateness of accounting policies used and the reasonableness of significant accounting estimates made by management, as well as evaluating the overall presentation of the financial statements. We believe that the audit evidence we have obtained is sufficient and appropriate to provide a basis for our audit opinions.
19
Opinions
In our opinion, based on our audit and the report of other auditors, the financial statements referred to above present fairly, in all material respects, the respective financial position of the governmental activities, the business-type activities, the aggregate discretely presented component units, each major fund, and the aggregate remaining fund information of the County of Prince William, Virginia, as of June 30, 2013, and the respective changes in financial position, and, where applicable, cash flows thereof for the year then ended in accordance with accounting principles generally accepted in the United States of America. Emphasis of Matter
Change in Accounting Principles
As described in Note 1Q to the financial statements, effective July 1, 2012, the County adopted the provisions of, Governmental Accounting Standards Board (“GASB”) Statement No. 61, The Financial Reporting Entity: Omnibus- an Amendment of GASB Statements No. 14 and No. 34, and No. 63, Financial Reporting of Deferred Outflows of Resources, Deferred Inflows of Resources, and Net Position. Our opinions are not modified with respect to this matter. Component Unit Reclassification
As described in Note 1P to the financial statements, effective July 1, 2012, the Prince William County Park Authority was merged into the County and is no longer a discretely presented component unit of the County. Our opinions are not modified with respect to this matter. Other Matters
Prior‐Year Comparative Information
We have previously audited the County’s 2012 financial statements, and we expressed unmodified opinions on the respective financial statements of the governmental activities, the business-type activities, the aggregate discretely presented component units, each major fund, and the aggregate remaining fund information in our report dated November 29, 2012. In our opinion, the summarized comparative information presented herein as of and for the year ended June 30, 2012, is consistent, in all material respects, with the audited financial statements from which it has been derived. Required Supplementary Information
Accounting principles generally accepted in the United States of America require that the management’s discussion and analysis, budgetary comparison information and schedule of funding progress on pages 23 through 36 and 123 through 128 be presented to supplement the basic financial statements. Such information, although not a part of the basic financial statements, is required by the Governmental Accounting Standards Board who considers it to be an essential part of financial reporting for placing the basic financial statements in an appropriate operational, economic, or historical context. We have applied certain limited procedures to the required supplementary information in accordance with auditing standards generally accepted in the United States of America, which consisted of inquiries of management about the methods of preparing the information and comparing the information for consistency with management’s responses to our inquiries, the basic financial statements, and other knowledge we obtained during our audit of the basic financial statements. We do not express an opinion or provide any assurance on the information because the limited procedures do not provide us with sufficient evidence to express an opinion or provide any assurance.
20
Other Information
Our audit was conducted for the purpose of forming opinions on the financial statements that collectively comprise the County’s basic financial statements. The introductory section, combining and individual nonmajor fund financial statements, nonmajor fund and component unit budgetary comparison schedules, debt obligation section and statistical section, are presented for purposes of additional analysis and are not a required part of the basic financial statements. The schedule of expenditures of federal awards is presented for purposes of additional analysis as required by U.S. Office of Management and Budget Circular A-133, Audits of States, Local Governments, and Non-Profit Organizations, and is also not a required part of the basic financial statements. The combining and individual nonmajor fund financial statements, nonmajor fund and component unit budgetary comparison schedules, debt obligation section and the schedule of expenditures of federal awards are the responsibility of management and were derived from and relate directly to the underlying accounting and other records used to prepare the basic financial statements. Such information has been subjected to the auditing procedures applied in the audit of the basic financial statements and certain additional procedures, including comparing and reconciling such information directly to the underlying accounting and other records used to prepare the basic financial statements or to the basic financial statements themselves, and other additional procedures in accordance with auditing standards generally accepted in the United States of America. In our opinion, the combining and individual nonmajor fund financial statements, nonmajor fund and component unit budgetary comparison schedules, debt obligation section and the schedule of expenditures of federal awards are fairly stated in all material respects in relation to the basic financial statements as a whole. The introductory and statistical sections have not been subjected to the auditing procedures applied in the audit of the basic financial statements and, accordingly, we do not express an opinion or provide any assurance on them. Other Reporting Required by Government Auditing Standards
In accordance with Government Auditing Standards, we have also issued our report dated December 23, 2013, on our consideration of the County’s internal control over financial reporting and on our tests of its compliance with certain provisions of laws, regulations, contracts, and grant agreements and other matters. The purpose of that report is to describe the scope of our testing of internal control over financial reporting and compliance and the results of that testing, and not to provide an opinion on internal control over financial reporting or on compliance. That report is an integral part of an audit performed in accordance with Government Auditing Standards in considering the County’s internal control over financial reporting and compliance.
Tysons Corner, Virginia December 23, 2013
21

22
MANAGEMENT’S DISCUSSION AND ANALYSISJUNE 30, 2013
(amounts expressed in millions)
Prince William County’s (the County) 2013 fiscal performance continues to demonstrate its successful implementation of its System for Results Oriented Government. This report provides accountability to the County’s goals and objectives defined with its citizenry and adopted by the Board of County Supervisors. This section of the annual financial report presents our discussion and analysis of the County’s financial performance during the fiscal year that ended on June 30, 2013. Please read it in conjunction with the transmittal letter at the front of this report and the County’s financial statements, which follow this section. All amounts in the discussion and analysis, unless otherwise indicated, are expressed in millions of dollars. Throughout this section of the report, the primary government is referred to as the “County” and the “Total Reporting Entity” is the total of the County and component units. Due to the material relationship between the School Board component unit and the County, the total financial reporting entity information more accurately reflects the financial operations of Prince William County.
OVERVIEW OF THE FINANCIAL STATEMENTS
The financial section of this annual report consists of four parts – Management’s Discussion & Analysis (MD&A), the Basic Financial Statements, other Required Supplementary Information, and an optional section that presents combining statements for nonmajor governmental funds, internal service funds, agency funds, discretely presented component units; budget and actual schedules for the nonmajor governmental funds; and debt obligation schedules. The basic financial statements include two kinds of statements that present different views of the County:
The first two statements are government–widefinancial statements that provide both long–term and short–term information about theCounty’s overall financial status.
The remaining statements are fund financialstatements that focus on individual parts of theCounty government, reporting the County’soperations in more detail than the government‐
FINANCIAL HIGHLIGHTS
The total reporting entity, which includes component units,has positive net position of $1,344 at June 30, 2013, whichrepresents a 3 percent increase of $41 from the prior year.
The total cost of the County’s programs increased 11 percentto $1,070 during fiscal year 2013, while the County’s totalrevenues increased by 5 percent, to $1,054.
Net position of governmental activities decreased 29 percentfrom the prior year due to costs exceeding revenues by $10.Program revenues stayed substantially the same from theprior year, while general revenues grew by 3 percent; thesetwo factors contributed to overall average revenue growth of2 percent, while total costs increased 8 percent from theprior year.
At June 30, 2013, the County has $803 of debt outstandingrelated to assets recorded by its component units and otherentities. Accordingly, liabilities of the County’s governmentalactivities at June 30, 2013 exceeded its assets by $46 (netposition).
Total net position of the County’s business‐type activitiesdecreased 14 percent to $37 due primarily to the inclusion ofParks & Recreation.
At the end of the current year, the unassigned fund balanceof $67 in the general fund was maintained at 7.5 percent oftotal general fund revenues. The unassigned fund balanceincreased 4 percent from the prior year. The increase isprimarily attributed to an increase in general fund revenuesand expenditure savings at the end of the fiscal year.
General fund revenues exceeded the budget by $10;alternatively, expenditure savings of $16 under the budgethelped to provide additional available resources for futureyears’ appropriations.
As of January 1, 2012 (the assessment date pertinent to realestate taxes supporting fiscal year 2013) the total assessedvalues of taxable property increased by 4 percent comparedto the prior year, with increases in residential valuesaccounting for 69 percent of the total rise in values. Thisincrease was partially offset by an increase in real estatetaxes from 1.204 to 1.209. Real estate taxes contributed 62percent of the total revenues for the primary government ofthe County during fiscal year 2013.
23

wide statements.
- The governmental funds statements reflect how general government services, like public safety, were financed in the short–term as well as what remains for future spending.
- Proprietary fund statements offer short–term and long–
term financial information about the activities the government operates like businesses, such as the Landfill.
- Fiduciary fund statements provide information about the
financial relationships – like the special welfare, community services board, and federal self‐sufficiency payee programs for certain County welfare, mental health services, and federal self‐sufficiency program recipients – in which the County acts solely as a trustee or agent for the benefit of others, to whom the resources belong.
The financial statements also include notes that explain some of the information in the financial statements and provide more detailed data. The statements are followed by a section of required supplementary information that further explains and supports the information in the financial statements. Figure A‐1 shows how the required parts of this financial section are arranged and relate to one another. In addition to these required elements, the financial statements include a section with combining statements that provide details about the County’s nonmajor governmental funds, internal service funds, agency funds and discretely presented component units, each of which are combined and presented in single columns in the basic financial statements. Comparative data from the prior fiscal year is also included on select financial statements.
Figure A‐2 summarizes the major features of the County’s financial statements, including the portion of the County government they cover and the types of information they contain. The remainder of this overview section of management’s discussion and analysis explains the structure and contents of each of the statements.
Figure A‐2 Major Features of the County’s Government‐wide and Fund Financial Statements
Government‐Wide
Statements
Fund Statements
Governmental Funds Proprietary Funds Fiduciary FundsScope Entire County government
(except fiduciary funds) and the County’s component units
The activities of the County that are not proprietary or fiduciary, such as police, fire, and community development
Activities the County operates similar to private businesses such as, the Landfill, Innovation Technology Park, and Parks & Recreation
Instances in which the County is the trustee or agent for someone else’s resources, such as the retirement plan for County employees
Required financial statements
Statement of net position
Statement of activities
Balance sheet Statement of revenues,
expenditures, and changes in fund balances
Statement of net position
Statement of revenues, expenses, and changes in net position
Statement of cash flows
Statement of fiduciary net position
Statement of changes in fiduciary net position
Accounting basis and measurement focus
Accrual accounting and economic resources focus
Modified accrual accounting and current financial resources focus
Accrual accounting and economic resources focus
Accrual accounting and economic resources focus
Type of asset/liability information
All assets and liabilities, both financial and capital, and short‐term and long‐term
Only assets expected to be used up and liabilities that come due during the year or soon thereafter, no capital assets included
All assets and liabilities, both financial and capital, and short‐term and long‐term
All assets and liabilities, both short‐term and long‐term; the County’s funds do not currently contain capital assets although they can
Type of inflow/outflow information
All revenues and expenses during the year, regardless of when cash is received or paid
Revenues for which cash is received during or soon after the end of the year; expenditures when goods or services have been received and payment is due during the year or soon thereafter
All revenues and expenses during the year, regardless of when cash is received or paid
All revenues and expenses during the year, regardless of when cash is received or paid
24

Government‐wide Statements The government‐wide statements report information about the County as a whole using accounting methods similar to those used by private‐sector companies. The statement of net position includes all of the government’s assets and liabilities. All of the current year’s revenues and expenses are accounted for in the statement of activities regardless of when cash is received or paid. The two government‐wide statements report the County’s net position and how they have changed. Net position – the difference between the County’s assets, deferred outflows, liabilities and deferred inflows – is one way to measure the County’s financial health. Over time, increases or decreases in the County’s net position are an indicator of whether its financial health is improving or deteriorating, respectively. To assess the overall health of the County, one needs to consider additional factors, such as changes in the County’s property tax base. The government‐wide financial statements of the County are divided into three categories:
Governmental activities—Most of the County’s basic services are included here, such as the police, fire, public works, transportation, community development, and general government administration. Property and other taxes and state and federal grants are the primary funding source of these activities.
Business‐type activities—The County charges fees to customers to help it cover the costs of certain services it provides. The County’s Landfill, Innovation Technology Park, and Parks & Recreation are included here.
Component units—The County includes three other entities in its report—the Prince William County School Board, the Adult Detention Center and the Prince William County/Manassas Convention Visitors Bureau. Although legally separate, these are considered “component units” because the County is financially accountable for them. Park Authority, previously reported as a component unit, has merged with the County and is reported as a part of the County as the Department of Parks & Recreation.
Fund Financial Statements The fund financial statements provide more detailed information about the County’s most significant funds—not the County as a whole. Funds are accounting devices that the County uses to keep track of specific sources of funding and spending for particular purposes. The County establishes funds to control and manage money for particular purposes (i.e., Education capital projects fund) or to show that it is properly using certain taxes and grants (i.e., Housing special revenue fund). The County has three kinds of funds:
Governmental funds—Most of the County’s basic services are included in governmental funds, which focus on: (1) how cash and other financial assets that can readily be converted to cash flow in and out; and (2) the balances left at year‐end that are available for spending. Consequently, the governmental funds statements provide a detailed short‐term view that indicates whether there are more or fewer financial resources that can be spent in the near future to finance the County’s programs. Because this information does not encompass the additional long‐term focus of the government‐wide statements, a detailed reconciliation provides additional information that explains the relationship (or differences) between the statements.
- The County’s governmental fund balances are categorized into five classifications based upon constraints
imposed upon the use of the resources ‐‐ non‐spendable, restricted, committed, assigned and unassigned.
25
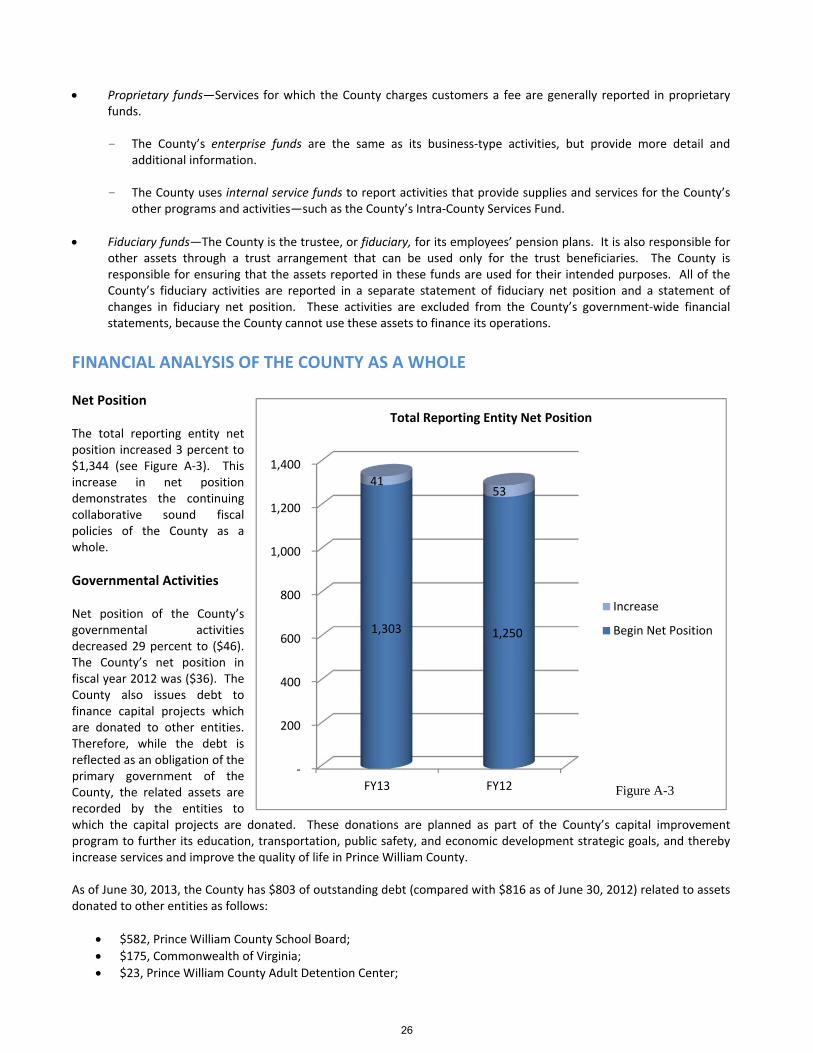
Proprietary funds—Services for which the County charges customers a fee are generally reported in proprietary funds.
- The County’s enterprise funds are the same as its business‐type activities, but provide more detail and
additional information.
- The County uses internal service funds to report activities that provide supplies and services for the County’s other programs and activities—such as the County’s Intra‐County Services Fund.
Fiduciary funds—The County is the trustee, or fiduciary, for its employees’ pension plans. It is also responsible for other assets through a trust arrangement that can be used only for the trust beneficiaries. The County is responsible for ensuring that the assets reported in these funds are used for their intended purposes. All of the County’s fiduciary activities are reported in a separate statement of fiduciary net position and a statement of changes in fiduciary net position. These activities are excluded from the County’s government‐wide financial statements, because the County cannot use these assets to finance its operations.
FINANCIAL ANALYSIS OF THE COUNTY AS A WHOLE Net Position The total reporting entity net position increased 3 percent to $1,344 (see Figure A‐3). This increase in net position demonstrates the continuing collaborative sound fiscal policies of the County as a whole.
Governmental Activities Net position of the County’s governmental activities decreased 29 percent to ($46). The County’s net position in fiscal year 2012 was ($36). The County also issues debt to finance capital projects which are donated to other entities. Therefore, while the debt is reflected as an obligation of the primary government of the County, the related assets are recorded by the entities to which the capital projects are donated. These donations are planned as part of the County’s capital improvement program to further its education, transportation, public safety, and economic development strategic goals, and thereby increase services and improve the quality of life in Prince William County. As of June 30, 2013, the County has $803 of outstanding debt (compared with $816 as of June 30, 2012) related to assets donated to other entities as follows:
$582, Prince William County School Board;
$175, Commonwealth of Virginia;
$23, Prince William County Adult Detention Center;
‐
200
400
600
800
1,000
1,200
1,400
FY13 FY12
1,303 1,250
4153
Total Reporting Entity Net Position
Increase
Begin Net Position
Figure A-3
26
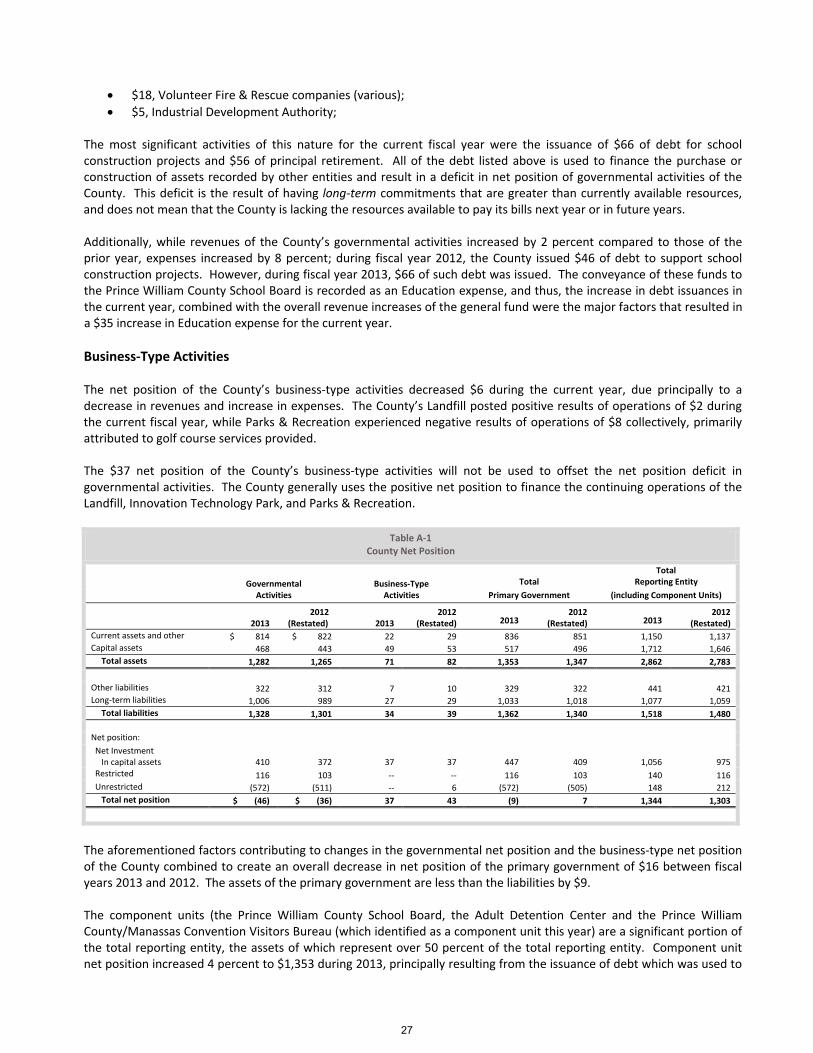
$18, Volunteer Fire & Rescue companies (various);
$5, Industrial Development Authority; The most significant activities of this nature for the current fiscal year were the issuance of $66 of debt for school construction projects and $56 of principal retirement. All of the debt listed above is used to finance the purchase or construction of assets recorded by other entities and result in a deficit in net position of governmental activities of the County. This deficit is the result of having long‐term commitments that are greater than currently available resources, and does not mean that the County is lacking the resources available to pay its bills next year or in future years. Additionally, while revenues of the County’s governmental activities increased by 2 percent compared to those of the prior year, expenses increased by 8 percent; during fiscal year 2012, the County issued $46 of debt to support school construction projects. However, during fiscal year 2013, $66 of such debt was issued. The conveyance of these funds to the Prince William County School Board is recorded as an Education expense, and thus, the increase in debt issuances in the current year, combined with the overall revenue increases of the general fund were the major factors that resulted in a $35 increase in Education expense for the current year.
Business‐Type Activities The net position of the County’s business‐type activities decreased $6 during the current year, due principally to a decrease in revenues and increase in expenses. The County’s Landfill posted positive results of operations of $2 during the current fiscal year, while Parks & Recreation experienced negative results of operations of $8 collectively, primarily attributed to golf course services provided. The $37 net position of the County’s business‐type activities will not be used to offset the net position deficit in governmental activities. The County generally uses the positive net position to finance the continuing operations of the Landfill, Innovation Technology Park, and Parks & Recreation.
Table A‐1County Net Position
Governmental Business‐Type
Total
Total Reporting Entity
Activities Activities Primary Government (including Component Units)
2013
2012 (Restated) 2013
2012 (Restated)
2013
2012 (Restated)
2013
2012(Restated)
Current assets and other $ 814 $ 822 22 29 836 851 1,150 1,137 Capital assets 468 443 49 53 517 496 1,712 1,646
Total assets 1,282 1,265 71 82 1,353 1,347 2,862 2,783
Other liabilities 322 312 7 10 329 322 441 421 Long‐term liabilities 1,006 989 27 29 1,033 1,018 1,077 1,059
Total liabilities 1,328 1,301 34 39 1,362 1,340 1,518 1,480
Net position: Net Investment In capital assets 410 372 37 37 447 409 1,056 975 Restricted 116 103 ‐‐ ‐‐ 116 103 140 116 Unrestricted (572) (511) ‐‐ 6 (572) (505) 148 212
Total net position $ (46) $ (36) 37 43 (9) 7 1,344 1,303
The aforementioned factors contributing to changes in the governmental net position and the business‐type net position of the County combined to create an overall decrease in net position of the primary government of $16 between fiscal years 2013 and 2012. The assets of the primary government are less than the liabilities by $9. The component units (the Prince William County School Board, the Adult Detention Center and the Prince William County/Manassas Convention Visitors Bureau (which identified as a component unit this year) are a significant portion of the total reporting entity, the assets of which represent over 50 percent of the total reporting entity. Component unit net position increased 4 percent to $1,353 during 2013, principally resulting from the issuance of debt which was used to
27

increase investments in capital assets. The net position of the primary government of ($9) combined with the net position of the component units of $1,353 resulted in total net position for the total reporting entity of $1,344.
Changes in Net Position Table A‐2 and the narrative that follows consider the operations of governmental and business‐type activities separately. See Figures A‐4, A‐5 and A‐6 for the revenue percentages and net costs for governmental activities.
Table A‐2 Prince William County’s Changes in Net Position
Governmental Activities
Business‐Type Activities
Total Primary Government
Total ReportingEntity
(including component units)
2013
2012(Restated) 2013
2012(Restated) 2013
2012 (Restated) 2013
2012(Restated)
Revenues: Program revenues: Charges for services $ 47 39 28 31 75 70 100 94 Operating grants and contributions 77 78 ‐‐ ‐‐ 77 78 224 222 Capital grants and contributions 30 37 ‐‐ ‐‐ 30 37 30 38 General revenues: Taxes: Real property 552 527 ‐‐ ‐‐ 552 527 552 527 Personal property 85 78 ‐‐ ‐‐ 85 78 85 78 Other taxes 116 110 ‐‐ ‐‐ 116 110 116 110 Payment from primary Government ‐‐ 22 ‐‐ ‐‐ ‐‐ 22 557 519 Grants and contributions not restricted to specific programs 82 82 ‐‐ ‐‐ 82 82 436 406 Unrestricted investment earnings (1) 20 ‐‐ 1 (1) 21 ‐‐ 24
Miscellaneous 37 10 1 1 38 11 42 14
Total revenues 1,025 1,003 29 33 1,054 1,036 2,142 2,032
Expenses:
General government administration 38 40 ‐‐ ‐‐ 38 40 38 40 Judicial administration 20 18 ‐‐ ‐‐ 20 18 20 18 Public safety 234 216 ‐‐ ‐‐ 234 216 234 216 Public works 73 56 ‐‐ ‐‐ 73 56 73 56 Health and welfare 76 75 ‐‐ ‐‐ 76 75 76 75 Education 463 406 ‐‐ ‐‐ 463 406 463 406 Parks, recreational and cultural 34 55 ‐‐ ‐‐ 34 55 34 40
Community development 54 52 ‐‐ ‐‐ 54 52 54 52 Interest on long‐term debt 43 43 ‐‐ ‐‐ 43 43 43 43 Enterprise ‐‐ ‐‐ 35 33 35 33 35 17 Component Units ‐‐ ‐‐ ‐‐ ‐‐ ‐‐ ‐‐ 1,031 1016
Total expenses 1,035 961 35 33 1,070 994 2,101 1,979Increase (Decrease) in net position before transfers (10) 42 (6) (0) (16) 42 41 53 Transfers ‐‐ 2 ‐‐ (2) ‐‐ ‐‐ ‐‐ ‐‐
Increase (Decrease) in Net position (10) 44 (6) (2) (16) 42 41 53 Net position– beginning (36) (80) 43 45 7 (35) 1,303 1,250
Net position – ending $ (46) $ (36) 37 43 (9) 7 1,344 1,303
The total reporting entity net position increased by $41 in fiscal year 2013 as total revenues of $2,142, 5 percent higher than fiscal year 2012, exceeded total expenses of $2,101, which were 6 percent higher than expenses of the prior year.
28
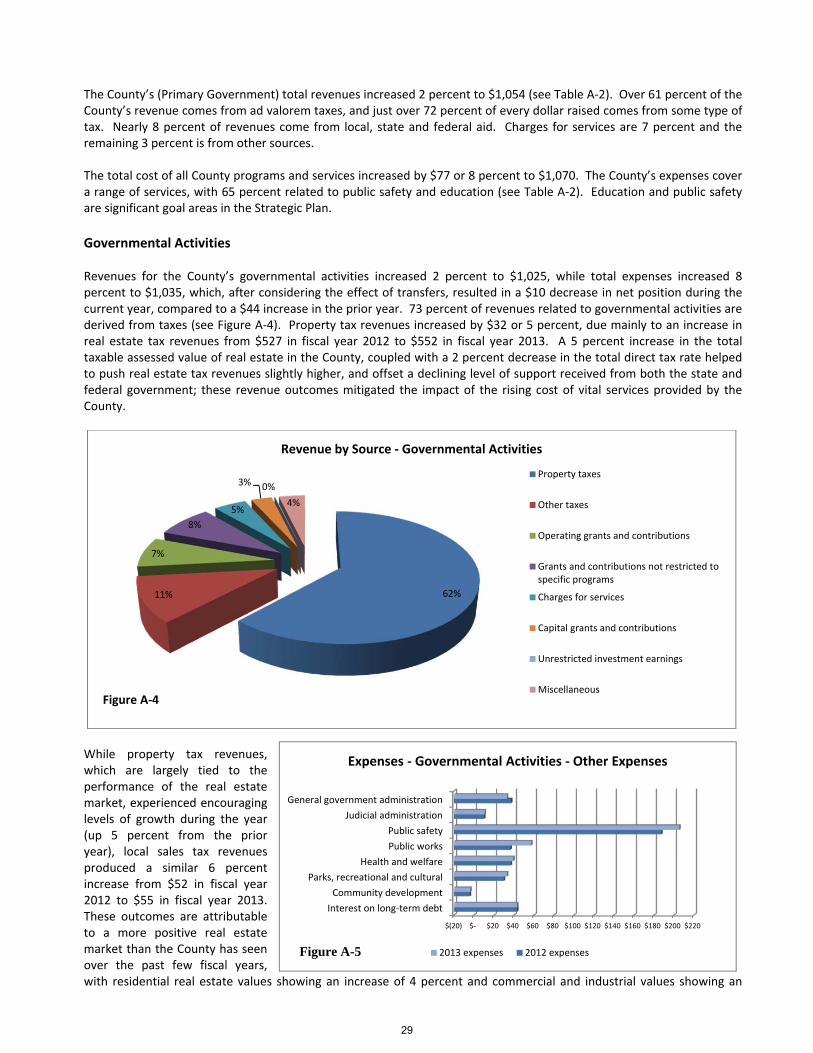
The County’s (Primary Government) total revenues increased 2 percent to $1,054 (see Table A‐2). Over 61 percent of the County’s revenue comes from ad valorem taxes, and just over 72 percent of every dollar raised comes from some type of tax. Nearly 8 percent of revenues come from local, state and federal aid. Charges for services are 7 percent and the remaining 3 percent is from other sources. The total cost of all County programs and services increased by $77 or 8 percent to $1,070. The County’s expenses cover a range of services, with 65 percent related to public safety and education (see Table A‐2). Education and public safety are significant goal areas in the Strategic Plan.
Governmental Activities Revenues for the County’s governmental activities increased 2 percent to $1,025, while total expenses increased 8 percent to $1,035, which, after considering the effect of transfers, resulted in a $10 decrease in net position during the current year, compared to a $44 increase in the prior year. 73 percent of revenues related to governmental activities are derived from taxes (see Figure A‐4). Property tax revenues increased by $32 or 5 percent, due mainly to an increase in real estate tax revenues from $527 in fiscal year 2012 to $552 in fiscal year 2013. A 5 percent increase in the total taxable assessed value of real estate in the County, coupled with a 2 percent decrease in the total direct tax rate helped to push real estate tax revenues slightly higher, and offset a declining level of support received from both the state and federal government; these revenue outcomes mitigated the impact of the rising cost of vital services provided by the County.
While property tax revenues, which are largely tied to the performance of the real estate market, experienced encouraging levels of growth during the year (up 5 percent from the prior year), local sales tax revenues produced a similar 6 percent increase from $52 in fiscal year 2012 to $55 in fiscal year 2013. These outcomes are attributable to a more positive real estate market than the County has seen over the past few fiscal years, with residential real estate values showing an increase of 4 percent and commercial and industrial values showing an
62%11%
7%
8%
5%
3% 0%
4%
Revenue by Source ‐ Governmental Activities
Property taxes
Other taxes
Operating grants and contributions
Grants and contributions not restricted tospecific programs
Charges for services
Capital grants and contributions
Unrestricted investment earnings
MiscellaneousFigure A‐4
$(20) $‐ $20 $40 $60 $80 $100 $120 $140 $160 $180 $200 $220
Interest on long‐term debt
Community development
Parks, recreational and cultural
Health and welfare
Public works
Public safety
Judicial administration
General government administration
Expenses ‐ Governmental Activities ‐ Other Expenses
2013 expenses 2012 expensesFigure A-5
29
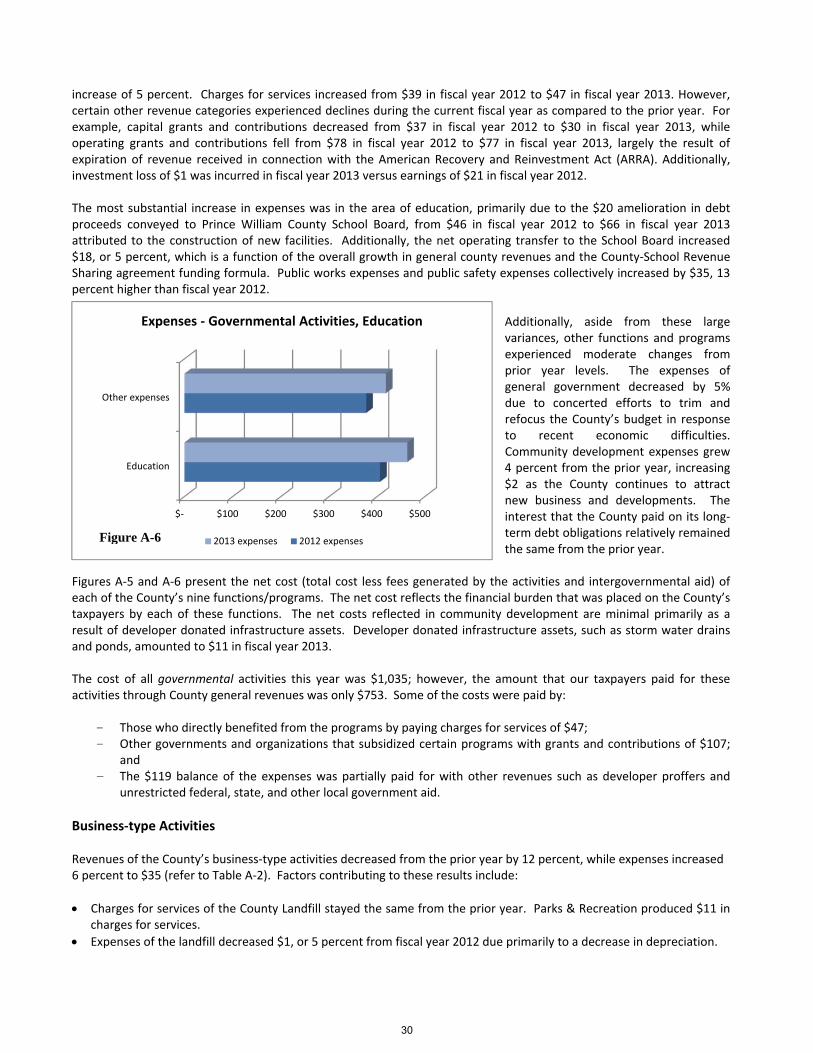
increase of 5 percent. Charges for services increased from $39 in fiscal year 2012 to $47 in fiscal year 2013. However, certain other revenue categories experienced declines during the current fiscal year as compared to the prior year. For example, capital grants and contributions decreased from $37 in fiscal year 2012 to $30 in fiscal year 2013, while operating grants and contributions fell from $78 in fiscal year 2012 to $77 in fiscal year 2013, largely the result of expiration of revenue received in connection with the American Recovery and Reinvestment Act (ARRA). Additionally, investment loss of $1 was incurred in fiscal year 2013 versus earnings of $21 in fiscal year 2012. The most substantial increase in expenses was in the area of education, primarily due to the $20 amelioration in debt proceeds conveyed to Prince William County School Board, from $46 in fiscal year 2012 to $66 in fiscal year 2013 attributed to the construction of new facilities. Additionally, the net operating transfer to the School Board increased $18, or 5 percent, which is a function of the overall growth in general county revenues and the County‐School Revenue Sharing agreement funding formula. Public works expenses and public safety expenses collectively increased by $35, 13 percent higher than fiscal year 2012.
Additionally, aside from these large variances, other functions and programs experienced moderate changes from prior year levels. The expenses of general government decreased by 5% due to concerted efforts to trim and refocus the County’s budget in response to recent economic difficulties. Community development expenses grew 4 percent from the prior year, increasing $2 as the County continues to attract new business and developments. The interest that the County paid on its long‐term debt obligations relatively remained the same from the prior year.
Figures A‐5 and A‐6 present the net cost (total cost less fees generated by the activities and intergovernmental aid) of each of the County’s nine functions/programs. The net cost reflects the financial burden that was placed on the County’s taxpayers by each of these functions. The net costs reflected in community development are minimal primarily as a result of developer donated infrastructure assets. Developer donated infrastructure assets, such as storm water drains and ponds, amounted to $11 in fiscal year 2013. The cost of all governmental activities this year was $1,035; however, the amount that our taxpayers paid for these activities through County general revenues was only $753. Some of the costs were paid by:
- Those who directly benefited from the programs by paying charges for services of $47; - Other governments and organizations that subsidized certain programs with grants and contributions of $107;
and - The $119 balance of the expenses was partially paid for with other revenues such as developer proffers and
unrestricted federal, state, and other local government aid.
Business‐type Activities Revenues of the County’s business‐type activities decreased from the prior year by 12 percent, while expenses increased 6 percent to $35 (refer to Table A‐2). Factors contributing to these results include:
Charges for services of the County Landfill stayed the same from the prior year. Parks & Recreation produced $11 in charges for services.
Expenses of the landfill decreased $1, or 5 percent from fiscal year 2012 due primarily to a decrease in depreciation.
$‐ $100 $200 $300 $400 $500
Education
Other expenses
Expenses ‐ Governmental Activities, Education
2013 expenses 2012 expensesFigure A-6
30
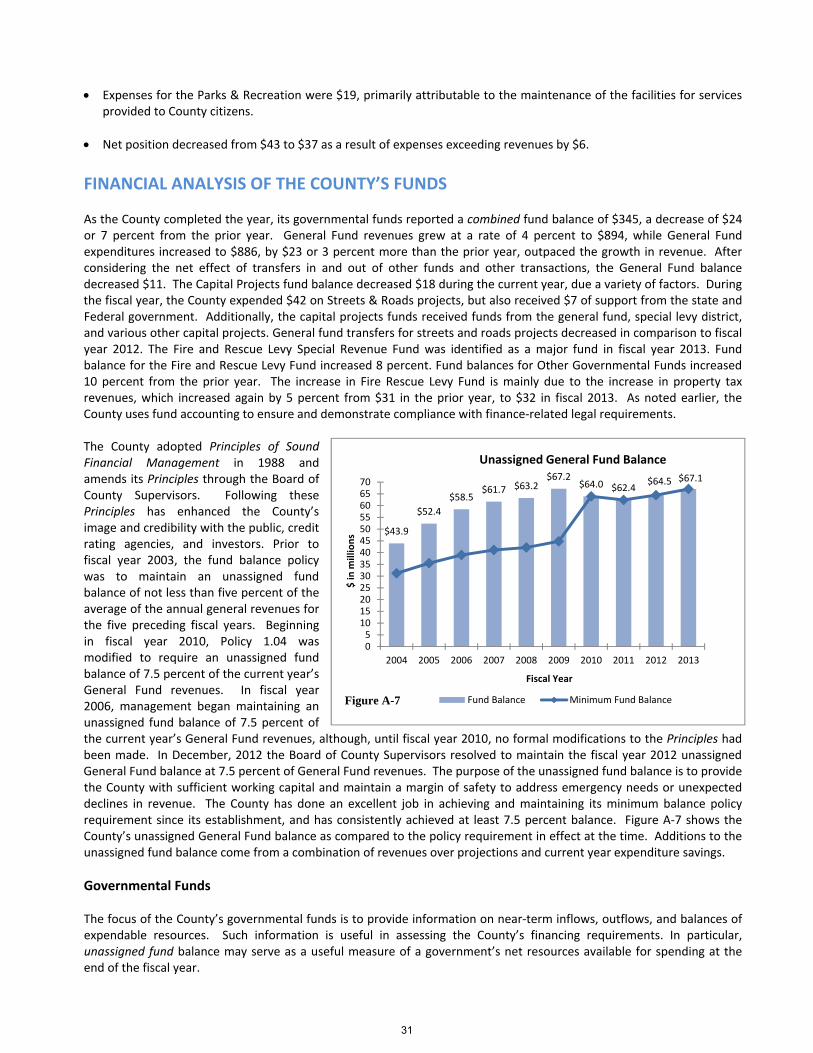
Expenses for the Parks & Recreation were $19, primarily attributable to the maintenance of the facilities for services provided to County citizens.
Net position decreased from $43 to $37 as a result of expenses exceeding revenues by $6.
FINANCIAL ANALYSIS OF THE COUNTY’S FUNDS As the County completed the year, its governmental funds reported a combined fund balance of $345, a decrease of $24 or 7 percent from the prior year. General Fund revenues grew at a rate of 4 percent to $894, while General Fund expenditures increased to $886, by $23 or 3 percent more than the prior year, outpaced the growth in revenue. After considering the net effect of transfers in and out of other funds and other transactions, the General Fund balance decreased $11. The Capital Projects fund balance decreased $18 during the current year, due a variety of factors. During the fiscal year, the County expended $42 on Streets & Roads projects, but also received $7 of support from the state and Federal government. Additionally, the capital projects funds received funds from the general fund, special levy district, and various other capital projects. General fund transfers for streets and roads projects decreased in comparison to fiscal year 2012. The Fire and Rescue Levy Special Revenue Fund was identified as a major fund in fiscal year 2013. Fund balance for the Fire and Rescue Levy Fund increased 8 percent. Fund balances for Other Governmental Funds increased 10 percent from the prior year. The increase in Fire Rescue Levy Fund is mainly due to the increase in property tax revenues, which increased again by 5 percent from $31 in the prior year, to $32 in fiscal 2013. As noted earlier, the County uses fund accounting to ensure and demonstrate compliance with finance‐related legal requirements. The County adopted Principles of Sound Financial Management in 1988 and amends its Principles through the Board of County Supervisors. Following these Principles has enhanced the County’s image and credibility with the public, credit rating agencies, and investors. Prior to fiscal year 2003, the fund balance policy was to maintain an unassigned fund balance of not less than five percent of the average of the annual general revenues for the five preceding fiscal years. Beginning in fiscal year 2010, Policy 1.04 was modified to require an unassigned fund balance of 7.5 percent of the current year’s General Fund revenues. In fiscal year 2006, management began maintaining an unassigned fund balance of 7.5 percent of the current year’s General Fund revenues, although, until fiscal year 2010, no formal modifications to the Principles had been made. In December, 2012 the Board of County Supervisors resolved to maintain the fiscal year 2012 unassigned General Fund balance at 7.5 percent of General Fund revenues. The purpose of the unassigned fund balance is to provide the County with sufficient working capital and maintain a margin of safety to address emergency needs or unexpected declines in revenue. The County has done an excellent job in achieving and maintaining its minimum balance policy requirement since its establishment, and has consistently achieved at least 7.5 percent balance. Figure A‐7 shows the County’s unassigned General Fund balance as compared to the policy requirement in effect at the time. Additions to the unassigned fund balance come from a combination of revenues over projections and current year expenditure savings.
Governmental Funds The focus of the County’s governmental funds is to provide information on near‐term inflows, outflows, and balances of expendable resources. Such information is useful in assessing the County’s financing requirements. In particular, unassigned fund balance may serve as a useful measure of a government’s net resources available for spending at the end of the fiscal year.
$43.9
$52.4
$58.5$61.7 $63.2
$67.2$64.0 $62.4
$64.5 $67.1
0510152025303540455055606570
2004 2005 2006 2007 2008 2009 2010 2011 2012 2013
$ in
millions
Fiscal Year
Unassigned General Fund Balance
Fund Balance Minimum Fund BalanceFigure A-7
31
The County’s General Fund balance decreased $11 or 7 percent despite favorable actual revenues of 6% coupled with actual expenditure increase of 4%. Actual revenues exceeded the final budget primarily due to higher than anticipated property tax revenues, which experienced growth as a result of a 5 percent increase in the taxable assessed value of real estate during fiscal year 2013. However, departmental expenditures increased $34 or 4 percent from prior year primarily in the areas of education and public safety.
The financial results detailed in governmental funds demonstrate the County’s accountability to its five strategic goal areas of economic development, public safety, human services, education, and transportation aligned to address the impact of population growth and increased needs of the community.
The County increased its investment in public safety in the current year, increasing expenditures by $13 or 7
percent from the prior year; public safety expenditures continue to represent approximately 22 percent of total expenditures of governmental funds.
Part of the County’s Transportation Goal is to alleviate congestion and is further defined in the second
initiative in the Letter of Transmittal. The $42 spent on the construction of various streets and roads are transferred to and become assets of the Commonwealth of Virginia upon completion.
The County’s operating support to the School Board increased by $48 during 2013. This upturn was the
result of the growth in general County revenues, which increased the amount of support due to the County School Board per the Revenue‐Sharing Agreement, and accounted for nearly $18 of the 2013 increase. Additionally, support for school construction projects increased from the prior year, as the County issued $20 more debt during the fiscal year 2013, and therefore, conveyed far more funding related to capital projects.
Bond proceeds of $66 for fiscal year 2013 were conveyed to the Prince William County School Board through the sale of general obligation bonds to the VPSA and are budgeted to be spent on part of the costs of constructing additions to a high school and four elementary schools, a new middle school, three new elementary schools, an elementary to middle school and infrastructure upgrades needed for technology improvements.
Proprietary Funds The County’s proprietary funds provide the same type of information found in the government‐wide financial statements but in more detail. Unrestricted net position of the Landfill at the end of the year was $2, while unrestricted net position amounted to $7 for Innovation Technology Park. The merger of Parks & Recreation resulted in the addition of a new fund. Unrestricted net position of the Landfill decreased marginally from fiscal year 2012 as the County’s closure liability increased for the Landfill; while Innovation Technology Park’s unrestricted net position stayed the same. The new Parks and Recreation enterprise fund ended the fiscal year with an unrestricted net position of ($10).
General Fund Budgetary Highlights Over the course of the year, the Board of County Supervisors revised the County budget several times. These budget amendments fall into two categories:
Amendments to appropriations approved shortly after the beginning of the year to reflect budget carryovers from the prior year.
Increases in appropriations based on supplemental funding sources. After these adjustments, budgetary expenditures were $16 lower than the final budget amounts while budgetary revenues exceeded the final budget by $10. These two factors, combined with the effect of transfers to other funds, resulted in an increase in the fund balance of the General Fund, on a budgetary basis, of $1 during the fiscal year. The most significant revenue variances were related to other local taxes ($6 higher than the final budget), charges for services
32
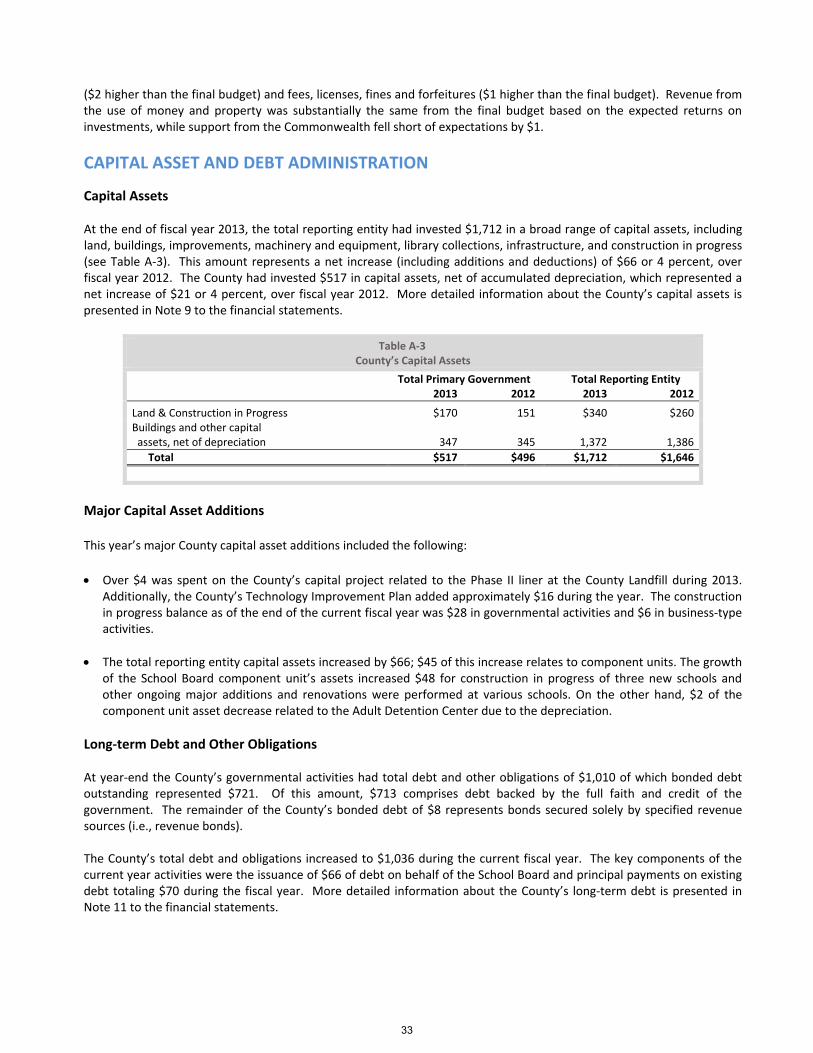
($2 higher than the final budget) and fees, licenses, fines and forfeitures ($1 higher than the final budget). Revenue from the use of money and property was substantially the same from the final budget based on the expected returns on investments, while support from the Commonwealth fell short of expectations by $1.
CAPITAL ASSET AND DEBT ADMINISTRATION
Capital Assets At the end of fiscal year 2013, the total reporting entity had invested $1,712 in a broad range of capital assets, including land, buildings, improvements, machinery and equipment, library collections, infrastructure, and construction in progress (see Table A‐3). This amount represents a net increase (including additions and deductions) of $66 or 4 percent, over fiscal year 2012. The County had invested $517 in capital assets, net of accumulated depreciation, which represented a net increase of $21 or 4 percent, over fiscal year 2012. More detailed information about the County’s capital assets is presented in Note 9 to the financial statements.
Table A‐3 County’s Capital Assets
Total Primary Government Total Reporting Entity 2013 2012 2013 2012
Land & Construction in Progress $170 151 $340 $260Buildings and other capital assets, net of depreciation 347 345 1,372 1,386
Total $517 $496 $1,712 $1,646
Major Capital Asset Additions This year’s major County capital asset additions included the following:
Over $4 was spent on the County’s capital project related to the Phase II liner at the County Landfill during 2013.
Additionally, the County’s Technology Improvement Plan added approximately $16 during the year. The construction in progress balance as of the end of the current fiscal year was $28 in governmental activities and $6 in business‐type activities.
The total reporting entity capital assets increased by $66; $45 of this increase relates to component units. The growth of the School Board component unit’s assets increased $48 for construction in progress of three new schools and other ongoing major additions and renovations were performed at various schools. On the other hand, $2 of the component unit asset decrease related to the Adult Detention Center due to the depreciation.
Long‐term Debt and Other Obligations At year‐end the County’s governmental activities had total debt and other obligations of $1,010 of which bonded debt outstanding represented $721. Of this amount, $713 comprises debt backed by the full faith and credit of the government. The remainder of the County’s bonded debt of $8 represents bonds secured solely by specified revenue sources (i.e., revenue bonds). The County’s total debt and obligations increased to $1,036 during the current fiscal year. The key components of the current year activities were the issuance of $66 of debt on behalf of the School Board and principal payments on existing debt totaling $70 during the fiscal year. More detailed information about the County’s long‐term debt is presented in Note 11 to the financial statements.
33
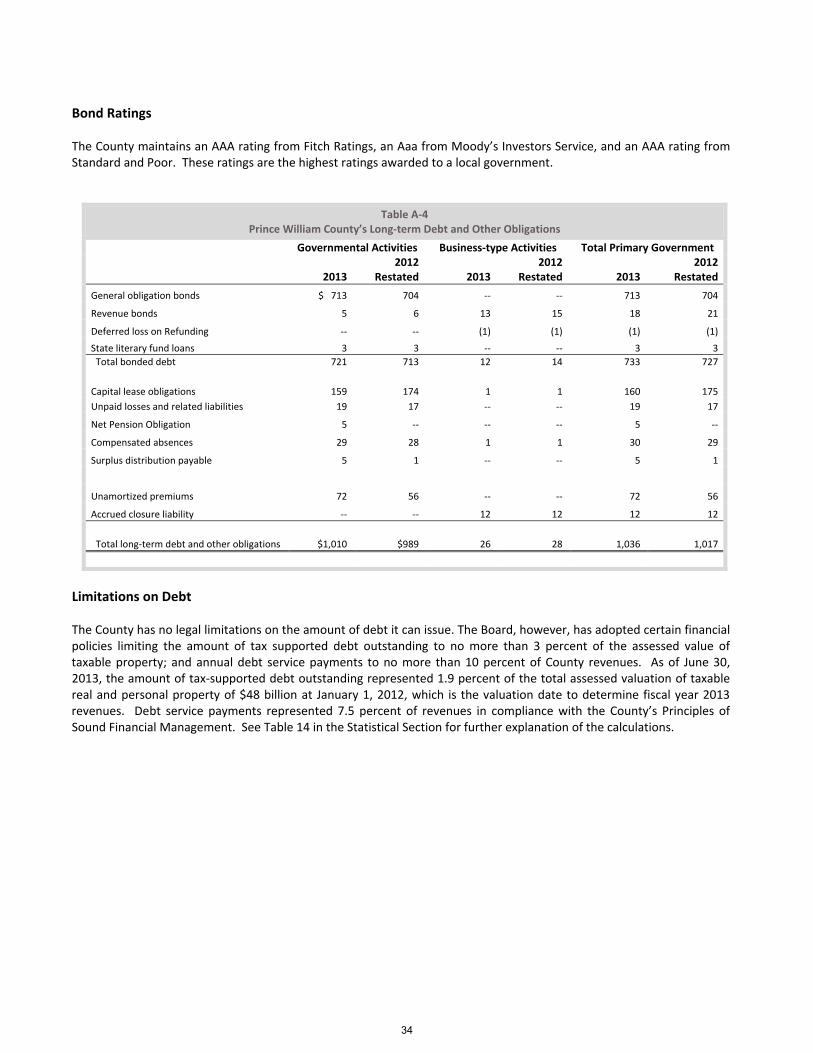
Bond Ratings The County maintains an AAA rating from Fitch Ratings, an Aaa from Moody’s Investors Service, and an AAA rating from Standard and Poor. These ratings are the highest ratings awarded to a local government.
Table A‐4 Prince William County’s Long‐term Debt and Other Obligations
Governmental Activities Business‐type Activities Total Primary Government
2013 2012
Restated
2013 2012
Restated
2013 2012
Restated
General obligation bonds $ 713 704 ‐‐ ‐‐ 713 704
Revenue bonds 5 6 13 15 18 21
Deferred loss on Refunding ‐‐ ‐‐ (1) (1) (1) (1)
State literary fund loans 3 3 ‐‐ ‐‐ 3 3
Total bonded debt 721 713 12 14 733 727
Capital lease obligations 159 174 1 1 160 175
Unpaid losses and related liabilities 19 17 ‐‐ ‐‐ 19 17
Net Pension Obligation 5 ‐‐ ‐‐ ‐‐ 5 ‐‐
Compensated absences 29 28 1 1 30 29
Surplus distribution payable 5 1 ‐‐ ‐‐ 5 1
Unamortized premiums 72 56 ‐‐ ‐‐ 72 56
Accrued closure liability ‐‐ ‐‐ 12 12 12 12
Total long‐term debt and other obligations $1,010 $989 26 28 1,036 1,017
Limitations on Debt The County has no legal limitations on the amount of debt it can issue. The Board, however, has adopted certain financial policies limiting the amount of tax supported debt outstanding to no more than 3 percent of the assessed value of taxable property; and annual debt service payments to no more than 10 percent of County revenues. As of June 30, 2013, the amount of tax‐supported debt outstanding represented 1.9 percent of the total assessed valuation of taxable real and personal property of $48 billion at January 1, 2012, which is the valuation date to determine fiscal year 2013 revenues. Debt service payments represented 7.5 percent of revenues in compliance with the County’s Principles of Sound Financial Management. See Table 14 in the Statistical Section for further explanation of the calculations.
34
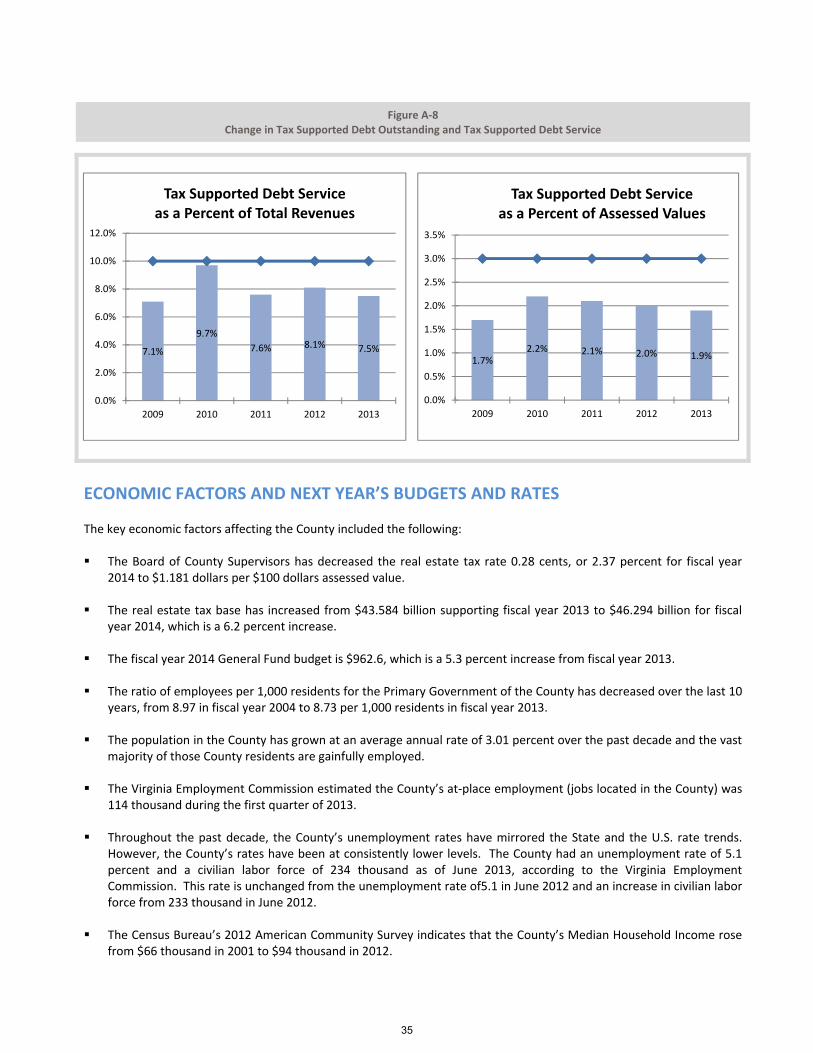
Figure A‐8 Change in Tax Supported Debt Outstanding and Tax Supported Debt Service
ECONOMIC FACTORS AND NEXT YEAR’S BUDGETS AND RATES The key economic factors affecting the County included the following: The Board of County Supervisors has decreased the real estate tax rate 0.28 cents, or 2.37 percent for fiscal year
2014 to $1.181 dollars per $100 dollars assessed value. The real estate tax base has increased from $43.584 billion supporting fiscal year 2013 to $46.294 billion for fiscal
year 2014, which is a 6.2 percent increase. The fiscal year 2014 General Fund budget is $962.6, which is a 5.3 percent increase from fiscal year 2013. The ratio of employees per 1,000 residents for the Primary Government of the County has decreased over the last 10
years, from 8.97 in fiscal year 2004 to 8.73 per 1,000 residents in fiscal year 2013. The population in the County has grown at an average annual rate of 3.01 percent over the past decade and the vast
majority of those County residents are gainfully employed. The Virginia Employment Commission estimated the County’s at‐place employment (jobs located in the County) was
114 thousand during the first quarter of 2013. Throughout the past decade, the County’s unemployment rates have mirrored the State and the U.S. rate trends.
However, the County’s rates have been at consistently lower levels. The County had an unemployment rate of 5.1 percent and a civilian labor force of 234 thousand as of June 2013, according to the Virginia Employment Commission. This rate is unchanged from the unemployment rate of5.1 in June 2012 and an increase in civilian labor force from 233 thousand in June 2012.
The Census Bureau’s 2012 American Community Survey indicates that the County’s Median Household Income rose
from $66 thousand in 2001 to $94 thousand in 2012.
1.7%2.2% 2.1% 2.0% 1.9%
0.0%
0.5%
1.0%
1.5%
2.0%
2.5%
3.0%
3.5%
2009 2010 2011 2012 2013
Tax Supported Debt Serviceas a Percent of Assessed Values
7.1%
9.7%
7.6% 8.1% 7.5%
0.0%
2.0%
4.0%
6.0%
8.0%
10.0%
12.0%
2009 2010 2011 2012 2013
Tax Supported Debt Serviceas a Percent of Total Revenues
35

The aforementioned factors were considered in preparing the County’s budget for the 2014 fiscal year. Amounts
available for appropriation in the General Fund budget are $962.6, a 5.3 percent increase from the adopted 2013 budget.
Real estate tax rates are slightly lower as the Board attempts to balance the impact of changes affecting real estate
assessments on its citizens, while still providing the funding required to ensure that the County has the resources
necessary to continue to provide vital services to the community. Further details of the County’s budget can be found in
its Adopted 2014 Fiscal Plan.
CONTACTING THE COUNTY’S FINANCIAL MANAGEMENT This financial report is designed to provide our citizens, taxpayers, customers, investors and creditors with a general overview of the County’s finances and to demonstrate the County’s accountability for the money it receives. If you have questions about this report or need additional financial information, contact the Office of the Finance Director, 1 County Complex Court, Prince William, Virginia, 22192‐9201.
36

BASIC FINANCIAL STATEMENTS
The Basic Financial Statements include all funds, discretely presented
component units and notes to provide an overview of the financial position and results of operation for the County as a whole. They also serve as an introduction to the more detailed statements and schedules that follow.
37
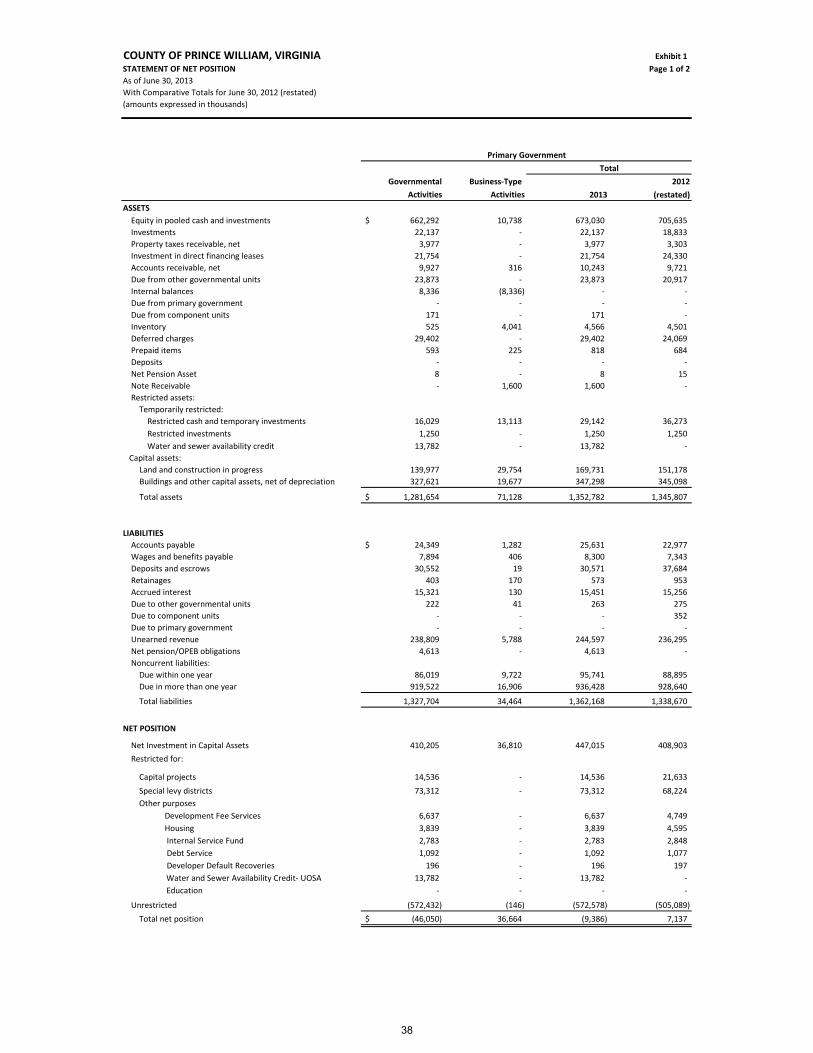
COUNTY OF PRINCE WILLIAM, VIRGINIA Exhibit 1
STATEMENT OF NET POSITION Page 1 of 2
As of June 30, 2013
With Comparative Totals for June 30, 2012 (restated)
(amounts expressed in thousands)
Governmental Business‐Type 2012
Activities Activities 2013 (restated)
ASSETS
Equity in pooled cash and investments 662,292$ 10,738 673,030 705,635
Investments 22,137 ‐ 22,137 18,833
Property taxes receivable, net 3,977 ‐ 3,977 3,303
Investment in direct financing leases 21,754 ‐ 21,754 24,330
Accounts receivable, net 9,927 316 10,243 9,721
Due from other governmental units 23,873 ‐ 23,873 20,917
Internal balances 8,336 (8,336) ‐ ‐
Due from primary government ‐ ‐ ‐ ‐
Due from component units 171 ‐ 171 ‐
Inventory 525 4,041 4,566 4,501
Deferred charges 29,402 ‐ 29,402 24,069
Prepaid items 593 225 818 684
Deposits ‐ ‐ ‐ ‐
Net Pension Asset 8 ‐ 8 15
Note Receivable ‐ 1,600 1,600 ‐
Restricted assets:
Temporarily restricted:
Restricted cash and temporary investments 16,029 13,113 29,142 36,273
Restricted investments 1,250 ‐ 1,250 1,250
Water and sewer availability credit 13,782 ‐ 13,782 ‐
Capital assets:
Land and construction in progress 139,977 29,754 169,731 151,178
Buildings and other capital assets, net of depreciation 327,621 19,677 347,298 345,098
Total assets 1,281,654$ 71,128 1,352,782 1,345,807
LIABILITIES
Accounts payable 24,349$ 1,282 25,631 22,977
Wages and benefits payable 7,894 406 8,300 7,343
Deposits and escrows 30,552 19 30,571 37,684
Retainages 403 170 573 953
Accrued interest 15,321 130 15,451 15,256
Due to other governmental units 222 41 263 275
Due to component units ‐ ‐ ‐ 352
Due to primary government ‐ ‐ ‐ ‐
Unearned revenue 238,809 5,788 244,597 236,295
Net pension/OPEB obligations 4,613 ‐ 4,613 ‐
Noncurrent liabilities:
Due within one year 86,019 9,722 95,741 88,895
Due in more than one year 919,522 16,906 936,428 928,640
Total liabilities 1,327,704 34,464 1,362,168 1,338,670
NET POSITION
Net Investment in Capital Assets 410,205 36,810 447,015 408,903
Restricted for:
Capital projects 14,536 ‐ 14,536 21,633
Special levy districts 73,312 ‐ 73,312 68,224
Other purposes
Development Fee Services 6,637 ‐ 6,637 4,749
Housing 3,839 ‐ 3,839 4,595
Internal Service Fund 2,783 ‐ 2,783 2,848
Debt Service 1,092 ‐ 1,092 1,077
Developer Default Recoveries 196 ‐ 196 197
Water and Sewer Availability Credit‐ UOSA 13,782 ‐ 13,782 ‐
Education ‐ ‐ ‐ ‐
Unrestricted (572,432) (146) (572,578) (505,089)
Total net position (46,050)$ 36,664 (9,386) 7,137
Total
Primary Government
38

Exhibit 1
Page 2 of 2
2012 2012
2013 (restated) 2013 (restated)
ASSETS
250,704 244,560 923,734 950,195 Equity in pooled cash and investments
‐ ‐ 22,137 18,833 Investments
‐ ‐ 3,977 3,303 Property taxes receivable, net
‐ ‐ 21,754 24,330 Investment in direct financing leases
2,096 2,016 12,339 11,737 Accounts receivable, net
32,317 24,058 56,190 44,975 Due from other governmental units
‐ ‐ ‐ ‐ Internal balances
‐ 352 ‐ 352 Due from primary government
‐ ‐ 171 ‐ Due from component units
3,667 3,229 8,233 7,730 Inventory
‐ ‐ 29,402 24,069 Deferred charges
2,027 1,570 2,845 2,254 Prepaid items
500 500 500 500 Deposits
‐ ‐ 8 15 Net Pension Asset
‐ ‐ 1,600 ‐ Note Receivable
Restricted assets:
Temporarily restricted:
22,707 11,917 51,849 48,190 Restricted cash and temporary investments
‐ ‐ 1,250 1,250 Restricted investments
‐ ‐ 13,782 ‐ Water and sewer availability credit
Capital assets:
170,260 108,695 339,991 259,873 Land and construction in progress
1,024,815 1,040,826 1,372,113 1,385,924 Buildings and other capital assets, net of depreciation
1,509,093 1,437,723 2,861,875 2,783,530 Total assets
LIABILITIES
12,044 11,214 37,675 34,191 Accounts payable
85,011 79,152 93,311 86,495 Wages and benefits payable
‐ ‐ 30,571 37,684 Deposits and escrows
3,635 2,289 4,208 3,242 Retainages
‐ ‐ 15,451 15,256 Accrued interest
540 188 803 463 Due to other governmental units
‐ ‐ ‐ 352 Due to component units
171 ‐ 171 ‐ Due to primary government
9,428 7,385 254,025 243,680 Unearned revenue
‐ ‐ 4,613 ‐ Net pension/OPEB obligations
Noncurrent liabilities:
18,759 18,173 114,500 107,068 Due within one year
26,530 23,549 962,958 952,189 Due in more than one year
156,118 141,950 1,518,286 1,480,620 Total liabilities
NET POSITION
1,195,075 1,149,459 1,055,634 A
975,195 Net Investment in Capital Assets
Restricted for:
19,418 11,917 14,536 A
10,843 Capital projects
‐ ‐ 73,312 68,224 Special levy districts
Other purposes
‐ ‐ 6,637 4,749 Development Fee Services
‐ ‐ 3,839 4,595 Housing
‐ ‐ 2,783 2,848 Internal Service Fund
‐ ‐ 1,092 1,077 Debt Service
‐ ‐ 196 197 Developer Default Recoveries
‐ ‐ 13,782 ‐ Water and Sewer Availability Credit‐ UOSA
23,673 22,874 23,673 22,874 Education
114,809 111,523 148,105 A
212,308 Unrestricted
1,352,975 1,295,773 1,343,589 1,302,910 Total net position
A The sum of the columns does not equal the Total Reporting Entity column by a difference of $605,874 because the debt related to the School Board component unit ($582,469),
and the ADC component unit ($23,405) is reflected in the primary government's general governmental activities column reducing unrestricted
column as Net Investment in Capital Assets. The Total Reporting Entity column matches the asset with the debt and reports the net amount in the component unit
on the net investment in capital assets. The net investment in capital assets is increased by Schools, and ADC unspent bond proceeds
of $19,418 with a corresponding decrease to the restricted capital projects.
Component
Units Reporting Entity
Total
39
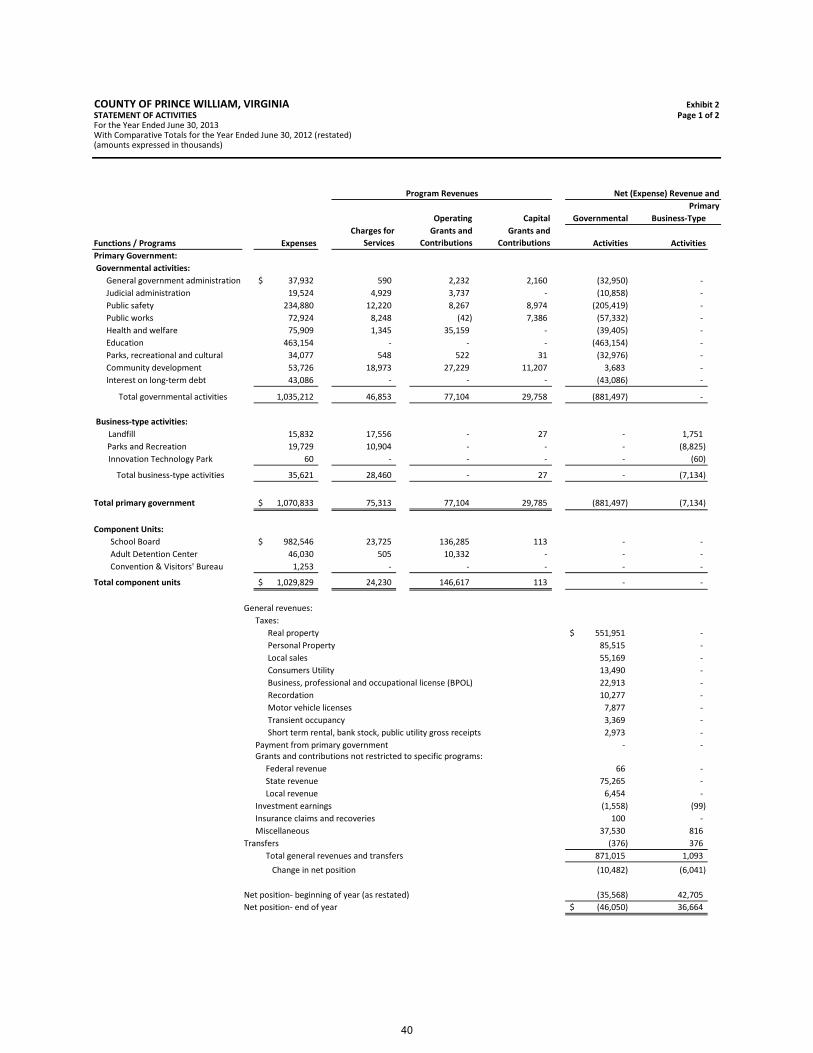
COUNTY OF PRINCE WILLIAM, VIRGINIA Exhibit 2STATEMENT OF ACTIVITIES Page 1 of 2For the Year Ended June 30, 2013With Comparative Totals for the Year Ended June 30, 2012 (restated)(amounts expressed in thousands)
Operating Capital
Charges for Operating Capital Governmental Business‐Type
Functions / Programs Expenses
Charges for
Services
Grants and
Contributions
Grants and
Contributions Activities Activities
Primary Government:
Governmental activities:
General government administration 37,932$ 590 2,232 2,160 (32,950) ‐
Judicial administration 19,524 4,929 3,737 ‐ (10,858) ‐
Public safety 234,880 12,220 8,267 8,974 (205,419) ‐
Public works 72,924 8,248 (42) 7,386 (57,332) ‐
Health and welfare 75,909 1,345 35,159 ‐ (39,405) ‐
Education 463,154 ‐ ‐ ‐ (463,154) ‐
Parks, recreational and cultural 34,077 548 522 31 (32,976) ‐
Community development 53,726 18,973 27,229 11,207 3,683 ‐
Interest on long‐term debt 43,086 ‐ ‐ ‐ (43,086) ‐
Total governmental activities 1,035,212 46,853 77,104 29,758 (881,497) ‐
Business‐type activities:
Landfill 15,832 17,556 ‐ 27 ‐ 1,751
Parks and Recreation 19,729 10,904 ‐ ‐ ‐ (8,825)
Innovation Technology Park 60 ‐ ‐ ‐ ‐ (60)
Total business‐type activities 35,621 28,460 ‐ 27 ‐ (7,134)
Total primary government 1,070,833$ 75,313 77,104 29,785 (881,497) (7,134)
Component Units:
School Board 982,546$ 23,725 136,285 113 ‐ ‐
Adult Detention Center 46,030 505 10,332 ‐ ‐ ‐
Convention & Visitors' Bureau 1,253 ‐ ‐ ‐ ‐ ‐
Total component units 1,029,829$ 24,230 146,617 113 ‐ ‐
General revenues:
Taxes:
Real property 551,951$ ‐
Personal Property 85,515 ‐
Local sales 55,169 ‐
Consumers Utility 13,490 ‐
Business, professional and occupational license (BPOL) 22,913 ‐
Recordation 10,277 ‐
Motor vehicle licenses 7,877 ‐
Transient occupancy 3,369 ‐
Short term rental, bank stock, public utility gross receipts 2,973 ‐
Payment from primary government ‐ ‐ Grants and contributions not restricted to specific programs:
Federal revenue 66 ‐
State revenue 75,265 ‐
Local revenue 6,454 ‐
Investment earnings (1,558) (99)
Insurance claims and recoveries 100 ‐
Miscellaneous 37,530 816
Transfers (376) 376
Total general revenues and transfers 871,015 1,093
Change in net position (10,482) (6,041)
Net position‐ beginning of year (as restated) (35,568) 42,705
Net position‐ end of year (46,050)$ 36,664
Program Revenues Net (Expense) Revenue and
Primary
40

Exhibit 2Page 2 of 2
2013
2012
(restated) 2013
2012
(restated) 2013
2012
(restated) Functions / Programs
Primary Government:
Governmental activities:
(32,950) (37,184) ‐ ‐ (32,950) (37,184) General government administration
(10,858) (10,171) ‐ ‐ (10,858) (10,171) Judicial administration
(205,419) (187,432) ‐ ‐ (205,419) (187,432) Public safety
(57,332) (36,381) ‐ ‐ (57,332) (36,381) Public works
(39,405) (36,911) ‐ ‐ (39,405) (36,911) Health and welfare
(463,154) (406,022) ‐ ‐ (463,154) (406,022) Education
(32,976) (29,965) ‐ ‐ (32,976) (29,965) Parks, recreational and cultural
3,683 4,141 ‐ ‐ 3,683 4,141 Community development
(43,086) (43,178) ‐ ‐ (43,086) (43,178) Interest on long‐term debt
(881,497) (783,103) ‐ ‐ (881,497) (783,103) Total governmental activities
Business‐type activities:
1,751 536 ‐ ‐ 1,751 536 Landfill
(8,825) (2,699) ‐ ‐ (8,825) (2,699) Parks and Recreation
(60) 942 ‐ ‐ (60) 942 Innovation Technology Park
(7,134) (1,221) ‐ ‐ (7,134) (1,221) Total business‐type activities
(888,631) (784,324) ‐ ‐ (888,631) (784,324) Total primary government
Component Units:
‐ ‐ (822,423) (787,646) (822,423) (787,646) School Board
‐ ‐ (35,193) (29,056) (35,193) (29,056) Adult Detention Center
‐ ‐ (1,253) (1,183) (1,253) (1,183) Convention & Visitors' Bureau
‐ ‐ (858,869) (817,885) (858,869) (817,885) Total component units
General revenues:
Taxes:
551,951 526,885 ‐ ‐ 551,951 526,885 Real property
85,515 78,338 ‐ ‐ 85,515 78,338 Personal Property
55,169 52,003 ‐ ‐ 55,169 52,003 Local sales
13,490 13,075 ‐ ‐ 13,490 13,075 Consumers Utility
22,913 21,725 ‐ ‐ 22,913 21,725 Business, professional and occupational license (BPOL)
10,277 8,014 ‐ ‐ 10,277 8,014 Recordation
7,877 7,591 ‐ ‐ 7,877 7,591 Motor vehicle licenses
3,369 3,274 ‐ ‐ 3,369 3,274 Transient occupancy
2,973 3,080 ‐ ‐ 2,973 3,080 Short term rental, bank stock, public utility gross receipts
‐ ‐ 556,524 497,540 556,524 497,540 Payment from primary government Grants and contributions not restricted to specific programs:
66 66 2,803 1,379 2,869 1,445 Federal revenue
75,265 75,231 347,674 319,514 422,939 394,745 State revenue
6,454 6,206 3,574 3,385 10,028 9,591 Local revenue
(1,657) 20,735 1,892 3,287 235 24,022 Investment earnings
100 66 ‐ ‐ 100 66 Insurance claims and recoveries
38,346 11,142 3,604 2,758 41,950 13,900 Miscellaneous
‐ ‐ ‐ ‐ ‐ ‐ Transfers
872,108 827,431 916,071 827,863 1,788,179 1,655,294 Total general revenues and transfers
(16,523) 43,107 57,202 9,978 40,679 53,085 Change in net position
7,137 (35,970) 1,295,773 1,285,795 1,302,910 1,249,825 Net position‐ beginning of year (as restated)
(9,386) 7,137 1,352,975 1,295,773 1,343,589 1,302,910 Net position‐ end of year
Changes in Net Position
Total
Component
Units Reporting Entity
TotalGovernment
41
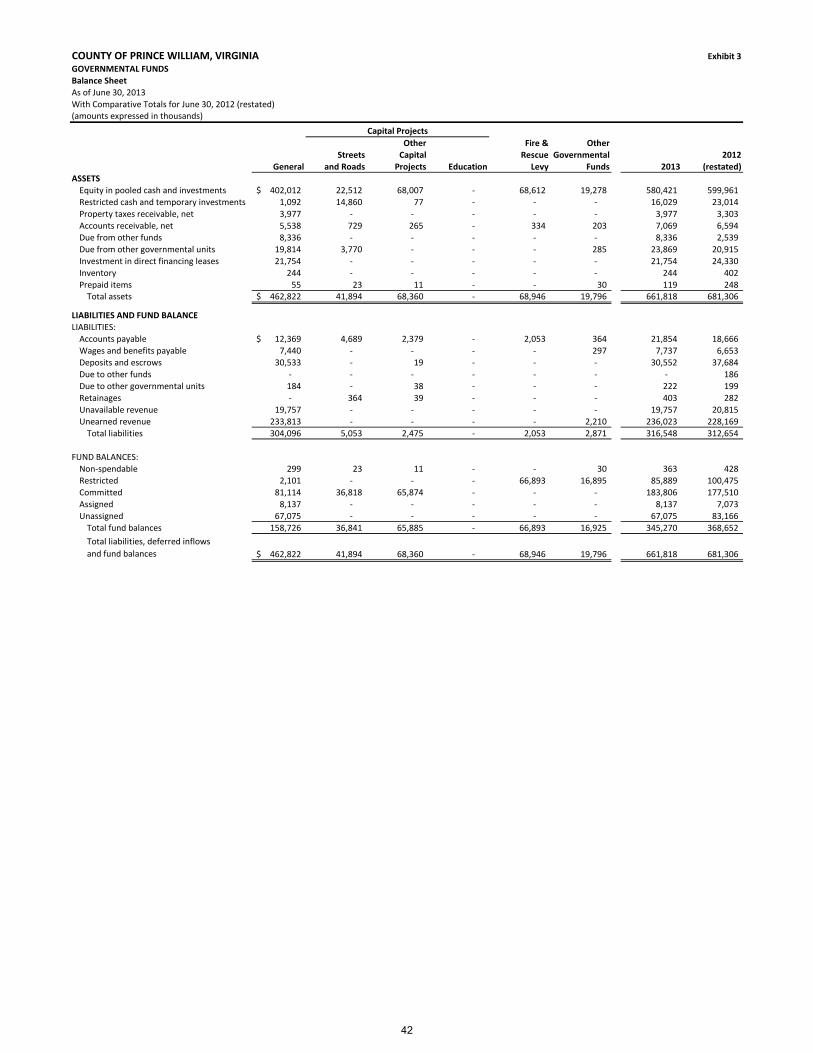
COUNTY OF PRINCE WILLIAM, VIRGINIA Exhibit 3
GOVERNMENTAL FUNDS
Balance Sheet
As of June 30, 2013
With Comparative Totals for June 30, 2012 (restated)(amounts expressed in thousands)
Other Fire & Other
Streets Capital Rescue Governmental 2012
General and Roads Projects Education Levy Funds 2013 (restated)
ASSETS
Equity in pooled cash and investments 402,012$ 22,512 68,007 ‐ 68,612 19,278 580,421 599,961
Restricted cash and temporary investments 1,092 14,860 77 ‐ ‐ ‐ 16,029 23,014
Property taxes receivable, net 3,977 ‐ ‐ ‐ ‐ ‐ 3,977 3,303
Accounts receivable, net 5,538 729 265 ‐ 334 203 7,069 6,594
Due from other funds 8,336 ‐ ‐ ‐ ‐ ‐ 8,336 2,539
Due from other governmental units 19,814 3,770 ‐ ‐ ‐ 285 23,869 20,915
Investment in direct financing leases 21,754 ‐ ‐ ‐ ‐ ‐ 21,754 24,330
Inventory 244 ‐ ‐ ‐ ‐ ‐ 244 402
Prepaid items 55 23 11 ‐ ‐ 30 119 248 Total assets 462,822$ 41,894 68,360 ‐ 68,946 19,796 661,818 681,306
LIABILITIES AND FUND BALANCE
LIABILITIES:
Accounts payable 12,369$ 4,689 2,379 ‐ 2,053 364 21,854 18,666
Wages and benefits payable 7,440 ‐ ‐ ‐ ‐ 297 7,737 6,653
Deposits and escrows 30,533 ‐ 19 ‐ ‐ ‐ 30,552 37,684
Due to other funds ‐ ‐ ‐ ‐ ‐ ‐ ‐ 186
Due to other governmental units 184 ‐ 38 ‐ ‐ ‐ 222 199
Retainages ‐ 364 39 ‐ ‐ ‐ 403 282
Unavailable revenue 19,757 ‐ ‐ ‐ ‐ ‐ 19,757 20,815
Unearned revenue 233,813 ‐ ‐ ‐ ‐ 2,210 236,023 228,169
Total liabilities 304,096 5,053 2,475 ‐ 2,053 2,871 316,548 312,654
FUND BALANCES:
Non‐spendable 299 23 11 ‐ ‐ 30 363 428
Restricted 2,101 ‐ ‐ ‐ 66,893 16,895 85,889 100,475
Committed 81,114 36,818 65,874 ‐ ‐ ‐ 183,806 177,510
Assigned 8,137 ‐ ‐ ‐ ‐ ‐ 8,137 7,073
Unassigned 67,075 ‐ ‐ ‐ ‐ ‐ 67,075 83,166
Total fund balances 158,726 36,841 65,885 ‐ 66,893 16,925 345,270 368,652
Total liabilities, deferred inflows
and fund balances 462,822$ 41,894 68,360 ‐ 68,946 19,796 661,818 681,306
Capital Projects
42
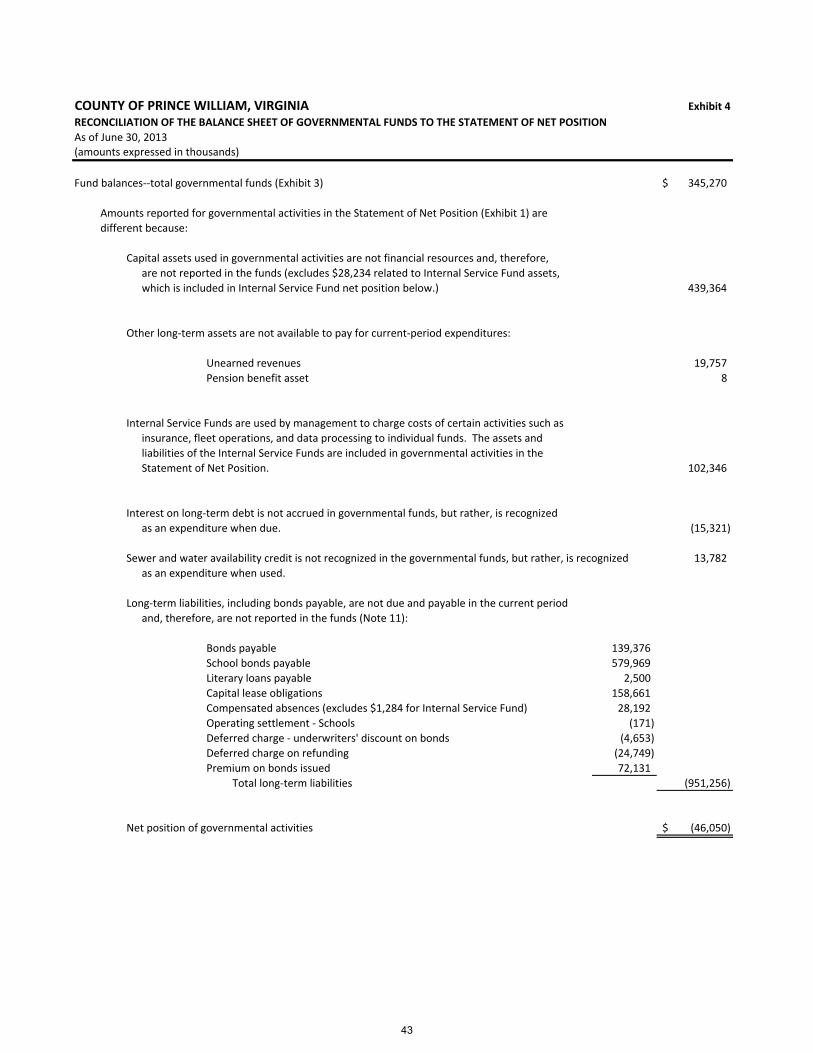
COUNTY OF PRINCE WILLIAM, VIRGINIA Exhibit 4
RECONCILIATION OF THE BALANCE SHEET OF GOVERNMENTAL FUNDS TO THE STATEMENT OF NET POSITION
As of June 30, 2013(amounts expressed in thousands)
Fund balances‐‐total governmental funds (Exhibit 3) 345,270$
Amounts reported for governmental activities in the Statement of Net Position (Exhibit 1) are
different because:
Capital assets used in governmental activities are not financial resources and, therefore,
are not reported in the funds (excludes $28,234 related to Internal Service Fund assets,
which is included in Internal Service Fund net position below.) 439,364
Other long‐term assets are not available to pay for current‐period expenditures:
Unearned revenues 19,757
Pension benefit asset 8
Internal Service Funds are used by management to charge costs of certain activities such as
insurance, fleet operations, and data processing to individual funds. The assets and
liabilities of the Internal Service Funds are included in governmental activities in the
Statement of Net Position. 102,346
Interest on long‐term debt is not accrued in governmental funds, but rather, is recognized
as an expenditure when due. (15,321)
Sewer and water availability credit is not recognized in the governmental funds, but rather, is recognized 13,782
as an expenditure when used.
Long‐term liabilities, including bonds payable, are not due and payable in the current period
and, therefore, are not reported in the funds (Note 11):
Bonds payable 139,376
School bonds payable 579,969
Literary loans payable 2,500
Capital lease obligations 158,661
Compensated absences (excludes $1,284 for Internal Service Fund) 28,192
Operating settlement ‐ Schools (171)
Deferred charge ‐ underwriters' discount on bonds (4,653)
Deferred charge on refunding (24,749)
Premium on bonds issued 72,131
Total long‐term liabilities (951,256)
Net position of governmental activities (46,050)$
43

COUNTY OF PRINCE WILLIAM, VIRGINIA Exhibit 5
GOVERNMENTAL FUNDS
Statement of Revenues, Expenditures and Changes in Fund Balances
For the Year Ended June 30, 2013
With Comparative Totals for the Year Ended June 30, 2012 (restated)
(amounts expressed in thousands)
Other
General
Streets and
Roads
Other Capital
Projects Education
Fire &
Rescue Levy
Governmental
Funds 2013
2012
(restated)
REVENUES:
General property taxes $ 600,658 ‐ ‐ ‐ 32,314 3,817 636,789 605,896
Other local taxes 116,068 ‐ ‐ ‐ ‐ ‐ 116,068 108,762
Permits, privilege fees and regulatory licenses 2,180 ‐ ‐ ‐ ‐ 14,174 16,354 13,836
Fines and forfeitures 3,259 ‐ ‐ ‐ ‐ 1 3,260 3,435
From use of money and property (5,200) 51 (680) ‐ (526) (67) (6,422) 13,993
Charges for services 15,407 ‐ ‐ ‐ ‐ 11,833 27,240 22,688
Intergovernmental revenues: ‐
Federal 18,297 4,366 59 ‐ ‐ 26,922 49,644 50,986
State 115,964 2,435 96 ‐ ‐ 12 118,507 122,949
Local 6,454 430 ‐ ‐ ‐ ‐ 6,884 6,661
Donations and contributions ‐ ‐ 20 ‐ ‐ ‐ 20 142
Miscellaneous 21,251 1,616 3,982 ‐ 95 340 27,284 10,206
Total revenues 894,338 8,898 3,477 ‐ 31,883 57,032 995,628 959,554
EXPENDITURES:
Current:
General government administration 36,788 ‐ ‐ ‐ ‐ ‐ 36,788 38,897
Judicial administration 18,388 ‐ ‐ ‐ ‐ ‐ 18,388 17,593
Public safety 195,937 ‐ ‐ ‐ 22,812 10,020 228,769 210,461
Public works 30,278 ‐ ‐ ‐ ‐ 244 30,522 30,408
Health and welfare 75,066 ‐ ‐ ‐ ‐ ‐ 75,066 75,014
Education 385,176 ‐ 500 77,976 ‐ ‐ 463,652 416,071
Parks, recreational and cultural 26,550 ‐ ‐ ‐ ‐ ‐ 26,550 24,096
Community development 6,330 ‐ ‐ ‐ ‐ 42,225 48,555 47,280
Debt service:
Principal retirement 69,766 ‐ ‐ ‐ 92 ‐ 69,858 74,760
Interest and other debt costs 41,970 ‐ ‐ ‐ 21 ‐ 41,991 42,803
Capital outlays ‐ 42,080 11,346 ‐ ‐ ‐ 53,426 38,110
Total expenditures 886,249 42,080 11,846 77,976 22,925 52,489 1,093,565 1,015,493
Excess (deficiency) of revenues over
(under) expenditures 8,089 (33,182) (8,369) (77,976) 8,958 4,543 (97,937) (55,939)
OTHER FINANCING SOURCES (USES):
Transfers in 21,607 13,683 16,709 ‐ 1,859 4,655 58,513 67,310
Transfers out (42,028) (79) (6,923) ‐ (6,155) (7,640) (62,825) (99,988)
Bonds, notes and capital leases ‐ ‐ ‐ 65,675 ‐ ‐ 65,675 46,445
Proceeds from refundings 46,180 ‐ ‐ ‐ ‐ ‐ 46,180 51,585
Premium on sale of bonds ‐ ‐ ‐ 12,301 ‐ ‐ 12,301 2,236
Premium on refundings 9,048 ‐ ‐ ‐ ‐ ‐ 9,048 9,690
Payments to escrow agent (54,689) ‐ ‐ ‐ ‐ ‐ (54,689) (60,921)
Insurance claims and recoveries 100 ‐ ‐ ‐ ‐ ‐ 100 66
Sale of surplus property 222 ‐ ‐ ‐ 19 11 252 298
Total other financing sources (uses) (19,560) 13,604 9,786 77,976 (4,277) (2,974) 74,555 16,721
Net change in fund balances (11,471) (19,578) 1,417 ‐ 4,681 1,569 (23,382) (39,218)
FUND BALANCE, beginning of year (as restated) 170,197 56,419 64,468 ‐ 62,212 15,356 368,652 407,870
FUND BALANCE, end of year $ 158,726 36,841 65,885 ‐ 66,893 16,925 345,270 368,652
Governmental Funds
Total
Capital Projects
44
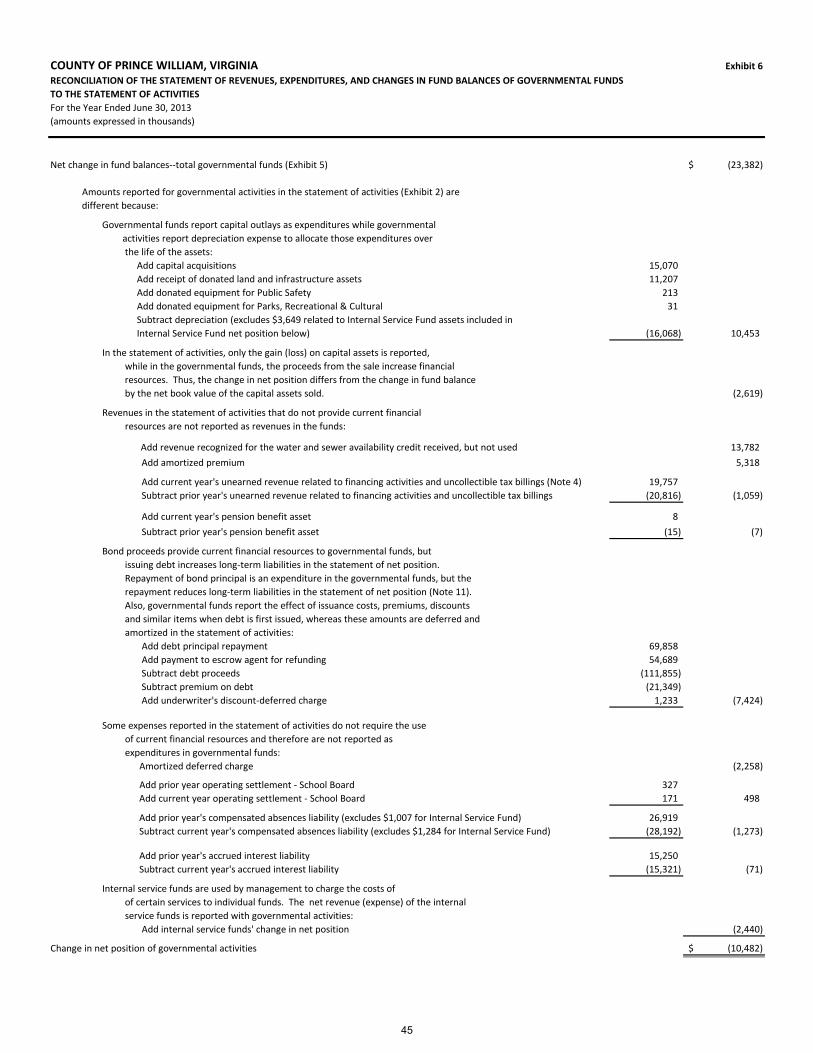
COUNTY OF PRINCE WILLIAM, VIRGINIA Exhibit 6
RECONCILIATION OF THE STATEMENT OF REVENUES, EXPENDITURES, AND CHANGES IN FUND BALANCES OF GOVERNMENTAL FUNDS
TO THE STATEMENT OF ACTIVITIES
For the Year Ended June 30, 2013
(amounts expressed in thousands)
Net change in fund balances‐‐total governmental funds (Exhibit 5) (23,382)$
Amounts reported for governmental activities in the statement of activities (Exhibit 2) are
different because:
Governmental funds report capital outlays as expenditures while governmental
activities report depreciation expense to allocate those expenditures over
the life of the assets:
Add capital acquisitions 15,070
Add receipt of donated land and infrastructure assets 11,207
Add donated equipment for Public Safety 213
Add donated equipment for Parks, Recreational & Cultural 31
Subtract depreciation (excludes $3,649 related to Internal Service Fund assets included in
Internal Service Fund net position below) (16,068) 10,453
In the statement of activities, only the gain (loss) on capital assets is reported,
while in the governmental funds, the proceeds from the sale increase financial
resources. Thus, the change in net position differs from the change in fund balance
by the net book value of the capital assets sold. (2,619)
Revenues in the statement of activities that do not provide current financial
resources are not reported as revenues in the funds:
Add revenue recognized for the water and sewer availability credit received, but not used 13,782
Add amortized premium 5,318
Add current year's unearned revenue related to financing activities and uncollectible tax billings (Note 4) 19,757
Subtract prior year's unearned revenue related to financing activities and uncollectible tax billings (20,816) (1,059)
Add current year's pension benefit asset 8
Subtract prior year's pension benefit asset (15) (7)
Bond proceeds provide current financial resources to governmental funds, but
issuing debt increases long‐term liabilities in the statement of net position.
Repayment of bond principal is an expenditure in the governmental funds, but the
repayment reduces long‐term liabilities in the statement of net position (Note 11).
Also, governmental funds report the effect of issuance costs, premiums, discounts
and similar items when debt is first issued, whereas these amounts are deferred and
amortized in the statement of activities:
Add debt principal repayment 69,858
Add payment to escrow agent for refunding 54,689
Subtract debt proceeds (111,855)
Subtract premium on debt (21,349)
Add underwriter's discount‐deferred charge 1,233 (7,424)
Some expenses reported in the statement of activities do not require the use
of current financial resources and therefore are not reported as
expenditures in governmental funds:
Amortized deferred charge (2,258)
Add prior year operating settlement ‐ School Board 327
Add current year operating settlement ‐ School Board 171 498
Add prior year's compensated absences liability (excludes $1,007 for Internal Service Fund) 26,919
Subtract current year's compensated absences liability (excludes $1,284 for Internal Service Fund) (28,192) (1,273)
Add prior year's accrued interest liability 15,250
Subtract current year's accrued interest liability (15,321) (71)
Internal service funds are used by management to charge the costs of
of certain services to individual funds. The net revenue (expense) of the internal
service funds is reported with governmental activities:
Add internal service funds' change in net position (2,440)
Change in net position of governmental activities (10,482)$
45
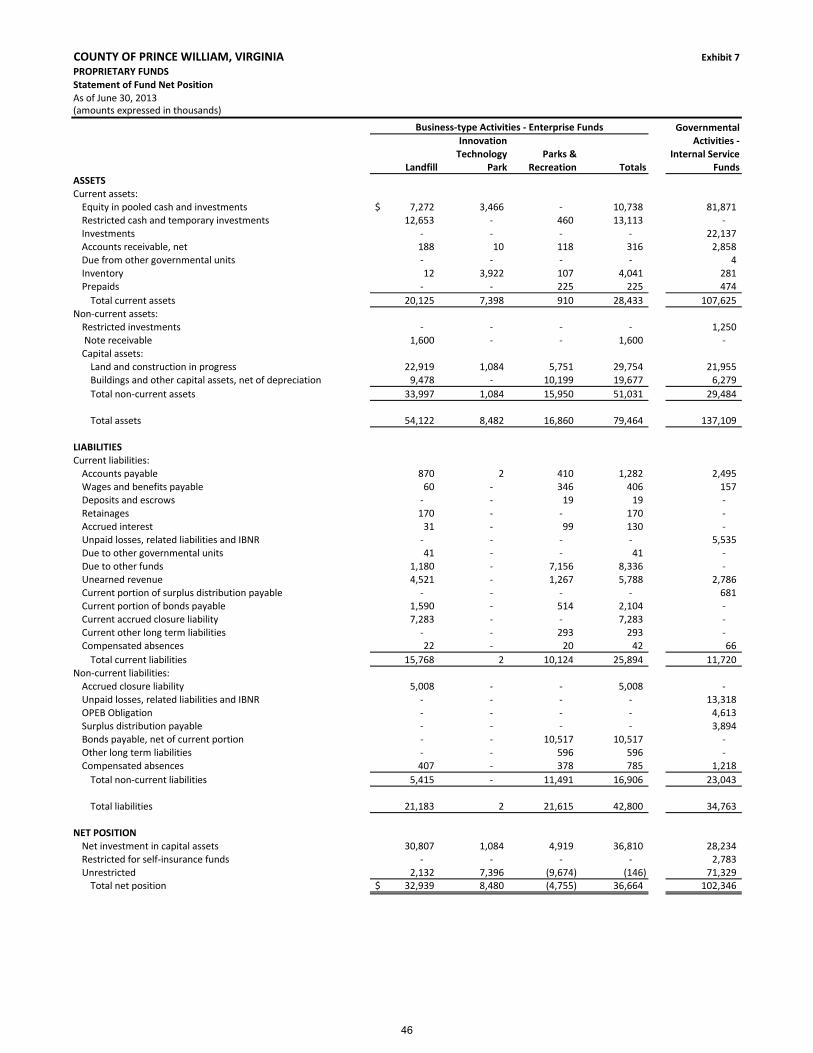
COUNTY OF PRINCE WILLIAM, VIRGINIA Exhibit 7
PROPRIETARY FUNDSStatement of Fund Net PositionAs of June 30, 2013(amounts expressed in thousands)
GovernmentalInnovation Activities ‐Technology Parks & Internal Service
Landfill Park Recreation Totals FundsASSETSCurrent assets:Equity in pooled cash and investments 7,272$ 3,466 ‐ 10,738 81,871 Restricted cash and temporary investments 12,653 ‐ 460 13,113 ‐ Investments ‐ ‐ ‐ ‐ 22,137 Accounts receivable, net 188 10 118 316 2,858 Due from other governmental units ‐ ‐ ‐ ‐ 4 Inventory 12 3,922 107 4,041 281 Prepaids ‐ ‐ 225 225 474
Total current assets 20,125 7,398 910 28,433 107,625 Non‐current assets:Restricted investments ‐ ‐ ‐ ‐ 1,250 Note receivable 1,600 ‐ ‐ 1,600 ‐ Capital assets:Land and construction in progress 22,919 1,084 5,751 29,754 21,955 Buildings and other capital assets, net of depreciation 9,478 ‐ 10,199 19,677 6,279
Total non‐current assets 33,997 1,084 15,950 51,031 29,484
Total assets 54,122 8,482 16,860 79,464 137,109
LIABILITIESCurrent liabilities:Accounts payable 870 2 410 1,282 2,495 Wages and benefits payable 60 ‐ 346 406 157 Deposits and escrows ‐ ‐ 19 19 ‐ Retainages 170 ‐ ‐ 170 ‐ Accrued interest 31 ‐ 99 130 ‐ Unpaid losses, related liabilities and IBNR ‐ ‐ ‐ ‐ 5,535 Due to other governmental units 41 ‐ ‐ 41 ‐ Due to other funds 1,180 ‐ 7,156 8,336 ‐ Unearned revenue 4,521 ‐ 1,267 5,788 2,786 Current portion of surplus distribution payable ‐ ‐ ‐ ‐ 681 Current portion of bonds payable 1,590 ‐ 514 2,104 ‐ Current accrued closure liability 7,283 ‐ ‐ 7,283 ‐ Current other long term liabilities ‐ ‐ 293 293 ‐ Compensated absences 22 ‐ 20 42 66
Total current liabilities 15,768 2 10,124 25,894 11,720 Non‐current liabilities:Accrued closure liability 5,008 ‐ ‐ 5,008 ‐ Unpaid losses, related liabilities and IBNR ‐ ‐ ‐ ‐ 13,318 OPEB Obligation ‐ ‐ ‐ ‐ 4,613 Surplus distribution payable ‐ ‐ ‐ ‐ 3,894 Bonds payable, net of current portion ‐ ‐ 10,517 10,517 ‐ Other long term liabilities ‐ ‐ 596 596 ‐ Compensated absences 407 ‐ 378 785 1,218
Total non‐current liabilities 5,415 ‐ 11,491 16,906 23,043
Total liabilities 21,183 2 21,615 42,800 34,763
NET POSITIONNet investment in capital assets 30,807 1,084 4,919 36,810 28,234 Restricted for self‐insurance funds ‐ ‐ ‐ ‐ 2,783 Unrestricted 2,132 7,396 (9,674) (146) 71,329 Total net position 32,939$ 8,480 (4,755) 36,664 102,346
Business‐type Activities ‐ Enterprise Funds
46
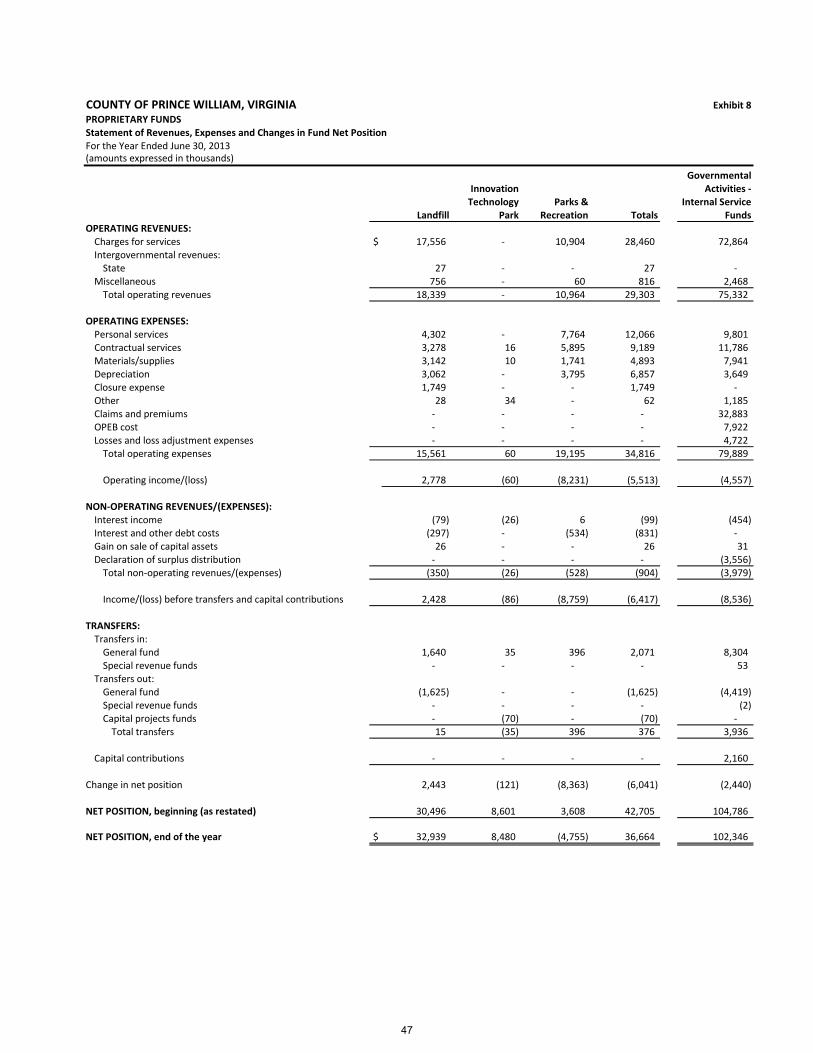
COUNTY OF PRINCE WILLIAM, VIRGINIA Exhibit 8
PROPRIETARY FUNDSStatement of Revenues, Expenses and Changes in Fund Net PositionFor the Year Ended June 30, 2013(amounts expressed in thousands)
GovernmentalInnovation Activities ‐Technology Parks & Internal Service
Landfill Park Recreation Totals FundsOPERATING REVENUES:Charges for services $ 17,556 ‐ 10,904 28,460 72,864 Intergovernmental revenues:State 27 ‐ ‐ 27 ‐
Miscellaneous 756 ‐ 60 816 2,468 Total operating revenues 18,339 ‐ 10,964 29,303 75,332
OPERATING EXPENSES:Personal services 4,302 ‐ 7,764 12,066 9,801 Contractual services 3,278 16 5,895 9,189 11,786 Materials/supplies 3,142 10 1,741 4,893 7,941 Depreciation 3,062 ‐ 3,795 6,857 3,649 Closure expense 1,749 ‐ ‐ 1,749 ‐ Other 28 34 ‐ 62 1,185 Claims and premiums ‐ ‐ ‐ ‐ 32,883 OPEB cost ‐ ‐ ‐ ‐ 7,922 Losses and loss adjustment expenses ‐ ‐ ‐ ‐ 4,722 Total operating expenses 15,561 60 19,195 34,816 79,889
Operating income/(loss) 2,778 (60) (8,231) (5,513) (4,557)
NON‐OPERATING REVENUES/(EXPENSES):Interest income (79) (26) 6 (99) (454) Interest and other debt costs (297) ‐ (534) (831) ‐ Gain on sale of capital assets 26 ‐ ‐ 26 31 Declaration of surplus distribution ‐ ‐ ‐ ‐ (3,556) Total non‐operating revenues/(expenses) (350) (26) (528) (904) (3,979)
Income/(loss) before transfers and capital contributions 2,428 (86) (8,759) (6,417) (8,536)
TRANSFERS:Transfers in:General fund 1,640 35 396 2,071 8,304 Special revenue funds ‐ ‐ ‐ ‐ 53
Transfers out:General fund (1,625) ‐ ‐ (1,625) (4,419) Special revenue funds ‐ ‐ ‐ ‐ (2) Capital projects funds ‐ (70) ‐ (70) ‐ Total transfers 15 (35) 396 376 3,936
Capital contributions ‐ ‐ ‐ ‐ 2,160
Change in net position 2,443 (121) (8,363) (6,041) (2,440)
NET POSITION, beginning (as restated) 30,496 8,601 3,608 42,705 104,786
NET POSITION, end of the year $ 32,939 8,480 (4,755) 36,664 102,346
47
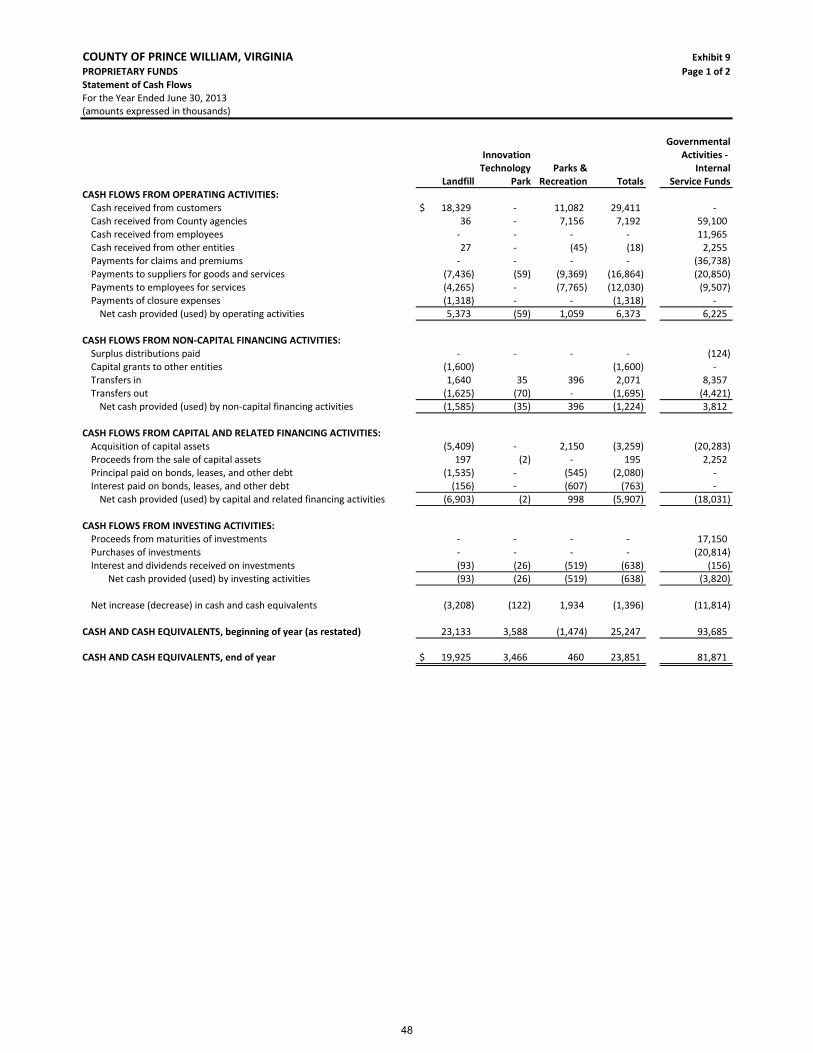
COUNTY OF PRINCE WILLIAM, VIRGINIA Exhibit 9
PROPRIETARY FUNDS Page 1 of 2Statement of Cash FlowsFor the Year Ended June 30, 2013(amounts expressed in thousands)
GovernmentalInnovation Activities ‐ Technology Parks & Internal
Landfill Park Recreation Totals Service FundsCASH FLOWS FROM OPERATING ACTIVITIES:Cash received from customers $ 18,329 ‐ 11,082 29,411 ‐Cash received from County agencies 36 ‐ 7,156 7,192 59,100 Cash received from employees ‐ ‐ ‐ ‐ 11,965 Cash received from other entities 27 ‐ (45) (18) 2,255 Payments for claims and premiums ‐ ‐ ‐ ‐ (36,738) Payments to suppliers for goods and services (7,436) (59) (9,369) (16,864) (20,850) Payments to employees for services (4,265) ‐ (7,765) (12,030) (9,507) Payments of closure expenses (1,318) ‐ ‐ (1,318) ‐Net cash provided (used) by operating activities 5,373 (59) 1,059 6,373 6,225
CASH FLOWS FROM NON‐CAPITAL FINANCING ACTIVITIES:Surplus distributions paid ‐ ‐ ‐ ‐ (124) Capital grants to other entities (1,600) (1,600) ‐Transfers in 1,640 35 396 2,071 8,357 Transfers out (1,625) (70) ‐ (1,695) (4,421) Net cash provided (used) by non‐capital financing activities (1,585) (35) 396 (1,224) 3,812
CASH FLOWS FROM CAPITAL AND RELATED FINANCING ACTIVITIES:Acquisition of capital assets (5,409) ‐ 2,150 (3,259) (20,283) Proceeds from the sale of capital assets 197 (2) ‐ 195 2,252 Principal paid on bonds, leases, and other debt (1,535) ‐ (545) (2,080) ‐Interest paid on bonds, leases, and other debt (156) ‐ (607) (763) ‐Net cash provided (used) by capital and related financing activities (6,903) (2) 998 (5,907) (18,031)
CASH FLOWS FROM INVESTING ACTIVITIES:Proceeds from maturities of investments ‐ ‐ ‐ ‐ 17,150 Purchases of investments ‐ ‐ ‐ ‐ (20,814) Interest and dividends received on investments (93) (26) (519) (638) (156)
Net cash provided (used) by investing activities (93) (26) (519) (638) (3,820)
Net increase (decrease) in cash and cash equivalents (3,208) (122) 1,934 (1,396) (11,814)
CASH AND CASH EQUIVALENTS, beginning of year (as restated) 23,133 3,588 (1,474) 25,247 93,685
CASH AND CASH EQUIVALENTS, end of year $ 19,925 3,466 460 23,851 81,871
48

COUNTY OF PRINCE WILLIAM, VIRGINIA Exhibit 9
PROPRIETARY FUNDS Page 2 of 2Statement of Cash FlowsFor the Year Ended June 30, 2013(amounts expressed in thousands)
GovernmentalInnovation Activities ‐ Technology Parks & Internal
Landfill Park Recreation Totals Service FundsRECONCILIATION OF OPERATING INCOME/(LOSS) TO NET CASH PROVIDED(USED) BY OPERATING ACTIVITIES:
Operating income/(loss) $ 2,778 (60) (8,231) (5,513) (4,557)
Adjustments to reconcile operating income/(loss) to net cash provided (used)by operating activities:Depreciation 3,062 ‐ 3,795 6,857 3,649 Change in assets and liabilities:(Increase) decrease in:Accounts receivable, net of accrued interest (47) ‐ (32) (79) 127 Due from other governmental units ‐ ‐ ‐ ‐ (2) Due from other funds ‐ ‐ ‐ ‐ 161 Inventory (1) ‐ (40) (41) (10) Prepaid items ‐ ‐ 9 9 (61)
Increase (decrease) in:Accounts payable and accrued liabilities, net of accrued interest 1,208 1 (1,745) (536) 795 Retainages (374) ‐ ‐ (374) ‐ Unpaid losses and related expenses ‐ ‐ ‐ ‐ 5,965 Accrued closure liability (1,318) ‐ ‐ (1,318) ‐ Due to other governmental units (35) ‐ ‐ (35) ‐ Unearned revenue 100 ‐ 147 247 200 Due to related parties ‐ ‐ ‐ ‐ (42)
Total adjustments 2,595 1 9,290 11,886 10,782
Net cash provided (used) by operating activities $ 5,373 (59) 1,059 6,373 6,225
NON‐CASH CAPITAL AND FINANCING ACTIVITIES:Capital contributions $ ‐ ‐ ‐ ‐ 2,160 Total non‐cash capital and financing activities $ ‐ ‐ ‐ ‐ 2,160
49
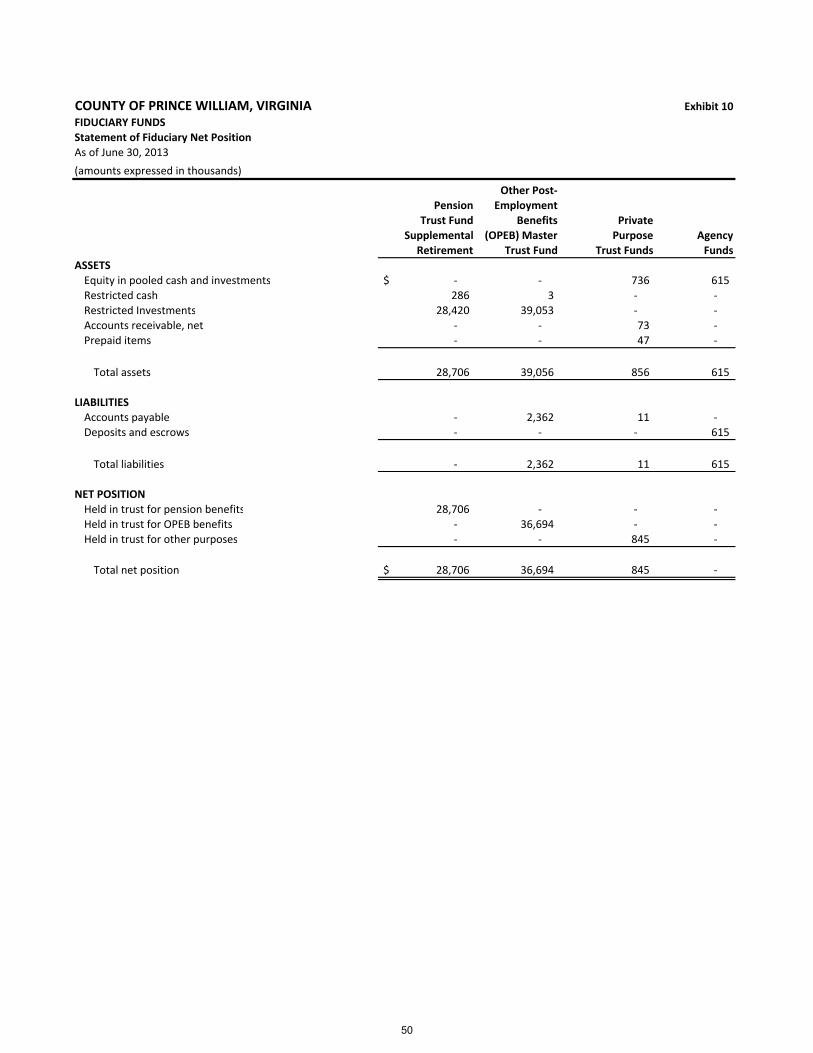
COUNTY OF PRINCE WILLIAM, VIRGINIA Exhibit 10
FIDUCIARY FUNDS
Statement of Fiduciary Net Position
As of June 30, 2013
(amounts expressed in thousands)
Other Post‐
Pension Employment
Trust Fund Benefits Private
Supplemental (OPEB) Master Purpose Agency
Retirement Trust Fund Trust Funds Funds
ASSETS
Equity in pooled cash and investments $ ‐ ‐ 736 615
Restricted cash 286 3 ‐ ‐
Restricted Investments 28,420 39,053 ‐ ‐
Accounts receivable, net ‐ ‐ 73 ‐
Prepaid items ‐ ‐ 47 ‐
Total assets 28,706 39,056 856 615
LIABILITIES
Accounts payable ‐ 2,362 11 ‐
Deposits and escrows ‐ ‐ ‐ 615
Total liabilities ‐ 2,362 11 615
NET POSITION
Held in trust for pension benefits 28,706 ‐ ‐ ‐
Held in trust for OPEB benefits ‐ 36,694 ‐ ‐
Held in trust for other purposes ‐ ‐ 845 ‐
Total net position $ 28,706 36,694 845 ‐
50
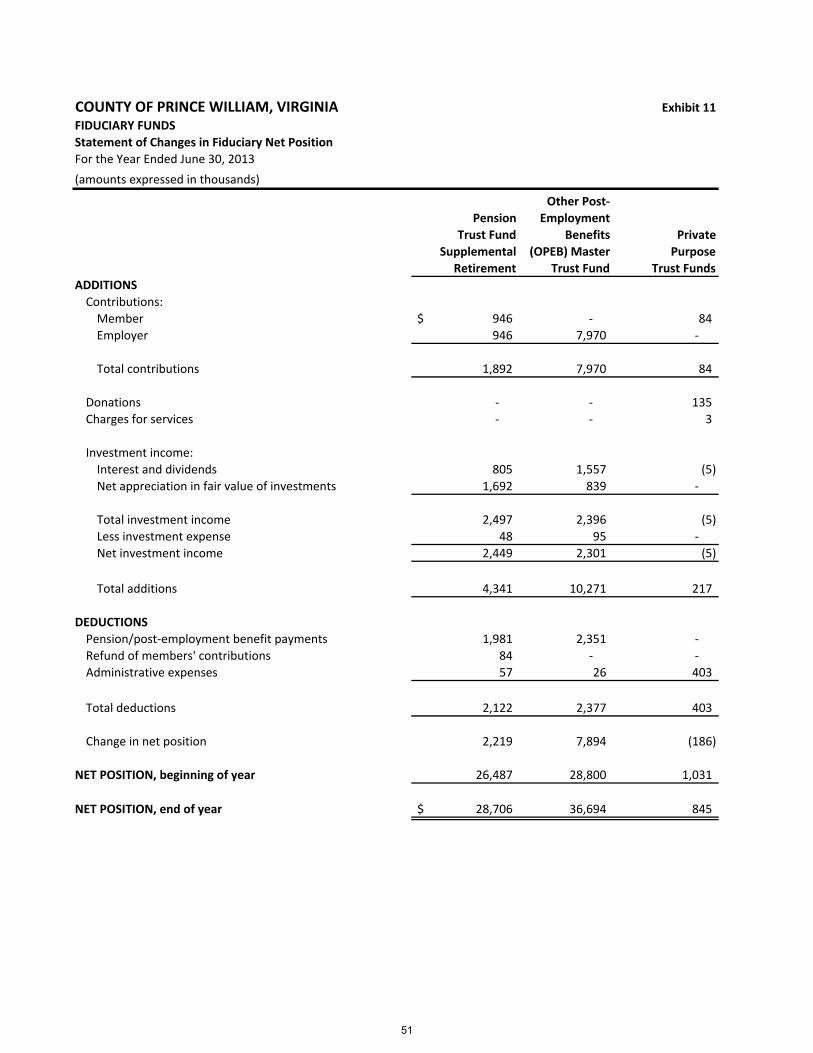
COUNTY OF PRINCE WILLIAM, VIRGINIA Exhibit 11
FIDUCIARY FUNDS
Statement of Changes in Fiduciary Net Position
For the Year Ended June 30, 2013
(amounts expressed in thousands)
Other Post‐
Pension Employment
Trust Fund Benefits Private
Supplemental (OPEB) Master Purpose
Retirement Trust Fund Trust Funds
ADDITIONS
Contributions:
Member $ 946 ‐ 84
Employer 946 7,970 ‐
Total contributions 1,892 7,970 84
Donations ‐ ‐ 135
Charges for services ‐ ‐ 3
Investment income:
Interest and dividends 805 1,557 (5)
Net appreciation in fair value of investments 1,692 839 ‐
Total investment income 2,497 2,396 (5)
Less investment expense 48 95 ‐
Net investment income 2,449 2,301 (5)
Total additions 4,341 10,271 217
DEDUCTIONS
Pension/post‐employment benefit payments 1,981 2,351 ‐
Refund of members' contributions 84 ‐ ‐
Administrative expenses 57 26 403
Total deductions 2,122 2,377 403
Change in net position 2,219 7,894 (186)
NET POSITION, beginning of year 26,487 28,800 1,031
NET POSITION, end of year $ 28,706 36,694 845
51
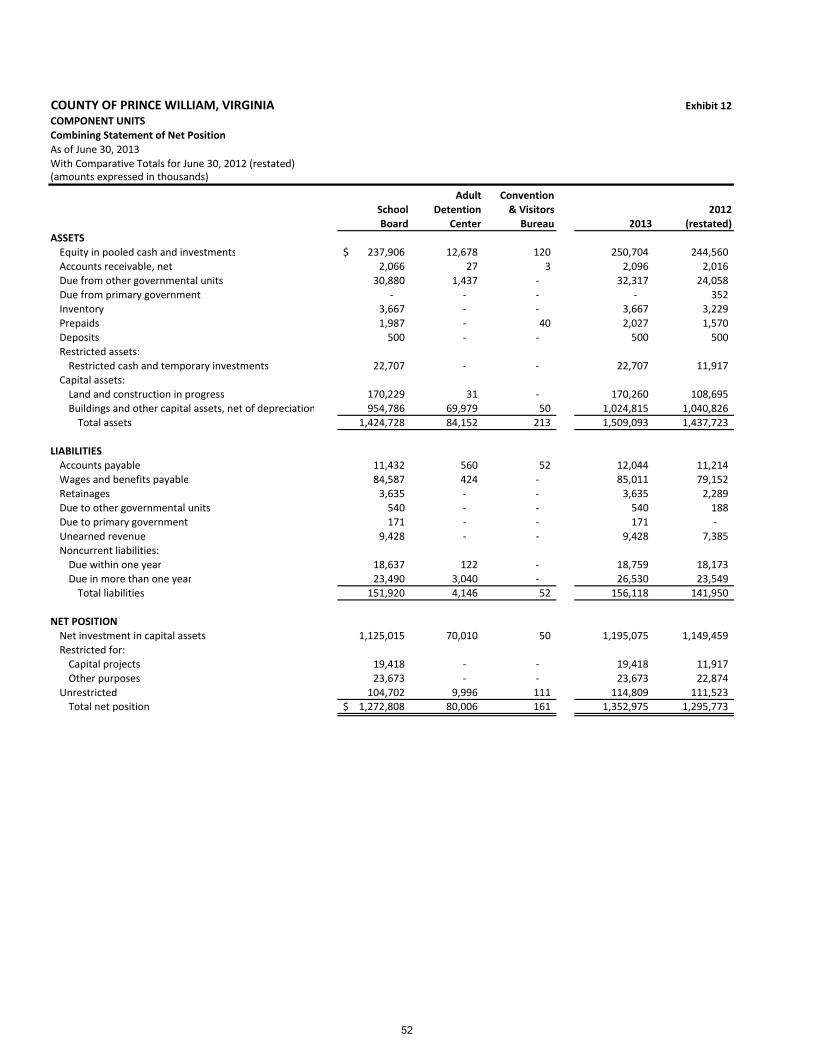
COUNTY OF PRINCE WILLIAM, VIRGINIA Exhibit 12
COMPONENT UNITS
Combining Statement of Net Position
As of June 30, 2013
With Comparative Totals for June 30, 2012 (restated)(amounts expressed in thousands)
Adult Convention
School Detention & Visitors 2012
Board Center Bureau 2013 (restated)
ASSETS
Equity in pooled cash and investments 237,906$ 12,678 120 250,704 244,560
Accounts receivable, net 2,066 27 3 2,096 2,016
Due from other governmental units 30,880 1,437 ‐ 32,317 24,058
Due from primary government ‐ ‐ ‐ ‐ 352
Inventory 3,667 ‐ ‐ 3,667 3,229
Prepaids 1,987 ‐ 40 2,027 1,570
Deposits 500 ‐ ‐ 500 500
Restricted assets:
Restricted cash and temporary investments 22,707 ‐ ‐ 22,707 11,917
Capital assets:
Land and construction in progress 170,229 31 ‐ 170,260 108,695
Buildings and other capital assets, net of depreciation 954,786 69,979 50 1,024,815 1,040,826
Total assets 1,424,728 84,152 213 1,509,093 1,437,723
LIABILITIES
Accounts payable 11,432 560 52 12,044 11,214
Wages and benefits payable 84,587 424 ‐ 85,011 79,152
Retainages 3,635 ‐ ‐ 3,635 2,289
Due to other governmental units 540 ‐ ‐ 540 188
Due to primary government 171 ‐ ‐ 171 ‐
Unearned revenue 9,428 ‐ ‐ 9,428 7,385
Noncurrent liabilities:
Due within one year 18,637 122 ‐ 18,759 18,173
Due in more than one year 23,490 3,040 ‐ 26,530 23,549
Total liabilities 151,920 4,146 52 156,118 141,950
NET POSITION
Net investment in capital assets 1,125,015 70,010 50 1,195,075 1,149,459
Restricted for:
Capital projects 19,418 ‐ ‐ 19,418 11,917
Other purposes 23,673 ‐ ‐ 23,673 22,874
Unrestricted 104,702 9,996 111 114,809 111,523 Total net position 1,272,808$ 80,006 161 1,352,975 1,295,773
52

53

COUNTY OF PRINCE WILLIAM, VIRGINIA Exhibit 13
COMPONENT UNITS Page 1 of 2Combining Statement of ActivitiesFor the Year Ended June 30, 2013With Comparative Totals for the Year Ended June 30, 2012 (restated)
(amounts expressed in thousands)
Net (Expense)
Operating Capital
Functions / Programs Expenses
Charges for
Services
Grants and
Contributions
Grants and
Contributions
School
Board
School Board
Instruction 653,641$ 3,498 113,946 113 (536,084)
Support Services 328,311 19,802 22,339 ‐ (286,170)
School Age Child Care 594 425 ‐ ‐ (169)
Adult Detention Center 46,030 505 10,332 ‐ ‐
Convention & Visitors Bureau 1,253 ‐ ‐ ‐ ‐
Total component units 1,029,829$ 24,230 146,617 113 (822,423)
General revenues:
Payment from primary government 532,717$
Federal revenue 2,803
State revenue 347,674
Local revenue ‐
Investment earnings 1,719
Miscellaneous 3,480
Total general revenues 888,393
Change in net position 65,970
1,206,838
Net position ‐ end of year 1,272,808$
Net position ‐ beginning of year (as
restated)
Program Revenues
54
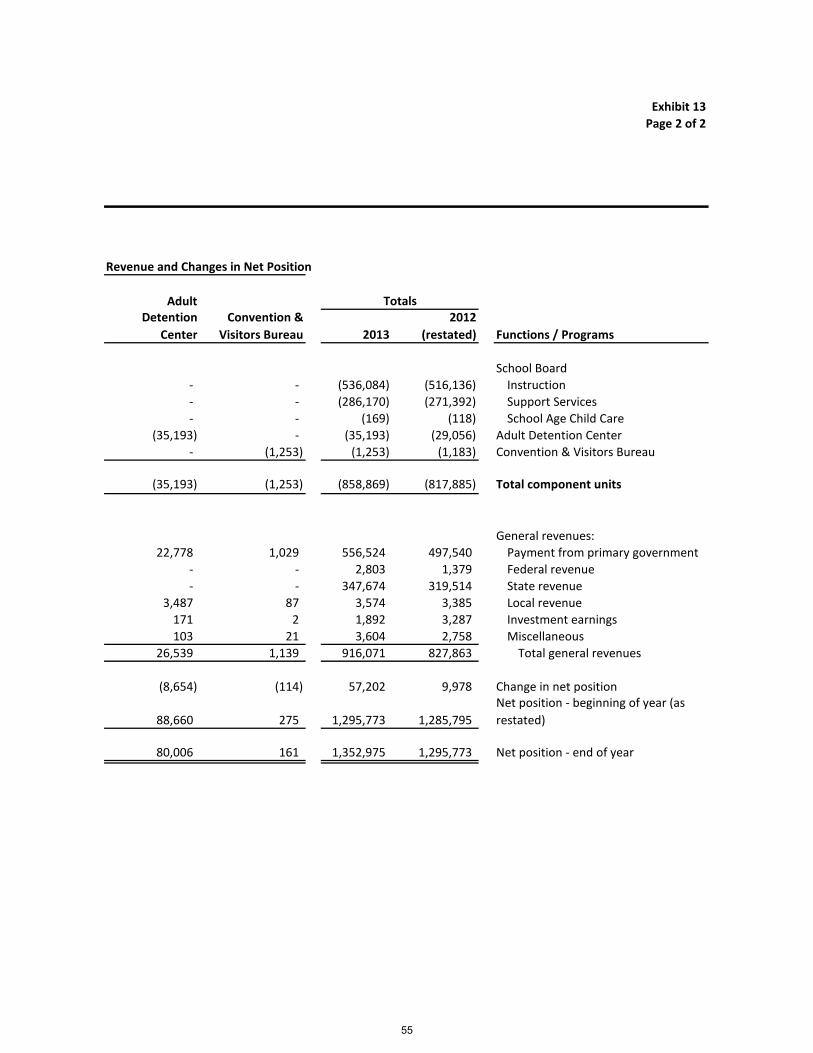
Exhibit 13
Page 2 of 2
Revenue and Changes in Net Position
AdultDetention
Center
Convention &
Visitors Bureau 2013
2012
(restated) Functions / Programs
School Board
‐ ‐ (536,084) (516,136) Instruction
‐ ‐ (286,170) (271,392) Support Services
‐ ‐ (169) (118) School Age Child Care
(35,193) ‐ (35,193) (29,056) Adult Detention Center
‐ (1,253) (1,253) (1,183) Convention & Visitors Bureau
(35,193) (1,253) (858,869) (817,885) Total component units
General revenues:
22,778 1,029 556,524 497,540 Payment from primary government
‐ ‐ 2,803 1,379 Federal revenue
‐ ‐ 347,674 319,514 State revenue
3,487 87 3,574 3,385 Local revenue
171 2 1,892 3,287 Investment earnings
103 21 3,604 2,758 Miscellaneous
26,539 1,139 916,071 827,863 Total general revenues
(8,654) (114) 57,202 9,978 Change in net position
88,660 275 1,295,773 1,285,795
Net position ‐ beginning of year (as
restated)
80,006 161 1,352,975 1,295,773 Net position ‐ end of year
Totals
55

56

NOTES TO FINANCIAL STATEMENTS JUNE 30, 2013 (amounts expressed in thousands)
NOTE (1) ‐ SUMMARY OF SIGNIFICANT ACCOUNTING POLICIES The County of Prince William, Virginia (the County) prepares its financial statements in conformity with accounting principles generally accepted in the United States (GAAP), as applied to governmental units. The Governmental Accounting Standards Board (GASB) is the standard‐setting body for governmental accounting and financial reporting. The GASB periodically updates its codification of the existing governmental accounting and financial reporting standards which, along with subsequent GASB pronouncements (statements and interpretations), constitutes GAAP for governmental units. The accounting and reporting framework and significant accounting principles and practices utilized by the County are discussed in subsequent sections of this note. The remainder of the notes is organized to provide explanations, including required disclosures, of the County’s financial activities for the fiscal year ended June 30, 2013. A. Principles Used to Determine the Reporting Entity The County is organized under the County Executive form of government, as provided for by Commonwealth of Virginia (the Commonwealth) law. Under this form of government, the policies concerning the financial and business affairs of the County are determined by the Board of County Supervisors (the Board). The Board is composed of eight elected members who serve four‐year terms. The Board appoints a County Executive who is the government’s chief administrative officer and executes the Board’s policies and programs. The accompanying financial statements include the County’s primary government and component units over which the County exercises significant influence. Significant influence or accountability is based primarily on operational or financial benefit/burden relationships with the County (as distinct from legal relationships). Due to restrictions of the State Constitution relating to the issuance of municipal debt, the County created public trusts to finance County services with revenue bonds or other non‐general obligation financing. Financing services provided by these public trusts are solely for the benefit of the County. Public trusts created to provide financing services are blended into the County’s primary government although retaining separate legal identity. Component units that do not meet the criteria for blending are reported discretely. Illustration 1‐1 illustrates potential component units and the reporting method in the County’s Comprehensive Annual Financial Report (CAFR).
Illustration 1‐1 Potential Component Units
Potential
Component Unit Description of Activities and Relationship to the
County
Inclusion Criteria
Reporting Method Prince William Parkway District
Exercise the powers and duties enumerated in the Code of Virginia related to the transportation improvement district.
Financial benefit/burden relationship exists; Two Boards are relatively the same.
Component Unit Blended in the Special Revenue Funds
Route 234 Bypass District Authorized by the Code of Virginia and
established by Board resolution. Set the appropriate tax rate to fund improvements within the district and act on transportation matters within the district.
Financial benefit/burden relationship exists; Two Boards are relatively the same.
Component Unit Blended in the Special Revenue Funds
Self‐Insurance Group Casualty Pool
Authorized by the Code of Virginia and licensed by the State Corporation Commission. Make available a long‐term, stable source of cost‐effective casualty insurance protection for participating members.
Majority of Board is appointed by County; Financial benefit/ burden relationship exists.
Component Unit Blended in the Internal Service Funds
Self‐Insurance Group Workers’ Compensation Association
Authorized by the Code of Virginia and licensed by the State Corporation Commission. Make available a long‐term, stable source of cost‐effective workers’ compensation insurance protection for participating members.
Majority of Board is appointed by County; Financial benefit/ burden relationship exists.
Component Unit Blended in the Internal Service Funds
57
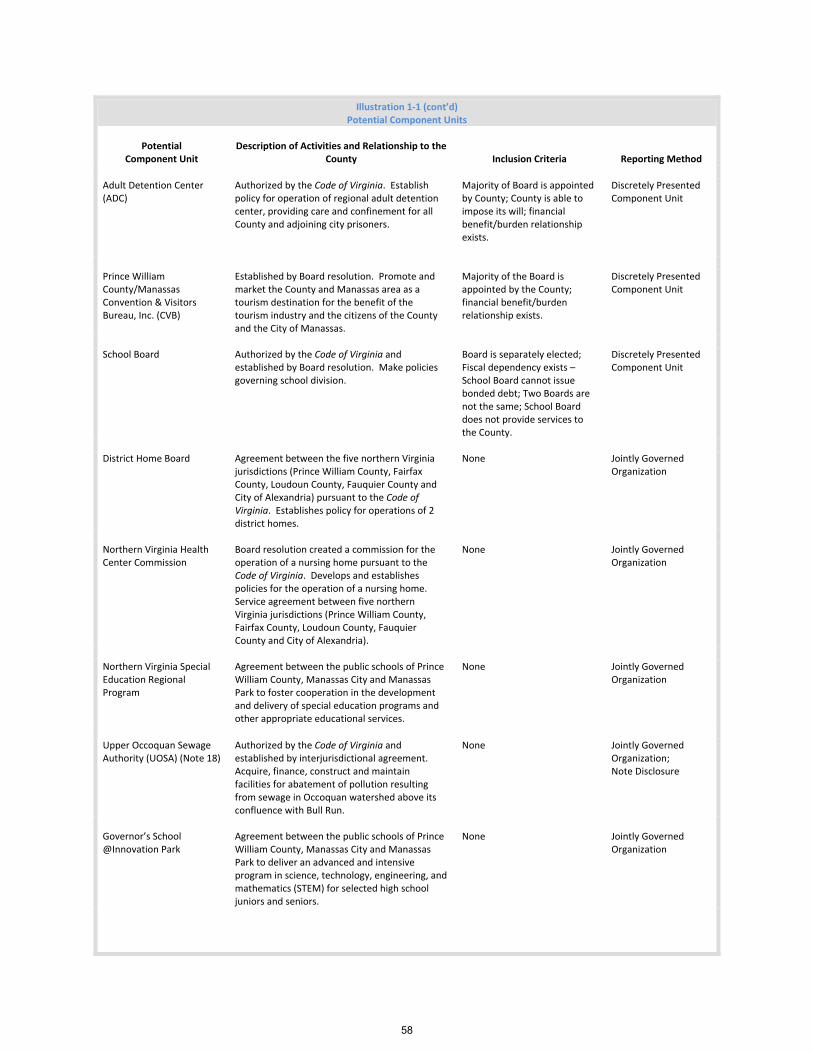
Illustration 1‐1 (cont’d) Potential Component Units
Potential
Component Unit Description of Activities and Relationship to the
County
Inclusion Criteria
Reporting Method
Adult Detention Center (ADC)
Authorized by the Code of Virginia. Establish policy for operation of regional adult detention center, providing care and confinement for all County and adjoining city prisoners.
Majority of Board is appointed by County; County is able to impose its will; financial benefit/burden relationship exists.
Discretely Presented Component Unit
Prince William County/Manassas Convention & Visitors Bureau, Inc. (CVB)
Established by Board resolution. Promote and market the County and Manassas area as a tourism destination for the benefit of the tourism industry and the citizens of the County and the City of Manassas.
Majority of the Board is appointed by the County; financial benefit/burden relationship exists.
Discretely Presented Component Unit
School Board Authorized by the Code of Virginia and
established by Board resolution. Make policies governing school division.
Board is separately elected; Fiscal dependency exists – School Board cannot issue bonded debt; Two Boards are not the same; School Board does not provide services to the County.
Discretely Presented Component Unit
District Home Board Agreement between the five northern Virginia
jurisdictions (Prince William County, Fairfax County, Loudoun County, Fauquier County and City of Alexandria) pursuant to the Code of Virginia. Establishes policy for operations of 2 district homes.
None Jointly Governed Organization
Northern Virginia Health Center Commission
Board resolution created a commission for the operation of a nursing home pursuant to the Code of Virginia. Develops and establishes policies for the operation of a nursing home. Service agreement between five northern Virginia jurisdictions (Prince William County, Fairfax County, Loudoun County, Fauquier County and City of Alexandria).
None Jointly Governed Organization
Northern Virginia Special Education Regional Program
Agreement between the public schools of Prince William County, Manassas City and Manassas Park to foster cooperation in the development and delivery of special education programs and other appropriate educational services.
None Jointly Governed Organization
Upper Occoquan Sewage Authority (UOSA) (Note 18)
Authorized by the Code of Virginia and established by interjurisdictional agreement. Acquire, finance, construct and maintain facilities for abatement of pollution resulting from sewage in Occoquan watershed above its confluence with Bull Run.
None Jointly Governed Organization; Note Disclosure
Governor’s School @Innovation Park
Agreement between the public schools of Prince William County, Manassas City and Manassas Park to deliver an advanced and intensive program in science, technology, engineering, and mathematics (STEM) for selected high school juniors and seniors.
None
Jointly Governed Organization
58
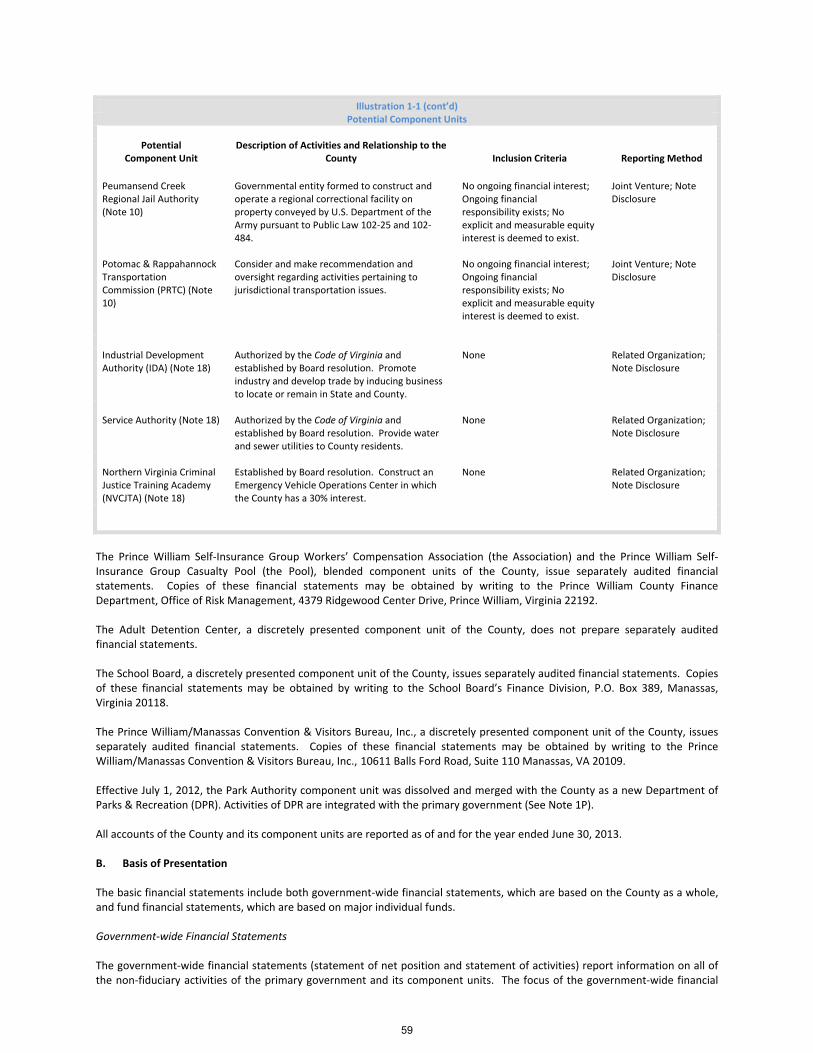
Illustration 1‐1 (cont’d) Potential Component Units
Potential Component Unit
Description of Activities and Relationship to the County Inclusion Criteria Reporting Method
Peumansend Creek Regional Jail Authority (Note 10)
Governmental entity formed to construct and operate a regional correctional facility on property conveyed by U.S. Department of the Army pursuant to Public Law 102‐25 and 102‐484.
No ongoing financial interest; Ongoing financial responsibility exists; No explicit and measurable equity interest is deemed to exist.
Joint Venture; Note Disclosure
Potomac & Rappahannock Transportation Commission (PRTC) (Note 10)
Consider and make recommendation and oversight regarding activities pertaining to jurisdictional transportation issues.
No ongoing financial interest; Ongoing financial responsibility exists; No explicit and measurable equity interest is deemed to exist.
Joint Venture; Note Disclosure
Industrial Development Authority (IDA) (Note 18)
Authorized by the Code of Virginia and established by Board resolution. Promote industry and develop trade by inducing business to locate or remain in State and County.
None Related Organization; Note Disclosure
Service Authority (Note 18) Authorized by the Code of Virginia and established by Board resolution. Provide water and sewer utilities to County residents.
None Related Organization; Note Disclosure
Northern Virginia Criminal Justice Training Academy (NVCJTA) (Note 18)
Established by Board resolution. Construct an Emergency Vehicle Operations Center in which the County has a 30% interest.
None Related Organization; Note Disclosure
The Prince William Self‐Insurance Group Workers’ Compensation Association (the Association) and the Prince William Self‐Insurance Group Casualty Pool (the Pool), blended component units of the County, issue separately audited financial statements. Copies of these financial statements may be obtained by writing to the Prince William County Finance Department, Office of Risk Management, 4379 Ridgewood Center Drive, Prince William, Virginia 22192.
The Adult Detention Center, a discretely presented component unit of the County, does not prepare separately audited financial statements.
The School Board, a discretely presented component unit of the County, issues separately audited financial statements. Copies of these financial statements may be obtained by writing to the School Board’s Finance Division, P.O. Box 389, Manassas, Virginia 20118.
The Prince William/Manassas Convention & Visitors Bureau, Inc., a discretely presented component unit of the County, issues separately audited financial statements. Copies of these financial statements may be obtained by writing to the Prince William/Manassas Convention & Visitors Bureau, Inc., 10611 Balls Ford Road, Suite 110 Manassas, VA 20109.
Effective July 1, 2012, the Park Authority component unit was dissolved and merged with the County as a new Department of Parks & Recreation (DPR). Activities of DPR are integrated with the primary government (See Note 1P).
All accounts of the County and its component units are reported as of and for the year ended June 30, 2013.
B. Basis of Presentation
The basic financial statements include both government‐wide financial statements, which are based on the County as a whole, and fund financial statements, which are based on major individual funds.
Government‐wide Financial Statements
The government‐wide financial statements (statement of net position and statement of activities) report information on all of the non‐fiduciary activities of the primary government and its component units. The focus of the government‐wide financial
59
statements is more on sustainability of the County as an entity and the change in aggregate financial position resulting from activities of the fiscal period. As a general rule, the effect of inter‐fund activity has been eliminated from these statements. Governmental activities, which are normally supported by taxes and intergovernmental revenues, are reported separately from business‐type activities, which rely, to a significant extent, on fees and other charges for support. Likewise, the primary government is reported separately from the County’s discretely presented component units. In the government‐wide statement of net position, the governmental and business‐type activities columns are presented on a consolidated basis by column and are presented using the economic resources measurement focus and the accrual basis of accounting, which incorporates long‐term assets as well as long‐term debt and obligations. Inter‐fund balances between governmental funds and inter‐fund balances between proprietary funds are not included in the government‐wide statement of net position. The government‐wide statement of activities demonstrates the degree to which the direct expenses of a given functional category (public safety, public works, etc.) or business‐type activity (landfill, etc.) are offset by program revenues. Direct expenses are those that are clearly identifiable with a specific functional category or business‐type activity. Program revenues include 1) charges to customers or applicants who purchase, use, or directly benefit from goods, services, or privileges provided by a given functional category or business‐type activity and 2) grants and contributions that are restricted to meet the operational or capital requirements of a particular functional category or business‐type activity. Taxes and other items that are not properly included among program revenues are reported instead as general revenues. When both restricted and unrestricted resources are available for use, it is the County’s policy to use restricted resources first, then unrestricted resources as they are needed. Fund Financial Statements The financial transactions of the County are recorded in individual funds. Each fund is a separate accounting entity with a self‐balancing set of accounts that comprise its assets, liabilities, reserves, fund equity, revenues and expenditures/expenses. Emphasis is on major funds in the governmental or business‐type categories. GASB Statement No. 34 sets forth minimum criteria for the determination of major funds. The County has elected to present additional funds as major due to the specific community focus. The nonmajor funds in each category are combined in a column in the fund financial statements and detailed in the combining and individual fund statements and schedules section. The governmental fund financial statements are presented using a current financial resources measurement focus and the modified accrual basis of accounting. This is the manner which GAAP has prescribed as the most appropriate to (a) demonstrate legal and covenant compliance, (b) demonstrate the source and use of liquid financial resources, and (c) demonstrate how the County’s actual experience conforms to the budget fiscal plan. As the governmental fund statements are presented on a different measurement focus and basis of accounting than the government‐wide statements’ governmental activities column, reconciliations are presented which briefly explain the adjustments necessary to reconcile the governmental fund financial statements to the government‐wide financial statements. The County’s internal service funds (which typically provide services to other funds of the government) are presented in a consolidated column in the proprietary fund financial statements. Since the principal users of these services are the County’s governmental activities, the financial statements of the internal service funds are consolidated into the governmental activities column in the government‐wide financial statements. To the extent possible, the costs of these services are reflected in the appropriate functional category. The County’s enterprise funds, presented in the proprietary fund financial statements, are presented using the economic resources measurement focus and the accrual basis of accounting. Since some of the County’s enterprise funds use the services of the internal service funds, reconciliations are presented which briefly explain the adjustments necessary to reconcile the proprietary fund financial statements to the government‐wide financial statements. Proprietary funds distinguish operating revenues and expenses from non‐operating items. Operating revenues and expenses generally result from providing services and producing and delivering goods in connection with the proprietary fund’s principal ongoing operations. The principal operating revenues of the Landfill Fund, the Innovation Technology Park Fund and the internal service funds are charges to customers for sales and services. Operating expenses of the enterprise funds and internal service funds include the costs of providing services, such as personnel, contracting and supplies, as well as depreciation. Additionally, landfill closure costs are included in operating expenses of the Landfill Fund. All revenues and expenses not meeting this definition are reported as non‐operating revenues and expenses. The County’s fiduciary funds are presented in the fund financial statements by type (pension trust funds, other post‐employment benefits master trust fund, private purpose trust funds, and agency funds). Since by definition, the assets of these
60

funds are held for the benefit of a third party (pension participants, other post‐employment benefit participants, private parties, etc.) and cannot be used to satisfy obligations of the County, these funds are not incorporated into the government‐wide financial statements.
The following major funds are used by the County:
Governmental Funds: The focus of governmental fund measurement in the fund financial statements is upon the determination of financial position and changes in financial position (sources, uses, and balances of financial resources) rather than upon net income. The following is a description of the major governmental funds of the County:
General Fund – The General Fund accounts for numerous primary services of the County (Police, Fire, Public Works, Community Development, Debt Service, etc.) and is the primary operating unit of the County. It accounts for all financialresources of the general government, except those required to be accounted for by another fund.
Streets and Roads Capital Projects Fund – The Streets and Roads Capital Projects Fund is used to account for the resourcesand expenditures related to the construction of sidewalks and roads within the County.
Other Capital Projects Fund – The Other Capital Projects Fund is used to account for the resources and expendituresrelated to construction projects such as libraries and parks, facilities to be used by police, detention and fire and rescueagencies, and storm water management ponds and channels.
Education Capital Projects Funds – The Education Capital Projects Fund is used to account for the resources obtainedexclusively for the construction of school buildings and other school projects (proceeds from bonds). Such resources areimmediately provided to the School Board Component Unit to support the construction of such assets.
Fire & Rescue Levy Special Revenue Fund – The Fire & Rescue Levy Special Revenue fund is used to account for fire andrescue services provided to specific County districts. Revenues are principally derived from special tax levies and interestearnings. Expenditures consist of the cost of delivering fire and rescue services.
Proprietary Funds:
The focus of proprietary fund measurement is upon the determination of operating income, changes in net position, financial position, and cash flows, which is similar to a business enterprise. The following is a description of the major proprietary funds of the County:
Landfill Fund – The Prince William County Landfill provides refuse disposal services.
Innovation Technology Park Fund – Innovation Technology Park provides land for economic development purposes.
Parks & Recreation Fund – The Prince William County Department of Parks & Recreation provides recreation services toCounty residents.
In addition to the major funds discussed above, the County reports on the following fund types:
Internal service funds – The County operates a construction crew, a data processing center, and a vehicle maintenancefacility. In addition, the County operates four self‐insurance funds – three for risk management services that provideinsurance for workers’ compensation, general liability, and other insurance needs of the County, and the Adult DetentionCenter, and one that provides health insurance for eligible participating County employees. The effect of inter‐fundactivity has been eliminated from the government‐wide financial statements. The excess revenues or expenses for thefund are allocated to the appropriate functional activity. The internal service funds are included in governmental activitiescolumn for government‐wide reporting purposes. Inter‐fund services that are provided and used are not eliminated in theprocess of consolidation.
Pension trust fund – The County accounts for a defined benefit trust to provide supplemental retirement benefits touniformed police officers and fire fighters.
Other Post‐Employment Benefits (OPEB) master trust fund – The County uses this fund to account for post‐employmentbenefits other than pensions for eligible employees of the County.
61

Private purpose trust funds – The County accounts for the operations of a business and industrial park owners’ association, Historic Preservation Foundation and library donations.
Agency funds – The County accounts for receipts and disbursements of monies for certain County welfare, mental health service, and federal self‐sufficiency program recipients.
C. Basis of Accounting The basis of accounting refers to the point at which revenues or expenditures/expenses are recognized in the accounts and reported in the financial statements. It relates to the timing of the measurements made, regardless of the measurement focus applied. The government‐wide financial statements, the proprietary fund financial statements, the fiduciary fund financial statements, and the component unit financial statements are presented on an accrual basis of accounting. The governmental fund financial statements are presented on a modified accrual basis of accounting. Accrual Basis of Accounting Revenues are recognized when earned and expenses are recognized when incurred. Modified Accrual Basis of Accounting Under the modified accrual basis of accounting, revenues are recorded when susceptible to accrual; both measurable and available. “Available” means collectible within the current period or soon enough thereafter to be used to pay liabilities of the current period. For this purpose, the County considers the availability period for all significant revenue sources to be 60 days after the end of the current fiscal period. Accordingly, real and personal property taxes are recorded as revenues and receivables when billed, net of allowances for uncollectible amounts. Property taxes due, but not collected within 60 days after year‐end, are reflected as unearned revenues. Derived tax revenues such as sales and utility taxes that are collected by the Commonwealth or utility companies, and subsequently remitted to the County, are recognized as revenues and receivables when the underlying exchange transaction occurs, which is generally two months preceding receipt by the County. Licenses, permits and fines are recorded as revenues when received. Intergovernmental revenues, consisting primarily of Federal, State and other grants for the purpose of funding specific expenditures, are recognized when earned or at the time of the specific expenditure. Revenues from general‐purpose grants are recognized in the period to which the grant applies. Interest earnings are recorded as earned. Expenditures are generally recognized under the modified accrual basis of accounting when the related liability is incurred. The exception to this general rule is that principal and interest on general obligation long‐term debt is recognized when due. D. Budgets and Budgetary Accounting Formal budgetary integration is employed as a management control device during the year. Budgets for all governmental funds of the Primary Government and Discretely Presented Component Units of the County are adopted by the Board annually on a non‐GAAP basis which excludes the effects of fair value adjustments to the carrying amounts of investments required by GASB Statement No. 31. Reconciliations between the non‐GAAP basis amounts presented for budgetary comparisons and the GAAP basis amounts presented elsewhere in the CAFR are shown on the face of the budgetary comparison schedules (Schedules 1, 5, 6, 7, and 8). Project length financial plans are adopted for all capital projects funds. In late February, the County Executive submits to the Board, a proposed operating budget for the fiscal year commencing the following July 1. The operating budget includes proposed expenditures and the means of financing them. The Board holds work sessions to review the proposed budget and conducts two public hearings to obtain taxpayer comments. The budget is legally adopted by the Board within the timelines stipulated by the Code of Virginia. The Board appropriates the budget on an annual basis. During the year, several supplemental appropriations are necessary. The Board adopts resolutions for supplemental appropriations that increase or decrease the adopted budget. Departmental expenditures may not exceed Board approved appropriations, which lapse at the end of the year. The Board appropriates carryovers from one fiscal year to the next resulting from projected surplus revenues and budget savings generated during the year through departmental spending control efforts. The Board also authorizes the Director of Finance to administratively reduce the amount of carryovers approved should the actual funds to support the appropriation be insufficient after completion of the County’s year end closing cycle.
62
The budget is controlled at certain legal as well as administrative levels. The Code of Virginia (1950), as amended (Code of Virginia) requires the County to annually adopt a balanced budget. The Board’s Annual Adopted Budget Resolution places legal restrictions on expenditures at the department level (i.e., the level at which expenditures may not legally exceed appropriations). Management approves budget transfers of any amount between major expenditure categories within departments and in certain limited cases these are reviewed by the Board. Budget transfers of twenty thousand dollars or more between departments are approved by the Board. The Board approves resolutions for supplemental appropriations that increase or decrease (amend) the original budget. Only the Board can amend the budget. All budgets and appropriations lapse at the end of each fiscal year. Annual transfers out are appropriated in the General and Special Revenue Funds and for the component units of the County. Expenditures in all governmental funds of the County were within authorized budget limitations. Where required, the governmental fund financial statements provide budgetary comparison schedules that demonstrate compliance at the legal level of budgetary control. E. Encumbrances Encumbrance accounting, the recording of purchase orders, contracts, and other mandatory commitments for the expenditure of monies to reserve that portion of the applicable appropriation, is employed as an extension of formal budgetary integration in all governmental funds. Encumbrances outstanding at year‐end are reported as restricted, committed, or assigned fund balance, depending on the source of funding and/or the specific constraints on the funds encumbered, since they do not constitute expenditures or liabilities. Encumbrances are normally re‐appropriated each year by Board resolution. F. Cash and Investments For purposes of the statement of cash flows, all cash on hand, deposits and highly liquid investments with original maturities of three months or less, as well as the County’s cash management pool, are grouped into equity in pooled cash and investments. These pooled cash and investments, as well as restricted cash and temporary investments are considered to be cash and cash equivalents. The County maintains a single cash and investment pool for use by all funds and component units, except for the Supplemental Retirement System Pension Trust Fund, OPEB Master Trust Fund, certain enterprise and internal service funds, the School Board Student Activity Fund, and the Community Services Board Payee Accounts. Each fund participates on a dollar equivalent and daily transaction basis. Interest is distributed monthly based on average daily cash balances. A “zero balance account” mechanism provides for daily sweeps of deposits made to the County’s checking accounts, resulting in an instantaneous transfer to the investment account. Hence, the majority of the County’s funds are invested at all times. Bond proceeds are maintained to comply with the provisions of the Tax Reform Act of 1986 or as required by various bond indentures. Investments are carried at fair value based on quoted market prices. Interest earnings are allocated monthly to the respective funds based on the percentage of each fund’s average daily balance of cash investments in the total pool. G. Inventories Inventory is valued at cost for all governmental funds and at lower of cost or market for all other funds using the first‐in, first‐out method. Inventory in the General and certain Enterprise and Internal service funds consists of expendable supplies held for consumption and land held for resale. The cost is recorded as an expenditure at the time individual inventory items are consumed. Reported inventories for governmental funds are offset equally by a non‐spendable fund balance which indicate they do not constitute available expendable resources, even though they are a component of assets. H. Due from Other Funds, Component Units and Governmental Units Noncurrent portions of long‐term inter‐fund loans receivable (reported in due from asset accounts) and amounts due from other governments are equally offset by a committed fund balance account which indicates that they do not constitute available expendable resources and therefore are not available for appropriation. I. Compensated Absences In governmental fund types, the cost of vacation and sick pay benefits (compensated absences) is recognized when payments are made to employees. A liability for all governmental fund type vested accrued vacation and sick pay benefits is recorded as
63
noncurrent liabilities in the government‐wide statement of net position. Proprietary fund types accrue vacation and sick leave benefits in the period they are earned.
J. Self‐Insurance and Health Insurance Long‐Term Liabilities
The County, and the Adult Detention Center component unit participate in the Prince William Self‐Insurance Group Casualty Pool and Workers' Compensation Association, which provide casualty insurance and workers' compensation protection for the members. Under GASB Statement No. 10, Accounting and Financial Reporting for Risk Financing and Related Insurance Issues, the Pool and the Association are classified as “entities other than pools” because the County and its component units are the only participants. The County provides three self‐insured health insurance program options to its employees. Estimated liability for claims payable includes estimates of losses on claims reported and actuarial determinations of claims incurred but not reported.
K. Capital Assets
The cost of capital assets acquired for general government purposes is recorded as an expenditure in the governmental funds and as an asset in the government‐wide financial statements to the extent the County’s capitalization threshold has been met. Capital assets acquired by proprietary funds are recorded as assets in both the government‐wide financial statements and in the proprietary fund financial statements to the extent the County’s capitalization threshold has been met. The County capitalizes assets (non‐software) costing at least five thousand dollars and having an estimated useful life longer than one year. The County capitalizes software costing at least one hundred thousand dollars and having an estimated useful life longer than one year. The School Board and the Prince William/Manassas Convention & Visitors Bureau, Inc. component units’ capitalization thresholds differ from the County’s. Details of their capitalization thresholds are discussed in their separately issued financial statements.
All purchased capital assets are valued at cost where historical records are available and at an estimated historical cost where no historical records exist. Donated capital assets are recorded at fair market value as of the date of donation.
Maintenance, repairs, and minor renovations, are charged to operations when incurred. Expenditures that materially increase values, change capacities, or extend useful lives are capitalized. Upon sale or retirement, the cost and related accumulated depreciation is eliminated from the respective accounts, and any resulting gain or loss is included in the determination of change in net position for the period.
In accordance with GASB Statement No. 34 and GASB Statement No. 51, the County’s infrastructure and commercial “off‐the‐shelf” software have been capitalized retroactively to 1980. Of the $187 million in infrastructure capitalized at June 30, 2013, approximately $138 million was valued using actual historical cost records; approximately $49 million was estimated using current replacement cost for a similar asset and deflating this cost through the use of price indices to the acquisition year. $34 million of intangible software capitalized at June 30, 2013 was valued using project costing models. The County does not capitalize streets and roads as these are transferred to and become property of the Commonwealth of Virginia upon completion.
Capital assets of the primary government and the Adult Detention Center component unit are depreciated using the straight‐line method over the estimated useful lives of purchased, donated and leased assets as follows:
Public domain infrastructure 40‐50 years Buildings 20‐40 years Improvements to sites 2‐50 years Equipment 2‐20 years Vehicles 3‐10 years Intangible assets 5‐15 years
Depreciation on the County’s solid waste landfill liner system is calculated based on the percentage of the landfill liner’s capacity used each year.
Details of the School Board and Prince William County/Manassas Convention Visitors Bureau, Inc. component units’ depreciation methods and estimated useful lives are discussed in their separately issued financial statements.
Impaired capital assets that are no longer used are reported at the lower of carrying value or fair value. An asset is considered impaired if both (a) the decline in service utility of the capital asset is large in magnitude and (b) the event or change in circumstance is outside the normal life of the capital asset.
64

L. Fund Equity Nonspendable fund balances represent amounts that cannot be spent because they are not in spendable form. Restricted fund balances represent those portions of fund equity not appropriable for expenditure or legally segregated for a specific future use. Committed and Assigned fund balances represent the County's managerial plans for future use of financial resources. Unassigned fund balance is the residual classification for the General Fund. Policy 1.04 of the County's Principles of Sound Financial Management requires an unassigned fund balance of 7.5 percent of the current year’s General Fund revenues. M. Leases For capital leases in the governmental fund types, acquisition costs are recorded as expenditures with an offsetting entry to other financing sources. N. Deferred Loss on Debt Refundings Losses resulting from advance or current refundings of debt in proprietary funds are deferred and amortized over the shorter of the life of the new debt or the remaining life of the old debt. The amount is deferred and reported as an unamortized deferred charge and is amortized and reported as a component of interest expense. O. Comparative Information
The financial statements for the prior year have been presented in selected sections of the accompanying financial statements in order to provide an understanding of the changes in the government’s financial position and operations. Certain amounts in the prior year data have been restated in order to be consistent with the current year’s presentation. The financial statements include certain prior‐year summarized comparative information in total but not by type of activity or fund‐type. Such information does not include sufficient detail to constitute a presentation in conformity with generally accepted accounting principles. As of July 1, 2012, the Park Authority component unit was dissolved and merged with the County as a new Department of Parks & Recreation. Accordingly, prior year comparative information should be read in conjunction with the County’s and Park Authority’s statements for the year ended June 30, 2012, from which the summarized information was derived. P. Change in Reporting Entity
On March 13, 2012, the Board of County Supervisors authorized Res. No. 12‐236 to dissolve the Park Authority component unit and merge its functions into the County Government by creating a new Department of Parks & Recreation (DPR). This action ended the separate corporate existence of the Park Authority on July 1, 2012 to provide parks and recreation services to the public by the most effective and efficient means. Due to the merger of Park Authority (now known as DPR), the fiscal year 2012 beginning balances and activities have been restated to include DPR as a part of the primary government, as shown in Illustration 1‐2. In accordance with GASB Statement No. 62, Codification of Accounting and Financial Reporting Guidance Contained in Pre‐November 30, 1989 FASB and AICPA Pronouncements, the prior year amounts presented were restated to show financial information on a comparative basis for the new reporting entity. Additionally, as a result of the changes to the original GASB Statement No. 14 brought on by GASB Statement No. 61 related to financial dependency, the Convention Visitors Bureau (CVB) qualified to be included as a component unit in FY 2013. The relationship between the County’s Transient Occupancy Tax (TOT) in relation to CVB’s other revenue sources increased in FY 2013 making them more financially dependent on the County’s revenues. Therefore, the reporting entity constitutes inclusion of comparative financial information for CVB.
65
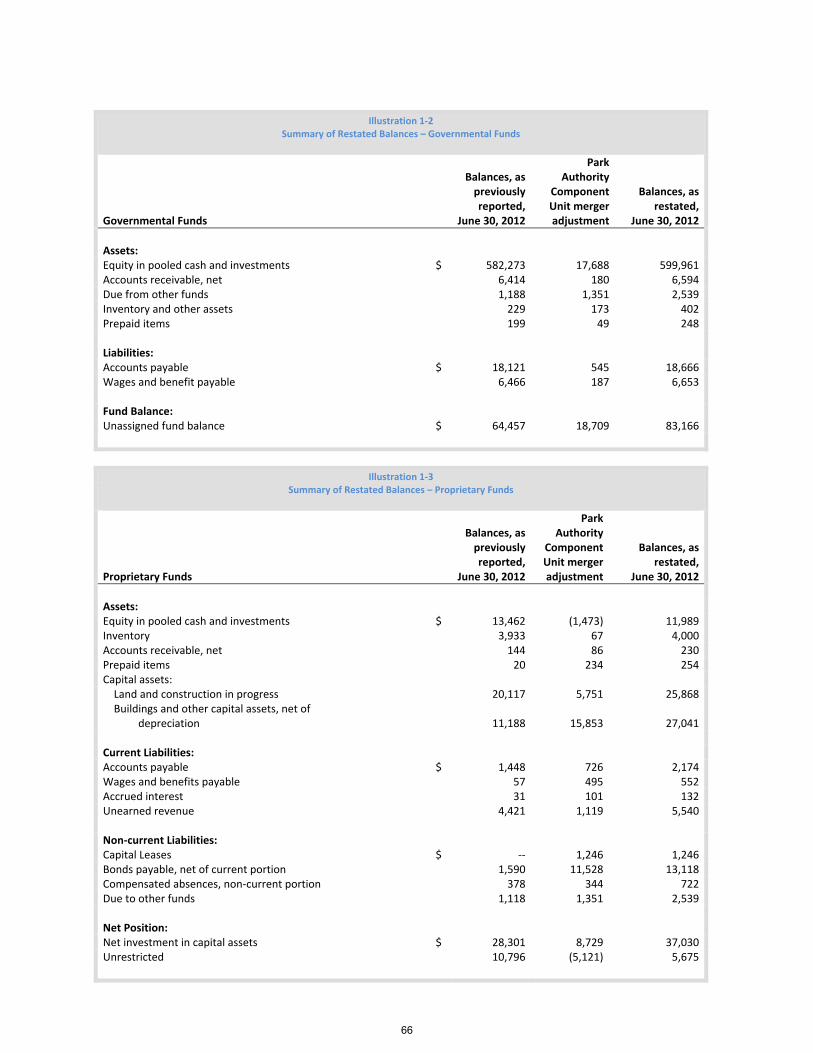
Illustration 1‐2Summary of Restated Balances – Governmental Funds
Governmental Funds
Balances, as previously reported,
June 30, 2012
Park Authority
Component Unit merger adjustment
Balances, as restated,
June 30, 2012
Assets: Equity in pooled cash and investments $ 582,273 17,688 599,961Accounts receivable, net 6,414 180 6,594Due from other funds 1,188 1,351 2,539Inventory and other assets 229 173 402Prepaid items 199 49 248 Liabilities: Accounts payable $ 18,121 545 18,666Wages and benefit payable 6,466 187 6,653
Fund Balance: Unassigned fund balance $ 64,457 18,709 83,166
Illustration 1‐3Summary of Restated Balances – Proprietary Funds
Proprietary Funds
Balances, as previously reported,
June 30, 2012
Park Authority
Component Unit merger adjustment
Balances, as restated,
June 30, 2012
Assets: Equity in pooled cash and investments $ 13,462 (1,473) 11,989Inventory 3,933 67 4,000Accounts receivable, net 144 86 230Prepaid items 20 234 254Capital assets: Land and construction in progress 20,117 5,751 25,868 Buildings and other capital assets, net of depreciation
11,188
15,853 27,041
Current Liabilities: Accounts payable $ 1,448 726 2,174Wages and benefits payable 57 495 552Accrued interest 31 101 132Unearned revenue 4,421 1,119 5,540 Non‐current Liabilities: Capital Leases $ ‐‐ 1,246 1,246Bonds payable, net of current portion 1,590 11,528 13,118Compensated absences, non‐current portion 378 344 722Due to other funds 1,118 1,351 2,539 Net Position: Net investment in capital assets $ 28,301 8,729 37,030Unrestricted 10,796 (5,121) 5,675
66
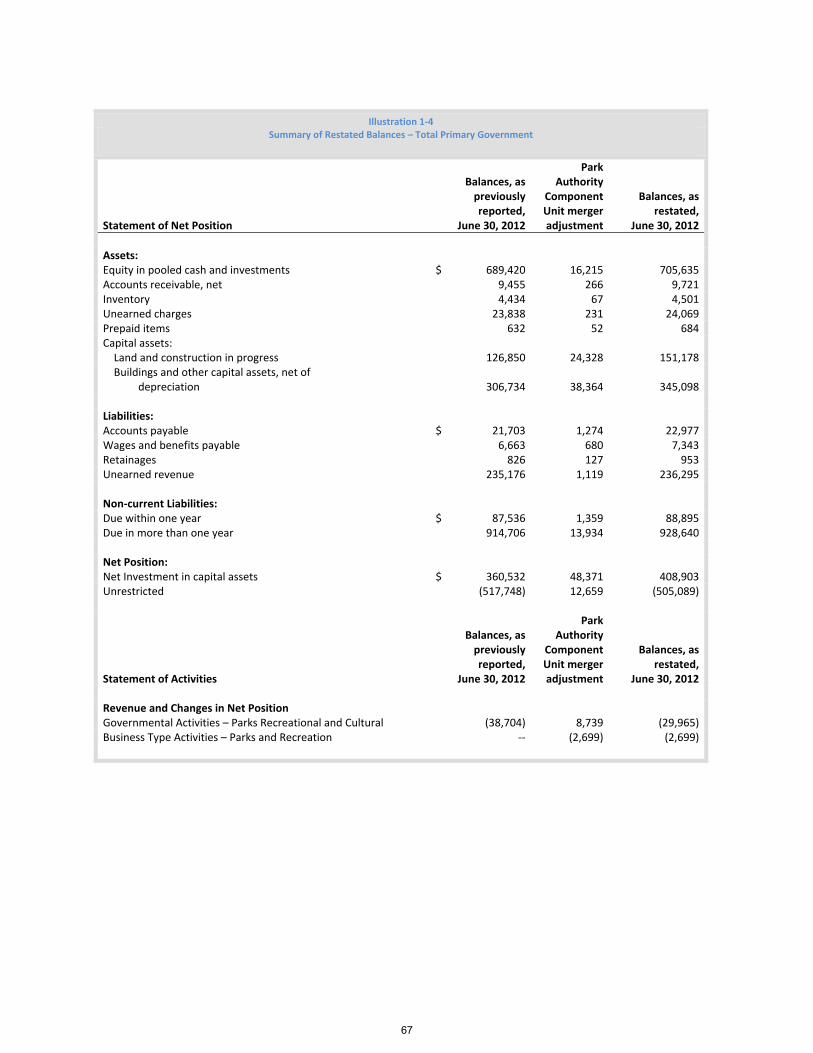
Illustration 1‐4Summary of Restated Balances – Total Primary Government
Statement of Net Position
Balances, as previously reported,
June 30, 2012
Park Authority
Component Unit merger adjustment
Balances, as restated,
June 30, 2012
Assets: Equity in pooled cash and investments $ 689,420 16,215 705,635Accounts receivable, net 9,455 266 9,721Inventory 4,434 67 4,501Unearned charges 23,838 231 24,069Prepaid items 632 52 684Capital assets: Land and construction in progress 126,850 24,328 151,178 Buildings and other capital assets, net of depreciation 306,734 38,364 345,098 Liabilities: Accounts payable $ 21,703 1,274 22,977Wages and benefits payable 6,663 680 7,343Retainages 826 127 953Unearned revenue 235,176 1,119 236,295 Non‐current Liabilities: Due within one year $ 87,536 1,359 88,895Due in more than one year 914,706 13,934 928,640 Net Position: Net Investment in capital assets $ 360,532 48,371 408,903Unrestricted (517,748) 12,659 (505,089)
Statement of Activities
Balances, as previously reported,
June 30, 2012
Park Authority
Component Unit merger adjustment
Balances, as restated,
June 30, 2012 Revenue and Changes in Net Position Governmental Activities – Parks Recreational and Cultural (38,704) 8,739 (29,965)Business Type Activities – Parks and Recreation ‐‐ (2,699) (2,699)
67

Illustration 1‐5
Summary of Restated Balances – Component Units
Statement of Net Position
Balances, as previously reported,
June 30, 2012
Park Authority
Component Unit merger adjustment
Convention Visitors Bureau
Component Unit
adjustment
Balances, as restated,
June 30, 2012
Assets: Equity in pooled cash and investments
$ 260,536 (16,215) 239 244,560Accounts receivable, net 2,282 (266) ‐‐ 2,016Due from other governmental units 24,058 ‐‐ ‐‐ 24,058Due from primary government 352 ‐‐ ‐‐ 352Inventory 3,275 (67) 21 3,229Unearned charges 231 (231) ‐‐ ‐‐Prepaid items 1,563 (52) 59 1,570Deposits 500 ‐‐ ‐‐ 500Restricted assets 11,917 ‐‐ ‐‐ 11,917Capital assets: Land and construction in progress 133,023 (24,328) ‐‐ 108,695
Buildings and other capital assets, net of depreciation 1,079,128 (38,364) 62 1,040,826Total Assets 1,516,865 (79,523) 381 1,437,723
Liabilities: Accounts payable $ 12,413 (1,274) 75 11,214Wages and benefits payable
79,801 (680) 31 79,152Retainages 2,289 ‐‐ ‐‐ 2,289Accrued interest 127 (127) ‐‐ ‐‐Due to other governmental units 188 ‐‐ ‐‐ 188Unearned revenue 8,504 (1,119) ‐‐ 7,385
Non‐current Liabilities: Due within one year $ 19,532 (1,359) ‐‐ 18,173Due in more than one year 37,483 (13,934) ‐‐ 23,549Total Liabilities 160,337 (18,493) 106 141,950
Net Position: Net Investment in capital assets $ 1,197,830 (48,371) ‐‐ 1,149,459Restricted 34,791 ‐‐ ‐‐ 34,791Unrestricted 123,907 (12,659) 275 111,523Total Net Position 1,356,528 (61,030) 275 1,295,773
68
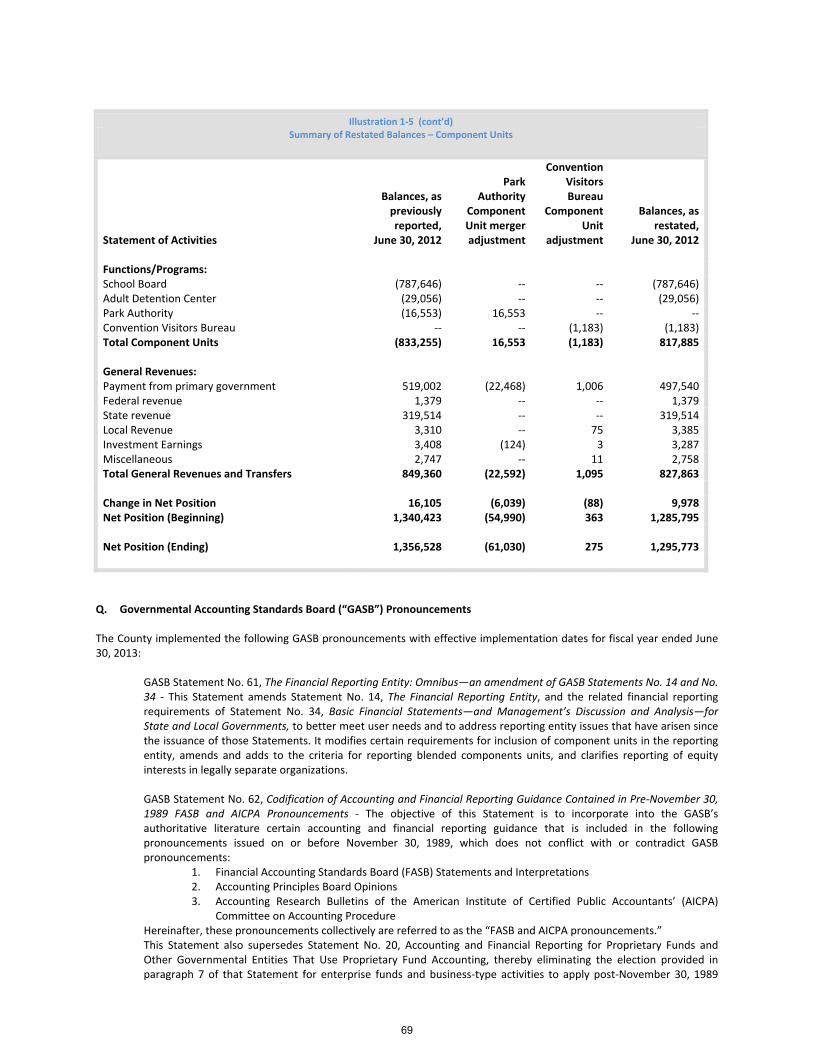
Illustration 1‐5 (cont’d)Summary of Restated Balances – Component Units
Statement of Activities
Balances, as previously reported,
June 30, 2012
Park Authority
Component Unit merger adjustment
Convention Visitors Bureau
Component Unit
adjustment
Balances, as restated,
June 30, 2012
Functions/Programs: School Board (787,646) ‐‐ ‐‐ (787,646)Adult Detention Center (29,056) ‐‐ ‐‐ (29,056)Park Authority (16,553) 16,553 ‐‐ ‐‐Convention Visitors Bureau ‐‐ ‐‐ (1,183) (1,183)Total Component Units (833,255) 16,553 (1,183) 817,885
General Revenues: Payment from primary government 519,002 (22,468) 1,006 497,540Federal revenue 1,379 ‐‐ ‐‐ 1,379State revenue 319,514 ‐‐ ‐‐ 319,514Local Revenue 3,310 ‐‐ 75 3,385Investment Earnings 3,408 (124) 3 3,287Miscellaneous 2,747 ‐‐ 11 2,758Total General Revenues and Transfers 849,360 (22,592) 1,095 827,863
Change in Net Position 16,105 (6,039) (88) 9,978Net Position (Beginning) 1,340,423 (54,990) 363 1,285,795
Net Position (Ending) 1,356,528 (61,030) 275 1,295,773
Q. Governmental Accounting Standards Board (“GASB”) Pronouncements
The County implemented the following GASB pronouncements with effective implementation dates for fiscal year ended June 30, 2013:
GASB Statement No. 61, The Financial Reporting Entity: Omnibus—an amendment of GASB Statements No. 14 and No. 34 ‐ This Statement amends Statement No. 14, The Financial Reporting Entity, and the related financial reporting requirements of Statement No. 34, Basic Financial Statements—and Management’s Discussion and Analysis—for State and Local Governments, to better meet user needs and to address reporting entity issues that have arisen since the issuance of those Statements. It modifies certain requirements for inclusion of component units in the reporting entity, amends and adds to the criteria for reporting blended components units, and clarifies reporting of equity interests in legally separate organizations.
GASB Statement No. 62, Codification of Accounting and Financial Reporting Guidance Contained in Pre‐November 30, 1989 FASB and AICPA Pronouncements ‐ The objective of this Statement is to incorporate into the GASB’s authoritative literature certain accounting and financial reporting guidance that is included in the following pronouncements issued on or before November 30, 1989, which does not conflict with or contradict GASB pronouncements:
1. Financial Accounting Standards Board (FASB) Statements and Interpretations2. Accounting Principles Board Opinions3. Accounting Research Bulletins of the American Institute of Certified Public Accountants’ (AICPA)
Committee on Accounting ProcedureHereinafter, these pronouncements collectively are referred to as the “FASB and AICPA pronouncements.” This Statement also supersedes Statement No. 20, Accounting and Financial Reporting for Proprietary Funds and Other Governmental Entities That Use Proprietary Fund Accounting, thereby eliminating the election provided in paragraph 7 of that Statement for enterprise funds and business‐type activities to apply post‐November 30, 1989
69
FASB Statements and Interpretations that do not conflict with or contradict GASB pronouncements. However, those entities can continue to apply, as other accounting literature, post‐November 30, 1989 FASB pronouncements that do not conflict with or contradict GASB pronouncements, including this Statement
GASB Statement No. 63, Financial Reporting of Deferred Outflows of Resources, Deferred Inflows of Resources, and Net Position ‐ This Statement provides financial reporting guidance for deferred outflows of resources and deferred inflows of resources. Concepts Statement No. 4, Elements of Financial Statements, introduced and defined those elements as a consumption of net assets by the government that is applicable to a future reporting period, and an acquisition of net assets by the government that is applicable to a future reporting period, respectively. Previous financial reporting standards do not include guidance for reporting those financial statement elements, which are distinct from assets and liabilities.
The GASB has also issued the following statements with effective implementation dates during the current fiscal year ended June 30, 2013. These statements, which have limited or no future impact on the County are as follows:
GASB Statement No. 60, Accounting and Financial Reporting for Service Concession Arrangements ‐ This statement improves financial reporting by addressing issues related to service concession arrangements (SCAs), which are a type of public‐private or public‐public partnership. As used in this Statement, an SCA is an arrangement between a transferor (a government) and an operator (governmental or nongovernmental entity) in which (1) the transferor conveys to an operator the right and related obligation to provide services through the use of infrastructure or another public asset (a “facility”) in exchange for significant consideration and (2) the operator collects and is compensated by fees from third parties. The County currently does not have and Service Concession Arrangements. GASB Statement No. 64, Derivative Instruments: Application of Hedge Accounting Termination Provisions—an amendment of GASB Statement No. 53 ‐ This statement clarifies whether an effective hedging relationship continues after the replacement of a swap counterparty or a swap counterparty’s credit support provider. This Statement sets forth criteria that establish when the effective hedging relationship continues and hedge accounting should continue to be applied. The County does not invest in derivative instruments.
The GASB has issued the following statements with effective implementation dates later than the fiscal year ending June 30, 2013. The statements deemed to have a future impact on the County are as follows:
GASB Statement No. 65, Items Previously Reported as Assets and Liabilities ‐ This statement establishes accounting and financial reporting standards that reclassify, as deferred outflows of resources of inflows or deferred inflows of resources, certain items that were previously reported as assets and liabilities and recognizes, as outflows of resources or inflows of resources, certain items that were previously reported as assets and liabilities. Concepts Statement No. 4, Elements of Financial Statements, introduced and defined the elements included in financial statements, including deferred outflows and deferred inflows of resources. This statement will improve financial reporting by clarifying the appropriate use of the financial statement elements and to ensure consistency in financial reporting. GASB Statement No. 67, Financial Reporting for Pension Plans—an amendment of GASB Statement No. 25 ‐ This Statement improves financial reporting by state and local governmental pension plans by revising existing standards of financial reporting for most pension plans and establishing a definition of a pension plan that reflects the primary activities associated with the pension arrangement—determining pensions, accumulating and managing assets dedicated for pensions, and paying benefits to plan members as they come due. GASB Statement No. 68, Accounting and Financial Reporting for Pensions—an amendment of GASB Statement No. 27 ‐ This Statement improves accounting and financial reporting by state and local governments for pensions, and improves information provided by state and local governmental employers about financial support for pensions that is provided by other entities by establishing accounting and financial reporting requirements related to pensions for governments whose employees are provided with pensions through pension plans that are covered by the scope of this Statement, as well as for non‐employer governments that have a legal obligation to contribute to those plans. GASB Statement No. 69, Government Combinations and Disposals of Government Operations ‐ This statement establishes accounting and financial standards related to government combinations referred to as mergers, acquisitions, and transfers of operations and also disposals of government operations. Prior to this statement, governments accounted for mergers, acquisitions, and transfers of operations by analogizing to accounting and financial reporting guidance intended for the business environment, generally APB Opinion No. 16, Business
70

Combinations. This statement improves the decision usefulness of financial reporting by requiring disclosures to be made by governments about combination arrangements in which they engage and for disposals of government operations. GASB Statement No. 70, Accounting and Financial Reporting for Non‐exchange Financial Guarantees ‐ This statement improves accounting and financial reporting by state and local governments that extend and receive non‐exchange financial guarantees. It requires a government that extends a non‐exchange financial guarantee to recognize a liability when it is more likely than not that the government will be required to make a payment on the guarantee and revenue to the extent of a reduction in its guaranteed liabilities. It also provides guidance on how that liability should be valued and how long the obligation should be reported. In addition it provides guidance on intra‐entity non‐exchange financial guarantees involving component units and specifies disclosure requirements for governments extending non‐exchange financial guarantees and requires new information to be disclosed by governments receiving non‐exchange financial guarantees.
R. Subsequent Events
The County has evaluated subsequent events (events occurring after June 30, 2013 through December 23, 2013) in connection with the preparation of these financial statements. Such events have been disclosed in Note 21.
NOTE (2) ‐ CASH AND INVESTMENTS A. Cash Deposits All cash of the County is maintained in accounts collateralized in accordance with the Virginia Security for Public Disclosures Act (the Act), Sec. 2.2‐4400 et. seq. of the Code of Virginia. Under the Act, banks holding public deposits in excess of the amounts insured by FDIC must pledge collateral in the amount of 50% of excess deposits to a collateral pool in the name of the State Treasury Board. If any member bank fails, the entire collateral pool becomes available to satisfy the claims of governmental entities. If the value of the pool’s collateral were inadequate to cover the loss, additional amounts would be assessed on a pro rata basis to the members of the collateral pool. Collateral is not specifically identified as security for any one public depositor and public depositors are prohibited from holding collateral in their name as security for deposits. With the ability to make additional assessments, the multiple bank collateral pool functions similar to depository insurance. Savings and loan institutions are required to collateralize 100% of deposits in excess of FDIC limits. The Commonwealth Treasury Board is responsible for monitoring compliance with the collateralization and reporting requirements of the Act. Funds deposited in accordance with the requirements of the Act are considered fully secured and are not subject to custodial credit risk. B. Investments County Investments Code of Virginia Sec. 2.2‐4501 through 2.2‐4513 authorizes the County to invest in obligations of the United States or agencies thereof; obligations of the Commonwealth or political subdivisions thereof; obligations of other states not in default; obligations of the International Bank for Reconstruction and Development (World Bank); the Asian Development Bank, the African Development Bank; “prime quality” commercial paper; negotiable certificates of deposits, negotiable bank notes and corporate notes rated AA or better by Standard & Poor’s, Inc. and Aa or better by Moody's Investors Service, Inc.; banker's acceptances; overnight, term and open repurchase agreements; money market mutual funds; the State Treasurer's Local Government Investment Pool (LGIP) and State Non‐Arbitrage Program (SNAP). However, in some instances, the County’s own investment policy is more stringent as to authorized investments as discussed below. Certain bond covenants require that the County’s bond proceeds be invested in accordance with the Code of Virginia requirements or the County’s own investment policy or as specified in the bond covenants themselves. The County invests in an externally managed investment pool, the LGIP, which is not SEC‐registered. Pursuant to Sec. 2.1‐234.7 of the Code of Virginia, the Treasury Board of the Commonwealth sponsors the LGIP and has delegated certain functions to the State Treasurer. The LGIP reports to the Treasury Board at their regularly scheduled monthly meetings, and the fair value of the position in the LGIP is the same as the value of the pool shares. Investments authorized for the LGIP are the same as those authorized for local governments in Sec. 2.2‐4501 thru‐2.2‐4513 of the Code of Virginia. In accordance with State Corporation Commission of Virginia (SCC) Regulations for the licensing of the Prince William County Self‐Insurance Group Workers' Compensation Association and Casualty Pool, the Association and the Pool are required to deposit securities with the State Treasurer. As of June 30, 2013, the Self‐Insurance Workers’ Compensation Association had $983, at fair value, in a Federal National Mortgage Association bond deposited with the State Treasurer to comply with the
71
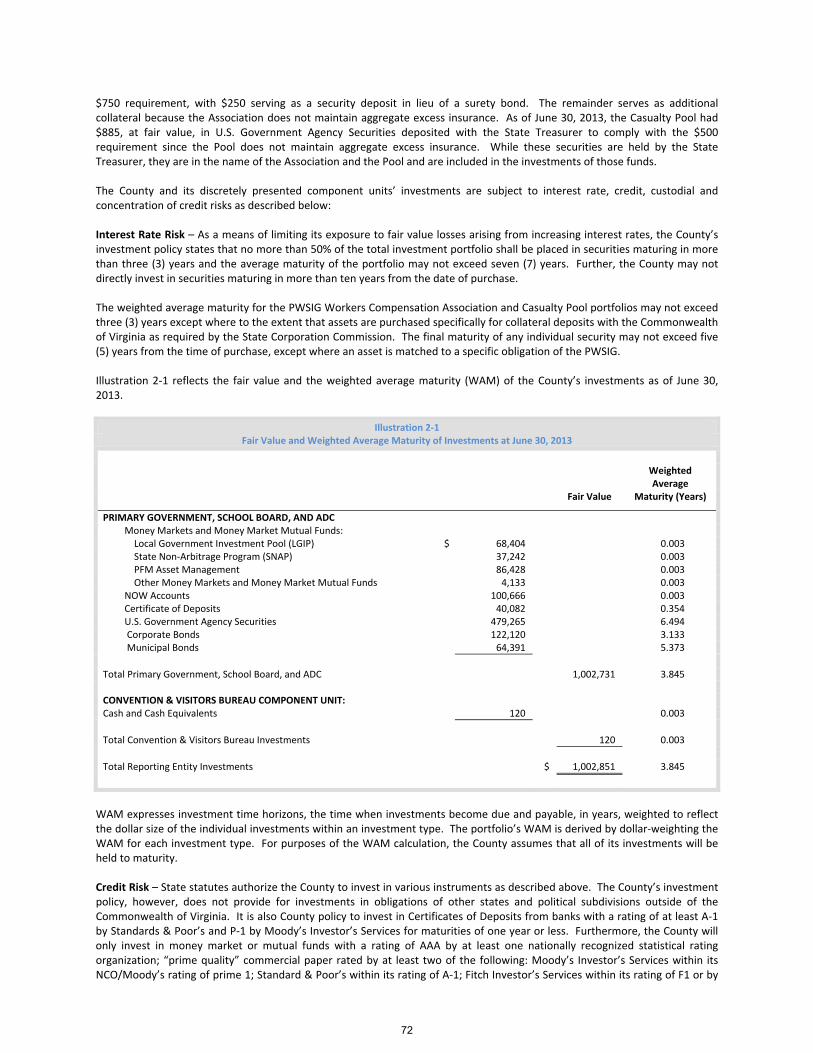
$750 requirement, with $250 serving as a security deposit in lieu of a surety bond. The remainder serves as additional collateral because the Association does not maintain aggregate excess insurance. As of June 30, 2013, the Casualty Pool had $885, at fair value, in U.S. Government Agency Securities deposited with the State Treasurer to comply with the $500 requirement since the Pool does not maintain aggregate excess insurance. While these securities are held by the State Treasurer, they are in the name of the Association and the Pool and are included in the investments of those funds. The County and its discretely presented component units’ investments are subject to interest rate, credit, custodial and concentration of credit risks as described below: Interest Rate Risk – As a means of limiting its exposure to fair value losses arising from increasing interest rates, the County’s investment policy states that no more than 50% of the total investment portfolio shall be placed in securities maturing in more than three (3) years and the average maturity of the portfolio may not exceed seven (7) years. Further, the County may not directly invest in securities maturing in more than ten years from the date of purchase. The weighted average maturity for the PWSIG Workers Compensation Association and Casualty Pool portfolios may not exceed three (3) years except where to the extent that assets are purchased specifically for collateral deposits with the Commonwealth of Virginia as required by the State Corporation Commission. The final maturity of any individual security may not exceed five (5) years from the time of purchase, except where an asset is matched to a specific obligation of the PWSIG. Illustration 2‐1 reflects the fair value and the weighted average maturity (WAM) of the County’s investments as of June 30, 2013.
Illustration 2‐1 Fair Value and Weighted Average Maturity of Investments at June 30, 2013
Weighted
Average Fair Value Maturity (Years)
PRIMARY GOVERNMENT, SCHOOL BOARD, AND ADC Money Markets and Money Market Mutual Funds: Local Government Investment Pool (LGIP) $ 68,404 0.003 State Non‐Arbitrage Program (SNAP) 37,242 0.003 PFM Asset Management 86,428 0.003 Other Money Markets and Money Market Mutual Funds 4,133 0.003 NOW Accounts 100,666 0.003 Certificate of Deposits 40,082 0.354 U.S. Government Agency Securities 479,265 6.494 Corporate Bonds 122,120 3.133 Municipal Bonds 64,391 5.373
Total Primary Government, School Board, and ADC 1,002,731 3.845 CONVENTION & VISITORS BUREAU COMPONENT UNIT: Cash and Cash Equivalents 120 0.003
Total Convention & Visitors Bureau Investments 120 0.003
Total Reporting Entity Investments $ 1,002,851 3.845
WAM expresses investment time horizons, the time when investments become due and payable, in years, weighted to reflect the dollar size of the individual investments within an investment type. The portfolio’s WAM is derived by dollar‐weighting the WAM for each investment type. For purposes of the WAM calculation, the County assumes that all of its investments will be held to maturity. Credit Risk – State statutes authorize the County to invest in various instruments as described above. The County’s investment policy, however, does not provide for investments in obligations of other states and political subdivisions outside of the Commonwealth of Virginia. It is also County policy to invest in Certificates of Deposits from banks with a rating of at least A‐1 by Standards & Poor’s and P‐1 by Moody’s Investor’s Services for maturities of one year or less. Furthermore, the County will only invest in money market or mutual funds with a rating of AAA by at least one nationally recognized statistical rating organization; “prime quality” commercial paper rated by at least two of the following: Moody’s Investor’s Services within its NCO/Moody’s rating of prime 1; Standard & Poor’s within its rating of A‐1; Fitch Investor’s Services within its rating of F1 or by
72

their corporate successors, provided that at the time of any such investment the issuing corporation has a net worth of at least $50,000 and the net income of the issuing corporation has averaged $3,000 per year for the previous five years and all existing senior bonded indebtedness of the issuer is rated AAA or its equivalent by at least two of the following: Moody’s Investor’s Services, Standard & Poor’s or Fitch Investor’s Services; and domestic and foreign banker’s acceptances provided that the bank’s assets exceed $500,000 or $1,000,000, respectively. County policy exempts investments in the SNAP and other money market funds in which the County invests pursuant to bond documents from its rating requirements. It is PWSIG policy to invest in obligations issued or guaranteed by the U.S. government, an agency thereof, or U.S. Government Sponsored Enterprises (GSEs); repurchase agreements collateralized by obligations issued or guaranteed by the U.S. Government, an agency thereof, or GSEs; non‐negotiable certificates of deposit and time deposits of Virginia banks and savings institutions federally insured to the maximum extent possible and collateralized under the Virginia Security for Public Deposits Act; negotiable certificates of deposit and negotiable bank deposit notes of domestic banks and domestic offices of foreign banks with a rating of not lower than P‐1 by Moody’s Investor’s Services and A‐1 by Standard and Poor’s; bankers acceptances with major U.S. banks and domestic offices of international banks with a rating of not lower than Aaa by Moody’s Investor’s Service and AAA by Standard & Poor’s; commercial paper issued by domestic corporations rated not lower than P‐1 by Moody’s Investor’s Services and A‐1 by Standard & Poors; short‐term corporate notes of domestic corporations with a minimum rating of Aaa by Moody’s Investor’s Services and AAA by Standard & Poor’s or short‐term ratings of P‐1 and A‐1 respectively; all money market, mutual funds or the LGIP with a minimum credit rating of AAA by at least one nationally recognized statistical rating organization and all GSEs with a minimum rating of AAA by at least one nationally recognized statistical rating organization. During the year, the County made investments in money market mutual funds, LGIP, SNAP, PFM Asset Management, U.S. Government Agency Securities, NOW Accounts, Certificates of Deposit, Corporate Bonds, and Municipal Bonds. The County’s investment ratings as of June 30, 2013 are presented in Illustration 2‐2.
Illustration 2‐2 County, School Board, and ADC, Investment Credit Risk at June 30, 2013
Investment Type
Credit Quality (Rating)
Credit Exposure as a % of Total Investments
Money Markets and Money Market Mutual Funds: Local Government Investment Pool (LGIP) AAA 6.82% State Non‐Arbitrage Program(SNAP) AAA 3.71% PFM Asset management AAA 8.62% Other Money Markets and Money Market Mutual Funds AAA 0.41% NOW Accounts Not applicable 10.04% Certificate of Deposits Not applicable 4.00% U.S. Government Agency Securities: FNMA, FHLB, FFCB and FHLMC Agency Notes AA+ 47.80% Corporate Bonds: AA‐ or Higher 12.18% Municipal Bonds: AA‐ or Higher 6.42%
100.00%
Custodial Credit Risk – Custodial risk is the risk that in the event of the failure of the counter party, the County will not be able to recover the value of its investments or collateral securities that are in the possession of an outside party. However, the County’s investment policy requires that all securities purchased by the County be properly and clearly labeled as an asset of Prince William County and held in safekeeping by a third party custodial bank or institution in compliance with Section 2.2‐4515 of the Code of Virginia. Therefore, the County has no custodial credit risk. Concentration of Credit Risk – To minimize credit risk, the County’s investment policy seeks to diversify its portfolio by limiting the percentage of the portfolio that may be invested in any one type of instrument at the time of purchase as follows: 35% for “prime quality” commercial paper (not to exceed 5% in the debt of any one issuer); 20% for corporate notes (not to exceed 5% for any one issuer); 40% for banker’s acceptances (not to exceed 5% for any one issuer); 10% for U.S. Treasury Certificates; 40% for certificates of deposit (not to exceed 15% for any one issuer); 100% for U.S. Agency Obligations (not to exceed 25% for any one agency); 60% for money market funds (not to exceed 20% in any one money market fund); 30% for repurchase agreements (not to exceed 30% with the County’s primary bank and 10% with any other institution/dealer) and up to 100% for U.S. Government Obligations (not to exceed 25% for any one issuer). The PWSIG investment policy seeks to diversify its portfolio by security type and by issuer by limiting the percentage of the portfolio that may be invested at the time of purchase in any one type of instrument as follows:
73
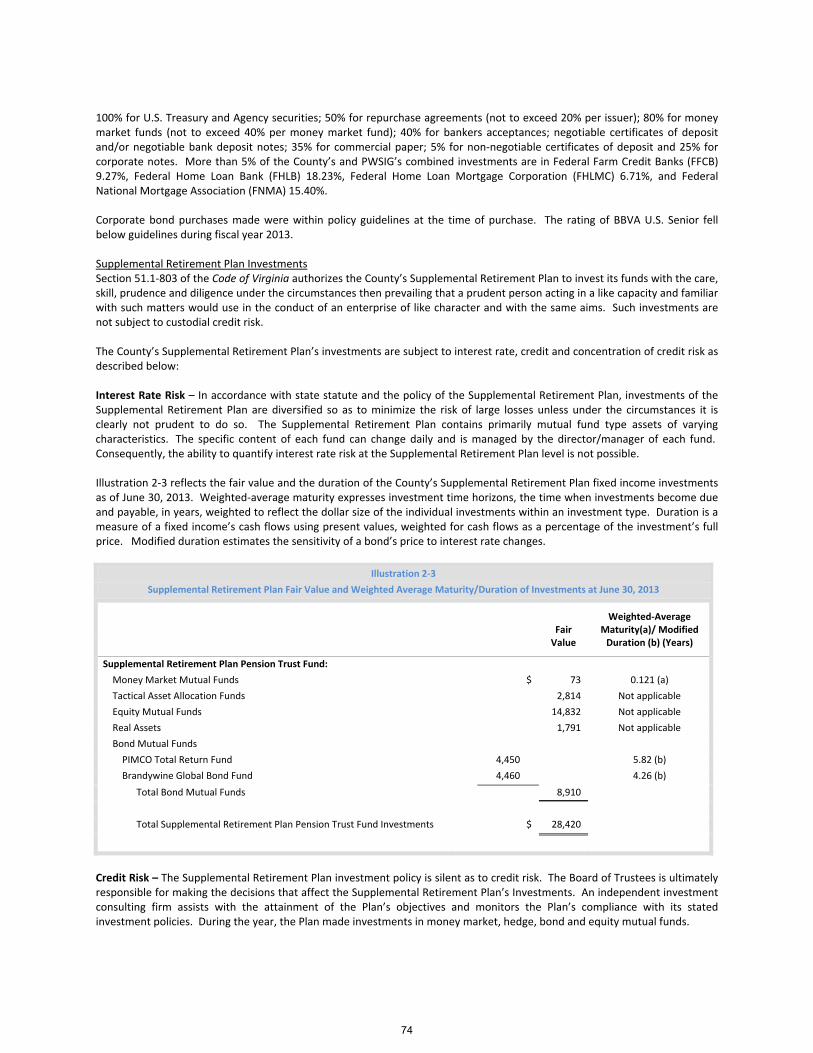
100% for U.S. Treasury and Agency securities; 50% for repurchase agreements (not to exceed 20% per issuer); 80% for money market funds (not to exceed 40% per money market fund); 40% for bankers acceptances; negotiable certificates of deposit and/or negotiable bank deposit notes; 35% for commercial paper; 5% for non‐negotiable certificates of deposit and 25% for corporate notes. More than 5% of the County’s and PWSIG’s combined investments are in Federal Farm Credit Banks (FFCB) 9.27%, Federal Home Loan Bank (FHLB) 18.23%, Federal Home Loan Mortgage Corporation (FHLMC) 6.71%, and Federal National Mortgage Association (FNMA) 15.40%. Corporate bond purchases made were within policy guidelines at the time of purchase. The rating of BBVA U.S. Senior fell below guidelines during fiscal year 2013. Supplemental Retirement Plan Investments Section 51.1‐803 of the Code of Virginia authorizes the County’s Supplemental Retirement Plan to invest its funds with the care, skill, prudence and diligence under the circumstances then prevailing that a prudent person acting in a like capacity and familiar with such matters would use in the conduct of an enterprise of like character and with the same aims. Such investments are not subject to custodial credit risk. The County’s Supplemental Retirement Plan’s investments are subject to interest rate, credit and concentration of credit risk as described below: Interest Rate Risk – In accordance with state statute and the policy of the Supplemental Retirement Plan, investments of the Supplemental Retirement Plan are diversified so as to minimize the risk of large losses unless under the circumstances it is clearly not prudent to do so. The Supplemental Retirement Plan contains primarily mutual fund type assets of varying characteristics. The specific content of each fund can change daily and is managed by the director/manager of each fund. Consequently, the ability to quantify interest rate risk at the Supplemental Retirement Plan level is not possible. Illustration 2‐3 reflects the fair value and the duration of the County’s Supplemental Retirement Plan fixed income investments as of June 30, 2013. Weighted‐average maturity expresses investment time horizons, the time when investments become due and payable, in years, weighted to reflect the dollar size of the individual investments within an investment type. Duration is a measure of a fixed income’s cash flows using present values, weighted for cash flows as a percentage of the investment’s full price. Modified duration estimates the sensitivity of a bond’s price to interest rate changes.
Illustration 2‐3
Supplemental Retirement Plan Fair Value and Weighted Average Maturity/Duration of Investments at June 30, 2013
Fair Weighted‐Average
Maturity(a)/ Modified Value Duration (b) (Years)
Supplemental Retirement Plan Pension Trust Fund:
Money Market Mutual Funds $ 73 0.121 (a)
Tactical Asset Allocation Funds 2,814 Not applicable
Equity Mutual Funds 14,832 Not applicable
Real Assets 1,791 Not applicable
Bond Mutual Funds
PIMCO Total Return Fund 4,450 5.82 (b)
Brandywine Global Bond Fund 4,460 4.26 (b)
Total Bond Mutual Funds 8,910
Total Supplemental Retirement Plan Pension Trust Fund Investments $ 28,420
Credit Risk – The Supplemental Retirement Plan investment policy is silent as to credit risk. The Board of Trustees is ultimately responsible for making the decisions that affect the Supplemental Retirement Plan’s Investments. An independent investment consulting firm assists with the attainment of the Plan’s objectives and monitors the Plan’s compliance with its stated investment policies. During the year, the Plan made investments in money market, hedge, bond and equity mutual funds.
74
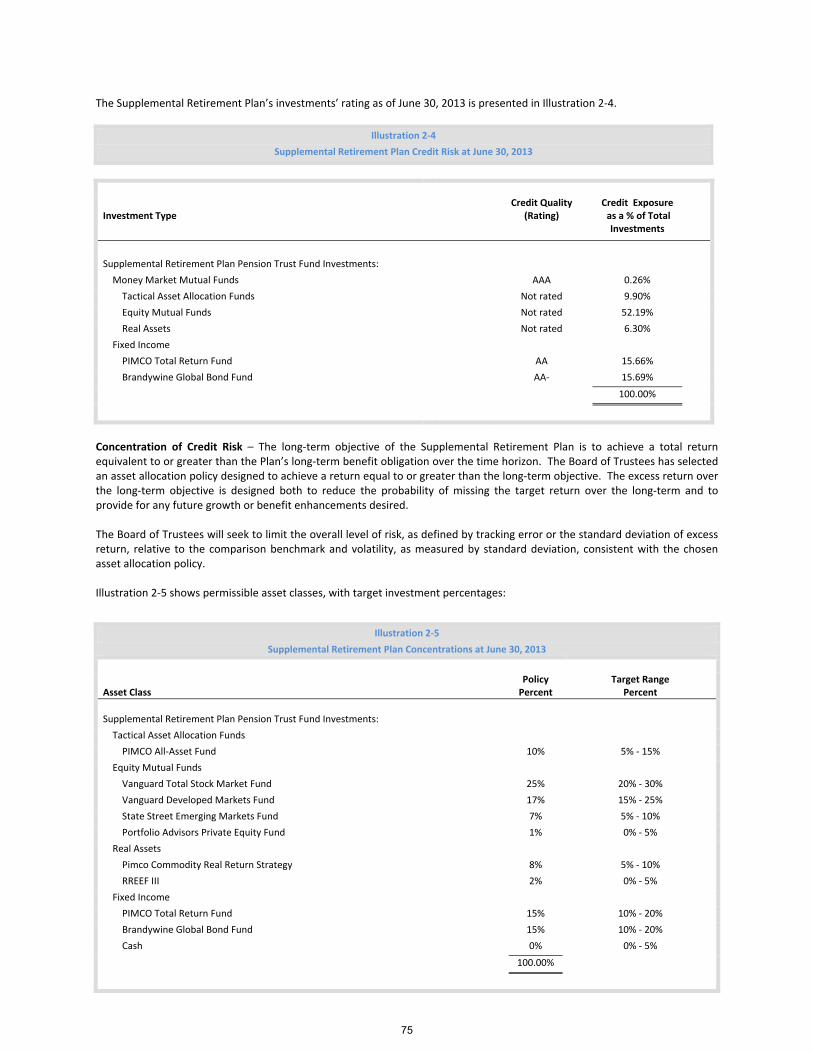
The Supplemental Retirement Plan’s investments’ rating as of June 30, 2013 is presented in Illustration 2‐4.
Illustration 2‐4
Supplemental Retirement Plan Credit Risk at June 30, 2013
Investment Type Credit Quality
(Rating) Credit Exposure as a % of Total Investments
Supplemental Retirement Plan Pension Trust Fund Investments:
Money Market Mutual Funds AAA 0.26%
Tactical Asset Allocation Funds Not rated 9.90%
Equity Mutual Funds Not rated 52.19%
Real Assets Not rated 6.30%
Fixed Income
PIMCO Total Return Fund AA 15.66%
Brandywine Global Bond Fund AA‐ 15.69%
100.00%
Concentration of Credit Risk – The long‐term objective of the Supplemental Retirement Plan is to achieve a total return equivalent to or greater than the Plan’s long‐term benefit obligation over the time horizon. The Board of Trustees has selected an asset allocation policy designed to achieve a return equal to or greater than the long‐term objective. The excess return over the long‐term objective is designed both to reduce the probability of missing the target return over the long‐term and to provide for any future growth or benefit enhancements desired.
The Board of Trustees will seek to limit the overall level of risk, as defined by tracking error or the standard deviation of excess return, relative to the comparison benchmark and volatility, as measured by standard deviation, consistent with the chosen asset allocation policy.
Illustration 2‐5 shows permissible asset classes, with target investment percentages:
Illustration 2‐5
Supplemental Retirement Plan Concentrations at June 30, 2013
Asset Class Policy Percent
Target Range Percent
Supplemental Retirement Plan Pension Trust Fund Investments:
Tactical Asset Allocation Funds
PIMCO All‐Asset Fund 10% 5% ‐ 15%
Equity Mutual Funds
Vanguard Total Stock Market Fund 25% 20% ‐ 30%
Vanguard Developed Markets Fund 17% 15% ‐ 25%
State Street Emerging Markets Fund 7% 5% ‐ 10%
Portfolio Advisors Private Equity Fund 1% 0% ‐ 5%
Real Assets
Pimco Commodity Real Return Strategy 8% 5% ‐ 10%
RREEF III 2% 0% ‐ 5%
Fixed Income
PIMCO Total Return Fund 15% 10% ‐ 20%
Brandywine Global Bond Fund 15% 10% ‐ 20%
Cash 0% 0% ‐ 5%
100.00%
75
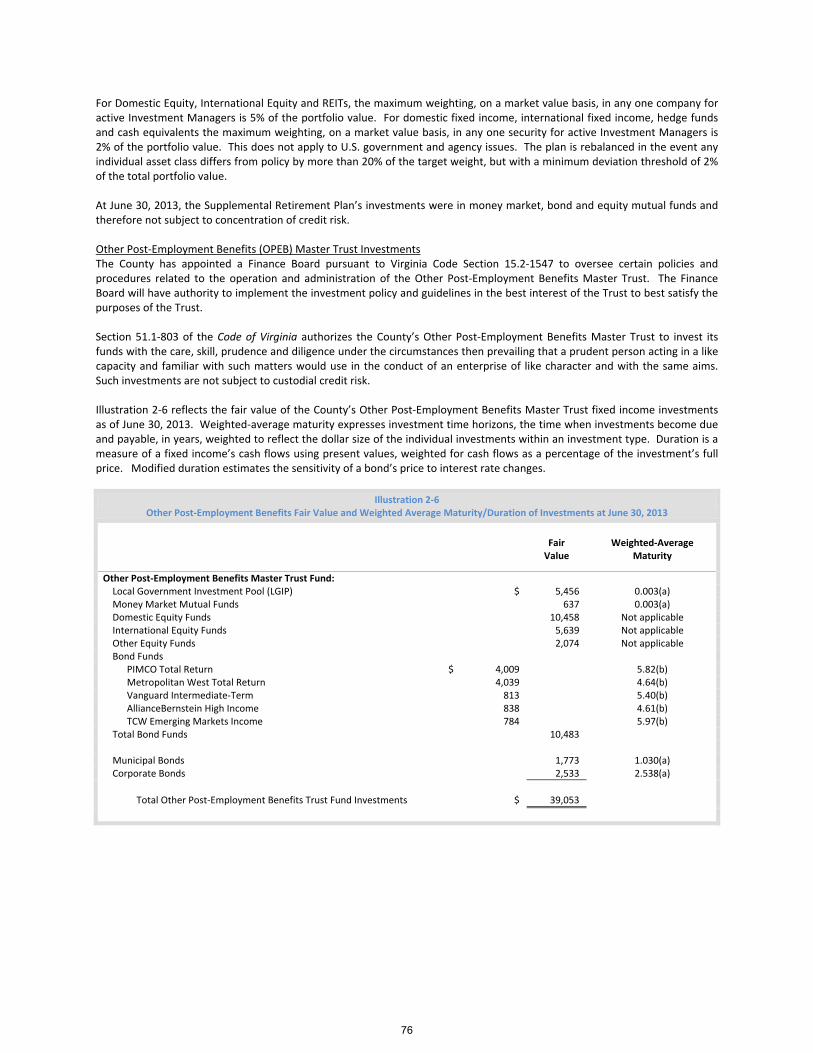
For Domestic Equity, International Equity and REITs, the maximum weighting, on a market value basis, in any one company for active Investment Managers is 5% of the portfolio value. For domestic fixed income, international fixed income, hedge funds and cash equivalents the maximum weighting, on a market value basis, in any one security for active Investment Managers is 2% of the portfolio value. This does not apply to U.S. government and agency issues. The plan is rebalanced in the event any individual asset class differs from policy by more than 20% of the target weight, but with a minimum deviation threshold of 2% of the total portfolio value. At June 30, 2013, the Supplemental Retirement Plan’s investments were in money market, bond and equity mutual funds and therefore not subject to concentration of credit risk. Other Post‐Employment Benefits (OPEB) Master Trust Investments The County has appointed a Finance Board pursuant to Virginia Code Section 15.2‐1547 to oversee certain policies and procedures related to the operation and administration of the Other Post‐Employment Benefits Master Trust. The Finance Board will have authority to implement the investment policy and guidelines in the best interest of the Trust to best satisfy the purposes of the Trust. Section 51.1‐803 of the Code of Virginia authorizes the County’s Other Post‐Employment Benefits Master Trust to invest its funds with the care, skill, prudence and diligence under the circumstances then prevailing that a prudent person acting in a like capacity and familiar with such matters would use in the conduct of an enterprise of like character and with the same aims. Such investments are not subject to custodial credit risk. Illustration 2‐6 reflects the fair value of the County’s Other Post‐Employment Benefits Master Trust fixed income investments as of June 30, 2013. Weighted‐average maturity expresses investment time horizons, the time when investments become due and payable, in years, weighted to reflect the dollar size of the individual investments within an investment type. Duration is a measure of a fixed income’s cash flows using present values, weighted for cash flows as a percentage of the investment’s full price. Modified duration estimates the sensitivity of a bond’s price to interest rate changes.
Illustration 2‐6 Other Post‐Employment Benefits Fair Value and Weighted Average Maturity/Duration of Investments at June 30, 2013
Fair Weighted‐Average Value Maturity
Other Post‐Employment Benefits Master Trust Fund: Local Government Investment Pool (LGIP) $ 5,456 0.003(a) Money Market Mutual Funds 637 0.003(a) Domestic Equity Funds 10,458 Not applicable International Equity Funds 5,639 Not applicable Other Equity Funds 2,074 Not applicable Bond Funds PIMCO Total Return $ 4,009 5.82(b) Metropolitan West Total Return 4,039 4.64(b) Vanguard Intermediate‐Term 813 5.40(b) AllianceBernstein High Income 838 4.61(b) TCW Emerging Markets Income 784 5.97(b) Total Bond Funds 10,483 Municipal Bonds 1,773 1.030(a) Corporate Bonds 2,533 2.538(a)
Total Other Post‐Employment Benefits Trust Fund Investments $ 39,053
76
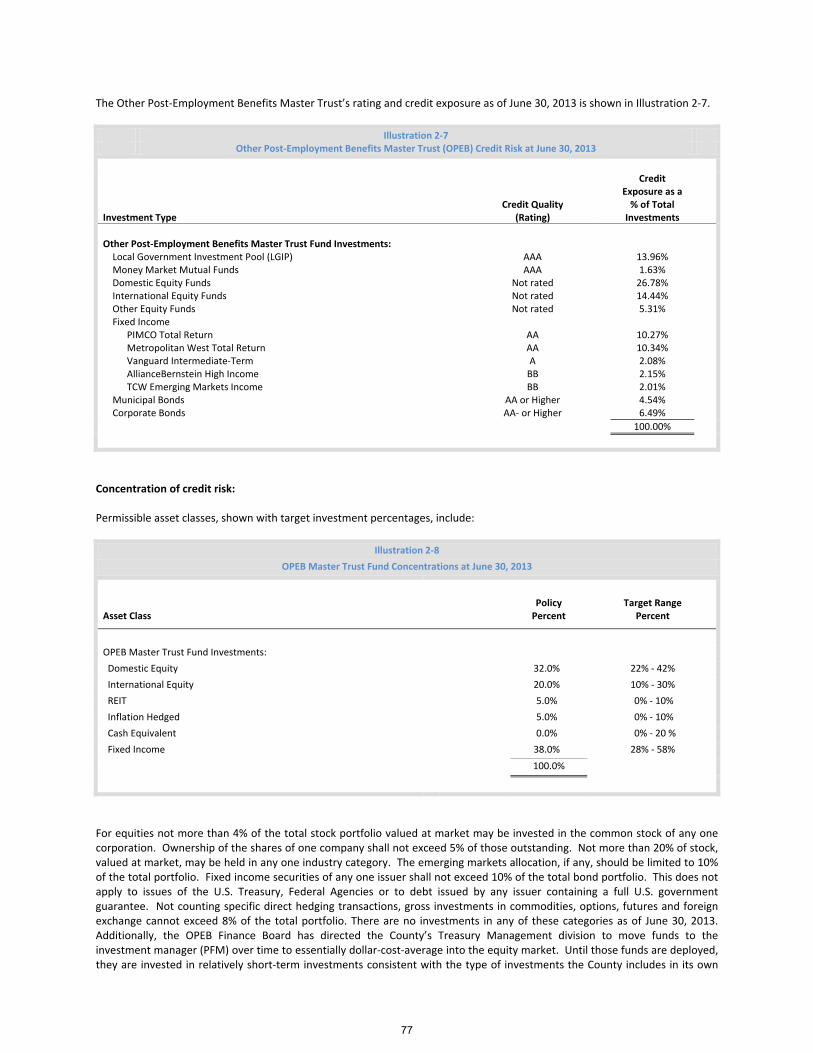
The Other Post‐Employment Benefits Master Trust’s rating and credit exposure as of June 30, 2013 is shown in Illustration 2‐7.
Illustration 2‐7 Other Post‐Employment Benefits Master Trust (OPEB) Credit Risk at June 30, 2013
Investment Type Credit Quality
(Rating)
Credit Exposure as a % of Total Investments
Other Post‐Employment Benefits Master Trust Fund Investments: Local Government Investment Pool (LGIP) AAA 13.96% Money Market Mutual Funds AAA 1.63% Domestic Equity Funds Not rated 26.78% International Equity Funds Not rated 14.44% Other Equity Funds Not rated 5.31% Fixed Income
PIMCO Total Return AA 10.27%Metropolitan West Total Return AA 10.34%Vanguard Intermediate‐Term A 2.08%AllianceBernstein High Income BB 2.15%TCW Emerging Markets Income BB 2.01%
Municipal Bonds AA or Higher 4.54% Corporate Bonds AA‐ or Higher 6.49%
100.00%
Concentration of credit risk:
Permissible asset classes, shown with target investment percentages, include:
Illustration 2‐8
OPEB Master Trust Fund Concentrations at June 30, 2013
Asset Class Policy Percent
Target Range Percent
OPEB Master Trust Fund Investments:
Domestic Equity 32.0% 22% ‐ 42%
International Equity 20.0% 10% ‐ 30%
REIT 5.0% 0% ‐ 10%
Inflation Hedged 5.0% 0% ‐ 10%
Cash Equivalent 0.0% 0% ‐ 20 %
Fixed Income 38.0% 28% ‐ 58%
100.0%
For equities not more than 4% of the total stock portfolio valued at market may be invested in the common stock of any one corporation. Ownership of the shares of one company shall not exceed 5% of those outstanding. Not more than 20% of stock, valued at market, may be held in any one industry category. The emerging markets allocation, if any, should be limited to 10% of the total portfolio. Fixed income securities of any one issuer shall not exceed 10% of the total bond portfolio. This does not apply to issues of the U.S. Treasury, Federal Agencies or to debt issued by any issuer containing a full U.S. government guarantee. Not counting specific direct hedging transactions, gross investments in commodities, options, futures and foreign exchange cannot exceed 8% of the total portfolio. There are no investments in any of these categories as of June 30, 2013. Additionally, the OPEB Finance Board has directed the County’s Treasury Management division to move funds to the investment manager (PFM) over time to essentially dollar‐cost‐average into the equity market. Until those funds are deployed, they are invested in relatively short‐term investments consistent with the type of investments the County includes in its own
77

portfolio. At June 30, 2013, the OPEB Master Trust Fund’s investments were in money market, bond and equity mutual funds and therefore not subject to concentration of credit risk. Reconciliation of Cash and Investments Reconciliation of total cash and investments to the entity‐wide financial statements at June 30, 2013 is shown in Illustration 2‐9.
Illustration 2‐9 Reconciliation of Cash and Investments to Entity‐Wide Financial Statements at June 30, 2013
Total Primary Government and Component Units $ 1,002,851Supplemental Retirement System Pension Trust Fund 28,420Other Post‐Employment Benefits (OPEB) Master Trust 39,053
Total Investments 1,070,324 Add: Cash on Hand 62 Deposits 7,645
Total Cash and Investments 1,078,031 Less: Supplemental Retirement System Pension Trust Fund’s cash and investments (28,706) OPEB cash and investments (39,056) Private Purpose Trust Funds (736) Agency Funds’ equity in pooled cash and investments (615) School Board Agency Funds’ cash and investments (9,948)
Total Reporting Entity Cash and Investments $ 998,970
Governmental Business‐
Type
Component Total
Reporting Activities Activities Total Units Entity
Primary Government: Equity in Pooled Cash and Investments $ 662,292 10,738 673,030 250,704 923,734 Investments 22,137 ‐‐ 22,137 ‐‐ 22,137 Restricted Cash and Temporary Investments
16,029
13,113
29,142
22,707
51,849
Restricted Investments 1,250 ‐‐ 1,250 ‐‐ 1,250
Total Cash and Investments $ 701,708 23,851 725,559 273,411 998,970
Restricted cash and investments consist of amounts required by bond financing terms to be segregated in a debt service reserve account, a closure fund required by the Virginia Resource Authority (VRA) for the Landfill, capitalized interest accounts required to be used for debt service, unspent debt proceeds required to be used for capital projects, and retainages as depicted in Illustration 2‐10.
78

Illustration 2‐10 Restricted Cash and Investments at June 30, 2013
Restricted
Cash &
Temporary Restricted Investments Investments
PRIMARY GOVERNMENT General Fund: IDA Lease Revenue Bonds $ 1,092 $ ‐‐
Total General Fund 1,092 ‐‐
Capital Projects Funds: General Obligation Bonds 11,853 ‐‐ VRA Lease Revenue Bonds 2,681 ‐‐ Retainages 403 ‐‐
Total Capital Projects Funds 14,937 ‐‐
Enterprise Funds: VRA Closure Fund 12,483 ‐‐ Parks & Recreation 460 ‐‐ Retainages 170 ‐‐
Total Enterprise Funds 13,113 ‐‐
Internal Service Funds: Insurance Pool Collateral ‐‐ 1,250
Total Internal Service Funds ‐‐ 1,250
Total Primary Government 29,142 1,250
COMPONENT UNIT School Board: School Bonds 22,707 ‐‐
Total School Board 22,707 ‐‐
Total Reporting Entity $ 51,849 $ 1,250
NOTE (3) ‐ PROPERTY TAXES RECEIVABLE The County's real estate and personal property taxes are levied each July 1, on the assessed value as of the prior January 1, for all property located in the County. Real estate taxes are due in two installments on July 15 and December 5 and personal property taxes are due on October 5. After October 5, personal property taxes are due 30 days following the levy date until the end of the fiscal year. Penalties and interest are assessed on taxes not paid by the due dates. Property tax levies are recorded as receivables and revenue, net of allowance for estimated uncollectibles on the payment due dates. Property taxes due, but not collected within 60 days after fiscal year‐end, are reflected as unearned revenues. Assessed values are established at 100% of appraised market value. The personal property tax is limited to vehicles and all business property. A valuation of all property is completed annually. The assessed value of real and personal property at January 1, 2012, upon which the July 1, 2012, levy was based, was approximately $46 billion. Current real estate and personal property tax collections for the year ended June 30, 2013, were 99.6% and 97.5%, respectively of the July 1, 2012, tax levy. Real property taxes attach an enforceable lien on property if not paid on the due date. Personal property taxes must be paid before the County vehicle license can be issued. Collections received on or before June 30, 2013, related to property taxes due on July 15 of the following fiscal year are recorded as unearned revenues at June 30, 2013.
79

The County calculates its allowance for uncollectible accounts using historical collection data. Taxes receivable as of June 30, 2013, is detailed in Illustration 3‐1.
Illustration 3‐1
Property Taxes Receivable at June 30, 2013
Allowance for
Gross Tax Receivable Uncollectible Accounts Net Tax Receivable
Real estate taxes $ 5,002 2,640 2,362
Personal property taxes 5,960 4,345 1,615
Total $ 10,962 6,985 3,977
NOTE (4) – UNEARNED REVENUE
Unearned revenue consists of two components: unearned revenue and unavailable revenue. Unearned revenue, as shown in Illustration 4‐1, represents amounts for which asset recognition criteria were met, but for which revenue recognition criteria were not met.
Illustration 4‐1 Unearned Revenue at June 30, 2013
PRIMARY GOVERNMENT Unearned Lease Revenues – amounts due in connection with direct financing leases $ 4,826
Prepaid Taxes – Taxes due subsequent to June 30, 2013, but paid in advance by taxpayers 203,715
Other Unearned Revenue – Prepaid recreation fees, developer fees, health premiums, and other unearned revenue 36,056
Total Primary Government 244,597
COMPONENT UNIT School Board 9,428
Total Reporting Entity $ 254,025
Unavailable revenue, as shown in Illustration 4‐2, represents amounts for which asset recognition criteria and revenue recognition criteria were met, but which were not available to finance expenditures of the current period under the modified accrual basis of accounting.
Illustration 4‐2 Unavailable Revenue at June 30, 2013
PRIMARY GOVERNMENT Unearned Taxes – Uncollected tax billings not available to fund current expenditures $ 2,829
Unearned Lease Revenues – Uncollected revenues associated with direct financing leases 16,928
Total Reporting Entity $ 19,757
80

NOTE (5) – INVESTMENT IN DIRECT FINANCING LEASES/ACCOUNTS RECEIVABLE
The County has investments in direct financing leases, consisting of financing arrangements with various volunteer fire & rescue companies and other organizations operating within the County. Under the terms of these financing arrangements, the County obtains leasehold interests in specific properties, and uses those leasehold interests as collateral to obtain financing. The County uses the proceeds from these financings to reimburse the organizations for capital expenses related to the renovation or construction of facilities. In separate‐but‐related agreements, the County subleases the original leasehold interests and any existing and future improvements back to the organizations; each sublease contains a clause which transfers title of the properties, as well as any existing and future improvements of the properties back to each respective organization at the time the related debt is fully extinguished.
Illustration 5‐1 shows the investment in direct financing leases.
Illustration 5‐1 Investment in Direct Financing Leases at June 30, 2013
Volunteer Fire & Rescue
Companies Other Total
Total minimum lease payments to be received $ 18,784 2,970 21,754Less: Unearned revenue 4,518 308 4,826
Net investment in direct financing leases $ 14,266 2,662 16,928
Illustration 5‐2 shows the scheduled minimum lease payments as of June 30, 2013.
Illustration 5‐2 Scheduled Minimum Lease Payments at June 30, 2013
Volunteer Fire & Rescue
Companies Other Total
FY 2014 $ 1,756 636 2,392FY 2015 1,720 636 2,356FY 2016 1,682 636 2,318FY 2017 1,640 636 2,276FY 2018 1,587 426 2,013Thereafter 10,399 ‐‐ 10,399
Total minimum lease payments $ 18,784 2,970 21,754
Accounts receivable, as shown in Illustration 5‐3, are recorded at gross value except for enterprise operations which are recorded net of allowance for uncollectible accounts.
Illustration 5‐3 Accounts Receivable at June 30, 2013
Component Units
Primary Government
SchoolBoard ADC
Convention & Visitors
Bureau Total
Accrued interest $ 1,619 ‐‐ ‐‐ ‐‐ 1,619Enterprise operations (net) 316 ‐‐ ‐‐ ‐‐ 316Utility/Consumption taxes 1,870 ‐‐ ‐‐ ‐‐ 1,870Transient occupancy taxes 886 ‐‐ ‐‐ ‐‐ 886Stormwater management fee 87 ‐‐ ‐‐ ‐‐ 87Cable franchise tax 311 ‐‐ ‐‐ ‐‐ 311Premiums due from participants 2,615 ‐‐ ‐‐ ‐‐ 2,615Other 2,539 2,066 27 3 4,635
Total $ 10,243 2,066 27 3 12,339
81
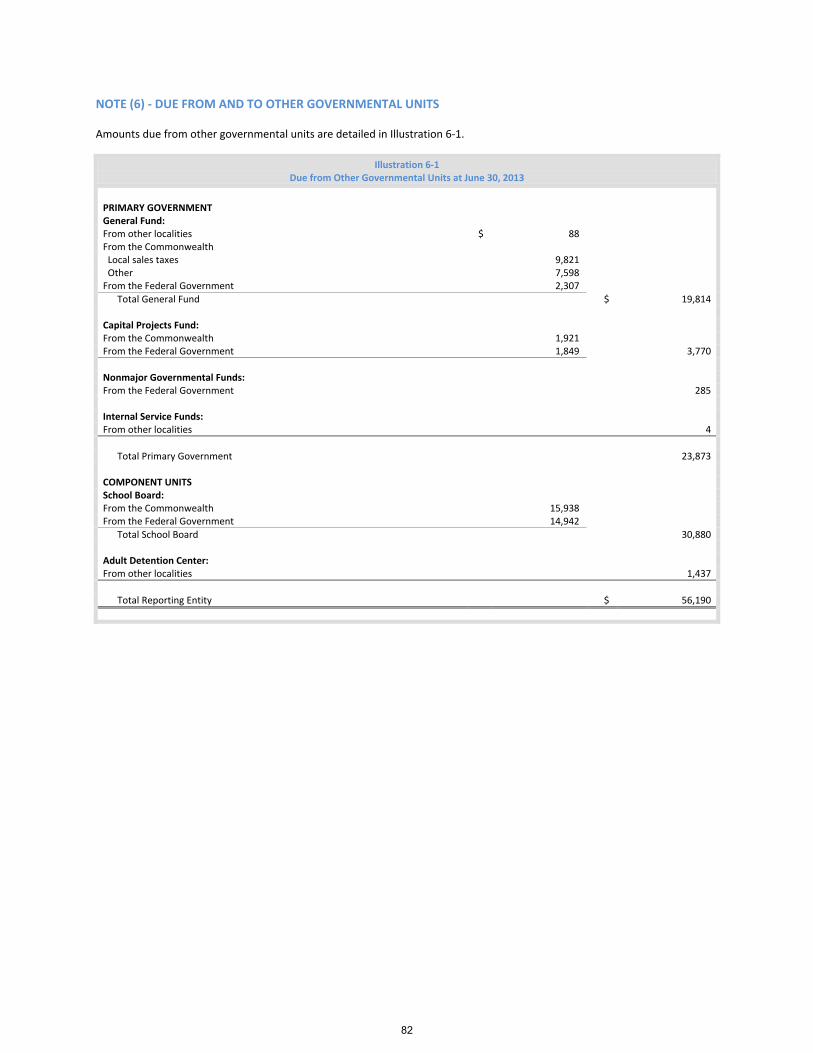
NOTE (6) ‐ DUE FROM AND TO OTHER GOVERNMENTAL UNITS Amounts due from other governmental units are detailed in Illustration 6‐1.
Illustration 6‐1 Due from Other Governmental Units at June 30, 2013
PRIMARY GOVERNMENT General Fund: From other localities $ 88 From the Commonwealth Local sales taxes 9,821 Other 7,598 From the Federal Government 2,307
Total General Fund $ 19,814 Capital Projects Fund: From the Commonwealth 1,921 From the Federal Government 1,849 3,770
Nonmajor Governmental Funds: From the Federal Government 285 Internal Service Funds: From other localities 4
Total Primary Government 23,873 COMPONENT UNITS School Board: From the Commonwealth 15,938 From the Federal Government 14,942
Total School Board 30,880 Adult Detention Center: From other localities 1,437
Total Reporting Entity $ 56,190
82
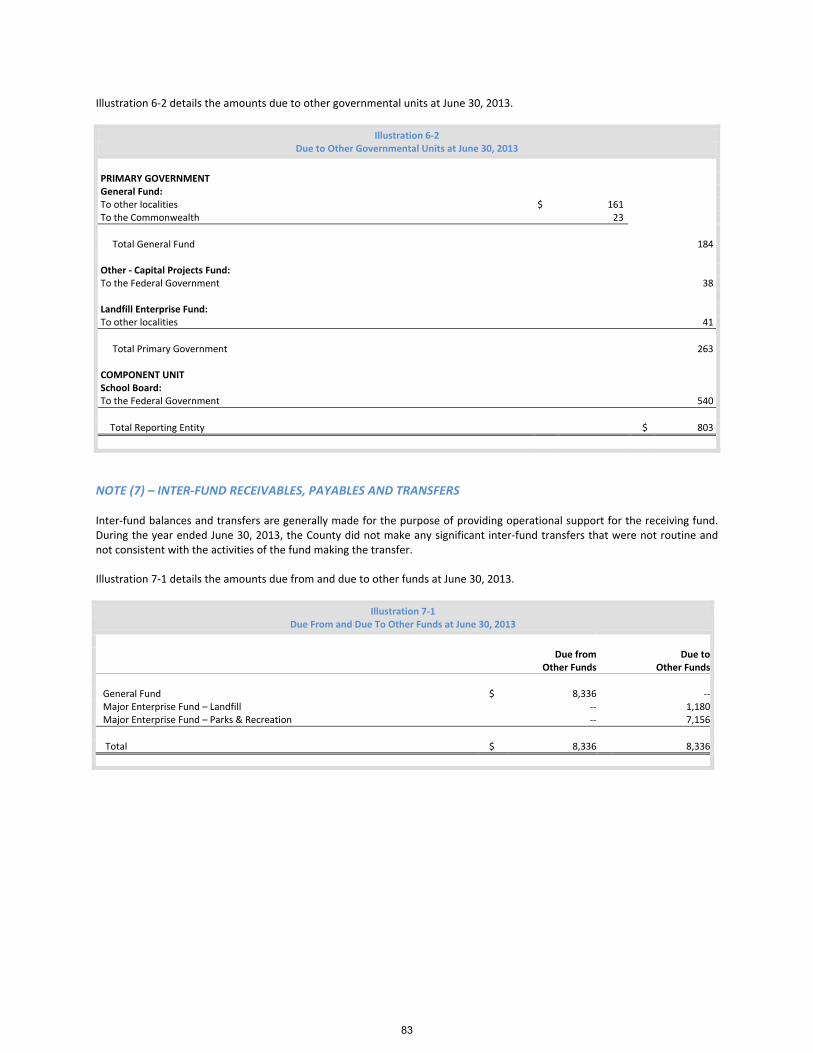
Illustration 6‐2 details the amounts due to other governmental units at June 30, 2013.
Illustration 6‐2 Due to Other Governmental Units at June 30, 2013
PRIMARY GOVERNMENT General Fund: To other localities $ 161 To the Commonwealth 23
Total General Fund 184 Other ‐ Capital Projects Fund: To the Federal Government 38 Landfill Enterprise Fund: To other localities 41
Total Primary Government 263 COMPONENT UNIT School Board: To the Federal Government 540
Total Reporting Entity $ 803
NOTE (7) – INTER‐FUND RECEIVABLES, PAYABLES AND TRANSFERS Inter‐fund balances and transfers are generally made for the purpose of providing operational support for the receiving fund. During the year ended June 30, 2013, the County did not make any significant inter‐fund transfers that were not routine and not consistent with the activities of the fund making the transfer. Illustration 7‐1 details the amounts due from and due to other funds at June 30, 2013.
Illustration 7‐1 Due From and Due To Other Funds at June 30, 2013
Due from
Other FundsDue to
Other Funds
General Fund $ 8,336 ‐‐ Major Enterprise Fund – Landfill ‐‐ 1,180 Major Enterprise Fund – Parks & Recreation ‐‐ 7,156
Total $ 8,336 8,336
83
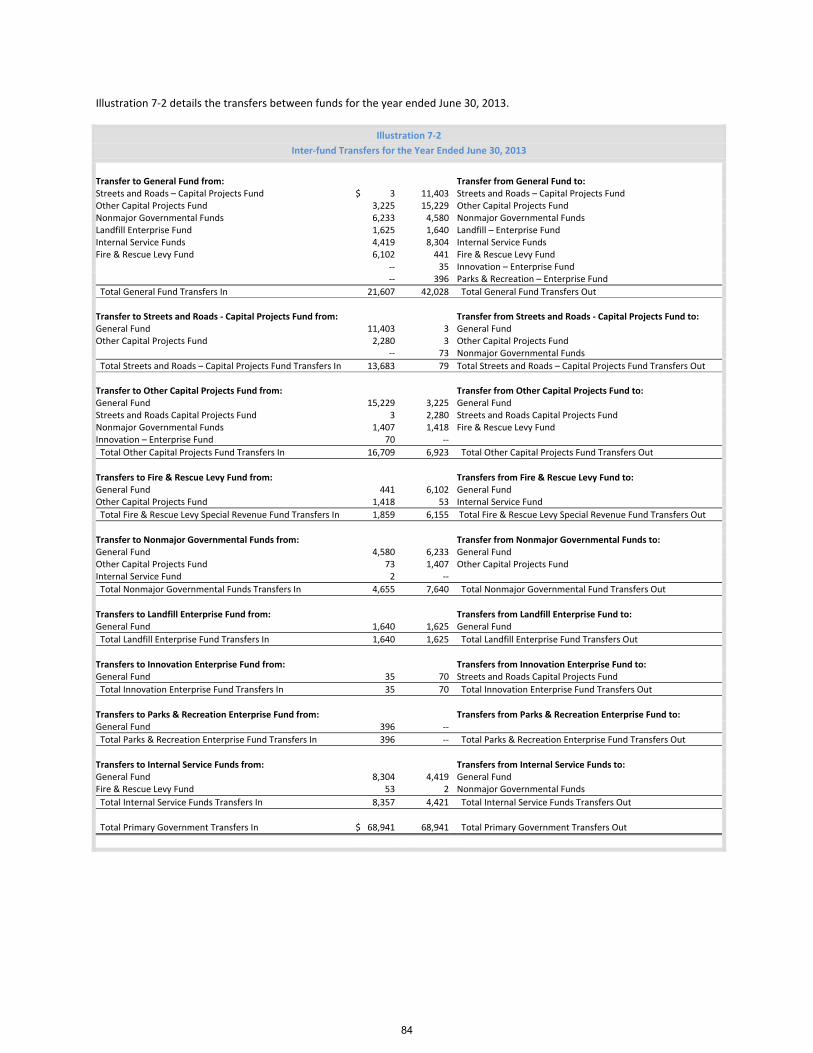
Illustration 7‐2 details the transfers between funds for the year ended June 30, 2013.
Illustration 7‐2
Inter‐fund Transfers for the Year Ended June 30, 2013
Transfer to General Fund from: Transfer from General Fund to: Streets and Roads – Capital Projects Fund $ 3 11,403 Streets and Roads – Capital Projects Fund Other Capital Projects Fund 3,225 15,229 Other Capital Projects Fund Nonmajor Governmental Funds 6,233 4,580 Nonmajor Governmental Funds Landfill Enterprise Fund 1,625 1,640 Landfill – Enterprise Fund Internal Service Funds 4,419 8,304 Internal Service Funds Fire & Rescue Levy Fund 6,102 441 Fire & Rescue Levy Fund ‐‐ 35 Innovation – Enterprise Fund ‐‐ 396 Parks & Recreation – Enterprise Fund
Total General Fund Transfers In 21,607 42,028 Total General Fund Transfers Out
Transfer to Streets and Roads ‐ Capital Projects Fund from: Transfer from Streets and Roads ‐ Capital Projects Fund to: General Fund 11,403 3 General Fund Other Capital Projects Fund 2,280 3 Other Capital Projects Fund ‐‐ 73 Nonmajor Governmental Funds
Total Streets and Roads – Capital Projects Fund Transfers In 13,683 79 Total Streets and Roads – Capital Projects Fund Transfers Out
Transfer to Other Capital Projects Fund from: Transfer from Other Capital Projects Fund to: General Fund 15,229 3,225 General Fund Streets and Roads Capital Projects Fund 3 2,280 Streets and Roads Capital Projects Fund Nonmajor Governmental Funds 1,407 1,418 Fire & Rescue Levy Fund Innovation – Enterprise Fund 70 ‐‐
Total Other Capital Projects Fund Transfers In 16,709 6,923 Total Other Capital Projects Fund Transfers Out
Transfers to Fire & Rescue Levy Fund from: Transfers from Fire & Rescue Levy Fund to: General Fund 441 6,102 General Fund Other Capital Projects Fund 1,418 53 Internal Service Fund
Total Fire & Rescue Levy Special Revenue Fund Transfers In 1,859 6,155 Total Fire & Rescue Levy Special Revenue Fund Transfers Out
Transfer to Nonmajor Governmental Funds from: Transfer from Nonmajor Governmental Funds to: General Fund 4,580 6,233 General Fund Other Capital Projects Fund 73 1,407 Other Capital Projects Fund Internal Service Fund 2 ‐‐
Total Nonmajor Governmental Funds Transfers In 4,655 7,640 Total Nonmajor Governmental Fund Transfers Out
Transfers to Landfill Enterprise Fund from: Transfers from Landfill Enterprise Fund to: General Fund 1,640 1,625 General Fund
Total Landfill Enterprise Fund Transfers In 1,640 1,625 Total Landfill Enterprise Fund Transfers Out
Transfers to Innovation Enterprise Fund from: Transfers from Innovation Enterprise Fund to: General Fund 35 70 Streets and Roads Capital Projects Fund
Total Innovation Enterprise Fund Transfers In 35 70 Total Innovation Enterprise Fund Transfers Out
Transfers to Parks & Recreation Enterprise Fund from: Transfers from Parks & Recreation Enterprise Fund to: General Fund 396 ‐‐
Total Parks & Recreation Enterprise Fund Transfers In 396 ‐‐ Total Parks & Recreation Enterprise Fund Transfers Out
Transfers to Internal Service Funds from: Transfers from Internal Service Funds to: General Fund 8,304 4,419 General Fund Fire & Rescue Levy Fund 53 2 Nonmajor Governmental Funds
Total Internal Service Funds Transfers In 8,357 4,421 Total Internal Service Funds Transfers Out
Total Primary Government Transfers In $ 68,941 68,941 Total Primary Government Transfers Out
84
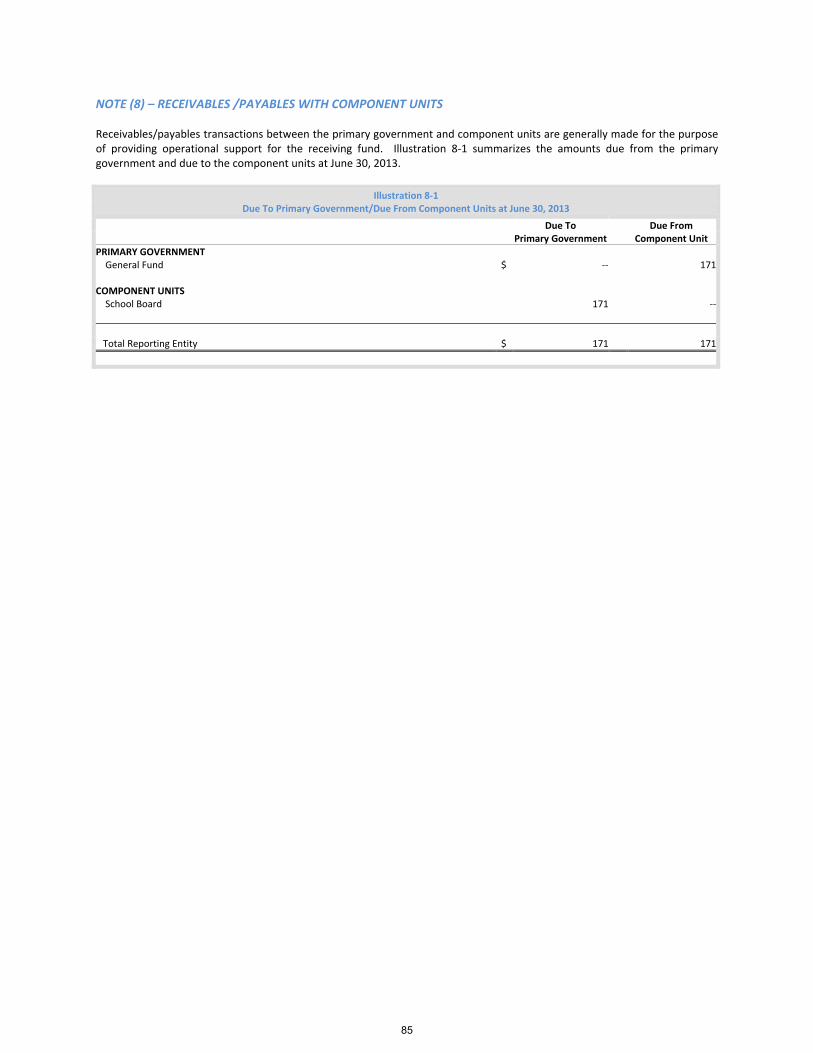
NOTE (8) – RECEIVABLES /PAYABLES WITH COMPONENT UNITS Receivables/payables transactions between the primary government and component units are generally made for the purpose of providing operational support for the receiving fund. Illustration 8‐1 summarizes the amounts due from the primary government and due to the component units at June 30, 2013.
Illustration 8‐1 Due To Primary Government/Due From Component Units at June 30, 2013
Due To Due From Primary Government Component Unit
PRIMARY GOVERNMENT General Fund $ ‐‐ 171 COMPONENT UNITS School Board 171 ‐‐
Total Reporting Entity $ 171 171
85
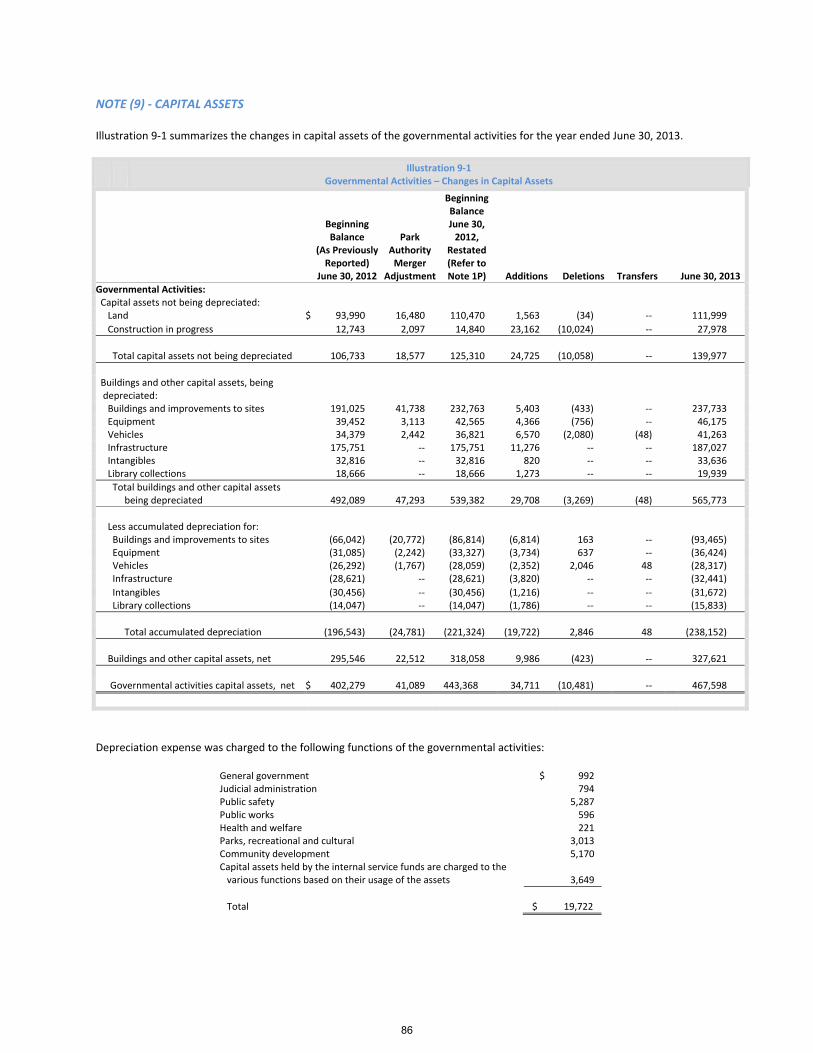
NOTE (9) ‐ CAPITAL ASSETS Illustration 9‐1 summarizes the changes in capital assets of the governmental activities for the year ended June 30, 2013.
Illustration 9‐1 Governmental Activities – Changes in Capital Assets
Beginning Balance
(As Previously Reported)
June 30, 2012
Park Authority Merger
Adjustment
Beginning Balance June 30, 2012,
Restated (Refer to Note 1P) Additions Deletions Transfers June 30, 2013
Governmental Activities: Capital assets not being depreciated: Land $ 93,990 16,480 110,470 1,563 (34) ‐‐ 111,999
Construction in progress 12,743 2,097 14,840 23,162 (10,024) ‐‐ 27,978
Total capital assets not being depreciated 106,733 18,577 125,310 24,725 (10,058) ‐‐ 139,977
Buildings and other capital assets, being depreciated:
Buildings and improvements to sites 191,025 41,738 232,763 5,403 (433) ‐‐ 237,733 Equipment 39,452 3,113 42,565 4,366 (756) ‐‐ 46,175 Vehicles 34,379 2,442 36,821 6,570 (2,080) (48) 41,263 Infrastructure 175,751 ‐‐ 175,751 11,276 ‐‐ ‐‐ 187,027 Intangibles 32,816 ‐‐ 32,816 820 ‐‐ ‐‐ 33,636 Library collections 18,666 ‐‐ 18,666 1,273 ‐‐ ‐‐ 19,939
Total buildings and other capital assets being depreciated 492,089 47,293 539,382 29,708 (3,269) (48) 565,773
Less accumulated depreciation for: Buildings and improvements to sites (66,042) (20,772) (86,814) (6,814) 163 ‐‐ (93,465) Equipment (31,085) (2,242) (33,327) (3,734) 637 ‐‐ (36,424) Vehicles (26,292) (1,767) (28,059) (2,352) 2,046 48 (28,317) Infrastructure (28,621) ‐‐ (28,621) (3,820) ‐‐ ‐‐ (32,441)
Intangibles (30,456) ‐‐ (30,456) (1,216) ‐‐ ‐‐ (31,672) Library collections (14,047) ‐‐ (14,047) (1,786) ‐‐ ‐‐ (15,833)
Total accumulated depreciation (196,543) (24,781) (221,324) (19,722) 2,846 48 (238,152)
Buildings and other capital assets, net 295,546 22,512 318,058 9,986 (423) ‐‐ 327,621
Governmental activities capital assets, net $ 402,279 41,089 443,368 34,711 (10,481) ‐‐ 467,598
Depreciation expense was charged to the following functions of the governmental activities:
General government $ 992 Judicial administration 794 Public safety 5,287 Public works 596 Health and welfare 221 Parks, recreational and cultural 3,013 Community development 5,170 Capital assets held by the internal service funds are charged to the various functions based on their usage of the assets
3,649
Total $ 19,722
86
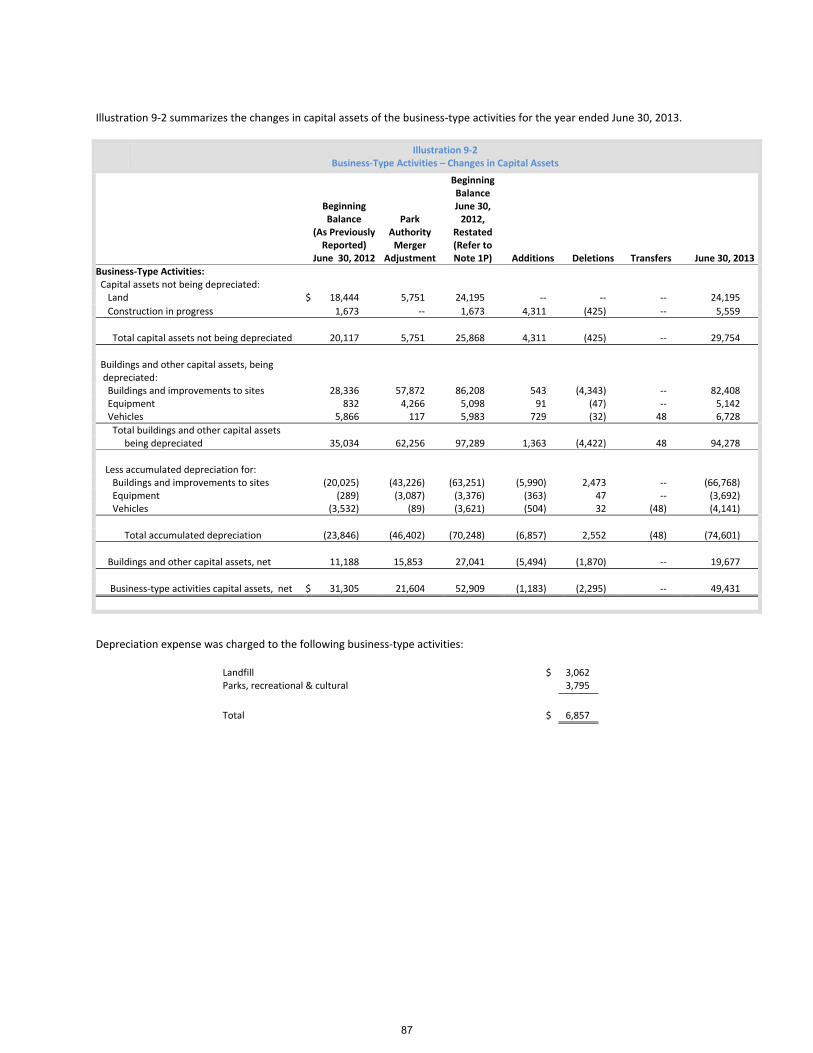
Illustration 9‐2 summarizes the changes in capital assets of the business‐type activities for the year ended June 30, 2013.
Illustration 9‐2 Business‐Type Activities – Changes in Capital Assets
Beginning Balance
(As Previously Reported)
June 30, 2012
Park Authority Merger
Adjustment
Beginning Balance June 30, 2012,
Restated (Refer to Note 1P) Additions Deletions Transfers June 30, 2013
Business‐Type Activities: Capital assets not being depreciated: Land $ 18,444 5,751 24,195 ‐‐ ‐‐ ‐‐ 24,195
Construction in progress 1,673 ‐‐ 1,673 4,311 (425) ‐‐ 5,559
Total capital assets not being depreciated 20,117 5,751 25,868 4,311 (425) ‐‐ 29,754
Buildings and other capital assets, being depreciated: Buildings and improvements to sites 28,336 57,872 86,208 543 (4,343) ‐‐ 82,408 Equipment 832 4,266 5,098 91 (47) ‐‐ 5,142 Vehicles 5,866 117 5,983 729 (32) 48 6,728
Total buildings and other capital assets being depreciated 35,034 62,256 97,289 1,363 (4,422) 48 94,278
Less accumulated depreciation for: Buildings and improvements to sites (20,025) (43,226) (63,251) (5,990) 2,473 ‐‐ (66,768) Equipment (289) (3,087) (3,376) (363) 47 ‐‐ (3,692) Vehicles (3,532) (89) (3,621) (504) 32 (48) (4,141)
Total accumulated depreciation (23,846) (46,402) (70,248) (6,857) 2,552 (48) (74,601)
Buildings and other capital assets, net 11,188 15,853 27,041 (5,494) (1,870) ‐‐ 19,677
Business‐type activities capital assets, net $ 31,305 21,604 52,909 (1,183) (2,295) ‐‐ 49,431
Depreciation expense was charged to the following business‐type activities:
Landfill $ 3,062 Parks, recreational & cultural 3,795
Total $ 6,857
87
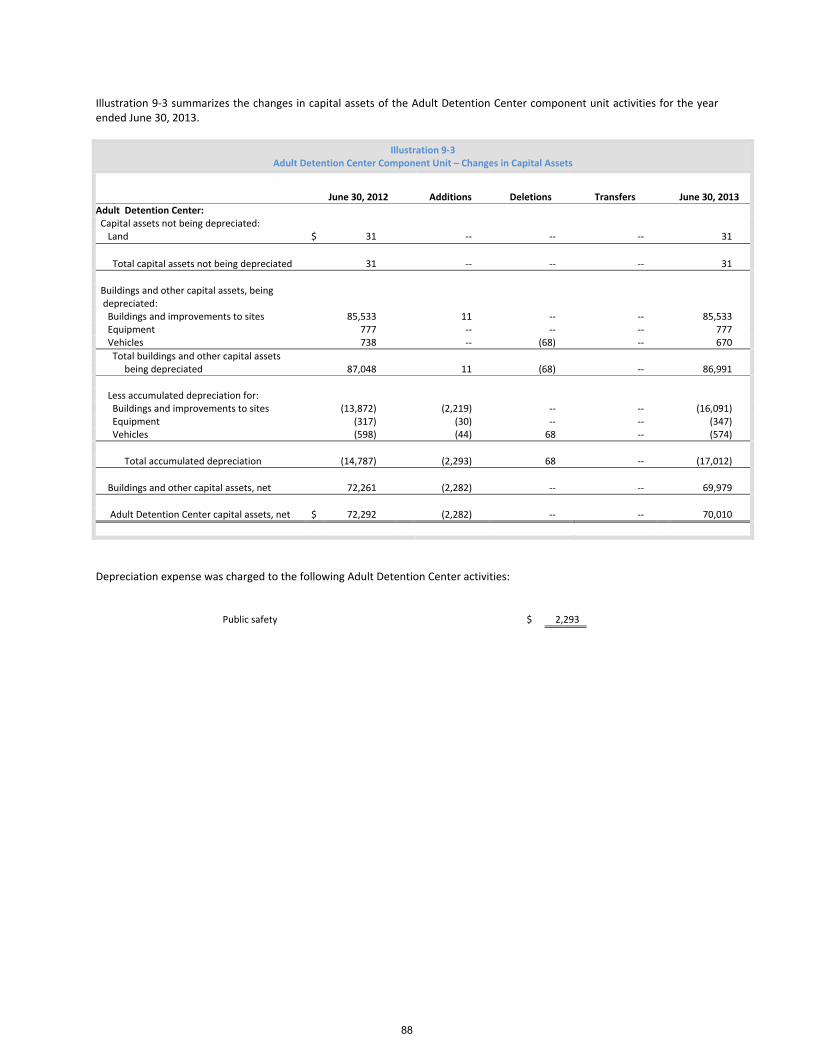
Illustration 9‐3 summarizes the changes in capital assets of the Adult Detention Center component unit activities for the year ended June 30, 2013.
Illustration 9‐3 Adult Detention Center Component Unit – Changes in Capital Assets
June 30, 2012 Additions Deletions Transfers June 30, 2013
Adult Detention Center: Capital assets not being depreciated: Land $ 31 ‐‐ ‐‐ ‐‐ 31
Total capital assets not being depreciated 31 ‐‐ ‐‐ ‐‐ 31
Buildings and other capital assets, being depreciated: Buildings and improvements to sites 85,533 11 ‐‐ ‐‐ 85,533 Equipment 777 ‐‐ ‐‐ ‐‐ 777 Vehicles 738 ‐‐ (68) ‐‐ 670
Total buildings and other capital assets being depreciated 87,048 11 (68) ‐‐ 86,991
Less accumulated depreciation for: Buildings and improvements to sites (13,872) (2,219) ‐‐ ‐‐ (16,091) Equipment (317) (30) ‐‐ ‐‐ (347) Vehicles (598) (44) 68 ‐‐ (574)
Total accumulated depreciation (14,787) (2,293) 68 ‐‐ (17,012)
Buildings and other capital assets, net 72,261 (2,282) ‐‐ ‐‐ 69,979
Adult Detention Center capital assets, net $ 72,292 (2,282) ‐‐ ‐‐ 70,010
Depreciation expense was charged to the following Adult Detention Center activities:
Public safety $ 2,293
88
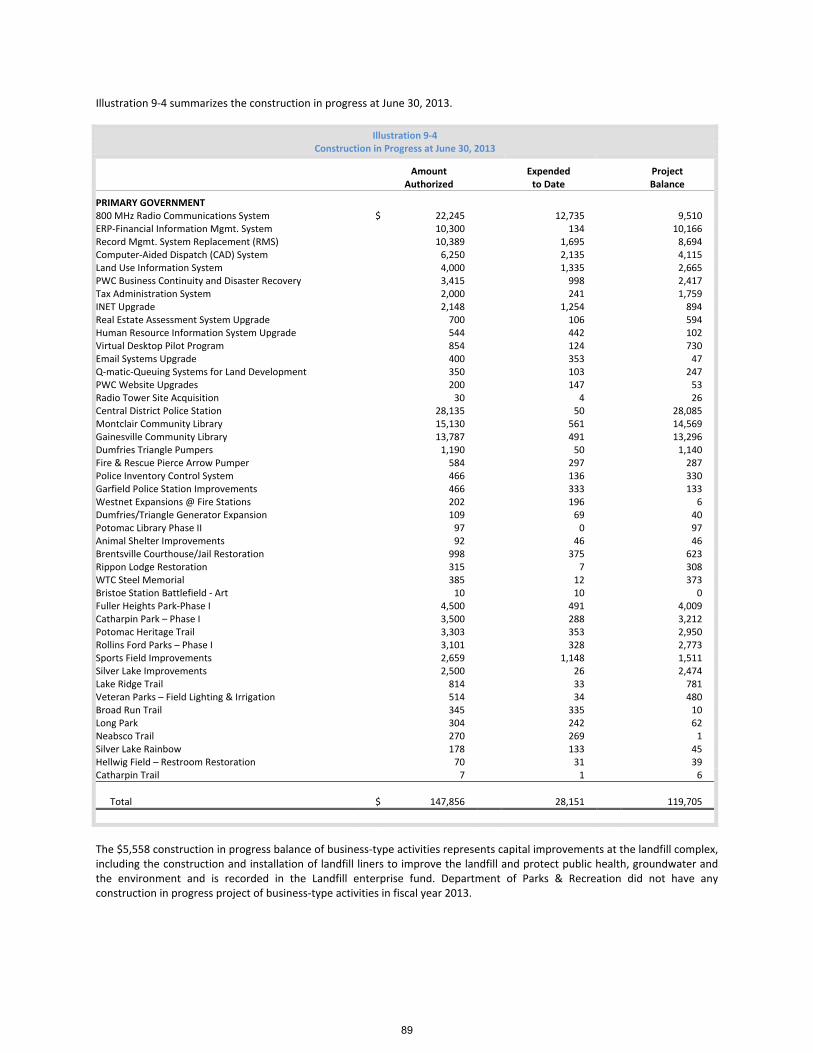
Illustration 9‐4 summarizes the construction in progress at June 30, 2013.
Illustration 9‐4 Construction in Progress at June 30, 2013
Amount Authorized
Expended to Date
Project Balance
PRIMARY GOVERNMENT 800 MHz Radio Communications System $ 22,245 12,735 9,510 ERP‐Financial Information Mgmt. System 10,300 134 10,166 Record Mgmt. System Replacement (RMS) 10,389 1,695 8,694 Computer‐Aided Dispatch (CAD) System 6,250 2,135 4,115 Land Use Information System 4,000 1,335 2,665 PWC Business Continuity and Disaster Recovery 3,415 998 2,417 Tax Administration System 2,000 241 1,759 INET Upgrade 2,148 1,254 894 Real Estate Assessment System Upgrade 700 106 594 Human Resource Information System Upgrade 544 442 102 Virtual Desktop Pilot Program 854 124 730 Email Systems Upgrade 400 353 47 Q‐matic‐Queuing Systems for Land Development 350 103 247 PWC Website Upgrades 200 147 53 Radio Tower Site Acquisition 30 4 26 Central District Police Station 28,135 50 28,085 Montclair Community Library 15,130 561 14,569 Gainesville Community Library 13,787 491 13,296 Dumfries Triangle Pumpers 1,190 50 1,140 Fire & Rescue Pierce Arrow Pumper 584 297 287 Police Inventory Control System 466 136 330 Garfield Police Station Improvements 466 333 133 Westnet Expansions @ Fire Stations 202 196 6 Dumfries/Triangle Generator Expansion 109 69 40 Potomac Library Phase II 97 0 97 Animal Shelter Improvements 92 46 46 Brentsville Courthouse/Jail Restoration 998 375 623 Rippon Lodge Restoration 315 7 308 WTC Steel Memorial 385 12 373 Bristoe Station Battlefield ‐ Art 10 10 0 Fuller Heights Park‐Phase I 4,500 491 4,009 Catharpin Park – Phase I 3,500 288 3,212 Potomac Heritage Trail 3,303 353 2,950 Rollins Ford Parks – Phase I 3,101 328 2,773 Sports Field Improvements 2,659 1,148 1,511 Silver Lake Improvements 2,500 26 2,474 Lake Ridge Trail 814 33 781 Veteran Parks – Field Lighting & Irrigation 514 34 480 Broad Run Trail 345 335 10 Long Park 304 242 62 Neabsco Trail 270 269 1 Silver Lake Rainbow 178 133 45 Hellwig Field – Restroom Restoration 70 31 39 Catharpin Trail 7 1 6
Total $ 147,856 28,151 119,705
The $5,558 construction in progress balance of business‐type activities represents capital improvements at the landfill complex, including the construction and installation of landfill liners to improve the landfill and protect public health, groundwater and the environment and is recorded in the Landfill enterprise fund. Department of Parks & Recreation did not have any construction in progress project of business‐type activities in fiscal year 2013.
89
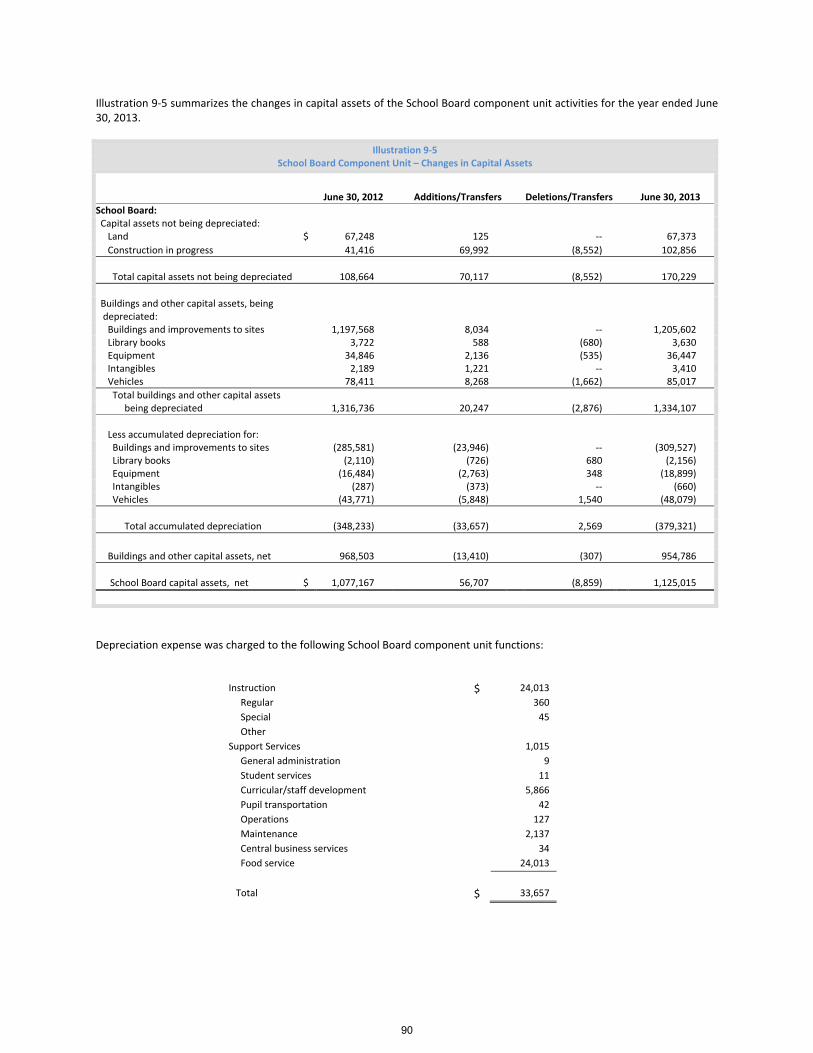
Illustration 9‐5 summarizes the changes in capital assets of the School Board component unit activities for the year ended June 30, 2013.
Illustration 9‐5 School Board Component Unit – Changes in Capital Assets
June 30, 2012
Additions/Transfers Deletions/Transfers
June 30, 2013
School Board: Capital assets not being depreciated: Land $ 67,248 125 ‐‐ 67,373
Construction in progress 41,416 69,992 (8,552) 102,856
Total capital assets not being depreciated 108,664 70,117 (8,552) 170,229
Buildings and other capital assets, being depreciated:
Buildings and improvements to sites 1,197,568 8,034 ‐‐ 1,205,602 Library books 3,722 588 (680) 3,630 Equipment 34,846 2,136 (535) 36,447 Intangibles 2,189 1,221 ‐‐ 3,410 Vehicles 78,411 8,268 (1,662) 85,017
Total buildings and other capital assets being depreciated 1,316,736 20,247 (2,876) 1,334,107
Less accumulated depreciation for: Buildings and improvements to sites (285,581) (23,946) ‐‐ (309,527) Library books (2,110) (726) 680 (2,156) Equipment (16,484) (2,763) 348 (18,899) Intangibles (287) (373) ‐‐ (660) Vehicles (43,771) (5,848) 1,540 (48,079)
Total accumulated depreciation (348,233) (33,657) 2,569 (379,321)
Buildings and other capital assets, net 968,503 (13,410) (307) 954,786
School Board capital assets, net $ 1,077,167 56,707 (8,859) 1,125,015
Depreciation expense was charged to the following School Board component unit functions:
Instruction $ 24,013
Regular 360
Special 45
Other
Support Services 1,015
General administration 9
Student services 11
Curricular/staff development 5,866
Pupil transportation 42
Operations 127
Maintenance 2,137
Central business services 34
Food service 24,013
Total $ 33,657
90
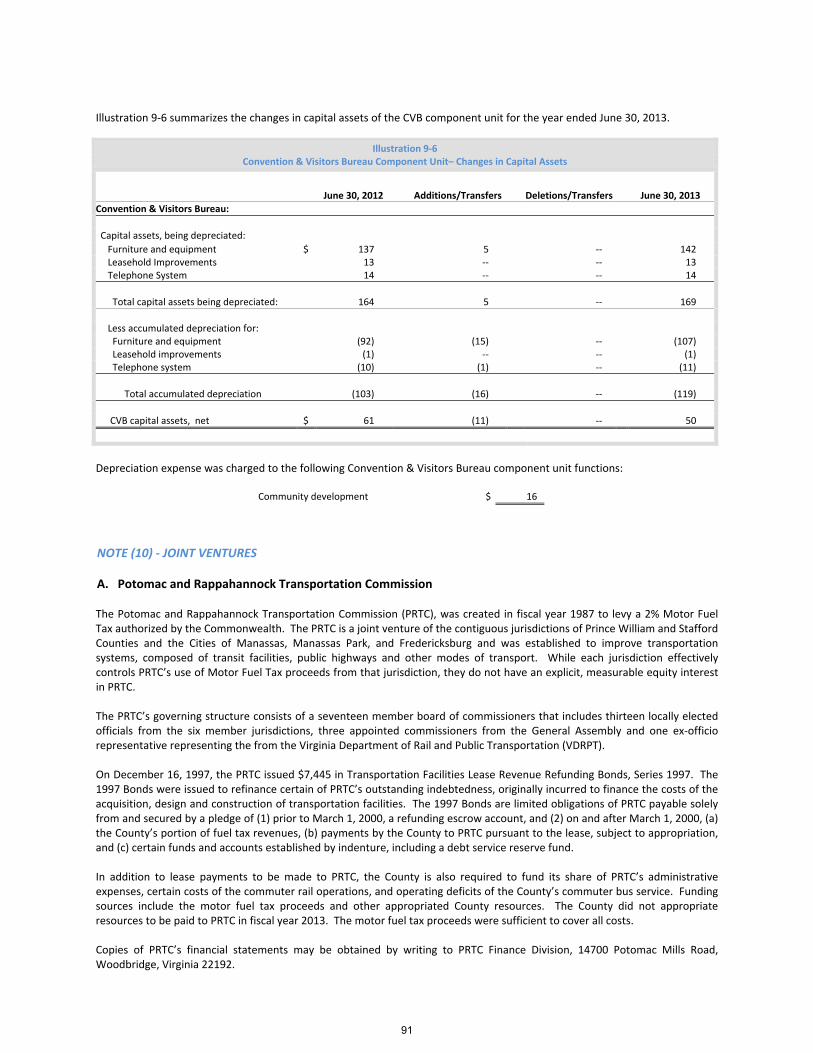
Illustration 9‐6 summarizes the changes in capital assets of the CVB component unit for the year ended June 30, 2013.
Illustration 9‐6 Convention & Visitors Bureau Component Unit– Changes in Capital Assets
June 30, 2012 Additions/Transfers Deletions/Transfers June 30, 2013
Convention & Visitors Bureau:
Capital assets, being depreciated:
Furniture and equipment $ 137 5 ‐‐ 142 Leasehold Improvements 13 ‐‐ ‐‐ 13 Telephone System 14 ‐‐ ‐‐ 14
Total capital assets being depreciated: 164 5 ‐‐ 169
Less accumulated depreciation for: Furniture and equipment (92) (15) ‐‐ (107) Leasehold improvements (1) ‐‐ ‐‐ (1) Telephone system (10) (1) ‐‐ (11)
Total accumulated depreciation (103) (16) ‐‐ (119)
CVB capital assets, net $ 61 (11) ‐‐ 50
Depreciation expense was charged to the following Convention & Visitors Bureau component unit functions:
Community development $ 16
NOTE (10) ‐ JOINT VENTURES
A. Potomac and Rappahannock Transportation Commission
The Potomac and Rappahannock Transportation Commission (PRTC), was created in fiscal year 1987 to levy a 2% Motor Fuel Tax authorized by the Commonwealth. The PRTC is a joint venture of the contiguous jurisdictions of Prince William and Stafford Counties and the Cities of Manassas, Manassas Park, and Fredericksburg and was established to improve transportation systems, composed of transit facilities, public highways and other modes of transport. While each jurisdiction effectively controls PRTC’s use of Motor Fuel Tax proceeds from that jurisdiction, they do not have an explicit, measurable equity interest in PRTC.
The PRTC’s governing structure consists of a seventeen member board of commissioners that includes thirteen locally elected officials from the six member jurisdictions, three appointed commissioners from the General Assembly and one ex‐officio representative representing the from the Virginia Department of Rail and Public Transportation (VDRPT).
On December 16, 1997, the PRTC issued $7,445 in Transportation Facilities Lease Revenue Refunding Bonds, Series 1997. The 1997 Bonds were issued to refinance certain of PRTC’s outstanding indebtedness, originally incurred to finance the costs of the acquisition, design and construction of transportation facilities. The 1997 Bonds are limited obligations of PRTC payable solely from and secured by a pledge of (1) prior to March 1, 2000, a refunding escrow account, and (2) on and after March 1, 2000, (a) the County’s portion of fuel tax revenues, (b) payments by the County to PRTC pursuant to the lease, subject to appropriation, and (c) certain funds and accounts established by indenture, including a debt service reserve fund.
In addition to lease payments to be made to PRTC, the County is also required to fund its share of PRTC’s administrative expenses, certain costs of the commuter rail operations, and operating deficits of the County’s commuter bus service. Funding sources include the motor fuel tax proceeds and other appropriated County resources. The County did not appropriate resources to be paid to PRTC in fiscal year 2013. The motor fuel tax proceeds were sufficient to cover all costs.
Copies of PRTC’s financial statements may be obtained by writing to PRTC Finance Division, 14700 Potomac Mills Road, Woodbridge, Virginia 22192.
91
B. Peumansend Creek Regional Jail Authority The Peumansend Creek Regional Jail Authority (the Authority) was created in fiscal year 1994 to construct and operate a 336 prisoner regional correctional facility. The Authority is a joint venture of the jurisdictions of Arlington, Caroline, Loudoun and Prince William Counties and the Cities of Alexandria and Richmond. The formation of the Authority was enabled by Public Law 102‐25 and 102‐484 that conveyed 150 acres at Fort A.P. Hill from the U.S. Department of the Army to Caroline County on the condition that Caroline County and at least three other jurisdictions named in the legislation construct and operate a regional correctional facility on the site. The City Manager, County Manager or County Executive of the member jurisdictions forms the Authority. The Authority has six member jurisdictions. The Authority employs a Superintendent who is responsible for the operation of the Jail. Each jurisdiction pays the per diem charge for the number of guaranteed beds set forth in the Service Agreement. The County and the other participating jurisdictions have no explicit, measurable equity interest in the Authority, but do have an ongoing financial responsibility for their share of the Authority’s operating costs. The County made payments to the Authority in fiscal year 2013 of $902 to pay its share of the Authority’s operating costs. On March 20, 1997, the Authority issued $10,220 Regional Jail Facility Revenue Bonds, Series 1997 and $12,000 Regional Jail Facility Grant Anticipation Notes, Series 1997. The obligations were issued for the purpose of financing the Authority’s planning, design, acquisition, construction and equipping of the Regional Jail Facility; funding a debt service reserve fund for the 1997 Bonds through the purchase of a surety bond from MBIA Insurance Corporation; funding payment of interest on the 1997 Notes through April 1, 2000; funding certain working capital expenditures incident to placing the Regional Jail in operation; and paying the costs of issuing the obligations. The Authority began accepting female prisoners in September 1999, and began full operation in November 1999. Copies of the Authority’s financial statements may be obtained by writing to Peumansend Creek Regional Jail Authority, P.O. Box 1460, Bowling Green, Virginia 22427.
NOTE (11) ‐ LONG‐TERM DEBT The following bonds and capital lease obligations were issued in fiscal year 2013:
On March 13, 2012, the Board of County Supervisors approved Resolution No. 12‐325 authorizing the sale of General
Obligation School Bonds to be sold to the Virginia Public School Authority in an amount not to exceed $79,600 for the
purpose of financing various school projects. On August 1, 2012, the County sold the Virginia Public School Authority
Prince William County Special Obligation Bonds Series 2012 in the par amount of $65,675.
On June 5, 2012, the Board of County Supervisors approved Resolution No. 12‐565 authorizing the sale of Virginia
Resource Authority Refunding Bonds in an amount not to exceed $11,000 for the purpose of refunding certain outstanding
maturities of the County's Virginia Resource Authority Bonds.
On June 27, 2012, the Virginia Resource Authority sold Refunding Bonds, Series 2012, which closed on July 12, 2012, in the
amount of $10,095 PAR. A portion of the proceeds of the Series 2012 Bonds will be applied to redeem certain prior
outstanding maturities in the series 2005 Virginia Resource Authority Bonds. The refunded maturities totaled $10,600 and
resulted in a debt service savings of $847 and a net present value savings of $735.
In conjunction with the above, the Virginia Resource Authority sold Refunding Bonds, Series 2012, in the amount of $880
PAR. A portion of the proceeds of the Series 2012 Bonds will be applied to redeem certain prior outstanding maturities in
the series 2003 Virginia Resource Authority Bonds. The refunded maturities totaled $950 and resulted in a debt service
savings of $117 and a net present value savings of $109.
On February 19, 2013 the Board of County Supervisors approved Resolution No. 13‐107 to authorize the sale of a
Refunding Certificate of Participation Refunding Bond in an amount not to exceed $50,000 for the purpose of refunding
certain prior outstanding maturities of County's Certificate of Participation Bonds. On March 26, 2013 the County sold
Certificate of Participation Refunding Bonds Series 2013 in the amount of $35,205 PAR. A portion of the proceeds of the
Series 2013 Certificate of Participation Refunding Bonds will be applied to redeem certain prior outstanding maturities of
the series 2005 and series 2006A Certificate of Participation Bonds. The refunded maturities totaled $36,550 and resulted
in a debt service savings of $3,064 and a net present value savings of $2,503.
92
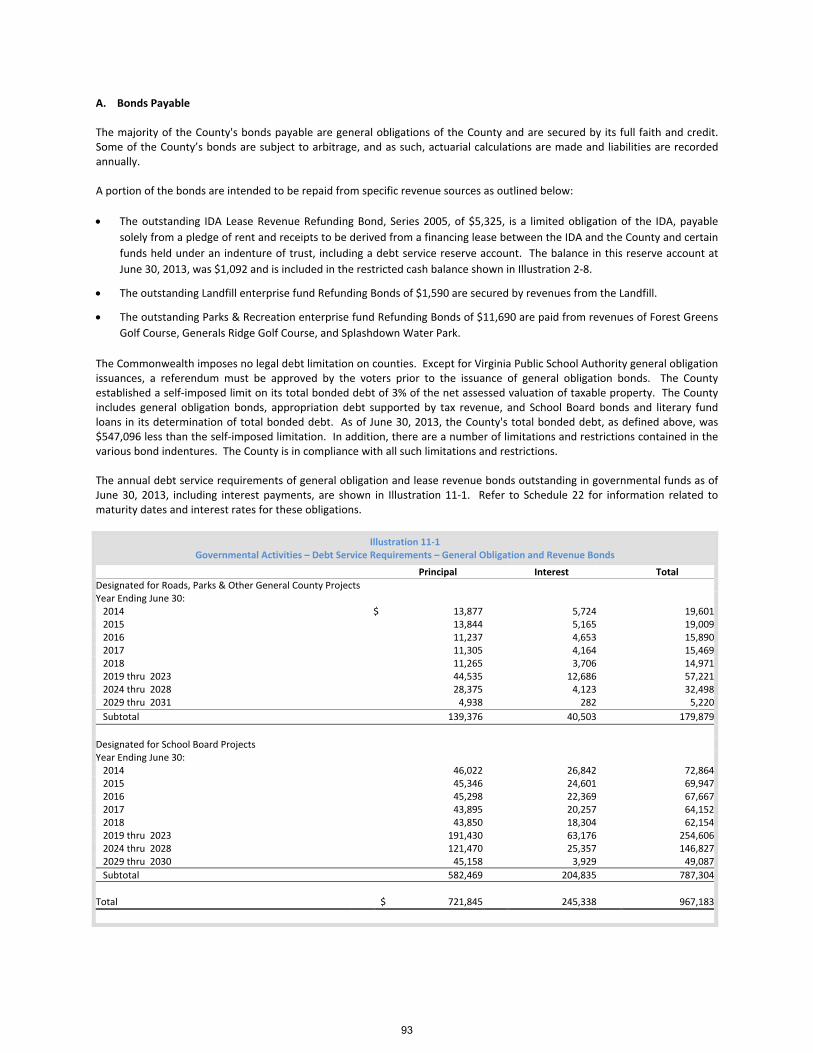
A. Bonds Payable The majority of the County's bonds payable are general obligations of the County and are secured by its full faith and credit. Some of the County’s bonds are subject to arbitrage, and as such, actuarial calculations are made and liabilities are recorded annually. A portion of the bonds are intended to be repaid from specific revenue sources as outlined below:
The outstanding IDA Lease Revenue Refunding Bond, Series 2005, of $5,325, is a limited obligation of the IDA, payable
solely from a pledge of rent and receipts to be derived from a financing lease between the IDA and the County and certain
funds held under an indenture of trust, including a debt service reserve account. The balance in this reserve account at
June 30, 2013, was $1,092 and is included in the restricted cash balance shown in Illustration 2‐8.
The outstanding Landfill enterprise fund Refunding Bonds of $1,590 are secured by revenues from the Landfill.
The outstanding Parks & Recreation enterprise fund Refunding Bonds of $11,690 are paid from revenues of Forest Greens
Golf Course, Generals Ridge Golf Course, and Splashdown Water Park.
The Commonwealth imposes no legal debt limitation on counties. Except for Virginia Public School Authority general obligation issuances, a referendum must be approved by the voters prior to the issuance of general obligation bonds. The County established a self‐imposed limit on its total bonded debt of 3% of the net assessed valuation of taxable property. The County includes general obligation bonds, appropriation debt supported by tax revenue, and School Board bonds and literary fund loans in its determination of total bonded debt. As of June 30, 2013, the County's total bonded debt, as defined above, was $547,096 less than the self‐imposed limitation. In addition, there are a number of limitations and restrictions contained in the various bond indentures. The County is in compliance with all such limitations and restrictions. The annual debt service requirements of general obligation and lease revenue bonds outstanding in governmental funds as of June 30, 2013, including interest payments, are shown in Illustration 11‐1. Refer to Schedule 22 for information related to maturity dates and interest rates for these obligations.
Illustration 11‐1 Governmental Activities – Debt Service Requirements – General Obligation and Revenue Bonds
Principal Interest Total
Designated for Roads, Parks & Other General County Projects Year Ending June 30: 2014 $ 13,877 5,724 19,601 2015 13,844 5,165 19,009 2016 11,237 4,653 15,890 2017 11,305 4,164 15,469 2018 11,265 3,706 14,971 2019 thru 2023 44,535 12,686 57,221 2024 thru 2028 28,375 4,123 32,498 2029 thru 2031 4,938 282 5,220
Subtotal 139,376 40,503 179,879
Designated for School Board Projects Year Ending June 30: 2014 46,022 26,842 72,864 2015 45,346 24,601 69,947 2016 45,298 22,369 67,667 2017 43,895 20,257 64,152 2018 43,850 18,304 62,154 2019 thru 2023 191,430 63,176 254,606 2024 thru 2028 121,470 25,357 146,827 2029 thru 2030 45,158 3,929 49,087
Subtotal 582,469 204,835 787,304
Total $ 721,845 245,338 967,183
93
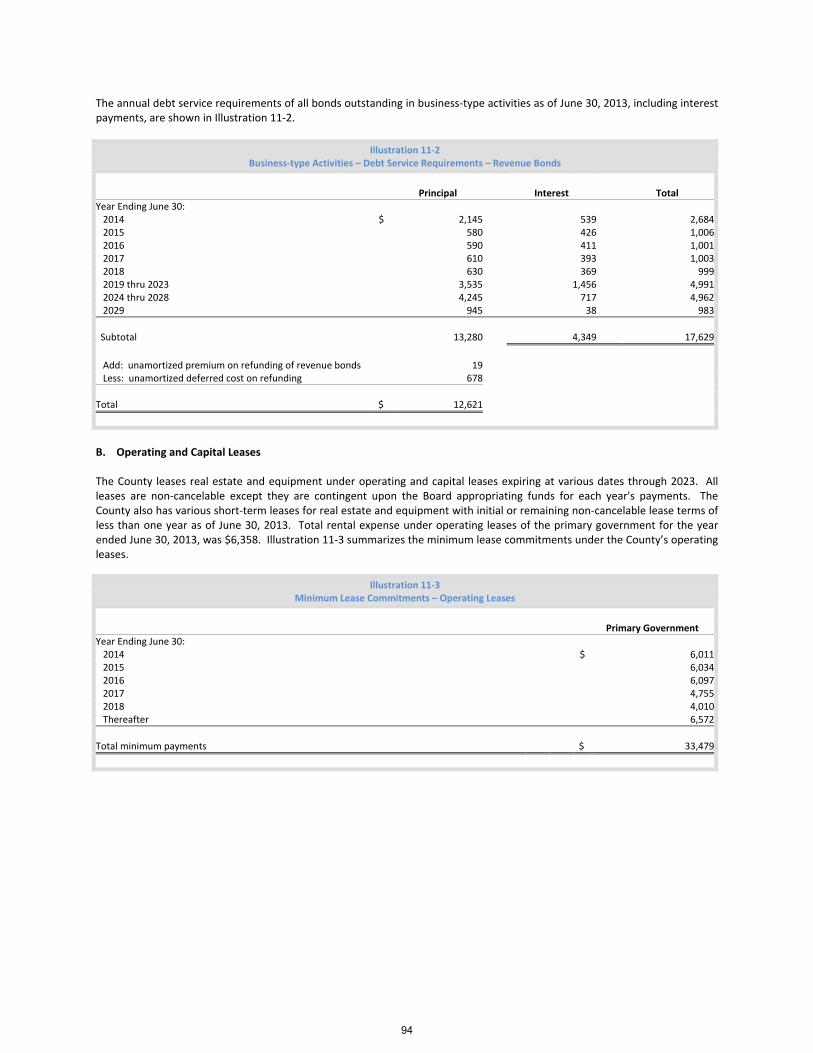
The annual debt service requirements of all bonds outstanding in business‐type activities as of June 30, 2013, including interest payments, are shown in Illustration 11‐2.
Illustration 11‐2 Business‐type Activities – Debt Service Requirements – Revenue Bonds
Principal Interest Total
Year Ending June 30: 2014 $ 2,145 539 2,684 2015 580 426 1,006 2016 590 411 1,001 2017 610 393 1,003 2018 630 369 999 2019 thru 2023 3,535 1,456 4,991 2024 thru 2028 4,245 717 4,962 2029 945 38 983
Subtotal 13,280 4,349 17,629
Add: unamortized premium on refunding of revenue bonds 19 Less: unamortized deferred cost on refunding 678
Total $ 12,621
B. Operating and Capital Leases
The County leases real estate and equipment under operating and capital leases expiring at various dates through 2023. All leases are non‐cancelable except they are contingent upon the Board appropriating funds for each year's payments. The County also has various short‐term leases for real estate and equipment with initial or remaining non‐cancelable lease terms of less than one year as of June 30, 2013. Total rental expense under operating leases of the primary government for the year ended June 30, 2013, was $6,358. Illustration 11‐3 summarizes the minimum lease commitments under the County’s operating leases.
Illustration 11‐3 Minimum Lease Commitments – Operating Leases
Primary Government
Year Ending June 30: 2014 $ 6,011 2015 6,034 2016 6,097 2017 4,755 2018 4,010 Thereafter 6,572
Total minimum payments $ 33,479
94
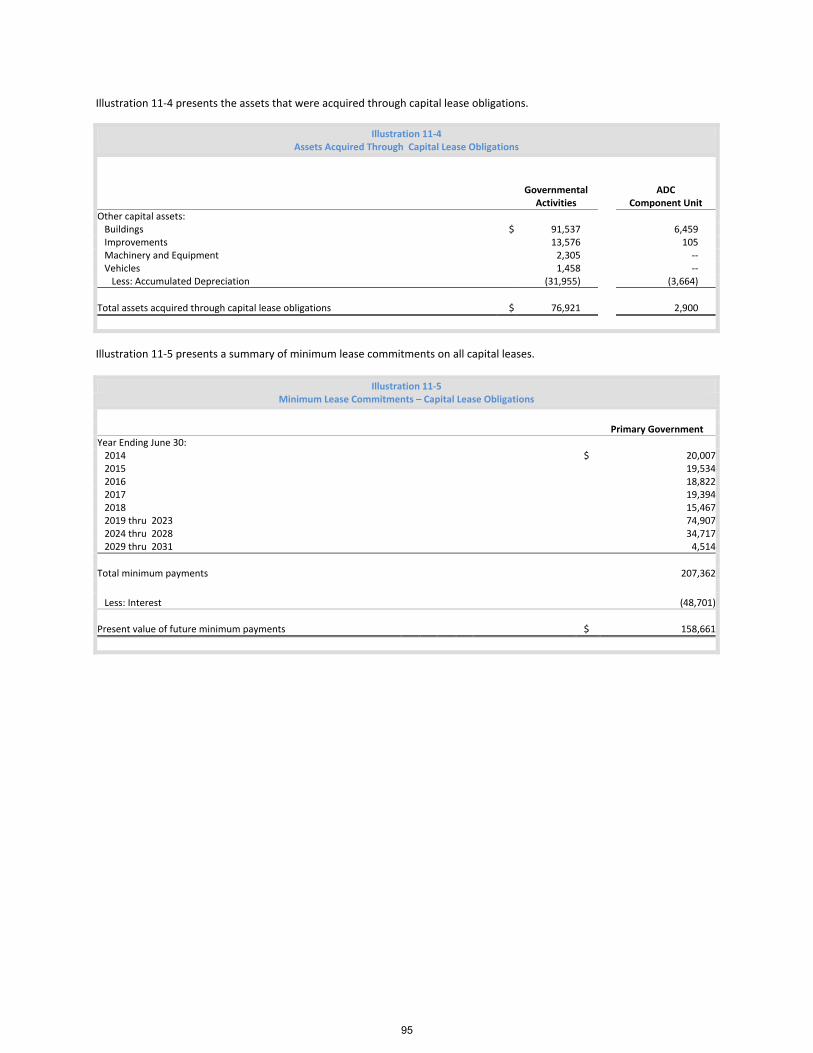
Illustration 11‐4 presents the assets that were acquired through capital lease obligations.
Illustration 11‐4 Assets Acquired Through Capital Lease Obligations
Governmental Activities
ADC
Component Unit
Other capital assets: Buildings $ 91,537 6,459 Improvements 13,576 105 Machinery and Equipment 2,305 ‐‐ Vehicles 1,458 ‐‐ Less: Accumulated Depreciation (31,955) (3,664)
Total assets acquired through capital lease obligations $ 76,921 2,900
Illustration 11‐5 presents a summary of minimum lease commitments on all capital leases.
Illustration 11‐5 Minimum Lease Commitments – Capital Lease Obligations
Primary Government
Year Ending June 30: 2014 $ 20,007 2015 19,534 2016 18,822 2017 19,394 2018 15,467 2019 thru 2023 74,907 2024 thru 2028 34,717 2029 thru 2031 4,514
Total minimum payments 207,362
Less: Interest (48,701)
Present value of future minimum payments
$ 158,661
95
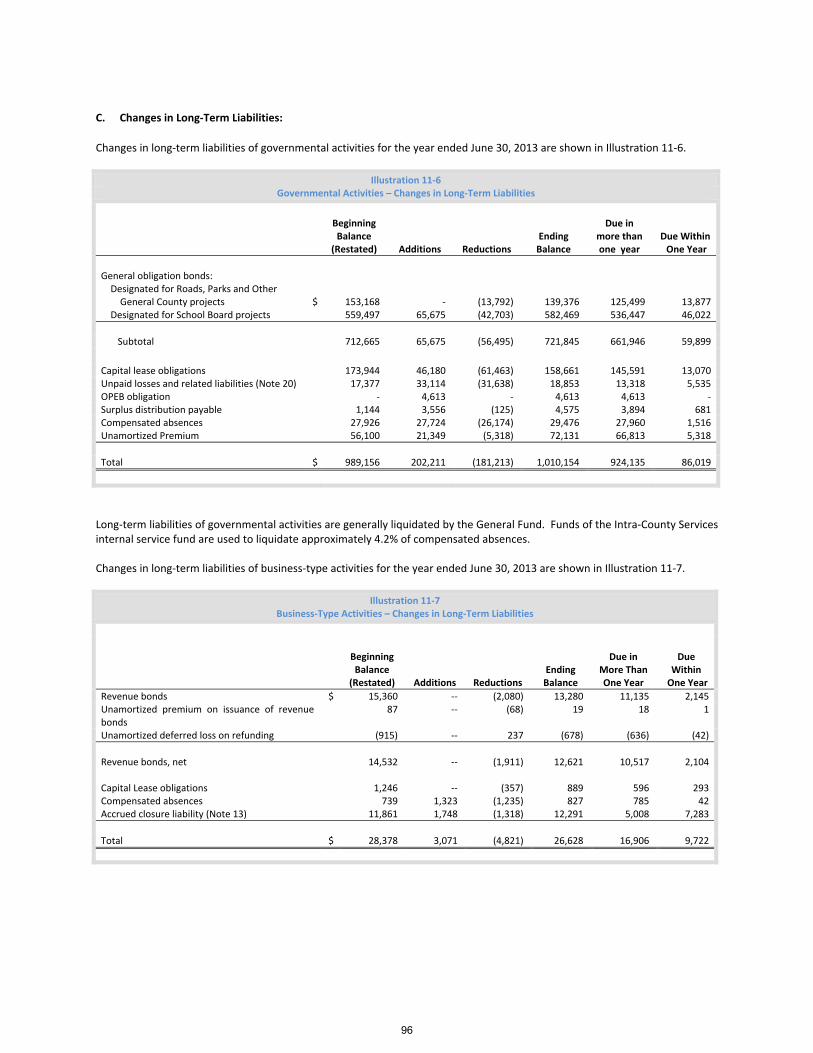
C. Changes in Long‐Term Liabilities:
Changes in long‐term liabilities of governmental activities for the year ended June 30, 2013 are shown in Illustration 11‐6.
Illustration 11‐6 Governmental Activities – Changes in Long‐Term Liabilities
Beginning Balance
(Restated)
Additions
Reductions
Ending Balance
Due in
more than one year
Due Within One Year
General obligation bonds: Designated for Roads, Parks and Other General County projects $ 153,168 ‐ (13,792) 139,376 125,499 13,877 Designated for School Board projects 559,497 65,675 (42,703) 582,469 536,447 46,022
Subtotal 712,665 65,675 (56,495) 721,845 661,946 59,899
Capital lease obligations 173,944 46,180 (61,463) 158,661 145,591 13,070Unpaid losses and related liabilities (Note 20) 17,377 33,114 (31,638) 18,853 13,318 5,535OPEB obligation ‐ 4,613 ‐ 4,613 4,613 ‐Surplus distribution payable 1,144 3,556 (125) 4,575 3,894 681Compensated absences 27,926 27,724 (26,174) 29,476 27,960 1,516Unamortized Premium 56,100 21,349 (5,318) 72,131 66,813 5,318
Total $ 989,156 202,211 (181,213) 1,010,154 924,135 86,019
Long‐term liabilities of governmental activities are generally liquidated by the General Fund. Funds of the Intra‐County Services internal service fund are used to liquidate approximately 4.2% of compensated absences. Changes in long‐term liabilities of business‐type activities for the year ended June 30, 2013 are shown in Illustration 11‐7.
Illustration 11‐7 Business‐Type Activities – Changes in Long‐Term Liabilities
Beginning Balance
(Restated)
Additions
Reductions
Ending Balance
Due in
More Than One Year
Due
Within One Year
Revenue bonds $ 15,360 ‐‐ (2,080) 13,280 11,135 2,145Unamortized premium on issuance of revenue bonds
87 ‐‐ (68) 19 18 1
Unamortized deferred loss on refunding (915) ‐‐ 237 (678) (636) (42)
Revenue bonds, net 14,532 ‐‐ (1,911) 12,621 10,517 2,104 Capital Lease obligations 1,246 ‐‐ (357) 889 596 293Compensated absences 739 1,323 (1,235) 827 785 42Accrued closure liability (Note 13) 11,861 1,748 (1,318) 12,291 5,008 7,283
Total $ 28,378 3,071 (4,821) 26,628 16,906 9,722
96
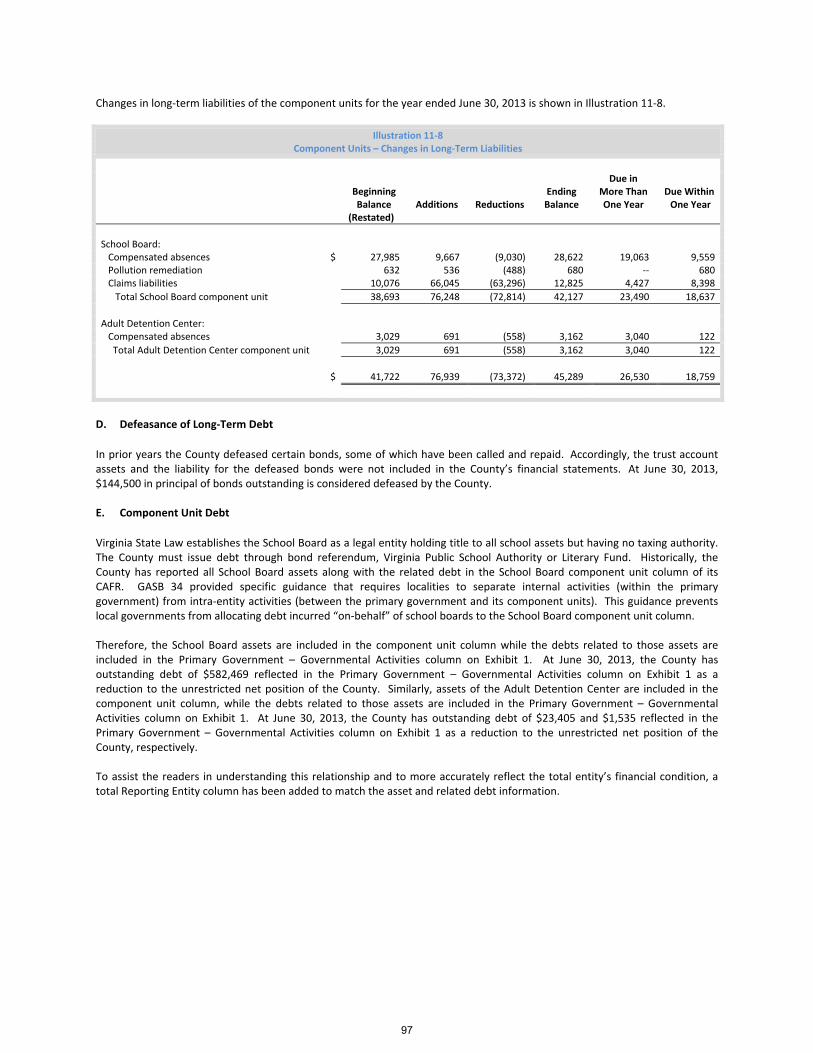
Changes in long‐term liabilities of the component units for the year ended June 30, 2013 is shown in Illustration 11‐8.
Illustration 11‐8 Component Units – Changes in Long‐Term Liabilities
Beginning Balance
(Restated)
Additions
Reductions
Ending Balance
Due in More Than One Year
Due Within One Year
School Board: Compensated absences $ 27,985 9,667 (9,030) 28,622 19,063 9,559 Pollution remediation 632 536 (488) 680 ‐‐ 680 Claims liabilities 10,076 66,045 (63,296) 12,825 4,427 8,398
Total School Board component unit 38,693 76,248 (72,814) 42,127 23,490 18,637
Adult Detention Center: Compensated absences 3,029 691 (558) 3,162 3,040 122
Total Adult Detention Center component unit 3,029 691 (558) 3,162 3,040 122
$ 41,722 76,939 (73,372) 45,289 26,530 18,759
D. Defeasance of Long‐Term Debt
In prior years the County defeased certain bonds, some of which have been called and repaid. Accordingly, the trust account assets and the liability for the defeased bonds were not included in the County’s financial statements. At June 30, 2013, $144,500 in principal of bonds outstanding is considered defeased by the County. E. Component Unit Debt
Virginia State Law establishes the School Board as a legal entity holding title to all school assets but having no taxing authority. The County must issue debt through bond referendum, Virginia Public School Authority or Literary Fund. Historically, the County has reported all School Board assets along with the related debt in the School Board component unit column of its CAFR. GASB 34 provided specific guidance that requires localities to separate internal activities (within the primary government) from intra‐entity activities (between the primary government and its component units). This guidance prevents local governments from allocating debt incurred “on‐behalf” of school boards to the School Board component unit column. Therefore, the School Board assets are included in the component unit column while the debts related to those assets are included in the Primary Government – Governmental Activities column on Exhibit 1. At June 30, 2013, the County has outstanding debt of $582,469 reflected in the Primary Government – Governmental Activities column on Exhibit 1 as a reduction to the unrestricted net position of the County. Similarly, assets of the Adult Detention Center are included in the component unit column, while the debts related to those assets are included in the Primary Government – Governmental Activities column on Exhibit 1. At June 30, 2013, the County has outstanding debt of $23,405 and $1,535 reflected in the Primary Government – Governmental Activities column on Exhibit 1 as a reduction to the unrestricted net position of the County, respectively. To assist the readers in understanding this relationship and to more accurately reflect the total entity’s financial condition, a total Reporting Entity column has been added to match the asset and related debt information.
97
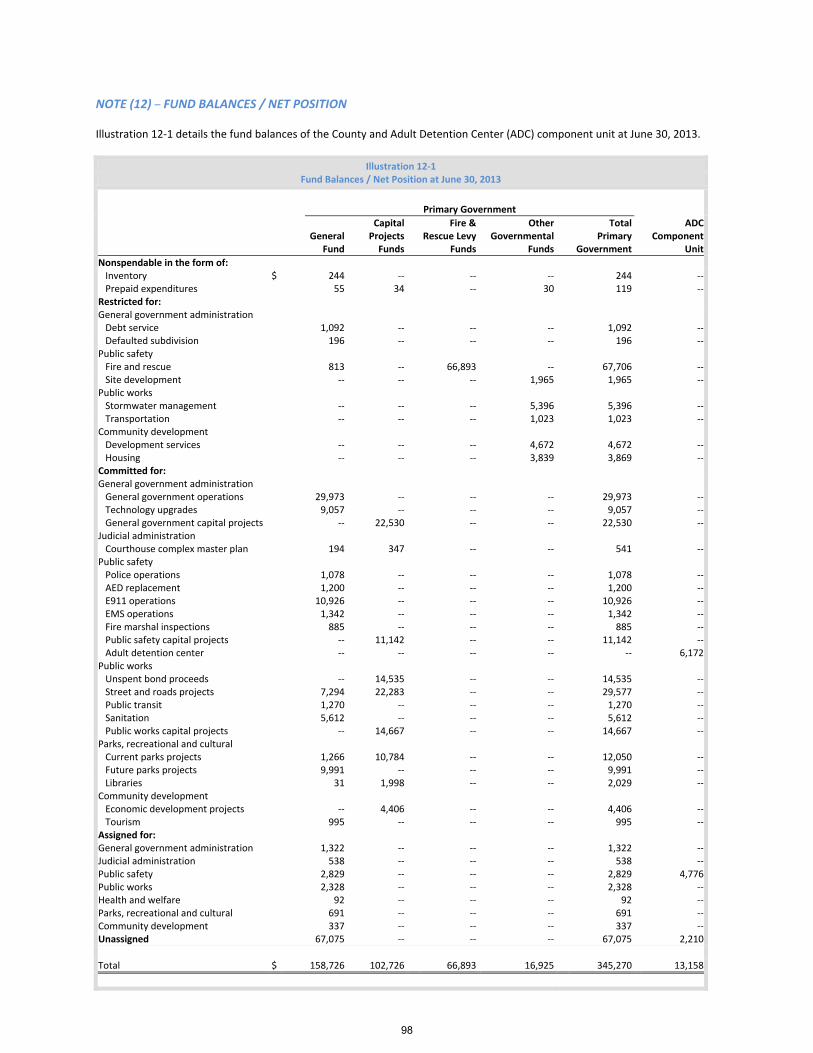
NOTE (12) – FUND BALANCES / NET POSITION Illustration 12‐1 details the fund balances of the County and Adult Detention Center (ADC) component unit at June 30, 2013.
Illustration 12‐1 Fund Balances / Net Position at June 30, 2013
Primary Government
Capital Fire & Other Total ADC General Projects Rescue Levy Governmental Primary Component Fund Funds Funds Funds Government Unit
Nonspendable in the form of: Inventory $ 244 ‐‐ ‐‐ ‐‐ 244 ‐‐ Prepaid expenditures 55 34 ‐‐ 30 119 ‐‐Restricted for: General government administration Debt service 1,092 ‐‐ ‐‐ ‐‐ 1,092 ‐‐ Defaulted subdivision 196 ‐‐ ‐‐ ‐‐ 196 ‐‐Public safety Fire and rescue 813 ‐‐ 66,893 ‐‐ 67,706 ‐‐ Site development ‐‐ ‐‐ ‐‐ 1,965 1,965 ‐‐Public works Stormwater management ‐‐ ‐‐ ‐‐ 5,396 5,396 ‐‐ Transportation ‐‐ ‐‐ ‐‐ 1,023 1,023 ‐‐Community development Development services ‐‐ ‐‐ ‐‐ 4,672 4,672 ‐‐ Housing ‐‐ ‐‐ ‐‐ 3,839 3,869 ‐‐Committed for: General government administration General government operations 29,973 ‐‐ ‐‐ ‐‐ 29,973 ‐‐ Technology upgrades 9,057 ‐‐ ‐‐ ‐‐ 9,057 ‐‐ General government capital projects ‐‐ 22,530 ‐‐ ‐‐ 22,530 ‐‐Judicial administration Courthouse complex master plan 194 347 ‐‐ ‐‐ 541 ‐‐Public safety Police operations 1,078 ‐‐ ‐‐ ‐‐ 1,078 ‐‐ AED replacement 1,200 ‐‐ ‐‐ ‐‐ 1,200 ‐‐ E911 operations 10,926 ‐‐ ‐‐ ‐‐ 10,926 ‐‐ EMS operations 1,342 ‐‐ ‐‐ ‐‐ 1,342 ‐‐ Fire marshal inspections 885 ‐‐ ‐‐ ‐‐ 885 ‐‐ Public safety capital projects ‐‐ 11,142 ‐‐ ‐‐ 11,142 ‐‐ Adult detention center ‐‐ ‐‐ ‐‐ ‐‐ ‐‐ 6,172Public works Unspent bond proceeds ‐‐ 14,535 ‐‐ ‐‐ 14,535 ‐‐ Street and roads projects 7,294 22,283 ‐‐ ‐‐ 29,577 ‐‐ Public transit 1,270 ‐‐ ‐‐ ‐‐ 1,270 ‐‐ Sanitation 5,612 ‐‐ ‐‐ ‐‐ 5,612 ‐‐ Public works capital projects ‐‐ 14,667 ‐‐ ‐‐ 14,667 ‐‐Parks, recreational and cultural Current parks projects 1,266 10,784 ‐‐ ‐‐ 12,050 ‐‐ Future parks projects 9,991 ‐‐ ‐‐ ‐‐ 9,991 ‐‐ Libraries 31 1,998 ‐‐ ‐‐ 2,029 ‐‐Community development Economic development projects ‐‐ 4,406 ‐‐ ‐‐ 4,406 ‐‐ Tourism 995 ‐‐ ‐‐ ‐‐ 995 ‐‐Assigned for: General government administration 1,322 ‐‐ ‐‐ ‐‐ 1,322 ‐‐Judicial administration 538 ‐‐ ‐‐ ‐‐ 538 ‐‐Public safety 2,829 ‐‐ ‐‐ ‐‐ 2,829 4,776Public works 2,328 ‐‐ ‐‐ ‐‐ 2,328 ‐‐Health and welfare 92 ‐‐ ‐‐ ‐‐ 92 ‐‐Parks, recreational and cultural 691 ‐‐ ‐‐ ‐‐ 691 ‐‐Community development 337 ‐‐ ‐‐ ‐‐ 337 ‐‐Unassigned 67,075 ‐‐ ‐‐ ‐‐ 67,075 2,210
Total $ 158,726 102,726 66,893 16,925 345,270 13,158
98

For further information about each classification of fund balance, see Note 1L. Restricted fund balances represent those portions of fund equity not appropriable for expenditure or legally segregated for a specific future use .Committed and Assigned fund balances represent the County's managerial plans for future use of financial resources. Unassigned fund balance is the residual classification for the general fund. The County’s restricted fund balance includes amounts restricted for debt service, unspent bond proceeds, cash equivalents, and related to revenues restricted in the Special Revenue funds. Committed Fund Balance. The County’s highest level of decision‐making authority is the Board of County Supervisors. The formal action required to establish, modify, or rescind a fund balance commitment is a resolution of the Board of County Supervisors. Assigned Fund Balance. Assignment of fund balance occurs only through the encumbrance of funds for particular purposes for which there is no existing fund balance restriction or commitment. Department directors have the authority to approve such encumbrances; the County Executive has the authority to modify or rescind any fund balance assignment per §100.12.6(a) of the County’s Purchasing Regulations. Fund balance assignments resulting from the encumbrance of funds are governed through the County’s Purchasing Regulations. Fund Balance Classification. The County considers restricted amounts to have been spent first when both restricted and unrestricted fund balance is available. When amounts from multiple fund balance classifications are eligible to be expended, the County considers the amounts to be spent first from the category with the most stringent constraints and last from the category with the least stringent constraints. Net Position. The reporting entity reported $139,880 of restricted net position at June 30, 2013. Of this amount, $83,818 is restricted by enabling legislation.
NOTE (13) – LANDFILL / CLOSURE AND POST CLOSURE CARE COST At the end of fiscal year 2013, the Landfill enterprise fund has generated sufficient revenue to maintain the Solid Waste Reserve in the General Fund for future bond coverage requirements. A total of $5,612, including interest earnings, is committed for Public Works in the General Fund’s fund balance for future landfill needs. State and federal laws and regulations require the County to place a final cover on its Independent Hill landfill site when it stops accepting waste and to perform certain maintenance and monitoring functions at the site for 30 years after closure. Although closure and post closure care costs will be paid only near or after the date that the landfill stops accepting waste, the County reports a portion of these closure and post closure care costs as an operating expense in each period based on landfill capacity used as of each financial statement date. The $12,291 reported as landfill closure and post closure care liability at June 30, 2013, represents the cumulative amount reported to date based on the use of 100% of the Phase I landfill, 13% of the Phase 2 landfill, and 39% of the total landfill capacity for the southern portion of the landfill, including Phases I, II and III. The total maximum exposure liability for closure and post closure care for all County solid waste facilities during the life of the landfill, as reported to the Virginia Department of Environmental Quality in December 2012, is $38,387. The County will recognize the remaining total estimated cost of closure and post closure care for the southern portion of the landfill of $27,085 as the remaining estimated capacity of the southern portion of the landfill is filled. These amounts are based on what it would cost to perform all closure and post closure care in 2013. The County expects to close the southern portion of the landfill site in the year 2033 and the entire landfill in 2060. Actual cost may be higher due to inflation, changes in technology, or changes in applicable laws or regulations.
NOTE (14) ‐ DEFINED BENEFIT PENSION PLANS A. Virginia Retirement System Plan Description: The County and the Adult Detention Center component unit contributes to the Virginia Retirement System (VRS), an agent and cost‐sharing multiple‐employer defined benefit pension plan administered by the VRS.
99
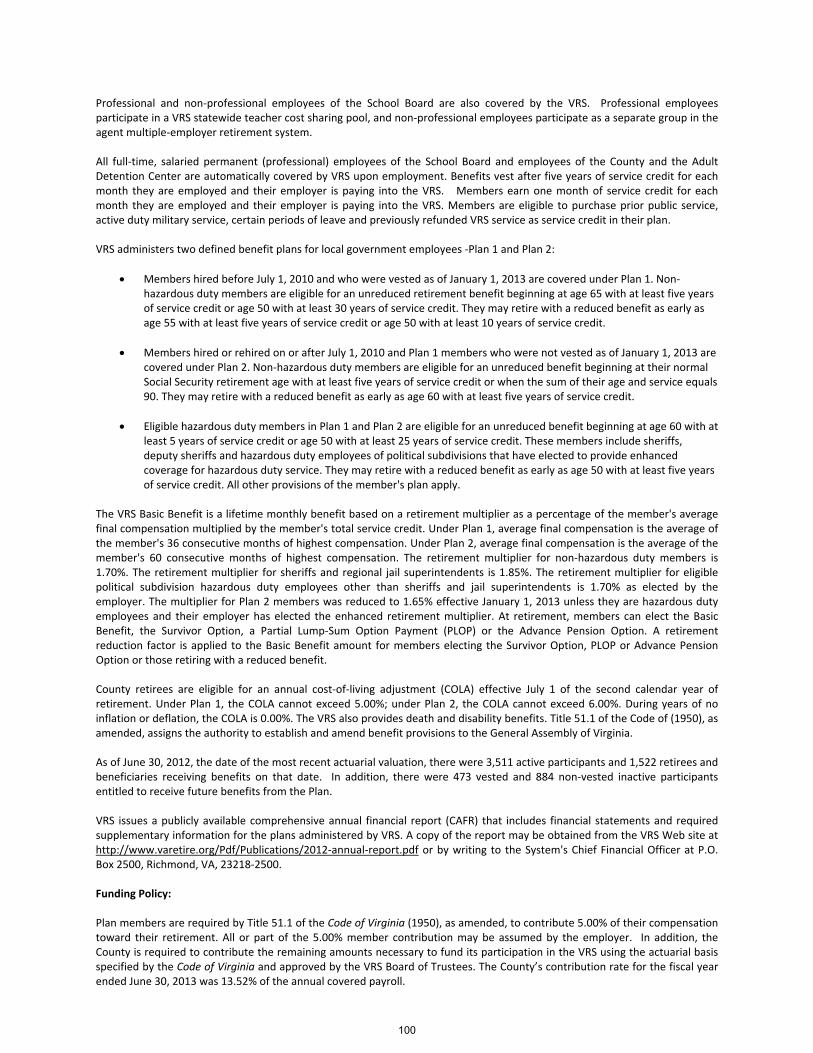
Professional and non‐professional employees of the School Board are also covered by the VRS. Professional employees participate in a VRS statewide teacher cost sharing pool, and non‐professional employees participate as a separate group in the agent multiple‐employer retirement system. All full‐time, salaried permanent (professional) employees of the School Board and employees of the County and the Adult Detention Center are automatically covered by VRS upon employment. Benefits vest after five years of service credit for each month they are employed and their employer is paying into the VRS. Members earn one month of service credit for each month they are employed and their employer is paying into the VRS. Members are eligible to purchase prior public service, active duty military service, certain periods of leave and previously refunded VRS service as service credit in their plan. VRS administers two defined benefit plans for local government employees ‐Plan 1 and Plan 2:
Members hired before July 1, 2010 and who were vested as of January 1, 2013 are covered under Plan 1. Non‐hazardous duty members are eligible for an unreduced retirement benefit beginning at age 65 with at least five years of service credit or age 50 with at least 30 years of service credit. They may retire with a reduced benefit as early as age 55 with at least five years of service credit or age 50 with at least 10 years of service credit.
Members hired or rehired on or after July 1, 2010 and Plan 1 members who were not vested as of January 1, 2013 are covered under Plan 2. Non‐hazardous duty members are eligible for an unreduced benefit beginning at their normal Social Security retirement age with at least five years of service credit or when the sum of their age and service equals 90. They may retire with a reduced benefit as early as age 60 with at least five years of service credit.
Eligible hazardous duty members in Plan 1 and Plan 2 are eligible for an unreduced benefit beginning at age 60 with at least 5 years of service credit or age 50 with at least 25 years of service credit. These members include sheriffs, deputy sheriffs and hazardous duty employees of political subdivisions that have elected to provide enhanced coverage for hazardous duty service. They may retire with a reduced benefit as early as age 50 with at least five years of service credit. All other provisions of the member's plan apply.
The VRS Basic Benefit is a lifetime monthly benefit based on a retirement multiplier as a percentage of the member's average final compensation multiplied by the member's total service credit. Under Plan 1, average final compensation is the average of the member's 36 consecutive months of highest compensation. Under Plan 2, average final compensation is the average of the member's 60 consecutive months of highest compensation. The retirement multiplier for non‐hazardous duty members is 1.70%. The retirement multiplier for sheriffs and regional jail superintendents is 1.85%. The retirement multiplier for eligible political subdivision hazardous duty employees other than sheriffs and jail superintendents is 1.70% as elected by the employer. The multiplier for Plan 2 members was reduced to 1.65% effective January 1, 2013 unless they are hazardous duty employees and their employer has elected the enhanced retirement multiplier. At retirement, members can elect the Basic Benefit, the Survivor Option, a Partial Lump‐Sum Option Payment (PLOP) or the Advance Pension Option. A retirement reduction factor is applied to the Basic Benefit amount for members electing the Survivor Option, PLOP or Advance Pension Option or those retiring with a reduced benefit. County retirees are eligible for an annual cost‐of‐living adjustment (COLA) effective July 1 of the second calendar year of retirement. Under Plan 1, the COLA cannot exceed 5.00%; under Plan 2, the COLA cannot exceed 6.00%. During years of no inflation or deflation, the COLA is 0.00%. The VRS also provides death and disability benefits. Title 51.1 of the Code of (1950), as amended, assigns the authority to establish and amend benefit provisions to the General Assembly of Virginia. As of June 30, 2012, the date of the most recent actuarial valuation, there were 3,511 active participants and 1,522 retirees and beneficiaries receiving benefits on that date. In addition, there were 473 vested and 884 non‐vested inactive participants entitled to receive future benefits from the Plan. VRS issues a publicly available comprehensive annual financial report (CAFR) that includes financial statements and required supplementary information for the plans administered by VRS. A copy of the report may be obtained from the VRS Web site at http://www.varetire.org/Pdf/Publications/2012‐annual‐report.pdf or by writing to the System's Chief Financial Officer at P.O. Box 2500, Richmond, VA, 23218‐2500. Funding Policy: Plan members are required by Title 51.1 of the Code of Virginia (1950), as amended, to contribute 5.00% of their compensation toward their retirement. All or part of the 5.00% member contribution may be assumed by the employer. In addition, the County is required to contribute the remaining amounts necessary to fund its participation in the VRS using the actuarial basis specified by the Code of Virginia and approved by the VRS Board of Trustees. The County’s contribution rate for the fiscal year ended June 30, 2013 was 13.52% of the annual covered payroll.
100
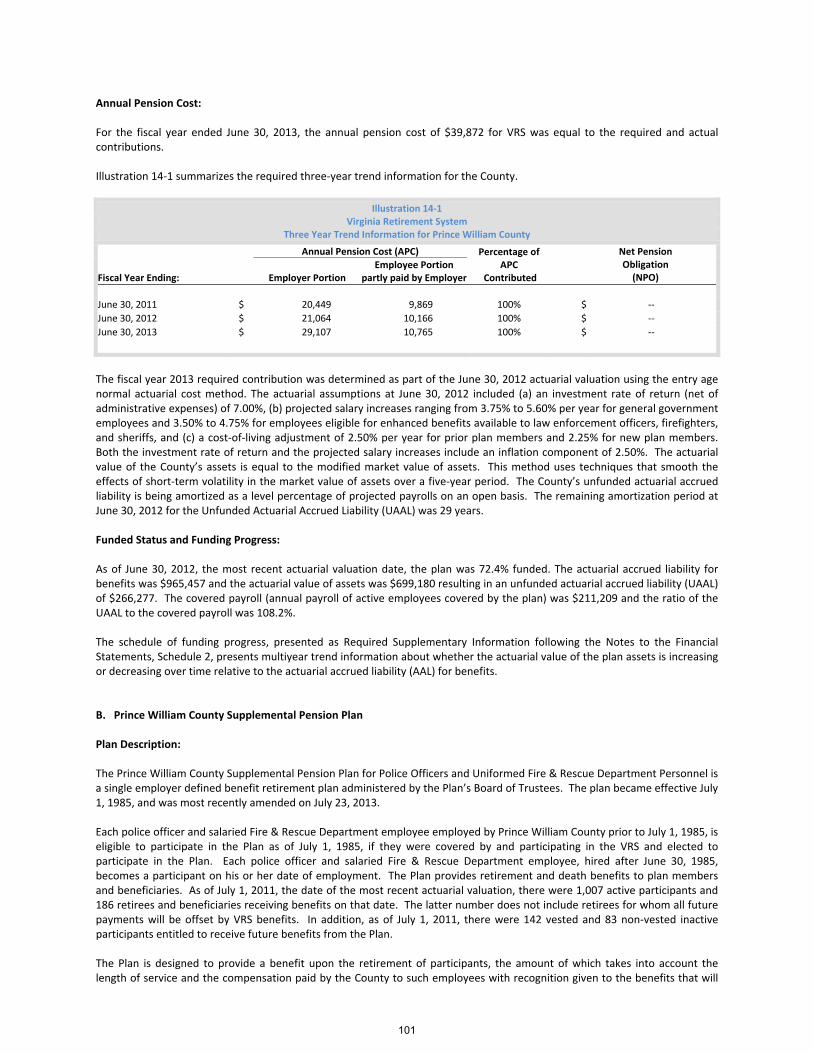
Annual Pension Cost: For the fiscal year ended June 30, 2013, the annual pension cost of $39,872 for VRS was equal to the required and actual contributions. Illustration 14‐1 summarizes the required three‐year trend information for the County.
Illustration 14‐1 Virginia Retirement System
Three Year Trend Information for Prince William County
Fiscal Year Ending:
Annual Pension Cost (APC) Percentage of APC
Contributed
Net Pension Obligation (NPO) Employer Portion
Employee Portion partly paid by Employer
June 30, 2011 $ 20,449 9,869 100% $ ‐‐
June 30, 2012 $ 21,064 10,166 100% $ ‐‐
June 30, 2013 $ 29,107 10,765 100% $ ‐‐
The fiscal year 2013 required contribution was determined as part of the June 30, 2012 actuarial valuation using the entry age normal actuarial cost method. The actuarial assumptions at June 30, 2012 included (a) an investment rate of return (net of administrative expenses) of 7.00%, (b) projected salary increases ranging from 3.75% to 5.60% per year for general government employees and 3.50% to 4.75% for employees eligible for enhanced benefits available to law enforcement officers, firefighters, and sheriffs, and (c) a cost‐of‐living adjustment of 2.50% per year for prior plan members and 2.25% for new plan members. Both the investment rate of return and the projected salary increases include an inflation component of 2.50%. The actuarial value of the County’s assets is equal to the modified market value of assets. This method uses techniques that smooth the effects of short‐term volatility in the market value of assets over a five‐year period. The County’s unfunded actuarial accrued liability is being amortized as a level percentage of projected payrolls on an open basis. The remaining amortization period at June 30, 2012 for the Unfunded Actuarial Accrued Liability (UAAL) was 29 years. Funded Status and Funding Progress: As of June 30, 2012, the most recent actuarial valuation date, the plan was 72.4% funded. The actuarial accrued liability for benefits was $965,457 and the actuarial value of assets was $699,180 resulting in an unfunded actuarial accrued liability (UAAL) of $266,277. The covered payroll (annual payroll of active employees covered by the plan) was $211,209 and the ratio of the UAAL to the covered payroll was 108.2%. The schedule of funding progress, presented as Required Supplementary Information following the Notes to the Financial Statements, Schedule 2, presents multiyear trend information about whether the actuarial value of the plan assets is increasing or decreasing over time relative to the actuarial accrued liability (AAL) for benefits. B. Prince William County Supplemental Pension Plan Plan Description: The Prince William County Supplemental Pension Plan for Police Officers and Uniformed Fire & Rescue Department Personnel is a single employer defined benefit retirement plan administered by the Plan’s Board of Trustees. The plan became effective July 1, 1985, and was most recently amended on July 23, 2013. Each police officer and salaried Fire & Rescue Department employee employed by Prince William County prior to July 1, 1985, is eligible to participate in the Plan as of July 1, 1985, if they were covered by and participating in the VRS and elected to participate in the Plan. Each police officer and salaried Fire & Rescue Department employee, hired after June 30, 1985, becomes a participant on his or her date of employment. The Plan provides retirement and death benefits to plan members and beneficiaries. As of July 1, 2011, the date of the most recent actuarial valuation, there were 1,007 active participants and 186 retirees and beneficiaries receiving benefits on that date. The latter number does not include retirees for whom all future payments will be offset by VRS benefits. In addition, as of July 1, 2011, there were 142 vested and 83 non‐vested inactive participants entitled to receive future benefits from the Plan. The Plan is designed to provide a benefit upon the retirement of participants, the amount of which takes into account the length of service and the compensation paid by the County to such employees with recognition given to the benefits that will
101
be provided by the VRS. Normal retirement date is the earlier of the participant’s 55th birthday or the completion of 25 years of credited service. Benefits, at the participants’ election, are i) the larger of 1.5% of the participant’s final average compensation times credited service or 1.65% of the final average compensation in excess of $1.2 multiplied by the years of credited service; ii) a temporary annuity of $0.54 per month for 15 years for participants who left employment prior to March 30, 2001, and then elect benefit commencement on or after such date or a temporary annuity of $0.64 per month for 15 years for participants employed on or after March 30, 2001; or iii) a lump sum benefit of the participant contribution plus the employer’s contributions during the period of employment. Final average compensation for participants hired before July 1, 2010 is the base salary of an employee for the 36 consecutive calendar months producing the highest total, selected from the 120 calendar months immediately preceding actual retirement or termination, divided by 36 (or total months of service if less). Final average compensation for participants hired after June 30, 2010 is the base salary of an employee for the 60 consecutive calendar months producing the highest total, selected from the 120 calendar months immediately preceding actual retirement or termination, divided by 60 (or total months of service if less). Participants shall vest 100% in the benefit provided under the Plan upon attainment of the participant’s normal retirement date. Participants are considered vested and eligible for early retirement after 20 years of credited service, but the benefits are reduced ½% for each month the commencement date precedes the normal retirement date. As an alternative, the member may elect a temporary annuity of $0.32 thousand per month for 15 years, multiplied by the ratio of the number of completed years of service at early retirement date to 25 or the withdrawal benefit. Any participant or spouse receiving a monthly benefit for at least one year is eligible for the pension increase each July 1st. The benefit will be increased by 100% of the first 3% increase in the cost‐of‐living index plus 50% of the increase in the cost‐of‐living index in excess of 3%. Increases in the cost‐of‐living index in excess of 7% are not recognized. Increases do not apply to supplemental benefits or early retirement pensions. Effective July 1, 2007, contributions from both the employee and the County ceased when an active employee attains the latter of age 50 and 25 years of service. Effective July 1, 2013, these contributions were reinstated. These benefit provisions, and the contributions required to pay them, were established and may be amended by authority of the Plan’s Board of Trustees. The plan does not issue a publicly available financial report. Funding Policy and Annual Pension Cost: The funding policy of the Plan provides for periodic employer contributions at actuarially determined rates which will remain relatively level over time as a percentage of payroll and will accumulate sufficient assets to meet the cost of all basic benefits when due. The Board of Trustees has fixed the annual contribution rate at 1.37% based on the actuarially recommended rate in the July 1, 1999 valuation report. Biennially calculated actuarial contribution percentages are used as a guide to determine changes in the fixed contribution percentage. Contribution rates are developed using the aggregate actuarial cost method. Under this funding method, there is no unfunded actuarial accrued liability. The actuarial accrued liability was determined as part of a biennial actuarial valuation as of June 30, 2011. Significant actuarial assumptions used include (a) a rate of return on the investment of present and future assets of 7.0% per year compounded annually, (b) projected salary increases of 4.5% per year compounded annually, (c) rate of increase in Consumer Price Index of 3% per year compounded annually, and (d) post‐retirement benefit increases of 3% per year. Both (a) and (b) included an inflation component of 3.0%. The actuarial value of the Plan’s assets is equal to the market value of the assets with gains and losses smoothed out over five years. Benefits and refunds of the Plan are recognized when due and payable in accordance with the terms of the plan. For terminating employees under 20 years, a refund of employee contributions including 4% interest per annum can be issued, if formally requested, but they are not entitled to future benefits. For the same group with 20 plus years, they can either receive a refund of all contributions including interest, or future benefits, but not both. For the year ended June 30, 2013, the County’s annual pension cost based on the actuarially determined contribution was $1,878 ($939 employer and $939 employee) which was less than the actual contribution of $1,892 ($946 employer and $946 employee) resulting in a negative net pension obligation (net pension asset). Employer contributions in fiscal year 2013 represented approximately 1.37% of gross salary as compared to the actuarially determined contribution of approximately 1.36%. Employee contributions in fiscal year 2013 represented approximately 1.37% of gross salary as compared to the actuarially determined contribution of approximately 1.36% The County reserves the right to terminate its participation in this Plan at any time. Such termination shall be by resolution. A certified copy of such resolution shall be delivered to the Board of Trustees and the County shall notify its employees. The Plan shall also terminate upon the County’s complete discontinuance of contributions to the Plan; should such an event occur, the County shall give written notice of such termination to the parties. Upon termination, or partial termination, of the Plan by the County, or upon the County’s permanent discontinuance of contributions to the Plan, the rights of each affected participant shall be fully vested and non‐forfeitable. The Plan additions fund the cost of administering the plan.
102
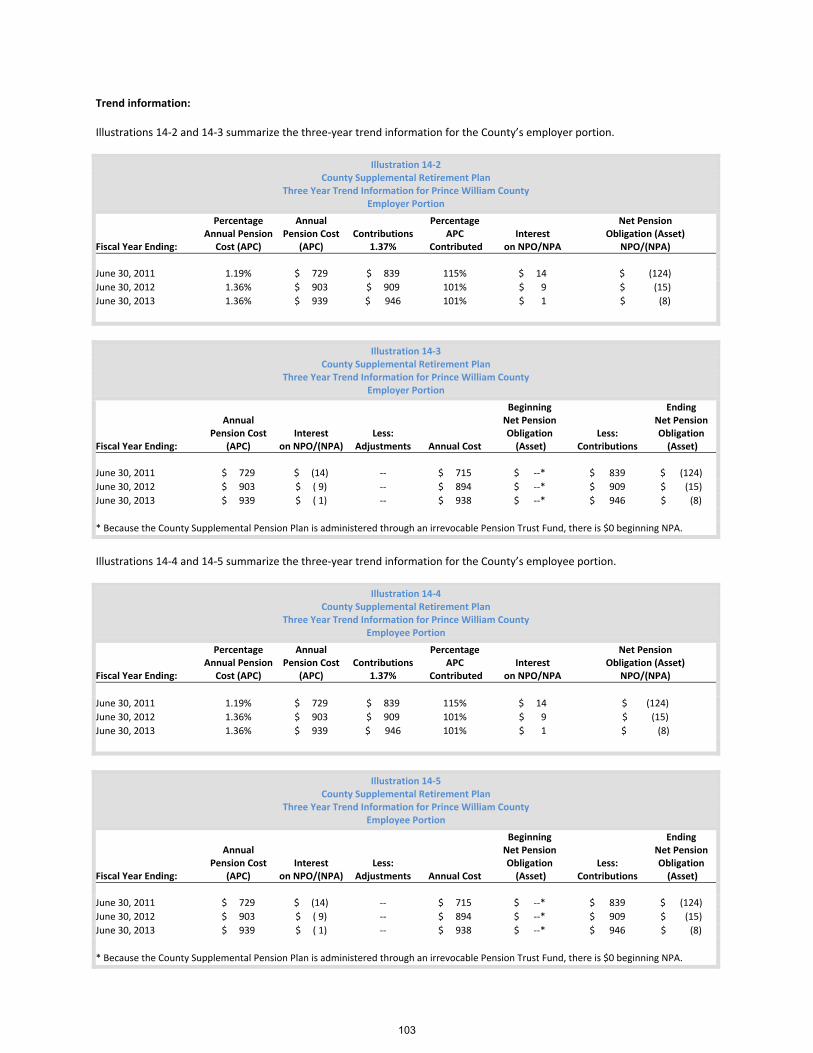
Trend information: Illustrations 14‐2 and 14‐3 summarize the three‐year trend information for the County’s employer portion.
Illustration 14‐2 County Supplemental Retirement Plan
Three Year Trend Information for Prince William County Employer Portion
Fiscal Year Ending:
Percentage Annual Pension
Cost (APC)
Annual Pension Cost
(APC) Contributions
1.37%
Percentage APC
Contributed
Interest
on NPO/NPA
Net Pension Obligation (Asset)
NPO/(NPA)
June 30, 2011 1.19% $ 729 $ 839 115% $ 14 $ (124)
June 30, 2012 1.36% $ 903 $ 909 101% $ 9 $ (15)
June 30, 2013 1.36% $ 939 $ 946 101% $ 1 $ (8)
Illustration 14‐3 County Supplemental Retirement Plan
Three Year Trend Information for Prince William County Employer Portion
Fiscal Year Ending:
Annual
Pension Cost (APC)
Interest on NPO/(NPA)
Less: Adjustments
Annual Cost
Beginning Net Pension Obligation (Asset)
Less: Contributions
Ending Net Pension Obligation (Asset)
June 30, 2011 $ 729 $ (14) ‐‐ $ 715 $ ‐‐* $ 839 $ (124)
June 30, 2012 $ 903 $ ( 9) ‐‐ $ 894 $ ‐‐* $ 909 $ (15)
June 30, 2013 $ 939 $ ( 1) ‐‐ $ 938 $ ‐‐* $ 946 $ (8)
* Because the County Supplemental Pension Plan is administered through an irrevocable Pension Trust Fund, there is $0 beginning NPA.
Illustrations 14‐4 and 14‐5 summarize the three‐year trend information for the County’s employee portion.
Illustration 14‐4 County Supplemental Retirement Plan
Three Year Trend Information for Prince William County Employee Portion
Fiscal Year Ending:
Percentage Annual Pension
Cost (APC)
Annual Pension Cost
(APC) Contributions
1.37%
Percentage APC
Contributed
Interest
on NPO/NPA
Net Pension Obligation (Asset)
NPO/(NPA)
June 30, 2011 1.19% $ 729 $ 839 115% $ 14 $ (124)
June 30, 2012 1.36% $ 903 $ 909 101% $ 9 $ (15)
June 30, 2013 1.36% $ 939 $ 946 101% $ 1 $ (8)
Illustration 14‐5 County Supplemental Retirement Plan
Three Year Trend Information for Prince William County Employee Portion
Fiscal Year Ending:
Annual
Pension Cost (APC)
Interest on NPO/(NPA)
Less: Adjustments
Annual Cost
Beginning Net Pension Obligation (Asset)
Less: Contributions
Ending Net Pension Obligation (Asset)
June 30, 2011 $ 729 $ (14) ‐‐ $ 715 $ ‐‐* $ 839 $ (124)
June 30, 2012 $ 903 $ ( 9) ‐‐ $ 894 $ ‐‐* $ 909 $ (15)
June 30, 2013 $ 939 $ ( 1) ‐‐ $ 938 $ ‐‐* $ 946 $ (8)
* Because the County Supplemental Pension Plan is administered through an irrevocable Pension Trust Fund, there is $0 beginning NPA.
103
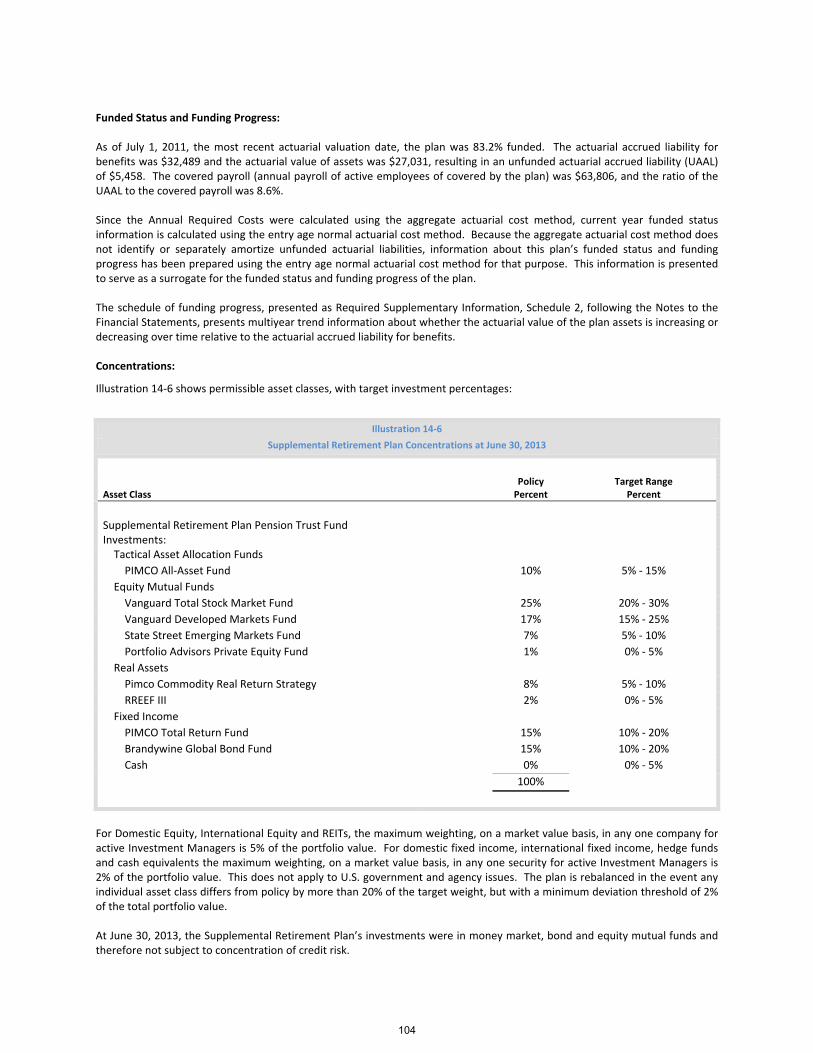
Funded Status and Funding Progress: As of July 1, 2011, the most recent actuarial valuation date, the plan was 83.2% funded. The actuarial accrued liability for benefits was $32,489 and the actuarial value of assets was $27,031, resulting in an unfunded actuarial accrued liability (UAAL) of $5,458. The covered payroll (annual payroll of active employees of covered by the plan) was $63,806, and the ratio of the UAAL to the covered payroll was 8.6%. Since the Annual Required Costs were calculated using the aggregate actuarial cost method, current year funded status information is calculated using the entry age normal actuarial cost method. Because the aggregate actuarial cost method does not identify or separately amortize unfunded actuarial liabilities, information about this plan’s funded status and funding progress has been prepared using the entry age normal actuarial cost method for that purpose. This information is presented to serve as a surrogate for the funded status and funding progress of the plan. The schedule of funding progress, presented as Required Supplementary Information, Schedule 2, following the Notes to the Financial Statements, presents multiyear trend information about whether the actuarial value of the plan assets is increasing or decreasing over time relative to the actuarial accrued liability for benefits. Concentrations:
Illustration 14‐6 shows permissible asset classes, with target investment percentages:
Illustration 14‐6
Supplemental Retirement Plan Concentrations at June 30, 2013
Asset Class
Policy Percent
Target Range Percent
Supplemental Retirement Plan Pension Trust Fund Investments:
Tactical Asset Allocation Funds
PIMCO All‐Asset Fund 10% 5% ‐ 15%
Equity Mutual Funds
Vanguard Total Stock Market Fund 25% 20% ‐ 30%
Vanguard Developed Markets Fund 17% 15% ‐ 25%
State Street Emerging Markets Fund 7% 5% ‐ 10%
Portfolio Advisors Private Equity Fund 1% 0% ‐ 5%
Real Assets
Pimco Commodity Real Return Strategy 8% 5% ‐ 10%
RREEF III 2% 0% ‐ 5%
Fixed Income
PIMCO Total Return Fund 15% 10% ‐ 20%
Brandywine Global Bond Fund 15% 10% ‐ 20%
Cash 0% 0% ‐ 5%
100%
For Domestic Equity, International Equity and REITs, the maximum weighting, on a market value basis, in any one company for active Investment Managers is 5% of the portfolio value. For domestic fixed income, international fixed income, hedge funds and cash equivalents the maximum weighting, on a market value basis, in any one security for active Investment Managers is 2% of the portfolio value. This does not apply to U.S. government and agency issues. The plan is rebalanced in the event any individual asset class differs from policy by more than 20% of the target weight, but with a minimum deviation threshold of 2% of the total portfolio value. At June 30, 2013, the Supplemental Retirement Plan’s investments were in money market, bond and equity mutual funds and therefore not subject to concentration of credit risk.
104
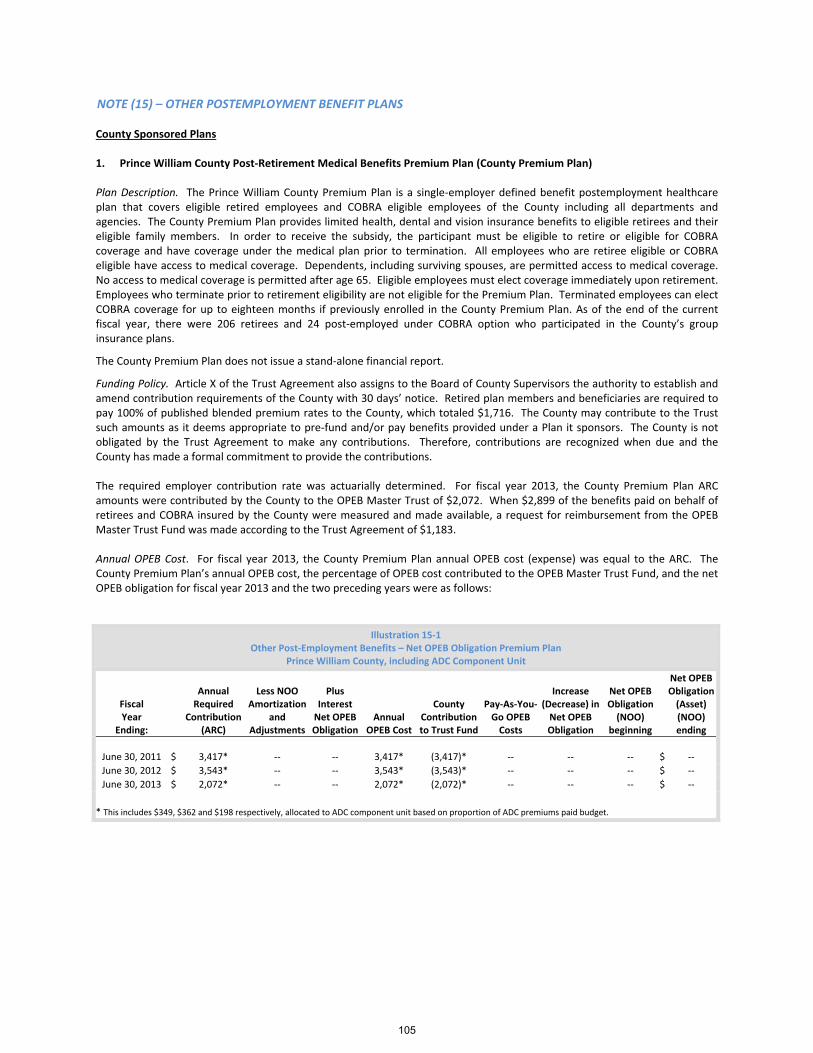
NOTE (15) – OTHER POSTEMPLOYMENT BENEFIT PLANS County Sponsored Plans 1. Prince William County Post‐Retirement Medical Benefits Premium Plan (County Premium Plan)
Plan Description. The Prince William County Premium Plan is a single‐employer defined benefit postemployment healthcare plan that covers eligible retired employees and COBRA eligible employees of the County including all departments and agencies. The County Premium Plan provides limited health, dental and vision insurance benefits to eligible retirees and their eligible family members. In order to receive the subsidy, the participant must be eligible to retire or eligible for COBRA coverage and have coverage under the medical plan prior to termination. All employees who are retiree eligible or COBRA eligible have access to medical coverage. Dependents, including surviving spouses, are permitted access to medical coverage. No access to medical coverage is permitted after age 65. Eligible employees must elect coverage immediately upon retirement. Employees who terminate prior to retirement eligibility are not eligible for the Premium Plan. Terminated employees can elect COBRA coverage for up to eighteen months if previously enrolled in the County Premium Plan. As of the end of the current fiscal year, there were 206 retirees and 24 post‐employed under COBRA option who participated in the County’s group insurance plans.
The County Premium Plan does not issue a stand‐alone financial report.
Funding Policy. Article X of the Trust Agreement also assigns to the Board of County Supervisors the authority to establish and amend contribution requirements of the County with 30 days’ notice. Retired plan members and beneficiaries are required to pay 100% of published blended premium rates to the County, which totaled $1,716. The County may contribute to the Trust such amounts as it deems appropriate to pre‐fund and/or pay benefits provided under a Plan it sponsors. The County is not obligated by the Trust Agreement to make any contributions. Therefore, contributions are recognized when due and the County has made a formal commitment to provide the contributions.
The required employer contribution rate was actuarially determined. For fiscal year 2013, the County Premium Plan ARC amounts were contributed by the County to the OPEB Master Trust of $2,072. When $2,899 of the benefits paid on behalf of retirees and COBRA insured by the County were measured and made available, a request for reimbursement from the OPEB Master Trust Fund was made according to the Trust Agreement of $1,183. Annual OPEB Cost. For fiscal year 2013, the County Premium Plan annual OPEB cost (expense) was equal to the ARC. The County Premium Plan’s annual OPEB cost, the percentage of OPEB cost contributed to the OPEB Master Trust Fund, and the net OPEB obligation for fiscal year 2013 and the two preceding years were as follows:
Illustration 15‐1 Other Post‐Employment Benefits – Net OPEB Obligation Premium Plan
Prince William County, including ADC Component Unit
Fiscal Year
Ending:
Annual Required
Contribution (ARC)
Less NOO Amortization
and Adjustments
Plus Interest Net OPEB Obligation
Annual OPEB Cost
County Contribution to Trust Fund
Pay‐As‐You‐Go OPEB Costs
Increase (Decrease) in Net OPEB Obligation
Net OPEB Obligation (NOO)
beginning
Net OPEB Obligation (Asset) (NOO) ending
June 30, 2011 $ 3,417* ‐‐ ‐‐ 3,417* (3,417)* ‐‐ ‐‐ ‐‐ $ ‐‐
June 30, 2012 $ 3,543* ‐‐ ‐‐ 3,543* (3,543)* ‐‐ ‐‐ ‐‐ $ ‐‐
June 30, 2013 $ 2,072* ‐‐ ‐‐ 2,072* (2,072)* ‐‐ ‐‐ ‐‐ $ ‐‐
* This includes $349, $362 and $198 respectively, allocated to ADC component unit based on proportion of ADC premiums paid budget.
105
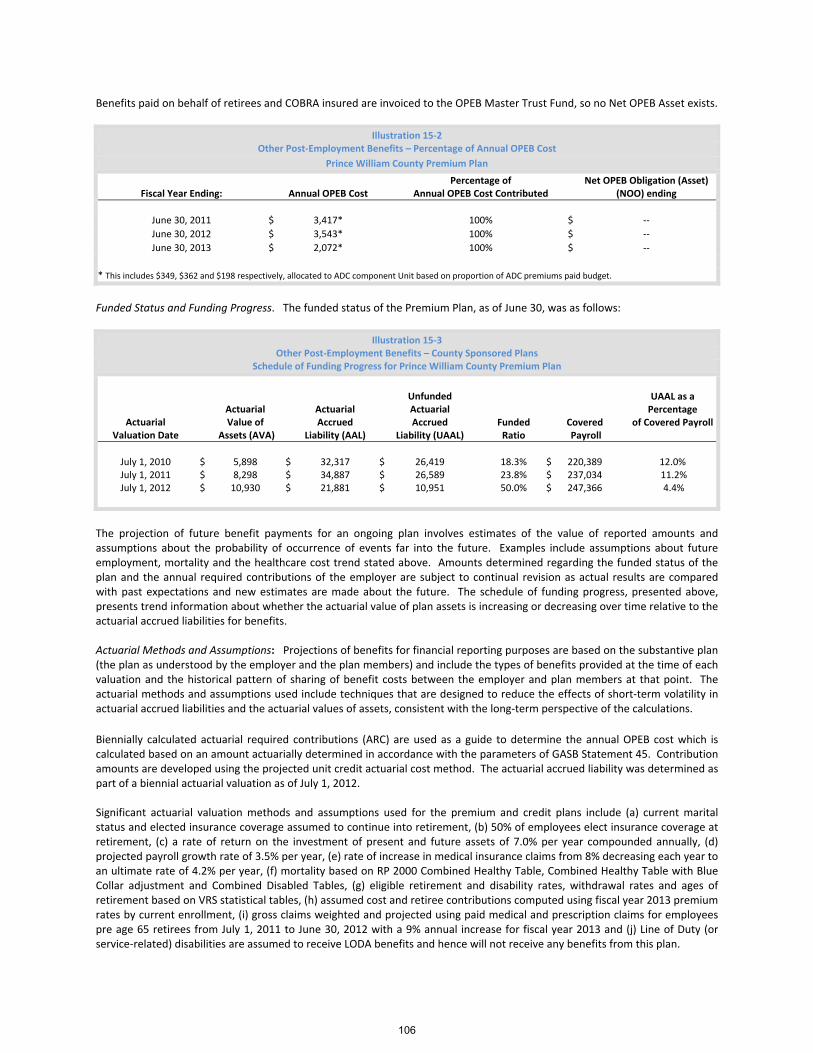
Benefits paid on behalf of retirees and COBRA insured are invoiced to the OPEB Master Trust Fund, so no Net OPEB Asset exists.
Illustration 15‐2 Other Post‐Employment Benefits – Percentage of Annual OPEB Cost
Prince William County Premium Plan
Fiscal Year Ending:
Annual OPEB Cost Percentage of
Annual OPEB Cost Contributed Net OPEB Obligation (Asset)
(NOO) ending
June 30, 2011 $ 3,417* 100% $ ‐‐
June 30, 2012 $ 3,543* 100% $ ‐‐
June 30, 2013 $ 2,072* 100% $ ‐‐
* This includes $349, $362 and $198 respectively, allocated to ADC component Unit based on proportion of ADC premiums paid budget.
Funded Status and Funding Progress. The funded status of the Premium Plan, as of June 30, was as follows:
Illustration 15‐3 Other Post‐Employment Benefits – County Sponsored Plans
Schedule of Funding Progress for Prince William County Premium Plan
Actuarial Valuation Date
Actuarial Value of
Assets (AVA)
Actuarial Accrued
Liability (AAL)
Unfunded Actuarial Accrued
Liability (UAAL)
Funded Ratio
Covered Payroll
UAAL as a Percentage
of Covered Payroll
July 1, 2010 $ 5,898 $ 32,317 $ 26,419 18.3% $ 220,389 12.0% July 1, 2011 $ 8,298 $ 34,887 $ 26,589 23.8% $ 237,034 11.2% July 1, 2012 $ 10,930 $ 21,881 $ 10,951 50.0% $ 247,366 4.4%
The projection of future benefit payments for an ongoing plan involves estimates of the value of reported amounts and assumptions about the probability of occurrence of events far into the future. Examples include assumptions about future employment, mortality and the healthcare cost trend stated above. Amounts determined regarding the funded status of the plan and the annual required contributions of the employer are subject to continual revision as actual results are compared with past expectations and new estimates are made about the future. The schedule of funding progress, presented above, presents trend information about whether the actuarial value of plan assets is increasing or decreasing over time relative to the actuarial accrued liabilities for benefits. Actuarial Methods and Assumptions: Projections of benefits for financial reporting purposes are based on the substantive plan (the plan as understood by the employer and the plan members) and include the types of benefits provided at the time of each valuation and the historical pattern of sharing of benefit costs between the employer and plan members at that point. The actuarial methods and assumptions used include techniques that are designed to reduce the effects of short‐term volatility in actuarial accrued liabilities and the actuarial values of assets, consistent with the long‐term perspective of the calculations.
Biennially calculated actuarial required contributions (ARC) are used as a guide to determine the annual OPEB cost which is calculated based on an amount actuarially determined in accordance with the parameters of GASB Statement 45. Contribution amounts are developed using the projected unit credit actuarial cost method. The actuarial accrued liability was determined as part of a biennial actuarial valuation as of July 1, 2012. Significant actuarial valuation methods and assumptions used for the premium and credit plans include (a) current marital status and elected insurance coverage assumed to continue into retirement, (b) 50% of employees elect insurance coverage at retirement, (c) a rate of return on the investment of present and future assets of 7.0% per year compounded annually, (d) projected payroll growth rate of 3.5% per year, (e) rate of increase in medical insurance claims from 8% decreasing each year to an ultimate rate of 4.2% per year, (f) mortality based on RP 2000 Combined Healthy Table, Combined Healthy Table with Blue Collar adjustment and Combined Disabled Tables, (g) eligible retirement and disability rates, withdrawal rates and ages of retirement based on VRS statistical tables, (h) assumed cost and retiree contributions computed using fiscal year 2013 premium rates by current enrollment, (i) gross claims weighted and projected using paid medical and prescription claims for employees pre age 65 retirees from July 1, 2011 to June 30, 2012 with a 9% annual increase for fiscal year 2013 and (j) Line of Duty (or service‐related) disabilities are assumed to receive LODA benefits and hence will not receive any benefits from this plan.
106

2. Prince William County Post‐Retirement Medical Benefits Credit Plan (RHICP)
Plan Description. The County RHICP is a single‐employer defined benefit postemployment healthcare plan that covers eligible employees or former employees of the County including all departments and agencies. The RHICP provides $5.50 per month, per year of service (maximum 30 years) paid for life towards the purchase of a medical insurance plan, benefit referred to as the Retiree Health Insurance Credit Plan (RHICP). Disabled employees receive the full 30‐year allowance. However, employees disabled in‐service, where the County pays the entire cost of insurance, do not receive the subsidy. The medical insurance plan can be the County Premium Plan or any health plan of the retiree’s choosing. In order to receive the subsidy, the retiree must have 15 years of service with the County and must be receiving a pension payment from the VRS or the County Supplemental Retirement Plan. Terminated vested employees are allowed. The health insurance credit cannot be used for spousal coverage. The retirees are granted the option to participate by paying 100 percent of their monthly health insurance premium towards the County Premium Plan less $5.50 times years of service for a maximum health insurance credit of $165 from the County. For the year ended June 30, 2013, the County paid $1,169 to 768 eligible retirees for the retiree health insurance credit plan.
The County RHICP does not issue a stand‐alone financial report.
Funding Policy. Article X of the Trust Agreement also assigns to the Board of County Supervisors the authority to establish and amend contribution requirements of the County with 30 days’ notice. Retired plan members and beneficiaries do not pay for coverage under the RHICP. The County may contribute to the Trust such amounts as it deems appropriate to pre‐fund and/or pay benefits provided under a Plan it sponsors. The County is not obligated by the Trust Agreement to make any contributions. Therefore, contributions are recognized when due and the County has made a formal commitment to provide the contributions. The required employer contribution rate was actuarially determined. For fiscal year 2013, the County RHICP ARC amounts were contributed by the County to the OPEB Master Trust of $2,082. When $1,169 of the benefits paid to the County’s retirees were measured and made available, a request for reimbursement from the OPEB Master Trust Fund was made according to the Trust Agreement of $1,169. Annual OPEB Cost. For fiscal year 2013, the RHICP annual OPEB cost (expense) was equal to the ARC. The County RHICP’s annual OPEB cost, the percentage of OPEB cost contributed to the OPEB Master Trust Fund, and the net OPEB obligation for fiscal year 2013 and the two preceding years were as follows:
Illustration 15‐4 Other Post‐Employment Benefits – Net OPEB Obligation RHICP
Prince William County, including ADC Component Unit
Fiscal Year
Ending:
Annual Required
Contribution (ARC)
Less NOO Amortization
and Adjustments
Plus Interest Net OPEB Obligation
Annual OPEB Cost
County Contribution to Trust Fund
Pay‐As‐You‐Go OPEB Costs
Increase (Decrease) in Net OPEB Obligation
Net OPEB Obligation (NOO)
beginning
Net OPEB Obligation (Asset) (NOO) ending
June 30, 2011 $ 1,811* ‐‐ ‐‐ 1,811* (1,811)* ‐‐ ‐‐ ‐‐ $ ‐‐
June 30, 2012 $ 1,844* ‐‐ ‐‐ 1,844* (1,844)* ‐‐ ‐‐ ‐‐ $ ‐‐
June 30, 2013 $ 2,082* ‐‐ ‐‐ 2,082* (2,082)* ‐‐ ‐‐ ‐‐ $ ‐‐
* This includes $160, $160 and $167, respectively, allocated to ADC component unit based on proportion of RHICP budget.
Benefits paid to retirees are invoiced to the OPEB Master Trust Fund, so no Net OPEB Asset exists.
Illustration 15‐5 Other Post‐Employment Benefits – Percentage of Annual OPEB Cost
Prince William County Retiree Health Insurance Credit Plan
Fiscal Year Ending:
Annual OPEB Cost Percentage of
Annual OPEB Cost Contributed Net OPEB Obligation (Asset)
(NOO) ending
June 30, 2011 $ 1,811* 100% $ ‐‐
June 30, 2012 $ 1,844* 100% $ ‐‐
June 30, 2013 $ 2,082* 100% $ ‐‐
* This includes $160, $160 and $167, respectively, allocated to ADC component unit based on proportion of RHICP budget.
107
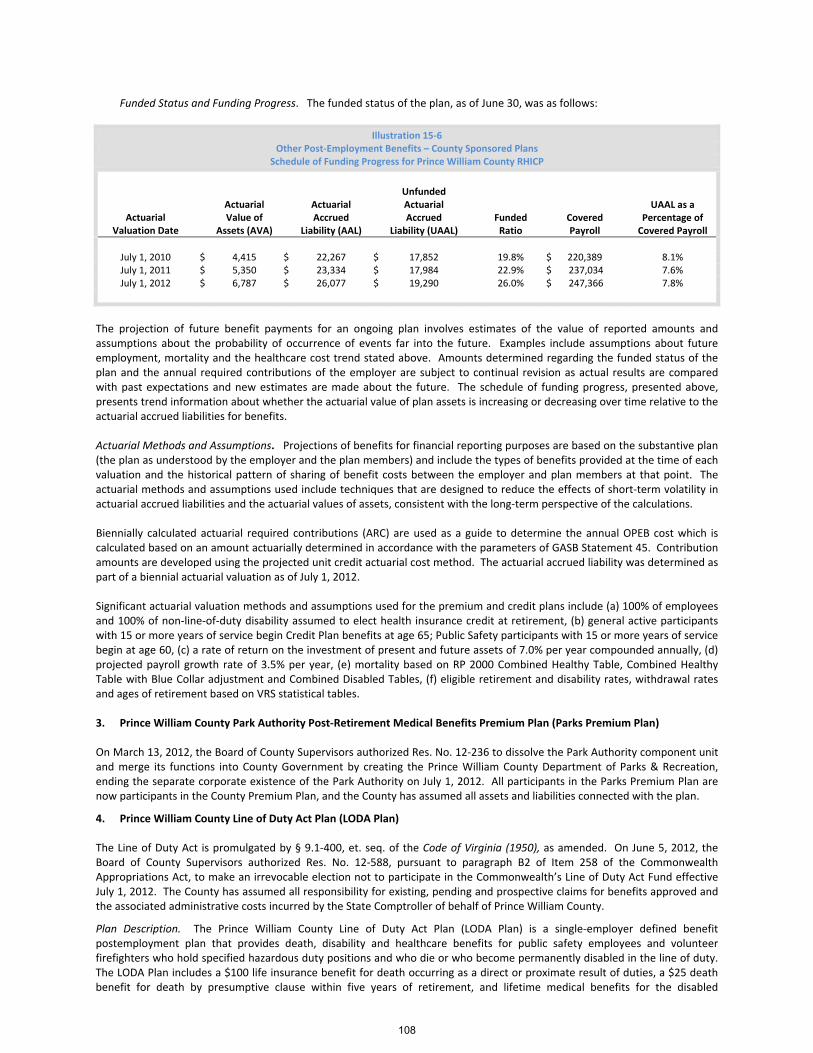
Funded Status and Funding Progress. The funded status of the plan, as of June 30, was as follows:
Illustration 15‐6 Other Post‐Employment Benefits – County Sponsored Plans
Schedule of Funding Progress for Prince William County RHICP
Actuarial Valuation Date
Actuarial Value of
Assets (AVA)
Actuarial Accrued
Liability (AAL)
Unfunded Actuarial Accrued
Liability (UAAL)
Funded Ratio
Covered Payroll
UAAL as a Percentage of Covered Payroll
July 1, 2010 $ 4,415 $ 22,267 $ 17,852 19.8% $ 220,389 8.1% July 1, 2011 $ 5,350 $ 23,334 $ 17,984 22.9% $ 237,034 7.6% July 1, 2012 $ 6,787 $ 26,077 $ 19,290 26.0% $ 247,366 7.8%
The projection of future benefit payments for an ongoing plan involves estimates of the value of reported amounts and assumptions about the probability of occurrence of events far into the future. Examples include assumptions about future employment, mortality and the healthcare cost trend stated above. Amounts determined regarding the funded status of the plan and the annual required contributions of the employer are subject to continual revision as actual results are compared with past expectations and new estimates are made about the future. The schedule of funding progress, presented above, presents trend information about whether the actuarial value of plan assets is increasing or decreasing over time relative to the actuarial accrued liabilities for benefits. Actuarial Methods and Assumptions. Projections of benefits for financial reporting purposes are based on the substantive plan (the plan as understood by the employer and the plan members) and include the types of benefits provided at the time of each valuation and the historical pattern of sharing of benefit costs between the employer and plan members at that point. The actuarial methods and assumptions used include techniques that are designed to reduce the effects of short‐term volatility in actuarial accrued liabilities and the actuarial values of assets, consistent with the long‐term perspective of the calculations. Biennially calculated actuarial required contributions (ARC) are used as a guide to determine the annual OPEB cost which is calculated based on an amount actuarially determined in accordance with the parameters of GASB Statement 45. Contribution amounts are developed using the projected unit credit actuarial cost method. The actuarial accrued liability was determined as part of a biennial actuarial valuation as of July 1, 2012. Significant actuarial valuation methods and assumptions used for the premium and credit plans include (a) 100% of employees and 100% of non‐line‐of‐duty disability assumed to elect health insurance credit at retirement, (b) general active participants with 15 or more years of service begin Credit Plan benefits at age 65; Public Safety participants with 15 or more years of service begin at age 60, (c) a rate of return on the investment of present and future assets of 7.0% per year compounded annually, (d) projected payroll growth rate of 3.5% per year, (e) mortality based on RP 2000 Combined Healthy Table, Combined Healthy Table with Blue Collar adjustment and Combined Disabled Tables, (f) eligible retirement and disability rates, withdrawal rates and ages of retirement based on VRS statistical tables.
3. Prince William County Park Authority Post‐Retirement Medical Benefits Premium Plan (Parks Premium Plan)
On March 13, 2012, the Board of County Supervisors authorized Res. No. 12‐236 to dissolve the Park Authority component unit and merge its functions into County Government by creating the Prince William County Department of Parks & Recreation, ending the separate corporate existence of the Park Authority on July 1, 2012. All participants in the Parks Premium Plan are now participants in the County Premium Plan, and the County has assumed all assets and liabilities connected with the plan.
4. Prince William County Line of Duty Act Plan (LODA Plan)
The Line of Duty Act is promulgated by § 9.1‐400, et. seq. of the Code of Virginia (1950), as amended. On June 5, 2012, the Board of County Supervisors authorized Res. No. 12‐588, pursuant to paragraph B2 of Item 258 of the Commonwealth Appropriations Act, to make an irrevocable election not to participate in the Commonwealth’s Line of Duty Act Fund effective July 1, 2012. The County has assumed all responsibility for existing, pending and prospective claims for benefits approved and the associated administrative costs incurred by the State Comptroller of behalf of Prince William County.
Plan Description. The Prince William County Line of Duty Act Plan (LODA Plan) is a single‐employer defined benefit postemployment plan that provides death, disability and healthcare benefits for public safety employees and volunteer firefighters who hold specified hazardous duty positions and who die or who become permanently disabled in the line of duty. The LODA Plan includes a $100 life insurance benefit for death occurring as a direct or proximate result of duties, a $25 death benefit for death by presumptive clause within five years of retirement, and lifetime medical benefits for the disabled
108

employee and their surviving spouse with certified children covered to age 21 or age 25 if continuously enrolled in college, comparable to the medical coverage held by the deceased or disabled employee or volunteer at the time of the qualifying incident.
In order to be eligible to receive LODA benefits, the disabled or deceased employee or volunteer must be certified by the Virginia Department of Accounts. To be eligible for the healthcare benefit portion of the plan, the employee or volunteer must subscribe to healthcare coverage under a medical plan prior to the date of incident. Eligible employees and/or family members are either enrolled in a County‐sponsored group healthcare plan or reimbursed for their healthcare premiums. Surviving spouses who remarry or children who marry and have access to other medical insurance coverage are no longer eligible for the healthcare benefits under the LODA Plan. Certified LODA retirees and their beneficiaries are required to pay 0% of the published blended premium rate for any of the County sponsored group healthcare plans. Uncertified beneficiaries (i.e. dependent children added post LODA certification) are required to pay a differential tier rate. As of June 30, 2013, 34 retirees or survivors who participated in the County’s group insurance plans and 4 retirees or survivors who received premium reimbursements.
The County LODA Plan does not issue a stand‐alone financial report.
Funding Policy. The required employer contribution rate was actuarially determined. For fiscal year 2013, the County LODA Plan Annual Required Contribution (ARC) was $5,312. Payments made by the County on behalf of retirees and beneficiaries for benefits and administration costs were $699, resulting in a $4,613 Net OPEB Obligation (NOO) at June 30, 2013. Payments to the County LODA Plan on behalf of uncertified beneficiaries totaled $10 for fiscal 2013. Annual OPEB Cost and Net OPEB Obligation. For fiscal year 2013, the County LODA Plan annual OPEB cost (expense) was greater than the ARC. The County LODA Plan’s annual OPEB cost, the percentage of OPEB cost contributed to the OPEB Master Trust Fund, and the net OPEB obligation for fiscal year 2013 was as follows:
Illustration 15‐7 Other Post‐Employment Benefits – Net OPEB Obligation
Prince William County LODA Plan
Fiscal Year
Ending:
Annual Required
Contribution (ARC)
Less NOO Amortization
and Adjustments
Plus Interest Net OPEB Obligation
Annual OPEB Cost
County Contribution to Trust Fund
Pay‐As‐You‐Go OPEB Costs
Increase (Decrease) in Net OPEB Obligation
Net OPEB Obligation (NOO)
beginning
Net OPEB Obligation (Asset) (NOO) ending
June 30, 2013 $ 5,312 ‐‐ ‐‐ 5,312* ‐‐ (699) 4,613 ‐‐ $ 4,613
* This includes $480 allocated to the ADC component unit.
Illustration 15‐8 Other Post‐Employment Benefits – Percentage of Annual OPEB Cost
Prince William County LODA Plan
Fiscal Year Ending:
Annual OPEB Cost Percentage of
Annual OPEB Cost Contributed Net OPEB Obligation (Asset)
(NOO) ending
June 30, 2013 $ 5,312* 13.2% $ 4,613
* This includes $480, allocated to the ADC component unit.
109
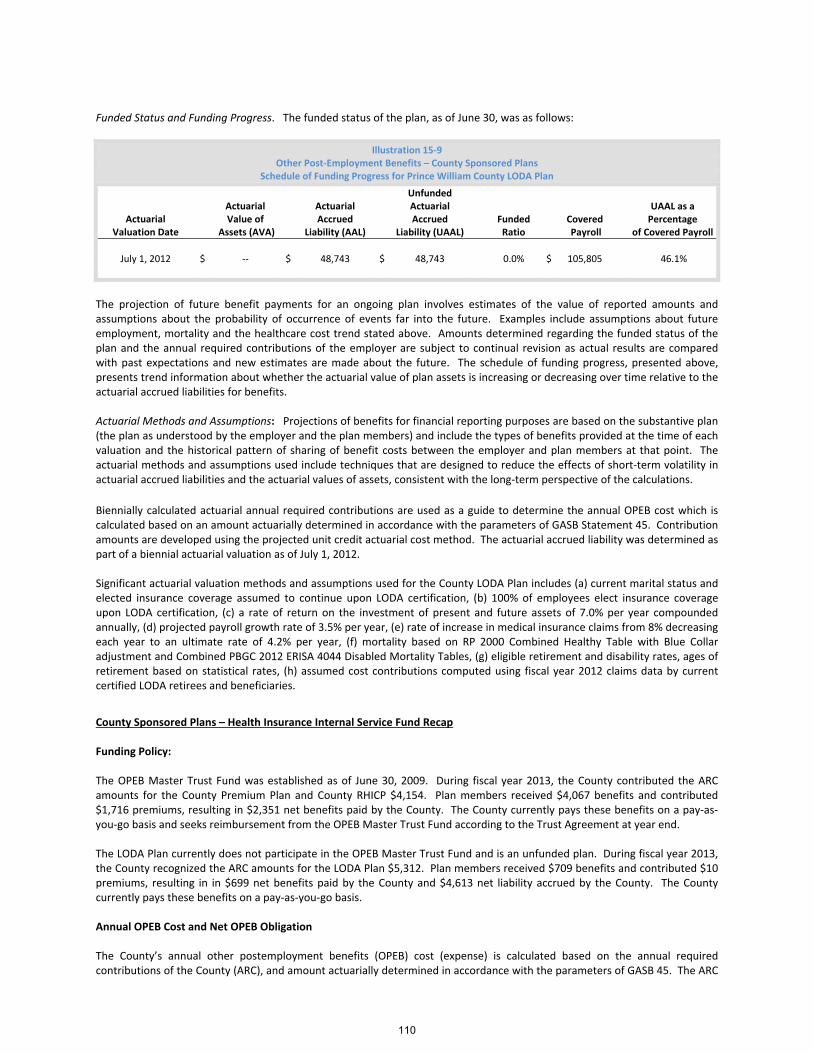
Funded Status and Funding Progress. The funded status of the plan, as of June 30, was as follows:
Illustration 15‐9 Other Post‐Employment Benefits – County Sponsored Plans
Schedule of Funding Progress for Prince William County LODA Plan
Actuarial Valuation Date
Actuarial Value of
Assets (AVA)
Actuarial Accrued
Liability (AAL)
Unfunded Actuarial Accrued
Liability (UAAL)
Funded Ratio
Covered Payroll
UAAL as a Percentage
of Covered Payroll
July 1, 2012 $ ‐‐ $ 48,743 $ 48,743 0.0% $ 105,805 46.1%
The projection of future benefit payments for an ongoing plan involves estimates of the value of reported amounts and assumptions about the probability of occurrence of events far into the future. Examples include assumptions about future employment, mortality and the healthcare cost trend stated above. Amounts determined regarding the funded status of the plan and the annual required contributions of the employer are subject to continual revision as actual results are compared with past expectations and new estimates are made about the future. The schedule of funding progress, presented above, presents trend information about whether the actuarial value of plan assets is increasing or decreasing over time relative to the actuarial accrued liabilities for benefits.
Actuarial Methods and Assumptions: Projections of benefits for financial reporting purposes are based on the substantive plan (the plan as understood by the employer and the plan members) and include the types of benefits provided at the time of each valuation and the historical pattern of sharing of benefit costs between the employer and plan members at that point. The actuarial methods and assumptions used include techniques that are designed to reduce the effects of short‐term volatility in actuarial accrued liabilities and the actuarial values of assets, consistent with the long‐term perspective of the calculations.
Biennially calculated actuarial annual required contributions are used as a guide to determine the annual OPEB cost which is calculated based on an amount actuarially determined in accordance with the parameters of GASB Statement 45. Contribution amounts are developed using the projected unit credit actuarial cost method. The actuarial accrued liability was determined as part of a biennial actuarial valuation as of July 1, 2012. Significant actuarial valuation methods and assumptions used for the County LODA Plan includes (a) current marital status and elected insurance coverage assumed to continue upon LODA certification, (b) 100% of employees elect insurance coverage upon LODA certification, (c) a rate of return on the investment of present and future assets of 7.0% per year compounded annually, (d) projected payroll growth rate of 3.5% per year, (e) rate of increase in medical insurance claims from 8% decreasing each year to an ultimate rate of 4.2% per year, (f) mortality based on RP 2000 Combined Healthy Table with Blue Collar adjustment and Combined PBGC 2012 ERISA 4044 Disabled Mortality Tables, (g) eligible retirement and disability rates, ages of retirement based on statistical rates, (h) assumed cost contributions computed using fiscal year 2012 claims data by current certified LODA retirees and beneficiaries.
County Sponsored Plans – Health Insurance Internal Service Fund Recap Funding Policy: The OPEB Master Trust Fund was established as of June 30, 2009. During fiscal year 2013, the County contributed the ARC amounts for the County Premium Plan and County RHICP $4,154. Plan members received $4,067 benefits and contributed $1,716 premiums, resulting in $2,351 net benefits paid by the County. The County currently pays these benefits on a pay‐as‐you‐go basis and seeks reimbursement from the OPEB Master Trust Fund according to the Trust Agreement at year end. The LODA Plan currently does not participate in the OPEB Master Trust Fund and is an unfunded plan. During fiscal year 2013, the County recognized the ARC amounts for the LODA Plan $5,312. Plan members received $709 benefits and contributed $10 premiums, resulting in in $699 net benefits paid by the County and $4,613 net liability accrued by the County. The County currently pays these benefits on a pay‐as‐you‐go basis. Annual OPEB Cost and Net OPEB Obligation The County’s annual other postemployment benefits (OPEB) cost (expense) is calculated based on the annual required contributions of the County (ARC), and amount actuarially determined in accordance with the parameters of GASB 45. The ARC
110

represents a level of funding that, if paid on an ongoing basis, is projected to cover the normal cost each year and to amortize any unfunded actuarial liabilities (or funding excess) over a period not to exceed 30 years. For the year ended June 30, 2013, the County’s annual OPEB cost for County Premium Plan and the County’s Retiree Health Insurance Credit Plan (RHICP), based on the actuarial annual required contribution (ARC) for OPEB funding was $4,154 ($1,875 amortization, $2,279 actuarial normal cost, funded) which was equal to the actual OPEB payment of $4,154. The County LODA Plan was not included. The County’s annual OPEB cost for the LODA Plan, based on the actuarial annual required contribution (ARC) for OPEB funding was $5,312 ($1,682 amortization, $3,630 actuarial normal cost, not funded) which $4,613 was not paid. As a result, the County recognizes a total net negative OPEB obligation (asset) of $4,613. OPEB costs for retiree and COBRA claims and claims administration, net of premiums paid, of $2,351, which were fully accrued in the OPEB Master Trust Fund statements and Health Insurance Internal Service Fund statements, and were billed according to the Trust Agreement to the OPEB Master Trust Fund for reimbursement, are not included. Illustration 15‐10 shows the components of the County’s annual OPEB cost for the year, the amount actually contributed to the plan, and the changes in the County’s net OPEB obligations for all County sponsored plans:
Illustration 15‐10 Other Post‐Employment Benefits – Net OPEB Obligation All Plans
Prince William County, including ADC Component Unit
Fiscal Year
Ending:
Annual Required
Contribution (ARC)
Less NOO Amortization
and Adjustments
Plus Interest Net OPEB Obligation
Annual OPEB Cost
County Contribution to Trust Fund
Pay‐As‐You‐Go OPEB Costs
Increase (Decrease) in Net OPEB Obligation
Net OPEB Obligation (NOO)
beginning
Net OPEB Obligation (Asset) (NOO) ending
June 30, 2011 $ 5,364 $ ‐‐ $ ‐‐ $ 5,364* $ (5,364) $ ‐‐ $ ‐‐ $ ‐‐ $ ‐‐
June 30, 2012 $ 5,529 $ ‐‐ $ ‐‐ $ 5,529* $ (5,529) $ ‐‐ $ ‐‐ $ ‐‐ $ ‐‐
June 30, 2013 $ 9,466 $ ‐‐ $ ‐‐ $ 9,466* $ (4,154) $ (699) $ 4,613 $ ‐‐ $ 4,613
* This includes $506, $522, and $845 respectively allocated to ADC component unit based on proportion of ADC premiums paid, RHICP budget and LODA
allocation.
Illustration 15‐11 summarizes the Net OPEB Obligation for the County’s other Post‐Employment benefits.
Illustration 15‐11 Other Post‐Employment Benefits – Percentage of Annual OPEB Cost
Prince William County, including ADC Premium Plan
Fiscal Year Ending:
Annual OPEB Cost Percentage of
Annual OPEB Cost Contributed
Net OPEB Obligation (Asset)
(NOO) ending
June 30, 2011 $ 5,364* 100.0% $ ‐‐
June 30, 2012 $ 5,529* 100.0% $ ‐‐
June 30, 2013 $ 9,466* 51.3% $ 4,613
* This includes $506, $522, and $845 respectively allocated to ADC component unit based on proportion of ADC premiums paid, RHICP budget and LODA allocation.
Funded Status and Funding Progress: The funded status of County plans as of July 1, 2012, the date of the most recent actuarial valuation, the actuarial accrued liability for benefits was $96,701 and the actuarial value of assets was $17,717, resulting in an unfunded actuarial accrued liability (UAAL) $78,984. The covered payroll (annual payroll of active employees covered by the plans) was $ 247,366, and the ratio of the UAAL to the covered payroll was 31.9 percent. The UAAL is being amortized as a level percentage of projected pay on an open basis. The remaining amortization period at June 30, 2013 was 25 years for Premium Plan and RHICP, 30 years for LODA Plan. The projection of future benefit payments for an ongoing plan involves estimates of the value of reported amounts and assumptions about the probability of occurrence of events far into the future. Examples include assumptions about future employment, mortality and the healthcare cost trend stated above. Amounts determined regarding the funded status of the plan and the annual required contributions of the employer are subject to continual revision as actual results are compared with past expectations and new estimates are made about the future. The schedule of funding progress, presented as
111
Required Supplementary Information following the Notes to the Financial Statements, presents trend information about whether the actuarial value of plan assets is increasing or decreasing over time relative to the actuarial accrued liabilities for benefits.
Component Unit Sponsored Plans 1. Prince William County Park Authority Post‐Retirement Medical Benefits Credit Plan (Parks RHICP) On March 13, 2012, the Board of County Supervisors authorized Res. No. 12‐236 to merge the functions of the Prince William County Park Authority component unit into County Government by creating the Prince William County Department of Parks & Recreation, ending the separate corporate existence of the Park Authority on July 1, 2012. All participants in the Parks RHICP are now participants in the County RHICP, and the County has assumed all assets and liabilities connected with the plan.
2. Prince William County Public Schools Retiree Medical Program (Schools Premium Plan)
The Prince William County Public Schools Retiree Medical Program (Schools Premium Plan) is sponsored and administered by the School Board and reported separately in their audited financial statements. Copies of these financial statements may be obtained by writing to the School Board’s Finance Division at P.O. Box 389, Manassas, Virginia 20108. VRS Health Insurance Credit Program Plan Description: Retirees of the County, as well as the Adult Detention Center, who have rendered at least fifteen years of total creditable service under the VRS, are granted the option to participate in the VRS Health Insurance Credit Program by paying 100 percent of their monthly health insurance premium less a $1.50 times years of service for a maximum credit of $45 from the VRS. Title 51.1 of the Code of Virginia assigns the authority to establish and amend benefit provisions to the General Assembly of Virginia. As of the end of the current fiscal year, there were 776 retirees that received the VRS health insurance credit. The health insurance credit is financed by payments from the County to the VRS. For the year ended June 30, 2013, the County paid $363. The surplus funds are not considered advance funded because the County, its employees, and retirees have no vested rights to access the excess funds. GAAP do not require governments to report a liability in the financial statements in connection with an employer's obligation to provide these benefits. As of June 30, 2012, the date of the most recent actuarial valuation, there were 3,176 active participants and 652 retirees receiving benefits on that date. The VRS issues a publicly available comprehensive annual financial report that includes financial statements and required supplementary information. A copy of that report may be obtained by writing the VRS at P.O. Box 2500, Richmond, Virginia 23218‐2500. Funding Policy and Annual Benefit Contribution: In accordance with Title 51.1 of the Code of Virginia the County is required to contribute an actuarial percentage of its employees’ annual reported compensation to the VRS to fund the VRS Health Insurance Credit Program. The County’s contribution rate for the fiscal year ended June 30, 2013 was 0.18% of annual covered payroll. The required contributions for the County were determined as part of an actuarial valuation performed as of June 30, 2012 using the entry age normal actuarial cost method. The actuarial assumptions included (a) a 7.00% investment rate of return, and (b) projected payroll growth rate of 3.00%. Both (a) and (b) included an inflation component of 2.50%. The actuarial value of the County assets is equal to the market value of the assets. This method was determined using techniques that smooth the effects of short‐term volatility in the market value of assets over a five‐year period. The unfunded actuarial accrued liability is being amortized as a level percentage of projected pay on a closed basis. The remaining amortization period at June 30, 2012, was 29 years for the County.
112

Trend information: Illustration 15‐12 summarizes the required three‐year trend information for the County.
Illustration 15‐12 Virginia Retirement System – Health Insurance Credit Program
Three Year Trend Information for Prince William County
Fiscal Year Ending:
Annual Benefit Cost (ABC)
Percentage of ABC
Contributed
Net Benefit Obligation (NBO) Employer Portion
June 30, 2011 $ 368 100% $ ‐‐
June 30, 2012 $ 378 100% $ ‐‐
June 30, 2013 $ 363 100% $ ‐‐
Funded Status and Funding Progress: As of June 30, 2012, the most recent actuarial valuation date, the VRS health insurance credit program was 37.1% funded. The actuarial accrued liability for benefits was $6,005 and the actuarial value of assets was $2,230, resulting in an unfunded actuarial accrued liability (UAAL) of $3,775. The covered payroll (annual payroll of active employees of covered by the plan) was $191,157, and the ratio of the UAAL to the covered payroll was 2.0%. Covered payroll was reduced to exclude constitutional officers, employees of constitutional officers, general registrars, employees of general registrars, and local social service employees. Annual salaries of prior valuations include all employees within Prince William County, including constitutional officers, employees of constitutional officers, general registrars, employees of general registrars, and local social service employees, whose actuarial accrued liability is not with Prince William County. The schedule of funding progress, presented as Required Supplementary Information following the Notes to the Financial Statements, Schedule 2, presents multiyear trend information about whether the actuarial value of the plan assets is increasing or decreasing over time relative to the actuarial accrued liability for benefits.
NOTE (16) – OPEB MASTER TRUST FUND Description: The Prince William County Other Post‐Employment Benefits (OPEB) Master Trust Fund is an agent multiple‐employer defined benefit post‐employment benefits trust fund. As such, it is reported in accordance to GASB Statement 43, paragraph 13, in the aggregate. Individual plan information of the participating employer agents is reported in Note (15). The OPEB Master Trust was established by the Prince William County Board of County Supervisors on June 23, 2009 by Resolution No. 09‐544 to provide funding for benefit payments on behalf of retiree and Consolidated Omnibus Budget Reconciliation Act (COBRA) participants. On June 30, 2009, funds were transferred to establish three separate trust fund sub‐accounts for County, Park Authority and Schools. Although the assets of the Trust fund are commingled for investment purposes, each plan’s assets may be used only for the payment of benefits to the members of that plan, in accordance to the terms of the Trust Agreement. Assets accumulated to pay for plan costs or benefits of members from one agent employer cannot be used for plan costs or benefits of another agent employer. On March 13, 2012, the Board of County Supervisors authorized Res. No. 12‐236 to merge the functions of the Prince William County Park Authority component unit into County Government by creating the Prince William County Department of Parks & Recreation, ending the separate corporate existence of the Park Authority on July 1, 2012 in order to provide parks and recreation services to the public by the most effective and efficient means. All participants in the Park Authority Premium Plan and Retiree Health Insurance Plan (RHICP) are now participants in the County Premium Plan and RHICP, and the County has assumed all assets and liabilities connected with the plan. As a result, the beginning of year net position increased by $809 for the County Trust Fund, but this amount was already included the total OPEB Master Trust Fund Net Position. The Line of Duty Act (LODA) is authorized Va. Code Section 9.1‐400 et seq. On June 5, 2012, the Board of County Supervisors authorized Res. No. 12‐588, pursuant to paragraph B2 of Item 258 of the Commonwealth Appropriations Act, to make an irrevocable election not to participate in the Commonwealth Line of Duty Act Fund on July 1, 2012. The County has assumed all responsibility for existing, pending or prospective claims for benefits approved and associated administrative costs made by the State Comptroller of behalf of Prince William County. During fiscal year 2013, the County did not contribute to the OPEB Master Trust Fund to fund LODA. Therefore, its members, assets and liabilities are excluded from the presentation below.
113
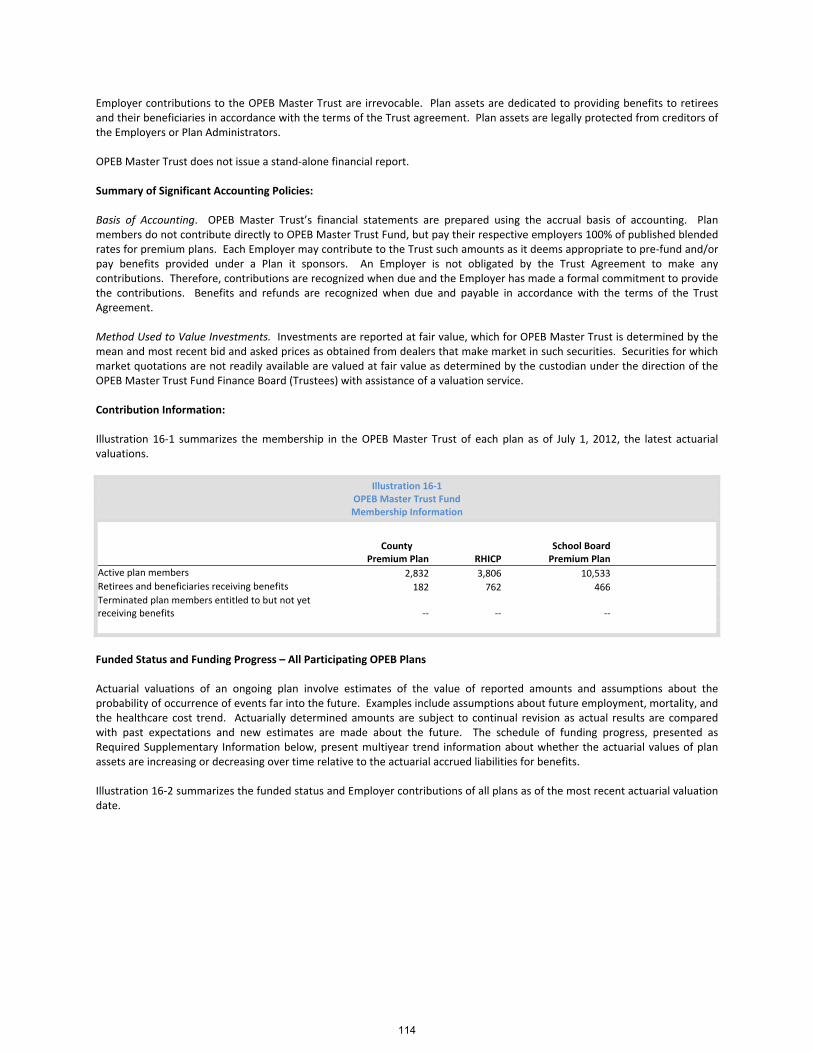
Employer contributions to the OPEB Master Trust are irrevocable. Plan assets are dedicated to providing benefits to retirees and their beneficiaries in accordance with the terms of the Trust agreement. Plan assets are legally protected from creditors of the Employers or Plan Administrators. OPEB Master Trust does not issue a stand‐alone financial report. Summary of Significant Accounting Policies: Basis of Accounting. OPEB Master Trust’s financial statements are prepared using the accrual basis of accounting. Plan members do not contribute directly to OPEB Master Trust Fund, but pay their respective employers 100% of published blended rates for premium plans. Each Employer may contribute to the Trust such amounts as it deems appropriate to pre‐fund and/or pay benefits provided under a Plan it sponsors. An Employer is not obligated by the Trust Agreement to make any contributions. Therefore, contributions are recognized when due and the Employer has made a formal commitment to provide the contributions. Benefits and refunds are recognized when due and payable in accordance with the terms of the Trust Agreement. Method Used to Value Investments. Investments are reported at fair value, which for OPEB Master Trust is determined by the mean and most recent bid and asked prices as obtained from dealers that make market in such securities. Securities for which market quotations are not readily available are valued at fair value as determined by the custodian under the direction of the OPEB Master Trust Fund Finance Board (Trustees) with assistance of a valuation service. Contribution Information: Illustration 16‐1 summarizes the membership in the OPEB Master Trust of each plan as of July 1, 2012, the latest actuarial valuations.
Illustration 16‐1 OPEB Master Trust Fund Membership Information
County School Board Premium Plan RHICP Premium Plan
Active plan members 2,832 3,806 10,533 Retirees and beneficiaries receiving benefits 182 762 466 Terminated plan members entitled to but not yet receiving benefits ‐‐ ‐‐ ‐‐
Funded Status and Funding Progress – All Participating OPEB Plans Actuarial valuations of an ongoing plan involve estimates of the value of reported amounts and assumptions about the probability of occurrence of events far into the future. Examples include assumptions about future employment, mortality, and the healthcare cost trend. Actuarially determined amounts are subject to continual revision as actual results are compared with past expectations and new estimates are made about the future. The schedule of funding progress, presented as Required Supplementary Information below, present multiyear trend information about whether the actuarial values of plan assets are increasing or decreasing over time relative to the actuarial accrued liabilities for benefits. Illustration 16‐2 summarizes the funded status and Employer contributions of all plans as of the most recent actuarial valuation date.
114
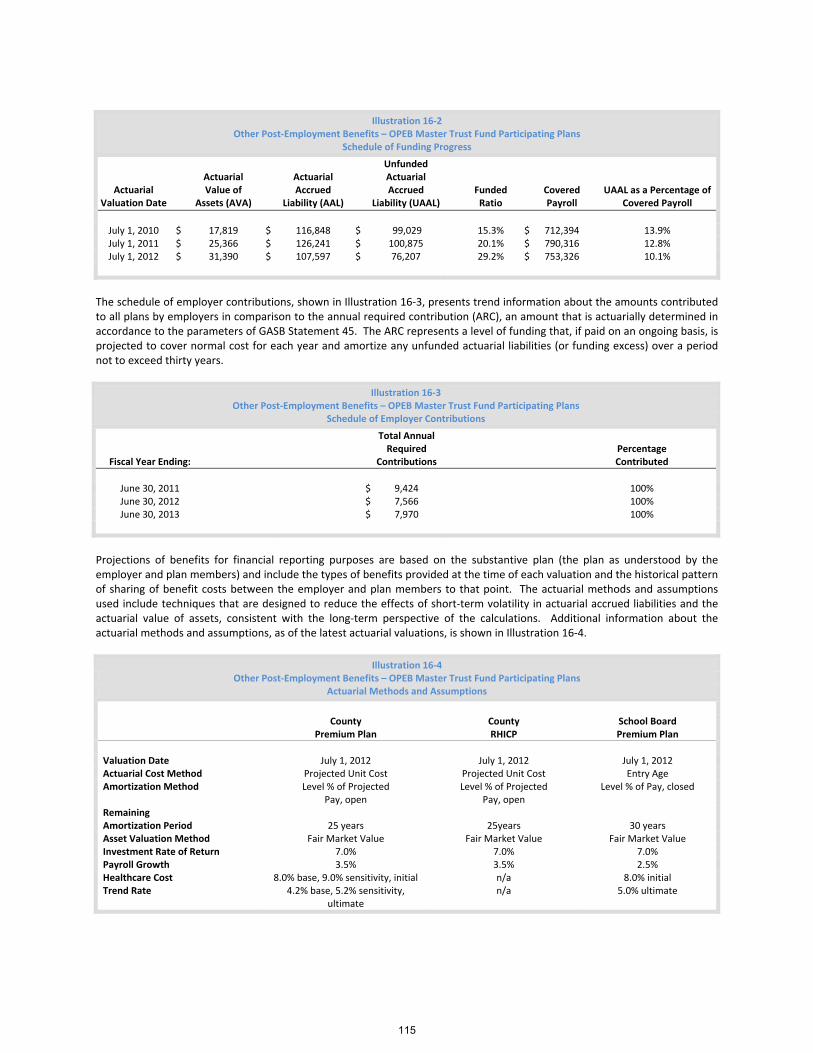
Illustration 16‐2 Other Post‐Employment Benefits – OPEB Master Trust Fund Participating Plans
Schedule of Funding Progress
Actuarial Valuation Date
Actuarial Value of
Assets (AVA)
Actuarial Accrued
Liability (AAL)
Unfunded Actuarial Accrued
Liability (UAAL)
Funded Ratio
Covered Payroll
UAAL as a Percentage of Covered Payroll
July 1, 2010 $ 17,819 $ 116,848 $ 99,029 15.3% $ 712,394 13.9% July 1, 2011 $ 25,366 $ 126,241 $ 100,875 20.1% $ 790,316 12.8% July 1, 2012 $ 31,390 $ 107,597 $ 76,207 29.2% $ 753,326 10.1%
The schedule of employer contributions, shown in Illustration 16‐3, presents trend information about the amounts contributed to all plans by employers in comparison to the annual required contribution (ARC), an amount that is actuarially determined in accordance to the parameters of GASB Statement 45. The ARC represents a level of funding that, if paid on an ongoing basis, is projected to cover normal cost for each year and amortize any unfunded actuarial liabilities (or funding excess) over a period not to exceed thirty years.
Illustration 16‐3 Other Post‐Employment Benefits – OPEB Master Trust Fund Participating Plans
Schedule of Employer Contributions
Fiscal Year Ending:
Total Annual Required
Contributions
Percentage Contributed
June 30, 2011 $ 9,424 100% June 30, 2012 $ 7,566 100% June 30, 2013 $ 7,970 100%
Projections of benefits for financial reporting purposes are based on the substantive plan (the plan as understood by the employer and plan members) and include the types of benefits provided at the time of each valuation and the historical pattern of sharing of benefit costs between the employer and plan members to that point. The actuarial methods and assumptions used include techniques that are designed to reduce the effects of short‐term volatility in actuarial accrued liabilities and the actuarial value of assets, consistent with the long‐term perspective of the calculations. Additional information about the actuarial methods and assumptions, as of the latest actuarial valuations, is shown in Illustration 16‐4.
Illustration 16‐4 Other Post‐Employment Benefits – OPEB Master Trust Fund Participating Plans
Actuarial Methods and Assumptions
County
Premium Plan County RHICP
School Board Premium Plan
Valuation Date July 1, 2012 July 1, 2012 July 1, 2012 Actuarial Cost Method Projected Unit Cost Projected Unit Cost Entry Age Amortization Method Level % of Projected
Pay, open Level % of Projected
Pay, open Level % of Pay, closed
Remaining Amortization Period
25 years
25years
30 years
Asset Valuation Method Fair Market Value Fair Market Value Fair Market Value Investment Rate of Return 7.0% 7.0% 7.0% Payroll Growth 3.5% 3.5% 2.5% Healthcare Cost Trend Rate
8.0% base, 9.0% sensitivity, initial 4.2% base, 5.2% sensitivity,
ultimate
n/a n/a
8.0% initial 5.0% ultimate
115
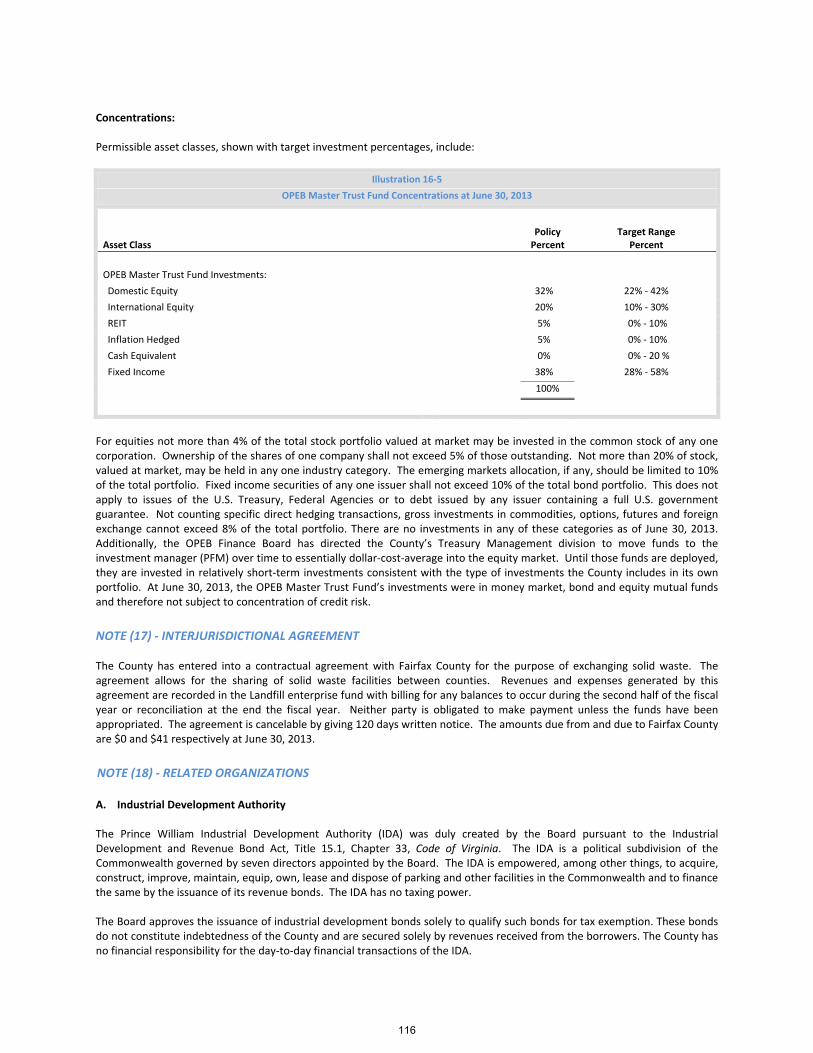
Concentrations: Permissible asset classes, shown with target investment percentages, include:
Illustration 16‐5
OPEB Master Trust Fund Concentrations at June 30, 2013
Asset Class
Policy Percent
Target Range Percent
OPEB Master Trust Fund Investments:
Domestic Equity 32% 22% ‐ 42%
International Equity 20% 10% ‐ 30%
REIT 5% 0% ‐ 10%
Inflation Hedged 5% 0% ‐ 10%
Cash Equivalent 0% 0% ‐ 20 %
Fixed Income 38% 28% ‐ 58%
100%
For equities not more than 4% of the total stock portfolio valued at market may be invested in the common stock of any one corporation. Ownership of the shares of one company shall not exceed 5% of those outstanding. Not more than 20% of stock, valued at market, may be held in any one industry category. The emerging markets allocation, if any, should be limited to 10% of the total portfolio. Fixed income securities of any one issuer shall not exceed 10% of the total bond portfolio. This does not apply to issues of the U.S. Treasury, Federal Agencies or to debt issued by any issuer containing a full U.S. government guarantee. Not counting specific direct hedging transactions, gross investments in commodities, options, futures and foreign exchange cannot exceed 8% of the total portfolio. There are no investments in any of these categories as of June 30, 2013. Additionally, the OPEB Finance Board has directed the County’s Treasury Management division to move funds to the investment manager (PFM) over time to essentially dollar‐cost‐average into the equity market. Until those funds are deployed, they are invested in relatively short‐term investments consistent with the type of investments the County includes in its own portfolio. At June 30, 2013, the OPEB Master Trust Fund’s investments were in money market, bond and equity mutual funds and therefore not subject to concentration of credit risk.
NOTE (17) ‐ INTERJURISDICTIONAL AGREEMENT The County has entered into a contractual agreement with Fairfax County for the purpose of exchanging solid waste. The agreement allows for the sharing of solid waste facilities between counties. Revenues and expenses generated by this agreement are recorded in the Landfill enterprise fund with billing for any balances to occur during the second half of the fiscal year or reconciliation at the end the fiscal year. Neither party is obligated to make payment unless the funds have been appropriated. The agreement is cancelable by giving 120 days written notice. The amounts due from and due to Fairfax County are $0 and $41 respectively at June 30, 2013.
NOTE (18) ‐ RELATED ORGANIZATIONS A. Industrial Development Authority The Prince William Industrial Development Authority (IDA) was duly created by the Board pursuant to the Industrial Development and Revenue Bond Act, Title 15.1, Chapter 33, Code of Virginia. The IDA is a political subdivision of the Commonwealth governed by seven directors appointed by the Board. The IDA is empowered, among other things, to acquire, construct, improve, maintain, equip, own, lease and dispose of parking and other facilities in the Commonwealth and to finance the same by the issuance of its revenue bonds. The IDA has no taxing power. The Board approves the issuance of industrial development bonds solely to qualify such bonds for tax exemption. These bonds do not constitute indebtedness of the County and are secured solely by revenues received from the borrowers. The County has no financial responsibility for the day‐to‐day financial transactions of the IDA.
116
B. Service Authority The Prince William County Service Authority (Service Authority) is authorized under the Virginia Water and Sewage Authorities Act; Section 15.1, Chapter 28 of the Code of Virginia, pursuant to resolution adopted by the Board on January 11, 1983. It was chartered by the State Corporation Commission. The members of the Service Authority are appointed by the Board; however, there is no ability of the Board to direct the members of the Service Authority with respect to carrying out the Service Authority’s fiscal and management functions. The Service Authority currently operates and sets the rates and charges for the sewer system in the County. The Service Authority’s operations and capital funds are principally financed by user charges and bond issues. The Service Authority is a public body politic and corporate, and as such it is solely responsible for all its outstanding debt. C. Upper Occoquan Sewage Authority The Upper Occoquan Sewage Authority (UOSA) was created under the provisions of the Virginia Water and Sewer Authorities Act to be the single regional entity to construct, finance and operate the regional sewage treatment facility mandated by the Occoquan policy for the upper portion of the Occoquan Watershed. UOSA is a joint venture formed on March 3, 1971, by a concurrent resolution of the governing bodies of the Counties of Fairfax and Prince William and the Cities of Manassas and Manassas Park. The governing body of UOSA is an eight person Board of Directors consisting of 2 members appointed to four year terms by the governing body of each jurisdiction. The County has an ongoing financial responsibility for its share of UOSA’s operating costs, construction costs, and annual debt service. The Prince William County Service Authority operates the sewer system in the County, including the portion of its system located in the UOSA service area. In 1992, the Service Authority contractually assumed the obligation to pay the amounts due from the County to UOSA under a Service Agreement, subject to an annual contribution to those payments by the County which declines over a period of years to zero in 2021. On December 11, 2012, the County and the Service Authority modified this agreement whereby the Service Authority assumed full responsibility for funding the County’s obligation to UOSA in the future. Furthermore, the Service Authority granted and formally acknowledged a non‐cash credit of $13,782 to the County equivalent to payments the County made under the prior agreement. The County may use this credit to purchase sewer and water availability or any Service Authority asset offered for sale. The non‐cash credit will be reduced by such value of any purchase of sewer and water availability or asset. In light of this agreement, the County’s payment for fiscal year 2013 was $214 and the County has no further ongoing obligation for UOSA’s debt service. D. Northern Virginia Criminal Justice Training Academy‐Emergency Vehicle Operations Center (EVOC)
The Northern Virginia Criminal Justice Training Academy (NVCJTA) was re‐chartered by the Commonwealth of Virginia in 1997. It was originally established in 1965 as the Northern Virginia Police Academy. In 1980, the NVCJTA entered into an agreement with the Old Dominion Speedway in Manassas for the use of the facility as an Emergency Vehicle Operations Center (EVOC). It is anticipated that access to this facility will be terminated. Therefore, the NVCJTA has entered into an agreement to lease finance the construction and equipping of a new EVOC on its property located in Nokesville, VA. There are four participating jurisdictions included in the financing of the new EVOC: Prince William County, Loudoun County, Arlington County and Alexandria City. The four jurisdictions are responsible for the debt service, and the operating and capital expenditures will be charged to all participating jurisdictions on a pro rata share basis. The County’s share of both operating and debt service expenditures has been set at 30 percent per the Memorandum of Understanding between NVCJTA and the County and approved by the Board of County Supervisors via Resolution No. 05‐770 on September 6, 2005. The Industrial Development Authority of Loudoun County VA issued $18,650 of Lease Revenue Bonds on November 21, 2006, to finance the construction and equipping of the EVOC. Prince William County is responsible for debt service on 30 percent of the total issue, or $5,505. The County’s payment for fiscal year 2013 was $465. The County’s General Fund committed share of the NVCJTA’s remaining debt service (including interest), which approximates 30 percent of total NVCJTA principal and interest requirements as of June 30, 2013 is shown in Illustration 18‐1.
117
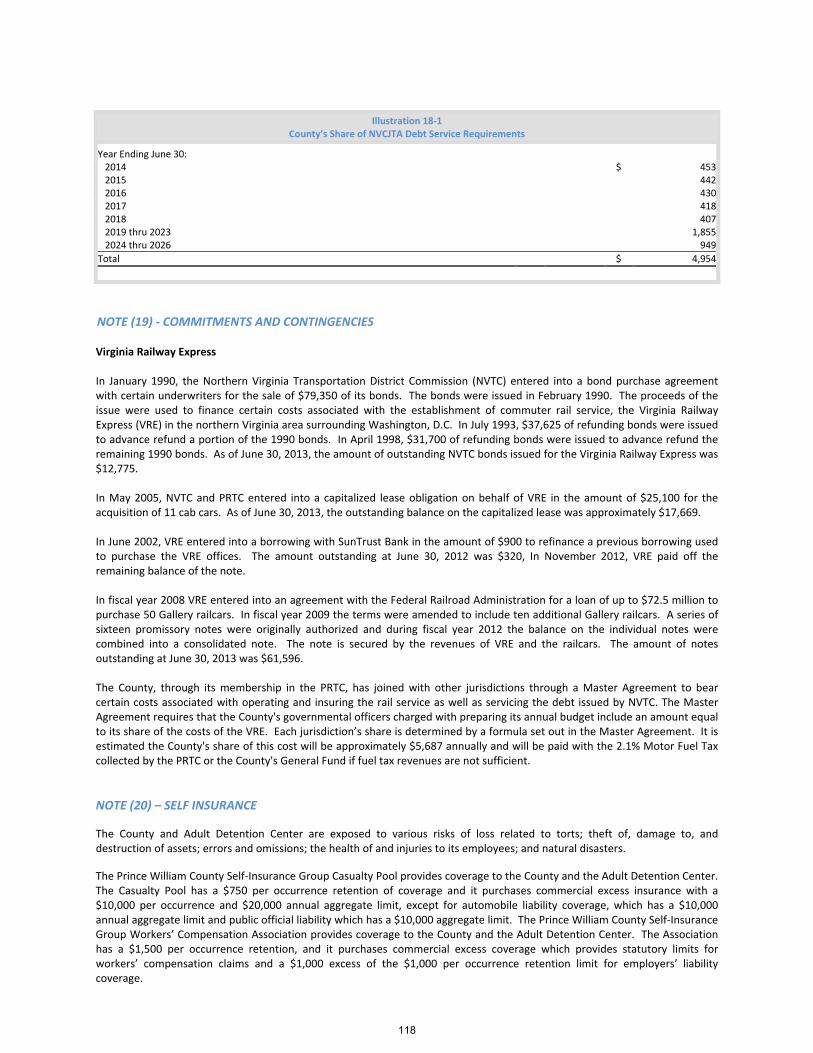
Illustration 18‐1 County’s Share of NVCJTA Debt Service Requirements
Year Ending June 30:
2014 $ 453 2015 442 2016 430 2017 418 2018 407 2019 thru 2023 1,855 2024 thru 2026 949
Total $ 4,954
NOTE (19) ‐ COMMITMENTS AND CONTINGENCIES Virginia Railway Express In January 1990, the Northern Virginia Transportation District Commission (NVTC) entered into a bond purchase agreement with certain underwriters for the sale of $79,350 of its bonds. The bonds were issued in February 1990. The proceeds of the issue were used to finance certain costs associated with the establishment of commuter rail service, the Virginia Railway Express (VRE) in the northern Virginia area surrounding Washington, D.C. In July 1993, $37,625 of refunding bonds were issued to advance refund a portion of the 1990 bonds. In April 1998, $31,700 of refunding bonds were issued to advance refund the remaining 1990 bonds. As of June 30, 2013, the amount of outstanding NVTC bonds issued for the Virginia Railway Express was $12,775. In May 2005, NVTC and PRTC entered into a capitalized lease obligation on behalf of VRE in the amount of $25,100 for the acquisition of 11 cab cars. As of June 30, 2013, the outstanding balance on the capitalized lease was approximately $17,669. In June 2002, VRE entered into a borrowing with SunTrust Bank in the amount of $900 to refinance a previous borrowing used to purchase the VRE offices. The amount outstanding at June 30, 2012 was $320, In November 2012, VRE paid off the remaining balance of the note. In fiscal year 2008 VRE entered into an agreement with the Federal Railroad Administration for a loan of up to $72.5 million to purchase 50 Gallery railcars. In fiscal year 2009 the terms were amended to include ten additional Gallery railcars. A series of sixteen promissory notes were originally authorized and during fiscal year 2012 the balance on the individual notes were combined into a consolidated note. The note is secured by the revenues of VRE and the railcars. The amount of notes outstanding at June 30, 2013 was $61,596. The County, through its membership in the PRTC, has joined with other jurisdictions through a Master Agreement to bear certain costs associated with operating and insuring the rail service as well as servicing the debt issued by NVTC. The Master Agreement requires that the County's governmental officers charged with preparing its annual budget include an amount equal to its share of the costs of the VRE. Each jurisdiction’s share is determined by a formula set out in the Master Agreement. It is estimated the County's share of this cost will be approximately $5,687 annually and will be paid with the 2.1% Motor Fuel Tax collected by the PRTC or the County's General Fund if fuel tax revenues are not sufficient.
NOTE (20) – SELF INSURANCE
The County and Adult Detention Center are exposed to various risks of loss related to torts; theft of, damage to, and destruction of assets; errors and omissions; the health of and injuries to its employees; and natural disasters.
The Prince William County Self‐Insurance Group Casualty Pool provides coverage to the County and the Adult Detention Center. The Casualty Pool has a $750 per occurrence retention of coverage and it purchases commercial excess insurance with a $10,000 per occurrence and $20,000 annual aggregate limit, except for automobile liability coverage, which has a $10,000 annual aggregate limit and public official liability which has a $10,000 aggregate limit. The Prince William County Self‐Insurance Group Workers’ Compensation Association provides coverage to the County and the Adult Detention Center. The Association has a $1,500 per occurrence retention, and it purchases commercial excess coverage which provides statutory limits for workers’ compensation claims and a $1,000 excess of the $1,000 per occurrence retention limit for employers’ liability coverage.
118

The County’s pre‐65 retirees with over 15 years of service and permanent employees are eligible to enroll in one of three health insurance plans and a dental plan. All three health insurance plans include comprehensive medical, preventive care, vision, and prescription drug coverage. Three of the health insurance plans are self‐insured up to an aggregate stop loss of 125% of total projected claims with a $175 specific individual stop loss limit. The basis for estimating incurred but not reported (IBNR) claims at year‐end is an annual analysis performed by the plan’s administrator. The County also offers an HMO option to limited employees and a dental option which are fully insured. The County expended $34,046 for claims, administration and premiums in fiscal year 2013. The County’s Self‐Insurance Group Casualty Pool, Workers’ Compensation and Other Self‐Insurance plans are fully funded. Losses are charged to operations as incurred. The liability for unpaid losses for self‐insurance is determined using case‐basis evaluations and a provision for incurred but not reported losses that is based upon actuarial projections. Actuarial projections of ultimate losses are based on a composite of the self‐insurance members’ experience and property and casualty insurance industry data, which is used to supplement the limited historical experience and includes the effects of inflation and other factors. Claims liabilities include allocated loss adjustment expenses and are reported net of estimated claims. Due to the limited historical experience of the Prince William Self‐Insurance Group Casualty Pool, Workers’ Compensation and Other Self‐Insurance, there exists a significant range of variability around the best estimate of the ultimate cost of settling all unpaid claims. Accordingly, the amount of the liability for unpaid losses and related expenses and the related provisions included in financial statements may be more or less than the actual cost of settling all unpaid claims. Adjustments to claim liabilities are made continually, based on subsequent developments and experience, and are included in operations as made.
Illustration 20‐1 presents a reconciliation of the changes in the aggregate liabilities for claims for the current and prior fiscal years. These claims liabilities are included in accrued liabilities in the accompanying statement of fund net position (Exhibit 7).
Illustration 20‐1
Prince William County Self‐Insurance
Other Self Insurance, Casualty Pool and Workers’ Compensation Association, Health Insurance
Changes in the Aggregate Liabilities for Claims
Other Self‐
Insurance
Casualty Pool
Workers’ Compensation Association
Health
Insurance*
Unpaid claims June 30, 2010 $ 308 677 11,288 2,840 Total claims incurred, fiscal year 2011 (20) 570 2,864 25,286 Total claims paid, fiscal year 2011 (38) (390) (1,873) (25,263)
Unpaid claims June 30, 2011 $ 250 857 12,279 2,863 Total claims incurred, fiscal year 2012 (29) 204 3,024 28,212 Total claims paid, fiscal year 2012 (25) (448) (1,893) (27,917)
Unpaid claims June 30, 2012 $ 196 613 13,410 3,158 Total claims incurred, fiscal year 2013 ‐‐ 394 4,186 28,591 Total claims paid, fiscal year 2013 (18) (379) (2,849) (28,449)
Unpaid claims June 30, 2013 $ 178 628 14,747 3,300
* The Health Insurance column excludes certain HMO, dental and vision premiums, flexible spending payments and retiree insurance credit expenses.
NOTE (21) – SUBSEQUENT EVENTS On March 5, 2013, the Board of County Supervisors approved Resolution No. 13‐157 authorizing the sale of General Obligation School Bonds to be sold to the Virginia Public School Authority in an amount not to exceed $69,280 for the purpose of financing various school projects. On July 17, 2013, the County sold to the Virginia Public School Authority Prince William County Special Obligation School Financing Bonds Series 2013 in the par amount of $59,990. On June 18, 2013, the Board of County Supervisors approved Resolution No. 13‐395 authorizing the sale of General Obligation Bonds to be sold in an amount not to exceed $32,000 for the purpose of road and parks capital improvement projects. On July 24, 2013, the County sold the Prince William County General Obligation Bonds Series 2013 in the par amount of $28,635.
119

120

REQUIRED SUPPLEMENTARY INFORMATION
(UNAUDITED)
121

122

Page 1 of 5
COUNTY OF PRINCE WILLIAM, VIRGINIA Schedule 1
GENERAL FUND
Schedule of Budgetary Revenues, Budgetary Expenditures and Changes in Budgetary Fund Balance ‐ Budget and Actual
(UNAUDITED ‐ BUDGET PREPARED ON A NON‐GAAP BASIS)
With Comparative Totals for the Year Ended June 30, 2012 (restated)(amounts expressed in thousands)
Variance With
Final Budget
2013 Positive 2012
Original Final Actual (Negative) (restated)
BUDGETARY REVENUES:
FROM LOCAL SOURCES:
GENERAL PROPERTY TAXES:
Real property taxes $ 499,202 499,202 496,742 (2,460) 475,380
Real and personal property taxes of public service corporations 17,982 17,982 18,401 419 17,704
Personal property taxes 131,661 77,361 80,247 2,886 73,192
Penalties and interest 6,061 6,061 5,268 (793) 5,146
Total general property taxes 654,906 600,606 600,658 52 571,422
OTHER LOCAL TAXES:
Short term rental tax 185 185 137 (48) 152
Local sales taxes 52,673 52,673 55,169 2,496 52,003
Consumer's utility taxes 13,740 13,740 13,490 (250) 13,075
Bank stock taxes 1,500 1,500 1,495 (5) 1,694
Motor vehicle licenses 7,770 7,770 7,877 107 7,591
Taxes on recordation and wills 7,075 7,075 10,277 3,202 8,014
Business, professional and occupational license tax 22,878 22,878 22,913 35 21,725
Public utility gross receipts tax 1,185 1,185 1,341 156 1,234
Transient occupancy tax 3,125 3,310 3,369 59 3,274
Total other local taxes 110,131 110,316 116,068 5,752 108,762
PERMITS, PRIVILEGE FEES AND
REGULATORY LICENSES:
Animal licenses 196 196 248 52 235
Development permits and licenses ‐ ‐ (3) (3) 1
Fire protection permits 319 319 457 138 360
Health protection permits 151 151 167 16 158
Cable franchise fees 881 881 1,208 327 1,112
Permits and other licenses 102 102 103 1 207
Total permits, privilege fees and regulatory licenses 1,649 1,649 2,180 531 2,073
FINES AND FORFEITURES: 2,586 2,586 3,259 673 3,435
FROM USE OF MONEY AND PROPERTY:
Use of money 8,667 6,317 6,234 (83) 6,228
Use of property 757 1,038 1,241 203 927 Total revenue from use of money and property 9,424 7,355 7,475 120 7,155
CHARGES FOR SERVICES:
Court costs 3,970 4,119 4,805 686 4,421
Correction and detention 693 833 954 121 846 Commonwealth's Attorney 73 73 124 51 127
Parks and recreation 765 765 1,188 423 1,462
Mental health and mental retardation 531 671 833 162 822 Welfare and social services 325 392 345 (47) 401
Library 663 663 548 (115) 578
Planning and community development 35 35 29 (6) 25
Public safety 1,031 1,031 1,382 351 1,136
Ambulance and rescue 4,087 4,087 4,609 522 3,774 Other charges 139 905 590 (315) 597
Total charges for services 12,312 13,574 15,407 1,833 14,189
Total revenue from local sources 791,008 736,086 745,047 8,961 707,036
Budgeted Amounts
123
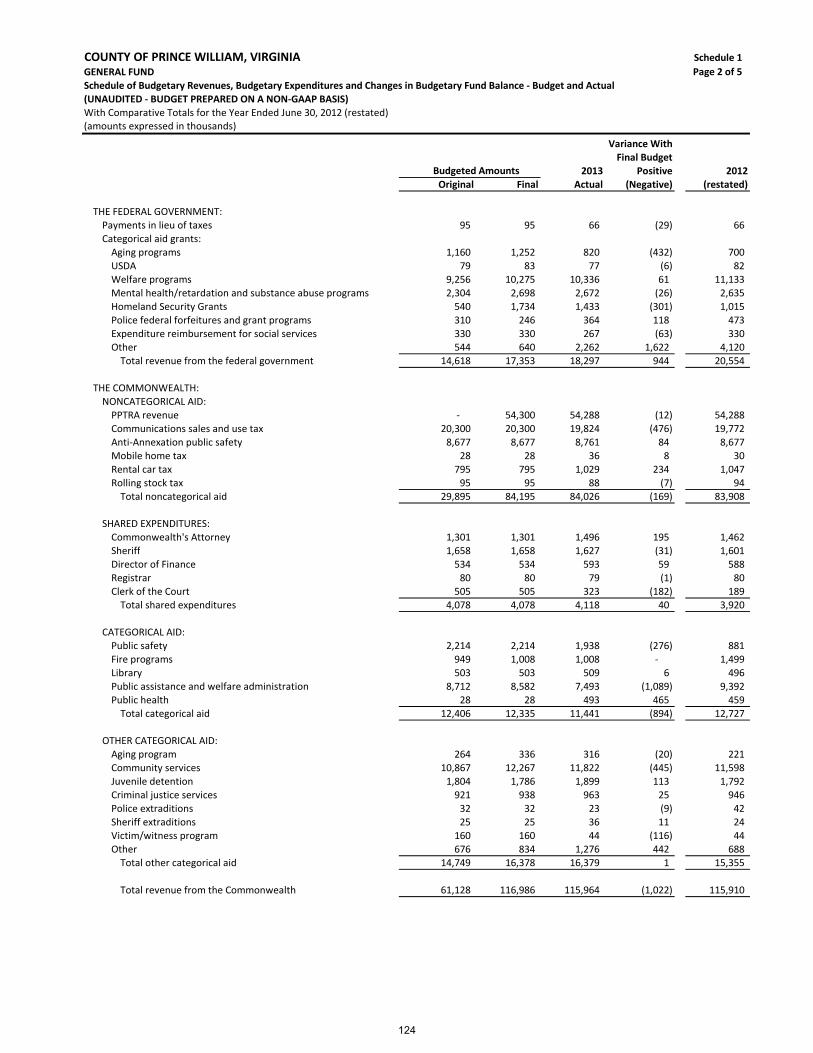
Page 2 of 5
COUNTY OF PRINCE WILLIAM, VIRGINIA Schedule 1
GENERAL FUND
Schedule of Budgetary Revenues, Budgetary Expenditures and Changes in Budgetary Fund Balance ‐ Budget and Actual
(UNAUDITED ‐ BUDGET PREPARED ON A NON‐GAAP BASIS)
With Comparative Totals for the Year Ended June 30, 2012 (restated)(amounts expressed in thousands)
Variance With
Final Budget
2013 Positive 2012
Original Final Actual (Negative) (restated)
Budgeted Amounts
THE FEDERAL GOVERNMENT:
Payments in lieu of taxes 95 95 66 (29) 66
Categorical aid grants:
Aging programs 1,160 1,252 820 (432) 700
USDA 79 83 77 (6) 82
Welfare programs 9,256 10,275 10,336 61 11,133
Mental health/retardation and substance abuse programs 2,304 2,698 2,672 (26) 2,635
Homeland Security Grants 540 1,734 1,433 (301) 1,015
Police federal forfeitures and grant programs 310 246 364 118 473
Expenditure reimbursement for social services 330 330 267 (63) 330
Other 544 640 2,262 1,622 4,120
Total revenue from the federal government 14,618 17,353 18,297 944 20,554
THE COMMONWEALTH:
NONCATEGORICAL AID:
PPTRA revenue ‐ 54,300 54,288 (12) 54,288
Communications sales and use tax 20,300 20,300 19,824 (476) 19,772
Anti‐Annexation public safety 8,677 8,677 8,761 84 8,677
Mobile home tax 28 28 36 8 30
Rental car tax 795 795 1,029 234 1,047
Rolling stock tax 95 95 88 (7) 94
Total noncategorical aid 29,895 84,195 84,026 (169) 83,908
SHARED EXPENDITURES:
Commonwealth's Attorney 1,301 1,301 1,496 195 1,462
Sheriff 1,658 1,658 1,627 (31) 1,601
Director of Finance 534 534 593 59 588
Registrar 80 80 79 (1) 80
Clerk of the Court 505 505 323 (182) 189
Total shared expenditures 4,078 4,078 4,118 40 3,920
CATEGORICAL AID:
Public safety 2,214 2,214 1,938 (276) 881
Fire programs 949 1,008 1,008 ‐ 1,499
Library 503 503 509 6 496
Public assistance and welfare administration 8,712 8,582 7,493 (1,089) 9,392 Public health 28 28 493 465 459
Total categorical aid 12,406 12,335 11,441 (894) 12,727
OTHER CATEGORICAL AID:
Aging program 264 336 316 (20) 221
Community services 10,867 12,267 11,822 (445) 11,598
Juvenile detention 1,804 1,786 1,899 113 1,792
Criminal justice services 921 938 963 25 946
Police extraditions 32 32 23 (9) 42 Sheriff extraditions 25 25 36 11 24
Victim/witness program 160 160 44 (116) 44
Other 676 834 1,276 442 688 Total other categorical aid 14,749 16,378 16,379 1 15,355
Total revenue from the Commonwealth 61,128 116,986 115,964 (1,022) 115,910
124
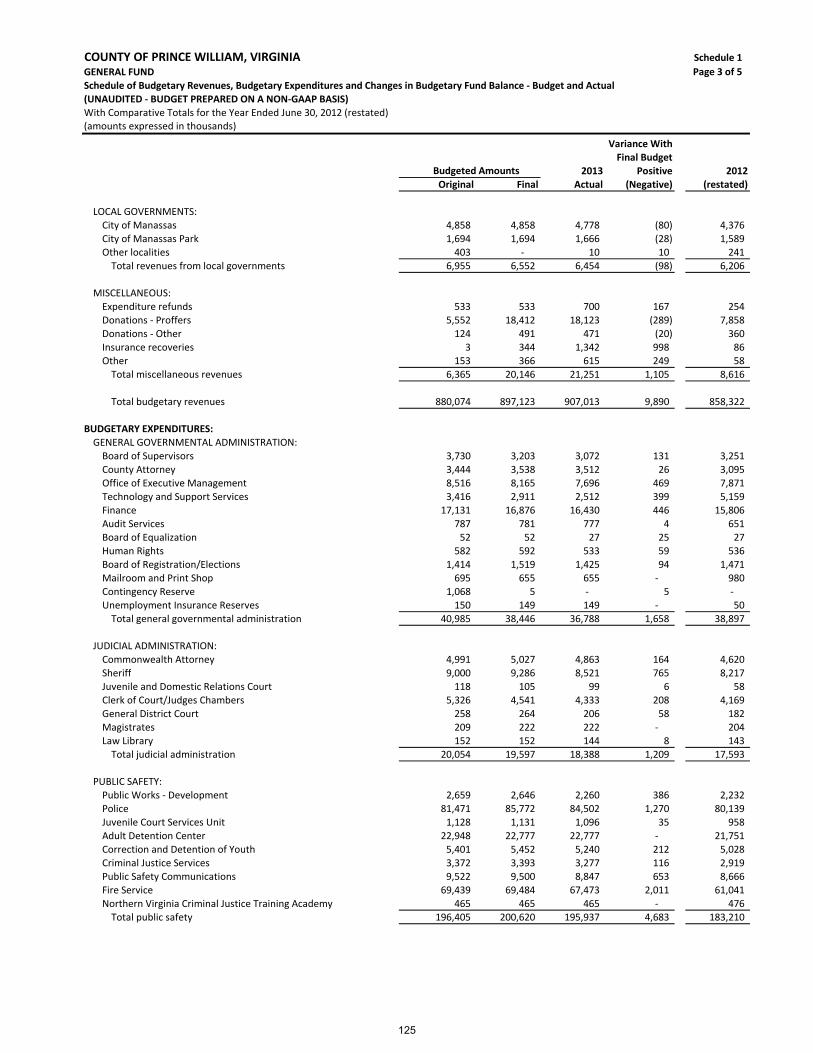
Page 3 of 5
COUNTY OF PRINCE WILLIAM, VIRGINIA Schedule 1
GENERAL FUND
Schedule of Budgetary Revenues, Budgetary Expenditures and Changes in Budgetary Fund Balance ‐ Budget and Actual
(UNAUDITED ‐ BUDGET PREPARED ON A NON‐GAAP BASIS)
With Comparative Totals for the Year Ended June 30, 2012 (restated)(amounts expressed in thousands)
Variance With
Final Budget
2013 Positive 2012
Original Final Actual (Negative) (restated)
Budgeted Amounts
LOCAL GOVERNMENTS:
City of Manassas 4,858 4,858 4,778 (80) 4,376
City of Manassas Park 1,694 1,694 1,666 (28) 1,589
Other localities 403 ‐ 10 10 241
Total revenues from local governments 6,955 6,552 6,454 (98) 6,206
MISCELLANEOUS:
Expenditure refunds 533 533 700 167 254
Donations ‐ Proffers 5,552 18,412 18,123 (289) 7,858
Donations ‐ Other 124 491 471 (20) 360
Insurance recoveries 3 344 1,342 998 86
Other 153 366 615 249 58
Total miscellaneous revenues 6,365 20,146 21,251 1,105 8,616
Total budgetary revenues 880,074 897,123 907,013 9,890 858,322
BUDGETARY EXPENDITURES:
GENERAL GOVERNMENTAL ADMINISTRATION:
Board of Supervisors 3,730 3,203 3,072 131 3,251
County Attorney 3,444 3,538 3,512 26 3,095
Office of Executive Management 8,516 8,165 7,696 469 7,871
Technology and Support Services 3,416 2,911 2,512 399 5,159
Finance 17,131 16,876 16,430 446 15,806
Audit Services 787 781 777 4 651
Board of Equalization 52 52 27 25 27
Human Rights 582 592 533 59 536
Board of Registration/Elections 1,414 1,519 1,425 94 1,471
Mailroom and Print Shop 695 655 655 ‐ 980
Contingency Reserve 1,068 5 ‐ 5 ‐
Unemployment Insurance Reserves 150 149 149 ‐ 50
Total general governmental administration 40,985 38,446 36,788 1,658 38,897
JUDICIAL ADMINISTRATION:
Commonwealth Attorney 4,991 5,027 4,863 164 4,620
Sheriff 9,000 9,286 8,521 765 8,217
Juvenile and Domestic Relations Court 118 105 99 6 58
Clerk of Court/Judges Chambers 5,326 4,541 4,333 208 4,169
General District Court 258 264 206 58 182 Magistrates 209 222 222 ‐ 204
Law Library 152 152 144 8 143
Total judicial administration 20,054 19,597 18,388 1,209 17,593
PUBLIC SAFETY:Public Works ‐ Development 2,659 2,646 2,260 386 2,232
Police 81,471 85,772 84,502 1,270 80,139
Juvenile Court Services Unit 1,128 1,131 1,096 35 958 Adult Detention Center 22,948 22,777 22,777 ‐ 21,751
Correction and Detention of Youth 5,401 5,452 5,240 212 5,028 Criminal Justice Services 3,372 3,393 3,277 116 2,919
Public Safety Communications 9,522 9,500 8,847 653 8,666
Fire Service 69,439 69,484 67,473 2,011 61,041
Northern Virginia Criminal Justice Training Academy 465 465 465 ‐ 476
Total public safety 196,405 200,620 195,937 4,683 183,210
125
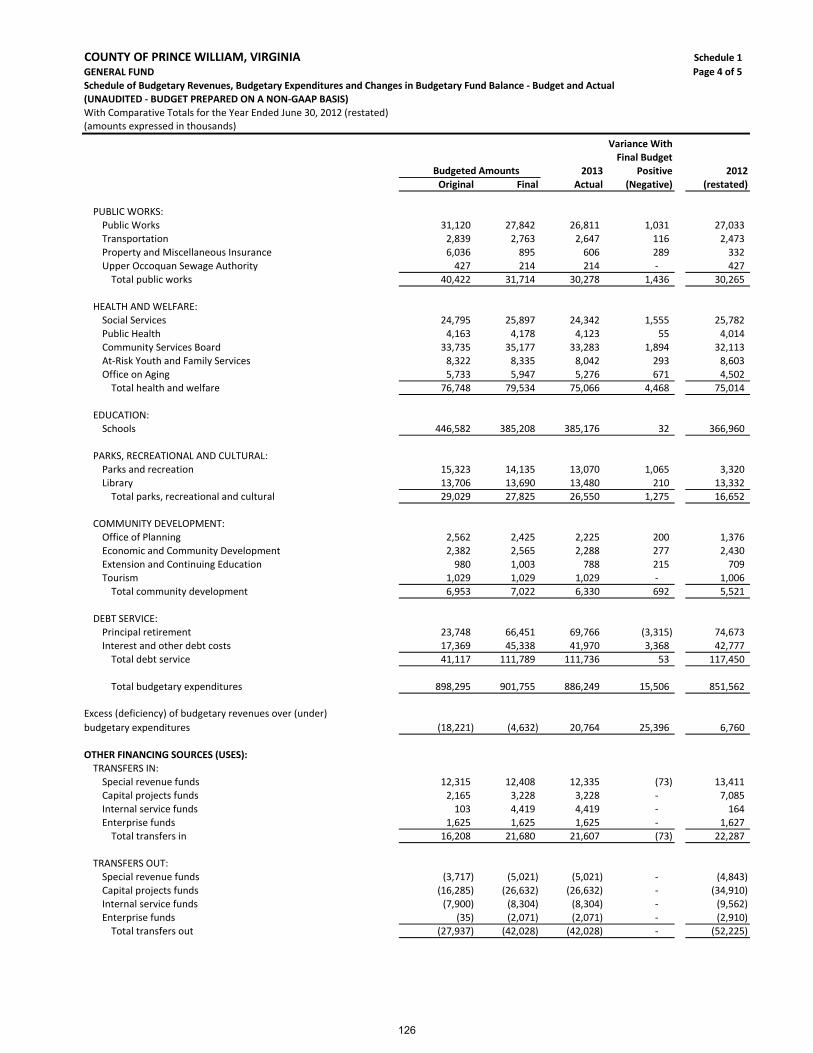
Page 4 of 5
COUNTY OF PRINCE WILLIAM, VIRGINIA Schedule 1
GENERAL FUND
Schedule of Budgetary Revenues, Budgetary Expenditures and Changes in Budgetary Fund Balance ‐ Budget and Actual
(UNAUDITED ‐ BUDGET PREPARED ON A NON‐GAAP BASIS)
With Comparative Totals for the Year Ended June 30, 2012 (restated)(amounts expressed in thousands)
Variance With
Final Budget
2013 Positive 2012
Original Final Actual (Negative) (restated)
Budgeted Amounts
PUBLIC WORKS:
Public Works 31,120 27,842 26,811 1,031 27,033
Transportation 2,839 2,763 2,647 116 2,473
Property and Miscellaneous Insurance 6,036 895 606 289 332
Upper Occoquan Sewage Authority 427 214 214 ‐ 427
Total public works 40,422 31,714 30,278 1,436 30,265
HEALTH AND WELFARE:
Social Services 24,795 25,897 24,342 1,555 25,782
Public Health 4,163 4,178 4,123 55 4,014
Community Services Board 33,735 35,177 33,283 1,894 32,113
At‐Risk Youth and Family Services 8,322 8,335 8,042 293 8,603
Office on Aging 5,733 5,947 5,276 671 4,502
Total health and welfare 76,748 79,534 75,066 4,468 75,014
EDUCATION:
Schools 446,582 385,208 385,176 32 366,960
PARKS, RECREATIONAL AND CULTURAL:
Parks and recreation 15,323 14,135 13,070 1,065 3,320
Library 13,706 13,690 13,480 210 13,332
Total parks, recreational and cultural 29,029 27,825 26,550 1,275 16,652
COMMUNITY DEVELOPMENT:
Office of Planning 2,562 2,425 2,225 200 1,376
Economic and Community Development 2,382 2,565 2,288 277 2,430
Extension and Continuing Education 980 1,003 788 215 709
Tourism 1,029 1,029 1,029 ‐ 1,006
Total community development 6,953 7,022 6,330 692 5,521
DEBT SERVICE:
Principal retirement 23,748 66,451 69,766 (3,315) 74,673
Interest and other debt costs 17,369 45,338 41,970 3,368 42,777
Total debt service 41,117 111,789 111,736 53 117,450
Total budgetary expenditures 898,295 901,755 886,249 15,506 851,562
Excess (deficiency) of budgetary revenues over (under)
budgetary expenditures (18,221) (4,632) 20,764 25,396 6,760
OTHER FINANCING SOURCES (USES):TRANSFERS IN:
Special revenue funds 12,315 12,408 12,335 (73) 13,411
Capital projects funds 2,165 3,228 3,228 ‐ 7,085
Internal service funds 103 4,419 4,419 ‐ 164
Enterprise funds 1,625 1,625 1,625 ‐ 1,627
Total transfers in 16,208 21,680 21,607 (73) 22,287
TRANSFERS OUT:
Special revenue funds (3,717) (5,021) (5,021) ‐ (4,843)
Capital projects funds (16,285) (26,632) (26,632) ‐ (34,910) Internal service funds (7,900) (8,304) (8,304) ‐ (9,562)
Enterprise funds (35) (2,071) (2,071) ‐ (2,910)
Total transfers out (27,937) (42,028) (42,028) ‐ (52,225)
126
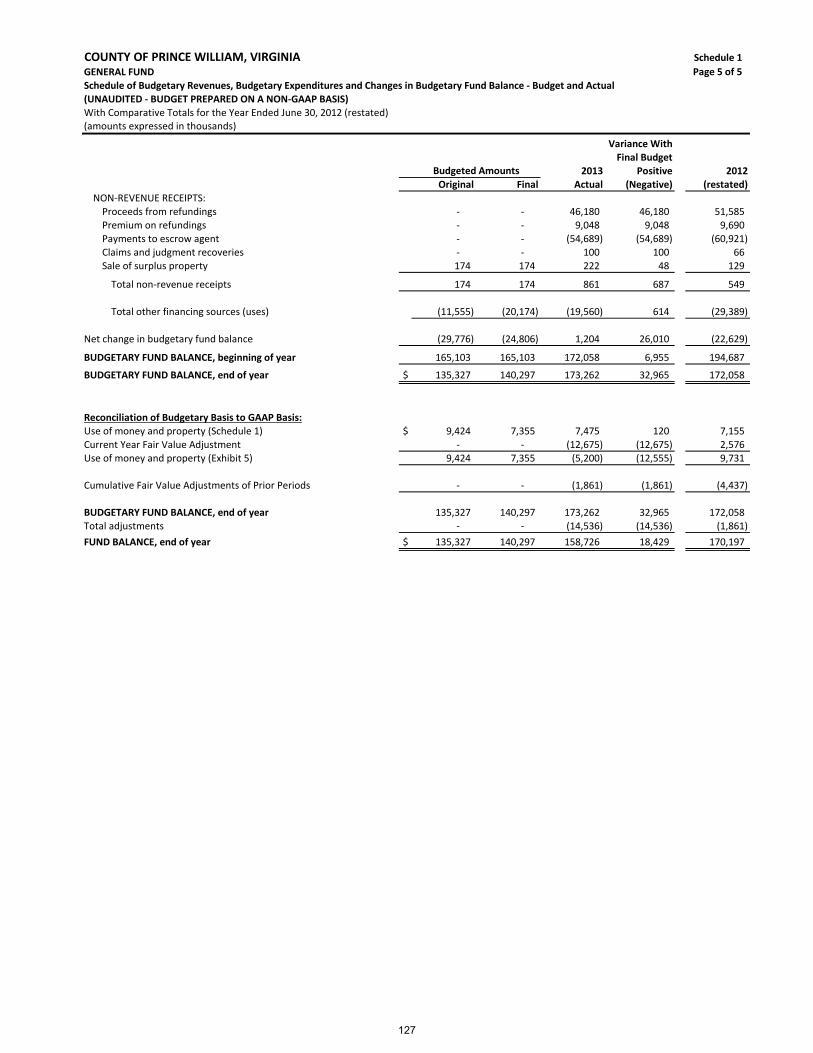
Page 5 of 5
COUNTY OF PRINCE WILLIAM, VIRGINIA Schedule 1
GENERAL FUND
Schedule of Budgetary Revenues, Budgetary Expenditures and Changes in Budgetary Fund Balance ‐ Budget and Actual
(UNAUDITED ‐ BUDGET PREPARED ON A NON‐GAAP BASIS)
With Comparative Totals for the Year Ended June 30, 2012 (restated)(amounts expressed in thousands)
Variance With
Final Budget
2013 Positive 2012
Original Final Actual (Negative) (restated)
Budgeted Amounts
NON‐REVENUE RECEIPTS:
Proceeds from refundings ‐ ‐ 46,180 46,180 51,585
Premium on refundings ‐ ‐ 9,048 9,048 9,690
Payments to escrow agent ‐ ‐ (54,689) (54,689) (60,921)
Claims and judgment recoveries ‐ ‐ 100 100 66
Sale of surplus property 174 174 222 48 129
Total non‐revenue receipts 174 174 861 687 549
Total other financing sources (uses) (11,555) (20,174) (19,560) 614 (29,389)
Net change in budgetary fund balance (29,776) (24,806) 1,204 26,010 (22,629)
BUDGETARY FUND BALANCE, beginning of year 165,103 165,103 172,058 6,955 194,687
BUDGETARY FUND BALANCE, end of year $ 135,327 140,297 173,262 32,965 172,058
Reconciliation of Budgetary Basis to GAAP Basis:Use of money and property (Schedule 1) $ 9,424 7,355 7,475 120 7,155
Current Year Fair Value Adjustment ‐ ‐ (12,675) (12,675) 2,576
Use of money and property (Exhibit 5) 9,424 7,355 (5,200) (12,555) 9,731
Cumulative Fair Value Adjustments of Prior Periods ‐ ‐ (1,861) (1,861) (4,437)
BUDGETARY FUND BALANCE, end of year 135,327 140,297 173,262 32,965 172,058
Total adjustments ‐ ‐ (14,536) (14,536) (1,861)
FUND BALANCE, end of year $ 135,327 140,297 158,726 18,429 170,197
127
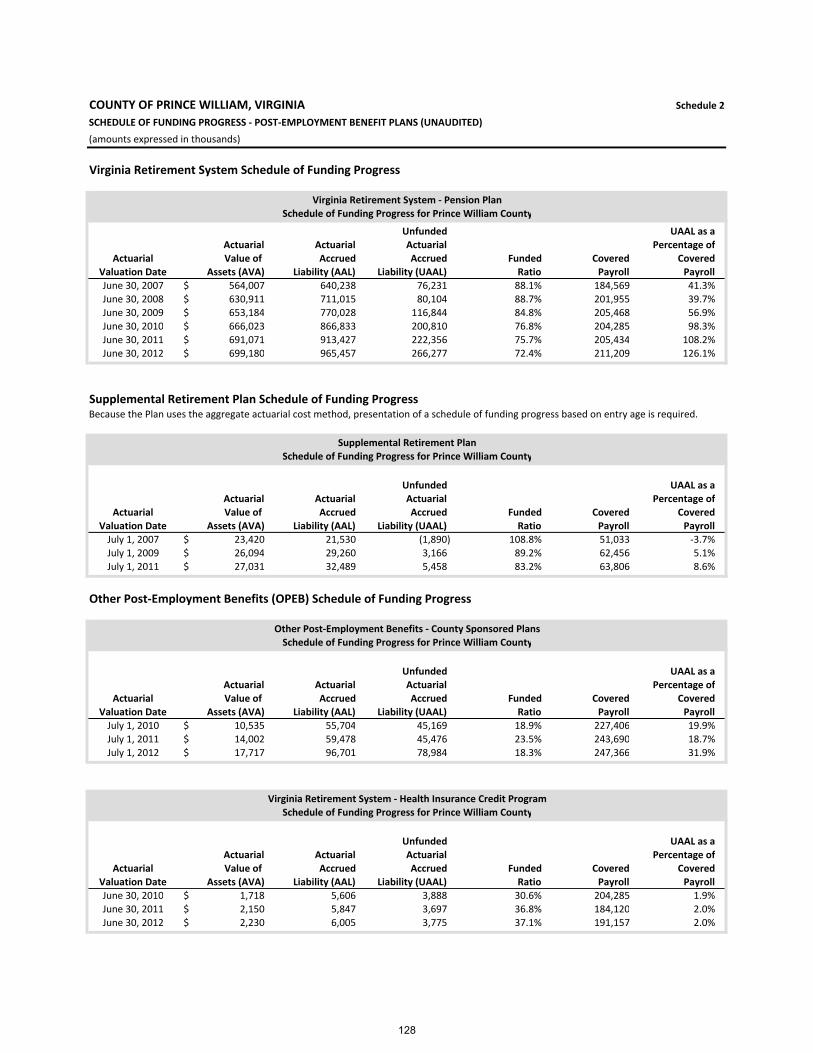
COUNTY OF PRINCE WILLIAM, VIRGINIA Schedule 2
SCHEDULE OF FUNDING PROGRESS ‐ POST‐EMPLOYMENT BENEFIT PLANS (UNAUDITED)
(amounts expressed in thousands)
Virginia Retirement System Schedule of Funding Progress
Unfunded UAAL as a
Actuarial Actuarial Actuarial Percentage ofActuarial Value of Accrued Accrued Funded Covered Covered
Valuation Date Assets (AVA) Liability (AAL) Liability (UAAL) Ratio Payroll Payroll
June 30, 2007 564,007$ 640,238 76,231 88.1% 184,569 41.3%
June 30, 2008 630,911$ 711,015 80,104 88.7% 201,955 39.7%
June 30, 2009 653,184$ 770,028 116,844 84.8% 205,468 56.9%
June 30, 2010 666,023$ 866,833 200,810 76.8% 204,285 98.3%
June 30, 2011 691,071$ 913,427 222,356 75.7% 205,434 108.2%
June 30, 2012 699,180$ 965,457 266,277 72.4% 211,209 126.1%
Supplemental Retirement Plan Schedule of Funding ProgressBecause the Plan uses the aggregate actuarial cost method, presentation of a schedule of funding progress based on entry age is required.
Unfunded UAAL as a
Actuarial Actuarial Actuarial Percentage ofActuarial Value of Accrued Accrued Funded Covered Covered
Valuation Date Assets (AVA) Liability (AAL) Liability (UAAL) Ratio Payroll Payroll
July 1, 2007 23,420$ 21,530 (1,890) 108.8% 51,033 ‐3.7%
July 1, 2009 26,094$ 29,260 3,166 89.2% 62,456 5.1%
July 1, 2011 27,031$ 32,489 5,458 83.2% 63,806 8.6%
Other Post‐Employment Benefits (OPEB) Schedule of Funding Progress
Unfunded UAAL as a
Actuarial Actuarial Actuarial Percentage ofActuarial Value of Accrued Accrued Funded Covered Covered
Valuation Date Assets (AVA) Liability (AAL) Liability (UAAL) Ratio Payroll Payroll
July 1, 2010 10,535$ 55,704 45,169 18.9% 227,406 19.9%July 1, 2011 14,002$ 59,478 45,476 23.5% 243,690 18.7%
July 1, 2012 17,717$ 96,701 78,984 18.3% 247,366 31.9%
Unfunded UAAL as a
Actuarial Actuarial Actuarial Percentage of
Actuarial Value of Accrued Accrued Funded Covered Covered
Valuation Date Assets (AVA) Liability (AAL) Liability (UAAL) Ratio Payroll PayrollJune 30, 2010 1,718$ 5,606 3,888 30.6% 204,285 1.9%
June 30, 2011 2,150$ 5,847 3,697 36.8% 184,120 2.0%June 30, 2012 2,230$ 6,005 3,775 37.1% 191,157 2.0%
Virginia Retirement System ‐ Health Insurance Credit Program
Schedule of Funding Progress for Prince William County
Virginia Retirement System ‐ Pension Plan
Schedule of Funding Progress for Prince William County
Supplemental Retirement Plan
Schedule of Funding Progress for Prince William County
Other Post‐Employment Benefits ‐ County Sponsored Plans
Schedule of Funding Progress for Prince William County
128

SUPPLEMENTARY INFORMATION
129

130

Nonmajor Governmental Funds Special Revenue Funds
Special Revenue Funds are used to account for specific revenues that are legally restricted to expenditures for particular purposes.
The Transportation Districts receive their revenues from special tax levies,
user fees, and interest earnings. These revenues are used primarily to pay debt service payments incurred in construction of streets and roads.
The Stormwater Management District and Gypsy Moth Levy receive its
revenues from permits and development fees, charges for services, Federal and State grants, interest earnings and special tax levies. Expenditures consist of the cost of promoting storm water drainage and construction projects, maintaining water quality and protecting the environment.
Development Fee Services receive revenues from permits, privilege fees,
and regulatory licenses related to land and building development. Expenditures consist primarily of the cost of conducting review, inspection, and planning services.
Housing receives its revenue primarily from Federal housing grants that are
used to develop affordable housing opportunities for County residents.
131
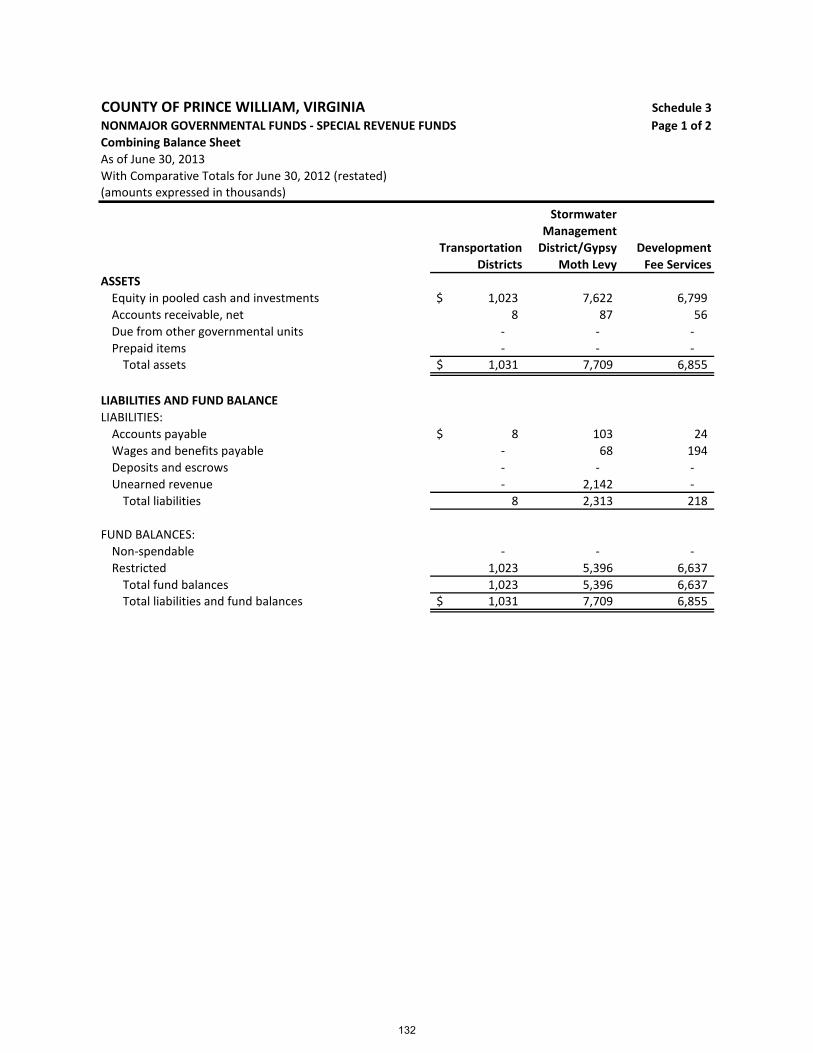
COUNTY OF PRINCE WILLIAM, VIRGINIA Schedule 3
NONMAJOR GOVERNMENTAL FUNDS ‐ SPECIAL REVENUE FUNDS Page 1 of 2
Combining Balance Sheet
As of June 30, 2013
With Comparative Totals for June 30, 2012 (restated)(amounts expressed in thousands)
Stormwater
Management
Transportation District/Gypsy Development
Districts Moth Levy Fee Services
ASSETS
Equity in pooled cash and investments 1,023$ 7,622 6,799
Accounts receivable, net 8 87 56
Due from other governmental units ‐ ‐ ‐
Prepaid items ‐ ‐ ‐ Total assets 1,031$ 7,709 6,855
LIABILITIES AND FUND BALANCE
LIABILITIES:
Accounts payable 8$ 103 24
Wages and benefits payable ‐ 68 194
Deposits and escrows ‐ ‐ ‐
Unearned revenue ‐ 2,142 ‐
Total liabilities 8 2,313 218
FUND BALANCES:
Non‐spendable ‐ ‐ ‐
Restricted 1,023 5,396 6,637
Total fund balances 1,023 5,396 6,637 Total liabilities and fund balances 1,031$ 7,709 6,855
132
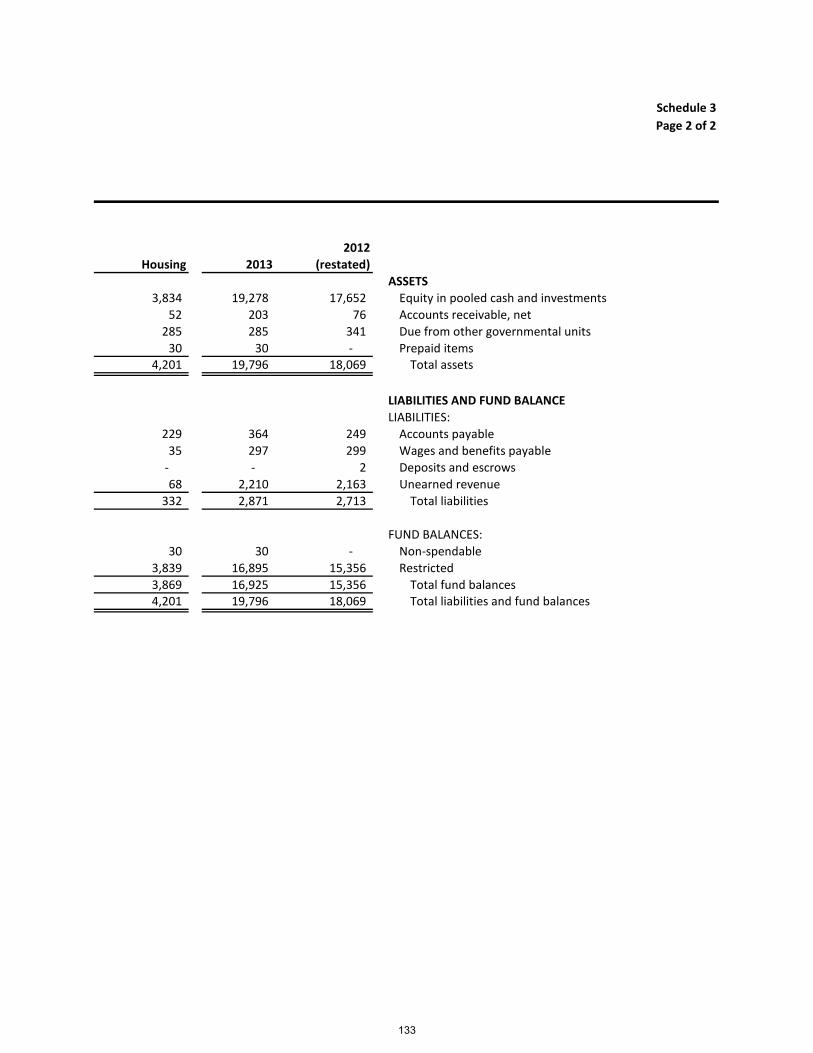
Schedule 3
Page 2 of 2
2012
Housing 2013 (restated)
ASSETS
3,834 19,278 17,652 Equity in pooled cash and investments
52 203 76 Accounts receivable, net
285 285 341 Due from other governmental units
30 30 ‐ Prepaid items4,201 19,796 18,069 Total assets
LIABILITIES AND FUND BALANCE
LIABILITIES:
229 364 249 Accounts payable
35 297 299 Wages and benefits payable
‐ ‐ 2 Deposits and escrows
68 2,210 2,163 Unearned revenue
332 2,871 2,713 Total liabilities
FUND BALANCES:
30 30 ‐ Non‐spendable
3,839 16,895 15,356 Restricted
3,869 16,925 15,356 Total fund balances4,201 19,796 18,069 Total liabilities and fund balances
133
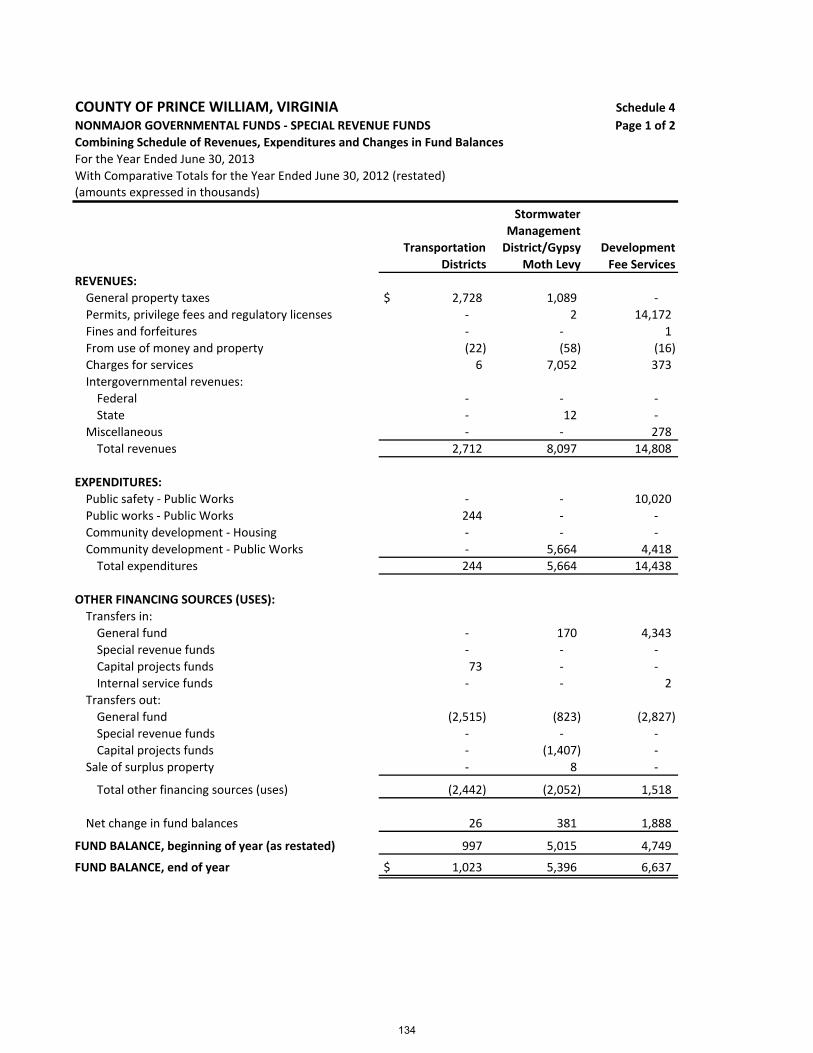
COUNTY OF PRINCE WILLIAM, VIRGINIA Schedule 4
NONMAJOR GOVERNMENTAL FUNDS ‐ SPECIAL REVENUE FUNDS Page 1 of 2
Combining Schedule of Revenues, Expenditures and Changes in Fund Balances
For the Year Ended June 30, 2013
With Comparative Totals for the Year Ended June 30, 2012 (restated)(amounts expressed in thousands)
Stormwater
Management
Transportation District/Gypsy Development
Districts Moth Levy Fee Services
REVENUES:
General property taxes $ 2,728 1,089 ‐
Permits, privilege fees and regulatory licenses ‐ 2 14,172
Fines and forfeitures ‐ ‐ 1
From use of money and property (22) (58) (16)
Charges for services 6 7,052 373
Intergovernmental revenues:
Federal ‐ ‐ ‐
State ‐ 12 ‐
Miscellaneous ‐ ‐ 278
Total revenues 2,712 8,097 14,808
EXPENDITURES:
Public safety ‐ Public Works ‐ ‐ 10,020
Public works ‐ Public Works 244 ‐ ‐
Community development ‐ Housing ‐ ‐ ‐
Community development ‐ Public Works ‐ 5,664 4,418
Total expenditures 244 5,664 14,438
OTHER FINANCING SOURCES (USES):
Transfers in:
General fund ‐ 170 4,343
Special revenue funds ‐ ‐ ‐
Capital projects funds 73 ‐ ‐
Internal service funds ‐ ‐ 2
Transfers out:
General fund (2,515) (823) (2,827)
Special revenue funds ‐ ‐ ‐
Capital projects funds ‐ (1,407) ‐
Sale of surplus property ‐ 8 ‐
Total other financing sources (uses) (2,442) (2,052) 1,518
Net change in fund balances 26 381 1,888
FUND BALANCE, beginning of year (as restated) 997 5,015 4,749
FUND BALANCE, end of year $ 1,023 5,396 6,637
134
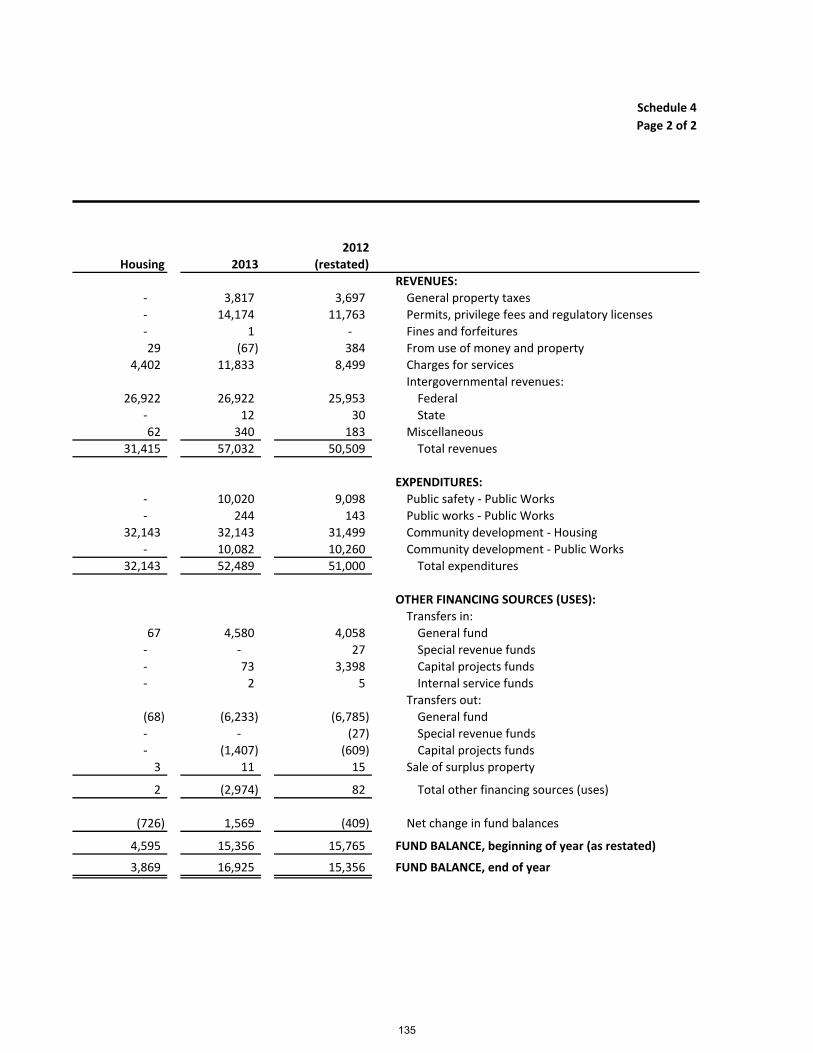
Schedule 4
Page 2 of 2
2012
Housing 2013 (restated)
REVENUES:
‐ 3,817 3,697 General property taxes
‐ 14,174 11,763 Permits, privilege fees and regulatory licenses
‐ 1 ‐ Fines and forfeitures
29 (67) 384 From use of money and property
4,402 11,833 8,499 Charges for services
Intergovernmental revenues:
26,922 26,922 25,953 Federal
‐ 12 30 State
62 340 183 Miscellaneous
31,415 57,032 50,509 Total revenues
EXPENDITURES:
‐ 10,020 9,098 Public safety ‐ Public Works
‐ 244 143 Public works ‐ Public Works
32,143 32,143 31,499 Community development ‐ Housing
‐ 10,082 10,260 Community development ‐ Public Works
32,143 52,489 51,000 Total expenditures
OTHER FINANCING SOURCES (USES):
Transfers in:
67 4,580 4,058 General fund
‐ ‐ 27 Special revenue funds
‐ 73 3,398 Capital projects funds
‐ 2 5 Internal service funds
Transfers out:
(68) (6,233) (6,785) General fund
‐ ‐ (27) Special revenue funds
‐ (1,407) (609) Capital projects funds
3 11 15 Sale of surplus property
2 (2,974) 82 Total other financing sources (uses)
(726) 1,569 (409) Net change in fund balances
4,595 15,356 15,765 FUND BALANCE, beginning of year (as restated)
3,869 16,925 15,356 FUND BALANCE, end of year
135
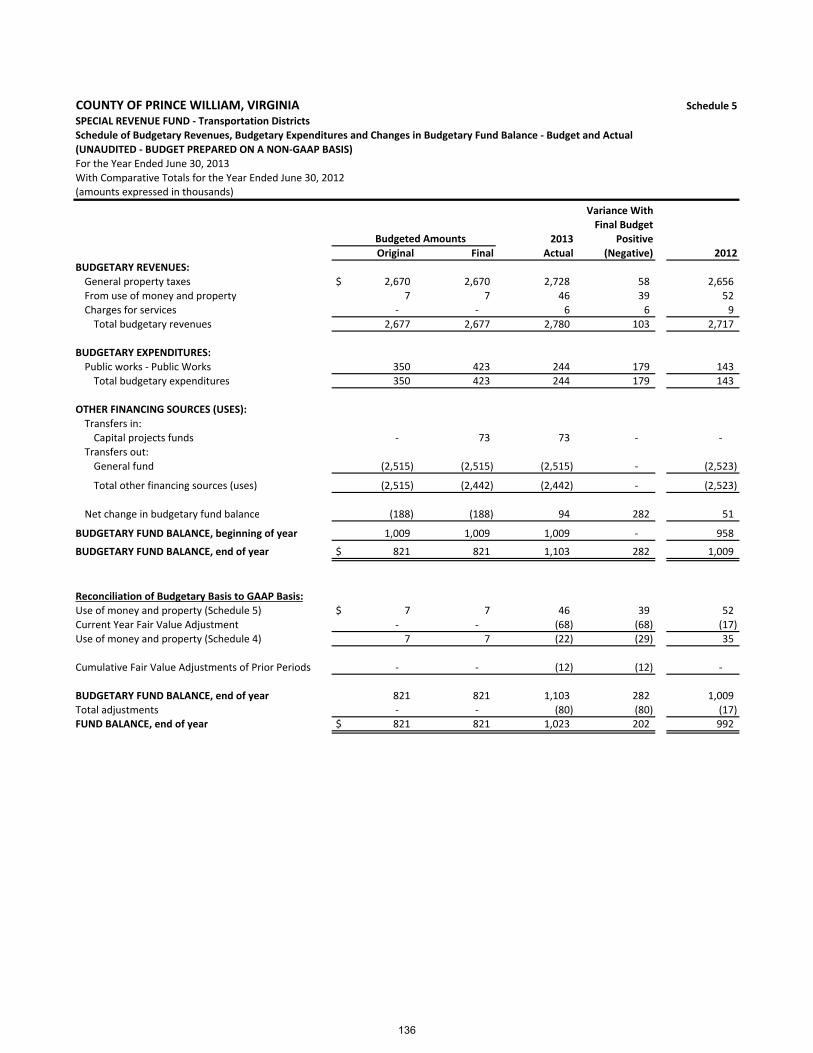
COUNTY OF PRINCE WILLIAM, VIRGINIA Schedule 5
SPECIAL REVENUE FUND ‐ Transportation Districts
Schedule of Budgetary Revenues, Budgetary Expenditures and Changes in Budgetary Fund Balance ‐ Budget and Actual
(UNAUDITED ‐ BUDGET PREPARED ON A NON‐GAAP BASIS)
For the Year Ended June 30, 2013
With Comparative Totals for the Year Ended June 30, 2012(amounts expressed in thousands)
Variance With
Final Budget
2013 Positive
Original Final Actual (Negative) 2012
BUDGETARY REVENUES:
General property taxes $ 2,670 2,670 2,728 58 2,656
From use of money and property 7 7 46 39 52
Charges for services ‐ ‐ 6 6 9
Total budgetary revenues 2,677 2,677 2,780 103 2,717
BUDGETARY EXPENDITURES:
Public works ‐ Public Works 350 423 244 179 143
Total budgetary expenditures 350 423 244 179 143
OTHER FINANCING SOURCES (USES):
Transfers in:
Capital projects funds ‐ 73 73 ‐ ‐
Transfers out:
General fund (2,515) (2,515) (2,515) ‐ (2,523)
Total other financing sources (uses) (2,515) (2,442) (2,442) ‐ (2,523)
Net change in budgetary fund balance (188) (188) 94 282 51
BUDGETARY FUND BALANCE, beginning of year 1,009 1,009 1,009 ‐ 958
BUDGETARY FUND BALANCE, end of year $ 821 821 1,103 282 1,009
Reconciliation of Budgetary Basis to GAAP Basis:
Use of money and property (Schedule 5) $ 7 7 46 39 52
Current Year Fair Value Adjustment ‐ ‐ (68) (68) (17)
Use of money and property (Schedule 4) 7 7 (22) (29) 35
Cumulative Fair Value Adjustments of Prior Periods ‐ ‐ (12) (12) ‐
BUDGETARY FUND BALANCE, end of year 821 821 1,103 282 1,009
Total adjustments ‐ ‐ (80) (80) (17) FUND BALANCE, end of year $ 821 821 1,023 202 992
Budgeted Amounts
136
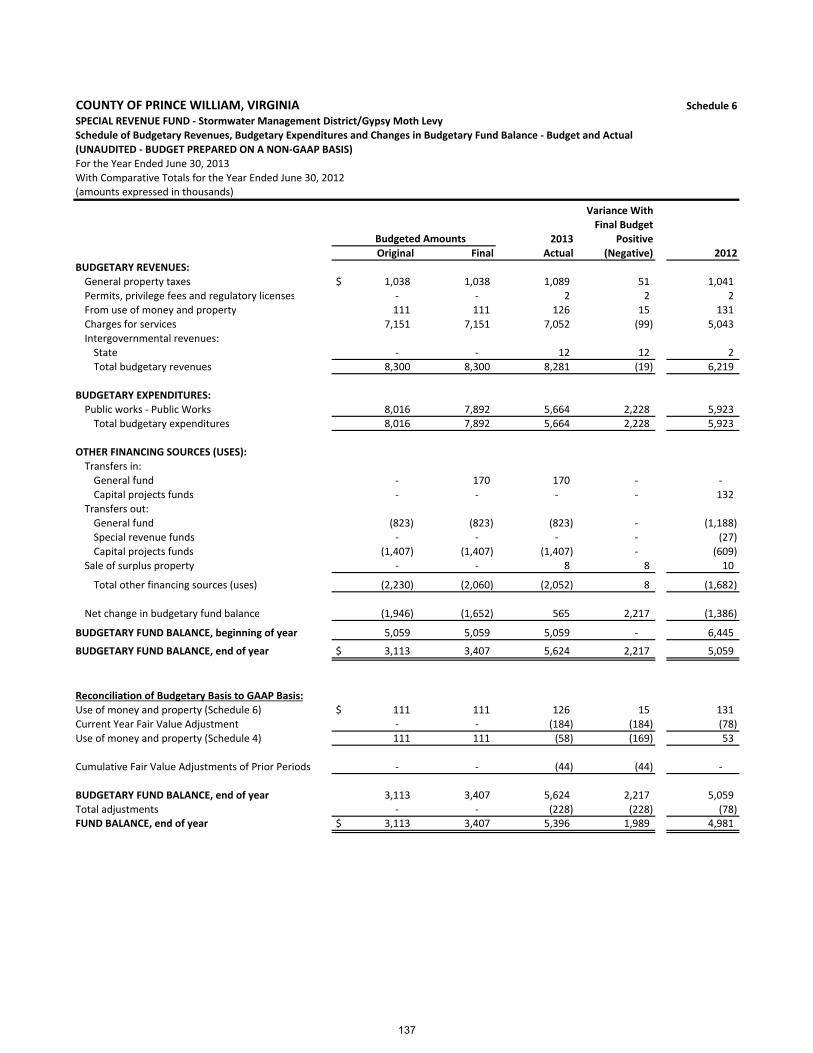
COUNTY OF PRINCE WILLIAM, VIRGINIA Schedule 6
SPECIAL REVENUE FUND ‐ Stormwater Management District/Gypsy Moth Levy
Schedule of Budgetary Revenues, Budgetary Expenditures and Changes in Budgetary Fund Balance ‐ Budget and Actual
(UNAUDITED ‐ BUDGET PREPARED ON A NON‐GAAP BASIS)
For the Year Ended June 30, 2013
With Comparative Totals for the Year Ended June 30, 2012(amounts expressed in thousands)
Variance With
Final Budget
2013 Positive
Original Final Actual (Negative) 2012
BUDGETARY REVENUES:
General property taxes $ 1,038 1,038 1,089 51 1,041
Permits, privilege fees and regulatory licenses ‐ ‐ 2 2 2
From use of money and property 111 111 126 15 131
Charges for services 7,151 7,151 7,052 (99) 5,043
Intergovernmental revenues:
State ‐ ‐ 12 12 2
Total budgetary revenues 8,300 8,300 8,281 (19) 6,219
BUDGETARY EXPENDITURES:
Public works ‐ Public Works 8,016 7,892 5,664 2,228 5,923
Total budgetary expenditures 8,016 7,892 5,664 2,228 5,923
OTHER FINANCING SOURCES (USES):
Transfers in:
General fund ‐ 170 170 ‐ ‐
Capital projects funds ‐ ‐ ‐ ‐ 132
Transfers out:
General fund (823) (823) (823) ‐ (1,188)
Special revenue funds ‐ ‐ ‐ ‐ (27)
Capital projects funds (1,407) (1,407) (1,407) ‐ (609)
Sale of surplus property ‐ ‐ 8 8 10
Total other financing sources (uses) (2,230) (2,060) (2,052) 8 (1,682)
Net change in budgetary fund balance (1,946) (1,652) 565 2,217 (1,386)
BUDGETARY FUND BALANCE, beginning of year 5,059 5,059 5,059 ‐ 6,445
BUDGETARY FUND BALANCE, end of year $ 3,113 3,407 5,624 2,217 5,059
Reconciliation of Budgetary Basis to GAAP Basis:
Use of money and property (Schedule 6) $ 111 111 126 15 131
Current Year Fair Value Adjustment ‐ ‐ (184) (184) (78)
Use of money and property (Schedule 4) 111 111 (58) (169) 53
Cumulative Fair Value Adjustments of Prior Periods ‐ ‐ (44) (44) ‐
BUDGETARY FUND BALANCE, end of year 3,113 3,407 5,624 2,217 5,059
Total adjustments ‐ ‐ (228) (228) (78) FUND BALANCE, end of year $ 3,113 3,407 5,396 1,989 4,981
Budgeted Amounts
137
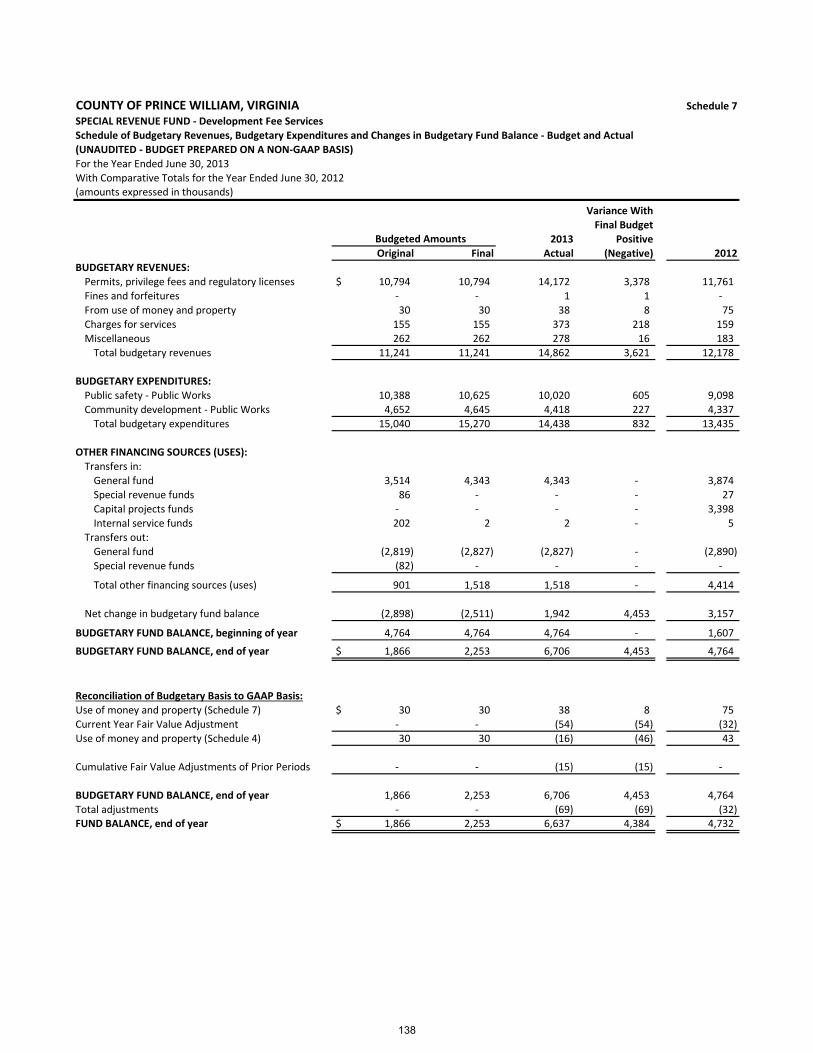
COUNTY OF PRINCE WILLIAM, VIRGINIA Schedule 7
SPECIAL REVENUE FUND ‐ Development Fee Services
Schedule of Budgetary Revenues, Budgetary Expenditures and Changes in Budgetary Fund Balance ‐ Budget and Actual
(UNAUDITED ‐ BUDGET PREPARED ON A NON‐GAAP BASIS)
For the Year Ended June 30, 2013
With Comparative Totals for the Year Ended June 30, 2012(amounts expressed in thousands)
Variance With
Final Budget
2013 Positive
Original Final Actual (Negative) 2012
BUDGETARY REVENUES:
Permits, privilege fees and regulatory licenses $ 10,794 10,794 14,172 3,378 11,761
Fines and forfeitures ‐ ‐ 1 1 ‐
From use of money and property 30 30 38 8 75
Charges for services 155 155 373 218 159
Miscellaneous 262 262 278 16 183
Total budgetary revenues 11,241 11,241 14,862 3,621 12,178
BUDGETARY EXPENDITURES:
Public safety ‐ Public Works 10,388 10,625 10,020 605 9,098
Community development ‐ Public Works 4,652 4,645 4,418 227 4,337
Total budgetary expenditures 15,040 15,270 14,438 832 13,435
OTHER FINANCING SOURCES (USES):
Transfers in:
General fund 3,514 4,343 4,343 ‐ 3,874
Special revenue funds 86 ‐ ‐ ‐ 27
Capital projects funds ‐ ‐ ‐ ‐ 3,398
Internal service funds 202 2 2 ‐ 5
Transfers out:
General fund (2,819) (2,827) (2,827) ‐ (2,890)
Special revenue funds (82) ‐ ‐ ‐ ‐
Total other financing sources (uses) 901 1,518 1,518 ‐ 4,414
Net change in budgetary fund balance (2,898) (2,511) 1,942 4,453 3,157
BUDGETARY FUND BALANCE, beginning of year 4,764 4,764 4,764 ‐ 1,607
BUDGETARY FUND BALANCE, end of year $ 1,866 2,253 6,706 4,453 4,764
Reconciliation of Budgetary Basis to GAAP Basis:
Use of money and property (Schedule 7) $ 30 30 38 8 75
Current Year Fair Value Adjustment ‐ ‐ (54) (54) (32)
Use of money and property (Schedule 4) 30 30 (16) (46) 43
Cumulative Fair Value Adjustments of Prior Periods ‐ ‐ (15) (15) ‐
BUDGETARY FUND BALANCE, end of year 1,866 2,253 6,706 4,453 4,764
Total adjustments ‐ ‐ (69) (69) (32) FUND BALANCE, end of year $ 1,866 2,253 6,637 4,384 4,732
Budgeted Amounts
138

COUNTY OF PRINCE WILLIAM, VIRGINIA Schedule 8
SPECIAL REVENUE FUND ‐ Housing
Schedule of Budgetary Revenues, Budgetary Expenditures and Changes in Budgetary Fund Balance ‐ Budget and Actual
(UNAUDITED ‐ BUDGET PREPARED ON A NON‐GAAP BASIS)
For the Year Ended June 30, 2013
With Comparative Totals for the Year Ended June 30, 2012(amounts expressed in thousands)
Variance With
Final Budget
2013 Positive
Original Final Actual (Negative) 2012
BUDGETARY REVENUES:
From use of money and property $ 25 25 29 4 70
Charges for services 3,735 3,723 4,402 679 3,288
Intergovernmental revenues:
Federal 31,214 28,923 26,922 (2,001) 25,953
State ‐ ‐ ‐ ‐ 28
Miscellaneous 25 25 62 37 ‐
Total budgetary revenues 34,999 32,696 31,415 (1,281) 29,339
BUDGETARY EXPENDITURES:
Community development ‐ Housing 35,842 33,869 32,143 1,726 31,499
Total budgetary expenditures 35,842 33,869 32,143 1,726 31,499
OTHER FINANCING SOURCES (USES):
Transfers in:
General fund 21 67 67 ‐ 52
Transfers out:
General fund (78) (78) (68) 10 (184)
Sale of surplus property ‐ ‐ 3 3 5
Total other financing sources (uses) (57) (11) 2 13 (127)
Net change in budgetary fund balance (900) (1,184) (726) 458 (2,287)
BUDGETARY FUND BALANCE, beginning of year 4,595 4,595 4,595 ‐ 6,882
BUDGETARY FUND BALANCE, end of year $ 3,695 3,411 3,869 458 4,595
Reconciliation of Budgetary Basis to GAAP Basis:
Use of money and property (Schedule 8) $ 25 25 29 4 70
Current Year Fair Value Adjustment ‐ ‐ ‐ ‐ ‐
Use of money and property (Schedule 4) 25 25 29 4 70
Cumulative Fair Value Adjustments of Prior Periods ‐ ‐ ‐ ‐ ‐
BUDGETARY FUND BALANCE, end of year 3,695 3,411 3,869 458 4,595
Total adjustments ‐ ‐ ‐ ‐ ‐ FUND BALANCE, end of year $ 3,695 3,411 3,869 458 4,595
Budgeted Amounts
139
Internal Service Funds
Internal Service Funds are used to account for the financing of goods or services provided on a cost‐reimbursement basis by one department or agency to other departments or agencies of the County. The County has the following internal service funds:
Intra‐County Services Fund
Comprised of the Construction Crew, which provide roads and sidewalk
construction and maintenance on County property; Data Processing, which provides computer operations and software applications; and Vehicle Maintenance, which provides fleet operations services.
Self‐insurance Funds
Three self‐insurance programs provide the County with liability, property
damage, casualty and workers' compensation insurance.
Health Insurance
The County established a Health Insurance Fund to self‐insure for medical
coverage for employees, to provide fully insured dental, vision, and flexible spending benefits, and to provide an additional insurance credit for retirees.
140
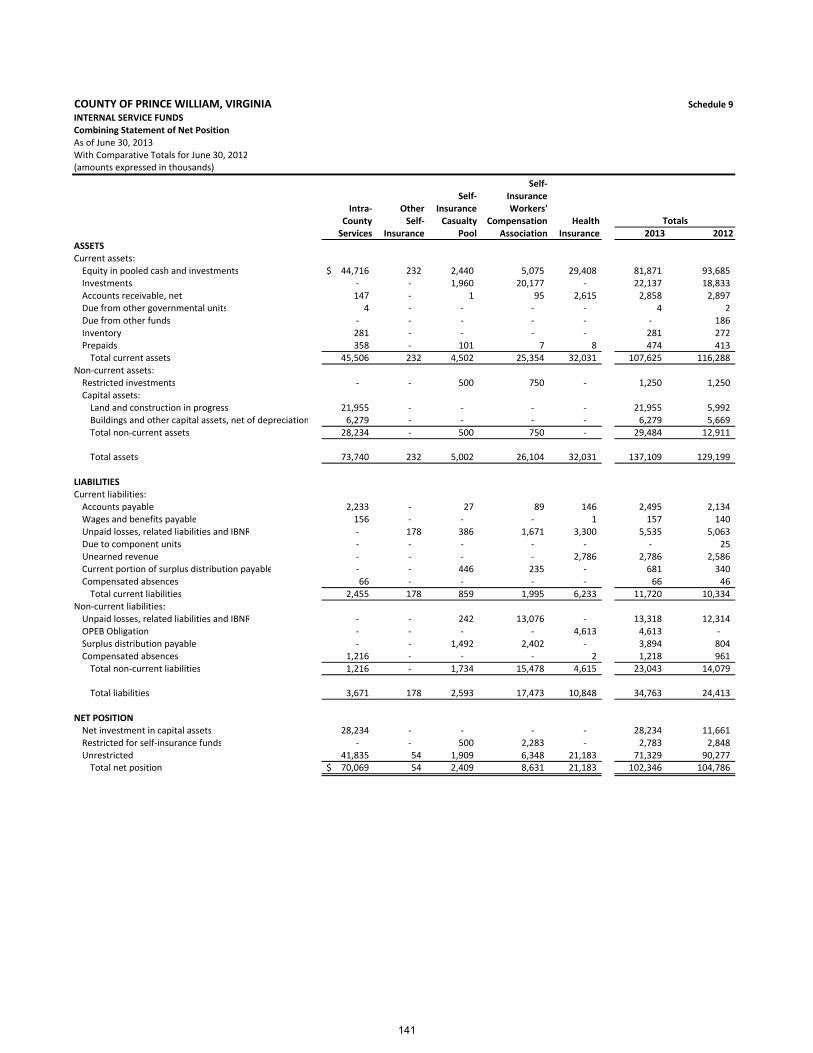
COUNTY OF PRINCE WILLIAM, VIRGINIA Schedule 9
INTERNAL SERVICE FUNDSCombining Statement of Net PositionAs of June 30, 2013With Comparative Totals for June 30, 2012(amounts expressed in thousands)
Self‐Self‐ Insurance
Intra‐ Other Insurance Workers'County Self‐ Casualty Compensation HealthServices Insurance Pool Association Insurance 2013 2012
ASSETSCurrent assets:Equity in pooled cash and investments 44,716$ 232 2,440 5,075 29,408 81,871 93,685 Investments ‐ ‐ 1,960 20,177 ‐ 22,137 18,833 Accounts receivable, net 147 ‐ 1 95 2,615 2,858 2,897 Due from other governmental units 4 ‐ ‐ ‐ ‐ 4 2 Due from other funds ‐ ‐ ‐ ‐ ‐ ‐ 186 Inventory 281 ‐ ‐ ‐ ‐ 281 272 Prepaids 358 ‐ 101 7 8 474 413 Total current assets 45,506 232 4,502 25,354 32,031 107,625 116,288
Non‐current assets:Restricted investments ‐ ‐ 500 750 ‐ 1,250 1,250 Capital assets:Land and construction in progress 21,955 ‐ ‐ ‐ ‐ 21,955 5,992 Buildings and other capital assets, net of depreciation 6,279 ‐ ‐ ‐ ‐ 6,279 5,669 Total non‐current assets 28,234 ‐ 500 750 ‐ 29,484 12,911
Total assets 73,740 232 5,002 26,104 32,031 137,109 129,199
LIABILITIESCurrent liabilities:Accounts payable 2,233 ‐ 27 89 146 2,495 2,134 Wages and benefits payable 156 ‐ ‐ ‐ 1 157 140 Unpaid losses, related liabilities and IBNR ‐ 178 386 1,671 3,300 5,535 5,063 Due to component units ‐ ‐ ‐ ‐ ‐ ‐ 25 Unearned revenue ‐ ‐ ‐ ‐ 2,786 2,786 2,586 Current portion of surplus distribution payable ‐ ‐ 446 235 ‐ 681 340 Compensated absences 66 ‐ ‐ ‐ ‐ 66 46 Total current liabilities 2,455 178 859 1,995 6,233 11,720 10,334
Non‐current liabilities:Unpaid losses, related liabilities and IBNR ‐ ‐ 242 13,076 ‐ 13,318 12,314 OPEB Obligation ‐ ‐ ‐ ‐ 4,613 4,613 ‐ Surplus distribution payable ‐ ‐ 1,492 2,402 ‐ 3,894 804 Compensated absences 1,216 ‐ ‐ ‐ 2 1,218 961 Total non‐current liabilities 1,216 ‐ 1,734 15,478 4,615 23,043 14,079
Total liabilities 3,671 178 2,593 17,473 10,848 34,763 24,413
NET POSITIONNet investment in capital assets 28,234 ‐ ‐ ‐ ‐ 28,234 11,661 Restricted for self‐insurance funds ‐ ‐ 500 2,283 ‐ 2,783 2,848 Unrestricted 41,835 54 1,909 6,348 21,183 71,329 90,277 Total net position 70,069$ 54 2,409 8,631 21,183 102,346 104,786
Totals
141
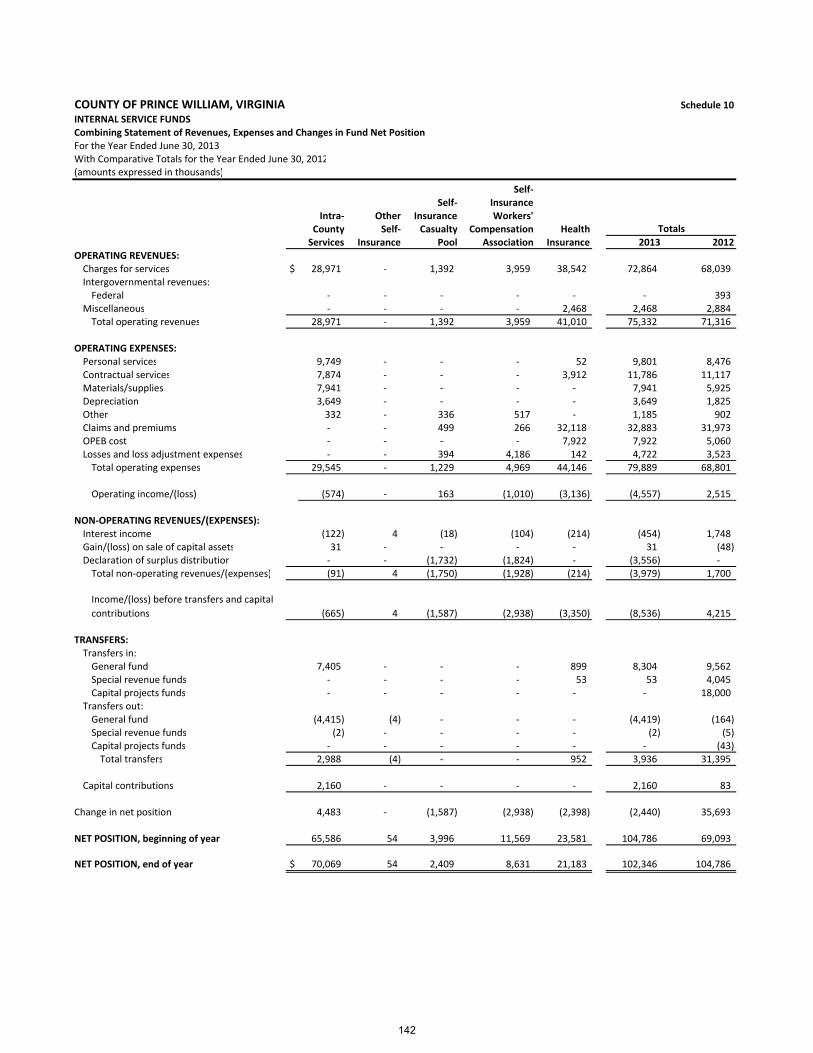
COUNTY OF PRINCE WILLIAM, VIRGINIA Schedule 10
INTERNAL SERVICE FUNDSCombining Statement of Revenues, Expenses and Changes in Fund Net PositionFor the Year Ended June 30, 2013With Comparative Totals for the Year Ended June 30, 2012(amounts expressed in thousands)
Self‐Self‐ Insurance
Intra‐ Other Insurance Workers'County Self‐ Casualty Compensation HealthServices Insurance Pool Association Insurance 2013 2012
OPERATING REVENUES:Charges for services $ 28,971 ‐ 1,392 3,959 38,542 72,864 68,039 Intergovernmental revenues:Federal ‐ ‐ ‐ ‐ ‐ ‐ 393
Miscellaneous ‐ ‐ ‐ ‐ 2,468 2,468 2,884 Total operating revenues 28,971 ‐ 1,392 3,959 41,010 75,332 71,316
OPERATING EXPENSES:Personal services 9,749 ‐ ‐ ‐ 52 9,801 8,476 Contractual services 7,874 ‐ ‐ ‐ 3,912 11,786 11,117 Materials/supplies 7,941 ‐ ‐ ‐ ‐ 7,941 5,925 Depreciation 3,649 ‐ ‐ ‐ ‐ 3,649 1,825 Other 332 ‐ 336 517 ‐ 1,185 902 Claims and premiums ‐ ‐ 499 266 32,118 32,883 31,973 OPEB cost ‐ ‐ ‐ ‐ 7,922 7,922 5,060 Losses and loss adjustment expenses ‐ ‐ 394 4,186 142 4,722 3,523 Total operating expenses 29,545 ‐ 1,229 4,969 44,146 79,889 68,801
Operating income/(loss) (574) ‐ 163 (1,010) (3,136) (4,557) 2,515
NON‐OPERATING REVENUES/(EXPENSES):Interest income (122) 4 (18) (104) (214) (454) 1,748 Gain/(loss) on sale of capital assets 31 ‐ ‐ ‐ ‐ 31 (48) Declaration of surplus distribution ‐ ‐ (1,732) (1,824) ‐ (3,556) ‐ Total non‐operating revenues/(expenses) (91) 4 (1,750) (1,928) (214) (3,979) 1,700
Income/(loss) before transfers and capital
contributions (665) 4 (1,587) (2,938) (3,350) (8,536) 4,215
TRANSFERS:Transfers in:General fund 7,405 ‐ ‐ ‐ 899 8,304 9,562 Special revenue funds ‐ ‐ ‐ ‐ 53 53 4,045 Capital projects funds ‐ ‐ ‐ ‐ ‐ ‐ 18,000
Transfers out:General fund (4,415) (4) ‐ ‐ ‐ (4,419) (164) Special revenue funds (2) ‐ ‐ ‐ ‐ (2) (5) Capital projects funds ‐ ‐ ‐ ‐ ‐ ‐ (43) Total transfers 2,988 (4) ‐ ‐ 952 3,936 31,395
Capital contributions 2,160 ‐ ‐ ‐ ‐ 2,160 83
Change in net position 4,483 ‐ (1,587) (2,938) (2,398) (2,440) 35,693
NET POSITION, beginning of year 65,586 54 3,996 11,569 23,581 104,786 69,093
NET POSITION, end of year $ 70,069 54 2,409 8,631 21,183 102,346 104,786
Totals
142

COUNTY OF PRINCE WILLIAM, VIRGINIA Schedule 11
INTERNAL SERVICE FUNDS Page 1 of 2Combining Statement of Cash FlowsFor the Year Ended June 30, 2013(amounts expressed in thousands)
Self‐Self‐ Insurance
Intra‐ Other Insurance Workers'County Self‐ Casualty Compensation HealthServices Insurance Pool Association Insurance Totals
CASH FLOWS FROM OPERATING ACTIVITIES:Cash received from County agencies $ 28,927 ‐ 1,392 4,078 24,703 59,100 Cash received from employees ‐ ‐ ‐ ‐ 11,965 11,965 Cash received from other entities 57 ‐ ‐ 66 2,132 2,255 Payments for claims and premiums ‐ (18) (1,021) (3,194) (32,505) (36,738) Payments to suppliers for goods and services (15,574) ‐ (311) (446) (4,519) (20,850) Payments to employees for services (9,456) ‐ ‐ ‐ (51) (9,507) Net cash provided (used) by operating activities 3,954 (18) 60 504 1,725 6,225
CASH FLOWS FROM NON‐CAPITAL FINANCING ACTIVITIES:Surplus distributions paid ‐ ‐ (36) (88) ‐ (124) Transfers in 7,405 ‐ ‐ ‐ 952 8,357 Transfers out (4,417) (4) ‐ ‐ ‐ (4,421) Net cash provided (used) by non‐capital financing activities 2,988 (4) (36) (88) 952 3,812
CASH FLOWS FROM CAPITAL AND RELATED FINANCING ACTIVITIES:Acquisition of capital assets (20,283) ‐ ‐ ‐ ‐ (20,283) Proceeds from the sale of capital assets 2,252 ‐ ‐ ‐ ‐ 2,252 Net cash provided (used) by capital and related financing activities (18,031) ‐ ‐ ‐ ‐ (18,031)
CASH FLOWS FROM INVESTING ACTIVITIES:Proceeds from maturities of investments ‐ ‐ 1,600 15,550 ‐ 17,150 Purchases of investments ‐ ‐ (1,600) (19,214) ‐ (20,814) Interest and dividends received on investments (123) 4 26 167 (230) (156)
Net cash provided (used) by investing activities (123) 4 26 (3,497) (230) (3,820)
Net increase (decrease) in cash and cash equivalents (11,212) (18) 50 (3,081) 2,447 (11,814)
CASH AND CASH EQUIVALENTS, beginning of year 55,928 250 2,390 8,156 26,961 93,685
CASH AND CASH EQUIVALENTS, end of year $ 44,716 232 2,440 5,075 29,408 81,871
143

COUNTY OF PRINCE WILLIAM, VIRGINIA Schedule 11
INTERNAL SERVICE FUNDS Page 2 of 2Combining Statement of Cash FlowsFor the Year Ended June 30, 2013(amounts expressed in thousands)
Self‐Self‐ Insurance
Intra‐ Other Insurance Workers'County Self‐ Casualty Compensation HealthServices Insurance Pool Association Insurance Totals
RECONCILIATION OF OPERATING INCOME/(LOSS) TO NET CASH PROVIDED(USED) BY OPERATING ACTIVITIES:
Operating income/(loss) $ (574) ‐ 163 (1,010) (3,136) (4,557)
Adjustments to reconcile operating income/(loss) to net cash provided (used)by operating activities:Depreciation 3,649 ‐ ‐ ‐ ‐ 3,649 Change in assets and liabilities:(Increase) decrease in:Accounts receivable, net of accrued interest 15 ‐ ‐ 67 45 127 Due from other governmental units (2) ‐ ‐ ‐ ‐ (2) Due from other funds ‐ ‐ ‐ 161 ‐ 161 Inventory (10) ‐ ‐ ‐ ‐ (10) Prepaid items (358) ‐ (96) ‐ 393 (61)
Increase (decrease) in:Accounts payable and accrued liabilities, net of accrued interest 1,234 (18) (22) (9) (390) 795 Unpaid losses and related expenses ‐ ‐ 15 1,337 4,613 5,965 Unearned revenue ‐ ‐ ‐ ‐ 200 200 Due to related parties ‐ ‐ ‐ (42) ‐ (42)
Total adjustments 4,528 (18) (103) 1,514 4,861 10,782
Net cash provided (used) by operating activities $ 3,954 (18) 60 504 1,725 6,225
NON‐CASH CAPITAL AND FINANCING ACTIVITIES:
Capital contributions $ 2,160 ‐ ‐ ‐ ‐ 2,160
Total non‐cash capital and financing activities $ 2,160 ‐ ‐ ‐ ‐ 2,160
144

145

Fiduciary & Agency Funds
Fiduciary funds are used to report assets held in a trustee or agency capacity for others which cannot be used to support the County’s programs. The County uses fiduciary funds to report the financial activities related to Other Post‐Employment Benefits (OPEB) obligations and the related assets held to fund those obligations, as well as for trust arrangements with private organizations.
Agency funds are used to account for assets held by the County as an agent for individuals, private organizations, other governments, and/or other funds.
Agency Funds are custodial in nature (assets equal liabilities) and do not involve measurement of results of operations. The Special Welfare Fund, the Community Service Board Payees Fund and the Housing FSS Recipients Fund are used to account for receipts and disbursements of monies for certain County welfare, mental health services and Federal Self‐Sufficiency (FSS) program recipients.
146
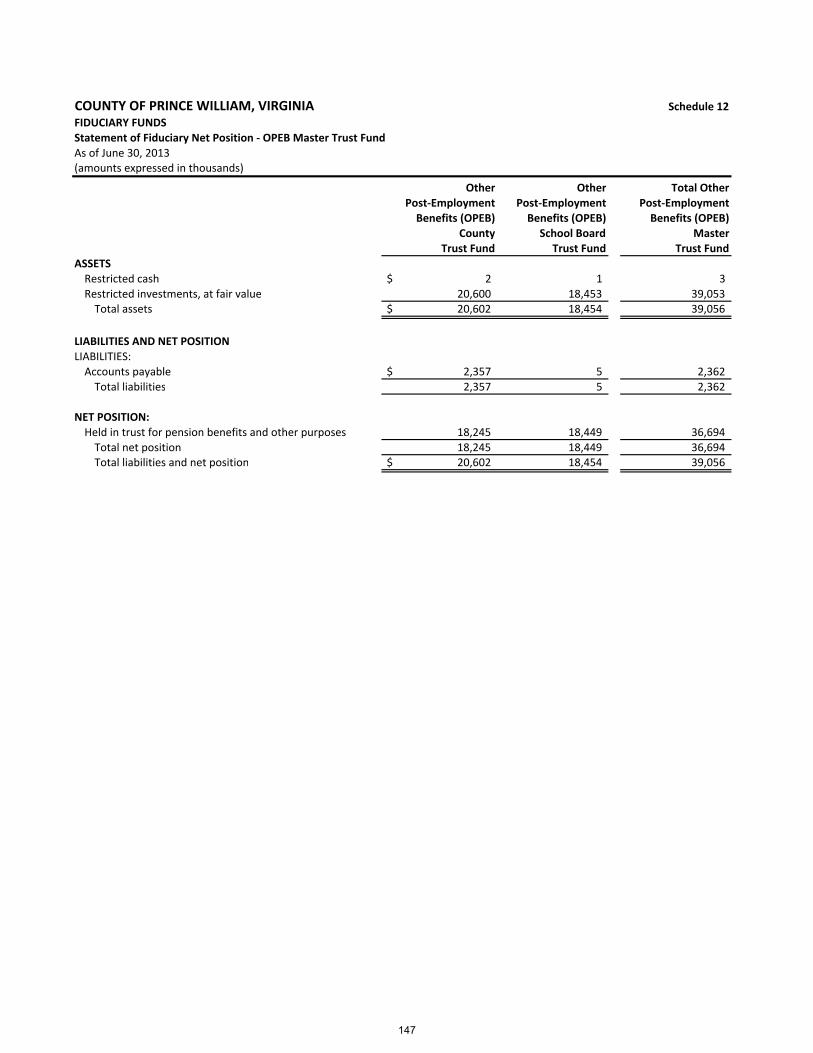
COUNTY OF PRINCE WILLIAM, VIRGINIA Schedule 12
FIDUCIARY FUNDS
Statement of Fiduciary Net Position ‐ OPEB Master Trust Fund
As of June 30, 2013(amounts expressed in thousands)
Other Other Total Other
Post‐Employment Post‐Employment Post‐Employment
Benefits (OPEB) Benefits (OPEB) Benefits (OPEB)
County School Board Master
Trust Fund Trust Fund Trust Fund
ASSETS
Restricted cash $ 2 1 3
Restricted investments, at fair value 20,600 18,453 39,053 Total assets $ 20,602 18,454 39,056
LIABILITIES AND NET POSITION
LIABILITIES:Accounts payable $ 2,357 5 2,362 Total liabilities 2,357 5 2,362
NET POSITION:Held in trust for pension benefits and other purposes 18,245 18,449 36,694 Total net position 18,245 18,449 36,694 Total liabilities and net position $ 20,602 18,454 39,056
147

COUNTY OF PRINCE WILLIAM, VIRGINIA Schedule 13
FIDUCIARY FUNDS
Statement of Changes in Fiduciary Net Position ‐ OPEB Master Trust Fund
For the Year Ended June 30, 2013(amounts expressed in thousands)
Other Other Total Other
Post‐Employment Post‐Employment Post‐Employment
Benefits (OPEB) Benefits (OPEB) Benefits (OPEB)
County School Board Master
Trust Fund Trust Fund Trust Fund
ADDITIONS
Contributions ‐ employer $ 4,154 3,816 7,970
Investment Income:
Interest and dividends 900 657 1,557
Net Appreciation/(depreciation) in fair value of investments 463 376 839
Total investment income 1,363 1,033 2,396 Less investment expense 53 42 95 Net investment income 1,310 991 2,301
Total additions 5,464 4,807 10,271
DEDUCTIONSOther Post‐Employment Benefit payments 2,351 ‐ 2,351 Administrative Expenses 1 25 26
Total deductions 2,352 25 2,377
Change in net position 3,112 4,782 7,894
NET POSITION, beginning of year (as restated) 15,133 13,667 28,800
NET POSITION, end of year $ 18,245 18,449 36,694
148

COUNTY OF PRINCE WILLIAM, VIRGINIA Schedule 14
FIDUCIARY FUNDS
Statement of Fiduciary Net Position ‐ Private Purpose Trust Funds
As of June 30, 2013
(amounts expressed in thousands)
Innovation Historic
Owners' Preservation Library
Association Foundation Donations Total
ASSETS
Equity in pooled cash and investments $ 363 37 336 736
Accounts receivable, net 72 ‐ 1 73
Prepaid items 47 ‐ ‐ 47
Total assets 482 37 337 856
LIABILITIES
Accounts payable 1 ‐ 10 11
Total liabilities 1 ‐ 10 11
NET POSITION
Held in trust for other purposes 481 37 327 845
Total net position $ 481 37 327 845
Private Purpose Trust Funds
149
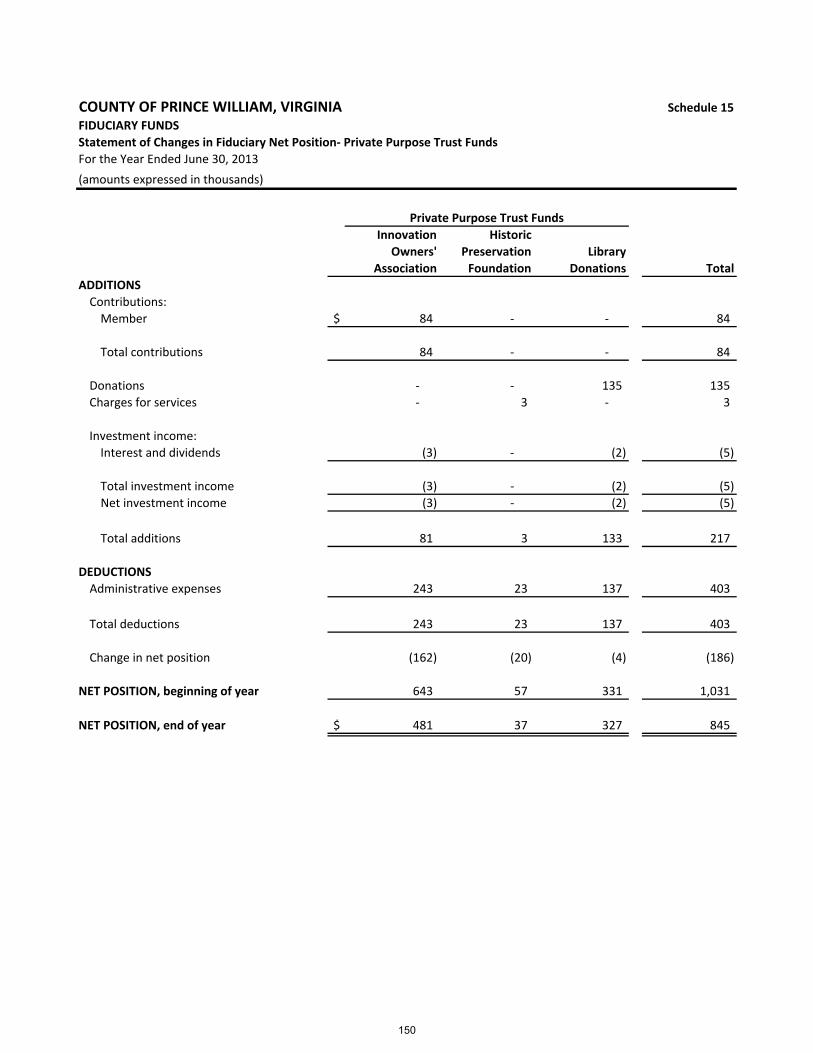
COUNTY OF PRINCE WILLIAM, VIRGINIA Schedule 15
FIDUCIARY FUNDS
Statement of Changes in Fiduciary Net Position‐ Private Purpose Trust Funds
For the Year Ended June 30, 2013
(amounts expressed in thousands)
Innovation Historic
Owners' Preservation Library
Association Foundation Donations Total
ADDITIONS
Contributions:
Member $ 84 ‐ ‐ 84
Total contributions 84 ‐ ‐ 84
Donations ‐ ‐ 135 135
Charges for services ‐ 3 ‐ 3
Investment income:
Interest and dividends (3) ‐ (2) (5)
Total investment income (3) ‐ (2) (5)
Net investment income (3) ‐ (2) (5)
Total additions 81 3 133 217
DEDUCTIONS
Administrative expenses 243 23 137 403
Total deductions 243 23 137 403
Change in net position (162) (20) (4) (186)
NET POSITION, beginning of year 643 57 331 1,031
NET POSITION, end of year $ 481 37 327 845
Private Purpose Trust Funds
150
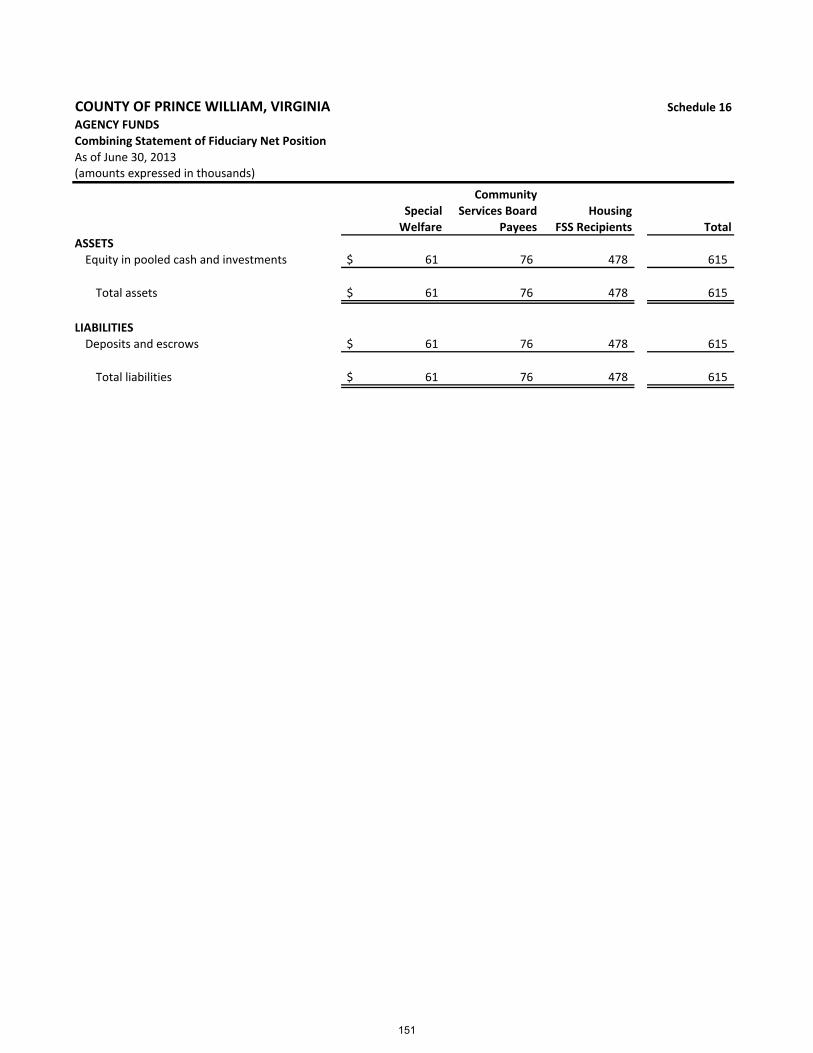
COUNTY OF PRINCE WILLIAM, VIRGINIA Schedule 16
AGENCY FUNDS
Combining Statement of Fiduciary Net Position
As of June 30, 2013(amounts expressed in thousands)
Community
Special Services Board Housing
Welfare Payees FSS Recipients Total
ASSETS
Equity in pooled cash and investments $ 61 76 478 615
Total assets $ 61 76 478 615
LIABILITIES
Deposits and escrows $ 61 76 478 615
Total liabilities $ 61 76 478 615
151
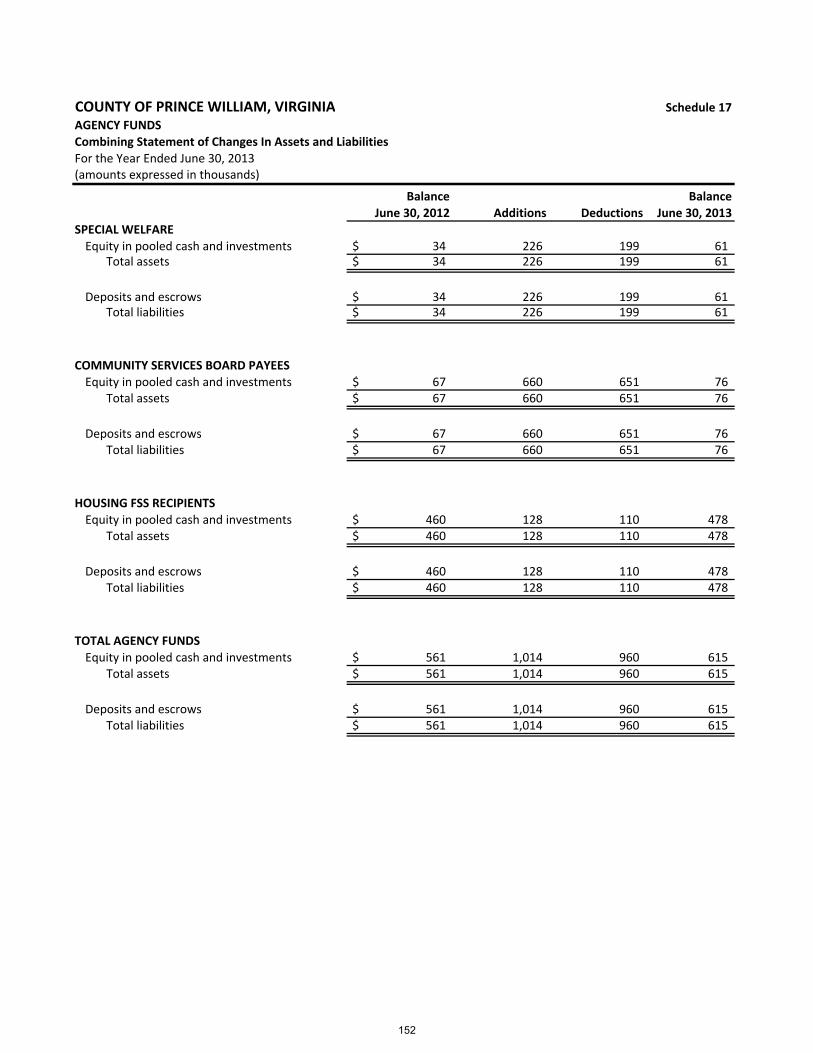
COUNTY OF PRINCE WILLIAM, VIRGINIA Schedule 17
AGENCY FUNDS
Combining Statement of Changes In Assets and Liabilities
For the Year Ended June 30, 2013(amounts expressed in thousands)
Balance Balance
June 30, 2012 Additions Deductions June 30, 2013
SPECIAL WELFARE
Equity in pooled cash and investments $ 34 226 199 61 Total assets $ 34 226 199 61
Deposits and escrows $ 34 226 199 61 Total liabilities $ 34 226 199 61
COMMUNITY SERVICES BOARD PAYEES
Equity in pooled cash and investments $ 67 660 651 76 Total assets $ 67 660 651 76
Deposits and escrows $ 67 660 651 76 Total liabilities $ 67 660 651 76
HOUSING FSS RECIPIENTS
Equity in pooled cash and investments $ 460 128 110 478 Total assets $ 460 128 110 478
Deposits and escrows $ 460 128 110 478 Total liabilities $ 460 128 110 478
TOTAL AGENCY FUNDS
Equity in pooled cash and investments $ 561 1,014 960 615 Total assets $ 561 1,014 960 615
Deposits and escrows $ 561 1,014 960 615 Total liabilities $ 561 1,014 960 615
152
DISCRETELY PRESENTED
COMPONENT UNITS
Adult Detention Center
The Adult Detention Center derives revenues from the County and charges
for services. The Adult Detention Center statement includes revenues and expenditures for the general operation and capital projects of the Adult Detention Center.
153
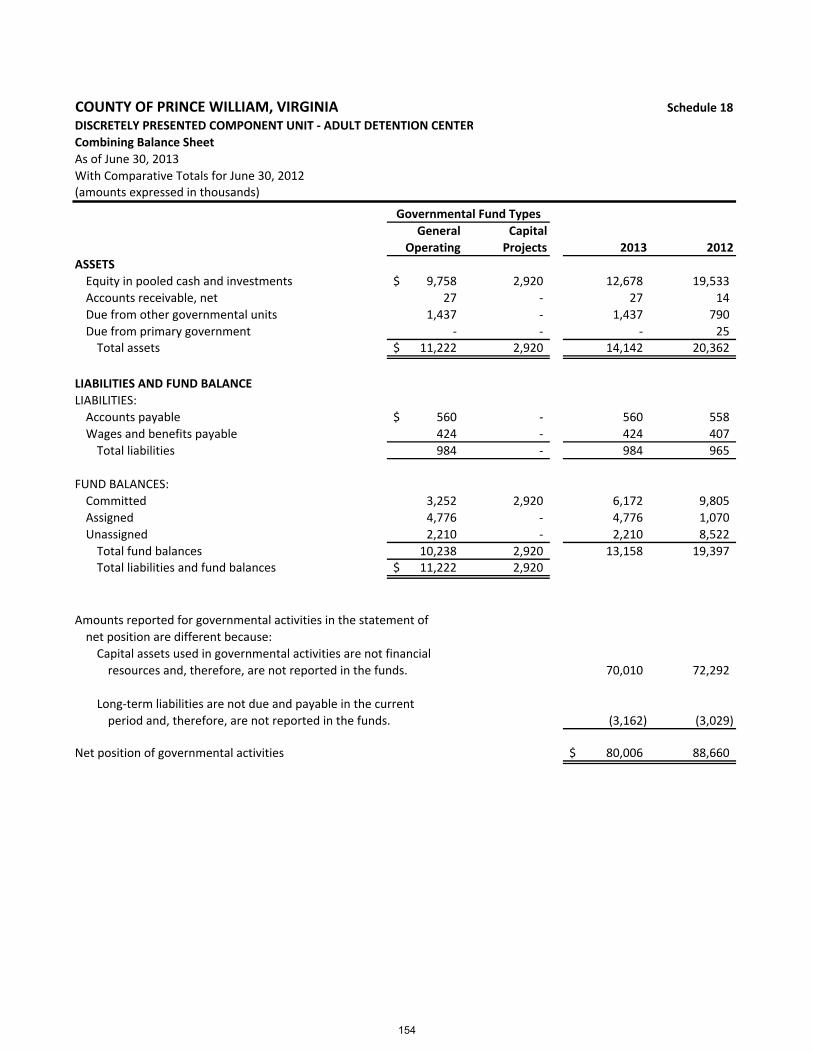
COUNTY OF PRINCE WILLIAM, VIRGINIA Schedule 18
DISCRETELY PRESENTED COMPONENT UNIT ‐ ADULT DETENTION CENTER
Combining Balance Sheet
As of June 30, 2013
With Comparative Totals for June 30, 2012(amounts expressed in thousands)
General Capital
Operating Projects 2013 2012
ASSETS
Equity in pooled cash and investments 9,758$ 2,920 12,678 19,533
Accounts receivable, net 27 ‐ 27 14
Due from other governmental units 1,437 ‐ 1,437 790
Due from primary government ‐ ‐ ‐ 25 Total assets 11,222$ 2,920 14,142 20,362
LIABILITIES AND FUND BALANCE
LIABILITIES:
Accounts payable 560$ ‐ 560 558
Wages and benefits payable 424 ‐ 424 407
Total liabilities 984 ‐ 984 965
FUND BALANCES:
Committed 3,252 2,920 6,172 9,805
Assigned 4,776 ‐ 4,776 1,070
Unassigned 2,210 ‐ 2,210 8,522
Total fund balances 10,238 2,920 13,158 19,397 Total liabilities and fund balances 11,222$ 2,920
Amounts reported for governmental activities in the statement of
net position are different because:
Capital assets used in governmental activities are not financial
resources and, therefore, are not reported in the funds. 70,010 72,292
Long‐term liabilities are not due and payable in the current
period and, therefore, are not reported in the funds. (3,162) (3,029)
Net position of governmental activities 80,006$ 88,660
Governmental Fund Types
154

COUNTY OF PRINCE WILLIAM, VIRGINIA Schedule 19
DISCRETELY PRESENTED COMPONENT UNIT ‐ ADULT DETENTION CENTER
Combining Statement of Revenues, Expenditures and Changes in Fund Balances
For the Year Ended June 30, 2013
With Comparative Totals for the Year Ended June 30, 2012(amounts expressed in thousands)
General Capital
Operating Projects 2013 2012
REVENUES:
From use of money and property $ 171 ‐ 171 221
Charges for services 505 ‐ 505 473
Intergovernmental revenues:
Federal 560 ‐ 560 651
State 9,772 ‐ 9,772 9,539
Local 26,265 ‐ 26,265 25,061
Miscellaneous 103 ‐ 103 92
Total revenues 37,376 ‐ 37,376 36,037
EXPENDITURES:
Public safety 38,585 5,041 43,626 37,427
Capital projects ‐ ‐ ‐ 16
Total expenditures 38,585 5,041 43,626 37,443
Excess (deficiency) of revenues over (under) expenditures (1,209) (5,041) (6,250) (1,406)
OTHER FINANCING SOURCES (USES):
Transfers in ‐ 40 40 40
Transfers out (40) ‐ (40) (40)
Sale of surplus property 11 ‐ 11 ‐
Total other financing sources (uses) (29) 40 11 ‐
Net change in fund balances (1,238) (5,001) (6,239) (1,406)
FUND BALANCES, beginning of year 11,476 7,921
FUND BALANCES, end of year $ 10,238 2,920
Governmental funds report capital outlays as expenditures while
governmental activities report depreciation expense to allocate
those expenditures over the life of the assets.
Add capital acquisitions 11 186
Subtract depreciation expense (2,293) (2,352)
Subtract net book value of assets removed from service ‐ (8)
Some expenses reported in the statement of activities do not require the use
of current financial resources and therefore are not reported as expenditures in
governmental funds.
Add prior year's compensated absences liability 3,029 2,927
Subtract current year's compensated absences liability (3,162) (3,029)
Change in Adult Detention Center net position $ (8,654) (3,682)
Total
Governmental Fund Types
155
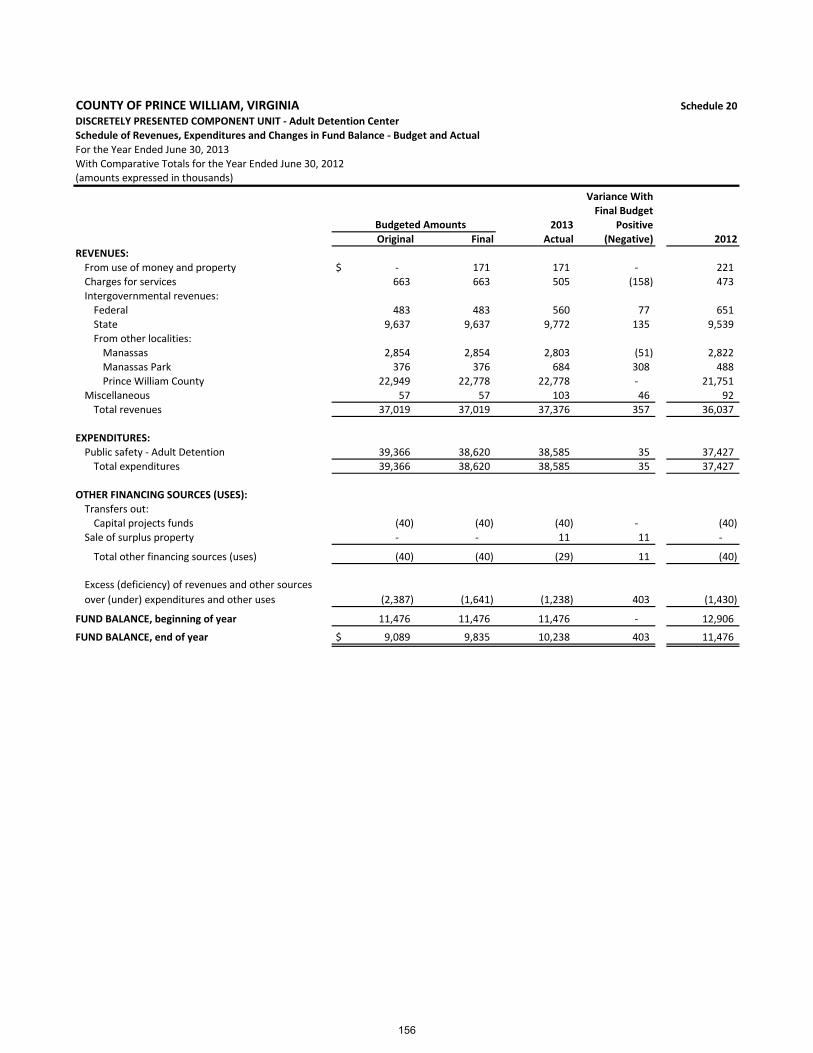
COUNTY OF PRINCE WILLIAM, VIRGINIA Schedule 20
DISCRETELY PRESENTED COMPONENT UNIT ‐ Adult Detention Center
Schedule of Revenues, Expenditures and Changes in Fund Balance ‐ Budget and Actual
For the Year Ended June 30, 2013
With Comparative Totals for the Year Ended June 30, 2012(amounts expressed in thousands)
Variance With
Final Budget
2013 Positive
Original Final Actual (Negative) 2012
REVENUES:
From use of money and property $ ‐ 171 171 ‐ 221
Charges for services 663 663 505 (158) 473
Intergovernmental revenues:
Federal 483 483 560 77 651
State 9,637 9,637 9,772 135 9,539
From other localities:
Manassas 2,854 2,854 2,803 (51) 2,822
Manassas Park 376 376 684 308 488
Prince William County 22,949 22,778 22,778 ‐ 21,751
Miscellaneous 57 57 103 46 92
Total revenues 37,019 37,019 37,376 357 36,037
EXPENDITURES:
Public safety ‐ Adult Detention 39,366 38,620 38,585 35 37,427
Total expenditures 39,366 38,620 38,585 35 37,427
OTHER FINANCING SOURCES (USES):
Transfers out:
Capital projects funds (40) (40) (40) ‐ (40)
Sale of surplus property ‐ ‐ 11 11 ‐
Total other financing sources (uses) (40) (40) (29) 11 (40)
Excess (deficiency) of revenues and other sources
over (under) expenditures and other uses (2,387) (1,641) (1,238) 403 (1,430)
FUND BALANCE, beginning of year 11,476 11,476 11,476 ‐ 12,906
FUND BALANCE, end of year $ 9,089 9,835 10,238 403 11,476
Budgeted Amounts
156

DEBT OBLIGATIONS
The schedules of bonds, capital leases, and other long‐term debt detail the
maturity dates and variable interest rates of the governmental funds’ and enterprise funds’ general obligation bonds, revenue bonds, notes payable, capital leases, school bonds, and state literary funds.
157

COUNTY OF PRINCE WILLIAM, VIRGINIA
GOVERNMENTAL FUNDS
Schedule 21
Page 1 of 6
Schedule of Bonds, Capital Lease Obligations and Other Long‐Term Debt
As of June 30, 2013
(amounts expressed in thousands)
Adult
General Detention School Total
County Road Center Park Board Outstanding Interest
Date Related Related Related Related Related (Not Matured) Rate
Description Authorized Issued Issued Debt Debt Debt Debt Debt at June 30, 2013 (%) Amount Fiscal Year
General Obligation Bonds:
Parks and Recreation 5,080$ 5,080 15‐Apr‐03 ‐‐ ‐‐ ‐‐ 255 ‐‐ 255 4.00 255 2014
1998 Referendum: 34,305 12,510 15‐Apr‐03 ‐‐ 625 ‐‐ ‐‐ ‐‐ 625 4.00 625 2014
10,350 8‐Jun‐04 ‐‐ 1,040 ‐‐ ‐‐ ‐‐ 1,040 5.00 520 2014
5.25 520 2015
11,445 9‐Nov‐04 ‐‐ 1,144 ‐‐ ‐‐ ‐‐ 1,144 5.00 573 2014
5.00 571 2015
1998 Referendum Total 34,305$ 34,305 ‐‐ 2,809 ‐‐ ‐‐ ‐‐ 2,809
2002 Referendum: 86,700$ 3,000 15‐Apr‐03 ‐‐ 150 ‐‐ ‐‐ ‐‐ 150 4.00 150 2014
10,000 8‐Jun‐04 ‐‐ 1,000 ‐‐ ‐‐ ‐‐ 1,000 5.00 500 2014
5.25 500 2015
26,555 9‐Nov‐04 ‐‐ 2,661 ‐‐ ‐‐ ‐‐ 2,661 5.00 1,332 2014
5.00 1,329 2015
22,085 12‐Jun‐07 ‐‐ 3,318 ‐‐ ‐‐ ‐‐ 3,318 5.00 1,106 2014 thru 2016
15,755 6‐Aug‐08 ‐‐ 4,729 ‐‐ ‐‐ ‐‐ 4,729 3.38 788 2014
3.50 789 2015
3.75 788 2016 thru 2017
4.00 788 2018 thru 2019
4,955 29‐Jul‐10 ‐‐ 3,853 ‐‐ ‐‐ ‐‐ 3,853 1.20 551 2014
3.00 551 2015
4.00 551 2016
3.00 550 2017 thru 2018
5.00 550 2019
3.00 550 2020
2002 Referendum Total 86,700$ 82,350 ‐‐ 15,711 ‐‐ ‐‐ ‐‐ 15,711
2006 Referendum: 369,550$ 10,370 12‐Jun‐07 ‐‐ 1,557 ‐‐ ‐‐ ‐‐ 1,557 5.00 519 2014 thru 2016
31,175 6‐Aug‐08 ‐‐ 8,051 ‐‐ 1,320 ‐‐ 9,371 3.38 1,561 2014
3.50 1,562 2015
3.75 1,562 2016 thru 2017
4.00 1,562 2018 thru 2019
3,775 29‐Jul‐10 ‐‐ 2,937 ‐‐ ‐‐ ‐‐ 2,937 1.20 419 2014
3.00 419 2015
4.00 419 2016
3.00 420 2017 thru 2018
5.00 420 2019
3.00 420 2020
Taxable ‐ Local Build America 10,670 29‐Jul‐10 ‐‐ 10,670 ‐‐ ‐‐ ‐‐ 10,670 3.68 1,000 2021
Bonds 4.28 960 2022
4.28 965 2023 thru 2026
5.31 970 2027 thru 2031
2006 Referendum Total 369,550$ 55,990 ‐‐ 23,215 ‐‐ 1,320 ‐‐ 24,535
School Bonds 13,150$ 13,150 5‐May‐94 ‐‐ ‐‐ ‐‐ ‐‐ 675 675 6.30 675 2014
25,760 25,760 1‐May‐95 ‐‐ ‐‐ ‐‐ ‐‐ 3,855 3,855 5.90 1,285 2014
5.98 1,285 2015 thru 2016
19,900 19,900 1‐Apr‐97 ‐‐ ‐‐ ‐‐ ‐‐ 4,975 4,975 5.60 995 2014 thru 2018
Total Outstanding at June 30, 2013
Maturing Annually
158
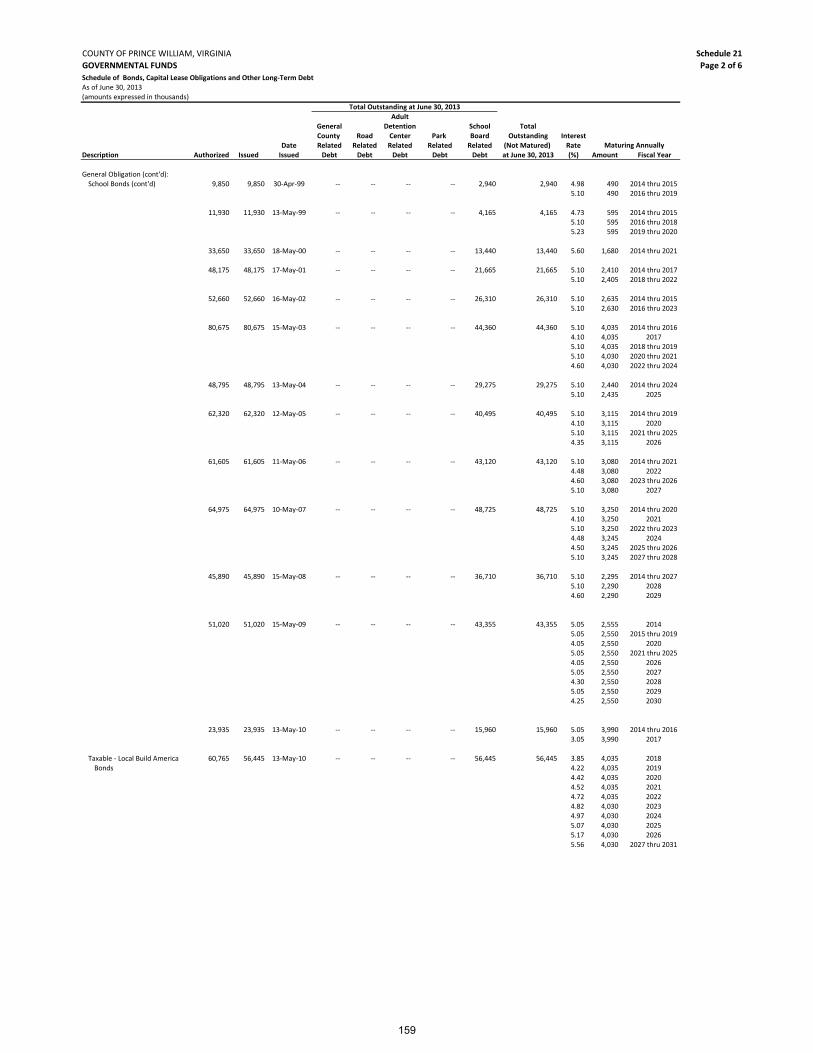
COUNTY OF PRINCE WILLIAM, VIRGINIA
GOVERNMENTAL FUNDS
Schedule 21
Page 2 of 6
Schedule of Bonds, Capital Lease Obligations and Other Long‐Term Debt
As of June 30, 2013
(amounts expressed in thousands)
Adult
General Detention School Total
County Road Center Park Board Outstanding Interest
Date Related Related Related Related Related (Not Matured) Rate
Description Authorized Issued Issued Debt Debt Debt Debt Debt at June 30, 2013 (%) Amount Fiscal Year
Total Outstanding at June 30, 2013
Maturing Annually
General Obligation (cont'd):
School Bonds (cont'd) 9,850 9,850 30‐Apr‐99 ‐‐ ‐‐ ‐‐ ‐‐ 2,940 2,940 4.98 490 2014 thru 2015
5.10 490 2016 thru 2019
11,930 11,930 13‐May‐99 ‐‐ ‐‐ ‐‐ ‐‐ 4,165 4,165 4.73 595 2014 thru 2015
5.10 595 2016 thru 2018
5.23 595 2019 thru 2020
33,650 33,650 18‐May‐00 ‐‐ ‐‐ ‐‐ ‐‐ 13,440 13,440 5.60 1,680 2014 thru 2021
48,175 48,175 17‐May‐01 ‐‐ ‐‐ ‐‐ ‐‐ 21,665 21,665 5.10 2,410 2014 thru 2017
5.10 2,405 2018 thru 2022
52,660 52,660 16‐May‐02 ‐‐ ‐‐ ‐‐ ‐‐ 26,310 26,310 5.10 2,635 2014 thru 2015
5.10 2,630 2016 thru 2023
80,675 80,675 15‐May‐03 ‐‐ ‐‐ ‐‐ ‐‐ 44,360 44,360 5.10 4,035 2014 thru 2016
4.10 4,035 2017
5.10 4,035 2018 thru 2019
5.10 4,030 2020 thru 2021
4.60 4,030 2022 thru 2024
48,795 48,795 13‐May‐04 ‐‐ ‐‐ ‐‐ ‐‐ 29,275 29,275 5.10 2,440 2014 thru 2024
5.10 2,435 2025
62,320 62,320 12‐May‐05 ‐‐ ‐‐ ‐‐ ‐‐ 40,495 40,495 5.10 3,115 2014 thru 2019
4.10 3,115 2020
5.10 3,115 2021 thru 2025
4.35 3,115 2026
61,605 61,605 11‐May‐06 ‐‐ ‐‐ ‐‐ ‐‐ 43,120 43,120 5.10 3,080 2014 thru 2021
4.48 3,080 2022
4.60 3,080 2023 thru 2026
5.10 3,080 2027
64,975 64,975 10‐May‐07 ‐‐ ‐‐ ‐‐ ‐‐ 48,725 48,725 5.10 3,250 2014 thru 2020
4.10 3,250 2021
5.10 3,250 2022 thru 2023
4.48 3,245 2024
4.50 3,245 2025 thru 2026
5.10 3,245 2027 thru 2028
45,890 45,890 15‐May‐08 ‐‐ ‐‐ ‐‐ ‐‐ 36,710 36,710 5.10 2,295 2014 thru 2027
5.10 2,290 2028
4.60 2,290 2029
51,020 51,020 15‐May‐09 ‐‐ ‐‐ ‐‐ ‐‐ 43,355 43,355 5.05 2,555 2014
5.05 2,550 2015 thru 2019
4.05 2,550 2020
5.05 2,550 2021 thru 2025
4.05 2,550 2026
5.05 2,550 2027
4.30 2,550 20285.05 2,550 2029
4.25 2,550 2030
23,935 23,935 13‐May‐10 ‐‐ ‐‐ ‐‐ ‐‐ 15,960 15,960 5.05 3,990 2014 thru 20163.05 3,990 2017
Taxable ‐ Local Build America 60,765 56,445 13‐May‐10 ‐‐ ‐‐ ‐‐ ‐‐ 56,445 56,445 3.85 4,035 2018 Bonds 4.22 4,035 2019
4.42 4,035 2020
4.52 4,035 2021
4.72 4,035 2022
4.82 4,030 20234.97 4,030 2024
5.07 4,030 2025
5.17 4,030 20265.56 4,030 2027 thru 2031
159
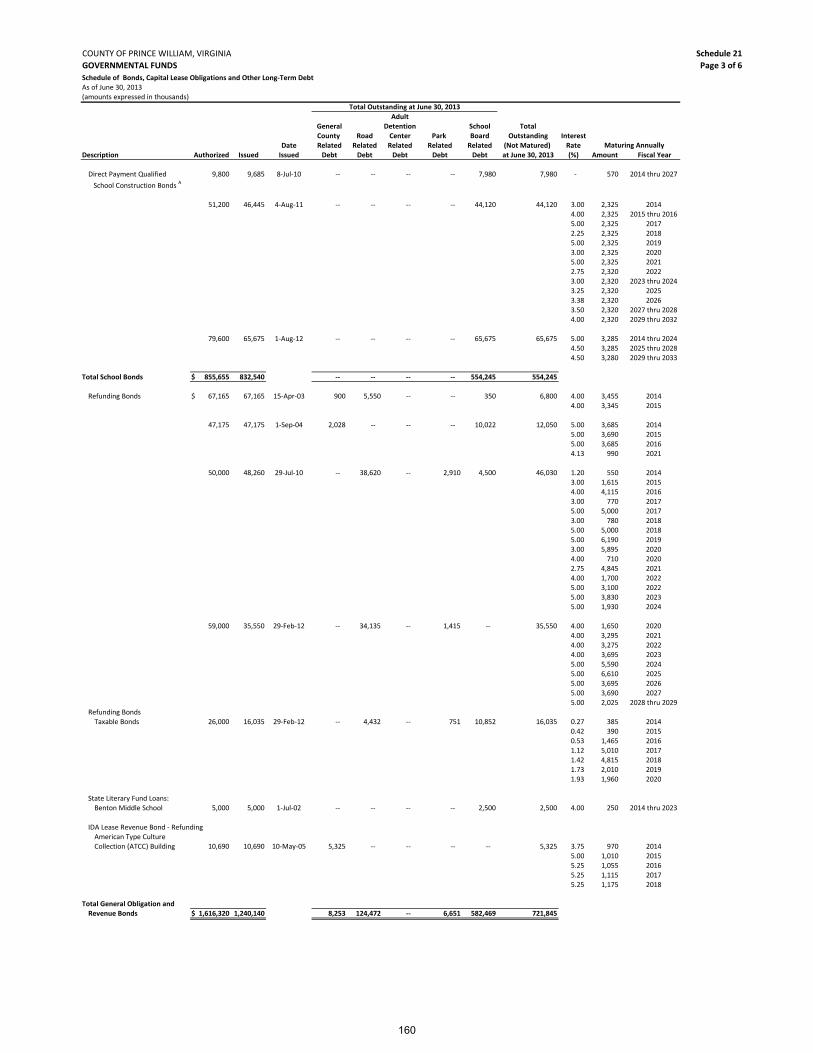
COUNTY OF PRINCE WILLIAM, VIRGINIA
GOVERNMENTAL FUNDS
Schedule 21
Page 3 of 6
Schedule of Bonds, Capital Lease Obligations and Other Long‐Term Debt
As of June 30, 2013
(amounts expressed in thousands)
Adult
General Detention School Total
County Road Center Park Board Outstanding Interest
Date Related Related Related Related Related (Not Matured) Rate
Description Authorized Issued Issued Debt Debt Debt Debt Debt at June 30, 2013 (%) Amount Fiscal Year
Total Outstanding at June 30, 2013
Maturing Annually
Direct Payment Qualified 9,800 9,685 8‐Jul‐10 ‐‐ ‐‐ ‐‐ ‐‐ 7,980 7,980 ‐ 570 2014 thru 2027
School Construction Bonds A
51,200 46,445 4‐Aug‐11 ‐‐ ‐‐ ‐‐ ‐‐ 44,120 44,120 3.00 2,325 2014
4.00 2,325 2015 thru 2016
5.00 2,325 2017
2.25 2,325 2018
5.00 2,325 2019
3.00 2,325 2020
5.00 2,325 2021
2.75 2,320 2022
3.00 2,320 2023 thru 2024
3.25 2,320 2025
3.38 2,320 2026
3.50 2,320 2027 thru 2028
4.00 2,320 2029 thru 2032
79,600 65,675 1‐Aug‐12 ‐‐ ‐‐ ‐‐ ‐‐ 65,675 65,675 5.00 3,285 2014 thru 2024
4.50 3,285 2025 thru 2028
4.50 3,280 2029 thru 2033
Total School Bonds 855,655$ 832,540 ‐‐ ‐‐ ‐‐ ‐‐ 554,245 554,245
Refunding Bonds 67,165$ 67,165 15‐Apr‐03 900 5,550 ‐‐ ‐‐ 350 6,800 4.00 3,455 2014
4.00 3,345 2015
47,175 47,175 1‐Sep‐04 2,028 ‐‐ ‐‐ ‐‐ 10,022 12,050 5.00 3,685 2014
5.00 3,690 2015
5.00 3,685 2016
4.13 990 2021
50,000 48,260 29‐Jul‐10 ‐‐ 38,620 ‐‐ 2,910 4,500 46,030 1.20 550 2014
3.00 1,615 2015
4.00 4,115 2016
3.00 770 2017
5.00 5,000 2017
3.00 780 2018
5.00 5,000 2018
5.00 6,190 2019
3.00 5,895 2020
4.00 710 2020
2.75 4,845 2021
4.00 1,700 2022
5.00 3,100 2022
5.00 3,830 2023
5.00 1,930 2024
59,000 35,550 29‐Feb‐12 ‐‐ 34,135 ‐‐ 1,415 ‐‐ 35,550 4.00 1,650 2020
4.00 3,295 2021
4.00 3,275 2022
4.00 3,695 2023
5.00 5,590 2024
5.00 6,610 2025
5.00 3,695 2026
5.00 3,690 2027
5.00 2,025 2028 thru 2029
Refunding Bonds
Taxable Bonds 26,000 16,035 29‐Feb‐12 ‐‐ 4,432 ‐‐ 751 10,852 16,035 0.27 385 20140.42 390 2015
0.53 1,465 2016
1.12 5,010 20171.42 4,815 2018
1.73 2,010 2019
1.93 1,960 2020
State Literary Fund Loans:Benton Middle School 5,000 5,000 1‐Jul‐02 ‐‐ ‐‐ ‐‐ ‐‐ 2,500 2,500 4.00 250 2014 thru 2023
IDA Lease Revenue Bond ‐ RefundingAmerican Type Culture
Collection (ATCC) Building 10,690 10,690 10‐May‐05 5,325 ‐‐ ‐‐ ‐‐ ‐‐ 5,325 3.75 970 2014
5.00 1,010 2015
5.25 1,055 20165.25 1,115 2017
5.25 1,175 2018
Total General Obligation and Revenue Bonds 1,616,320$ 1,240,140 8,253 124,472 ‐‐ 6,651 582,469 721,845
160
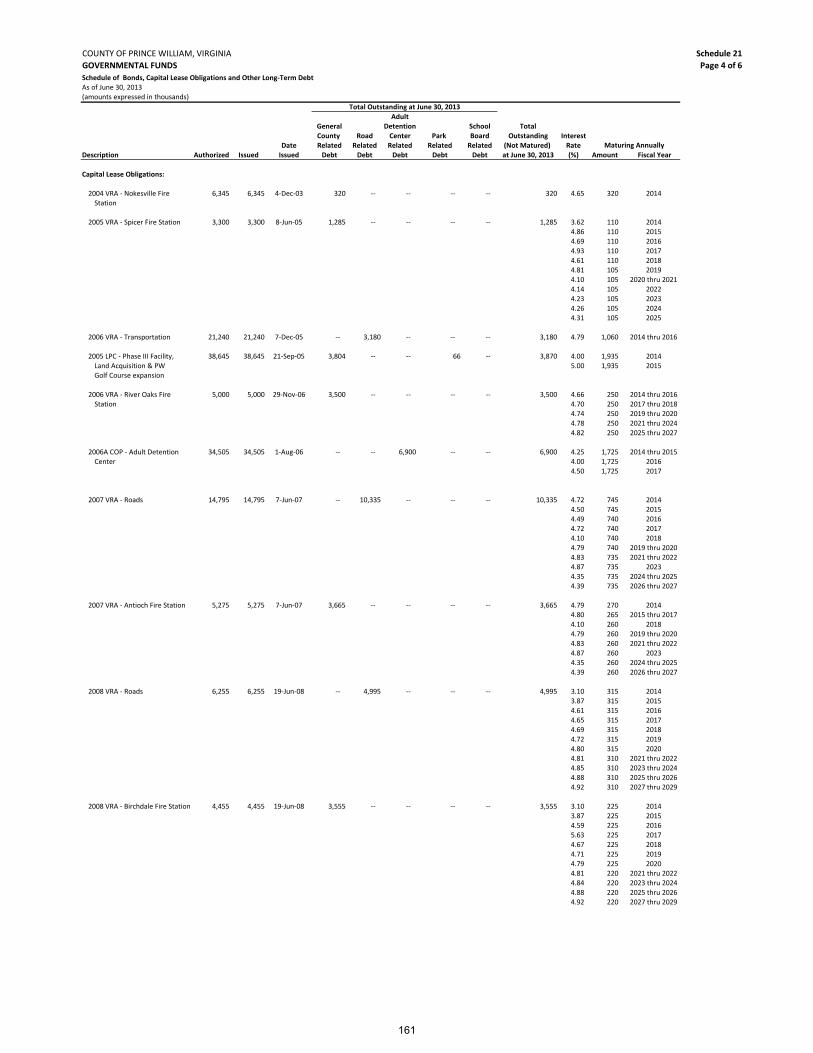
COUNTY OF PRINCE WILLIAM, VIRGINIA
GOVERNMENTAL FUNDS
Schedule 21
Page 4 of 6
Schedule of Bonds, Capital Lease Obligations and Other Long‐Term Debt
As of June 30, 2013
(amounts expressed in thousands)
Adult
General Detention School Total
County Road Center Park Board Outstanding Interest
Date Related Related Related Related Related (Not Matured) Rate
Description Authorized Issued Issued Debt Debt Debt Debt Debt at June 30, 2013 (%) Amount Fiscal Year
Total Outstanding at June 30, 2013
Maturing Annually
Capital Lease Obligations:
2004 VRA ‐ Nokesville Fire 6,345 6,345 4‐Dec‐03 320 ‐‐ ‐‐ ‐‐ ‐‐ 320 4.65 320 2014
Station
2005 VRA ‐ Spicer Fire Station 3,300 3,300 8‐Jun‐05 1,285 ‐‐ ‐‐ ‐‐ ‐‐ 1,285 3.62 110 2014
4.86 110 2015
4.69 110 2016
4.93 110 2017
4.61 110 2018
4.81 105 2019
4.10 105 2020 thru 2021
4.14 105 2022
4.23 105 2023
4.26 105 2024
4.31 105 2025
2006 VRA ‐ Transportation 21,240 21,240 7‐Dec‐05 ‐‐ 3,180 ‐‐ ‐‐ ‐‐ 3,180 4.79 1,060 2014 thru 2016
2005 LPC ‐ Phase III Facility, 38,645 38,645 21‐Sep‐05 3,804 ‐‐ ‐‐ 66 ‐‐ 3,870 4.00 1,935 2014
Land Acquisition & PW 5.00 1,935 2015
Golf Course expansion
2006 VRA ‐ River Oaks Fire 5,000 5,000 29‐Nov‐06 3,500 ‐‐ ‐‐ ‐‐ ‐‐ 3,500 4.66 250 2014 thru 2016
Station 4.70 250 2017 thru 2018
4.74 250 2019 thru 2020
4.78 250 2021 thru 2024
4.82 250 2025 thru 2027
2006A COP ‐ Adult Detention 34,505 34,505 1‐Aug‐06 ‐‐ ‐‐ 6,900 ‐‐ ‐‐ 6,900 4.25 1,725 2014 thru 2015
Center 4.00 1,725 2016
4.50 1,725 2017
2007 VRA ‐ Roads 14,795 14,795 7‐Jun‐07 ‐‐ 10,335 ‐‐ ‐‐ ‐‐ 10,335 4.72 745 2014
4.50 745 2015
4.49 740 2016
4.72 740 2017
4.10 740 2018
4.79 740 2019 thru 2020
4.83 735 2021 thru 2022
4.87 735 2023
4.35 735 2024 thru 2025
4.39 735 2026 thru 2027
2007 VRA ‐ Antioch Fire Station 5,275 5,275 7‐Jun‐07 3,665 ‐‐ ‐‐ ‐‐ ‐‐ 3,665 4.79 270 2014
4.80 265 2015 thru 2017
4.10 260 2018
4.79 260 2019 thru 2020
4.83 260 2021 thru 2022
4.87 260 2023
4.35 260 2024 thru 2025
4.39 260 2026 thru 2027
2008 VRA ‐ Roads 6,255 6,255 19‐Jun‐08 ‐‐ 4,995 ‐‐ ‐‐ ‐‐ 4,995 3.10 315 20143.87 315 2015
4.61 315 2016
4.65 315 2017
4.69 315 2018
4.72 315 20194.80 315 2020
4.81 310 2021 thru 2022
4.85 310 2023 thru 20244.88 310 2025 thru 2026
4.92 310 2027 thru 2029
2008 VRA ‐ Birchdale Fire Station 4,455 4,455 19‐Jun‐08 3,555 ‐‐ ‐‐ ‐‐ ‐‐ 3,555 3.10 225 2014 3.87 225 2015
4.59 225 2016
5.63 225 20174.67 225 2018
4.71 225 2019
4.79 225 2020
4.81 220 2021 thru 2022
4.84 220 2023 thru 20244.88 220 2025 thru 2026
4.92 220 2027 thru 2029
161
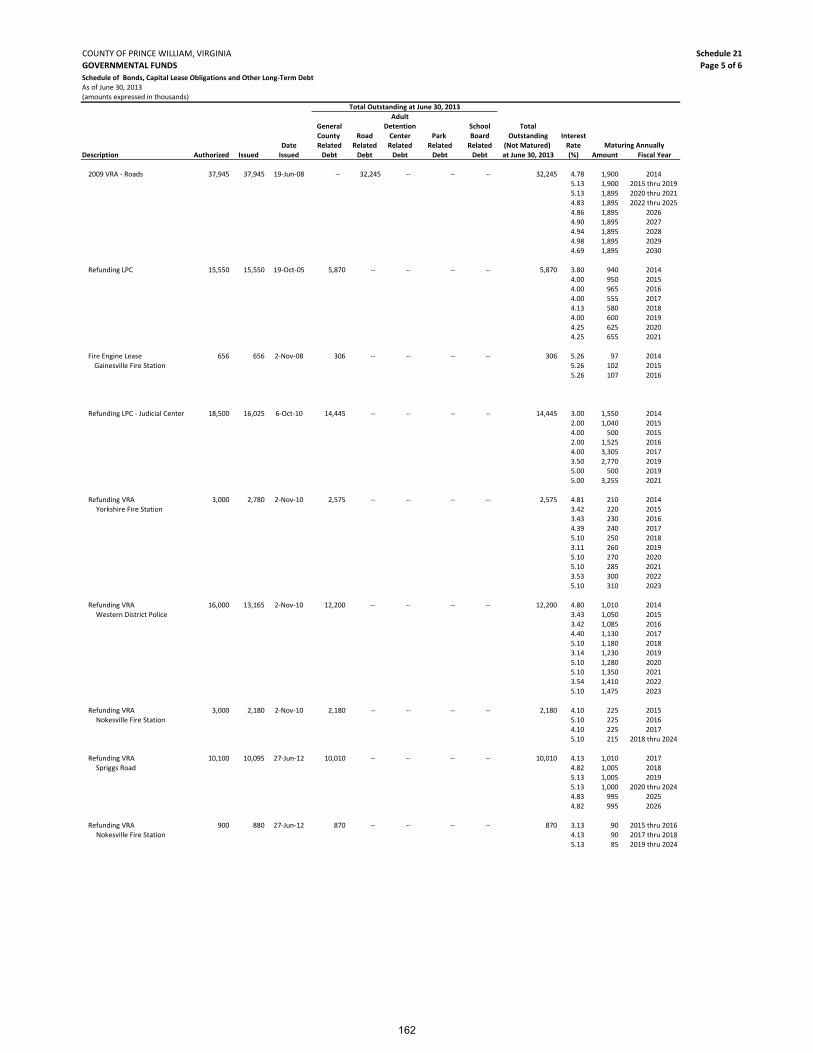
COUNTY OF PRINCE WILLIAM, VIRGINIA
GOVERNMENTAL FUNDS
Schedule 21
Page 5 of 6
Schedule of Bonds, Capital Lease Obligations and Other Long‐Term Debt
As of June 30, 2013
(amounts expressed in thousands)
Adult
General Detention School Total
County Road Center Park Board Outstanding Interest
Date Related Related Related Related Related (Not Matured) Rate
Description Authorized Issued Issued Debt Debt Debt Debt Debt at June 30, 2013 (%) Amount Fiscal Year
Total Outstanding at June 30, 2013
Maturing Annually
2009 VRA ‐ Roads 37,945 37,945 19‐Jun‐08 ‐‐ 32,245 ‐‐ ‐‐ ‐‐ 32,245 4.78 1,900 2014
5.13 1,900 2015 thru 2019
5.13 1,895 2020 thru 2021
4.83 1,895 2022 thru 2025
4.86 1,895 2026
4.90 1,895 2027
4.94 1,895 2028
4.98 1,895 2029
4.69 1,895 2030
Refunding LPC 15,550 15,550 19‐Oct‐05 5,870 ‐‐ ‐‐ ‐‐ ‐‐ 5,870 3.80 940 2014
4.00 950 2015
4.00 965 2016
4.00 555 2017
4.13 580 2018
4.00 600 2019
4.25 625 2020
4.25 655 2021
Fire Engine Lease 656 656 2‐Nov‐08 306 ‐‐ ‐‐ ‐‐ ‐‐ 306 5.26 97 2014
Gainesville Fire Station 5.26 102 2015
5.26 107 2016
Refunding LPC ‐ Judicial Center 18,500 16,025 6‐Oct‐10 14,445 ‐‐ ‐‐ ‐‐ ‐‐ 14,445 3.00 1,550 2014
2.00 1,040 2015
4.00 500 2015
2.00 1,525 2016
4.00 3,305 2017
3.50 2,770 2019
5.00 500 2019
5.00 3,255 2021
Refunding VRA 3,000 2,780 2‐Nov‐10 2,575 ‐‐ ‐‐ ‐‐ ‐‐ 2,575 4.81 210 2014
Yorkshire Fire Station 3.42 220 2015
3.43 230 2016
4.39 240 2017
5.10 250 2018
3.11 260 2019
5.10 270 2020
5.10 285 2021
3.53 300 2022
5.10 310 2023
Refunding VRA 16,000 13,165 2‐Nov‐10 12,200 ‐‐ ‐‐ ‐‐ ‐‐ 12,200 4.80 1,010 2014
Western District Police 3.43 1,050 2015
3.42 1,085 2016
4.40 1,130 2017
5.10 1,180 2018
3.14 1,230 2019
5.10 1,280 2020
5.10 1,350 2021
3.54 1,410 2022
5.10 1,475 2023
Refunding VRA 3,000 2,180 2‐Nov‐10 2,180 ‐‐ ‐‐ ‐‐ ‐‐ 2,180 4.10 225 2015
Nokesville Fire Station 5.10 225 2016
4.10 225 2017
5.10 215 2018 thru 2024
Refunding VRA 10,100 10,095 27‐Jun‐12 10,010 ‐‐ ‐‐ ‐‐ ‐‐ 10,010 4.13 1,010 2017
Spriggs Road 4.82 1,005 2018
5.13 1,005 20195.13 1,000 2020 thru 2024
4.83 995 2025
4.82 995 2026
Refunding VRA 900 880 27‐Jun‐12 870 ‐‐ ‐‐ ‐‐ ‐‐ 870 3.13 90 2015 thru 2016 Nokesville Fire Station 4.13 90 2017 thru 2018
5.13 85 2019 thru 2024
162

COUNTY OF PRINCE WILLIAM, VIRGINIA
GOVERNMENTAL FUNDS
Schedule 21
Page 6 of 6
Schedule of Bonds, Capital Lease Obligations and Other Long‐Term Debt
As of June 30, 2013
(amounts expressed in thousands)
Adult
General Detention School Total
County Road Center Park Board Outstanding Interest
Date Related Related Related Related Related (Not Matured) Rate
Description Authorized Issued Issued Debt Debt Debt Debt Debt at June 30, 2013 (%) Amount Fiscal Year
Total Outstanding at June 30, 2013
Maturing Annually
Refunding COP 50,000 35,205 26‐Mar‐13 18,381 ‐‐ 16,505 319 ‐‐ 35,205 3.00 1,960 2016
3.00 1,925 2017
4.00 3,615 2018
4.00 3,575 2019
4.00 3,535 2020
5.00 3,510 2021
5.00 3,500 2022
5.00 3,495 2023
5.00 3,500 2024
5.00 3,510 2025
5.00 1,540 2026 thru 2027
Equipment Lease ‐ Parks and 1,309 1,309 21‐Dec‐07 ‐‐ ‐‐ ‐‐ 406 ‐‐ 406 3.34 200 2014
Recreation 3.34 206 2015
1,048 1,048 14‐Jul‐11 ‐‐ ‐‐ ‐‐ 744 ‐‐ 744 1.87 208 2014
1.87 212 2015
1.87 215 2016
1.87 109 2017
Total Capital Lease Obligations 297,823$ 276,653 82,966 50,755 23,405 1,535 ‐‐ 158,661
Total General Obligation,
Capital Leases and Other
Long‐Term Debt 1,914,143$ 1,516,793 91,219 175,227 23,405 8,186 582,469 880,506
A ‐ Qualified School Construction Bonds (QSCB) are authorized by the federal government through the American Recovery and Reinvestment Act (ARRA) of 2009. The bonds provide
reimbursement of interest paid by a credit from the US Treasury via VPSA.
163

COUNTY OF PRINCE WILLIAM, VIRGINIA
PROPRIETARY FUNDS
Schedule 22
Schedule of Bonds, Capital Lease Obligations and Other Long‐Term Debt
As of June 30, 2013
(amounts expressed in thousands)
Total
Outstanding Interest
Date Parks & (Not Matured) Rate
Description Authorized Issued Issued Landfill Recreation at June 30, 2013 (%) Amount Fiscal Year
Revenue Bonds:
Refunding Bonds 14,500$ 12,240 16‐Feb‐05 1,590 ‐‐ 1,590 3.52 1,590 2014
19,000 13,285 14‐Apr‐10 ‐‐ 11,690 11,690 4.00 555 2014
2.50 580 2015
3.00 590 2016
4.00 610 2017
4.00 630 2018
4.00 650 2019
4.00 680 2020
3.50 715 2021
3.75 730 2022
3.88 760 2023
4.00 790 2024
4.00 815 2025
4.00 850 2026
4.00 880 2027
4.00 910 2028
4.13 945 2029
Total Revenue Bonds 33,500$ 25,525 1,590 11,690 13,280
Capital Lease Obligations:
Equipment Leases 691$ 691 21‐Dec‐07 ‐‐ 214 214 3.34 105 2014
3.34 109 2015
Equipment Leases 952 952 14‐Jul‐11 ‐‐ 675 675 1.87 188 2014
1.87 192 2015
1.87 196 2016
1.87 99 2017
Total Capital Lease Obligations 1,643$ 1,643 ‐‐ 889 889
Total Capital Leases and Other Long‐Term Debt 35,143$ 27,168 1,590 12,579 14,169
Total Outstanding at June 30, 2013
Maturing Annually
164

STATISTICAL SECTION
This part of Prince William County’s Comprehensive Annual Financial Report
presents detailed information as a context for understanding what the information in the financial statements, note disclosures, and required supplementary information says about the County’s overall financial health.
Unless otherwise noted, the information in these schedules is derived from
the Comprehensive Annual Financial Reports for the relevant year.
Contents Page
Financial Trends 166
These schedules contain trend information to help the reader understand how the County’s financial performance and well‐being have changed over time.
Revenue Capacity 176
These schedules contain information to help the reader assess the County’s most significant local revenue source, the real estate tax, as well as other revenue sources.
Debt Capacity 184
These schedules present information to help the reader assess the affordability of the County’s current levels of outstanding debt and the County’s ability to issue additional debt in the future.
Demographic and Economic Information 191
These schedules offer demographic and economic indicators to help the reader understand the environment within which the County’s financial activities take place.
Operating Information 193
These schedules contain service and infrastructure data to help the reader understand how the information in the County’s financial report relates to the services the County provides and the activities it performs.
Other Statistical Tables 196
These schedules present other information useful to certain readers of the County’s financial statements.
165

COUNTY OF PRINCE WILLIAM, VIRGINIATABLE 1 ‐ Net Position by Component
Last Ten Fiscal Years
(accrual basis of accounting; amounts expressed in thousands)
2004 2005 2006 2007 2008c
Governmental activities:
Net Investment in capital assets $ 157,675 $ 157,297 $ 181,314 $ 176,505 $ 228,235
Restricted 63,091 97,948 80,709 127,372 97,828
Unrestricted (416,662) (448,851) (456,650) (557,515) (572,351)
Total governmental activities net position $ (195,896) $ (193,606) $ (194,627) $ (253,638) $ (246,288)
Business‐type activities:Net Investment in capital assets $ 15,597 $ 16,580 $ 19,534 $ 20,316 $ 21,238 Unrestricted 10,709 10,879 5,246 1,784 6,345
Total business‐type activities net position $ 26,306 $ 27,459 $ 24,780 $ 22,100 $ 27,583
Primary government:Net Investment in capital assets $ 173,272 $ 173,877 $ 200,848 $ 196,821 $ 249,473 Restricted 63,091 97,948 80,709 127,372 97,828 Unrestricted (405,953) (437,972) (451,404) (555,731) (566,006)
Total primary government net position $ (169,590) $ (166,147) $ (169,847) $ (231,538) $ (218,705)
Component units:a
Net Investment in capital assets $ 600,839 $ 673,971 $ 760,726 $ 849,253 $ 959,640 Restricted 99,225 91,563 93,803 150,427 111,676 Unrestricted 34,938 68,448 85,543 105,568 85,760
Total component units net position $ 735,002 $ 833,982 $ 940,072 $ 1,105,248 $ 1,157,076
Total reporting entity:
Net Investment in capital assetsb $ 460,590 $ 492,349 $ 573,997 $ 611,788 $ 728,795
Restrictedb 65,261 100,132 82,914 130,976 98,566 Unrestricted 39,561 75,354 113,314 130,946 111,010
Total reporting entity net position $ 565,412 $ 667,835 $ 770,225 $ 873,710 $ 938,371
a Component unit net position represents a significant portion of net position for the total reporting entity,
b The sum of the rows does not equal the amount reported for the total reporting entity because certain debt related to the School Board, and the Adult Detention Center component units is reflected in the primary government's general governmental activities. See Exhibit 1 for further details.
c The restatement of net position resulting from the implementation of GASB Statement No. 51 was carried
back to 2008. Net position values prior to 2008 do not reflect the capitalization of intangible assets.
d The Park Authority component unit was dissolved and became the County Department of Parks and Recreation effective FY 2013.
The Convention and Visitors Bureau became a component unit of the County effective FY 2013.
166
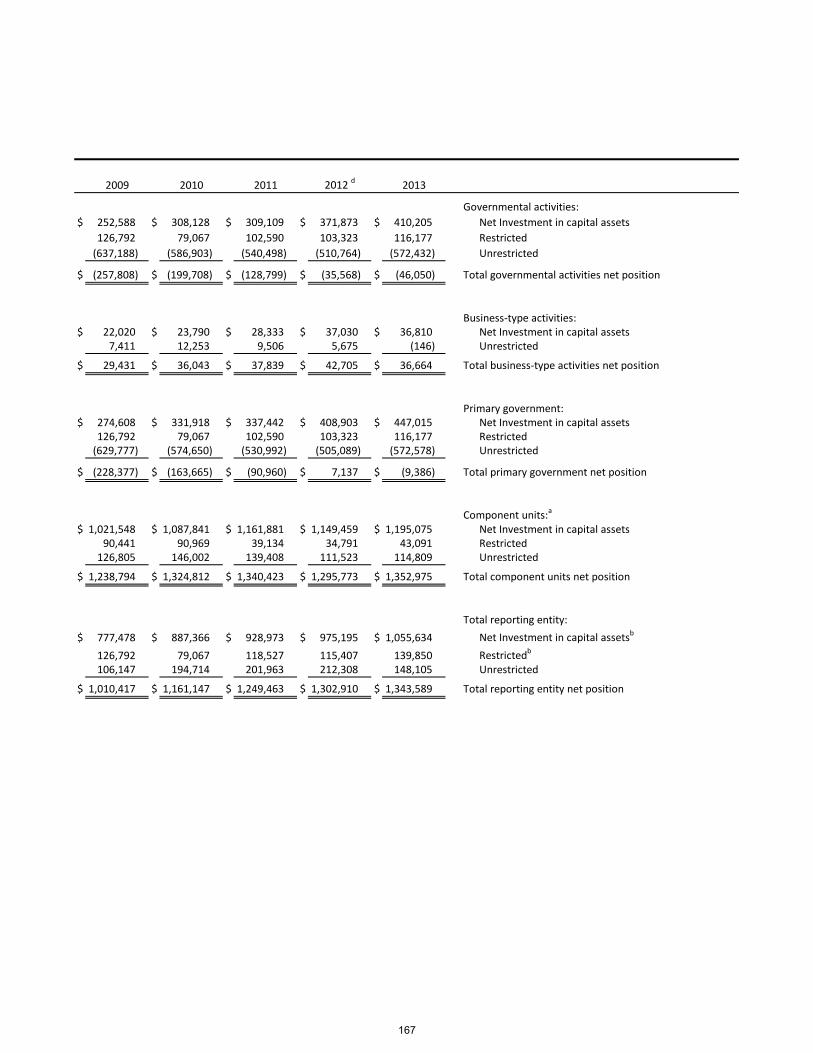
2009 2010 2011 2012 d 2013
Governmental activities:
$ 252,588 $ 308,128 $ 309,109 $ 371,873 $ 410,205 Net Investment in capital assets
126,792 79,067 102,590 103,323 116,177 Restricted
(637,188) (586,903) (540,498) (510,764) (572,432) Unrestricted
$ (257,808) $ (199,708) $ (128,799) $ (35,568) $ (46,050) Total governmental activities net position
Business‐type activities:$ 22,020 $ 23,790 $ 28,333 $ 37,030 $ 36,810 Net Investment in capital assets
7,411 12,253 9,506 5,675 (146) Unrestricted
$ 29,431 $ 36,043 $ 37,839 $ 42,705 $ 36,664 Total business‐type activities net position
Primary government:$ 274,608 $ 331,918 $ 337,442 $ 408,903 $ 447,015 Net Investment in capital assets
126,792 79,067 102,590 103,323 116,177 Restricted(629,777) (574,650) (530,992) (505,089) (572,578) Unrestricted
$ (228,377) $ (163,665) $ (90,960) $ 7,137 $ (9,386) Total primary government net position
Component units:a
$ 1,021,548 $ 1,087,841 $ 1,161,881 $ 1,149,459 $ 1,195,075 Net Investment in capital assets90,441 90,969 39,134 34,791 43,091 Restricted
126,805 146,002 139,408 111,523 114,809 Unrestricted
$ 1,238,794 $ 1,324,812 $ 1,340,423 $ 1,295,773 $ 1,352,975 Total component units net position
Total reporting entity:
$ 777,478 $ 887,366 $ 928,973 $ 975,195 $ 1,055,634 Net Investment in capital assetsb
126,792 79,067 118,527 115,407 139,850 Restrictedb
106,147 194,714 201,963 212,308 148,105 Unrestricted
$ 1,010,417 $ 1,161,147 $ 1,249,463 $ 1,302,910 $ 1,343,589 Total reporting entity net position
167

Page 1 of 2
COUNTY OF PRINCE WILLIAM, VIRGINIATABLE 2 ‐ Changes in Net PositionLast Ten Fiscal Years(accrual basis of accounting; amounts expressed in thousands)
2004 2005 2006 2007 2008 2009 2010 2011 2012 2013Primary Government:ExpensesGovernmental activities:General government administration $ 28,115 $ 33,959 $ 38,146 $ 38,452 $ 40,289 $ 41,470 $ 37,377 $ 45,435 $ 40,151 $ 37,932 Judicial administration 15,518 15,661 17,130 18,097 19,260 19,004 17,471 18,157 18,222 19,524 Public safety 137,522 146,097 176,300 247,862 194,468 210,257 197,928 205,341 215,366 234,880 Public works 32,207 58,200 73,149 90,004 94,042 124,491 54,892 48,819 55,538 72,924 Health and welfare 59,249 63,111 65,580 70,062 75,112 75,163 74,268 76,664 75,217 75,909 Education 310,767 360,258 386,995 413,349 403,396 434,797 440,443 368,236 406,022 463,154 Parks, recreational and cultural 30,277 28,904 31,479 36,114 37,291 35,793 38,347 33,728 54,934 34,077 Community development 47,136 48,079 50,363 45,225 45,474 49,100 49,524 50,227 52,318 53,726 Interest on long‐term debt 27,432 31,923 33,684 40,074 41,526 41,868 44,253 44,095 43,242 43,086
Total governmental activities expenses 688,223 786,192 872,826 999,239 950,858 1,031,943 954,503 890,702 961,010 1,035,212
Business‐type activities:Landfill 11,683 13,919 13,885 14,461 14,955 12,181 10,724 15,804 16,734 15,832 Parks and Recreation ‐‐ ‐‐ ‐‐ ‐‐ ‐‐ ‐‐ ‐‐ ‐‐ 15,927 19,729 Innovation Technology Park 129 877 157 949 209 242 49 48 48 60
Total business‐type activities expenses 11,812 14,796 14,042 15,410 15,164 12,423 10,773 15,852 32,709 35,621
Total primary government expenses $ 700,035 $ 800,988 $ 886,868 $ 1,014,649 $ 966,022 $ 1,044,366 $ 965,276 $ 906,554 $ 993,719 $ 1,070,833
Program RevenuesGovernmental activities:Charges for services:General government administration $ 377 $ 477 $ 513 $ 539 $ 570 $ 678 $ 554 $ 554 $ 597 $ 590 Judicial administration 5,628 6,558 7,213 5,577 4,796 4,695 4,234 4,160 4,548 4,929
Public safety 3,481 4,317 4,630 6,002 6,412 5,783 6,027 6,646 11,105 12,220
Public works 7,274 7,447 6,692 6,851 8,796 4,669 4,958 5,038 5,054 8,248
Health and welfare 1,473 1,666 1,619 1,751 2,000 1,850 1,429 1,287 1,381 1,345
Parks, recreational and cultural 441 590 575 553 517 526 520 562 1,807 548
Community development 17,374 17,527 17,216 11,121 11,624 10,457 9,564 10,461 15,234 18,973
Operating grants and contributions 67,689 68,900 69,496 74,152 76,200 86,411 90,529 88,851 101,066 77,104
Capital grants and contributions 23,364 20,346 26,259 37,673 31,514 40,183 28,271 46,890 37,115 29,758
Total governmental activities program revenues 127,101 127,828 134,213 144,219 142,429 155,252 146,086 164,449 177,907 153,715
Business‐type activities:
Charges for services:
Landfill 12,543 13,305 13,296 14,567 14,948 15,840 16,244 17,696 17,213 17,556
Parks and Recreation ‐‐ ‐‐ ‐‐ ‐‐ ‐‐ ‐‐ ‐‐ ‐‐ 13,228 10,904
Innovation Technology Park 474 3,098 1,416 7,812 2,168 1,373 7 ‐‐ 990 ‐‐
Capital grants and contributions ‐‐ ‐‐ ‐‐ ‐‐ ‐‐ 27 177 66 57 27
Total business‐type activities program revenues 13,017 16,403 14,712 22,379 17,116 17,240 16,428 17,762 31,488 28,487
Total primary government program revenues $ 140,118 $ 144,231 $ 148,925 $ 166,598 $ 159,545 $ 172,492 $ 162,514 $ 182,211 $ 209,395 $ 182,202
Net (Expense)/Revenue
Governmental activities $ (561,122) $ (658,364) $ (738,613) $ (855,020) $ (808,429) $ (876,691) $ (808,417) $ (726,253) $ (783,103) $ (881,497)
Business‐type activities 1,205 1,607 670 6,969 1,952 4,817 5,655 1,910 (1,221) (7,134)
Total primary government net (expense)/revenue $ (559,917) $ (656,757) $ (737,943) $ (848,051) $ (806,477) $ (871,874) $ (802,762) $ (724,343) $ (784,324) $ (888,631)
General Revenues and Other
Changes in Net Position
Governmental activities:
Taxes
Real property $ 340,470 $ 388,216 $ 418,990 $ 461,230 $ 484,368 $ 545,021 $ 509,007 $ 508,761 $ 526,885 $ 551,951
Personal property 51,285 52,625 62,368 75,030 77,509 80,642 67,816 72,641 78,338 85,515
Local sales 40,721 43,857 46,649 47,921 46,155 45,055 46,155 49,554 52,003 55,169
Consumers utility 22,870 25,452 26,295 18,522 12,354 12,596 12,840 13,190 13,075 13,490
Telecommunications sales and use tax ‐‐ ‐‐ ‐‐ 9,533 22,230 20,198 ‐‐ ‐‐ ‐‐ ‐‐
Cable franchise tax 3,262 3,252 3,431 2,021 ‐‐ ‐‐ ‐‐ ‐‐ ‐‐ ‐‐ Business, professional and
occupational license 17,564 19,534 23,071 22,809 21,173 19,931 20,269 20,965 21,725 22,913
Recordation 10,713 19,491 22,741 15,143 11,528 10,669 7,813 7,562 8,014 10,277 Motor vehicle licenses 5,829 6,275 6,641 6,534 6,651 6,874 7,221 7,504 7,591 7,877 Public safety E‐911 3,047 2,957 2,931 1,536 ‐‐ ‐‐ ‐‐ ‐‐ ‐‐ ‐‐
Transient occupancy 2,357 2,793 3,026 3,294 3,389 3,189 3,014 3,169 3,274 3,369 Short term rental, bank stock,
public utility gross receipts 1,764 1,803 2,151 2,044 1,990 2,220 2,661 3,208 3,080 2,973 Grants and contributions not
restricted to specific programs 57,450 59,608 67,359 62,227 62,580 62,765 82,882 82,422 81,503 81,785
Investment earnings 5,232 13,909 20,823 31,484 35,361 26,777 31,700 11,754 20,222 (1,558) Insurance claims and recoveries ‐‐ ‐‐ ‐‐ ‐‐ ‐‐ ‐‐ ‐‐ ‐‐ 66 100
Gain/(loss) on disposition of capital assets ‐‐ ‐‐ ‐‐ ‐‐ (170) ‐‐ ‐‐ ‐‐ ‐‐ ‐‐ Miscellaneous 7,989 18,976 26,291 24,720 24,633 24,357 21,954 14,876 10,348 37,530
Transfers 2,831 1,736 4,825 11,961 (789) 4,877 810 1,556 1,527 (376) Total governmental activities 573,384 660,484 737,592 796,009 808,962 865,171 814,142 797,162 827,651 871,015
168
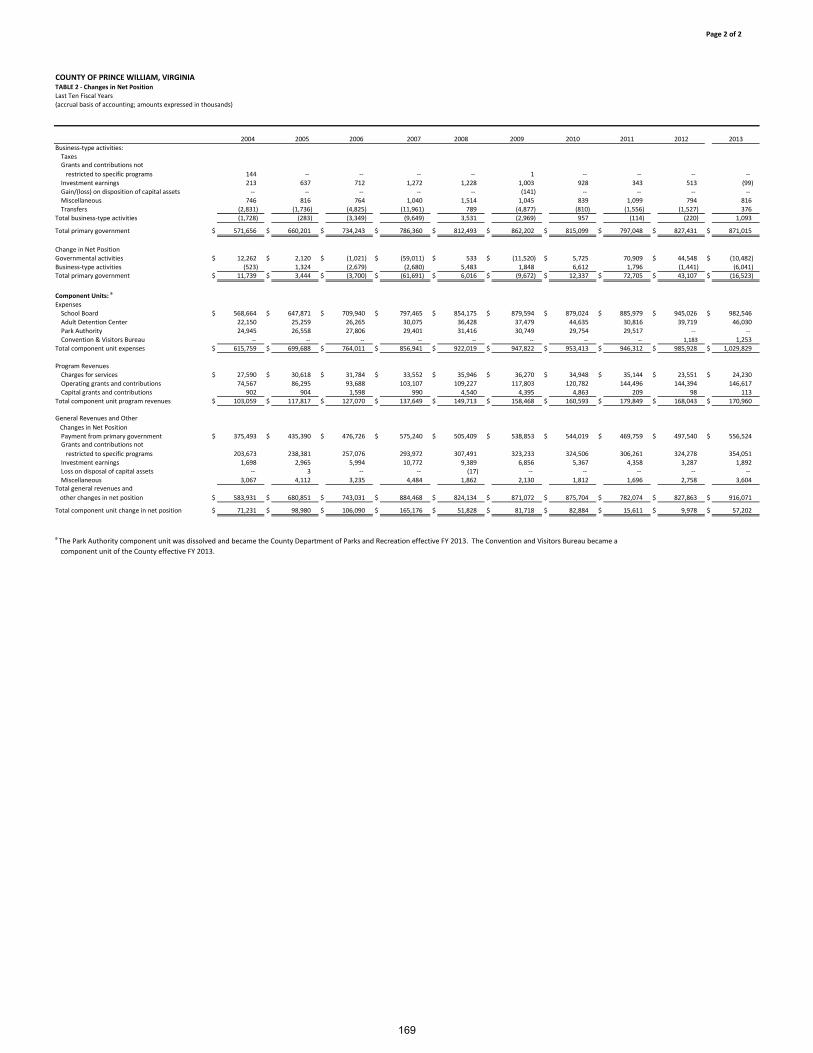
Page 2 of 2
COUNTY OF PRINCE WILLIAM, VIRGINIATABLE 2 ‐ Changes in Net PositionLast Ten Fiscal Years(accrual basis of accounting; amounts expressed in thousands)
2004 2005 2006 2007 2008 2009 2010 2011 2012 2013
Business‐type activities:TaxesGrants and contributions not
restricted to specific programs 144 ‐‐ ‐‐ ‐‐ ‐‐ 1 ‐‐ ‐‐ ‐‐ ‐‐ Investment earnings 213 637 712 1,272 1,228 1,003 928 343 513 (99) Gain/(loss) on disposition of capital assets ‐‐ ‐‐ ‐‐ ‐‐ ‐‐ (141) ‐‐ ‐‐ ‐‐ ‐‐ Miscellaneous 746 816 764 1,040 1,514 1,045 839 1,099 794 816 Transfers (2,831) (1,736) (4,825) (11,961) 789 (4,877) (810) (1,556) (1,527) 376
Total business‐type activities (1,728) (283) (3,349) (9,649) 3,531 (2,969) 957 (114) (220) 1,093
Total primary government $ 571,656 $ 660,201 $ 734,243 $ 786,360 $ 812,493 $ 862,202 $ 815,099 $ 797,048 $ 827,431 $ 871,015
Change in Net PositionGovernmental activities $ 12,262 $ 2,120 $ (1,021) $ (59,011) $ 533 $ (11,520) $ 5,725 70,909 $ 44,548 $ (10,482) Business‐type activities (523) 1,324 (2,679) (2,680) 5,483 1,848 6,612 1,796 (1,441) (6,041) Total primary government $ 11,739 $ 3,444 $ (3,700) $ (61,691) $ 6,016 $ (9,672) $ 12,337 $ 72,705 $ 43,107 $ (16,523)
Component Units: a
ExpensesSchool Board $ 568,664 $ 647,871 $ 709,940 $ 797,465 $ 854,175 $ 879,594 $ 879,024 $ 885,979 $ 945,026 $ 982,546 Adult Detention Center 22,150 25,259 26,265 30,075 36,428 37,479 44,635 30,816 39,719 46,030 Park Authority 24,945 26,558 27,806 29,401 31,416 30,749 29,754 29,517 ‐‐ ‐‐ Convention & Visitors Bureau ‐‐ ‐‐ ‐‐ ‐‐ ‐‐ ‐‐ ‐‐ ‐‐ 1,183 1,253
Total component unit expenses $ 615,759 $ 699,688 $ 764,011 $ 856,941 $ 922,019 $ 947,822 $ 953,413 $ 946,312 $ 985,928 $ 1,029,829
Program Revenues
Charges for services $ 27,590 $ 30,618 $ 31,784 $ 33,552 $ 35,946 $ 36,270 $ 34,948 $ 35,144 $ 23,551 $ 24,230
Operating grants and contributions 74,567 86,295 93,688 103,107 109,227 117,803 120,782 144,496 144,394 146,617
Capital grants and contributions 902 904 1,598 990 4,540 4,395 4,863 209 98 113
Total component unit program revenues $ 103,059 $ 117,817 $ 127,070 $ 137,649 $ 149,713 $ 158,468 $ 160,593 $ 179,849 $ 168,043 $ 170,960
General Revenues and Other
Changes in Net Position
Payment from primary government $ 375,493 $ 435,390 $ 476,726 $ 575,240 $ 505,409 $ 538,853 $ 544,019 $ 469,759 $ 497,540 $ 556,524 Grants and contributions not
restricted to specific programs 203,673 238,381 257,076 293,972 307,491 323,233 324,506 306,261 324,278 354,051
Investment earnings 1,698 2,965 5,994 10,772 9,389 6,856 5,367 4,358 3,287 1,892
Loss on disposal of capital assets ‐‐ 3 ‐‐ ‐‐ (17) ‐‐ ‐‐ ‐‐ ‐‐ ‐‐
Miscellaneous 3,067 4,112 3,235 4,484 1,862 2,130 1,812 1,696 2,758 3,604 Total general revenues and
other changes in net position $ 583,931 $ 680,851 $ 743,031 $ 884,468 $ 824,134 $ 871,072 $ 875,704 $ 782,074 $ 827,863 $ 916,071
Total component unit change in net position $ 71,231 $ 98,980 $ 106,090 $ 165,176 $ 51,828 $ 81,718 $ 82,884 $ 15,611 $ 9,978 $ 57,202
a The Park Authority component unit was dissolved and became the County Department of Parks and Recreation effective FY 2013. The Convention and Visitors Bureau became a
component unit of the County effective FY 2013.
169
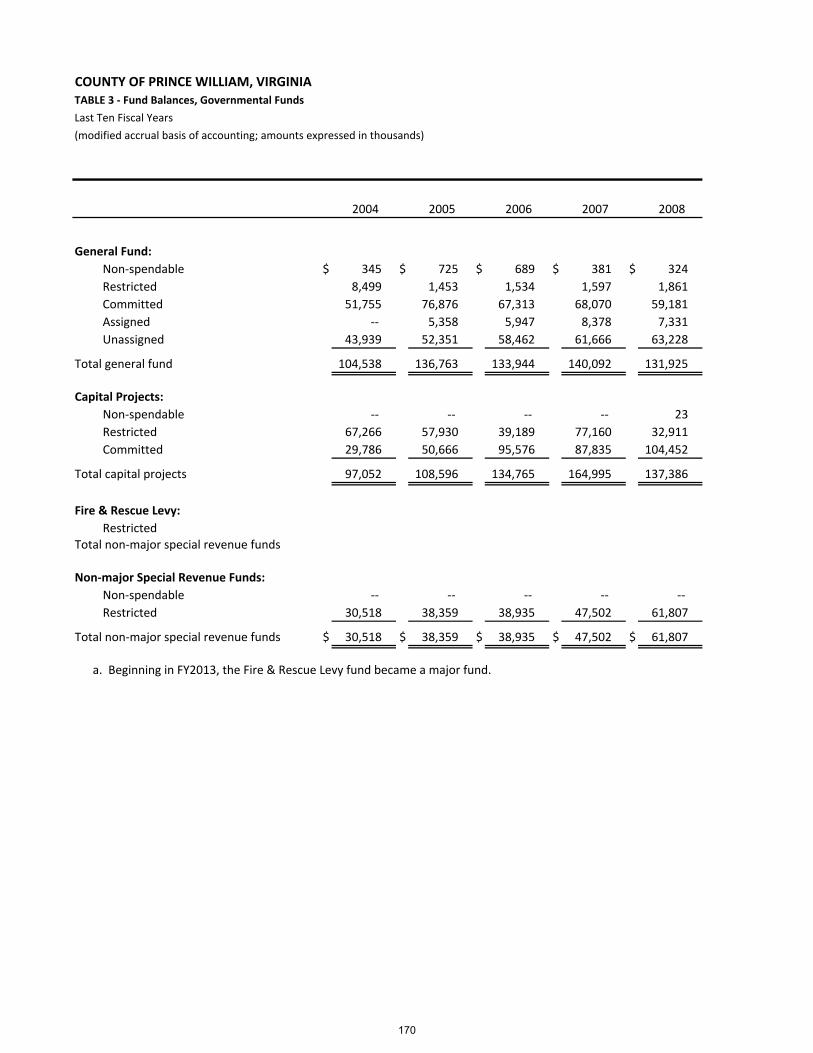
COUNTY OF PRINCE WILLIAM, VIRGINIATABLE 3 ‐ Fund Balances, Governmental Funds
Last Ten Fiscal Years
(modified accrual basis of accounting; amounts expressed in thousands)
2004 2005 2006 2007 2008
General Fund:
Non‐spendable $ 345 $ 725 $ 689 $ 381 $ 324
Restricted 8,499 1,453 1,534 1,597 1,861
Committed 51,755 76,876 67,313 68,070 59,181
Assigned ‐‐ 5,358 5,947 8,378 7,331
Unassigned 43,939 52,351 58,462 61,666 63,228
Total general fund 104,538 136,763 133,944 140,092 131,925
Capital Projects:
Non‐spendable ‐‐ ‐‐ ‐‐ ‐‐ 23
Restricted 67,266 57,930 39,189 77,160 32,911
Committed 29,786 50,666 95,576 87,835 104,452
Total capital projects 97,052 108,596 134,765 164,995 137,386
Fire & Rescue Levy:
RestrictedTotal non‐major special revenue funds
Non‐major Special Revenue Funds:
Non‐spendable ‐‐ ‐‐ ‐‐ ‐‐ ‐‐
Restricted 30,518 38,359 38,935 47,502 61,807
Total non‐major special revenue funds $ 30,518 $ 38,359 $ 38,935 $ 47,502 $ 61,807
a. Beginning in FY2013, the Fire & Rescue Levy fund became a major fund.
170

2009 2010 2011 2012 2013 a
General Fund:
$ 293 $ 201 $ 224 $ 229 $ 299 Non‐spendable
1,559 1,321 1,369 1,274 2,101 Restricted
95,532 99,627 113,811 90,209 81,114 Committed
4,311 3,780 7,570 7,073 8,137 Assigned
67,187 63,948 62,422 64,457 67,075 Unassigned
168,882 168,877 185,396 163,242 158,726 Total general fund
Capital Projects:
34 34 34 199 34 Non‐spendable
55,992 8,550 26,798 21,633 ‐‐ Restricted
87,102 111,574 109,413 87,301 102,692 Committed
143,128 120,158 136,245 109,133 102,726 Total capital projects
Fire & Rescue Levy:
66,893 Restricted66,893 Total non‐major special revenue funds
Non‐major Special Revenue Funds:
‐‐ ‐‐ ‐‐ ‐‐ 30 Non‐spendable
67,497 67,339 73,173 77,568 16,895 Restricted
$ 67,497 $ 67,339 $ 73,173 $ 77,568 $ 16,925 Total non‐major special revenue funds
171
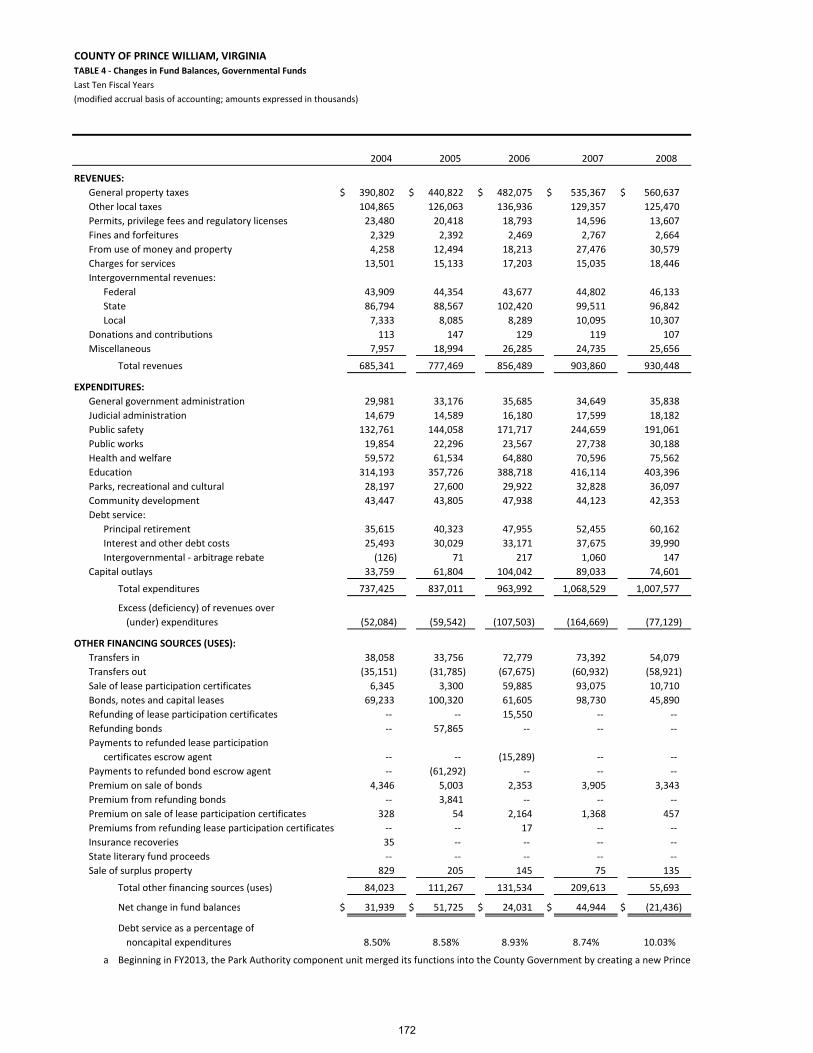
COUNTY OF PRINCE WILLIAM, VIRGINIATABLE 4 ‐ Changes in Fund Balances, Governmental Funds
Last Ten Fiscal Years
(modified accrual basis of accounting; amounts expressed in thousands)
2004 2005 2006 2007 2008
REVENUES:
General property taxes $ 390,802 $ 440,822 $ 482,075 $ 535,367 $ 560,637
Other local taxes 104,865 126,063 136,936 129,357 125,470
Permits, privilege fees and regulatory licenses 23,480 20,418 18,793 14,596 13,607
Fines and forfeitures 2,329 2,392 2,469 2,767 2,664
From use of money and property 4,258 12,494 18,213 27,476 30,579
Charges for services 13,501 15,133 17,203 15,035 18,446
Intergovernmental revenues:
Federal 43,909 44,354 43,677 44,802 46,133
State 86,794 88,567 102,420 99,511 96,842
Local 7,333 8,085 8,289 10,095 10,307
Donations and contributions 113 147 129 119 107
Miscellaneous 7,957 18,994 26,285 24,735 25,656
Total revenues 685,341 777,469 856,489 903,860 930,448
EXPENDITURES:
General government administration 29,981 33,176 35,685 34,649 35,838
Judicial administration 14,679 14,589 16,180 17,599 18,182
Public safety 132,761 144,058 171,717 244,659 191,061
Public works 19,854 22,296 23,567 27,738 30,188
Health and welfare 59,572 61,534 64,880 70,596 75,562
Education 314,193 357,726 388,718 416,114 403,396
Parks, recreational and cultural 28,197 27,600 29,922 32,828 36,097
Community development 43,447 43,805 47,938 44,123 42,353
Debt service:
Principal retirement 35,615 40,323 47,955 52,455 60,162
Interest and other debt costs 25,493 30,029 33,171 37,675 39,990
Intergovernmental ‐ arbitrage rebate (126) 71 217 1,060 147
Capital outlays 33,759 61,804 104,042 89,033 74,601
Total expenditures 737,425 837,011 963,992 1,068,529 1,007,577
Excess (deficiency) of revenues over
(under) expenditures (52,084) (59,542) (107,503) (164,669) (77,129)
OTHER FINANCING SOURCES (USES):
Transfers in 38,058 33,756 72,779 73,392 54,079
Transfers out (35,151) (31,785) (67,675) (60,932) (58,921)
Sale of lease participation certificates 6,345 3,300 59,885 93,075 10,710
Bonds, notes and capital leases 69,233 100,320 61,605 98,730 45,890
Refunding of lease participation certificates ‐‐ ‐‐ 15,550 ‐‐ ‐‐
Refunding bonds ‐‐ 57,865 ‐‐ ‐‐ ‐‐
Payments to refunded lease participation
certificates escrow agent ‐‐ ‐‐ (15,289) ‐‐ ‐‐
Payments to refunded bond escrow agent ‐‐ (61,292) ‐‐ ‐‐ ‐‐
Premium on sale of bonds 4,346 5,003 2,353 3,905 3,343
Premium from refunding bonds ‐‐ 3,841 ‐‐ ‐‐ ‐‐
Premium on sale of lease participation certificates 328 54 2,164 1,368 457
Premiums from refunding lease participation certificates ‐‐ ‐‐ 17 ‐‐ ‐‐
Insurance recoveries 35 ‐‐ ‐‐ ‐‐ ‐‐
State literary fund proceeds ‐‐ ‐‐ ‐‐ ‐‐ ‐‐
Sale of surplus property 829 205 145 75 135
Total other financing sources (uses) 84,023 111,267 131,534 209,613 55,693
Net change in fund balances $ 31,939 $ 51,725 $ 24,031 $ 44,944 $ (21,436)
Debt service as a percentage of
noncapital expenditures 8.50% 8.58% 8.93% 8.74% 10.03%
a Beginning in FY2013, the Park Authority component unit merged its functions into the County Government by creating a new Prince
172
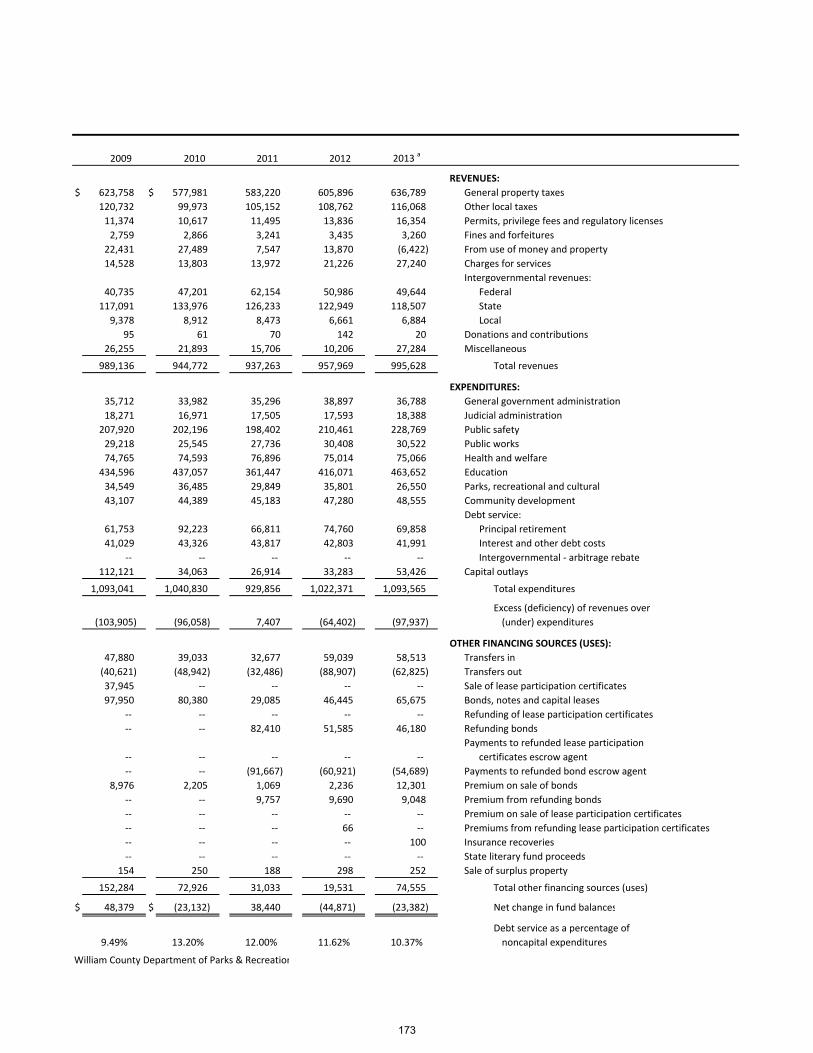
2009 2010 2011 2012 2013 a
REVENUES:
$ 623,758 $ 577,981 583,220 605,896 636,789 General property taxes
120,732 99,973 105,152 108,762 116,068 Other local taxes
11,374 10,617 11,495 13,836 16,354 Permits, privilege fees and regulatory licenses
2,759 2,866 3,241 3,435 3,260 Fines and forfeitures
22,431 27,489 7,547 13,870 (6,422) From use of money and property
14,528 13,803 13,972 21,226 27,240 Charges for services
Intergovernmental revenues:
40,735 47,201 62,154 50,986 49,644 Federal
117,091 133,976 126,233 122,949 118,507 State
9,378 8,912 8,473 6,661 6,884 Local
95 61 70 142 20 Donations and contributions
26,255 21,893 15,706 10,206 27,284 Miscellaneous
989,136 944,772 937,263 957,969 995,628 Total revenues
EXPENDITURES:
35,712 33,982 35,296 38,897 36,788 General government administration
18,271 16,971 17,505 17,593 18,388 Judicial administration
207,920 202,196 198,402 210,461 228,769 Public safety
29,218 25,545 27,736 30,408 30,522 Public works
74,765 74,593 76,896 75,014 75,066 Health and welfare
434,596 437,057 361,447 416,071 463,652 Education
34,549 36,485 29,849 35,801 26,550 Parks, recreational and cultural
43,107 44,389 45,183 47,280 48,555 Community development
Debt service:
61,753 92,223 66,811 74,760 69,858 Principal retirement
41,029 43,326 43,817 42,803 41,991 Interest and other debt costs
‐‐ ‐‐ ‐‐ ‐‐ ‐‐ Intergovernmental ‐ arbitrage rebate
112,121 34,063 26,914 33,283 53,426 Capital outlays
1,093,041 1,040,830 929,856 1,022,371 1,093,565 Total expenditures
Excess (deficiency) of revenues over
(103,905) (96,058) 7,407 (64,402) (97,937) (under) expenditures
OTHER FINANCING SOURCES (USES):
47,880 39,033 32,677 59,039 58,513 Transfers in
(40,621) (48,942) (32,486) (88,907) (62,825) Transfers out
37,945 ‐‐ ‐‐ ‐‐ ‐‐ Sale of lease participation certificates
97,950 80,380 29,085 46,445 65,675 Bonds, notes and capital leases
‐‐ ‐‐ ‐‐ ‐‐ ‐‐ Refunding of lease participation certificates
‐‐ ‐‐ 82,410 51,585 46,180 Refunding bonds
Payments to refunded lease participation
‐‐ ‐‐ ‐‐ ‐‐ ‐‐ certificates escrow agent
‐‐ ‐‐ (91,667) (60,921) (54,689) Payments to refunded bond escrow agent
8,976 2,205 1,069 2,236 12,301 Premium on sale of bonds
‐‐ ‐‐ 9,757 9,690 9,048 Premium from refunding bonds
‐‐ ‐‐ ‐‐ ‐‐ ‐‐ Premium on sale of lease participation certificates
‐‐ ‐‐ ‐‐ 66 ‐‐ Premiums from refunding lease participation certificates
‐‐ ‐‐ ‐‐ ‐‐ 100 Insurance recoveries
‐‐ ‐‐ ‐‐ ‐‐ ‐‐ State literary fund proceeds
154 250 188 298 252 Sale of surplus property
152,284 72,926 31,033 19,531 74,555 Total other financing sources (uses)
$ 48,379 $ (23,132) 38,440 (44,871) (23,382) Net change in fund balances
Debt service as a percentage of
9.49% 13.20% 12.00% 11.62% 10.37% noncapital expenditures
William County Department of Parks & Recreation
173
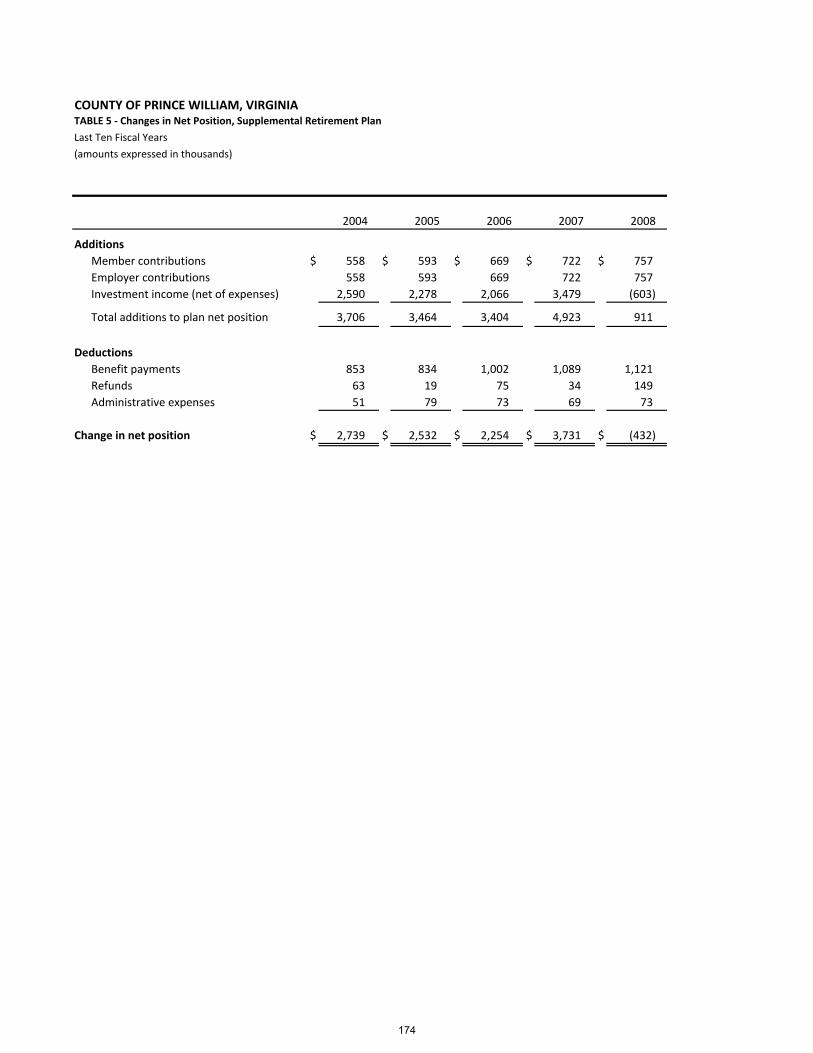
COUNTY OF PRINCE WILLIAM, VIRGINIATABLE 5 ‐ Changes in Net Position, Supplemental Retirement Plan
Last Ten Fiscal Years
(amounts expressed in thousands)
2004 2005 2006 2007 2008
Additions
Member contributions $ 558 $ 593 $ 669 $ 722 $ 757
Employer contributions 558 593 669 722 757
Investment income (net of expenses) 2,590 2,278 2,066 3,479 (603)
Total additions to plan net position 3,706 3,464 3,404 4,923 911
Deductions
Benefit payments 853 834 1,002 1,089 1,121
Refunds 63 19 75 34 149
Administrative expenses 51 79 73 69 73
Change in net position $ 2,739 $ 2,532 $ 2,254 $ 3,731 $ (432)
174
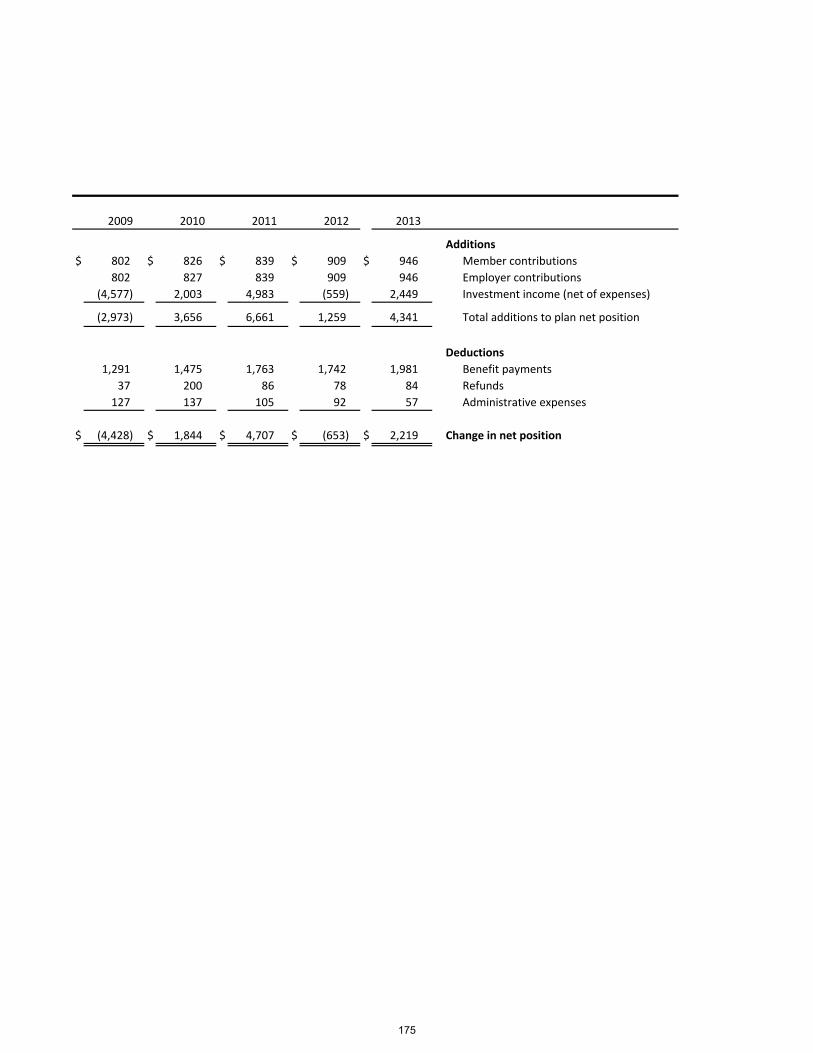
2009 2010 2011 2012 2013
Additions
$ 802 $ 826 $ 839 $ 909 $ 946 Member contributions
802 827 839 909 946 Employer contributions
(4,577) 2,003 4,983 (559) 2,449 Investment income (net of expenses)
(2,973) 3,656 6,661 1,259 4,341 Total additions to plan net position
Deductions
1,291 1,475 1,763 1,742 1,981 Benefit payments
37 200 86 78 84 Refunds
127 137 105 92 57 Administrative expenses
$ (4,428) $ 1,844 $ 4,707 $ (653) $ 2,219 Change in net position
175
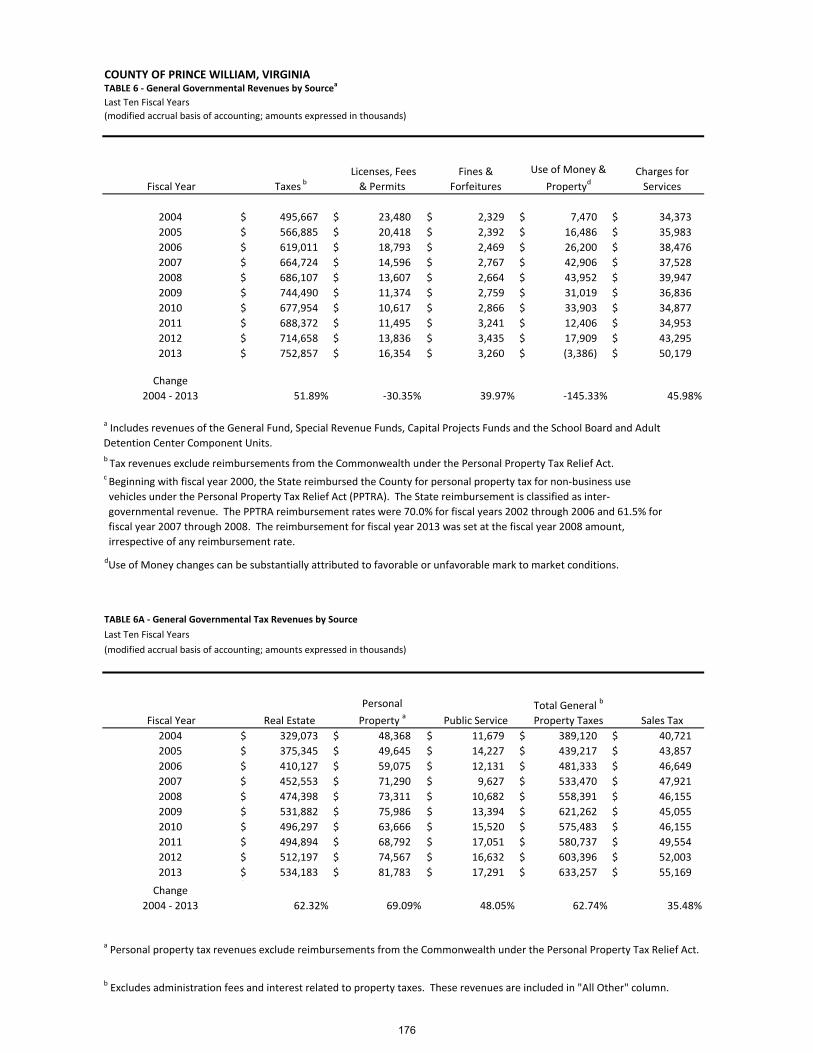
COUNTY OF PRINCE WILLIAM, VIRGINIATABLE 6 ‐ General Governmental Revenues by Sourcea
Last Ten Fiscal Years
(modified accrual basis of accounting; amounts expressed in thousands)
Fiscal Year Taxes b Licenses, Fees
& Permits
Fines &
Forfeitures
Use of Money &
Propertyd
Charges for
Services
2004 $ 495,667 $ 23,480 $ 2,329 $ 7,470 $ 34,373
2005 $ 566,885 $ 20,418 $ 2,392 $ 16,486 $ 35,983
2006 $ 619,011 $ 18,793 $ 2,469 $ 26,200 $ 38,476
2007 $ 664,724 $ 14,596 $ 2,767 $ 42,906 $ 37,528
2008 $ 686,107 $ 13,607 $ 2,664 $ 43,952 $ 39,947
2009 $ 744,490 $ 11,374 $ 2,759 $ 31,019 $ 36,836
2010 $ 677,954 $ 10,617 $ 2,866 $ 33,903 $ 34,877
2011 $ 688,372 $ 11,495 $ 3,241 $ 12,406 $ 34,953
2012 $ 714,658 $ 13,836 $ 3,435 $ 17,909 $ 43,295
2013 $ 752,857 $ 16,354 $ 3,260 $ (3,386) $ 50,179
Change
2004 ‐ 2013 51.89% ‐30.35% 39.97% ‐145.33% 45.98%
dUse of Money changes can be substantially attributed to favorable or unfavorable mark to market conditions.
TABLE 6A ‐ General Governmental Tax Revenues by Source
Last Ten Fiscal Years
(modified accrual basis of accounting; amounts expressed in thousands)
Fiscal Year Real Estate
Personal
Property a Public Service
Total General b
Property Taxes Sales Tax
2004 $ 329,073 $ 48,368 $ 11,679 $ 389,120 $ 40,721
2005 $ 375,345 $ 49,645 $ 14,227 $ 439,217 $ 43,857
2006 $ 410,127 $ 59,075 $ 12,131 $ 481,333 $ 46,649
2007 $ 452,553 $ 71,290 $ 9,627 $ 533,470 $ 47,921
2008 $ 474,398 $ 73,311 $ 10,682 $ 558,391 $ 46,155
2009 $ 531,882 $ 75,986 $ 13,394 $ 621,262 $ 45,055
2010 $ 496,297 $ 63,666 $ 15,520 $ 575,483 $ 46,155
2011 $ 494,894 $ 68,792 $ 17,051 $ 580,737 $ 49,554
2012 $ 512,197 $ 74,567 $ 16,632 $ 603,396 $ 52,003
2013 $ 534,183 $ 81,783 $ 17,291 $ 633,257 $ 55,169 $
Change
2004 ‐ 2013 62.32% 69.09% 48.05% 62.74% 35.48%
b Excludes administration fees and interest related to property taxes. These revenues are included in "All Other" column.
a Includes revenues of the General Fund, Special Revenue Funds, Capital Projects Funds and the School Board and Adult
Detention Center Component Units.
c Beginning with fiscal year 2000, the State reimbursed the County for personal property tax for non‐business use
vehicles under the Personal Property Tax Relief Act (PPTRA). The State reimbursement is classified as inter‐
governmental revenue. The PPTRA reimbursement rates were 70.0% for fiscal years 2002 through 2006 and 61.5% for
fiscal year 2007 through 2008. The reimbursement for fiscal year 2013 was set at the fiscal year 2008 amount,
irrespective of any reimbursement rate.
a Personal property tax revenues exclude reimbursements from the Commonwealth under the Personal Property Tax Relief Act.
b Tax revenues exclude reimbursements from the Commonwealth under the Personal Property Tax Relief Act.
176
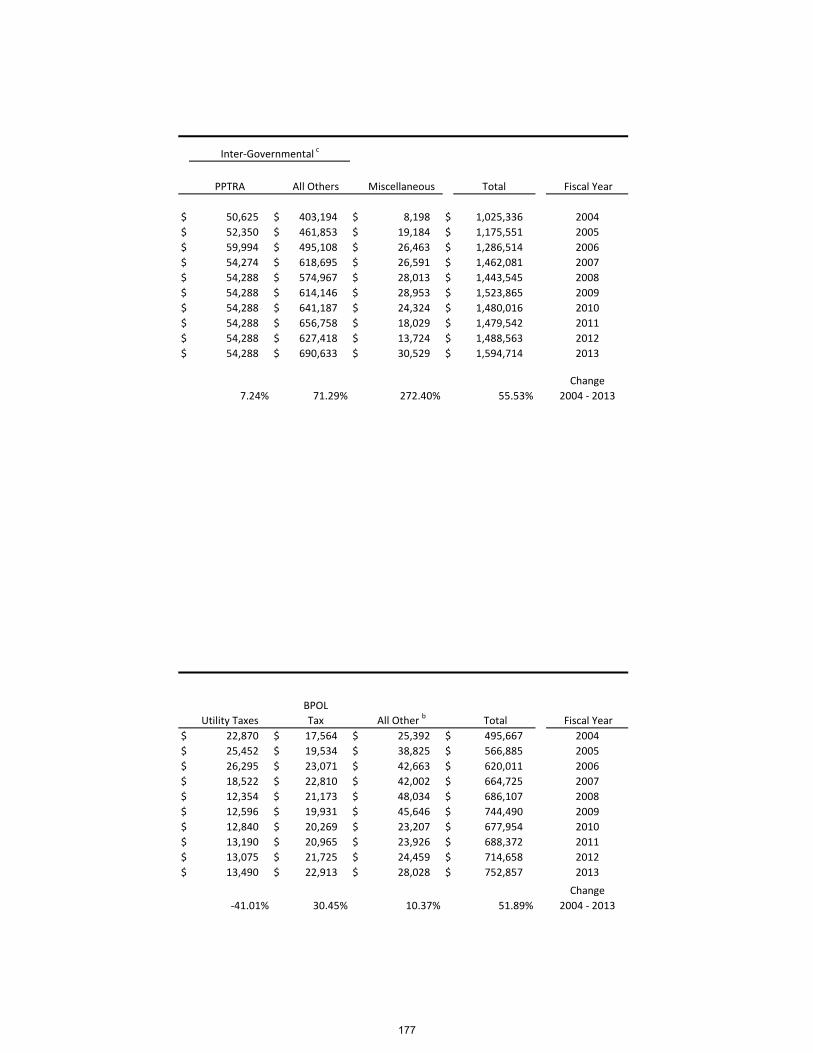
PPTRA All Others Miscellaneous Total Fiscal Year
$ 50,625 $ 403,194 $ 8,198 $ 1,025,336 2004
$ 52,350 $ 461,853 $ 19,184 $ 1,175,551 2005
$ 59,994 $ 495,108 $ 26,463 $ 1,286,514 2006
$ 54,274 $ 618,695 $ 26,591 $ 1,462,081 2007
$ 54,288 $ 574,967 $ 28,013 $ 1,443,545 2008
$ 54,288 $ 614,146 $ 28,953 $ 1,523,865 2009
$ 54,288 $ 641,187 $ 24,324 $ 1,480,016 2010
$ 54,288 $ 656,758 $ 18,029 $ 1,479,542 2011
$ 54,288 $ 627,418 $ 13,724 $ 1,488,563 2012
$ 54,288 $ 690,633 $ 30,529 $ 1,594,714 2013
Change
7.24% 71.29% 272.40% 55.53% 2004 ‐ 2013
Utility Taxes
BPOL
Tax All Other b Total Fiscal Year
$ 22,870 $ 17,564 $ 25,392 $ 495,667 2004
$ 25,452 $ 19,534 $ 38,825 $ 566,885 2005
$ 26,295 $ 23,071 $ 42,663 $ 620,011 2006
$ 18,522 $ 22,810 $ 42,002 $ 664,725 2007
$ 12,354 $ 21,173 $ 48,034 $ 686,107 2008
$ 12,596 $ 19,931 $ 45,646 $ 744,490 2009
$ 12,840 $ 20,269 $ 23,207 $ 677,954 2010
$ 13,190 $ 20,965 $ 23,926 $ 688,372 2011
$ 13,075 $ 21,725 $ 24,459 $ 714,658 2012
$ 13,490 $ 22,913 $ 28,028 $ 752,857 2013
Change
‐41.01% 30.45% 10.37% 51.89% 2004 ‐ 2013
Inter‐Governmental c
177
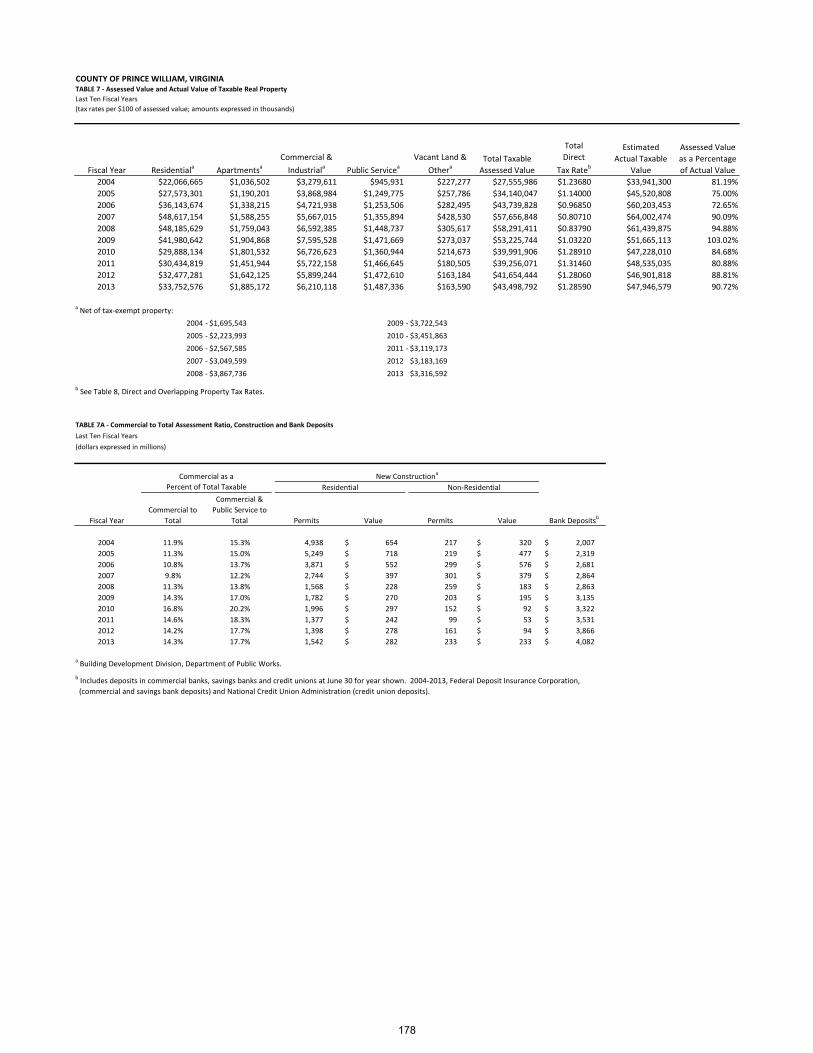
COUNTY OF PRINCE WILLIAM, VIRGINIATABLE 7 ‐ Assessed Value and Actual Value of Taxable Real Property
Last Ten Fiscal Years (tax rates per $100 of assessed value; amounts expressed in thousands)
Fiscal Year Residentiala ApartmentsaCommercial &
Industriala Public ServiceaVacant Land &
OtheraTotal Taxable
Assessed Value
Total
Direct
Tax Rateb
Estimated
Actual Taxable
Value
Assessed Value
as a Percentage
of Actual Value
2004 $22,066,665 $1,036,502 $3,279,611 $945,931 $227,277 $27,555,986 $1.23680 $33,941,300 81.19%
2005 $27,573,301 $1,190,201 $3,868,984 $1,249,775 $257,786 $34,140,047 $1.14000 $45,520,808 75.00%
2006 $36,143,674 $1,338,215 $4,721,938 $1,253,506 $282,495 $43,739,828 $0.96850 $60,203,453 72.65%
2007 $48,617,154 $1,588,255 $5,667,015 $1,355,894 $428,530 $57,656,848 $0.80710 $64,002,474 90.09%
2008 $48,185,629 $1,759,043 $6,592,385 $1,448,737 $305,617 $58,291,411 $0.83790 $61,439,875 94.88%
2009 $41,980,642 $1,904,868 $7,595,528 $1,471,669 $273,037 $53,225,744 $1.03220 $51,665,113 103.02%
2010 $29,888,134 $1,801,532 $6,726,623 $1,360,944 $214,673 $39,991,906 $1.28910 $47,228,010 84.68%
2011 $30,434,819 $1,451,944 $5,722,158 $1,466,645 $180,505 $39,256,071 $1.31460 $48,535,035 80.88%
2012 $32,477,281 $1,642,125 $5,899,244 $1,472,610 $163,184 $41,654,444 $1.28060 $46,901,818 88.81%
2013 $33,752,576 $1,885,172 $6,210,118 $1,487,336 $163,590 $43,498,792 $1.28590 $47,946,579 90.72%
a Net of tax‐exempt property:
2004 ‐ $1,695,543 2009 ‐ $3,722,543
2005 ‐ $2,223,993 2010 ‐ $3,451,863
2006 ‐ $2,567,585 2011 ‐ $3,119,173
2007 ‐ $3,049,599 2012 $3,183,169
2008 ‐ $3,867,736 2013 $3,316,592
b See Table 8, Direct and Overlapping Property Tax Rates.
TABLE 7A ‐ Commercial to Total Assessment Ratio, Construction and Bank Deposits
Last Ten Fiscal Years
(dollars expressed in millions)
Fiscal Year
Commercial to
Total
Commercial &
Public Service to
Total Permits Value Permits Value Bank Depositsb
2004 11.9% 15.3% 4,938 654 $ 217 320 $ 2,007 $
2005 11.3% 15.0% 5,249 718 $ 219 477 $ 2,319 $
2006 10.8% 13.7% 3,871 552 $ 299 576 $ 2,681 $
2007 9.8% 12.2% 2,744 397 $ 301 379 $ 2,864 $
2008 11.3% 13.8% 1,568 228 $ 259 183 $ 2,863 $
2009 14.3% 17.0% 1,782 270 $ 203 195 $ 3,135 $
2010 16.8% 20.2% 1,996 297 $ 152 92 $ 3,322 $
2011 14.6% 18.3% 1,377 242 $ 99 53 $ 3,531 $
2012 14.2% 17.7% 1,398 278 $ 161 94 $ 3,866 $
2013 14.3% 17.7% 1,542 282 $ 233 233 $ 4,082 $
a Building Development Division, Department of Public Works.
b Includes deposits in commercial banks, savings banks and credit unions at June 30 for year shown. 2004‐2013, Federal Deposit Insurance Corporation,
(commercial and savings bank deposits) and National Credit Union Administration (credit union deposits).
Commercial as a New Constructiona
Percent of Total Taxable Residential Non‐Residential
178

179

COUNTY OF PRINCE WILLIAM, VIRGINIATABLE 8 ‐ Direct and Overlapping Real Estate Tax Rates
Last Ten Fiscal Years
(tax rates per $100 of assessed value)
Type of Tax 2004 2005 2006 2007 2008
PRINCE WILLIAM COUNTY
Countywide Tax Levies: Real Estate ‐ General Fund 1.16000 $ 1.07000 $ 0.91000 $ 0.75800 $ 0.78700 $ Fire and Rescue Levy (Countywide) 0.07280 $ 0.06600 $ 0.05600 $ 0.04660 $ 0.04840 $ Gypsy Moth Levy (Countywide) 0.00400 $ 0.00400 $ 0.00250 $ 0.00250 $ 0.00250 $
Total Direct Tax Rate 1.23680 $ 1.14000 $ 0.96850 $ 0.80710 $ 0.83790 $
Sanitary District Levy
Bull Run 0.00001 $ 0.00001 $ 0.00001 $ ‐‐ ‐‐
Occoquan Forest 0.00001 $ 0.00001 $ 0.00001 $ ‐‐ ‐‐
Service District Levies ‐
Bull Run 0.10000 $ 0.10000 $ 0.10000 $ 0.12000 $ 0.12000 $
Lake Jackson 0.11000 $ 0.11000 $ 0.11000 $ 0.11000 $ 0.11000 $
Circuit Court 0.28000 $ 0.28000 $ 0.23000 $ 0.19000 $ 0.19000 $
Transportation District Levies ‐
Prince William Parkway 0.20000 $ 0.20000 $ 0.20000 $ 0.20000 $ 0.20000 $
234‐Bypass 0.02000 $ 0.02000 $ 0.02000 $ 0.02000 $ 0.02000 $
Foremost Court Service 0.23000 $ 0.22000 $ ‐‐ ‐‐ ‐‐
Woodbine Forest Service ‐‐ ‐‐ ‐‐ ‐‐ ‐‐
OVERLAPPING GOVERNMENTS
Real Estate Tax Levy:
Town of Dumfries 0.12420 $ 0.12420 $ 0.13000 $ 0.18000 $ 0.18000 $
Town of Haymarket 0.14000 $ 0.14000 $ 0.14000 $ 0.12000 $ 0.12800 $
Town of Occoquan 0.05000 $ 0.05000 $ 0.05000 $ 0.08500 $ 0.08500 $
Town of Quantico 0.20000 $ 0.20000 $ 0.15000 $ 0.20000 $ 0.20000 $
180

2009 2010 2011 2012 2013 Type of Tax
PRINCE WILLIAM COUNTY
Countywide Tax Levies:0.97000 $ 1.21200 $ 1.23600 $ 1.20400 $ 1.20900 $ Real Estate ‐ General Fund0.05970 $ 0.07460 $ 0.07610 $ 0.07410 $ 0.07440 $ Fire and Rescue Levy (Countywide)0.00250 $ 0.00250 $ 0.00250 $ 0.00250 $ 0.00250 $ Gypsy Moth Levy (Countywide)
1.03220 $ 1.28910 $ 1.31460 $ 1.28060 $ 1.28590 $ Total Direct Tax Rate
Sanitary District Levy
‐‐ ‐‐ ‐‐ ‐‐ ‐‐ Bull Run
‐‐ ‐‐ ‐‐ ‐‐ ‐‐ Occoquan Forest
Service District Levies ‐
0.13800 $ 0.19900 $ 0.20100 $ 0.20100 $ 0.20100 $ Bull Run
0.12300 $ 0.17200 $ 0.17500 $ 0.17500 $ 0.17500 $ Lake Jackson
0.15000 $ ‐‐ ‐‐ ‐‐ ‐‐ Circuit Court
Transportation District Levies ‐
0.20000 $ 0.20000 $ 0.20000 $ 0.20000 $ 0.20000 $ Prince William Parkway
0.02000 $ 0.02000 $ 0.02000 $ 0.02000 $ 0.02000 $ 234‐Bypass
‐‐ ‐‐ ‐‐ ‐‐ ‐‐ Foremost Court Service
‐‐ ‐‐ ‐‐ ‐‐ ‐‐ Woodbine Forest Service
OVERLAPPING GOVERNMENTS
Real Estate Tax Levy:
0.18000 $ 0.35330 $ 0.33350 $ 0.33330 $ 0.27733 $ Town of Dumfries
0.16400 $ 0.16400 $ 0.16400 $ 0.16400 $ 0.16400 $ Town of Haymarket
0.10000 $ 0.10000 $ 0.10000 $ 0.10000 $ 0.10000 $ Town of Occoquan
0.20000 $ 0.20000 $ 0.20000 $ 0.20000 $ 0.20000 $ Town of Quantico
181

COUNTY OF PRINCE WILLIAM, VIRGINIATABLE 9 ‐ Principal Real Property Tax Payers
Current Year and Nine Years Ago
(amounts expressed in thousands)
Taxpayer
Taxable
Assessed
Value Rank
Percentage of
Total County
Taxable Assessed
Valuea
Taxable
Assessed
Value Rank
Percentage of
Total County
Taxable Assessed
Valuea
VA Electric & Power Company $ 755,920 1 1.74% $ 369,242 1 1.34%
Northern Virginia Electric Co‐op 271,275 2 0.62% 172,501 3 0.63%
Verizon South, Inc. 156,121 3 0.36% 134,313 4 0.49%
Woodbridge Station Apartments LLC 136,075 4 0.31% ‐
Washington Gas Light Company 100,812 5 0.23% 65,524 10 0.24%
Mall at Potomac Mills, LLC 97,162 6 0.22% 287,656 2 1.04%
Stellar Chatsworth LLC 96,449 7 0.22% ‐ ‐
TR Rollings Brook Corp. 94,942 8 0.22% ‐ ‐
Prince William Square Investors LLC 93,924 9 0.22% ‐ ‐
Manassas Owner LLC 74,880 10 0.17% ‐ ‐
Dominion Country Club, LP ‐ ‐ 97,900 5 0.36%
AOL LLC ‐ ‐ 94,493 6 0.34%
Manassas Mall LLC ‐ ‐ 81,460 7 0.30%
US Home Corporation ‐ ‐ 75,221 8 0.27%
WNH Limited Partnership ‐ ‐ 66,747 9 0.24%
$ 1,877,560 4.3% $ 1,445,057 5.2%
a See Table 7 for a ten‐year listing of Taxable Assessed Values.
2013 2004
182

COUNTY OF PRINCE WILLIAM, VIRGINIATABLE 10 ‐ Real Property Tax Levies and Collections
Last Ten Fiscal Years
(amounts expressed in thousands)
Fiscal Year
Total Adjusted
Tax Levya
Amount
Percentage of
Levy
Collections in
Subsequent
Years
Percentage of
Levy Collected
Penalties on
Taxes
Collected Amount
Percentage of
Levy
2004 $ 340,760 $ 338,870 99.4% $ 1,746 100.0% $ 1,221 $ 341,837 100.3%
2005 $ 388,254 $ 386,367 99.5% $ 1,694 100.0% $ 1,367 $ 495,970 100.8%
2006 $ 420,203 $ 418,111 99.5% $ 1,973 100.0% $ 1,507 $ 421,591 100.3%
2007 $ 461,108 $ 458,438 99.4% $ 2,505 100.0% $ 1,748 $ 462,691 100.3%
2008 $ 484,124 $ 481,069 99.4% $ 2,717 99.9% $ 1,905 $ 485,691 100.3%
2009 $ 544,909 $ 541,235 99.3% $ 3,263 99.9% $ 2,065 $ 546,563 100.3%
2010 $ 510,988 $ 508,264 99.5% $ 2,397 99.9% $ 1,698 $ 512,359 100.3%
2011 $ 511,316 $ 509,154 99.6% $ 1,417 99.9% $ 1,376 $ 511,947 100.1%
2012 $ 527,838 $ 525,737 99.6% $ 1,145 99.8% $ 1,256 $ 528,138 100.1%
2013 $ 553,424 $ 551,222 99.6% $ ‐‐ 99.6% $ 1,229 $ 552,451 99.8%
b Total collections to date include the effects of penalties assessed on amounts paid past the due date.
a Total tax levy includes gross real estate and public service taxes less adjustments to tax due made prior to payment.
Collected within the
Fiscal Year of the Levy Total Collections to Dateb
183
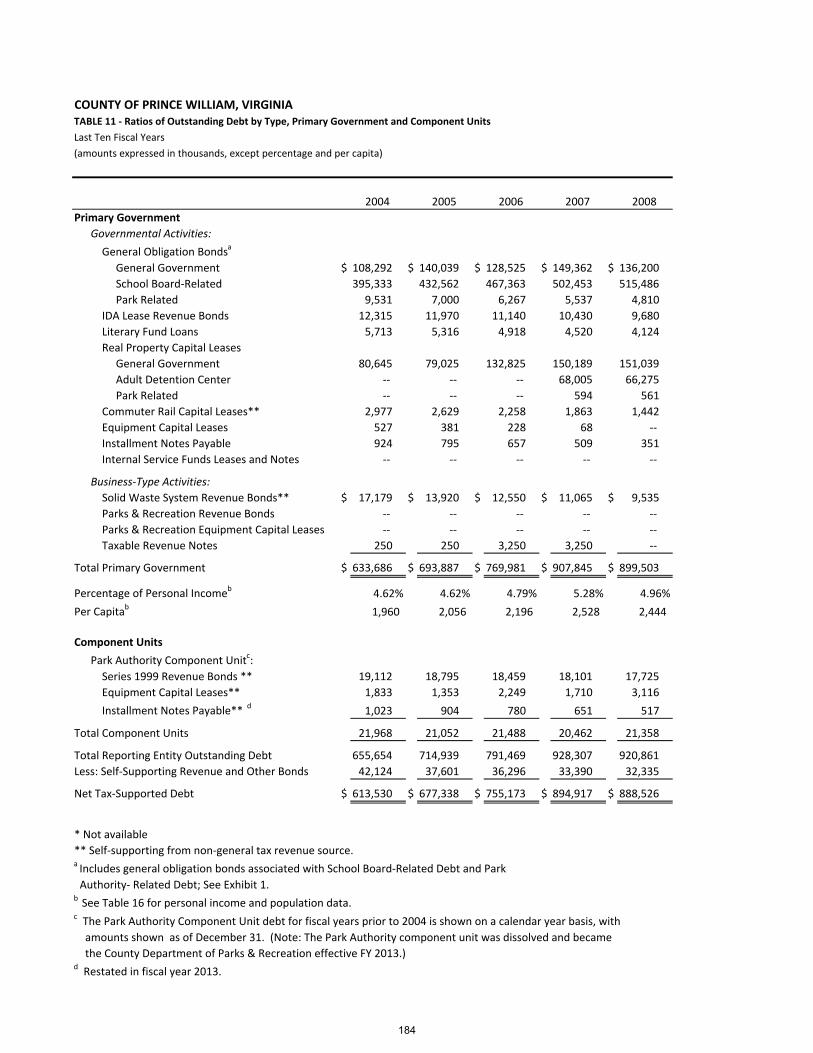
COUNTY OF PRINCE WILLIAM, VIRGINIATABLE 11 ‐ Ratios of Outstanding Debt by Type, Primary Government and Component Units
Last Ten Fiscal Years
(amounts expressed in thousands, except percentage and per capita)
2004 2005 2006 2007 2008
Primary Government
Governmental Activities:
General Obligation Bondsa
General Government $ 108,292 $ 140,039 $ 128,525 $ 149,362 $ 136,200
School Board‐Related 395,333 432,562 467,363 502,453 515,486
Park Related 9,531 7,000 6,267 5,537 4,810
IDA Lease Revenue Bonds 12,315 11,970 11,140 10,430 9,680
Literary Fund Loans 5,713 5,316 4,918 4,520 4,124
Real Property Capital Leases
General Government 80,645 79,025 132,825 150,189 151,039
Adult Detention Center ‐‐ ‐‐ ‐‐ 68,005 66,275
Park Related ‐‐ ‐‐ ‐‐ 594 561
Commuter Rail Capital Leases** 2,977 2,629 2,258 1,863 1,442
Equipment Capital Leases 527 381 228 68 ‐‐
Installment Notes Payable 924 795 657 509 351
Internal Service Funds Leases and Notes ‐‐ ‐‐ ‐‐ ‐‐ ‐‐
Business‐Type Activities:
Solid Waste System Revenue Bonds** $ 17,179 $ 13,920 $ 12,550 $ 11,065 $ 9,535
Parks & Recreation Revenue Bonds ‐‐ ‐‐ ‐‐ ‐‐ ‐‐
Parks & Recreation Equipment Capital Leases ‐‐ ‐‐ ‐‐ ‐‐ ‐‐
Taxable Revenue Notes 250 250 3,250 3,250 ‐‐
Total Primary Government $ 633,686 $ 693,887 $ 769,981 $ 907,845 $ 899,503
Percentage of Personal Incomeb 4.62% 4.62% 4.79% 5.28% 4.96%
Per Capitab 1,960 2,056 2,196 2,528 2,444
Component Units
Park Authority Component Unitc:
Series 1999 Revenue Bonds ** 19,112 18,795 18,459 18,101 17,725
Equipment Capital Leases** 1,833 1,353 2,249 1,710 3,116
Installment Notes Payable** d
1,023 904 780 651 517
Total Component Units 21,968 21,052 21,488 20,462 21,358
Total Reporting Entity Outstanding Debt 655,654 714,939 791,469 928,307 920,861
Less: Self‐Supporting Revenue and Other Bonds 42,124 37,601 36,296 33,390 32,335
Net Tax‐Supported Debt $ 613,530 $ 677,338 $ 755,173 $ 894,917 $ 888,526
* Not available
** Self‐supporting from non‐general tax revenue source.a Includes general obligation bonds associated with School Board‐Related Debt and Park
Authority‐ Related Debt; See Exhibit 1.b See Table 16 for personal income and population data.c The Park Authority Component Unit debt for fiscal years prior to 2004 is shown on a calendar year basis, with
amounts shown as of December 31. (Note: The Park Authority component unit was dissolved and became
the County Department of Parks & Recreation effective FY 2013.)d Restated in fiscal year 2013.
184
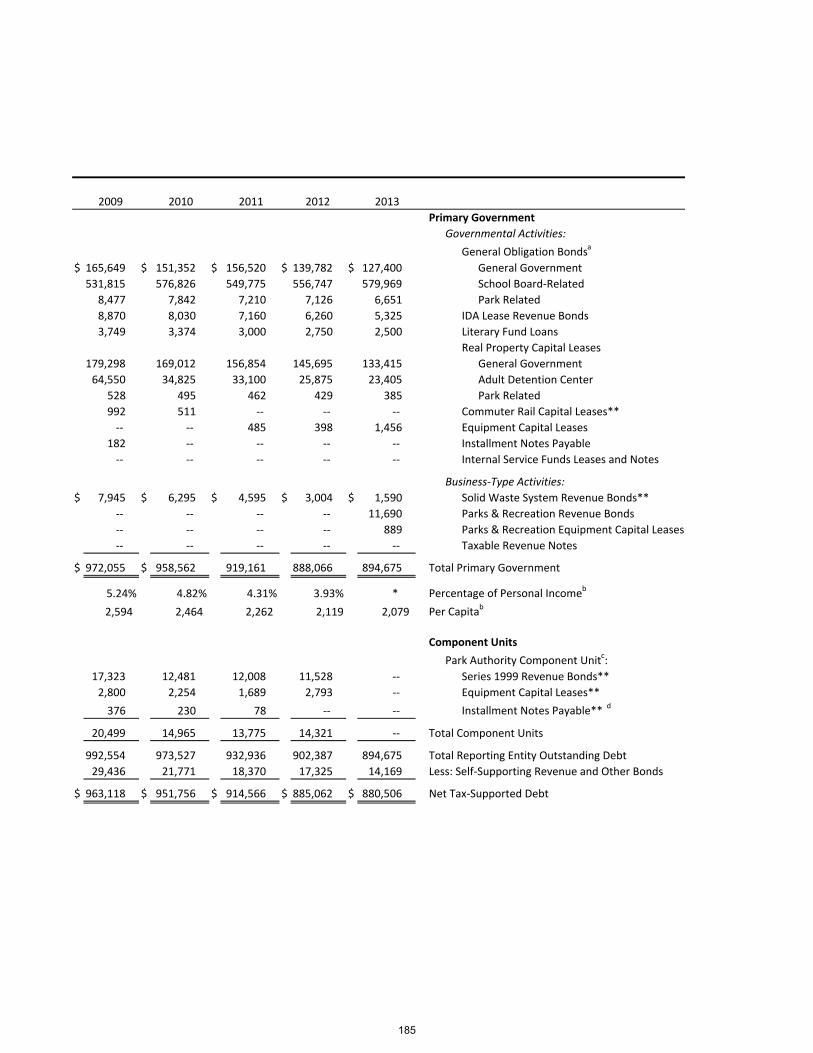
2009 2010 2011 2012 2013
Primary Government
Governmental Activities:
General Obligation Bondsa
$ 165,649 $ 151,352 $ 156,520 $ 139,782 $ 127,400 General Government
531,815 576,826 549,775 556,747 579,969 School Board‐Related
8,477 7,842 7,210 7,126 6,651 Park Related
8,870 8,030 7,160 6,260 5,325 IDA Lease Revenue Bonds
3,749 3,374 3,000 2,750 2,500 Literary Fund Loans
Real Property Capital Leases
179,298 169,012 156,854 145,695 133,415 General Government
64,550 34,825 33,100 25,875 23,405 Adult Detention Center
528 495 462 429 385 Park Related
992 511 ‐‐ ‐‐ ‐‐ Commuter Rail Capital Leases**
‐‐ ‐‐ 485 398 1,456 Equipment Capital Leases
182 ‐‐ ‐‐ ‐‐ ‐‐ Installment Notes Payable
‐‐ ‐‐ ‐‐ ‐‐ ‐‐ Internal Service Funds Leases and Notes
Business‐Type Activities:
$ 7,945 $ 6,295 $ 4,595 $ 3,004 $ 1,590 Solid Waste System Revenue Bonds**
‐‐ ‐‐ ‐‐ ‐‐ 11,690 Parks & Recreation Revenue Bonds
‐‐ ‐‐ ‐‐ ‐‐ 889 Parks & Recreation Equipment Capital Leases
‐‐ ‐‐ ‐‐ ‐‐ ‐‐ Taxable Revenue Notes
$ 972,055 $ 958,562 919,161 888,066 894,675 Total Primary Government
5.24% 4.82% 4.31% 3.93% * Percentage of Personal Incomeb
2,594 2,464 2,262 2,119 2,079 Per Capitab
Component Units
Park Authority Component Unitc:
17,323 12,481 12,008 11,528 ‐‐ Series 1999 Revenue Bonds**
2,800 2,254 1,689 2,793 ‐‐ Equipment Capital Leases**
376 230 78 ‐‐ ‐‐ Installment Notes Payable** d
20,499 14,965 13,775 14,321 ‐‐ Total Component Units
992,554 973,527 932,936 902,387 894,675 Total Reporting Entity Outstanding Debt
29,436 21,771 18,370 17,325 14,169 Less: Self‐Supporting Revenue and Other Bonds
$ 963,118 $ 951,756 $ 914,566 $ 885,062 $ 880,506 Net Tax‐Supported Debt
185
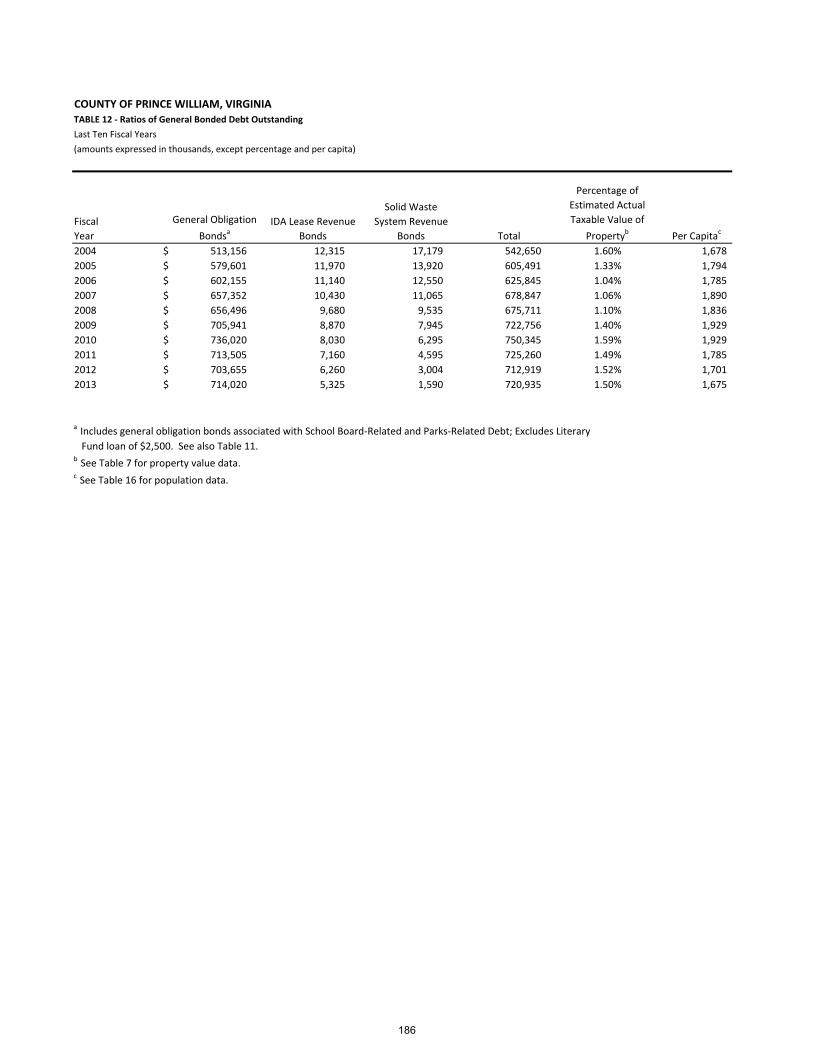
COUNTY OF PRINCE WILLIAM, VIRGINIATABLE 12 ‐ Ratios of General Bonded Debt Outstanding
Last Ten Fiscal Years
(amounts expressed in thousands, except percentage and per capita)
Fiscal
Year
General Obligation
BondsaIDA Lease Revenue
Bonds
Solid Waste
System Revenue
Bonds Total
Percentage of
Estimated Actual
Taxable Value of
Propertyb Per Capitac
2004 $ 513,156 12,315 17,179 542,650 1.60% 1,678
2005 $ 579,601 11,970 13,920 605,491 1.33% 1,794
2006 $ 602,155 11,140 12,550 625,845 1.04% 1,785
2007 $ 657,352 10,430 11,065 678,847 1.06% 1,890
2008 $ 656,496 9,680 9,535 675,711 1.10% 1,836
2009 $ 705,941 8,870 7,945 722,756 1.40% 1,929
2010 $ 736,020 8,030 6,295 750,345 1.59% 1,929
2011 $ 713,505 7,160 4,595 725,260 1.49% 1,785
2012 $ 703,655 6,260 3,004 712,919 1.52% 1,701
2013 $ 714,020 5,325 1,590 720,935 1.50% 1,675
a Includes general obligation bonds associated with School Board‐Related and Parks‐Related Debt; Excludes Literary
Fund loan of $2,500. See also Table 11.b See Table 7 for property value data.c See Table 16 for population data.
186
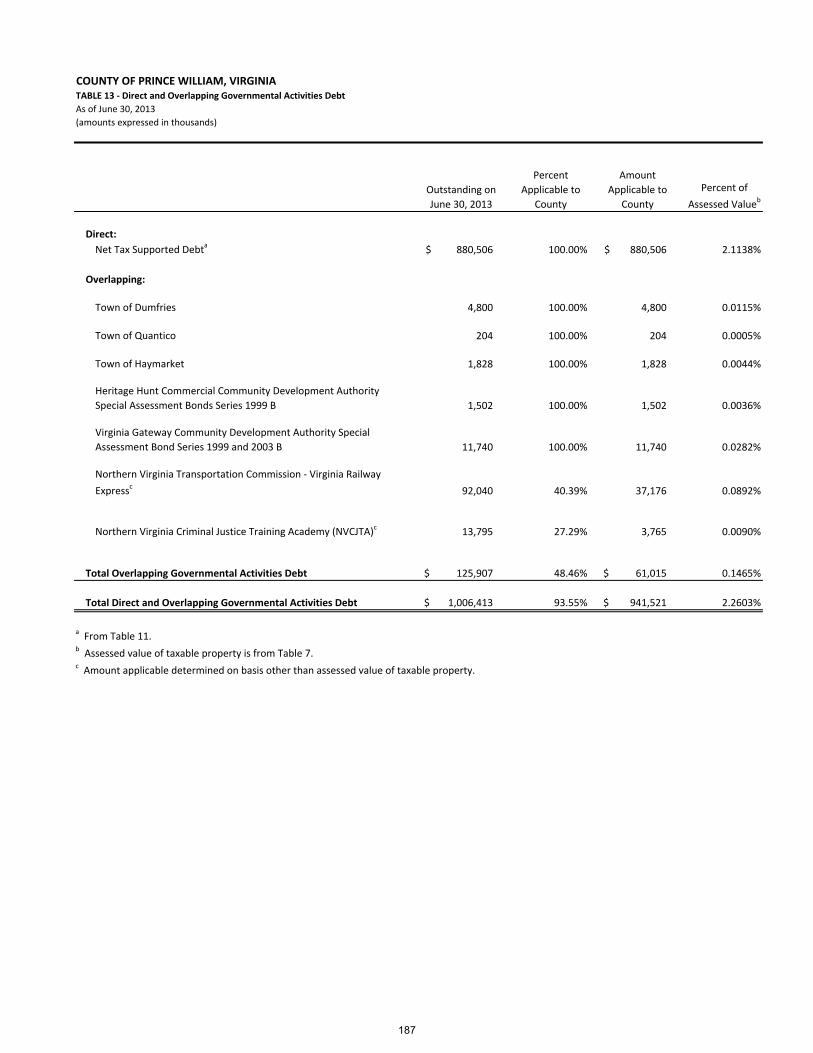
COUNTY OF PRINCE WILLIAM, VIRGINIATABLE 13 ‐ Direct and Overlapping Governmental Activities Debt
As of June 30, 2013 (amounts expressed in thousands)
Outstanding on
June 30, 2013
Percent
Applicable to
County
Amount
Applicable to
County
Percent of
Assessed Valueb
Direct:
Net Tax Supported Debta 880,506 $ 100.00% 880,506 $ 2.1138%
Overlapping:
Town of Dumfries 4,800 100.00% 4,800 0.0115%
Town of Quantico 204 100.00% 204 0.0005%
Town of Haymarket 1,828 100.00% 1,828 0.0044%
Heritage Hunt Commercial Community Development Authority
Special Assessment Bonds Series 1999 B 1,502 100.00% 1,502 0.0036%
Virginia Gateway Community Development Authority Special
Assessment Bond Series 1999 and 2003 B 11,740 100.00% 11,740 0.0282%
Northern Virginia Transportation Commission ‐ Virginia Railway
Expressc 92,040 40.39% 37,176 0.0892%
Northern Virginia Criminal Justice Training Academy (NVCJTA)c
13,795 27.29% 3,765 0.0090%
Total Overlapping Governmental Activities Debt 125,907 $ 48.46% 61,015 $ 0.1465%
Total Direct and Overlapping Governmental Activities Debt 1,006,413 $ 93.55% 941,521 $ 2.2603%
a From Table 11.b Assessed value of taxable property is from Table 7.
c Amount applicable determined on basis other than assessed value of taxable property.
187
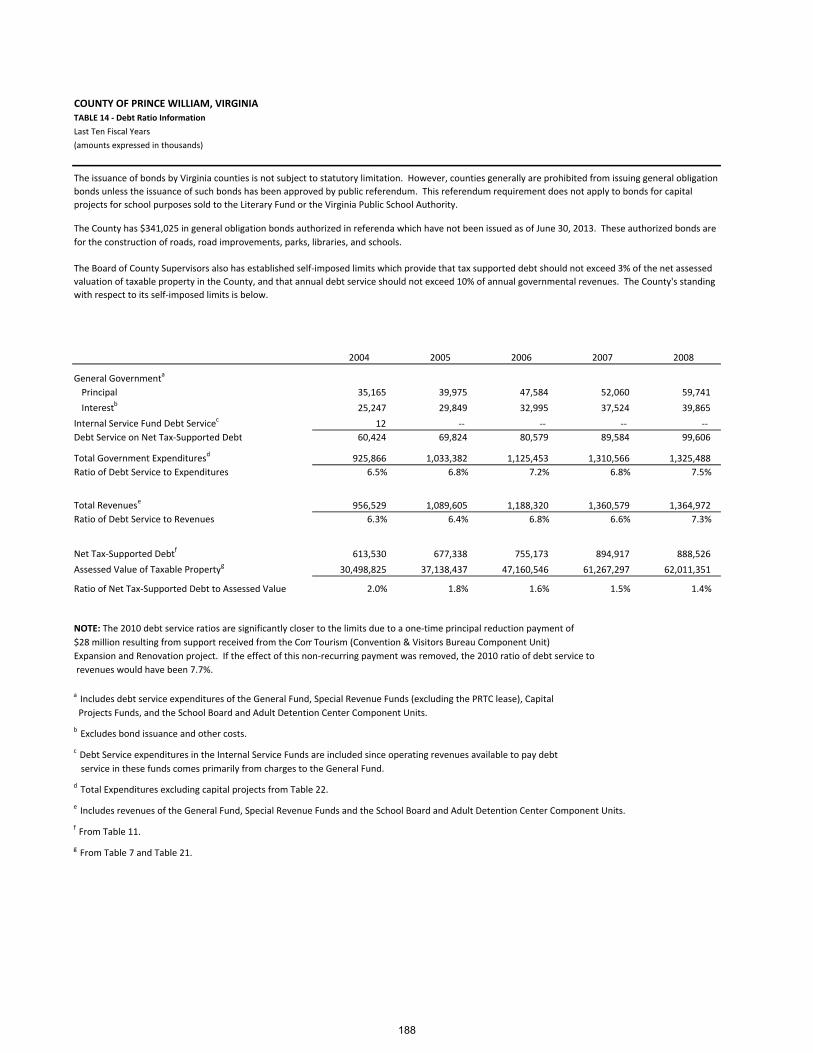
COUNTY OF PRINCE WILLIAM, VIRGINIATABLE 14 ‐ Debt Ratio Information
Last Ten Fiscal Years
(amounts expressed in thousands)
for the construction of roads, road improvements, parks, libraries, and schools.
2004 2005 2006 2007 2008
General Governmenta
Principal 35,165 39,975 47,584 52,060 59,741
Interestb
25,247 29,849 32,995 37,524 39,865
Internal Service Fund Debt Servicec
12 ‐‐ ‐‐ ‐‐ ‐‐
Debt Service on Net Tax‐Supported Debt 60,424 69,824 80,579 89,584 99,606
Total Government Expendituresd
925,866 1,033,382 1,125,453 1,310,566 1,325,488
Ratio of Debt Service to Expenditures 6.5% 6.8% 7.2% 6.8% 7.5%
Total Revenuese
956,529 1,089,605 1,188,320 1,360,579 1,364,972
Ratio of Debt Service to Revenues 6.3% 6.4% 6.8% 6.6% 7.3%
Net Tax‐Supported Debtf
613,530 677,338 755,173 894,917 888,526
Assessed Value of Taxable Propertyg
30,498,825 37,138,437 47,160,546 61,267,297 62,011,351
Ratio of Net Tax‐Supported Debt to Assessed Value 2.0% 1.8% 1.6% 1.5% 1.4%
NOTE: The 2010 debt service ratios are significantly closer to the limits due to a one‐time principal reduction payment of
$28 million resulting from support received from the ComTourism (Convention & Visitors Bureau Component Unit)
Expansion and Renovation project. If the effect of this non‐recurring payment was removed, the 2010 ratio of debt service to
revenues would have been 7.7%.
a Includes debt service expenditures of the General Fund, Special Revenue Funds (excluding the PRTC lease), Capital
Projects Funds, and the School Board and Adult Detention Center Component Units.
b Excludes bond issuance and other costs.
c Debt Service expenditures in the Internal Service Funds are included since operating revenues available to pay debt
service in these funds comes primarily from charges to the General Fund.
d Total Expenditures excluding capital projects from Table 22.
e Includes revenues of the General Fund, Special Revenue Funds and the School Board and Adult Detention Center Component Units.
f From Table 11.
g From Table 7 and Table 21.
The issuance of bonds by Virginia counties is not subject to statutory limitation. However, counties generally are prohibited from issuing general obligation
bonds unless the issuance of such bonds has been approved by public referendum. This referendum requirement does not apply to bonds for capital
projects for school purposes sold to the Literary Fund or the Virginia Public School Authority.
The County has $341,025 in general obligation bonds authorized in referenda which have not been issued as of June 30, 2013. These authorized bonds are
The Board of County Supervisors also has established self‐imposed limits which provide that tax supported debt should not exceed 3% of the net assessed
valuation of taxable property in the County, and that annual debt service should not exceed 10% of annual governmental revenues. The County's standing
with respect to its self‐imposed limits is below.
188

2009 2010 2011 2012 2013
General Governmenta
61,303 91,742 66,299 74,760 69,858 Principal
41,032 43,272 43,783 42,803 41,991 Interestb
‐‐ ‐‐ ‐‐ ‐‐ ‐‐ Internal Service Fund Debt Servicec
102,335 135,014 110,082 117,563 111,849 Debt Service on Net Tax‐Supported Debt
1,331,692 1,386,901 1,337,189 1,427,543 1,399,827 Total Government Expendituresd
7.7% 9.7% 8.2% 8.2% 8.0% Ratio of Debt Service to Expenditures
1,441,690 1,392,237 1,439,786 1,460,245 1,493,495 Total Revenuese
7.1% 9.7% 7.6% 8.1% 7.5% Ratio of Debt Service to Revenues
963,118 951,756 914,566 885,062 880,506 Net Tax‐Supported Debtf
56,999,051 43,359,775 42,750,432 45,148,805 47,586,736 Assessed Value of Taxable Propertyg
1.7% 2.2% 2.1% 2.0% 1.9% Ratio of Net Tax‐Supported Debt to Assessed Value
189

COUNTY OF PRINCE WILLIAM, VIRGINIATABLE 15 ‐ Revenue Bond Coverage for Solid Waste System Revenue Bonds
Last Ten Fiscal Years
(amounts expressed in thousands)
Fiscal Year Coveragef
2004 $ 13,606 $ 7,013 $ 1,798 $ 4,795 $ 1,148 $ 1,162 $ 2,310 2.08
2005 $ 14,715 $ 10,090 $ 1,752 $ 2,873 $ 1,323 $ 1,114 $ 2,437 1.18
2006 $ 14,653 $ 9,615 $ 2,594 $ 2,444 $ 1,370 $ 501 $ 1,871 1.31
2007 $ 16,535 $ 9,970 $ 2,199 $ 4,366 $ 1,485 $ 562 $ 2,047 2.13
2008 $ 17,342 $ 10,651 $ 3,015 $ 3,676 $ 1,530 $ 504 $ 2,034 1.81
2009 $ 17,795 $ 15,027 $ ‐‐ $ 2,768 $ 1,590 $ 435 $ 2,025 1.37
2010 $ 17,925 $ 10,423 $ ‐‐ $ 7,502 $ 1,650 $ 362 $ 2,012 3.73
2011 $ 18,861 $ 11,694 $ 749 $ 6,418 $ 1,700 $ 295 $ 1,995 3.22
2012 $ 18,064 $ 12,031 $ 1,503 $ 4,530 $ 1,470 $ 226 $ 1,696 2.67
2013 $ 18,339 $ 10,735 $ 1,749 $ 5,855 $ 1,535 $ 156 $ 1,691 3.46
a Includes "Total Operating Revenues", "Grants from the Commonwealth," and "Interest and Miscellaneous Income"
from the Statement of Revenues, Expenses and Changes in Fund Net Position.
b Includes "Total Operating Expenses" (exclusive of "Depreciation" and "Closure Expense"), and "Transfers", from the
Statement of Revenues, Expenses, and Changes in Fund Net Position.
c There was no provision for closure payment in fiscal years 2009 or 2010 due to revised engineering estimate increasing
the capacity due to changes in slope design.
e In fiscal year 2005, certain bonds were refunded, and a portion of the proceeds were used to pay down principal resulting in
excess principal payments of $1.9 million. This amount is excluded from the normal principal payments noted above.
Solid Waste System.
f Required coverage is 1.15.
d Principal, accreted value of and interest (including other debt costs) paid during the fiscal year on bonded indebtedness of the
Principale Interest Total
System
Revenuesa
Operating
Expenses and
TransfersbClosure
Paymentc
Net Revenue
Available for
Debt Service
Debt Service Paymentsd
190
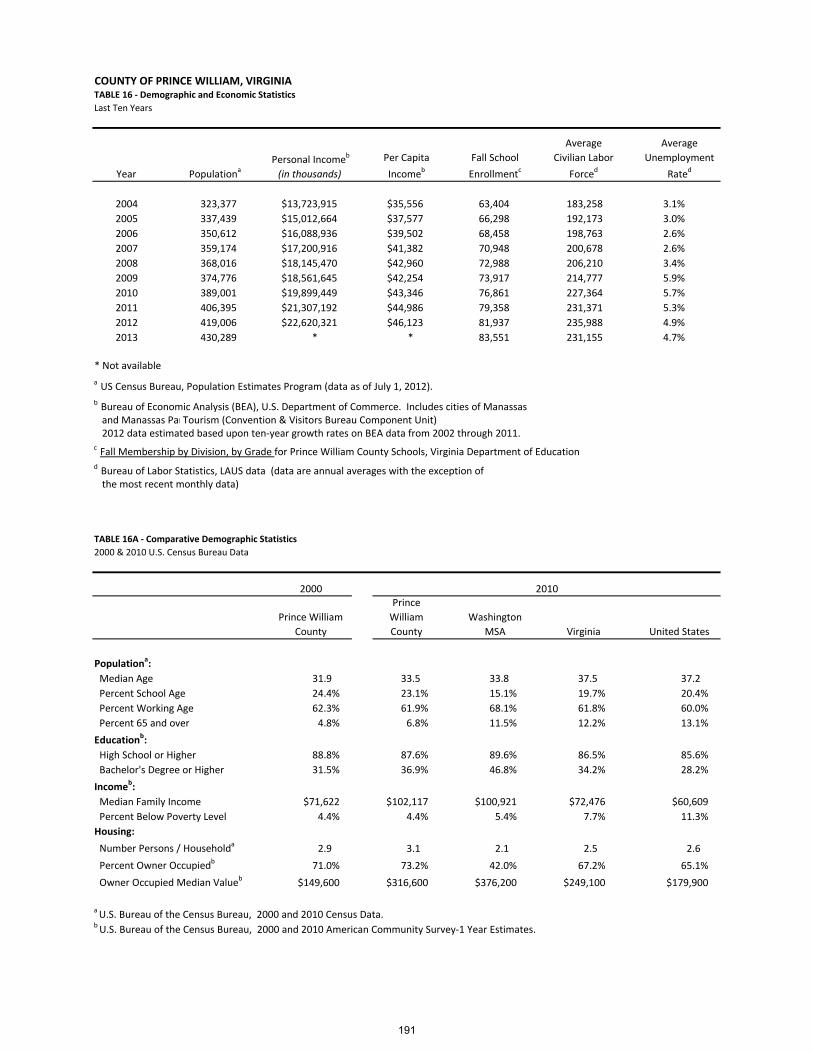
COUNTY OF PRINCE WILLIAM, VIRGINIATABLE 16 ‐ Demographic and Economic Statistics
Last Ten Years
Year PopulationaPersonal Incomeb
(in thousands)
Per Capita
IncomebFall School
Enrollmentc
Average
Civilian Labor
Forced
Average
Unemployment
Rated
2004 323,377 $13,723,915 $35,556 63,404 183,258 3.1%
2005 337,439 $15,012,664 $37,577 66,298 192,173 3.0%
2006 350,612 $16,088,936 $39,502 68,458 198,763 2.6%
2007 359,174 $17,200,916 $41,382 70,948 200,678 2.6%
2008 368,016 $18,145,470 $42,960 72,988 206,210 3.4%
2009 374,776 $18,561,645 $42,254 73,917 214,777 5.9%
2010 389,001 $19,899,449 $43,346 76,861 227,364 5.7%
2011 406,395 $21,307,192 $44,986 79,358 231,371 5.3%
2012 419,006 $22,620,321 $46,123 81,937 235,988 4.9%
2013 430,289 * * 83,551 231,155 4.7%
and Manassas ParTourism (Convention & Visitors Bureau Component Unit)
TABLE 16A ‐ Comparative Demographic Statistics
2000 & 2010 U.S. Census Bureau Data
2000
Prince William
County
Prince
William
County
Washington
MSA Virginia United States
Populationa:
Median Age 31.9 33.5 33.8 37.5 37.2
Percent School Age 24.4% 23.1% 15.1% 19.7% 20.4%
Percent Working Age 62.3% 61.9% 68.1% 61.8% 60.0%
Percent 65 and over 4.8% 6.8% 11.5% 12.2% 13.1%
Educationb:
High School or Higher 88.8% 87.6% 89.6% 86.5% 85.6%
Bachelor's Degree or Higher 31.5% 36.9% 46.8% 34.2% 28.2%
Incomeb:
Median Family Income $71,622 $102,117 $100,921 $72,476 $60,609
Percent Below Poverty Level 4.4% 4.4% 5.4% 7.7% 11.3%
Housing:
Number Persons / Householda 2.9 3.1 2.1 2.5 2.6
Percent Owner Occupiedb 71.0% 73.2% 42.0% 67.2% 65.1%
Owner Occupied Median Valueb $149,600 $316,600 $376,200 $249,100 $179,900
a U.S. Bureau of the Census Bureau, 2000 and 2010 Census Data.
* Not available
2010
the most recent monthly data)
b U.S. Bureau of the Census Bureau, 2000 and 2010 American Community Survey‐1 Year Estimates.
a US Census Bureau, Population Estimates Program (data as of July 1, 2012).
c Fall Membership by Division, by Grade for Prince William County Schools, Virginia Department of Educationd Bureau of Labor Statistics, LAUS data (data are annual averages with the exception of
b Bureau of Economic Analysis (BEA), U.S. Department of Commerce. Includes cities of Manassas
2012 data estimated based upon ten‐year growth rates on BEA data from 2002 through 2011.
191
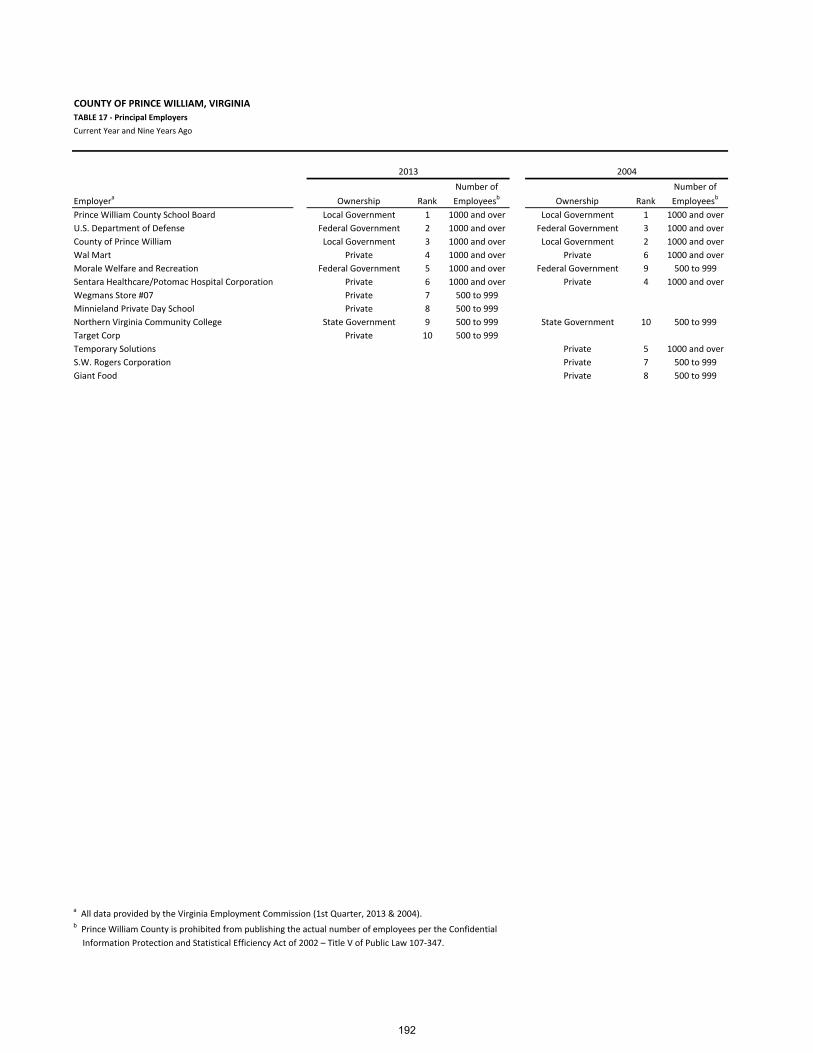
COUNTY OF PRINCE WILLIAM, VIRGINIA
TABLE 17 ‐ Principal Employers
Current Year and Nine Years Ago
Employera Ownership Rank
Number of
Employeesb Ownership Rank
Number of
Employeesb
Prince William County School Board Local Government 1 1000 and over Local Government 1 1000 and over
U.S. Department of Defense Federal Government 2 1000 and over Federal Government 3 1000 and over
County of Prince William Local Government 3 1000 and over Local Government 2 1000 and over
Wal Mart Private 4 1000 and over Private 6 1000 and over
Morale Welfare and Recreation Federal Government 5 1000 and over Federal Government 9 500 to 999
Sentara Healthcare/Potomac Hospital Corporation Private 6 1000 and over Private 4 1000 and over
Wegmans Store #07 Private 7 500 to 999
Minnieland Private Day School Private 8 500 to 999
Northern Virginia Community College State Government 9 500 to 999 State Government 10 500 to 999
Target Corp Private 10 500 to 999
Temporary Solutions Private 5 1000 and over
S.W. Rogers Corporation Private 7 500 to 999
Giant Food Private 8 500 to 999
a All data provided by the Virginia Employment Commission (1st Quarter, 2013 & 2004).b Prince William County is prohibited from publishing the actual number of employees per the Confidential
Information Protection and Statistical Efficiency Act of 2002 – Title V of Public Law 107‐347.
2013 2004
192
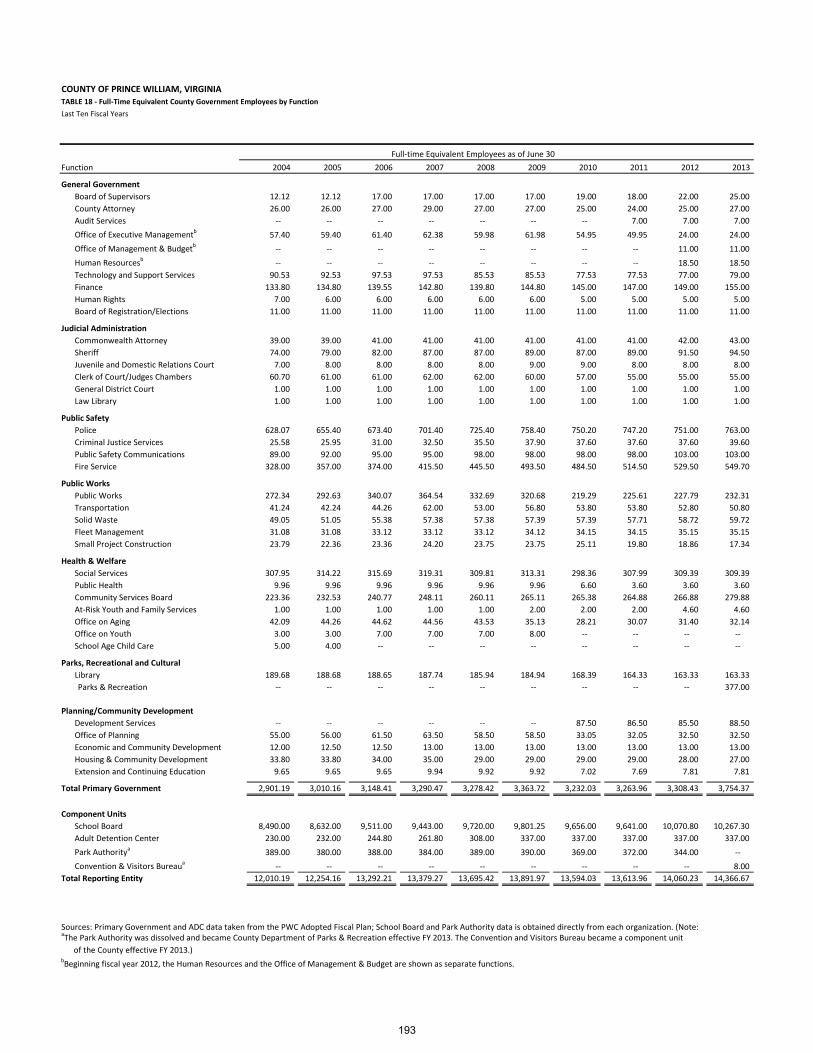
COUNTY OF PRINCE WILLIAM, VIRGINIATABLE 18 ‐ Full‐Time Equivalent County Government Employees by Function
Last Ten Fiscal Years
Function 2004 2005 2006 2007 2008 2009 2010 2011 2012 2013
General Government
Board of Supervisors 12.12 12.12 17.00 17.00 17.00 17.00 19.00 18.00 22.00 25.00
County Attorney 26.00 26.00 27.00 29.00 27.00 27.00 25.00 24.00 25.00 27.00
Audit Services ‐‐ ‐‐ ‐‐ ‐‐ ‐‐ ‐‐ ‐‐ 7.00 7.00 7.00
Office of Executive Managementb
57.40 59.40 61.40 62.38 59.98 61.98 54.95 49.95 24.00 24.00
Office of Management & Budgetb
‐‐ ‐‐ ‐‐ ‐‐ ‐‐ ‐‐ ‐‐ ‐‐ 11.00 11.00
Human Resourcesb
‐‐ ‐‐ ‐‐ ‐‐ ‐‐ ‐‐ ‐‐ ‐‐ 18.50 18.50
Technology and Support Services 90.53 92.53 97.53 97.53 85.53 85.53 77.53 77.53 77.00 79.00
Finance 133.80 134.80 139.55 142.80 139.80 144.80 145.00 147.00 149.00 155.00
Human Rights 7.00 6.00 6.00 6.00 6.00 6.00 5.00 5.00 5.00 5.00
Board of Registration/Elections 11.00 11.00 11.00 11.00 11.00 11.00 11.00 11.00 11.00 11.00
Judicial Administration
Commonwealth Attorney 39.00 39.00 41.00 41.00 41.00 41.00 41.00 41.00 42.00 43.00
Sheriff 74.00 79.00 82.00 87.00 87.00 89.00 87.00 89.00 91.50 94.50
Juvenile and Domestic Relations Court 7.00 8.00 8.00 8.00 8.00 9.00 9.00 8.00 8.00 8.00
Clerk of Court/Judges Chambers 60.70 61.00 61.00 62.00 62.00 60.00 57.00 55.00 55.00 55.00
General District Court 1.00 1.00 1.00 1.00 1.00 1.00 1.00 1.00 1.00 1.00
Law Library 1.00 1.00 1.00 1.00 1.00 1.00 1.00 1.00 1.00 1.00
Public Safety
Police 628.07 655.40 673.40 701.40 725.40 758.40 750.20 747.20 751.00 763.00
Criminal Justice Services 25.58 25.95 31.00 32.50 35.50 37.90 37.60 37.60 37.60 39.60
Public Safety Communications 89.00 92.00 95.00 95.00 98.00 98.00 98.00 98.00 103.00 103.00
Fire Service 328.00 357.00 374.00 415.50 445.50 493.50 484.50 514.50 529.50 549.70
Public Works
Public Works 272.34 292.63 340.07 364.54 332.69 320.68 219.29 225.61 227.79 232.31
Transportation 41.24 42.24 44.26 62.00 53.00 56.80 53.80 53.80 52.80 50.80
Solid Waste 49.05 51.05 55.38 57.38 57.38 57.39 57.39 57.71 58.72 59.72
Fleet Management 31.08 31.08 33.12 33.12 33.12 34.12 34.15 34.15 35.15 35.15
Small Project Construction 23.79 22.36 23.36 24.20 23.75 23.75 25.11 19.80 18.86 17.34
Health & Welfare
Social Services 307.95 314.22 315.69 319.31 309.81 313.31 298.36 307.99 309.39 309.39
Public Health 9.96 9.96 9.96 9.96 9.96 9.96 6.60 3.60 3.60 3.60
Community Services Board 223.36 232.53 240.77 248.11 260.11 265.11 265.38 264.88 266.88 279.88
At‐Risk Youth and Family Services 1.00 1.00 1.00 1.00 1.00 2.00 2.00 2.00 4.60 4.60
Office on Aging 42.09 44.26 44.62 44.56 43.53 35.13 28.21 30.07 31.40 32.14
Office on Youth 3.00 3.00 7.00 7.00 7.00 8.00 ‐‐ ‐‐ ‐‐ ‐‐
School Age Child Care 5.00 4.00 ‐‐ ‐‐ ‐‐ ‐‐ ‐‐ ‐‐ ‐‐ ‐‐
Parks, Recreational and Cultural
Library 189.68 188.68 188.65 187.74 185.94 184.94 168.39 164.33 163.33 163.33
Parks & Recreation ‐‐ ‐‐ ‐‐ ‐‐ ‐‐ ‐‐ ‐‐ ‐‐ ‐‐ 377.00
Planning/Community Development
Development Services ‐‐ ‐‐ ‐‐ ‐‐ ‐‐ ‐‐ 87.50 86.50 85.50 88.50
Office of Planning 55.00 56.00 61.50 63.50 58.50 58.50 33.05 32.05 32.50 32.50
Economic and Community Development 12.00 12.50 12.50 13.00 13.00 13.00 13.00 13.00 13.00 13.00
Housing & Community Development 33.80 33.80 34.00 35.00 29.00 29.00 29.00 29.00 28.00 27.00
Extension and Continuing Education 9.65 9.65 9.65 9.94 9.92 9.92 7.02 7.69 7.81 7.81
Total Primary Government 2,901.19 3,010.16 3,148.41 3,290.47 3,278.42 3,363.72 3,232.03 3,263.96 3,308.43 3,754.37
Component Units
School Board 8,490.00 8,632.00 9,511.00 9,443.00 9,720.00 9,801.25 9,656.00 9,641.00 10,070.80 10,267.30
Adult Detention Center 230.00 232.00 244.80 261.80 308.00 337.00 337.00 337.00 337.00 337.00
Park Authoritya
389.00 380.00 388.00 384.00 389.00 390.00 369.00 372.00 344.00 ‐‐
Convention & Visitors Bureaua
‐‐ ‐‐ ‐‐ ‐‐ ‐‐ ‐‐ ‐‐ ‐‐ ‐‐ 8.00
Total Reporting Entity 12,010.19 12,254.16 13,292.21 13,379.27 13,695.42 13,891.97 13,594.03 13,613.96 14,060.23 14,366.67
Sources: Primary Government and ADC data taken from the PWC Adopted Fiscal Plan; School Board and Park Authority data is obtained directly from each organization. (Note: aThe Park Authority was dissolved and became County Department of Parks & Recreation effective FY 2013. The Convention and Visitors Bureau became a component unit
of the County effective FY 2013.)bBeginning fiscal year 2012, the Human Resources and the Office of Management & Budget are shown as separate functions.
Full‐time Equivalent Employees as of June 30
193
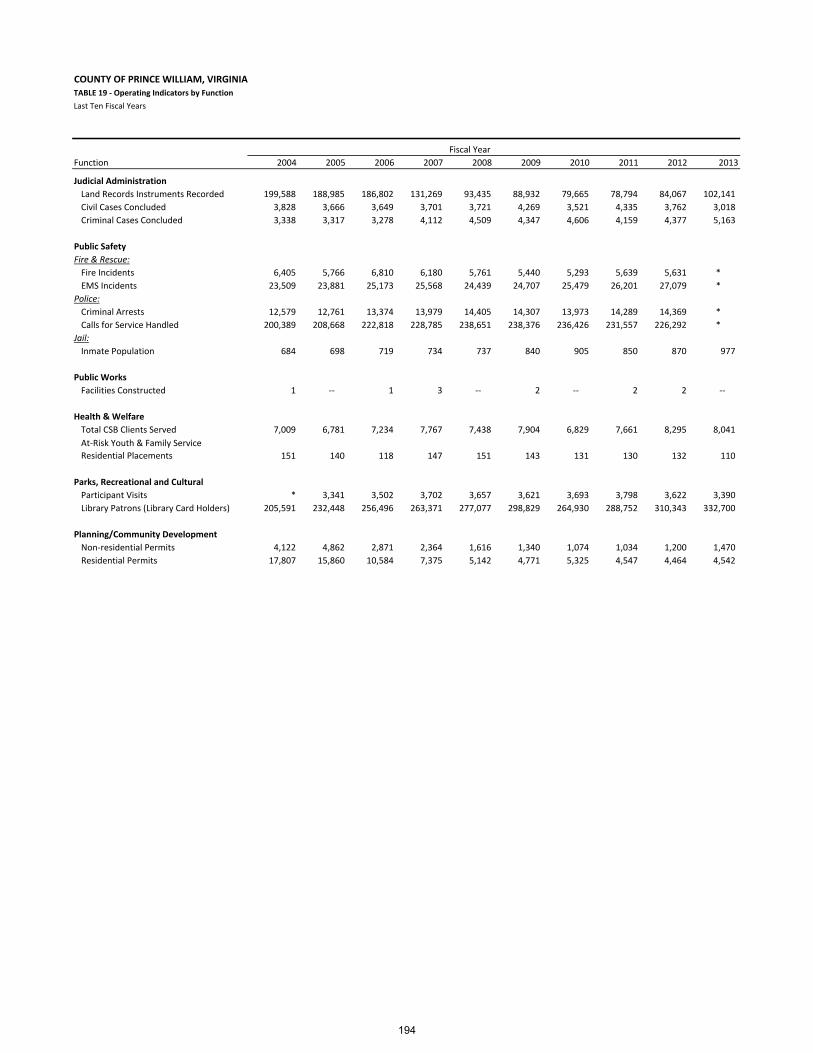
COUNTY OF PRINCE WILLIAM, VIRGINIATABLE 19 ‐ Operating Indicators by Function
Last Ten Fiscal Years
Function 2004 2005 2006 2007 2008 2009 2010 2011 2012 2013
Judicial Administration
Land Records Instruments Recorded 199,588 188,985 186,802 131,269 93,435 88,932 79,665 78,794 84,067 102,141
Civil Cases Concluded 3,828 3,666 3,649 3,701 3,721 4,269 3,521 4,335 3,762 3,018
Criminal Cases Concluded 3,338 3,317 3,278 4,112 4,509 4,347 4,606 4,159 4,377 5,163
Public Safety
Fire & Rescue:
Fire Incidents 6,405 5,766 6,810 6,180 5,761 5,440 5,293 5,639 5,631 *
EMS Incidents 23,509 23,881 25,173 25,568 24,439 24,707 25,479 26,201 27,079 *
Police:
Criminal Arrests 12,579 12,761 13,374 13,979 14,405 14,307 13,973 14,289 14,369 *
Calls for Service Handled 200,389 208,668 222,818 228,785 238,651 238,376 236,426 231,557 226,292 *
Jail:
Inmate Population 684 698 719 734 737 840 905 850 870 977
Public Works
Facilities Constructed 1 ‐‐ 1 3 ‐‐ 2 ‐‐ 2 2 ‐‐
Health & Welfare
Total CSB Clients Served 7,009 6,781 7,234 7,767 7,438 7,904 6,829 7,661 8,295 8,041
At‐Risk Youth & Family Service
Residential Placements 151 140 118 147 151 143 131 130 132 110
Parks, Recreational and Cultural
Participant Visits * 3,341 3,502 3,702 3,657 3,621 3,693 3,798 3,622 3,390
Library Patrons (Library Card Holders) 205,591 232,448 256,496 263,371 277,077 298,829 264,930 288,752 310,343 332,700
Planning/Community Development
Non‐residential Permits 4,122 4,862 2,871 2,364 1,616 1,340 1,074 1,034 1,200 1,470
Residential Permits 17,807 15,860 10,584 7,375 5,142 4,771 5,325 4,547 4,464 4,542
Fiscal Year
194
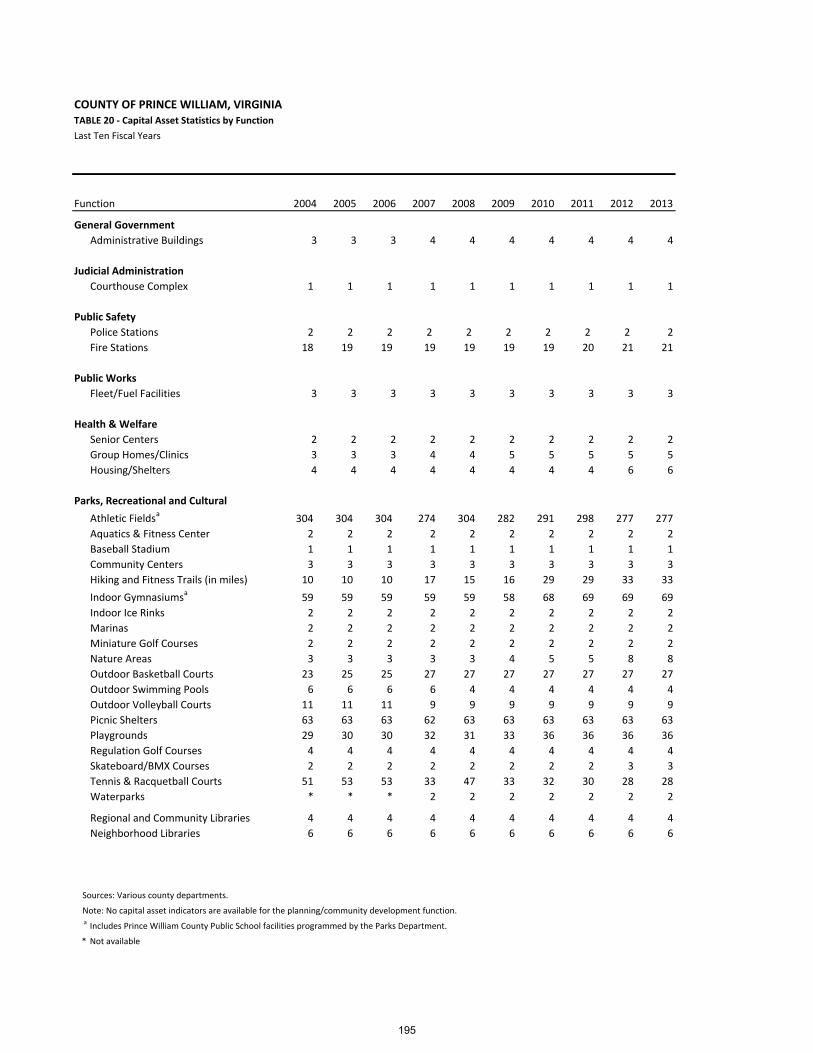
COUNTY OF PRINCE WILLIAM, VIRGINIATABLE 20 ‐ Capital Asset Statistics by Function
Last Ten Fiscal Years
Function 2004 2005 2006 2007 2008 2009 2010 2011 2012 2013
General Government
Administrative Buildings 3 3 3 4 4 4 4 4 4 4
Judicial Administration
Courthouse Complex 1 1 1 1 1 1 1 1 1 1
Public Safety
Police Stations 2 2 2 2 2 2 2 2 2 2
Fire Stations 18 19 19 19 19 19 19 20 21 21
Public Works
Fleet/Fuel Facilities 3 3 3 3 3 3 3 3 3 3
Health & Welfare
Senior Centers 2 2 2 2 2 2 2 2 2 2
Group Homes/Clinics 3 3 3 4 4 5 5 5 5 5
Housing/Shelters 4 4 4 4 4 4 4 4 6 6
Parks, Recreational and Cultural
Athletic Fieldsa 304 304 304 274 304 282 291 298 277 277
Aquatics & Fitness Center 2 2 2 2 2 2 2 2 2 2
Baseball Stadium 1 1 1 1 1 1 1 1 1 1
Community Centers 3 3 3 3 3 3 3 3 3 3
Hiking and Fitness Trails (in miles) 10 10 10 17 15 16 29 29 33 33
Indoor Gymnasiumsa 59 59 59 59 59 58 68 69 69 69
Indoor Ice Rinks 2 2 2 2 2 2 2 2 2 2
Marinas 2 2 2 2 2 2 2 2 2 2
Miniature Golf Courses 2 2 2 2 2 2 2 2 2 2
Nature Areas 3 3 3 3 3 4 5 5 8 8
Outdoor Basketball Courts 23 25 25 27 27 27 27 27 27 27
Outdoor Swimming Pools 6 6 6 6 4 4 4 4 4 4
Outdoor Volleyball Courts 11 11 11 9 9 9 9 9 9 9
Picnic Shelters 63 63 63 62 63 63 63 63 63 63
Playgrounds 29 30 30 32 31 33 36 36 36 36
Regulation Golf Courses 4 4 4 4 4 4 4 4 4 4
Skateboard/BMX Courses 2 2 2 2 2 2 2 2 3 3
Tennis & Racquetball Courts 51 53 53 33 47 33 32 30 28 28
Waterparks * * * 2 2 2 2 2 2 2
Regional and Community Libraries 4 4 4 4 4 4 4 4 4 4
Neighborhood Libraries 6 6 6 6 6 6 6 6 6 6
Sources: Various county departments.
Note: No capital asset indicators are available for the planning/community development function.a Includes Prince William County Public School facilities programmed by the Parks Department.
* Not available
195
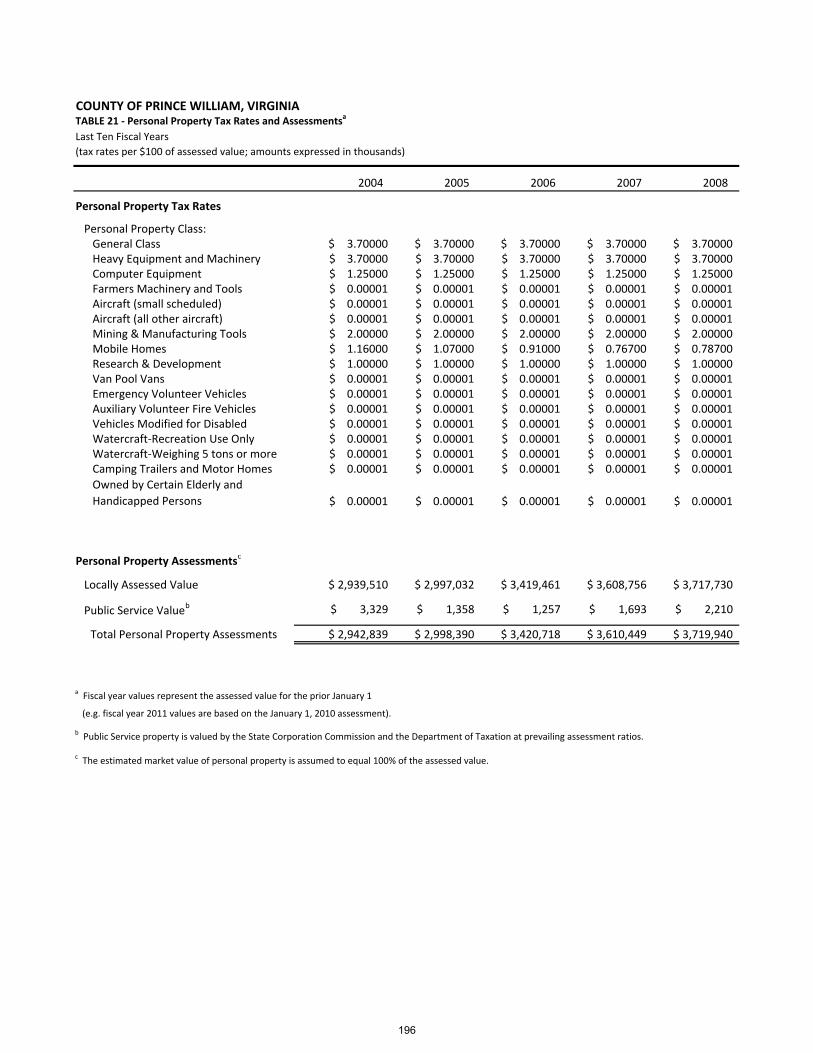
COUNTY OF PRINCE WILLIAM, VIRGINIATABLE 21 ‐ Personal Property Tax Rates and Assessmentsa
Last Ten Fiscal Years
(tax rates per $100 of assessed value; amounts expressed in thousands)
2004 2005 2006 2007 2008
Personal Property Tax Rates
Personal Property Class: General Class 3.70000$ 3.70000$ 3.70000$ 3.70000$ 3.70000$ Heavy Equipment and Machinery 3.70000$ 3.70000$ 3.70000$ 3.70000$ 3.70000$ Computer Equipment 1.25000$ 1.25000$ 1.25000$ 1.25000$ 1.25000$ Farmers Machinery and Tools 0.00001$ 0.00001$ 0.00001$ 0.00001$ 0.00001$ Aircraft (small scheduled) 0.00001$ 0.00001$ 0.00001$ 0.00001$ 0.00001$ Aircraft (all other aircraft) 0.00001$ 0.00001$ 0.00001$ 0.00001$ 0.00001$ Mining & Manufacturing Tools 2.00000$ 2.00000$ 2.00000$ 2.00000$ 2.00000$ Mobile Homes 1.16000$ 1.07000$ 0.91000$ 0.76700$ 0.78700$ Research & Development 1.00000$ 1.00000$ 1.00000$ 1.00000$ 1.00000$ Van Pool Vans 0.00001$ 0.00001$ 0.00001$ 0.00001$ 0.00001$ Emergency Volunteer Vehicles 0.00001$ 0.00001$ 0.00001$ 0.00001$ 0.00001$ Auxiliary Volunteer Fire Vehicles 0.00001$ 0.00001$ 0.00001$ 0.00001$ 0.00001$ Vehicles Modified for Disabled 0.00001$ 0.00001$ 0.00001$ 0.00001$ 0.00001$ Watercraft‐Recreation Use Only 0.00001$ 0.00001$ 0.00001$ 0.00001$ 0.00001$ Watercraft‐Weighing 5 tons or more 0.00001$ 0.00001$ 0.00001$ 0.00001$ 0.00001$ Camping Trailers and Motor Homes 0.00001$ 0.00001$ 0.00001$ 0.00001$ 0.00001$
Owned by Certain Elderly and
Handicapped Persons 0.00001$ 0.00001$ 0.00001$ 0.00001$ 0.00001$
Personal Property Assessmentsc
Locally Assessed Value 2,939,510$ 2,997,032$ 3,419,461$ 3,608,756$ 3,717,730$
Public Service Valueb 3,329$ 1,358$ 1,257$ 1,693$ 2,210$
Total Personal Property Assessments 2,942,839$ 2,998,390$ 3,420,718$ 3,610,449$ 3,719,940$
a Fiscal year values represent the assessed value for the prior January 1
(e.g. fiscal year 2011 values are based on the January 1, 2010 assessment).
b Public Service property is valued by the State Corporation Commission and the Department of Taxation at prevailing assessment ratios.
c The estimated market value of personal property is assumed to equal 100% of the assessed value.
196
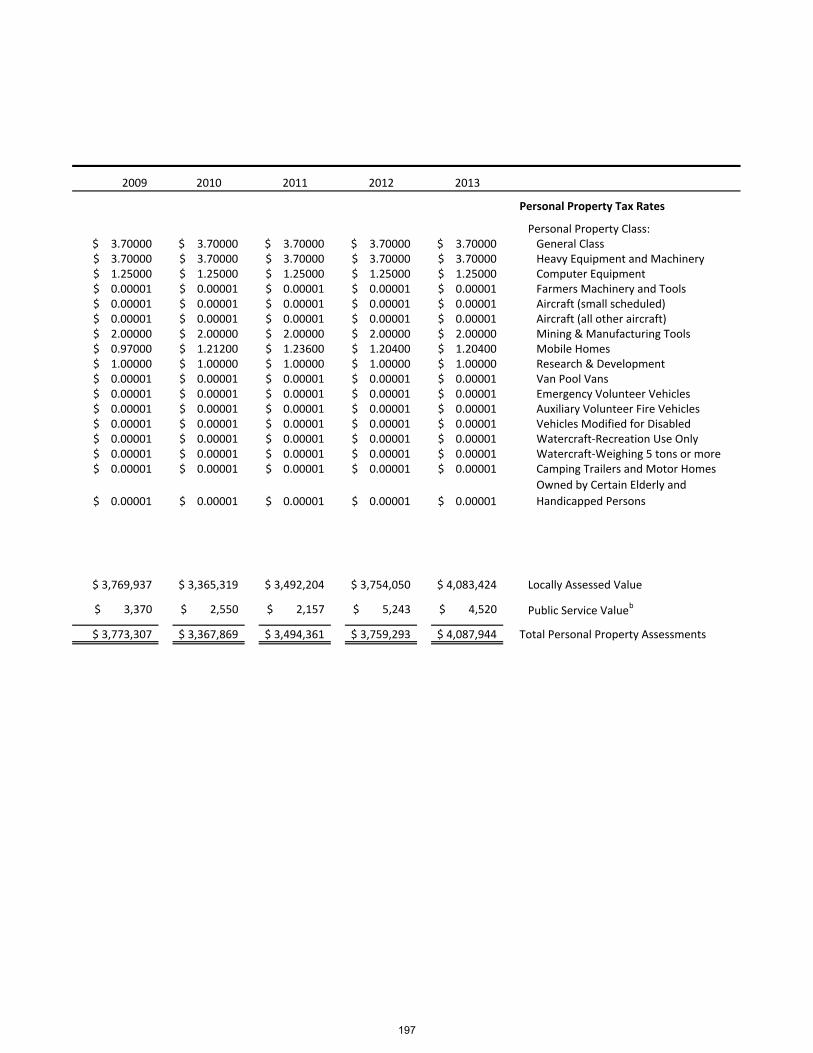
2009 2010 2011 2012 2013
Personal Property Tax Rates
Personal Property Class:3.70000$ 3.70000$ 3.70000$ 3.70000$ 3.70000$ General Class3.70000$ 3.70000$ 3.70000$ 3.70000$ 3.70000$ Heavy Equipment and Machinery1.25000$ 1.25000$ 1.25000$ 1.25000$ 1.25000$ Computer Equipment0.00001$ 0.00001$ 0.00001$ 0.00001$ 0.00001$ Farmers Machinery and Tools0.00001$ 0.00001$ 0.00001$ 0.00001$ 0.00001$ Aircraft (small scheduled)0.00001$ 0.00001$ 0.00001$ 0.00001$ 0.00001$ Aircraft (all other aircraft)2.00000$ 2.00000$ 2.00000$ 2.00000$ 2.00000$ Mining & Manufacturing Tools 0.97000$ 1.21200$ 1.23600$ 1.20400$ 1.20400$ Mobile Homes1.00000$ 1.00000$ 1.00000$ 1.00000$ 1.00000$ Research & Development0.00001$ 0.00001$ 0.00001$ 0.00001$ 0.00001$ Van Pool Vans0.00001$ 0.00001$ 0.00001$ 0.00001$ 0.00001$ Emergency Volunteer Vehicles0.00001$ 0.00001$ 0.00001$ 0.00001$ 0.00001$ Auxiliary Volunteer Fire Vehicles0.00001$ 0.00001$ 0.00001$ 0.00001$ 0.00001$ Vehicles Modified for Disabled0.00001$ 0.00001$ 0.00001$ 0.00001$ 0.00001$ Watercraft‐Recreation Use Only0.00001$ 0.00001$ 0.00001$ 0.00001$ 0.00001$ Watercraft‐Weighing 5 tons or more0.00001$ 0.00001$ 0.00001$ 0.00001$ 0.00001$ Camping Trailers and Motor Homes
0.00001$ 0.00001$ 0.00001$ 0.00001$ 0.00001$
Owned by Certain Elderly and
Handicapped Persons
3,769,937$ 3,365,319$ 3,492,204$ 3,754,050$ 4,083,424$ Locally Assessed Value
3,370$ 2,550$ 2,157$ 5,243$ 4,520$ Public Service Valueb
3,773,307$ 3,367,869$ 3,494,361$ 3,759,293$ 4,087,944$ Total Personal Property Assessments
197
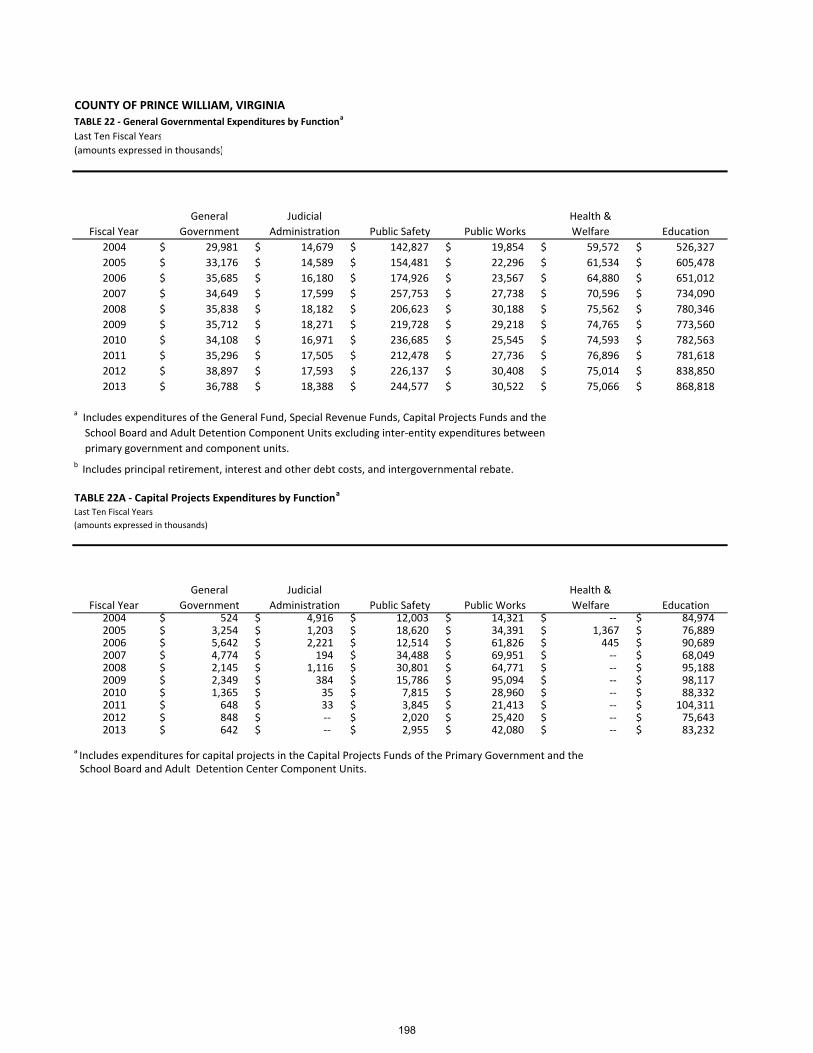
COUNTY OF PRINCE WILLIAM, VIRGINIATABLE 22 ‐ General Governmental Expenditures by Functiona
Last Ten Fiscal Years
(amounts expressed in thousands)
Fiscal Year
General
Government
Judicial
Administration Public Safety Public Works
Health &
Welfare Education
2004 $ 29,981 $ 14,679 $ 142,827 $ 19,854 $ 59,572 $ 526,327
2005 $ 33,176 $ 14,589 $ 154,481 $ 22,296 $ 61,534 $ 605,478
2006 $ 35,685 $ 16,180 $ 174,926 $ 23,567 $ 64,880 $ 651,012
2007 $ 34,649 $ 17,599 $ 257,753 $ 27,738 $ 70,596 $ 734,090
2008 $ 35,838 $ 18,182 $ 206,623 $ 30,188 $ 75,562 $ 780,346
2009 $ 35,712 $ 18,271 $ 219,728 $ 29,218 $ 74,765 $ 773,560
2010 $ 34,108 $ 16,971 $ 236,685 $ 25,545 $ 74,593 $ 782,563
2011 $ 35,296 $ 17,505 $ 212,478 $ 27,736 $ 76,896 $ 781,618
2012 $ 38,897 $ 17,593 $ 226,137 $ 30,408 $ 75,014 $ 838,850
2013 $ 36,788 $ 18,388 $ 244,577 $ 30,522 $ 75,066 $ 868,818
School Board and Adult Detention Component Units excluding inter‐entity expenditures between
primary government and component units.
TABLE 22A ‐ Capital Projects Expenditures by Functiona
Last Ten Fiscal Years
(amounts expressed in thousands)
Fiscal Year
General
Government
Judicial
Administration Public Safety Public Works
Health &
Welfare Education2004 $ 524 $ 4,916 $ 12,003 $ 14,321 $ ‐‐ $ 84,974 2005 $ 3,254 $ 1,203 $ 18,620 $ 34,391 $ 1,367 $ 76,889 2006 $ 5,642 $ 2,221 $ 12,514 $ 61,826 $ 445 $ 90,689 2007 $ 4,774 $ 194 $ 34,488 $ 69,951 $ ‐‐ $ 68,049 2008 $ 2,145 $ 1,116 $ 30,801 $ 64,771 $ ‐‐ $ 95,188 2009 $ 2,349 $ 384 $ 15,786 $ 95,094 $ ‐‐ $ 98,117 2010 $ 1,365 $ 35 $ 7,815 $ 28,960 $ ‐‐ $ 88,332 2011 $ 648 $ 33 $ 3,845 $ 21,413 $ ‐‐ $ 104,311 2012 $ 848 $ ‐‐ $ 2,020 $ 25,420 $ ‐‐ $ 75,643 2013 $ 642 $ ‐‐ $ 2,955 $ 42,080 $ ‐‐ $ 83,232
a Includes expenditures for capital projects in the Capital Projects Funds of the Primary Government and the School Board and Adult Detention Center Component Units.
a Includes expenditures of the General Fund, Special Revenue Funds, Capital Projects Funds and the
b Includes principal retirement, interest and other debt costs, and intergovernmental rebate.
198
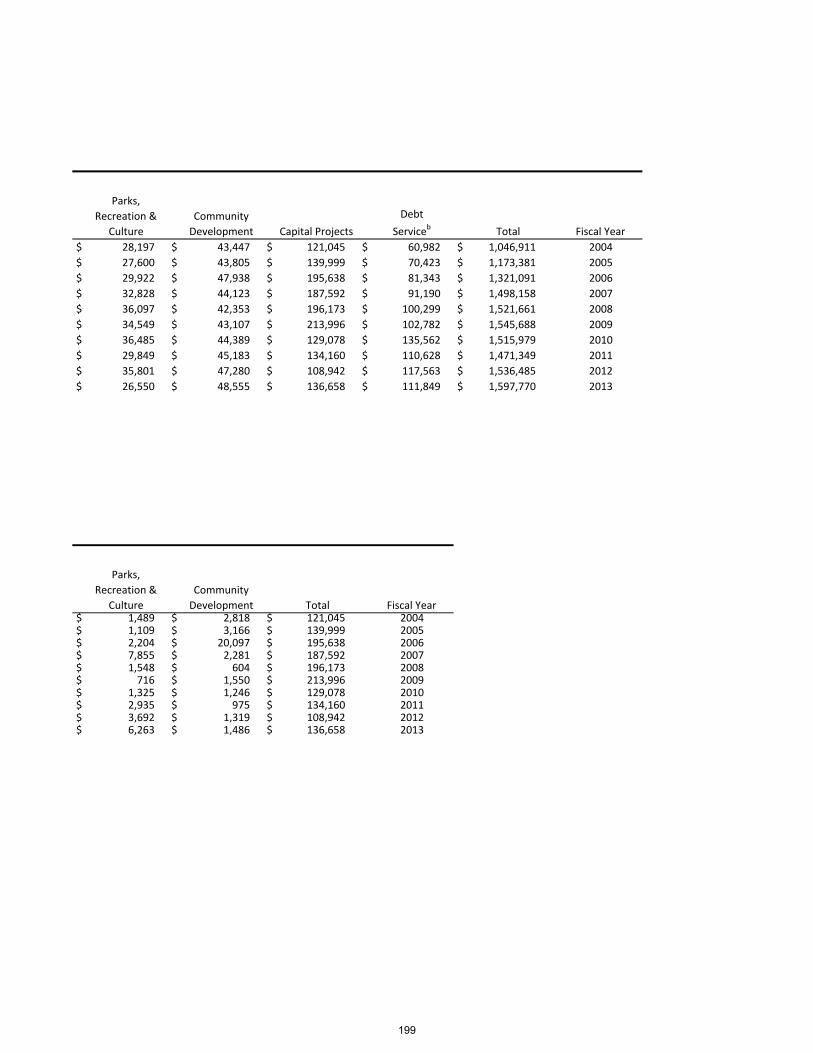
Parks,
Recreation &
Culture
Community
Development Capital Projects
Debt
Serviceb Total Fiscal Year
$ 28,197 $ 43,447 $ 121,045 $ 60,982 $ 1,046,911 2004
$ 27,600 $ 43,805 $ 139,999 $ 70,423 $ 1,173,381 2005
$ 29,922 $ 47,938 $ 195,638 $ 81,343 $ 1,321,091 2006
$ 32,828 $ 44,123 $ 187,592 $ 91,190 $ 1,498,158 2007
$ 36,097 $ 42,353 $ 196,173 $ 100,299 $ 1,521,661 2008
$ 34,549 $ 43,107 $ 213,996 $ 102,782 $ 1,545,688 2009
$ 36,485 $ 44,389 $ 129,078 $ 135,562 $ 1,515,979 2010
$ 29,849 $ 45,183 $ 134,160 $ 110,628 $ 1,471,349 2011
$ 35,801 $ 47,280 $ 108,942 $ 117,563 $ 1,536,485 2012
$ 26,550 $ 48,555 $ 136,658 $ 111,849 $ 1,597,770 2013
Parks,
Recreation &
Culture
Community
Development Total Fiscal Year$ 1,489 $ 2,818 $ 121,045 2004$ 1,109 $ 3,166 $ 139,999 2005$ 2,204 $ 20,097 $ 195,638 2006$ 7,855 $ 2,281 $ 187,592 2007$ 1,548 $ 604 $ 196,173 2008$ 716 $ 1,550 $ 213,996 2009$ 1,325 $ 1,246 $ 129,078 2010$ 2,935 $ 975 $ 134,160 2011$ 3,692 $ 1,319 $ 108,942 2012$ 6,263 $ 1,486 $ 136,658 2013
199
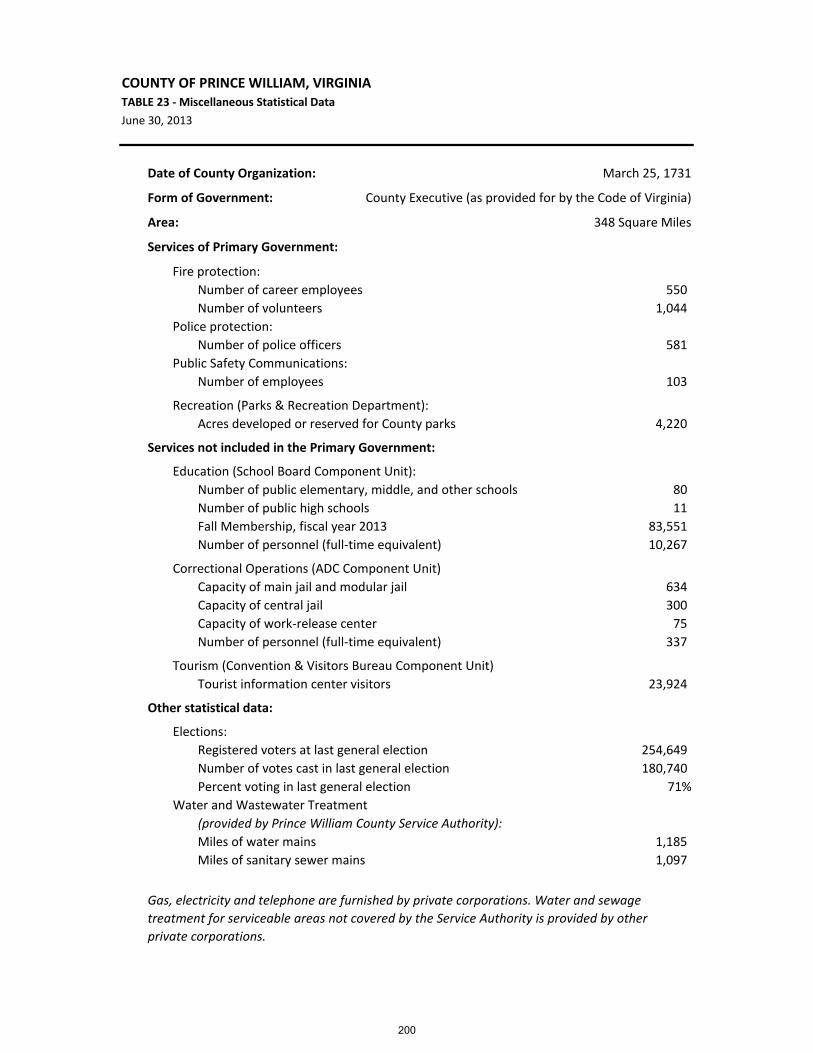
COUNTY OF PRINCE WILLIAM, VIRGINIATABLE 23 ‐ Miscellaneous Statistical Data
June 30, 2013
Date of County Organization: March 25, 1731
Form of Government: County Executive (as provided for by the Code of Virginia)
Area: 348 Square Miles
Services of Primary Government:
Fire protection:
Number of career employees 550
Number of volunteers 1,044
Police protection:
Number of police officers 581
Public Safety Communications:
Number of employees 103
Recreation (Parks & Recreation Department):
Acres developed or reserved for County parks 4,220
Services not included in the Primary Government:
Education (School Board Component Unit):
Number of public elementary, middle, and other schools 80
Number of public high schools 11
Fall Membership, fiscal year 2013 83,551
Number of personnel (full‐time equivalent) 10,267
Correctional Operations (ADC Component Unit)
Capacity of main jail and modular jail 634
Capacity of central jail 300
Capacity of work‐release center 75
Number of personnel (full‐time equivalent) 337
Tourism (Convention & Visitors Bureau Component Unit)
Tourist information center visitors 23,924
Other statistical data:
Elections:
Registered voters at last general election 254,649
Number of votes cast in last general election 180,740
Percent voting in last general election 71%
Water and Wastewater Treatment
(provided by Prince William County Service Authority):
Miles of water mains 1,185
Miles of sanitary sewer mains 1,097
Gas, electricity and telephone are furnished by private corporations. Water and sewage
treatment for serviceable areas not covered by the Service Authority is provided by other
private corporations.
200
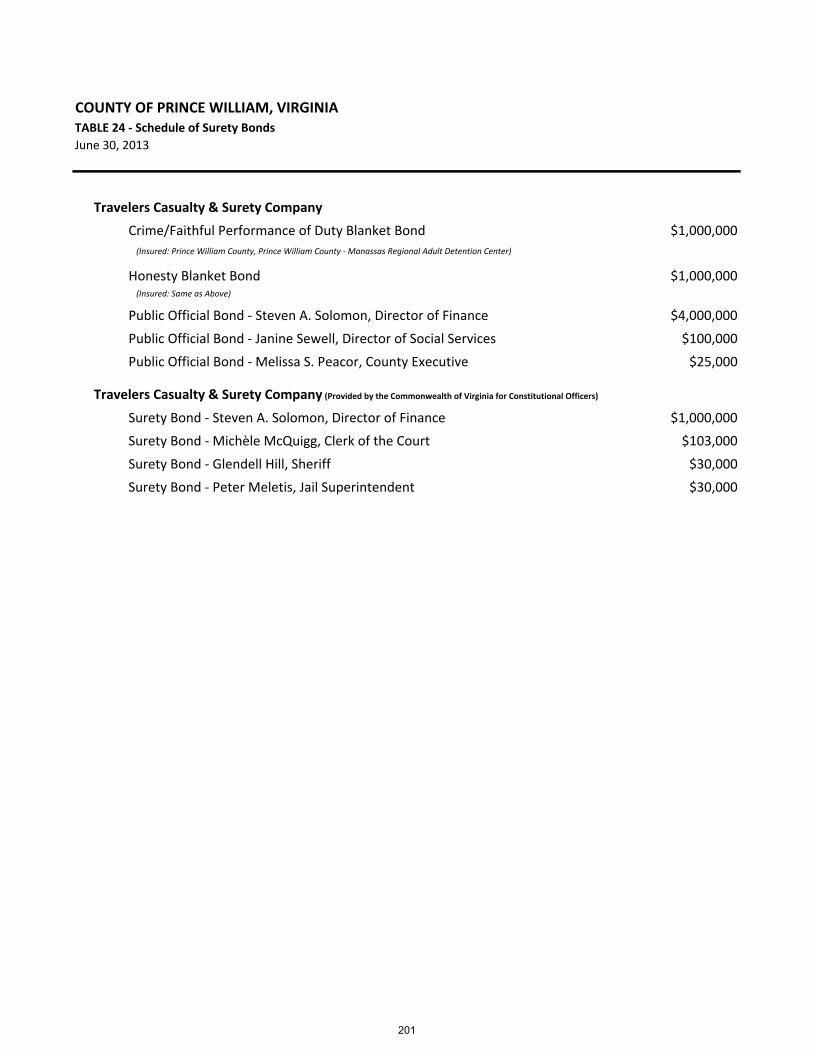
COUNTY OF PRINCE WILLIAM, VIRGINIATABLE 24 ‐ Schedule of Surety Bonds
June 30, 2013
Travelers Casualty & Surety Company
Crime/Faithful Performance of Duty Blanket Bond $1,000,000
(Insured: Prince William County, Prince William County ‐ Manassas Regional Adult Detention Center)
Honesty Blanket Bond $1,000,000 (Insured: Same as Above)
Public Official Bond ‐ Steven A. Solomon, Director of Finance $4,000,000
Public Official Bond ‐ Janine Sewell, Director of Social Services $100,000
Public Official Bond ‐ Melissa S. Peacor, County Executive $25,000
Travelers Casualty & Surety Company (Provided by the Commonwealth of Virginia for Constitutional Officers)
Surety Bond ‐ Steven A. Solomon, Director of Finance $1,000,000
Surety Bond ‐ Michèle McQuigg, Clerk of the Court $103,000
Surety Bond ‐ Glendell Hill, Sheriff $30,000
Surety Bond ‐ Peter Meletis, Jail Superintendent $30,000
201

202

Page 1 of 8
COUNTY OF PRINCE WILLIAM, VIRGINIASCHEDULE OF EXPENDITURES OF FEDERAL AWARDSFor the year ended June 30, 2013(amounts expressed in thousands)
CFDA Pass‐Through Agency FederalFederal Granting Agency/Recipient Pass‐Through Agency/Grant Program Number Identifying Number Expenditures
OFFICE OF NATIONAL DRUG CONTROL POLICY:
* Pass‐Through Payments from University of Maryland:High Intensity Drug Trafficking Area (HIDTA) Project 07.000 not available 625
Total Office of National Drug Control Policy 625
DEPARTMENT OF AGRICULTURE:
* Direct Payments:Child & Adult Care Food Program 10.558 not applicable 23
* Pass‐Through Payments from Commonwealth of Virginia:* Department of Aging:
Nutrition Services Incentive 10.570 45702‐40573 0* Department of Agriculture:
Food Donation ‐ Commodities 10.550 not available 4
Fresh Fruit and Vegetable Program 10.582 17901‐40599 444
Team Nutrition Grant 10.574 not applicable 15
Distance Learning ‐ Forest Service ‐ Conservation Ed 10.000 not applicable 300
* Department of Social Services:State Administrative Matching Grant for Food Stamp Program 10.561 45213‐90303 2,894
45213‐9030446003‐9010346003‐9010446003‐9021246003‐9110346003‐9110446003‐9140346003‐9140446003‐9040346003‐9040446006‐9022346006‐9022446006‐9070346006‐90704
Child Nutrition Cluster1
* Department of Agriculture & Consumer Services:National School Lunch Program ‐ Commodities 10.5552 not available 1,714
* Department of Education:School Breakfast Program 10.5533 17901‐40591 3,843
National School Lunch Program 10.5552 17901‐40623 15,099
* Department of Juvenile Justice:School Breakfast Program 10.5533 36001‐00000 24
National School Lunch Program 10.5552 36001‐00000 5036003‐00000
Total Department of Agriculture 24,410
1 Child Nutrition Cluster Total $20,730
2 CFDA 10.555 Total $16,863
3 CFDA 10.553 Total $3,867
See accompanying notes to the Schedule of Expenditures of Federal Awards.203

Page 2 of 8
COUNTY OF PRINCE WILLIAM, VIRGINIASCHEDULE OF EXPENDITURES OF FEDERAL AWARDSFor the year ended June 30, 2013(amounts expressed in thousands)
CFDA Pass‐Through Agency FederalFederal Granting Agency/Recipient Pass‐Through Agency/Grant Program Number Identifying Number Expenditures
DEPARTMENT OF DEFENSE:
* Direct Payments:Junior ROTC Program 12.000 not applicable 686
Total Department of Defense 686
DEPARTMENT OF HOUSING AND URBAN DEVELOPMENT:Direct Payments:
* Housing Counseling Assistance Program 14.169 not applicable 6
Community Development Block Grants / Entitlement Grants 14.2184 not applicable 1,678
Supportive Housing Program 14.235 not applicable 552
HOME Investment Partnerships Program 14.239 not applicable 666
Economic Development Initiative‐Special Project, Neighborhood Initiati 14.251 not applicable 22
Section 8 Housing Choice Vouchers 14.871 not applicable 25,275
Community Development Block Grant ARRA Entitlement Grants (CDBG‐ 14.2534 not applicable 13
Pass‐Through Payments from Northern Virginia Planning District Commission:* Housing Opportunities for Persons with AIDS 14.241 not available 268
Total Department of Housing and Urban Development 28,480
DEPARTMENT OF THE INTERIOR:Direct Payments:
* Payments in Lieu of Taxes ‐ Public Law # 97‐258 15.226 not applicable 66
Pass‐Through Payments from Commonwealth of Virginia:* * Department of Historic Resources:
American Battlefield Protection 15.926 50205‐66018 36
Total Department of the Interior 102
Pass‐Through Payments from Commonwealth of Virginia:* * Department of Historic Resources:
Historic Preservation Fund Grants‐In‐Aid 15.904 50205‐66015 0
4 CFDA 14.218 & 14.253 Total $1,691
See accompanying notes to the Schedule of Expenditures of Federal Awards.204
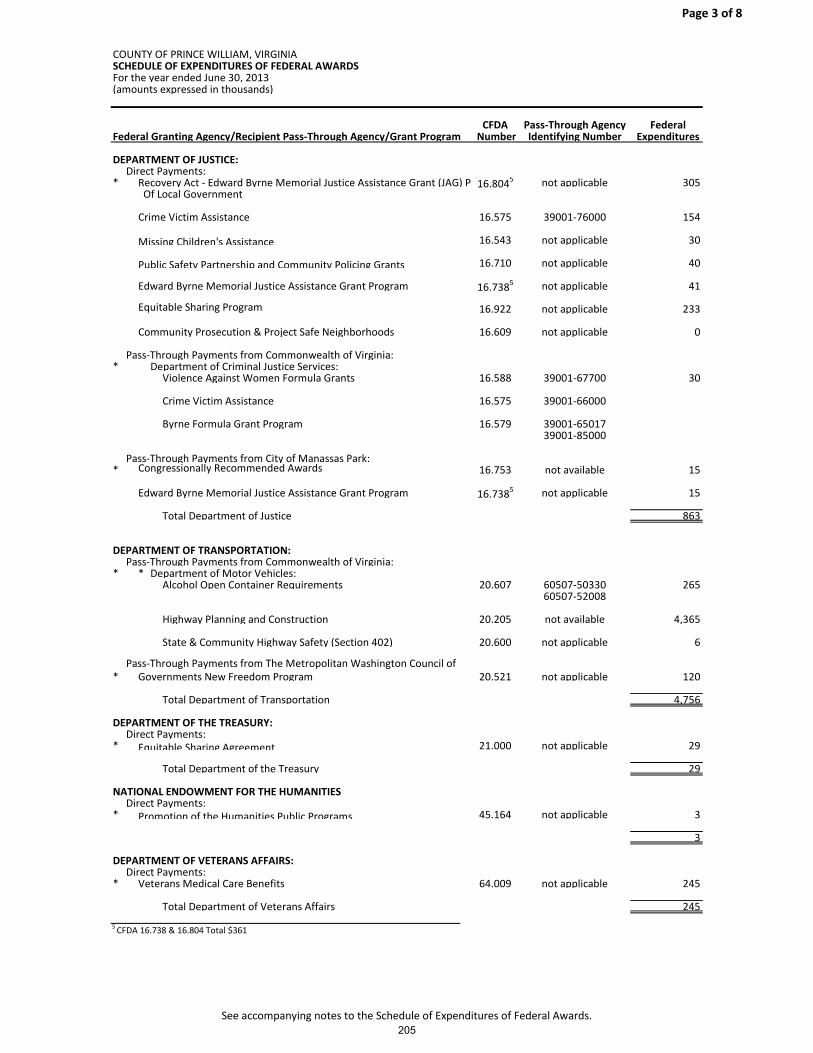
Page 3 of 8
COUNTY OF PRINCE WILLIAM, VIRGINIASCHEDULE OF EXPENDITURES OF FEDERAL AWARDSFor the year ended June 30, 2013(amounts expressed in thousands)
CFDA Pass‐Through Agency FederalFederal Granting Agency/Recipient Pass‐Through Agency/Grant Program Number Identifying Number Expenditures
DEPARTMENT OF JUSTICE:Direct Payments:
* Recovery Act ‐ Edward Byrne Memorial Justice Assistance Grant (JAG) P 16.8045 not applicable 305 Of Local Government
Crime Victim Assistance 16.575 39001‐76000 154
Missing Children's Assistance 16.543 not applicable 30
Public Safety Partnership and Community Policing Grants 16.710 not applicable 40
Edward Byrne Memorial Justice Assistance Grant Program 16.7385 not applicable 41
Equitable Sharing Program 16.922 not applicable 233
Community Prosecution & Project Safe Neighborhoods 16.609 not applicable 0
Pass‐Through Payments from Commonwealth of Virginia:* Department of Criminal Justice Services:
Violence Against Women Formula Grants 16.588 39001‐67700 30
Crime Victim Assistance 16.575 39001‐66000
Byrne Formula Grant Program 16.579 39001‐6501739001‐85000
Pass‐Through Payments from City of Manassas Park:* Congressionally Recommended Awards 16.753 not available 15
Edward Byrne Memorial Justice Assistance Grant Program 16.7385 not applicable 15
Total Department of Justice 863
DEPARTMENT OF TRANSPORTATION:Pass‐Through Payments from Commonwealth of Virginia:
* * Department of Motor Vehicles:Alcohol Open Container Requirements 20.607 60507‐50330 265
60507‐52008
Highway Planning and Construction 20.205 not available 4,365
State & Community Highway Safety (Section 402) 20.600 not applicable 6
Pass‐Through Payments from The Metropolitan Washington Council of * Governments New Freedom Program 20.521 not applicable 120
Total Department of Transportation 4,756
DEPARTMENT OF THE TREASURY:Direct Payments:
* Equitable Sharing Agreement 21.000 not applicable 29
Total Department of the Treasury 29
NATIONAL ENDOWMENT FOR THE HUMANITIESDirect Payments:
* Promotion of the Humanities Public Programs 45.164 not applicable 3
3
DEPARTMENT OF VETERANS AFFAIRS:Direct Payments:
* Veterans Medical Care Benefits 64.009 not applicable 245
Total Department of Veterans Affairs 245
5 CFDA 16.738 & 16.804 Total $361
See accompanying notes to the Schedule of Expenditures of Federal Awards.205
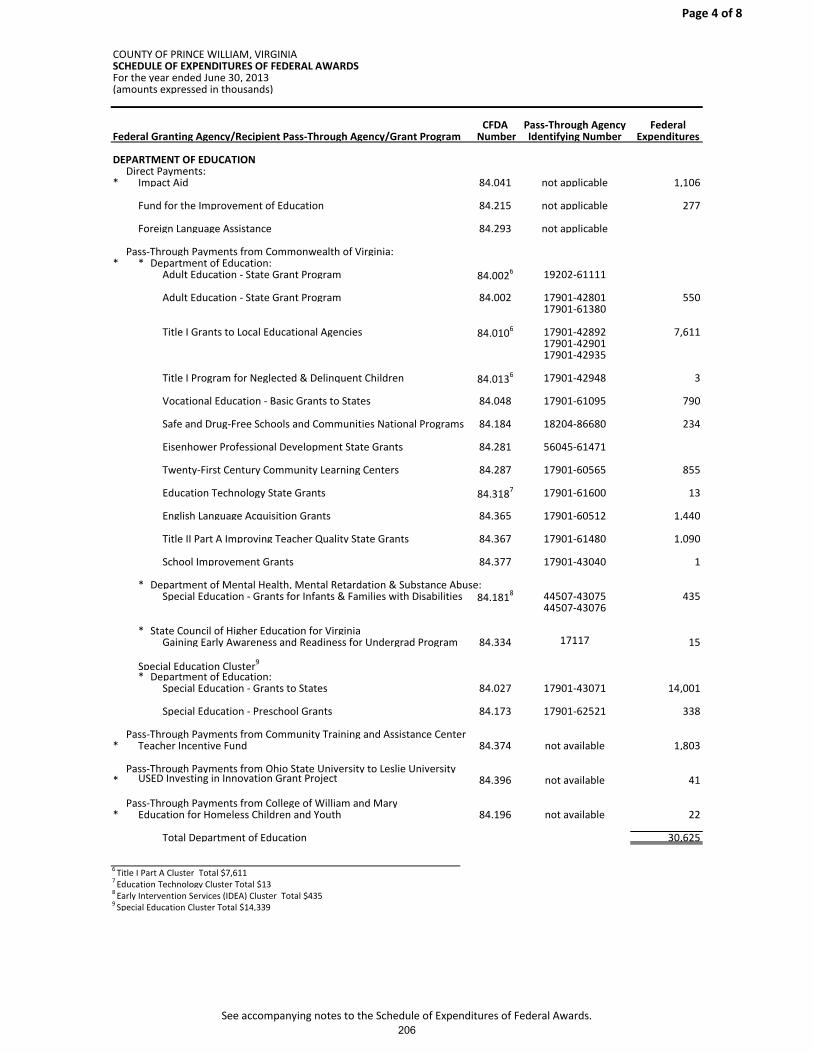
Page 4 of 8
COUNTY OF PRINCE WILLIAM, VIRGINIASCHEDULE OF EXPENDITURES OF FEDERAL AWARDSFor the year ended June 30, 2013(amounts expressed in thousands)
CFDA Pass‐Through Agency FederalFederal Granting Agency/Recipient Pass‐Through Agency/Grant Program Number Identifying Number Expenditures
DEPARTMENT OF EDUCATIONDirect Payments:
* Impact Aid 84.041 not applicable 1,106
Fund for the Improvement of Education 84.215 not applicable 277
Foreign Language Assistance 84.293 not applicable
Pass‐Through Payments from Commonwealth of Virginia:* * Department of Education:
Adult Education ‐ State Grant Program 84.0026 19202‐61111
Adult Education ‐ State Grant Program 84.002 17901‐42801 55017901‐61380
Title I Grants to Local Educational Agencies 84.0106 17901‐42892 7,61117901‐4290117901‐42935
Title I Program for Neglected & Delinquent Children 84.0136 17901‐42948 3
Vocational Education ‐ Basic Grants to States 84.048 17901‐61095 790
Safe and Drug‐Free Schools and Communities National Programs 84.184 18204‐86680 234
Eisenhower Professional Development State Grants 84.281 56045‐61471
Twenty‐First Century Community Learning Centers 84.287 17901‐60565 855
Education Technology State Grants 84.3187 17901‐61600 13
English Language Acquisition Grants 84.365 17901‐60512 1,440
Title II Part A Improving Teacher Quality State Grants 84.367 17901‐61480 1,090
School Improvement Grants 84.377 17901‐43040 1
* Department of Mental Health, Mental Retardation & Substance Abuse:Special Education ‐ Grants for Infants & Families with Disabilities 84.1818 44507‐43075 435
44507‐43076
* State Council of Higher Education for Virginia Gaining Early Awareness and Readiness for Undergrad Program 84.334 17117 15
Special Education Cluster9
* Department of Education:Special Education ‐ Grants to States 84.027 17901‐43071 14,001
Special Education ‐ Preschool Grants 84.173 17901‐62521 338
Pass‐Through Payments from Community Training and Assistance Center* Teacher Incentive Fund 84.374 not available 1,803
Pass‐Through Payments from Ohio State University to Leslie University* USED Investing in Innovation Grant Project 84.396 not available 41
Pass‐Through Payments from College of William and Mary* Education for Homeless Children and Youth 84.196 not available 22
Total Department of Education 30,625
6 Title I Part A Cluster Total $7,6117 Education Technology Cluster Total $138 Early Intervention Services (IDEA) Cluster Total $435
9 Special Education Cluster Total $14,339
See accompanying notes to the Schedule of Expenditures of Federal Awards.206
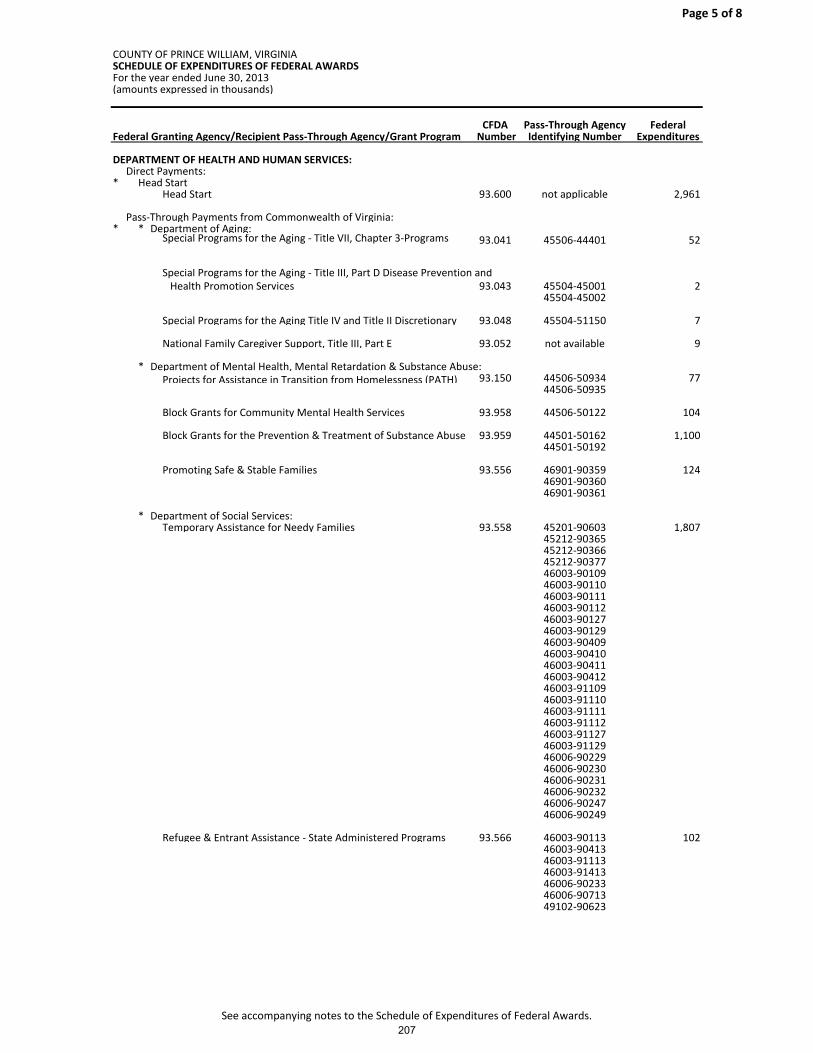
Page 5 of 8
COUNTY OF PRINCE WILLIAM, VIRGINIASCHEDULE OF EXPENDITURES OF FEDERAL AWARDSFor the year ended June 30, 2013(amounts expressed in thousands)
CFDA Pass‐Through Agency FederalFederal Granting Agency/Recipient Pass‐Through Agency/Grant Program Number Identifying Number Expenditures
DEPARTMENT OF HEALTH AND HUMAN SERVICES:Direct Payments:
* Head Start Head Start 93.600 not applicable 2,961
Pass‐Through Payments from Commonwealth of Virginia:* * Department of Aging:
Special Programs for the Aging ‐ Title VII, Chapter 3‐Programs 93.041 45506‐44401 52
Special Programs for the Aging ‐ Title III, Part D Disease Prevention and Health Promotion Services 93.043 45504‐45001 2
45504‐45002
Special Programs for the Aging Title IV and Title II Discretionary 93.048 45504‐51150 7
National Family Caregiver Support, Title III, Part E 93.052 not available 9
* Department of Mental Health, Mental Retardation & Substance Abuse:Projects for Assistance in Transition from Homelessness (PATH) 93.150 44506‐50934 77
44506‐50935
Block Grants for Community Mental Health Services 93.958 44506‐50122 104
Block Grants for the Prevention & Treatment of Substance Abuse 93.959 44501‐50162 1,10044501‐50192
Promoting Safe & Stable Families 93.556 46901‐90359 12446901‐9036046901‐90361
* Department of Social Services:Temporary Assistance for Needy Families 93.558 45201‐90603 1,807
45212‐9036545212‐9036645212‐9037746003‐9010946003‐9011046003‐9011146003‐9011246003‐9012746003‐9012946003‐9040946003‐9041046003‐9041146003‐9041246003‐9110946003‐9111046003‐9111146003‐9111246003‐9112746003‐9112946006‐9022946006‐9023046006‐9023146006‐9023246006‐9024746006‐90249
Refugee & Entrant Assistance ‐ State Administered Programs 93.566 46003‐90113 10246003‐9041346003‐9111346003‐9141346006‐9023346006‐9071349102‐90623
See accompanying notes to the Schedule of Expenditures of Federal Awards.207

Page 6 of 8
COUNTY OF PRINCE WILLIAM, VIRGINIASCHEDULE OF EXPENDITURES OF FEDERAL AWARDSFor the year ended June 30, 2013(amounts expressed in thousands)
CFDA Pass‐Through Agency FederalFederal Granting Agency/Recipient Pass‐Through Agency/Grant Program Number Identifying Number Expenditures
DEPARTMENT OF HEALTH AND HUMAN SERVICES (cont'd):Pass‐Through Payments from Commonwealth of Virginia (cont'd):
* * Department of Social Services (cont'd):Low‐Income Home Energy Assistance 93.568 46003‐90114 73
46003‐9011546003‐9111446003‐9111546006‐9023446006‐90235
Chafee Education and Training Vouchers Program (ETV) 93.599 46901‐90353 3
Child Welfare Services State Grants 93.645 46003‐91131 646006‐90251
Foster Care ‐ Title IV‐E 93.658 46003‐90105 1,40046003‐9010646003‐9014846003‐9020946003‐9040546003‐9040646003‐9040746003‐9044746003‐9044846003‐9110546003‐9110646003‐9110746003‐9113346003‐9113846003‐9114746003‐9114846003‐9140546003‐9140646003‐9140746003‐9143346003‐9143846003‐9144746003‐9144846006‐9022546006‐9022646006‐9022746006‐9025346006‐9025846006‐9026746006‐9026846006‐9070546006‐9070646006‐9070746006‐9073346006‐9073846006‐9074746006‐9074846901‐9004746901‐9063646901‐9063746901‐9063946901‐9065746901‐90658
Adoption Assistance 93.659 46003‐90108 56546003‐9021446003‐9040846003‐9110846003‐9140846006‐9022846006‐9070846903‐9060646903‐9060746903‐90627
See accompanying notes to the Schedule of Expenditures of Federal Awards.208
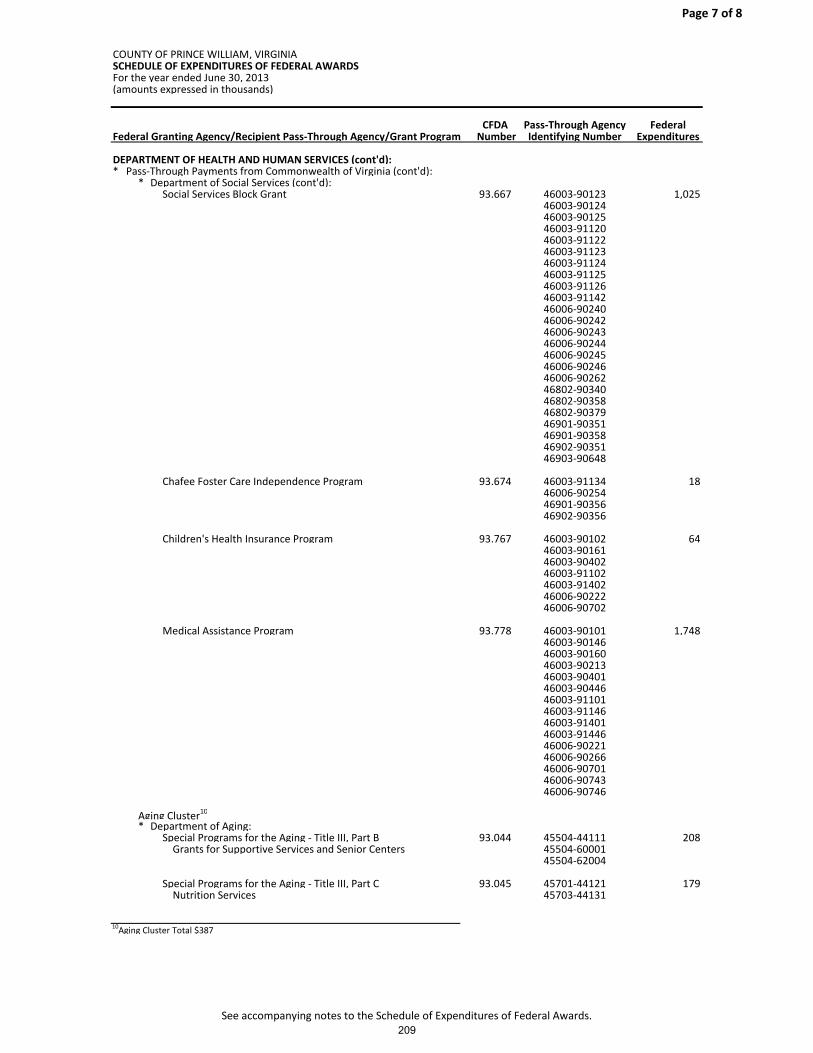
Page 7 of 8
COUNTY OF PRINCE WILLIAM, VIRGINIASCHEDULE OF EXPENDITURES OF FEDERAL AWARDSFor the year ended June 30, 2013(amounts expressed in thousands)
CFDA Pass‐Through Agency FederalFederal Granting Agency/Recipient Pass‐Through Agency/Grant Program Number Identifying Number Expenditures
DEPARTMENT OF HEALTH AND HUMAN SERVICES (cont'd):* Pass‐Through Payments from Commonwealth of Virginia (cont'd):
* Department of Social Services (cont'd):Social Services Block Grant 93.667 46003‐90123 1,025
46003‐9012446003‐9012546003‐9112046003‐9112246003‐9112346003‐9112446003‐9112546003‐9112646003‐9114246006‐9024046006‐9024246006‐9024346006‐9024446006‐9024546006‐9024646006‐9026246802‐9034046802‐9035846802‐9037946901‐9035146901‐9035846902‐9035146903‐90648
Chafee Foster Care Independence Program 93.674 46003‐91134 1846006‐9025446901‐9035646902‐90356
Children's Health Insurance Program 93.767 46003‐90102 6446003‐9016146003‐9040246003‐9110246003‐9140246006‐9022246006‐90702
Medical Assistance Program 93.778 46003‐90101 1,74846003‐9014646003‐9016046003‐9021346003‐9040146003‐9044646003‐9110146003‐9114646003‐9140146003‐9144646006‐9022146006‐9026646006‐9070146006‐9074346006‐90746
Aging Cluster10
* Department of Aging:Special Programs for the Aging ‐ Title III, Part B 93.044 45504‐44111 208 Grants for Supportive Services and Senior Centers 45504‐60001
45504‐62004
Special Programs for the Aging ‐ Title III, Part C 93.045 45701‐44121 179 Nutrition Services 45703‐44131
10Aging Cluster Total $387
See accompanying notes to the Schedule of Expenditures of Federal Awards.209

Page 8 of 8
COUNTY OF PRINCE WILLIAM, VIRGINIASCHEDULE OF EXPENDITURES OF FEDERAL AWARDSFor the year ended June 30, 2013(amounts expressed in thousands)
CFDA Pass‐Through Agency FederalFederal Granting Agency/Recipient Pass‐Through Agency/Grant Program Number Identifying Number Expenditures
DEPARTMENT OF HEALTH AND HUMAN SERVICES (cont'd):* Pass‐Through Payments from Commonwealth of Virginia (cont'd):
Child Care Cluster
* Child Care Mandatory & Matching Funds of the Child Care & 93.596 45214‐90529 237 Development Fund 45214‐90540
45214‐9054145214‐9056645215‐9037845215‐9052146003‐9011646003‐9011746003‐9011846003‐9111646003‐9111746003‐9111846006‐9023646006‐9023746006‐90238
Total Department of Health and Human Services 11,871
DEPARTMENT OF HOMELAND SECURITY:
* Direct Payments:Homeland Security Grant Program 97.06711 not applicable 390
* Pass‐Through Payments from Commonwealth of Virginia:* Department of Emergency Management:
Disaster Grants ‐ Public Assistance (Presidentially 97.036 77602‐147 136
Emergency Management Performance Grants 97.042 77501‐52741 10
State Homeland Security Program (SHSP) 97.073 77501‐52708 20Emergency Management Performance Grants 97.042
72209‐5210377501‐52700
* Pass‐Through Payments from Arlington County:Homeland Security Grant Program 97.06711 not applicable 354
* Pass‐Through Payments from District of ColumbiaHomeland Security Grant Program 97.06711 not applicable 224
* Pass‐Through Payments from Fairfax County: 97.06711 not applicable 210Homeland Security Grant Program
* Pass‐Through Payments from Montgomery County: 97.06711 not applicable 213Homeland Security Grant Program
Total Department of Homeland Security 1,557
TOTAL EXPENDITURES OF FEDERAL AWARDS 104,252
11 Homeland Security Grant Program Total $1,391
See accompanying notes to the Schedule of Expenditures of Federal Awards.210
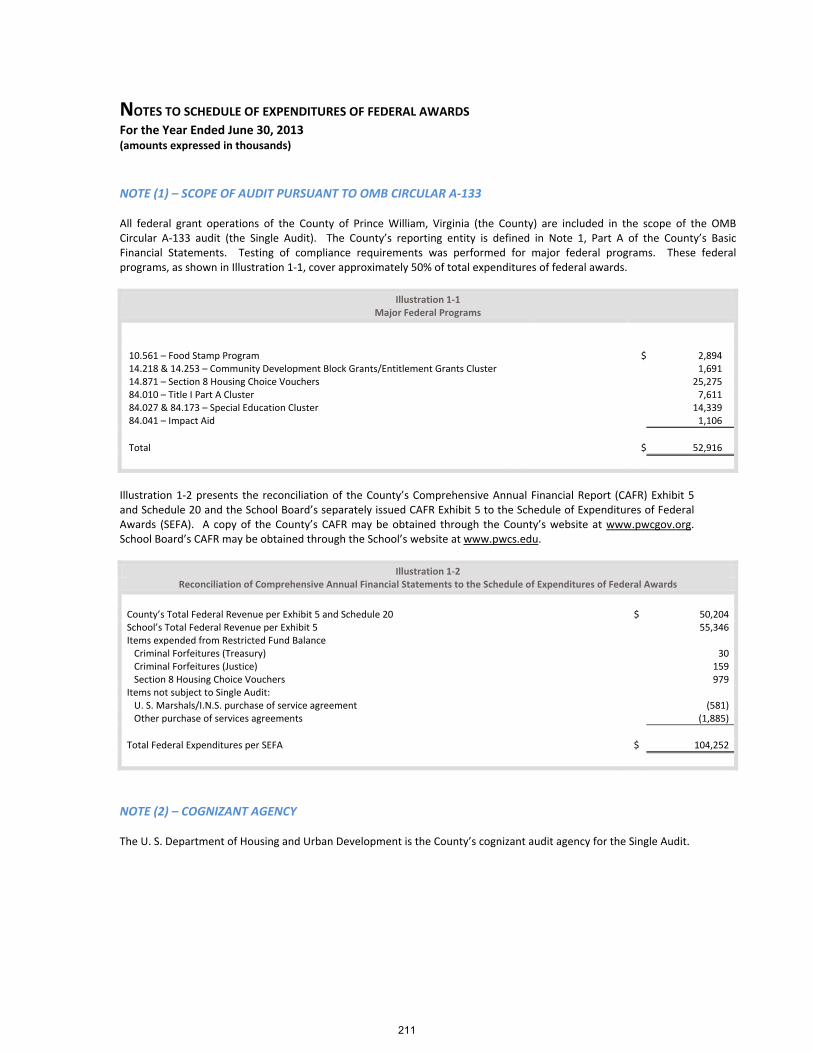
NOTES TO SCHEDULE OF EXPENDITURES OF FEDERAL AWARDS
For the Year Ended June 30, 2013 (amounts expressed in thousands)
NOTE (1) – SCOPE OF AUDIT PURSUANT TO OMB CIRCULAR A‐133 All federal grant operations of the County of Prince William, Virginia (the County) are included in the scope of the OMB Circular A‐133 audit (the Single Audit). The County’s reporting entity is defined in Note 1, Part A of the County’s Basic Financial Statements. Testing of compliance requirements was performed for major federal programs. These federal programs, as shown in Illustration 1‐1, cover approximately 50% of total expenditures of federal awards.
Illustration 1‐1 Major Federal Programs
10.561 – Food Stamp Program $ 2,894 14.218 & 14.253 – Community Development Block Grants/Entitlement Grants Cluster 1,691 14.871 – Section 8 Housing Choice Vouchers 25,275 84.010 – Title I Part A Cluster 7,611 84.027 & 84.173 – Special Education Cluster 14,339 84.041 – Impact Aid 1,106
Total $ 52,916
Illustration 1‐2 presents the reconciliation of the County’s Comprehensive Annual Financial Report (CAFR) Exhibit 5 and Schedule 20 and the School Board’s separately issued CAFR Exhibit 5 to the Schedule of Expenditures of Federal Awards (SEFA). A copy of the County’s CAFR may be obtained through the County’s website at www.pwcgov.org. School Board’s CAFR may be obtained through the School’s website at www.pwcs.edu.
Illustration 1‐2 Reconciliation of Comprehensive Annual Financial Statements to the Schedule of Expenditures of Federal Awards
County’s Total Federal Revenue per Exhibit 5 and Schedule 20 $ 50,204School’s Total Federal Revenue per Exhibit 5 Items expended from Restricted Fund Balance Criminal Forfeitures (Treasury) Criminal Forfeitures (Justice) Section 8 Housing Choice Vouchers
55,346
30159979
Items not subject to Single Audit: U. S. Marshals/I.N.S. purchase of service agreement (581) Other purchase of services agreements (1,885)
Total Federal Expenditures per SEFA $ 104,252
NOTE (2) – COGNIZANT AGENCY The U. S. Department of Housing and Urban Development is the County’s cognizant audit agency for the Single Audit.
211
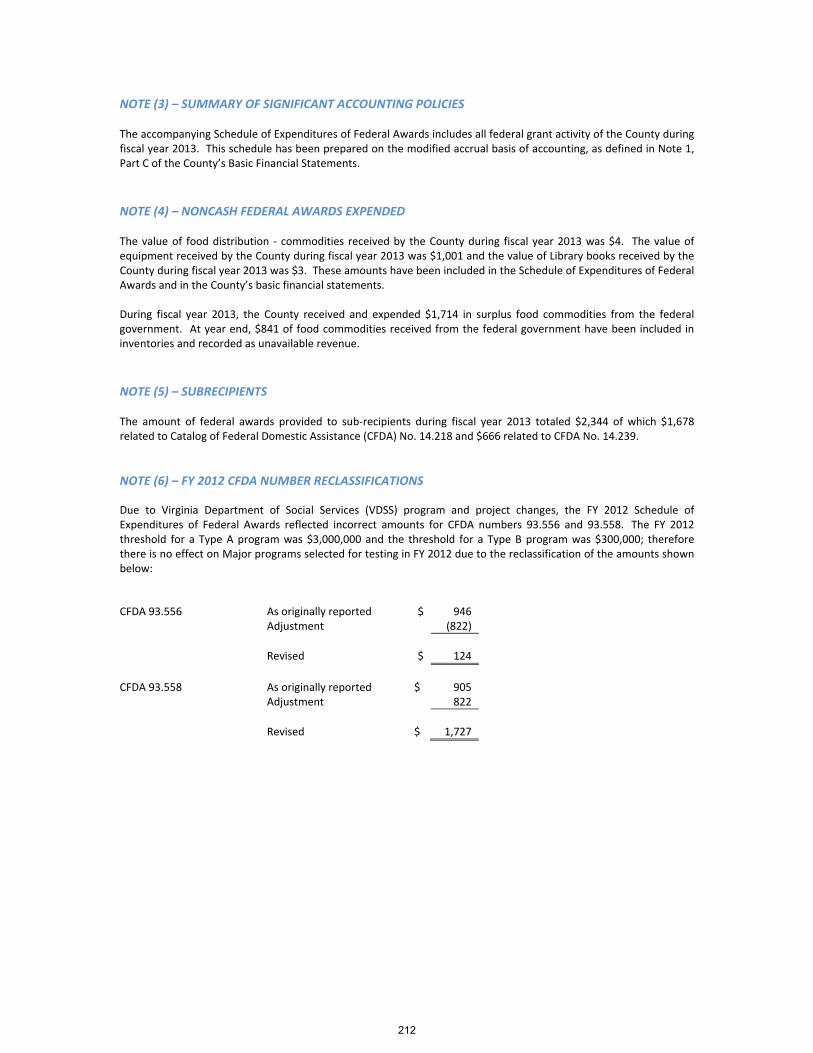
NOTE (3) – SUMMARY OF SIGNIFICANT ACCOUNTING POLICIES The accompanying Schedule of Expenditures of Federal Awards includes all federal grant activity of the County during fiscal year 2013. This schedule has been prepared on the modified accrual basis of accounting, as defined in Note 1, Part C of the County’s Basic Financial Statements.
NOTE (4) – NONCASH FEDERAL AWARDS EXPENDED The value of food distribution ‐ commodities received by the County during fiscal year 2013 was $4. The value of equipment received by the County during fiscal year 2013 was $1,001 and the value of Library books received by the County during fiscal year 2013 was $3. These amounts have been included in the Schedule of Expenditures of Federal Awards and in the County’s basic financial statements. During fiscal year 2013, the County received and expended $1,714 in surplus food commodities from the federal government. At year end, $841 of food commodities received from the federal government have been included in inventories and recorded as unavailable revenue.
NOTE (5) – SUBRECIPIENTS The amount of federal awards provided to sub‐recipients during fiscal year 2013 totaled $2,344 of which $1,678 related to Catalog of Federal Domestic Assistance (CFDA) No. 14.218 and $666 related to CFDA No. 14.239.
NOTE (6) – FY 2012 CFDA NUMBER RECLASSIFICATIONS Due to Virginia Department of Social Services (VDSS) program and project changes, the FY 2012 Schedule of Expenditures of Federal Awards reflected incorrect amounts for CFDA numbers 93.556 and 93.558. The FY 2012 threshold for a Type A program was $3,000,000 and the threshold for a Type B program was $300,000; therefore there is no effect on Major programs selected for testing in FY 2012 due to the reclassification of the amounts shown below: CFDA 93.556 As originally reported $ 946 Adjustment (822)
Revised $ 124
CFDA 93.558 As originally reported $ 905 Adjustment 822
Revised $ 1,727
212
INDEPENDENT AUDITOR’S REPORT ON INTERNAL CONTROL OVER FINANCIAL REPORTING AND ON COMPLIANCE AND OTHER MATTERS BASED ON AN AUDIT OF FINANCIAL STATEMENTS PERFORMED
IN ACCORDANCE WITH GOVERNMENT AUDITING STANDARDS
To the Board of County Supervisors County of Prince William, Virginia
We have audited, in accordance with the auditing standards generally accepted in the United States of America and the standards applicable to financial audits contained in Government Auditing Standards issued by the Comptroller General of the United States and the Specifications of audits of Counties, Cities and Towns issued by the Auditor of Public Accounts of the Commonwealth of Virginia, the financial statements of the governmental activities, the business-type activities, the aggregate discretely presented component units, each major fund, and the aggregate remaining fund information of the County of Prince William, Virginia (the “County”), as of and for the year ended June 30, 2013, and the related notes to the financial statements, which collectively comprise the County’s basic financial statements, and have issued our report thereon dated December 23, 2013. Our report includes a reference to other auditors who audited the financial statements of the Prince William County/Manassas Convention and Visitors Bureau (the “CVB”), as described in our report on the County’s financial statements. This report does not include the results of the other auditors’ testing of internal control over financial reporting or compliance and other matters that are reported on separately by those auditors. The financial statements of the CVB were not audited in accordance with Government Auditing Standards.
Internal Control Over Financial Reporting
In planning and performing our audit of the financial statements, we considered the County’s internal control over financial reporting (internal control) to determine the audit procedures that are appropriate in the circumstances for the purpose of expressing our opinions on the financial statements, but not for the purpose of expressing an opinion on the effectiveness of the County’s internal control. Accordingly, we do not express an opinion on the effectiveness of the County’s internal control.
A deficiency in internal control exists when the design or operation of a control does not allow management or employees, in the normal course of performing their assigned functions, to prevent, or detect and correct, misstatements on a timely basis. A material weakness is a deficiency, or a combination of deficiencies, in internal control, such that there is a reasonable possibility that a material misstatement of the entity’s financial statements will not be prevented, or detected and corrected on a timely basis. A significant deficiency is a deficiency, or a combination of deficiencies, in internal control that is less severe than a material weakness, yet important enough to merit attention by those charged with governance.
Our consideration of internal control was for the limited purpose described in the first paragraph of this section and was not designed to identify all deficiencies in internal control that might be material weaknesses or significant deficiencies and therefore, material weaknesses or significant deficiencies may exist that were not identified. Given these limitations, during our audit we did not identify any deficiencies in internal control that we consider to be material weaknesses. However, material weaknesses may exist that have not been identified. We did identify a certain deficiency in internal control, described as 2013-01 in the accompanying schedule of findings and questioned costs that we consider to be significant deficiency.
213
Compliance and Other Matters
As part of obtaining reasonable assurance about whether the County’s financial statements are free from material misstatement, we performed tests of its compliance with certain provisions of laws, regulations, contracts, and grant agreements, noncompliance with which could have a direct and material effect on the determination of financial statement amounts. However, providing an opinion on compliance with those provisions was not an objective of our audit, and accordingly, we do not express such an opinion. The results of our tests disclosed an instance of noncompliance or other matters that is required to be reported under Government Auditing Standards and which is described in the accompanying schedule of findings and questioned costs as item 2013-2.
County’s Response to Finding
The County responses to the findings identified in our audit are described in the accompanying schedule of findings and questioned costs. The County’s responses were not subjected to the auditing procedures applied in the audit of the financial statements and, accordingly, we express no opinion on them.
Purpose of this Report
The purpose of this report is solely to describe the scope of our testing of internal control and compliance and the results of that testing, and not to provide an opinion on the effectiveness of the County’s internal control or on compliance. This report is an integral part of an audit performed in accordance with Government Auditing Standards in considering the County’s internal control and compliance. Accordingly, this communication is not suitable for any other purpose.
Tysons Corner, Virginia December 23, 2013
214

INDEPENDENT AUDITOR’S REPORT ON COMPLIANCE FOR EACH MAJOR PROGRAM AND ON INTERNAL CONTROL OVER COMPLIANCE REQUIRED BY OMB CIRCULAR A‐133
To the Board of County Supervisors County of Prince William, Virginia
Report on Compliance for Each Major Federal Program
We have audited the County of Prince William, Virginia’s (the “County”) compliance with the types of compliance requirements described in the OMB Circular A-133 Compliance Supplement that could have a direct and material effect on each of the County’s major federal programs for the year ended June 30, 2013. The County’s major federal programs are identified in the summary of auditor’s results section of the accompanying schedule of findings and questioned costs.
Management’s Responsibility
Management is responsible for compliance with the requirements of laws, regulations, contracts, and grants applicable to its federal programs.
Auditor’s Responsibility
Our responsibility is to express an opinion on compliance for each of the County’s major federal programs based on our audit of the types of compliance requirements referred to above. We conducted our audit of compliance in accordance with auditing standards generally accepted in the United States of America; the standards applicable to financial audits contained in Government Auditing Standards, issued by the Comptroller General of the United States; and OMB Circular A-133, Audits of States, Local Governments, and Non-Profit Organizations. Those standards and OMB Circular A-133 require that we plan and perform the audit to obtain reasonable assurance about whether noncompliance with the types of compliance requirements referred to above that could have a direct and material effect on a major federal program occurred. An audit includes examining, on a test basis, evidence about the County’s compliance with those requirements and performing such other procedures as we considered necessary in the circumstances.
We believe that our audit provides a reasonable basis for our opinion on compliance for each major federal program. However, our audit does not provide a legal determination of the County of Prince William, Virginia’s compliance.
Opinion on Each Major Federal Program
In our opinion, the County, complied, in all material respects, with the types of compliance requirements referred to above that could have a direct and material effect on each of its major federal programs for the year ended June 30, 2013.
Report on Internal Control Over Compliance
Management of the County is responsible for establishing and maintaining effective internal control over compliance with the types of compliance requirements referred to above. In planning and performing our audit of compliance, we considered the County’s internal control over compliance with the types of requirements that could have a direct and material effect on each major federal program to determine the auditing procedures that are appropriate in the circumstances for the purpose of expressing an opinion on compliance for each major federal program and to test and report on internal control over compliance in accordance with OMB Circular A-133, but not for the purpose of expressing an opinion on the effectiveness of internal control over compliance. Accordingly, we do not express an opinion on the effectiveness of the County’s internal control over compliance.
215
A deficiency in internal control over compliance exists when the design or operation of a control over compliance does not allow management or employees, in the normal course of performing their assigned functions, to prevent, or detect and correct, noncompliance with a type of compliance requirement of a federal program on a timely basis. A material weakness in internal control over compliance is a deficiency, or combination of deficiencies, in internal control over compliance, such that there is a reasonable possibility that material noncompliance with a type of compliance requirement of a federal program will not be prevented, or detected and corrected, on a timely basis. A significant deficiency in internal control over compliance is a deficiency, or a combination of deficiencies, in internal control over compliance with a type of compliance requirement of a federal program that is less severe than a material weakness in internal control over compliance, yet important enough to merit attention by those charged with governance.
Our consideration of internal control over compliance was for the limited purpose described in the first paragraph of this section and was not designed to identify all deficiencies in internal control over compliance that might be material weaknesses or significant deficiencies. We did not identify any deficiencies in internal control over compliance that we consider to be material weaknesses. However, material weaknesses may exist that have not been identified.
The purpose of this report on internal control over compliance is solely to describe the scope of our testing of internal control over compliance and the results of that testing based on the requirements of OMB Circular A-133. Accordingly, this report is not suitable for any other purpose.
Tysons Corner, Virginia December 23, 2013
216
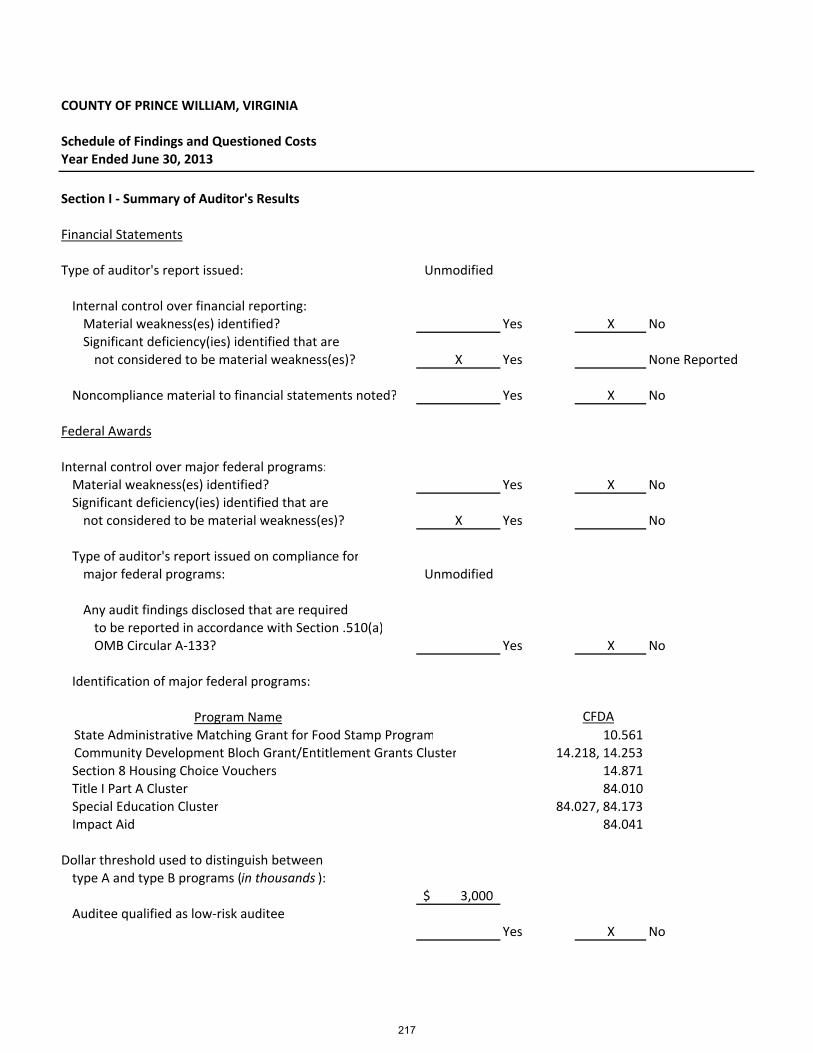
COUNTY OF PRINCE WILLIAM, VIRGINIA
Schedule of Findings and Questioned Costs Year Ended June 30, 2013
Section I ‐ Summary of Auditor's Results
Financial Statements
Type of auditor's report issued: Unmodified
Internal control over financial reporting:Material weakness(es) identified? Yes X NoSignificant deficiency(ies) identified that arenot considered to be material weakness(es)? X Yes None Reported
Noncompliance material to financial statements noted? Yes X No
Federal Awards
Internal control over major federal programs:Material weakness(es) identified? Yes X NoSignificant deficiency(ies) identified that arenot considered to be material weakness(es)? X Yes No
Type of auditor's report issued on compliance formajor federal programs: Unmodified
Any audit findings disclosed that are requiredto be reported in accordance with Section .510(a)OMB Circular A‐133? Yes X No
Identification of major federal programs:
Program Name State Administrative Matching Grant for Food Stamp Program 10.561 Community Development Bloch Grant/Entitlement Grants Cluster 14.218, 14.253Section 8 Housing Choice Vouchers 14.871Title I Part A Cluster 84.010Special Education Cluster 84.027, 84.173Impact Aid 84.041
Dollar threshold used to distinguish betweentype A and type B programs (in thousands ):
3,000$ Auditee qualified as low‐risk auditee
Yes X No
CFDA
217

COUNTY OF PRINCE WILLIAM, VIRGINIA
SCHEDULE OF FINDINGS AND QUESTIONED COSTS For the Year Ended June 30, 2013
Section II ‐ Financial Statement Findings Finding 2013‐1: INTERNAL CONTROL OVER FINANCIAL REPORTING – PRINCE WILLIAM COUNTY SCHOOLS Criteria: All depreciable fixed assets should have depreciation calculated and expensed on an annual basis,
based on the useful life of the asset.
Condition: During the audit we noted a $13.4 million decrease in overall depreciation expense from the
prior year. The expenses for Buildings and Equipment decreased from the prior year. Buildings had a
significant decrease of $12.8 million, while the other category decreased approximately $600,000. Per
review of the fixed asset supporting schedule, we noted that the depreciation for three building assets that
were acquired during the 2013 fiscal year did not have calculated depreciation.
Cause: The fixed asset system had system issues that resulted in the no calculation of depreciation expense
for several Building and Equipment. The system did not properly process all fixed assets and did not
calculate the depreciation expense for all fixed assets.
Effect: Misstatement of depreciation expense due to the significant deficiency in controls could have
resulted in a direct misstatement on the financial statement of depreciation expense. An understatement of
depreciation expense and accumulated depreciation could lead to an overstatement of assets on the
financial statement.
Recommendation: We recommend that management implement controls that require upgrades to the
fixed asset system be tested before the system upgrade is implemented on live data.
View of responsible officials and planned corrective action: Management concurs with the finding 2013‐1.
Management is in the process of developing procedures to encompass additional testing and ensuring the
system issues are resolved. This additional testing will result in increased controls.
Finding 2013‐2: APA OF VIRGINIA, SECTION 3‐15 SOCIAL SERVICES COMPLIANCE
Criteria: In accordance with the Auditors of Public Accounts (APA) of Virginia, Section 3‐15 Social Services,
the County Social Service employees are required to read the 2012 VDSS Information Security Program and
sign the Information Security Program and Acceptable Use Awareness Acknowledgement Form after
October 11, 2012 and no later than close of business November 30, 2012.
218

COUNTY OF PRINCE WILLIAM, VIRGINIA
SCHEDULE OF FINDINGS AND QUESTIONED COSTS For the Year Ended June 30, 2013
Condition: In our sample of 25 employees, we noted ten instances where employees signed the Information
Security Program and Acceptable Use Awareness Acknowledgement Form subsequent to November 30,
2012. Additionally, in our sample of 25 employees, we noted two instances where employees signed the
Information Security Program and Acceptable Use Awareness Acknowledgement Form before October 11,
2012 and November 20, 2012.
Cause: The Department of Social Services of the County did not require employees to read and sign the Acceptable Use Awareness Acknowledgement Form by the date specified by the state. The County had no formal review process in place to ensure that all employees had signed the correct form by the specified date.
Effect: The Department of Social Services of the County is not in compliance with Section 3‐15 of the APA of
Virginia. Each employee should have signed the most recent Acceptable Use Awareness Acknowledge Form
within the state specified time frame. Signing the most recent form in a timely manner ensures that
employees are aware of the changes made to the policy.
Recommendation: Employees should complete the Information Security Program and Acceptable Use
Awareness Acknowledgement Form within the required deadline as required by Section 3‐15 of the APA of
Virginia.
View of responsible officials and planned corrective action: Management concurs with the finding 2013‐2.
Management is in the process of developing procedures to ensure compliance with APA Section 3‐15 by the
specified deadline.
Section III – Findings and Questioned Costs for Federal Awards There were no findings or questioned costs related to Federal awards that were required to be reported in accordance with OMB Circular A‐133, section 510 (a).
219

COUNTY OF PRINCE WILLIAM, VIRGINIA
CORRECTIVE ACTION PLAN For the Year Ended June 30, 2013
Financial Statement Findings Finding 2013‐1: INTERNAL CONTROL OVER FINANCIAL REPORTING – PRINCE WILLIAM COUNTY SCHOOLS Name of Contact Person: Steven A. Solomon, Director of Finance Corrective Action:
Management is in the process of developing procedures to encompass additional testing and ensuring the system issues are resolved. This additional testing will result in increased controls.
Proposed Completion Date: Immediately Finding 2013‐2: APA OF VIRGINIA, SECTION 3‐15 SOCIAL SERVICES COMPLIANCE Name of Contact Person: Steven A. Solomon, Director of Finance Corrective Action:
Management concurs with the finding 2013‐2. Management is in the process of developing
procedures to ensure compliance with APA Section 3‐15 by the specified deadline.
Proposed Completion Date: Immediately
220