Embed Size (px)
Citation preview

Recomm
ended BudgetFiscal Year 2012
State of California
Comprehensive AnnualFinancial
Report
Fiscal YearEnded
June 30, 2014
County of Santa Clara
Emily HarrisonDirector of Finance

COUNTY OF SANTA CLARA, CALIFORNIA
70 West Hedding Street, San Jose, California 95110
COMPREHENSIVE ANNUAL FINANCIAL REPORT
For the Fiscal Year Ended June 30, 2014
Prepared by the Finance Agency
Emily Harrison, Director of Finance

This page intentionally left blank.

COUNTY OF SANTA CLARA
Comprehensive Annual Financial Report Table of Contents
For the Fiscal Year Ended June 30, 2014
Page
INTRODUCTORY SECTION: Letter of Transmittal .............................................................................................................................. i GFOA Certificate of Achievement .................................................................................................... vii Board of Supervisors and Principal County Officials ........................................................................ viii County of Santa Clara Organization Chart .......................................................................................... ix
FINANCIAL SECTION: Independent Auditor’s Report ....................................................................................................................... 1
Management’s Discussion and Analysis (Required Supplementary Information – Unaudited) ................... 5
Basic Financial Statements: Government-wide Financial Statements:
Statement of Net Position .............................................................................................................. 23 Statement of Activities ................................................................................................................... 24
Fund Financial Statements: Governmental Funds:
Balance Sheet ............................................................................................................................. 26 Reconciliation of the Governmental Funds Balance Sheet to the Government-wide Statement of Net Position – Governmental Activities ..................... 27 Statement of Revenues, Expenditures, and Changes in Fund Balances ..................................... 28 Reconciliation of the Statement of Revenues, Expenditures, and Changes in Fund Balances of Governmental Funds to the Government-wide Statement of Activities – Governmental Activities ...................................................................................... 29
Proprietary Funds: Statement of Fund Net Position .................................................................................................. 30 Statement of Revenues, Expenses, and Changes in Fund Net Position ...................................... 31 Statement of Cash Flows ............................................................................................................ 32
Fiduciary Funds: Statement of Fiduciary Net Position ........................................................................................... 34 Statement of Changes in Fiduciary Net Position ........................................................................ 35
COUNTY OF SANTA CLARA
Comprehensive Annual Financial Report Table of Contents
For the Fiscal Year Ended June 30, 2014
Page
Notes to the Basic Financial Statements: (1) Summary of Significant Accounting Policies .................................................................... 37 (2) Stewardship, Compliance and Accountability .................................................................... 48 (3) Cash and Investments ......................................................................................................... 49 (4) Receivables ......................................................................................................................... 56 (5) Interfund Transactions ........................................................................................................ 59 (6) Capital Assets ..................................................................................................................... 61 (7) Capital Leases ..................................................................................................................... 65 (8) Short–Term Debt ................................................................................................................ 65 (9) Long–Term Liabilities ........................................................................................................ 67 (10) Hospital Program Revenues ............................................................................................... 81 (11) Net Position/Fund Balances ............................................................................................... 83 (12) Employee Benefit Plans ..................................................................................................... 86 (13) Risk Management ............................................................................................................... 99 (14) Commitments and Contingencies ..................................................................................... 101 (15) Pollution Remediation ...................................................................................................... 105 (16) Subsequent Events ............................................................................................................ 106
REQUIRED SUPPLEMENTARY INFORMATION (other than MD&A): Schedules of Funding Progress ......................................................................................................... 107 Budgetary Comparison Schedule - General Fund - Budgetary Basis ............................................... 109 Notes to Required Supplementary Information ................................................................................ 119
OTHER SUPPLEMENTARY INFORMATION: Combining and Individual Fund Statements and Schedules:
Discrete Component Units ........................................................................................................... 121 Combining Statement of Net Position ...................................................................................... 122 Combining Statement of Activities .......................................................................................... 123
Nonmajor Governmental Funds: Combining Balance Sheet......................................................................................................... 125 Combining Statement of Revenues, Expenditures, and Changes in Fund Balances ................ 126
COUNTY OF SANTA CLARA
Comprehensive Annual Financial Report Table of Contents
For the Fiscal Year Ended June 30, 2014
Page
OTHER SUPPLEMENTARY INFORMATION (Continued): Nonmajor Special Revenue Funds ....................................................................................... 127
Combining Balance Sheet ............................................................................................... 128 Combining Statement of Revenues, Expenditures, and Changes in Fund Balances....... 130 Budgetary Comparison Schedules:
Roads Fund ............................................................................................................... 132 County Library Fund ................................................................................................ 133 Parks Operation and Maintenance Fund .................................................................. 134 Housing and Community Development Fund .......................................................... 135 Clerk-Recorder Fund ................................................................................................ 136 Fire Districts Fund .................................................................................................... 137 Emergency Medical Services Fund .......................................................................... 138 Environmental Health Fund ..................................................................................... 139 Vector Control Fund ................................................................................................. 140 Tobacco Securitization Fund .................................................................................... 141 Proposition 63 Fund… ............................................................................................. 142 Child Support Fund… .............................................................................................. 143 Other Special Revenue Funds .................................................................................. 144
Nonmajor Debt Service Funds ............................................................................................. 149 Combining Balance Sheet ............................................................................................... 150 Combining Statement of Revenues, Expenditures, and Changes in Fund Balances....... 152 Budgetary Comparison Schedules:
Multiple Facilities Bonds Fund ................................................................................ 154 Hospital Facilities Bonds Fund ................................................................................ 155 Justice Facilities Bonds Fund ................................................................................... 156 Morgan Hill Courthouse Bonds Fund ...................................................................... 157 General Obligation Bonds Fund ............................................................................... 158 Qualified Energy Conservation Bonds Fund ............................................................ 159 Technology Bonds Fund .......................................................................................... 160

COUNTY OF SANTA CLARA
Comprehensive Annual Financial Report Table of Contents
For the Fiscal Year Ended June 30, 2014
Page OTHER SUPPLEMENTARY INFORMATION (Continued):
Nonmajor Capital Projects Funds ........................................................................................ 161 Combining Balance Sheet ............................................................................................... 162 Combining Statement of Revenues, Expenditures, and Changes in Fund Balances....... 163 Budgetary Comparison Schedules:
General Capital Improvement Fund ......................................................................... 164 Parks Acquisition and Development Fund ............................................................... 165 Qualified Energy Conservation Bonds Fund ............................................................ 166 Technology Bonds Fund .......................................................................................... 167
Nonmajor Enterprise Funds ......................................................................................................... 169 Combining Statement of Fund Net Position ............................................................................. 170 Combining Statement of Revenues, Expenses, and Changes in Fund Net Position ................. 171 Combining Statement of Cash Flows ....................................................................................... 172
Internal Service Funds ................................................................................................................. 173 Combining Statement of Fund Net Position ............................................................................. 174 Combining Statement of Revenues, Expenses, and Changes in Fund Net Position ................. 176 Combining Statement of Cash Flows ....................................................................................... 178
Fiduciary Funds ........................................................................................................................... 181 Investment Trust Funds:
Combining Statement of Fiduciary Net Position ................................................................. 182 Combining Statement of Changes in Fiduciary Net Position .............................................. 183
Agency Funds:Combining Statement of Changes in Assets and Liabilities ................................................ 184

COUNTY OF SANTA CLARA
Comprehensive Annual Financial Report Table of Contents
For the Fiscal Year Ended June 30, 2014
Page
STATISTICAL SECTION (Unaudited): Net Position by Component ...................................................................................................... 188 Changes in Net Position ........................................................................................................... 190 Fund Balances of Governmental Funds .................................................................................... 194 Changes in Fund Balances of Governmental Funds ................................................................. 196 General Governmental Tax Revenues by Source ..................................................................... 198 Taxable Assessed Value of Property ........................................................................................ 199 Property Tax Rate - Direct and Overlapping Governments .................................................... 200 Principal Property Taxpayers ................................................................................................... 201 Property Tax Levies and Collections ........................................................................................ 202 Ratios of Outstanding Debt by Type ........................................................................................ 203 Ratios of General Bonded Debt Outstanding ........................................................................... 205 Direct and Overlapping Bonded Debt ...................................................................................... 206 Legal Debt Margin Information ................................................................................................ 208 Pledge Revenue Coverage ........................................................................................................ 209 Demographic and Economic Statistics ..................................................................................... 210 Principal Employers ................................................................................................................. 211 Full-time Equivalent County Employees by Function / Program ............................................. 213 Operating Indicators by Function / Program ............................................................................ 214 Capital Asset Statistics by Function / Program ........................................................................ 216 Miscellaneous Statistical Data .................................................................................................. 219
GLOSSARY: Glossary for the Comprehensive Annual Financial Report ...................................................... 221

This page intentionally left blank.

Introductory Section

This page intentionally left blank.


v

vi

vii

COUNTY OF SANTA CLARA
BOARD OF SUPERVISORS AND PRINCIPAL COUNTY OFFICIALS
JUNE 30, 2014
PRINCIPAL COUNTY OFFICIALS
Mike WassermanDistrict 1
Cindy ChavezDistrict 2
Laurie SmithSheriff
viii
Larry StoneAssessor
Emily HarrisonDirector of Finance
BOARD OF SUPERVISORS
Jeff RosenDistrict Attorney
Jeffrey V. SmithCounty Executive
S. Joseph SimitianDistrict 5
Dave CorteseDistrict 3
Ken YeagerDistrict 4
Orry P. KorbCounty Counsel

County Executive
COUNTY OF SANTA CLARAORGANIZATION CHART
Deputy CountyExecutive
Deputy CountyExecutive
Deputy CountyExecutive
Deputy CountyExecutive
Clerk of the Board
County CounselDepartment of
CorrectionPublic Defender
Probation
District Attorney AssessorSheriff
Employee ServicesAgency
County Library Finance AgencyFacilities/FleetDepartment
Pretrial Services
MedicalExaminer-Coroner
Social ServicesAgency
Santa Clara ValleyHealth & Hospital
System
Fire Districts
The Board of Supervisors
District 1Supervisor
District 2Supervisor
District 3Supervisor
District 4Supervisor
District 5Supervisor
Elected
Board of SupervisorsAppointment
Information Services
Department of ChildSupport Services
Registrar of Voters
Roads and Airports ProcurementCounty
CommunicationsPlanning andDevelopment
Agriculture &EnvironmentalManagement
Parks andRecreation
Chief OperatingOfficer
Deputy CountyExecutive
ix

x
This page intentionally left blank.

Financial Section

This page intentionally left blank.

Sacramento
Oakland
LA/Century City
Newport Beach
San Diego
Seattle
www.mgocpa.com
Walnut Creek2121 N. California Blvd., Suite 750
Walnut Creek, CA 94596925.274.0190
1
INDEPENDENT AUDITOR’S REPORT
The Board of Supervisors County of Santa Clara San Jose, California
We have audited the accompanying financial statements of the governmental activities, the business-type activities, the aggregate discretely presented component units, each major fund, and the aggregate remaining fund information of the County of Santa Clara, California (the “County”), as of and for the year ended June 30, 2014, and the related notes to the financial statements, which collectively comprise the County’s basic financial statements as listed in the table of contents.
Management’s Responsibility for the Financial Statements Management is responsible for the preparation and fair presentation of these financial statements in accordance with accounting principles generally accepted in the United States of America; this includes the design, implementation, and maintenance of internal control relevant to the preparation and fair presentation of financial statements that are free from material misstatement, whether due to fraud or error.
Auditor’s Responsibility Our responsibility is to express opinions on these financial statements based on our audit. We did not audit the financial statements of the Housing Authority of the County of Santa Clara; FIRST 5 Santa Clara County; Santa Clara County Health Authority; the County Sanitation District 2 – 3 of Santa Clara County; the Santa Clara County Vector Control District; the Silicon Valley Tobacco Securitization Authority; the Santa Clara County Tobacco Securitization Corporation; and the Santa Clara County Central Fire Protection District, the South Santa Clara County Fire District, and the Los Altos Hills County Fire District (collectively, “Fire Districts”), which collectively represent the following percentages of the assets, net position/fund balances, and revenues/additions of the following opinion units.
Net Position/ Revenues/Opinion Unit Assets Fund Balances Additions
Governmental activities 3.5% 16.7% 4.2%Business-type activities 0.5% 0.9% 0.2%Aggregate discretely presented component units 100.0% 100.0% 100.0%Aggregate remaining fund information 1.9% 2.2% 1.0%
Those statements were audited by other auditors whose reports have been furnished to us, and our opinion, insofar as it relates to the amounts included for those entities, is based solely on the reports of the other auditors. We conducted our audit in accordance with auditing standards generally accepted in the United States of America. Those standards require that we plan and perform the audit to obtain reasonable assurance about whether the financial statements are free from material misstatement.

2
An audit involves performing procedures to obtain audit evidence about the amounts and disclosures in the financial statements. The procedures selected depend on the auditor’s judgment, including the assessment of the risks of material misstatement of the financial statements, whether due to fraud or error. In making those risk assessments, the auditor considers internal control relevant to the entity’s preparation and fair presentation of the financial statements in order to design audit procedures that are appropriate in the circumstances, but not for the purpose of expressing an opinion on the effectiveness of the entity’s internal control. Accordingly, we express no such opinion. An audit also includes evaluating the appropriateness of accounting policies used and the reasonableness of significant accounting estimates made by management, as well as evaluating the overall presentation of the financial statements.
We believe that the audit evidence we have obtained is sufficient and appropriate to provide a basis for our audit opinions.
Opinions In our opinion, based on our audit and the reports of other auditors, the financial statements referred to above present fairly, in all material respects, the respective financial position of the governmental activities, the business-type activities, the aggregate discretely presented component units, each major fund, and the aggregate remaining fund information of the County as of June 30, 2014, and the respective changes in financial position and, where applicable, cash flows thereof for the year then ended in accordance with accounting principles generally accepted in the United States of America.
Emphasis of Matters Change in Accounting Principles As described in Note 1(p) to the basic financial statements, effective July 1, 2013, the County adopted the provisions of Governmental Accounting Standards Board (GASB) Statement No. 65, Items Previously Reported as Assets and Liabilities; Statement No. 66, Technical Corrections – 2012 – An Amendment of GASB Statement No. 10 and No. 62; and Statement No. 70, Accounting and Financial for Nonexchange Financial Guarantees.
Deficit Net Positions As discussed in Note 2, several County internal service funds have deficit net positions at June 30, 2014, which include the Workers’ Compensation, Retiree Healthcare, and Pension Obligation internal service funds with deficit net positions of $45.4 million, $190.3 million, and $47.4 million, respectively.
Our opinion is not modified with respect to these matters.
Other Matters Required Supplementary Information Accounting principles generally accepted in the United States of America require that the management’s discussion and analysis; the schedules of funding progress; and the budgetary comparison schedule – General Fund – budgetary basis listed in the table of contents be presented to supplement the basic financial statements. Such information, although not a part of the basic financial statements, is required by the GASB, who considers it to be an essential part of financial reporting for placing the basic financial statements in an appropriate operational, economic, or historical context. We and other auditors have applied certain limited procedures to the required supplementary information in accordance with auditing standards generally accepted in the United States of America, which consisted of inquiries of management about the methods of preparing the information and comparing the information for consistency with management’s responses to our inquiries, the basic financial statements, and other knowledge we obtained during our audit of the basic financial statements. We do not express an opinion or provide any assurance on the information because the limited procedures do not provide us with sufficient evidence to express an opinion or provide any assurance.

3
Other Information Our audit was conducted for the purpose of forming opinions on the financial statements that collectively comprise the County’s basic financial statements. The introductory section, combining and individual fund statements and schedules, statistical section, and glossary section are presented for purposes of additional analysis and are not a required part of the basic financial statements. The combining and individual fund statements and schedules are the responsibility of management and were derived from and relate directly to the underlying accounting and other records used to prepare the basic financial statements. Such information has been subjected to the auditing procedures applied in the audit of the basic financial statements and certain additional procedures, including comparing and reconciling such information directly to the underlying accounting and other records used to prepare the basic financial statements or to the basic financial statements themselves, and other additional procedures in accordance with auditing standards generally accepted in the United States of America by us and other auditors. In our opinion, based on our audit, the procedures performed as described above, and the reports of the other auditors, the combining and individual fund statements and schedules are fairly stated, in all material respects, in relation to the basic financial statements as a whole. The introductory, statistical and glossary sections have not been subjected to the auditing procedures applied in the audit of the basic financial statements, and accordingly, we do not express an opinion or provide any assurance on it.
Walnut Creek, California December 30, 2014

4
This page intentionally left blank.

Management’s Discussion and Analysis

This page intentionally left blank.

5
County of Santa Clara Management’s Discussion and Analysis
Required Supplementary Information - Unaudited
As management of the County of Santa Clara (the County), we offer readers of the County’s financial statements this narrative overview and analysis of the financial activities of the County for the fiscal year ended June 30, 2014. We encourage readers to consider the information presented here in conjunction with additional information that we have furnished in our letter of transmittal, which can be found on pages i to vi of this report.
FINANCIAL HIGHLIGHTS
The assets and deferred outflows of resources of the County exceeded its liabilities and deferred inflows of resources by $1.53 billion (net position) at June 30, 2014. Of this amount, $94.4 million (unrestricted net position) may be used to meet the County’s ongoing obligations to its citizens and creditors and $457.4 million (restricted net position) may be used for the County’s ongoing obligations related to programs with external restrictions. The County’s net investment in capital assets was $982.4 million. (See further detail in Table 1 on page 8).
The County’s total net position decreased by $72.1 million for the year. (See further detail in Table 2 on page 12).
At June 30, 2014, the County governmental funds reported combined fund balances of $883.1 million, an increase of $12.7 million from the prior year. Approximately 48.9 percent of the combined fund balances, $431.6 million, is available to meet the County’s current and future needs.
The County’s investments in capital assets increased by $138.2 million or 6.5 percent. (See further detail in Table 5 on page 19).
The County’s total long-term debt, net of retirements of $85.0 million and additions of $28.8 million for the year, decreased by $56.2 million or 2.5 percent during the current fiscal year. (See further detail in Table 6 on page 20).
At June 30, 2014, the County’s unassigned fund balance for the General Fund was $237.9 million, 11.5 percent of total General Fund expenditures.
OVERVIEW OF THE FINANCIAL STATEMENTS
Management’s discussion and analysis are intended to serve as an introduction to the County’s basic financial statements. The County’s basic financial statements comprise three components 1) government-wide financial statements, 2) fund financial statements, and 3) notes to the basic financial statements. Required supplementary information is included in addition to the basic financial statements.
Government-wide Financial Statements The government-wide financial statements are designed to provide readers with a broad overview of County finances, in a manner similar to a private-sector business.
The statement of net position presents information on all County assets, deferred outflows of resources, liabilities, and deferred inflows of resources with the difference reported as net position. Over time, increases or decreases in net position may serve as a useful indicator of whether the financial position of the County is improving or deteriorating.

6
The statement of activities presents information showing how net position changed during the most recent fiscal year. All changes in net position are reported as soon as the underlying event giving rise to the change occurs, regardless of the timing of related cash flows. Thus, revenues and expenses are reported in the government-wide statements for some items that will result in cash flows in future fiscal periods (e.g., uncollected taxes and earned but unused vacation leave).
The government-wide financial statements distinguish functions of the County that are principally supported by taxes and intergovernmental revenues (governmental activities) from other functions that are intended to recover all or significant portion of their costs through user fees and charges (business-type activities). The governmental activities of the County include general government, public protection, public ways and facilities, health and sanitation, public assistance, education and recreation and culture. The business-type activities of the County include healthcare operations (a hospital—Santa Clara Valley Medical Center (SCVMC) and a health plan (Valley Health Plan)), airport operations (3 airports - Reid Hillview, Palo Alto and South County), and sanitation operations (County Sanitation District No. 2-3 of Santa Clara County).
Component units are included in the basic financial statements and consist of legally separate entities for which the County is financially accountable. Because of the governing board relationship and the exclusivity of County services, the financial operations of some component units are blended in the County’s basic financial statements. These component units are the Santa Clara County Central Fire Protection District, South Santa Clara County Fire District, Los Altos Hills County Fire District, Santa Clara County Library, Santa Clara County Vector Control District, County Sanitation District No. 2-3 of Santa Clara County, Santa Clara County Financing Authority, Santa Clara County–El Camino Hospital District Hospital Facilities Authority, Santa Clara County Tobacco Securitization Corporation and the Silicon Valley Tobacco Securitization Authority. The Housing Authority of Santa Clara County, Santa Clara County Health Authority, and the FIRST 5 Santa Clara County are reported as discrete component units of the County.
The government-wide financial statements can be found on pages 23 – 25 of this report.
Fund Financial Statements A fund is a grouping of related accounts that are used to maintain control over resources that have been segregated for specific activities or objectives. The County, like other state and local governments, uses fund accounting to ensure and demonstrate finance-related legal compliance. All of the funds of the County can be divided into three categories: governmental funds, proprietary funds, and fiduciary funds.
Governmental funds Governmental funds are used to account for essentially the same functions reported as governmental activities in the government-wide financial statements. However, unlike the government-wide financial statements, governmental funds financial statements focus on near-term inflows and outflows of spendable resources, as well as on balances of spendable resources available at the end of the fiscal year. Such information may be useful in evaluating the County’s near-term financing requirements.
Because the focus of governmental funds is narrower than that of the government-wide financial statements, it is useful to compare the information presented for governmental funds with similar information presented for governmental activities in the government-wide financial statements. By doing so, the readers may better understand the long-term impact of the government’s near-term financing decisions. Both the governmental funds balance sheet and the governmental funds statement of revenues, expenditures and changes in fund balances provide a reconciliation to facilitate this comparison between governmental funds and governmental activities.
The County maintains 26 individual governmental funds. Information is presented separately in the governmental funds balance sheet and in the governmental funds statement of revenues, expenditures and changes in fund balances for the General Fund. Data from other governmental funds are combined into a single aggregated presentation. Individual fund data for each of these nonmajor governmental funds is provided in the form of combining statements and schedules elsewhere in this report.
The governmental funds financial statements can be found on pages 26 – 29 of this report.

7
Proprietary funds The County maintains two kinds of proprietary funds. Enterprise funds are used to report the same functions presented as business-type activities in the government-wide financial statements. The County uses enterprise funds to account for one hospital—Santa Clara Valley Medical Center (SCVMC), one health plan (Valley Health Plan), three airports (Reid Hillview, Palo Alto, and South County), and one sanitation operation (County Sanitation District No. 2-3 of Santa Clara County). Internal service funds are an accounting device used to accumulate and allocate costs internally among the County’s various functions. The County uses internal service funds to account for its information services, fleet management, insurance, printing services, unemployment insurance, workers’ compensation, employee benefits, pension obligations, and retirees’ healthcare. The internal service funds have been allocated between the governmental activities and business-type activities based on the relative percentage of use of the internal service funds in these activities.
Proprietary fund statements provide the same type of information as the business-type activities column in the government-wide financial statements, but in more detail. The proprietary fund financial statements provide separate information for the SCVMC, which is considered a major fund. The financial statements of the nonmajor enterprise funds (Airport, Sanitation District, and Valley Health Plan) are combined into a single aggregated presentation. Similarly, the County’s nine internal service funds are combined into a single aggregated presentation in the proprietary funds financial statements. Individual fund data for the enterprise funds and the internal service funds is provided in the form of combining statements section of this report.
The proprietary funds financial statements can be found on pages 30 – 33 of this report.
Fiduciary funds The Fiduciary Funds are used to account for resources held for the benefit of parties outside the County. Fiduciary funds are not reflected in the government-wide financial statements because the resources of those funds are not available to support the County’s own programs. The accounting used for fiduciary funds is much like that used for proprietary funds except for agency funds.
The fiduciary funds financial statements can be found on pages 34 – 35 of this report.
Notes to the Basic Financial Statements The notes to the basic financial statements provide additional information that is essential to a full understanding of the data provided in the government-wide and fund financial statements. The notes can be found on pages 37 – 106 of this report.
Required Supplementary Information The required supplementary information is presented concerning the County’s progress in funding its obligation to provide pension and other postemployment benefits (OPEB) to its employees and the County General Fund budgetary comparison schedule. The County adopts an annual appropriated budget for its General Fund. A budgetary comparison schedule has been provided for the General Fund to demonstrate compliance with this budget. Required supplementary information can be found on pages 107 – 120 of this report.
Combining Statements and Schedules The combining and individual fund statements and schedules referred to earlier provide information for discrete component units, nonmajor governmental funds, nonmajor enterprise funds, internal service funds, and certain fiduciary funds and are presented immediately following the required supplementary information. Combining and individual fund statements and schedules can be found on pages 121 – 185 of this report.

8
GOVERNMENT-WIDE FINANCIAL ANALYSIS
The County’s assets and deferred outflows of resources exceeded its liabilities and deferred inflows of resources by $1.53 billion (net position) at June 30, 2014. As stated earlier, net position may serve over time as a useful indicator of a government’s financial position. When applicable, prior year numbers have been reclassified to make them comparable to the current year.
Table 1—Net Position (in thousands)
Dollar PercentChange Change
AssetsCurrent and other assets 2,753,396 $ (152,003) -5.2%Capital assets 138,231 6.5%
Total assets (13,772) -0.3%
Deferred outflows of resources 10,408 61.2%
LiabilitiesCurrent and other liabilities 117,405 23.3%Long-term liabilities (47,298) -1.6%Noncurrent derivative instrument liabilities (130) -0.8%
Total liabilities 69,977 2.0%
Deferred inflows of resources (1,366) -9.0%
Net position:Net investment in capital assets 53,489 5.8%Restricted 17,402 4.0%Unrestricted (142,965) -60.2%
Total net position (72,074) -4.5%
TotalGovernmental Business-typeActivities Activities Total
2013 2014 2013 2014 2013 2014
$ 2,195,267 $ 2,057,137 $ 710,132 $ 696,259 $ 2,905,399 $1,114,725 1,157,137 1,018,161 1,113,980 2,132,886 2,271,117
3,309,992 3,214,274 1,728,293 1,810,239 5,038,285 5,024,513
- 886 17,007 26,529 17,007 27,415
295,313 172,032 326,629 504,537 621,9422,271,166 2,242,289 641,082 622,661 2,912,248 2,864,950
17,007 16,877 17,007 16,877
2,603,671 2,537,602 830,121 966,167 3,433,792 3,503,769
15,236 13,870 - - 15,236 13,870
928,872 982,361438,990 456,393 494,390 363,612 440,029 457,431
237,363 94,398
$ 691,085 $ 663,688 $ 915,179 $ 870,502 $ 1,606,264 $ 1,534,190 $
332,505
-
897,189
(645,094)
959,157
(751,862)
498,066
(77,277)
617,486
(110,596)
In accordance with GASB guidance, the County reclassified $362.6 million of the primary government’s total net position amounts from restricted to unrestricted and $594.3 million from net investment in capital assets to unrestricted. Additional information on the presentation can be found in Note 11 on page 84 of this report.
Assets and Deferred Outflows of Resources The County’s total assets and deferred outflows of resources decreased $3.5 million or 0.1 percent primarily due to the following:
Governmental activities. Total assets and deferred outflows of resources for the governmental activities decreased by $94.8 million or 2.9 percent. Current and other assets decreased by $138.1 million. The primary reasons were from decreases of $72.4 million in net receivables, $50.2 million in due from other government agencies, and $37.7 million in restricted cash and investments in comparison to the prior year. These decreases were offset by an increase of $43.5 million in unrestricted cash and investments.
The decreases in total assets and deferred outflows of resources occurred in the following account balances:
Decrease by $72.4 million in net receivable was mainly due to a $70.8 million receivable related to the TeeterPlan Obligation issued in prior year for the purpose of assisting the County in funding its obligation todistribute tax levies to participating taxing agencies. This obligation was paid off in September 11, 2013,which correlated to the decrease in the related receivable.
Decrease by $50.2 million in the net amount reported in due from other government agencies due primarilyto an increase in an allowance to provide for Short Doyle Medi-Cal audits.
Decrease in restricted cash and investments by $37.7 million was primarily due to the final debt servicepayment on the 1985 Series A & B Adjustable Convertible Extendable Securities (ACES) bonds from reserveand other restricted accounts made on August 1, 2013 and additional bond payments related to 2013 SeriesB General Obligation Bonds made from restricted accounts.
Increase in unrestricted cash by $43.5 million resulted from improvements in the cash positions of numerousCounty programs. This includes $9.0 million one-time revenues from successor agencies to the formerredevelopment agencies and $35.2 million increase from Measure A, which passed in November 2012 toincrease sales tax by one-eighth of a cent.

9
Capital assets increased $42.4 million or 3.8 percent. Non-depreciable capital assets increased by $45.7 million; whereas, depreciable capital assets decreased by $3.3 million. Changes in capital assets will be discussed in the Capital Assets section on page 19 and Note 6 on page 61.
Business-type activities. Total assets and deferred outflows of resources for the business-type activities increased by $91.4 million or 5.2 percent. Current and other assets decreased $13.9 million and capital assets increased $95.8 million. In addition, deferred outflow of resources increased $9.5 million due primarily to the reclassification of deferred loss on refunding of debt from a contra liability pursuant to GASB Statement No. 65.
The decrease in current and other assets by $13.9 was primarily a result of the use of cash and cash equivalents in rebuilding and improving the seismically deficient medical facilities.
Changes in capital assets will be discussed in the Capital Assets section on page 19 and Note 6 on page 62.
Liabilities and Deferred Inflows of Resources The County’s total liabilities and deferred inflows of resources increased by $68.7 million or 2.0 percent mainly due to the following:
Governmental activities. Total liabilities and deferred inflows of resources for the governmental activities decreased by $67.4 million or 2.6 percent due to decreases of current and other liabilities of $37.2 million and noncurrent liabilities of $28.9 million.
The decreases in current and other liabilities of $37.2 million occurred in the following account balances:
Increase of $12.8 million in accrued liabilities primarily due to the timing of the payment of prior yearcontract services provided for Mental Health programs supporting mentally disabled citizens.
Increase of $28.9 million in due to other government agencies primarily from a $25.3 million increase fromLocal Revenue Fund 2011 Realignment for Protective Services programs such as Foster Care, KinGap, andAdoption as well as Calworks programs that are owed to State for advances received.
Increase of $5.3 million in unearned revenue mainly due to Wraparound services contracts.
Decrease of $85.0 million in short-term debt payable as the County did not issue short-term Teeter financingin FY2014.
The decreases in other long term liabilities will be discussed further in the Long-term Debt section on page 20.
Business-type activities. Total liabilities for the business-type activities increased by $136.1 million or 16.4 percent from increase of $154.6 million in current and other liabilities which was offset by $18.4 million decrease in long term liabilities. The increase in current and other liabilities resulted from increased liabilities for third party settlements and due to other governmental agencies primarily due to Disproportionate Share Hospital (DSH) overpayments received from the State Department of Health Care Services. The decrease in long term liabilities was due to the repayment of the 1985 Series A & B ACES and 1997 Series A lease revenue bonds.
Net Position
The County’s unrestricted net position of $94.4 million (6.2 percent) may be used to meet the County’s ongoing obligations to citizens and creditors. The largest portion of the County’s net position of $982.4 million (64.0 percent) reflects its investment in capital assets (e.g., land, buildings and improvements, infrastructure, and equipment and vehicles) net of accumulated depreciation, less any related outstanding debt used to acquire those assets. The County uses these capital assets to provide services to citizens; consequently, these assets are not available for future spending. Although the County’s investment in its capital assets is reported net of related debt, the resources needed to repay this debt must be provided from other sources, since the capital assets themselves cannot be used to liquidate these liabilities. The remaining $457.4 million (29.8 percent) of the County’s net position represents resources that are subject to external restrictions on how they may be used.

10
At the end of the current fiscal year, the County reported positive balances in all categories of net position for its governmental activities and for its business-type activities with the exception of negative balances of $751.9 million and $110.6 million in unrestricted net position category of its governmental activities and business-type activities respectively. The negative unrestricted net position balances were offset on the County-wide level through reclassifications of $362.6 million from restricted and $594.3 million from net investment in capital assets.
The County’s net position decreased by $72.1 million or 4.5 percent for the year. This change in net position is explained below in the context of the County’s governmental and business-type activities.
($250)
($200)
($150)
($100)
($50)
$0
$50
$100
$150
Total Unrestricted Restricted Net investmentin capital assets
Change in Net Position(in millions)
$0
$500
$1,000
$1,500
$2,000
FY11-12 FY12-13 FY13-14
Net Position (in millions)
Unrestricted
Restricted
Net investmentin capital assets

11
Governmental activities The governmental activities decreased the County’s net position by $27.4 million. Revenues exceeded expenses by $144.0 million. In addition, due to the implementation of GASB Statement No. 65, deferred charges were written off in the amount of $11.8 million as prior period adjustments. Furthermore, net transfers of $159.6 million were made to the business-type activities primarily for operating subsidies of the County’s healthcare programs.
As an arm of the state government, the County provides various mandated services, such as public assistance, public health, and mental health. Revenues directly generated by or attributable to a specific governmental function are called program revenues. These include charges for services and restrictive (program specific) grants and contributions, both operating and capital. The following chart shows the County’s program revenues and expenses for the year. Not included in this chart are the general revenues: taxes (property, business, and sales), unrestricted grants, investment income, gain on sale of capital assets, and other revenue. These general revenues are not shown by program, but are available to support the program activities countywide.
$-
$100
$200
$300
$400
$500
$600
$700
$800
$900
Generalgovernment
Publicprotection
Public ways &facilities
Health &sanitation
Publicassistance
Education Recreation &Culture
Interest onlong-term debt
$336
$832
$60
$487
$688
$36 $40 $57
$309
$348
$52
$248
$601
$8 $7 $0
Expenses and Revenues - Governmental Activities
Expenses
Program Revenues
Millions

12
Changes in the County’s net position from its governmental activities are explained in the context of changes in revenues and expenses:
Table 2—The Change in Net Position (in thousands)
Dollar Percent2013 2014 2013 2014 2013 2014 Change Change
Revenues:
Program revenues:Charges for services 264,719$ 264,674$ 860,359$ 1,015,340$ 1,125,078$ 1,280,014$ 154,936$ 13.8%Operating grants and contributions 1,220,593 1,300,352 119,451 108,809 1,340,044 1,409,161 69,117 5.2%Capital grants and contributions 9,482 6,799 7,234 7,234 16,716 14,033 (2,683) (16.1%)
General revenues:Property taxes 824,370 919,612 - - 824,370 919,612 95,242 11.6%Sales and use taxes 14,487 49,537 8,692 5,553 23,179 55,090 31,911 137.7%Other taxes 37,651 35,597 - - 37,651 35,597 (2,054) (5.5%)Unrestricted grants & contributions 17,179 15,765 - - 17,179 15,765 (1,414) (8.2%)Unrestricted investment income 7,041 8,391 1,177 3,680 8,218 12,071 3,853 46.9%
Gain on sale of capital assets 4,424 - - - 4,424 - (4,424) (100.0%)Other revenue 69,539 79,837 - - 69,539 79,837 10,298 14.8%
Total revenues 2,469,485 2,680,564 996,913 1,140,616 3,466,398 3,821,180 354,782 10.2%
Program expenses:General government 302,106 336,205 - - 302,106 336,205 34,099 11.3%Public protection 783,619 832,030 - - 783,619 832,030 48,411 6.2%Public ways and facilities 30,712 60,332 - - 30,712 60,332 29,620 96.4%Health and sanitation 450,147 487,010 - - 450,147 487,010 36,863 8.2%Public assistance 637,603 687,503 - - 637,603 687,503 49,900 7.8%Education 32,179 36,294 - - 32,179 36,294 4,115 12.8%Recreation and culture 36,956 40,270 - - 36,956 40,270 3,314 9.0%Interest on long-term liabilities 45,059 56,922 - - 45,059 56,922 11,863 26.3%Healthcare - - 1,141,759 1,332,671 1,141,759 1,332,671 190,912 16.7%Airport - - 3,581 3,810 3,581 3,810 229 6.4%Sanitation - - 1,954 1,818 1,954 1,818 (136) (7.0%)
Total expenses 2,318,381 2,536,566 1,147,294 1,338,299 3,465,675 3,874,865 409,190 11.8%
Excess (deficiency) before transfers 151,104 143,998 (150,381) (197,683) 723 (53,685) (54,408) (7525.3%)
Transfers (574,489) (159,557) 574,489 159,557 - - -Change in net position (423,385) (15,559) 424,108 (38,126) 723 (53,685) (54,408) (7525.3%)Net position, beginning of year, as restated 1,114,470 679,247 491,071 908,628 1,605,541 1,587,875 (17,666) (1.1%)
Net position, end of year 691,085$ 663,688$ 915,179$ 870,502$ 1,606,264$ 1,534,190$ (72,074)$ -4.49%
Governmental Business-type TotalActivities Activities Total
Revenues
The County’s governmental activities’ revenues increased $211.1 million or 8.5 percent to $2.7 billion. The program revenues increased by $77.0 million or 5.2 percent, while general revenues increased by $134.0 million or 13.8 percent. Over the past three years, the County’s program revenues from its governmental activities have contributed about 63.6 percent of the cost of running those governmental programs. The general revenues support the programs by covering the remaining 36.4 percent of costs.
The largest source of program revenues for the County’s governmental activities is Federal and State grants and contributions, both operating and capital. These revenues amount to 83.2 percent of the County’s program revenues and 48.8 percent of its total revenues. For the year, operating grants increased by $79.8 million, while capital grants fell by $2.7 million. The net result was an increase in the Federal and State grants and contributions of $77.1 million. The reasons for these changes will be discussed in the governmental funds area.
The County’s governmental activities’ general revenues increased by $134.0 million or 13.8 percent. General revenues are not directly related to governmental programs and include: taxes (property, business, and sales), unrestricted grants, investment income, gain on sale of capital assets, and other revenue. General revenues support government programs by defraying costs, which those programs cannot cover from their own revenues. Tax revenues are the County’s second largest revenue source - grants and contributions being the largest. The County earned $1.0 billion in tax revenues (property tax, sales and use tax, and other taxes) for the current year. This is approximately 90.6 percent of the general revenues and 37.5 percent of the total revenues. These general revenues provide the Board of Supervisors (the Board) with most of its discretionary spending ability. The reasons for these changes will be discussed in the governmental funds area.

13
The County’s general revenues increased mainly due to:
An increase of $95.2 million in property taxes primarily due to an 8.4 percent increase in total propertyassessed values. This increase resulted from an increase in secured property tax collection of $40.3 million,$15.3 million in property tax in lieu of vehicle license fee, and $25.7 million in property taxes – retired benefitlevy. In addition, there was an increase of $3.8 million in distribution of residual Redevelopment PropertyTax Trust Fund (RPTTF) and $9.0 million increase from Low and Moderate Income Housing Funds(LMIHF) due to wind down of municipal redevelopment agencies.
An increase of $35.1 million in sales taxes mainly from Measure A which passed in November 2012 andincreased sales tax for the county by one-eighth of a cent.
These topics will be discussed in Financial Analysis of the County’s Funds section on page 16.
Expenses and Transfers
Expenses for governmental activities increased by $218.2 million or 9.4 percent. All categories experienced higher costs than in the prior year. The primary reasons for the changes are explained below:
General Government increased by $34.1 million or 11.3 percent for a variety of reasons including:
Increased by $13.5 million in salaries and benefits mainly due to filling of vacant positions in FY 2014, 2.0percent countywide salary increase, increase in employee retirement plan.
Increased by $12.9 million in expenditures related to property tax retiree benefit levy due to a 9.0 percentgrowth received in FY2014.
Increased by $5.4 million from increased expenses for Homeland Security and Urban Areas SecurityInitiative (UASI) grants to support security enhancements for the County.
Increased by $4.9 million from implementing multi-phased regional interoperable radio and datacommunication projects in FY2014.
General Revenues By Source -Governmental Activities
Property tax 82.9%
Sales tax 4.5%
Other taxes 3.2%
Unrestricted grants &contributions 1.4%Investment earnings and securitieslending activities 0.8%Other revenue 7.2%
Program Revenues By Source - Governmental Activities
Charges for services16.9%
Operating grants &contributions 82.7%
Capital grants &contributions 0.4%

14
Public Protection increased by $48.4 million or 6.2 percent due to increases in staffing, salary amounts from union contracts, health insurance rates, and retiree medical insurance and retirement benefit contributions.
Public Ways and Facilities increased by $29.6 million or 96.4 percent mainly due to bridge and road repairs and maintenance, pedestrian and bicycle route improvements, and Measure B improvement projects which included widening and landscaping of highways.
Health and sanitation increased $36.9 million or 8.2 percent due to the following:
$12.5 million increase in salaries and benefits resulting from 8.0 percent increase in positions, 2.0 percentsalary increase, and additional contributions towards retiree medical and employee retirement and healthinsurance contributions.
$3.8 million increased primarily due to contract services related to Alcohol and Drug services as new fundingwas received from Drug Medi-Cal for adults program, Probation for Pathway Ranch, California Departmentof Corrections and Rehabilitation (CDCR), and AB109 funding for housing parole violator in County jail.
$18.1 million increased in contracts for mental health treatment of adult and children.
Public Assistance increased by $49.9 million or 7.8 percent primarily due to the following:
$34.7 million increase in salaries and benefits due to increases in staffing by 5.0 percent, salary amounts fromunion contracts, health insurance rates, and retiree medical insurance and retirement benefit contributions.
$3.9 million increase in contract services due to the implementation of the Affordable Care Act Health CareReform.
$4.1 million increase in services charged by Employment Services Agency (ESA) due to transfer of SocialServices Agency’s Human Resources and Equal Opportunity Department to ESA to enhance efficiencies,standardize processes, and provide for adequate supervision.
$5.8 million increase in insurance premiums for eligible independent providers in In Home Support Services.
Interest on Long-Term Debt increased by $11.9 million or 26.3 percent mainly due from the issuance of the 2013 Series B general obligation bonds.
Transfers decreased by $414.9 million was primarily due to the issuance and transfer of $490.4 million in general obligation bond proceeds to SCVMC in the prior fiscal year and a higher General Fund subsidy by $89.0 million to SCVMC this fiscal year.
The following chart shows the County’s expenses by functional category for the governmental activities.
General Government 13.3%
Public Protection 33.0%
Recreation & Culture 1.6%
Public Assistance27.1%
Education1.4%
Health and Sanitation19.2%
Public ways and facilities
2.2% Interest on long-term debt
2.2%
Expenses By Function/Program - Governmental Activities

15
Business-type activities Business-type activities decreased the County’s net position by $44.7 million, of which $6.5 million was related to the implementation of GASB Statement No. 65. The business-type activities had a net loss before transfers of $197.7 million, which was partially offset by net transfers of $159.6 million.
The largest of the County’s business-type activities, healthcare operations, had $1.3 billion in expenses and $1.1 billion in program revenues for the year. This is about 99.5 percent of the program revenues of all business-type activities.
Healthcare operations program revenues increased by $144.0 million or 14.6 percent which was mainly the result of increases in net patient revenues. This increase was the result of new programs that generated additional revenues and increased census of 6.0 percent and patient visits of 11.0 percent compared to the prior fiscal year. In addition, Medicaid Covered Expansion (MCE) patients are now reimbursed at full cost.
Healthcare operations program expenses increased by $190.9 million or 16.7 percent due higher software maintenance for new systems, legal fees due to acquisition activities, outside medical costs from increased patient volume, and professional services for implementation of the “EPIC” system and other service contracts.
Transfers in decreased by $414.9 million primarily due to the issuance and transfer of general obligation bond proceeds in prior year. Similar transfer did not occur in the most recent fiscal year.
The other enterprise operations—airport and sanitation operations —are very small in size and did not change much in the year. The first chart below shows expenses and revenues by each business activity, while the second chart shows revenues by source for the business activities.
$-
$500
$1,000
$1,500
Health Care Airport SanitationDistrict
$1,333
$4 $2
$1,126
$3 $2
Expenses and Program Revenues -Business-type Activities
(Dollars in millions)
Expenses
ProgramRevenue
Revenues By Source -Business-type Activities
Charges for services 89.0%
Investment earnings 0.3%
Operating grants & contributions 9.5%
Capital grants & contributions 0.7%
Sales tax 0.5%

16
FINANCIAL ANALYSIS OF THE COUNTY’S FUNDS
The County uses fund accounting to ensure and demonstrate compliance with finance-related legal requirements. When applicable, prior year numbers have been reclassified to make them comparable to the current year.
Governmental funds The general government’s functions are reported in the general, special revenue, debt service, and capital project funds. The focus of these governmental funds is to provide information on near-term inflows, outflows, and balances of unrestricted resources. Such information is useful in assessing the County’s financing requirements. In particular, unassigned fund balance at the end of the fiscal year can serve as a useful measure of the County’s net resources available for spending.
At June 30, 2014, the County’s governmental funds reported total fund balances of $883.1 million, an increase of $12.7 million or 1.5 percent from the prior year. Approximately 48.9 percent of the combined fund balances, $431.6 million, constitutes fund balance that is available to meet the County’s current and future needs (committed, assigned and unassigned). The remainder of the fund balance totaling $451.5 million is either in nonspendable form or restricted for specific spending. This includes $10.4 million of items that are not expected to be converted to cash (for example: inventories, prepaid amounts, and long-term notes receivable) and $441.1 million restricted for programs or other purposes.
For its governmental funds, the County’s total revenues for the current fiscal year were $2.7 billion—an increase of $265.4 million or 11.1 percent from the last year. Total governmental fund expenditures increased by $238.0 million or 10.6 percent to $2.5 billion for the year. Primary reasons for these changes in revenues and expenditures for the governmental funds are explained in the framework of individual funds.
The General Fund is the chief operating fund of the County. Its unassigned fund balance was $237.9 million, at June 30, 2014, while its total fund balance was $365.0 million, a $41.1 million increase from the prior year. This was mainly due to an excess of revenues over expenditures of $184.7 million for the fiscal year, which was offset by $143.5 million in transfers to other County funds and other financing sources. As a measure of the General Fund’s liquidity, it may be useful to compare both the unassigned fund balance and the total fund balance to total fund expenditures. The unassigned fund balance and the total fund balance represent 11.5 percent and 17.6 percent of the total General Fund expenditures at June 30, 2014, respectively.
The nonspendable and restricted portions of the General Fund’s fund balance were $9.8 million and $60.5 million, respectively. The remaining fund balance constitutes the spendable portion, which was $294.6 million. Of this amount, $237.9 million was unassigned fund balance. The remaining portions of spendable fund balance included $44.8 million of committed fund balance and $11.9 million of assigned fund balance. The committed portion represents amounts set aside by the County’s highest level of decision-making authority, the Board of Supervisors, for specific purposes. The assigned amounts include items earmarked by County management and include litigation reserves, amounts encumbered for future purchases, and amounts to be used for future operations.

17
General Fund revenues and expenditures for the year were $2.26 billion and $2.07 billion, respectively. While its revenues increased by $273.6 million or 13.8 percent for the year, its expenditures increased by $170.5 million or 9.0 percent. The General Fund’s revenues by sources and expenditures by function as well as changes from the prior fiscal year are presented below:
Table 3—General Fund Revenue Classified by Source (in thousands)
FY 2014
Amount34.7% $ 811,660
0.7% 13,922 0.6%2.7% 52,401 2.3%0.3% 8,732 0.4%
54.4% 1,217,760 54.0%5.5% 109,258 4.9%1.8% 41,290 1.8%
FY 2013 FY 2014Percent Amount
10.4% $ 240,78233.2% 673,700 32.5%
2,402 0.1% 5,329 0.3%21.9% 451,786 21.8%33.0% 675,223 32.6%
1,814 0.1% 996 0.1% 9,332 0.5% 10,056 0.5%
0.8% 12,487 0.6% 2,070,359 100.0%
FY 2013
PercentRevenues by source Amount Percent Amount PercentTaxes 688,233$ 123,427 17.9%Licenses and permits 13,251 671 5.1%Fines, forfeitures and penalties 52,834 (433) (0.8%)Interest and investment income 5,809 2,923 50.3%Intergovernmental revenues 1,077,021 140,739 13.1%Charges for services 109,425 (167) (0.2%)Other revenue 34,802 6,488 18.6%
Total 1,981,375$ 100.0% 2,255,023$ 100.0% 273,648$ 13.8%
Increase/(Decrease)
Table 4—General Fund Expenditures by Function (in thousands)
Expenditures by function Amount Percent Amount PercentGeneral government 197,631$ 43,151 21.8%Public protection 630,552 43,148 6.8%Public ways and facilities 2,927 121.9%Health and sanitation 416,674 35,112 8.4%Public assistance 627,102 48,121 7.7%Capital outlay (818) (45.1%)
Principal retirement 724 7.8%Interest and fiscal charges 14,375 (1,888) (13.1%)
Totals 1,899,882$ 100.0% 170,477 9.0%
Increase/(Decrease)
Our discussion on the County’s governmental activities identified key reasons for changes in its revenues and expenditures that also help explain significant changes in the General Fund because it is the chief operating fund of the County, and its revenues and expenditures respectively cover 84.7 percent and 83.1 percent of the County’s total current year revenues and expenditures of all governmental funds. For this reason, we will briefly mention the points that were elaborated in our earlier discussion on the countywide revenues and expenses.
Intergovernmental revenues increased by $140.7 million or 13.1 percent. This was mainly due to an increase in Mental Health MediCal revenues by $58.8 million. Effective January 1, 2014, the Health Care Reform Medical Expansion was implemented to include low income health plan clients. Furthermore, the State Realignment for Health and Welfare increased by $16.5 million, Child Welfare Support Realignment increased by $7.6 million, and Public Safety Realignment increased by $28.0 million due to increases in sales tax collection from an improved economy. There was also an increase in Medical Administration reimbursements from State by $9.0 million and Federal by $10.0 million due to the implementation of the Affordable Care Act. The County increased its resources due to this implementation which increase the reimbursements from both Federal and State. Lastly, the revenues increased due to SB90 State reimbursements by $6.2 million as the State’s financial stability brightened allowing it to pay SB90 claims due from prior years.
Tax revenues increased by $123.4 million or 17.9 percent. This was mainly due to an approximately 8.4 percent increase in total property assessed values which led to an increase in secured property tax revenues of $27.5
36.0% $
11.6% $
$
18
million, $15.1 million increase in property tax in-lieu of vehicle license fees, and $25.7 million increase in property taxes - retired benefit levy. In addition, real estate transactions increased which led to increase in supplemental taxes of $5.4 million and $2.7 million in real property transfer tax. Furthermore, FY 2014 included a $3.8 million increase from the residual distributions from the Redevelopment Property Tax Trust Fund (RPTTF) and $9.0 increase from the former redevelopment agencies’ Low and Moderate Income Housing Funds due to the wind down of redevelopment agencies located in the County pursuant to the Redevelopment Dissolution Act. Lastly, Measure A which increases sales tax by one-eighth of a cent passed in November 2012; thus, the County only collected one quarter of this tax in prior year. A full year of sales tax collections contributed to an increase of $35.2 million in FY 2014.
Other revenue increased by $6.5 million or 18.6 percent. This was mainly due to a receipt of $2.3 million for regional interoperable radio and communications project reimbursements from the participating cities. Additionally, there was an excess in Educational Revenue Augmentation Funds apportionment which resulted to an increase in revenue by $2.0 million to the County.
Pertinent reasons for changes in General Fund expenditures are not different from what was explained in the earlier discussion on the countywide governmental programs and activities.
Proprietary funds The County’s proprietary funds provide the same type of information found in the government-wide financial statements, but in more detail.
As of June 30, 2014, the County’s net position in its enterprise funds was $982.2 million. The net investment in capital assets was $617.5 million. The restricted net position of the enterprise funds were $363.6 million. These assets represent resources that are subject to external restrictions on how they may be used. The unrestricted net position as of June 30, 2014 was $1.1 million. The net position of the County’s enterprise funds decreased by $25.2 million for the year, of which $6.6 million was from the implementation of GASB Statement No. 65. Primary reasons for the change in net position are explained in the framework of individual enterprise funds.
SCVMC is the largest enterprise fund and its revenues and expenses comprise 77.8 percent of the total operating revenues and 80.8 percent of the total operating expenses for all enterprise funds. The other three enterprise funds— Airport, Sanitation District, and Valley Health Plan—are very small in comparison.
The net position for SCVMC decreased by $39.6 million. Operating revenues increased by $242.2 million or 31.8 percent and operating expenses increased by $329.1 million or 38.5 percent. The net capital contributions and transfers were $151.3 million for the year. The primary reason for the changes in revenues and expenses were discussed in the business-type activities section. The net position of SCVMC was $939.7 million with a negative unrestricted net position of $19.2 million. The restricted net position of SCVMC was $363.3 million and the net investment in capital assets was $595.7 million. On July 1, 2013, the SCVMC transferred $15.3 million to establish the Valley Health Plan fund in order to separately account for the County’s health insurance program to Medi-Cal members. There were no significant changes to the net position for the Airport, Sanitation District, and the Valley Health Plan during the year.
GENERAL FUND BUDGETARY HIGHLIGHTS
The County’s final budget appropriations for FY 2014 were $2.6 billion, which was $79.2 million or 3.1 percent higher than the original budget adopted by the Board. Occasionally, unexpected events may cause the County to commit its one-time reserves or use ongoing resources to pay for those unplanned events. Differences between the original and final budgets represent supplemental appropriations approved by the Board for various new grants received by the County or to pay for increased service level that was not expected when the original budget was approved.
19
General Fund revenues and expenditures were less than the budgetary estimates for the year. Estimated revenues for the year exceeded actual revenues by $259.3 million or 10.0 percent. Fines, Forfeitures, and Penalties, Intergovernmental Revenues, and Interfund Transfers came in lower than estimates. Final budgetary appropriations exceeded actual expenditures by $338.2 million or 12.8 percent for the year. These cost savings resulted from unspent appropriations of: a) $45.8 million in salaries and benefits costs due to eliminating or not filling vacant positions; b) $140.6 million in services and supplies costs for government programs – general government, health and sanitation, public assistance, and public protection; c) $1.7 million in lower debt service payments; d) $1.5 million in capital outlay; e) $9.0 million from Special Program amounts designated for the Healthy Kids program and $2.5 million Cash Reserve approved by the Board of Supervisors; $2.3 million in inter-fund transfers set aside related to system re-engineering by the Assessor’s Office; $1.9 million from PG&E rebates set aside payable to Qualified Energy Conservation Bonds; and f) $132.2 million remaining in contingency reserves.
The General Fund budgetary comparison schedule starts on page 110 of this report.
CAPITAL ASSETS AND DEBT ADMINISTRATION
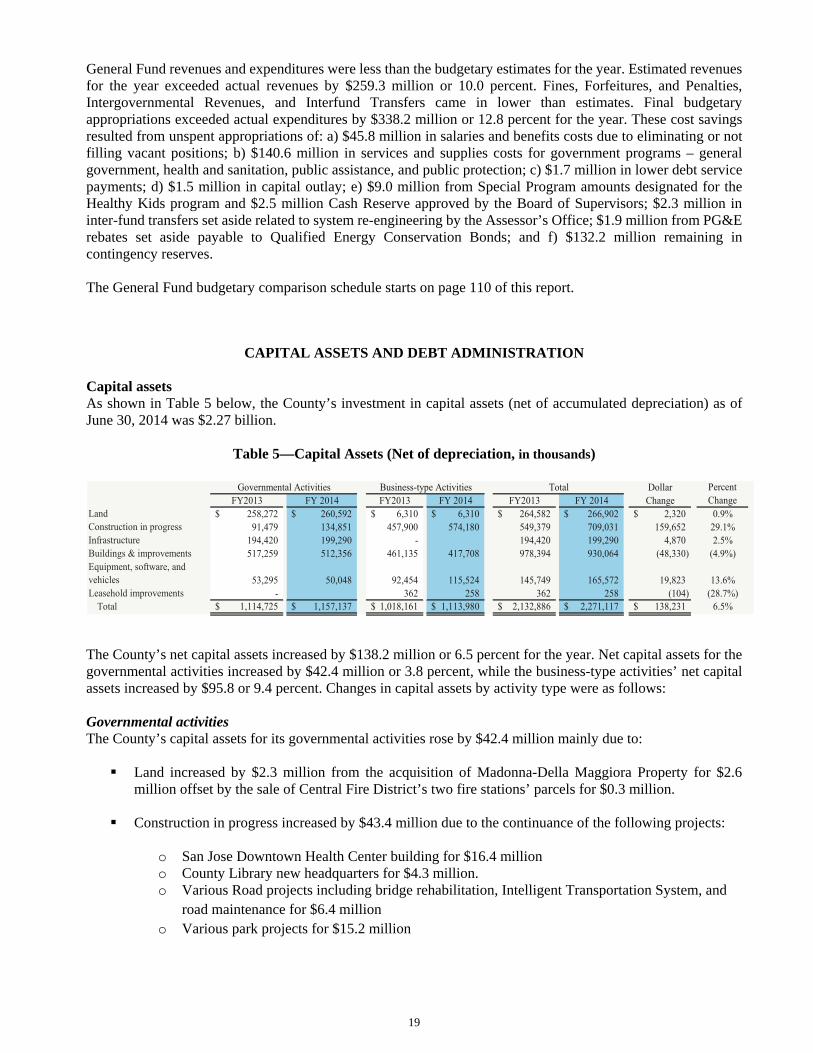
Capital assets As shown in Table 5 below, the County’s investment in capital assets (net of accumulated depreciation) as of June 30, 2014 was $2.27 billion.
Table 5—Capital Assets (Net of depreciation, in thousands)
Governmental Activities Business-type Activities TotalFY2013 FY 2014 FY2013 FY 2014 FY2013 FY 2014
$ 258,272 $ 260,592 $ 6,310 $ 6,310 $ 264,582 $ 266,902 $ 2,320 0.9%91,479 134,851 574,180 549,379 709,031 159,652 29.1%
194,420 199,290 194,420 199,290517,259 512,356 461,135 417,708 978,394 930,064
50,048 92,454 115,524 145,749 165,572 13.6%362 258 362 258
6.5%
DollarChange
PercentChange
457,900- 4,870
(48,330)2.5%
(4.9%)
53,295-
19,823(104) (28.7%)
$ 1,114,725 $ 1,157,137 $ 1,018,161 $ 1,113,980 $ 2,132,886 $ 2,271,117 $ 138,231
Land Construction in progressInfrastructureBuildings & improvementsEquipment, software, and vehiclesLeasehold improvements
Total
The County’s net capital assets increased by $138.2 million or 6.5 percent for the year. Net capital assets for the governmental activities increased by $42.4 million or 3.8 percent, while the business-type activities’ net capital assets increased by $95.8 or 9.4 percent. Changes in capital assets by activity type were as follows:
Governmental activities The County’s capital assets for its governmental activities rose by $42.4 million mainly due to:
Land increased by $2.3 million from the acquisition of Madonna-Della Maggiora Property for $2.6million offset by the sale of Central Fire District’s two fire stations’ parcels for $0.3 million.
Construction in progress increased by $43.4 million due to the continuance of the following projects:
o San Jose Downtown Health Center building for $16.4 milliono County Library new headquarters for $4.3 million.o Various Road projects including bridge rehabilitation, Intelligent Transportation System, and
road maintenance for $6.4 milliono Various park projects for $15.2 million

20
Buildings and improvements decreased by $4.9 million attributable to a relatively higher depreciation of$15.7 million compared to the total addition to buildings and improvements of $11.1 million. Theadditions are due to the completion of the following projects:
o Renovation of the Juvenile Hall detention buildings for $4.0 milliono Repairs at the Elmwood and Main Jail correctional facilities for $3.5 milliono $2.7 million in projects completed by various departments
Infrastructure increased by $4.9 million due the completion of major capital projects by Roads andAirports and Parks Departments.
Equipment, vehicles and software decreased by $3.2 million primarily due to the retirement of oldvehicles and equipment.
Business-type activities
Net capital assets for business-type activities increased by $95.8 million for the year. This increase was due to the current year addition in construction in progress by $116.3 million, which includes seismic compliance capital program of SCVMC buildings and facilities and $23.1 million increase in equipment and vehicles purchases. These increases were offset by a reduction of $43.4 million in building and improvements from an increase in accumulated depreciation of $18.6 million and a reclassification of improvements to equipment of $25.0 million.
Commitment of Resources for Construction Work in Progress At June 30, 2014, the County had committed $22.8 million of its net position from the governmental activities and $18.0 million of its net position from the business-type activities for various uncompleted capital projects included in the construction in progress.
Additional information on the County’s capital assets can found in Note 6 on page 61 of this report.
Long-term debt The County’s long-term outstanding debt as of June 30, 2014 was $2.2 billion as shown in Table 6 below:
Table 6—Outstanding Debt (in thousands)
The County’s long-term debt decreased by $56.2 million mainly due to the repayment of the 1985 Series A & B ACES and 1997 Series A lease revenue bonds. These were offset by $8.9 million and $7.3 million increases in accreted interest on Tobacco Settlement Asset-Backed bonds and Taxable Pension Funding bonds, respectively.
Additional information on the County’s long-term debt can be found in Note 9 on page 67 of this report.
For its outstanding debt, the Standard & Poor’s (S&P) raised its rating from AA to AA+ on the County’s existing lease revenue bonds and pension obligation bonds. In addition, S&P also raised its rating on County’s general obligation from AA+ to AAA. This rating is the highest possible long-term rating. Additional information on the County’s ratings changes on its long term debt can be found in Note 16 on page 106.
Governmental Activities Business-type Activities TotalFY2013 FY 2014 FY2013 FY 2014 FY2013 FY 2014
416,066 $ 418,337 $ $ 857,704 854,825 857,704 854,825 258,683 230,797 587,292 551,068 845,975 148,309 157,191 148,309 157,191 8,882 6.0%
3,575 3,387 3,575491 272 491
DollarChange
PercentChange
- -
- - -
0.5%(0.3%)(7.6%)
(5.3%)
(2.5%)
781,865
3,387 272
- - -
2,271 (2,879)
(64,110)
(188)
Taxable pension funding bonds $ General obligation bondsLease revenue bondsCapital appreciation bonds
- $ 416,066 $ 418,337 $ -
(219) (44.6%)$ 1,684,828 $ 1,664,809 $ 587,292 $ 551,068 $ 2,272,120 $ 2,215,877 $ (56,243)
Certificates of participationCapital lease obligations
Total

21
ECONOMIC FACTORS AND NEXT YEAR’S BUDGET AND RATES
The County continues to recover from one of the greatest economic downturns since the Great Depression. This is indicative of the County’s budget for the upcoming year, which projected a 5.0 percent increase in revenue and 3.6 percent increase in net expenditure. The budgeted expenditures exceed budgeted revenue by $180.9 million in the FY 2015. The deficit is expected to be covered by available FY 2014 fund balance. On the surface this relatively low increase in cost comparing to the greater increase in revenue indicate a solid step into financial stability. The following economic factors, some pointing to a long awaited recovery, were considered in the County’s 2015 budget:
The County’s unemployment rate continues to improve as the rate for June 2014 was 5.4 percent. This is animprovement from June 2013 when the unemployment rate was 6.8 percent. In comparison, the statewideunemployment rate for June 2014 was 7.3 percent, a decrease of 1.6 percent from the prior year at 8.9 percent.
The real per capita income (a measure of wealth creation) as of March 2013 (most current available data)increased from $61,028 to $65,679. The real per capita income on a national level was $45,188, an increaseof $2,019 from the prior year. These increases are signs of an improving economy.
After several years of declining valuations, the housing prices continued to grow for a third straight year.This was demonstrated by the median price for single family homes, which increased to $808,000, a 14.6percent increase from a year ago. This increase was fueled by tight inventory of homes for sale, low mortgageinterest rates, and investor demand.
Venture capital investment, a leading indicator of innovation and long-term development, rebounded from adecrease in 2012, up 45.5 percent in FY 2014 compared to FY 2013, an increase of $12.2 billion. SiliconValley and San Francisco regions, taken together, accounted for 48.6 percent of the national total and 86.5percent of the state’s total. High technology including software, networking and equipment,telecommunication, IT services, and semiconductors attracted the largest funding.
Research and development, office, and warehouse space occupancy, which are leading indicators ofeconomic activity, showed improved results compared to the past year. The vacancy rate for research anddevelopment space was 12.2 percent in 2014 versus 13.0 percent a year ago. The office space vacancy ratewas 10.3 percent in 2014 compared to 12.4 percent last year. The vacancy rate for warehouse space droppedfrom 13.5 percent in June 2013 to 7.3 percent in June 2014.
Assessed value for real property, which increased by 8.4 percent, contributed to an increase of $27.0 millionin current secured property tax revenue. The current unsecured property value decreased by 4.0 percent witha tax decrease of $1.4 million. The property tax delinquencies on secured property decreased from 0.8 percentin FY 2013 to 0.7 percent in FY 2014. Property transfer tax revenue increased by 12.0 percent or $2.6 million.Supplemental tax revenues increased by 64.0 percentage or 5.4 million due to significant marketimprovement and negative supplemental tax in prior years being absorbed. The FY 2015 budget assumes a6.4 percent in secured property assessed value, which corresponds to an increase of $44.6 million in propertytax value.
The FY 2015 Countywide budget of $4.9 billion included a 6.8 percent increase in comparison to the prior year’s budget. This increase was due to the restoration and enhancement of administrative infrastructure, improving access and capacity to prepare for the Affordable Care Act, and continued commitment towards the country’s physical and technological infrastructure.
The FY 2015 budget sets aside $112.7 million in contingency reserves. Operating reserve designations and the strategic reserve designations are part of the financial resources that are available to address unanticipated revenue shortfalls or unforeseen expenditures. These designations provide a primary defense against deficit spending and help maintain liquidity when budgeted draw-downs become necessary.

22
This page intentionally left blank.

Basic Financial Statements

This page intentionally left blank.

Business-Governmental type Component
Activities Activities Total Units
Assets:Cash and investments 1,057,948$ 170,064$ 1,228,012$ 156,307$ Receivables, net of allowance for uncollectibles 96,656 132,266 228,922 77,457 Internal balances 115,792 (115,792) - - Due from other governmental agencies, net 315,194 70,246 385,440 17,007 Receivables from related parties and component units 7,635 - 7,635 58,262 Inventories 4,177 19,403 23,580 - Net pension asset 377,513 - 377,513 - Other assets 11,058 4,632 15,690 23,332 Restricted cash and investments 71,164 415,440 486,604 22,723 Capital assets:
Nondepreciable 395,443 580,490 975,933 55,162 Depreciable, net of accumulated depreciation 761,694 533,490 1,295,184 345,077
Total assets 3,214,274 1,810,239 5,024,513 755,327
Deferred outflows of resources:Unamortized loss on refunding debt 886 9,553 10,439 - Deferred outflows on derivative instruments - 16,976 16,976 - Other - - - 16,576
Total deferred outflows of resources 886 26,529 27,415 16,576
Liabilities:Accounts payable 107,292 64,442 171,734 50,283 Accrued salaries and benefits 34,874 21,347 56,221 135 Accrued liabilities 67,677 46,391 114,068 35,959 Estimated third-party payer settlements - 114,937 114,937 - Due to related parties - - - 11,098 Due to other governmental agencies 40,945 74,073 115,018 4,636 Unearned revenue 44,525 5,439 49,964 214 Payable to primary government - - - 7,635 Noncurrent liabilities:
Due within one year 84,038 38,390 122,428 9,917 Due in more than one year 2,158,251 584,271 2,742,522 304,219
Derivative instruments liabilities - 16,976 16,976 -
Total liabilities 2,537,602 966,266 3,503,868 424,096
Deferred inflows of resources:Deferred service concession arrangement receipts 13,870 - 13,870 - Other - - - 2,501
Total deferred inflows of resources 13,870 - 13,870 2,501
Net position (see Note 11(a)):Net investment in capital assets 959,157 617,486 982,361 84,884 Restricted for:
Capital facilities - 362,574 - - Debt service 21,248 1,038 22,286 - Parks 72,332 - 72,332 - Housing programs 79,450 - 79,450 - Roads 56,482 - 56,482 - Mental health 98,119 - 98,119 - Other purposes 128,762 - 128,762 21,208
Unrestricted (751,862) (110,596) 94,398 239,214
Total net position 663,688$ 870,502$ 1,534,190$ 345,306$
The notes to the basic financial statements are an integral part of this statement.
Primary Government
COUNTY OF SANTA CLARA
Statement of Net Position
June 30, 2014(In thousands)
23

Indirect Operating CapitalExpenses Charges for Grants and Grants and
Expenses Allocation Services Contributions ContributionsFunction/program activities:
Primary government:Governmental activities:
General government 369,922$ (33,717)$ 100,062$ 208,821$ -$Public protection 829,829 2,201 97,169 250,353 - Public ways and facilities 59,648 684 2,534 42,642 6,799 Health and sanitation 478,469 8,541 46,993 201,139 - Public assistance 684,040 3,463 5,205 595,460 - Education 35,849 445 6,689 1,393 - Recreation and culture 39,344 926 6,022 544 - Interest on long-term liabilities 56,922 - - - -
Total governmental activities 2,554,023 (17,457) 264,674 1,300,352 6,799
Business-type activities:Healthcare 1,315,269 17,402 1,009,930 108,809 7,234 Airport 3,755 55 3,039 - - Sanitation 1,818 - 2,371 - -
Total business-type activities 1,320,842 17,457 1,015,340 108,809 7,234
Total primary government 3,874,865$ -$ 1,280,014$ 1,409,161$ 14,033$
Component units 734,694$ 720,120$ 19,129$ 10,770$
General revenues:Property taxesSales and use taxesOther taxesUnrestricted motor vehicle in lieu of taxesGrants/contributions not restricted to specific programsInvestment incomeOther:
Penalties on delinquent taxesTobacco settlement revenuesMiscellaneous revenues
Transfers
Total general revenues and transfers
Change in net position
Net position, beginning of year, as previously reportedPrior period adjustments
Net position, beginning of year, as restated
Net position, end of year
COUNTY OF SANTA CLARA
Statement of Activities
For the Fiscal Year Ended June 30, 2014(In thousands)
The notes to the basic financial statements are an integral part of this statement.
Program Revenues
24

Business-Governmental type Component
Activities Activities Total UnitsFunction/program activities:
Primary government:Governmental activities:
(27,322)$ -$ (27,322)$ -$ General government(484,508) - (484,508) - Public protection
(8,357) - (8,357) - Public ways and facilities(238,878) - (238,878) - Health and sanitation
(86,838) - (86,838) - Public assistance(28,212) - (28,212) - Education(33,704) - (33,704) - Recreation and culture(56,922) - (56,922) - Interest on long-term liabilities
(964,741) - (964,741) - Total governmental activities
Business-type activities:- (206,698) (206,698) - SCVMC- (771) (771) - Airport- 553 553 - Sanitation District
- (206,916) (206,916) - Total business-type activities
(964,741) (206,916) (1,171,657) - Total primary government
- - - 15,325 Component units
General revenues:919,612 - 919,612 - Property taxes
49,537 5,553 55,090 - Sales and use taxes433 - 433 - Other taxes
35,164 - 35,164 - Unrestricted motor vehicle in lieu of taxes15,765 - 15,765 - Grants/contributions not restricted to specific programs
8,391 3,680 12,071 3,883 Investment incomeOther:
35,392 - 35,392 - Penalties on delinquent taxes15,688 - 15,688 - Tobacco settlement revenues28,757 - 28,757 7,485 Miscellaneous revenues
(159,557) 159,557 - - Transfers
949,182 168,790 1,117,972 11,368 Total general revenues and transfers
(15,559) (38,126) (53,685) 26,693 Change in net position
691,085 915,179 1,606,264 318,698 Net position, beginning of year, as previously reported(11,838) (6,551) (18,389) (85) Prior period adjustments
679,247 908,628 1,587,875 318,613 Net position, beginning of year, as restated
663,688$ 870,502$ 1,534,190$ 345,306$ Net position, end of year
Net (Expense) Revenue and Changes in Net PositionPrimary Government
The notes to the basic financial statements are an integral part of this statement.
25

OtherGeneral Governmental
Fund Funds TotalAssets:
Cash and investments:Unrestricted 407,708$ 482,294$ 890,002$ Restricted with fiscal agents - 682 682 Other restricted 69 55,725 55,794
Receivables:Property taxes 2,886 - 2,886 Other, net of allowance for uncollectibles 20,031 61,461 81,492
Due from other funds 5,181 2,767 7,948 Due from other governmental agencies, net 301,503 12,061 313,564 Inventories 2,165 613 2,778 Other assets 7,038 610 7,648 Advances to other funds 607 - 607
Total assets 747,188$ 616,213$ 1,363,401$
Liabilities, Deferred Inflows of Resources and Fund Balances:Liabilities:
Accounts payable 84,048$ 14,437$ 98,485$ Accrued salaries and benefits 27,866 6,055 33,921 Other accrued liabilities 30,896 12,921 43,817 Due to other funds 1,024 1,945 2,969 Due to other governmental agencies 40,268 663 40,931 Advances from other funds - 607 607 Unearned revenue 42,365 2,160 44,525
Total liabilities 226,467 38,788 265,255
Deferred inflows of resources:Unavailable revenue 155,762 59,254 215,016
Fund balances:Nonspendable 9,810 613 10,423 Restricted 60,506 380,616 441,122 Committed 44,842 99,745 144,587 Assigned 11,945 37,197 49,142 Unassigned 237,856 - 237,856
Total fund balances 364,959 518,171 883,130
Total liabilities, deferred inflows of resources, and fund balances 747,188$ 616,213$ 1,363,401$
The notes to the basic financial statements are an integral part of this statement.
(In thousands)
COUNTY OF SANTA CLARA
June 30, 2014
Governmental FundsBalance Sheet
26

Fund balances - total governmental funds (page 26) 883,130$
Amounts reported for governmental activities in the
statement of net position are different because:
Capital assets used in governmental activities are not financial resourcesand, therefore, are not reported in the governmental funds. 1,148,246
Prepaid bond insurance costs and loss on bond refundings are capitalized andamortized over the life of the corresponding bonds for purposes of the statement of net position. 1,307
Other long-term receivables are not available to pay for current period expenditures and therefore are recorded as deferred inflows of resources in the funds. 215,016
Long-term receivables from the Housing Authority with matching long term liabilities and service concession arrangementsare not current financial resources and therefore are notreported in the governmental funds. 14,872
Deferred inflows of resources related to the receivable and capital assets fromthe service concession arrangements are not due and payable in the current period and therefore are not reported in the governmental funds. (13,870)
Internal service funds are used by management to charge the costs ofmanagement of information services, fleet management, insurance, printing,unemployment insurance, workers' compensation, employee benefits,retiree healthcare and pension obligation to individual funds. The assets and liabilities are included in governmental activities in the statement of net position. (128,727)
Long-term liabilities, including bonds payable, are not due and payable in thecurrent period and therefore are not reported in the governmental funds.
Bonds payable (excludes Pension Funding Bonds recorded in the internal service funds) (1,246,200)$ Accrued vacation and sick leave (140,986) Capital lease obligations (272) Accrued interest payable (16,606) Net OPEB obligations - Santa Clara Central Fire Protection District (40,236) Pollution remediation obligation (6,330) Accrued litigation liability (5,656) (1,456,286)
Net Position - governmental activities (page 23) 663,688$
The notes to the basic financial statements are an integral part of this statement.
(In thousands)June 30, 2014
COUNTY OF SANTA CLARA
Reconciliation of the Governmental Funds Balance Sheet to theGovernment-wide Statement of Net Position - Governmental Activities
27

OtherGeneral Governmental
Fund Funds TotalRevenues:
Taxes 811,660$ 167,705$ 979,365$ Licenses and permits 13,922 23,445 37,367 Fines, forfeitures, and penalties 52,401 9,332 61,733 Interest and investment income 8,732 4,970 13,702 Intergovernmental revenues 1,217,760 155,539 1,373,299 Charges for services 109,258 35,364 144,622 Other revenue 41,290 9,491 50,781
Total revenues 2,255,023 405,846 2,660,869
Expenditures:Current:
General government 240,782 204 240,986 Public protection 673,700 136,610 810,310 Public ways and facilities 5,329 57,854 63,183 Health and sanitation 451,786 29,404 481,190 Public assistance 675,223 2,323 677,546 Education - 35,093 35,093 Recreation and culture - 37,387 37,387
Capital outlay 996 66,988 67,984 Debt service:
Principal retirement 10,056 17,319 27,375 Interest and fiscal charges 12,487 36,290 48,777 Advance refunding escrow - 1,090 1,090 Cost of issuance - 308 308
Total expenditures 2,070,359 420,870 2,491,229
Excess of revenues over expenditures 184,664 (15,024) 169,640
Other financing sources (uses):Proceeds from sale of capital assets 5,008 264 5,272 Bond premium - 909 909 Proceeds of refunding bonds - 11,715 11,715 Payment to bond refunding escrow - (12,310) (12,310) Transfers in 79,140 60,909 140,049 Transfers out (227,679) (74,887) (302,566)
Total other financing sources (uses) (143,531) (13,400) (156,931)
Net change in fund balances 41,133 (28,424) 12,709
Fund balances, beginning of year 323,826 546,595 870,421
Fund balances, end of year 364,959$ 518,171$ 883,130$
The notes to the basic financial statements are an integral part of this statement.
(In thousands)For the Fiscal Year Ended June 30, 2014
COUNTY OF SANTA CLARA
Statement of Revenues, Expenditures, and Changes in Fund BalancesGovernmental Funds
28

Reconciliation of the Statement of Revenues, Expenditures, andChanges in Fund Balances of Governmental Funds to the Government-wide
Statement of Activities - Governmental Activities
For the Fiscal Year Ended June 30, 2014
Net change in fund balances - total governmental funds (page 28) 12,709$
Amounts reported for governmental activities in thestatement of activities are different because:
Governmental funds report capital outlay as expenditures. However, in the statement of activities, the cost of those assets is allocated over their estimated useful lives and reported as depreciation expense.
Expenditures for capital assets 83,912$ Net effect of various miscellaneous transactions involving capital assets (i.e., sales, disposals, donations) (402)Less current year depreciation (44,426) 39,084
Prepaid bond insurance costs are expended in governmental funds when paid, however, are capitalized and amortized over the life of the correspondingbonds for the purposes of the statement of activities.
Amortization of prepaid bond insurance costs (114)
Revenues in the statement of activities that do not provide current financialresources are not reported as revenues in the funds. (7,840)
Revenues recognized in the governmental funds that were earned andrecognized in previous years and are reported as beginning net position in the statement of activities. (5,000)
Issuance and refunding of bonds are reported as other financing sources in governmental funds and thus contribute to the change in fund balances. However, bonds issuance changes long-term liabilities in the statement of net position and do not affect the statement of activities. (12,624)
Repayment of debt principal is an expenditure in the governmental funds,but the repayment reduces long-term liabilities in the statement of net position. 40,775
Some expenses reported in the statement of activities do not require theuse of current financial resources and therefore are not reported asexpenditures in governmental funds.
Amortization of bond premium 3,021Amortization of loss on refunding debt (300)Change in accrued interest payable (1,676) Change in accreted interest - Tobacco Settlement Asset-Backed Bonds (8,882) Change in net OPEB obligations - Santa Clara Central Fire Protection District (2,014) Change in pollution remediation obligations (430)Change in accrued litigation liability (3,156) Change in long-term compensated absences (4,792) (18,229)
Internal service funds are used by management to charge the costs ofcertain activities to individual funds. The net expense of the internalservice funds is reported with governmental activities. (64,320)
Change in net position of governmental activities (page 25) (15,559)$
The notes to the basic financial statements are an integral part of this statement.
COUNTY OF SANTA CLARA
(In thousands)
29

GovernmentalActivitiesInternal
SCVMC Other Total Service FundsAssets:
Current assets:Cash and investments:
Unrestricted 114,472$ 55,592$ 170,064$ 167,946$ Restricted with fiscal agent - 775 775 14,177 Other restricted 414,665 - 414,665 511
Receivables:Patient accounts receivable, net of
estimated uncollectables 129,218 - 129,218 -Other 2,321 727 3,048 5,041
Due from other funds 900 1,370 2,270 21Due from other governmental agencies 70,246 - 70,246 1,630 Inventories 19,403 - 19,403 1,399 Prepaid rent/insurance 4,610 - 4,610 2,018
Total current assets 755,835 58,464 814,299 192,743
Noncurrent assets:Net pension asset - - - 377,513 Other assets - 22 22 971Capital assets:
Nondepreciable 576,308 4,182 580,490 1,295 Depreciable, net of accumulated depreciation 511,258 22,232 533,490 7,596
Total noncurrent assets 1,087,566 26,436 1,114,002 387,375 Total assets 1,843,401 84,900 1,928,301 580,118
Deferred outflows of resources:Unamortized loss on refunding debt 9,553 - 9,553 -Deferred outflows on derivative instruments 16,976 - 16,976 -
Total deferred outflows of resources 26,529 - 26,529 -Liabilities:
Current liabilities:Accounts payable 39,883 24,559 64,442 8,807 Accrued salaries and benefits 20,971 376 21,347 953Accrued liabilities 40,947 5,444 46,391 7,254 Due to other funds 5,420 936 6,356 914Due to third-party payers 114,937 - 114,937 -Due to other governmental agencies 74,073 - 74,073 14Unearned revenue - 5,439 5,439 -Current portion of insurance claims - - - 40,722 Current portion of accrued vacation and sick leave 12,481 80 12,561 339Current portion of bonds payable 25,610 219 25,829 5,950
Total current liabilities 334,322 37,053 371,375 64,953
Noncurrent liabilities:Noncurrent portion of insurance claims - - - 101,147 Noncurrent portion of accrued vacation and sick leave 58,012 1,020 59,032 5,173 Noncurrent portion of bonds payable 520,873 4,366 525,239 412,387 Net OPEB obligation - - - 236,891 Derivative instruments liabilities 16,976 - 16,976 -
Total noncurrent liabilities 595,861 5,386 601,247 755,598
Total liabilities 930,183 42,439 972,622 820,551 Net position:
Net investment in capital assets 595,657 21,829 617,486 8,891 Restricted:
Capital facilities 362,574 - 362,574 -Debt service 705 333 1,038 -
Unrestricted (19,189) 20,299 1,110 (249,324) Total net position 939,747$ 42,461$ 982,208 (240,433)$
Adjustment to reflect the consolidation of internal service fund activities to enterprise funds. (111,706) Net position of business-type activities 870,502$
The notes to the basic financial statements are an integral part of this statement.
(In thousands)
Business-type Activities - Enterprise Funds
COUNTY OF SANTA CLARA
Statement of Fund Net PositionProprietary Funds
June 30, 2014
30

GovernmentalActivitiesInternal
SCVMC Other Total Service FundsOperating revenues:
Charges for services 895,971$ 286,993$ 1,182,964$ 280,519$ Other program revenues 108,809 - 108,809 -
Net operating revenues 1,004,780 286,993 1,291,773 280,519 Operating expenses:
Salaries and benefits 762,135 12,155 774,290 221,029 Services and supplies 103,899 266,505 370,404 30,877 General and administrative - - - 4,256 Professional services 239,640 510 240,150 1,321 Depreciation 46,283 891 47,174 2,296 Amortization of net pension asset - - (3,635) Leases and rentals 6,921 - 6,921 28 Utilities 10,520 - 10,520 - Insurance claims and premiums 9,091 43 9,134 88,480 Other 6,250 1,220 7,470 -
Total operating expenses 1,184,739 281,324 1,466,063 344,652
Operating income (loss) (179,959) 5,669 (174,290) (64,133)
Nonoperating revenues (expenses):Taxes 5,553 - 5,553 - Investment income 3,407 273 3,680 2,960 Interest expense (20,557) (227) (20,784) (26,119) Gain (loss) on disposal of capital assets (79) (189) (268) 167 Other, net 667 4 671 366
Total nonoperating revenues (expenses), net (11,009) (139) (11,148) (22,626)
Income (loss) before capital contributions and transfers (190,968) 5,530 (185,438) (86,759)
Capital contributions 7,234 - 7,234 - Transfers in 181,246 17,445 198,691 2,960 Transfers out (37,134) (2,000) (39,134) -
Change in net position (39,622) 20,975 (18,647) (83,799)
Net assets, beginning of year, as previously reported 985,920 21,486 1,007,406 (155,377) Prior period adjustment (6,551) - (6,551) (1,257)
Net position, beginning of year, as restated 979,369 21,486 1,000,855 (156,634)
Net position, end of year 939,747$ 42,461$ 982,208$ (240,433)$
Change in net position of enterprise funds (18,647)$
Adjustment to reflect the consolidation of internal service funds to enterprise funds. (19,479)
Change in net position of business-type activities (38,126)$
The notes to the basic financial statements are an integral part of this statement.
COUNTY OF SANTA CLARA
Business-type Activities - Enterprise Funds
(In thousands)For the Fiscal Year Ended June 30, 2014
Proprietary FundsStatement of Revenues, Expenses, and Changes in Fund Net Position
31

GovernmentalActivitiesInternal
SCVMC Other Total Service Funds
Cash flows from operating activities:Cash receipts from customers and users 1,159,913$ 287,427$ 1,447,340$ 284,148$ Cash payment to suppliers for goods and services (354,917) (248,075) (602,992) (33,635) Cash payment to employees for services (753,696) (11,887) (765,583) (39,912) Cash payment for retirement benefits - - - (227,893) Cash payment for judgments and claims - - - (64,556) Other receipts 667 4 671 366
Net cash provided by (used in) operating activities 51,967 27,469 79,436 (81,482)
Cash flows from noncapital financing activities:Cash receipts from state grants - taxes realignment 5,251 - 5,251 - Cash receipts from borrowings to other funds - - - 105 Cash payments to other funds (23,609) (1,370) (24,979) - Principal paid on pension obligation bonds - - - (3,576) Interest paid on pension obligation bonds - - - (18,968) Transfers in 181,246 32,537 213,783 2,960 Transfers out (52,226) (2,000) (54,226) -
Net cash provided by (used in) noncapital financing activities 110,662 29,167 139,829 (19,479)
Cash flows from capital and related financing activities:Principal paid on bonds (34,397) (185) (34,582) - Interest paid (21,175) (227) (21,402) (3) Acquisition of capital assets (150,800) (9,447) (160,247) (5,632) Proceeds from sale of capital assets - - - 175 Capital contributions received 74 - 74 -
Net cash used in capital and related financing activities (206,298) (9,859) (216,157) (5,460)
Cash flows from investing activities:Proceeds from sale of investments - - - 126,160 Investment income received 2,826 273 3,099 9,594 Investment expenses paid - - - (32)
Net cash provided by investing activities 2,826 273 3,099 135,722
Net change in cash and cash equivalents (40,843) 47,050 6,207 29,301
Cash and cash equivalents, beginning of year 569,980 9,317 579,297 151,863
Cash and cash equivalents, end of year 529,137$ 56,367$ 585,504$ 181,164$
Cash and cash equivalents:Cash and investments:
Unrestricted 114,472$ 55,592$ 170,064$ 167,946$ Restricted with fiscal agents - 775 775 14,177 Other restricted 414,665 - 414,665 511 Less deposits and investments not meeting the definition of
cash and cash equivalents - - - (1,010)
Total cash and cash equivalents 529,137$ 56,367$ 585,504$ 181,624$ (Continued)
The notes to the basic financial statements are an integral part of this statement.
Business-type Activities - Enterprise Funds
For the Fiscal Year Ended June 30, 2014
Statement of Cash Flows
COUNTY OF SANTA CLARA
Proprietary Funds
(In thousands)
32

GovernmentalActivitiesInternal
SCVMC Other Total Service Funds
Business-type Activities - Enterprise Funds
For the Fiscal Year Ended June 30, 2014
Statement of Cash Flows
COUNTY OF SANTA CLARA
Proprietary Funds
(In thousands)
Reconciliation of operating income (loss) to net cash provided by (used in) operating activities:Operating income (loss) (179,959)$ 5,669$ (174,290)$ (64,133)$ Adjustments to reconcile operating income (loss)
to net cash provided by (used in) operating activities:Depreciation 46,283 891 47,174 2,296 Amortization of net pension asset - - - (3,635) Provision for bad debts 40,856 - 40,856 - Miscellaneous nonoperating revenues, net 667 4 671 366 Decrease (increase) in assets:
Receivables (73,569) (565) (74,134) 526 Due from other funds - - - 2,432 Due from other governmental agencies 35,456 - 35,456 (1,208) Receivables from component units 27,272 - 27,272 - Inventories (526) - (526) (195) Prepaid rent/insurance 542 - 542 (165) Other assets - 141 141 -
Increase (decrease) in liabilities:Accounts payable 2,784 19,028 21,812 3,011 Accrued salaries and benefits - 119 119 - Accrued liabilities 27,043 1,034 28,077 357 Due to third-party payers 68,201 - 68,201 - Accrued vacation and sick leave - 149 149 1,342 Insurance claims - - - 23,937 Due to other governmental agencies 57,317 - 57,317 13 Due to other funds - - - 170 Unearned revenue (400) 999 599 - Net OPEB obligation - - - (46,596)
Net cash provided by (used in) operating activities 51,967$ 27,469$ 79,436$ (81,482)$
Supplemental disclosure of noncash investing, capital andrelated financing activities:
Noncash capital and related financing activities:Acquisition of capital assets through accounts payable 6,335$ -$ 6,335$ -$ Amortization of bond discounts 29 - 29 - Amortization of bond premiums (1,671) - (1,671) - Amortization of loss on refunding debt 1,269 - 1,269 - Amortization of prepaid insurance costs 30 - 30 - Decrease in rebatable arbitrage 21 - 21 - Transfer of current assets from (to) other funds (49) 49 - - Transfer of capital assets from (to) other funds (32) 32 - - Transfer of current liabilities from (to) other funds (14,413) 14,413 - - Transfer of noncurrent liabilities from (to) other funds (760) 760 - -
Noncash investing activities:Net change in fair value of investments not considered
cash and cash equivalents - - - (6,602)
Noncash noncapital financing activities:Accretion of interest on capital appreciation bonds - - - 7,311
The notes to the basic financial statements are an integral part of this statement.
33

Investment Private Purpose AgencyTrust Funds Trust Fund Funds
Assets:Cash and investments:
Unrestricted 2,945,723$ 39,861$ 219,004$ Other restricted 5 347 259
Receivables:Property taxes - - 64,812Interest 12,852 226 6,432Other - 85 245
Due from other agency funds - - 57,595 Due from other governmental agencies - - 975Other assets - 74,243 2,468
Total assets 2,958,580 114,762 351,790
Liabilities:Accounts payable - 39,150 - Other accrued liabilities - 372 - Due to other funds - - 57,595 Due to other governmental agencies - 574 1,210 Deposits from others - 74,332 - Fiduciary liabilities - - 292,985
Total liabilities - 114,428 351,790
Net position:Net position held in trust 2,958,580$ 334$ -$
The notes to the basic financial statements are an integral part of this statement.
(In thousands)
COUNTY OF SANTA CLARA
Statement of Fiduciary Net PositionFiduciary Funds
June 30, 2014
34

Investment Private-PurposeTrust Funds Trust Fund
Additions:Contributions to pooled investments 10,542,342$ -$ Interest and investment income 9,470 41
Total additions 10,551,812 41
Deductions:Distributions and administrative expenses 10,447,882 14
Change in net position 103,930 27
Net position held in trust, beginning of year 2,854,650 307
Net position held in trust, end of year 2,958,580$ 334$
The notes to the basic financial statements are an integral part of this statement.
(In thousands)
COUNTY OF SANTA CLARA
Statement of Changes in Fiduciary Net PositionFiduciary Funds
For the Fiscal Year Ended June 30, 2014
35

36
This page intentionally left blank.

COUNTY OF SANTA CLARA
Notes to the Basic Financial Statements June 30, 2014
(Dollars in thousands)
37
(1) Summary of Significant Accounting Policies (a) Description of the Reporting Entity
The County of Santa Clara (County), California (State), was established on June 1, 1850. The County’s powers are exercised through a Board of Supervisors (the Board), which is the governing body of the County. The Board is responsible for the legislative and executive control of the County. The County provides various services on a County-wide basis and certain services only to unincorporated areas. Services provided include law and justice, education, detention, social services, health, hospital, fire protection, sanitation, road construction and maintenance, park and recreation facilities, elections and records, communications, planning, zoning, treasury, and tax collection. The governmental reporting entity consists of the County (Primary Government) and its component units. Component units are legally separate organizations for which the Board is financially accountable or other organizations whose nature and significant relationship with the County are such that exclusion would cause the County’s financial statements to be misleading or incomplete. Financial accountability is defined as the appointment of a voting majority of the component unit’s board, and (i) either the County’s ability to impose its will on the organization or (ii) there is potential for the organization to provide a financial benefit to or impose a financial burden on the County. Financial accountability is also defined as the fiscal dependency of the component units on the County and the potential for the component unit to provide a financial benefit to or impose a financial burden on the County regardless of the organization of the governing board of the component unit. The basic financial statements include both blended and discretely presented component units. The blended component units are, although legally separate entities, in substance part of the County’s operations and so data from these units are combined with data of the primary government. The discretely presented component units, on the other hand, are reported in a separate column in the government-wide financial statements to emphasize they are legally separate from the government. For financial reporting purposes, the County’s basic financial statements include all financial activities that are controlled by or are dependent upon actions taken by the County’s Board. The financial statements of the individual component units may be obtained from the County’s Controller-Treasurer Department located at 70 West Hedding Street, 2nd Floor, East Wing, San Jose, California 95110. Blended Component Units The County and the component units listed below have a financial and operational relationship which requires that they be blended into the County’s financial statements. The Board serves as the governing board of the County’s blended component units. In addition, the Santa Clara County Financing Authority, the Santa Clara County – El Camino Hospital District Hospital Facilities Authority, the Silicon Valley Tobacco Securitization Authority, and the Santa Clara County Tobacco Securitization Corporation provide services entirely or almost entirely to the County.

COUNTY OF SANTA CLARA
Notes to the Basic Financial Statements (Continued) June 30, 2014
(Dollars in thousands)
38
(1) Summary of Significant Accounting Policies (Continued)
The following component units are blended in the County’s basic financial statements:
Blended in the basic financial statementsComponent unit under the category of:Santa Clara County Central Fire Protection District Nonmajor governmental funds - all fire districtsSouth Santa Clara County Fire District are reported together in a special revenue fund.Los Altos Hills County Fire District
Santa Clara County Library Nonmajor governmental funds
Santa Clara County Vector Control District Nonmajor governmental funds
County Sanitation District 2 - 3 of Santa Clara County Sanitation District Enterprise Fund
Santa Clara County Financing Authority (SCCFA) SCCFA is included in the financial statements for the Santa Clara Valley Medical Center (SCVMC)and debt service funds of the governmental funds.
Santa Clara County - El Camino Hospital Nonmajor governmental funds District Hospital Facilities Authority
Silicon Valley Tobacco Securitization Authority Nonmajor governmental funds with the noncurrentliabilities included in the government-wide statementof net position.
Santa Clara County Tobacco Securitization Corporation Nonmajor governmental funds with the noncurrentliabilities included in the government-wide statementof net position.
In January 2014, the County entered into a termination agreement with the Santa Clara County – El Camino Hospital District Hospital Facilities Authority upon the payment of the related bonds and all other indebtedness incurred to construct the project on August 1, 2013 (see Note 9).
Discretely Presented Component Units The FIRST 5 Santa Clara County (FIRST 5) was created on March 30, 1999, under the provisions of the California Children and Families Act of 1998 (the Act). The Act became law in 1998 when California voters approved Proposition 10, authorizing the State to levy a tax on tobacco products to pay for programs to promote the healthy development of young children. FIRST 5’s board consists of nine members, two of whom are officers of the County, while the remaining seven are appointed by the Board. FIRST 5 does not provide a financial benefit nor impose a financial burden on the County. FIRST 5 is financially accountable to the County as the County appoints a voting majority of FIRST 5’s governing board, and the County is able to impose its will on FIRST 5. Due to the nature and significance of FIRST 5’s relationship with the County, FIRST 5 is a discretely presented component unit of the County. Complete financial statements for FIRST 5 can be obtained directly from its administrative office at 4000 Moorpark Avenue, Suite 200, San Jose, California 95117. The Housing Authority of the County of Santa Clara (Housing Authority) was established in 1967 by the Board. The purpose of the Housing Authority is to provide affordable housing to low-income families, elderly and handicapped in Santa Clara County. It accomplishes its objectives by providing management, administrative and educational services to tenants and landlords to facilitate the operation of the various federal and state pretax assistance programs. Most of the housing programs administered by the Housing Authority are funded by contributions from the U.S. Department of Housing and Urban Development (HUD).

COUNTY OF SANTA CLARA
Notes to the Basic Financial Statements (Continued) June 30, 2014
(Dollars in thousands)
39
(1) Summary of Significant Accounting Policies (Continued)
The Board appoints a voting majority of the Housing Authority’s Board of Commissioners and can remove appointed members at will. The Housing Authority is presented as a discretely presented component unit of the County. The Housing Authority’s governing body is not substantially the same as that of the County, and the Housing Authority does not provide services entirely or almost entirely to the County. The financial data included for the Housing Authority represents the aggregated data of its business-type activities and its component units. The Housing Authority has formed twelve non-profit organizations and one for-profit corporation to further facilitate its goals. During the year ended June 30, 2014, the Housing Authority had changes in its reporting entity resulting in a restatement in the beginning net position in the amount of $85. Complete financial statements for the Housing Authority can be obtained directly from its administrative office at 505 W. Julian Street, San Jose, CA 95110.
The Santa Clara Heath Authority, doing business as Santa Clara Family Health Plan and the Santa Clara Community Health Authority (collectively, the Health Authority), was established by the County Board pursuant to Section 14087.38 of the Welfare and Institutional Code. The Health Authority was created for the purpose of developing the Local Initiative Plan for the expansion of Medi-Cal Managed Care. The majority of the Health Authority’s revenues are generated from a contract with the State of California Medi-Cal Program and a contract with the Centers for Medicare and Medicaid Services (CMS) for a Medicare program. The Health Authority is a legally separate entity governed by a thirteen-member governing board appointed by the County. In April 2012, the County adopted an ordinance, which granted the County the ability to remove the Health Authority’s governing board at will. Due to the nature and significance of Health Authority’s relationship with the County, the Health Authority is included in the County’s basic financial statements as a discretely presented component unit. The Health Authority is a nonprofit entity that is separate and apart from the County, and is not considered to be an agency, division, or department of the County. Furthermore, the Health Authority is not governed by, nor is it subject to, the Charter of the County and is not subject to the County’s policies or operational rules. The Health Authority’s debts are not expected to be repaid with County resources. Therefore, the Health Authority’s data are presented separately from the data of the primary government. The Health Authority acquired a license under the Knox-Keene Health Care Services Plan Act, and is regulated by the State’s Department of Health Care Services (DHCS), California's Department of Managed Health Care (DMHC), and the Centers for Medicare and Medicaid Services (CMS). Complete financial statements for the Health Authority can be obtained directly from its administrative offices at 210 E. Hacienda Ave, Campbell, CA 95008.
(b) Basis of Presentation
Government-wide Financial Statements The statement of net position and statement of activities display information about the primary government (the County) and its component units. These statements include the financial activities of the overall government, except for fiduciary activities. Eliminations have been made to minimize the double counting of internal activities. These statements distinguish between the governmental and business-type activities of the County and between the County and its discretely presented component units. Governmental activities, which normally are supported by taxes, intergovernmental revenues and other non-exchange transactions, are reported separately from business-type activities, which rely to a significant extent on fees charged to external parties.

COUNTY OF SANTA CLARA
Notes to the Basic Financial Statements (Continued) June 30, 2014
(Dollars in thousands)
40
(1) Summary of Significant Accounting Policies (Continued)
The statement of activities presents a comparison between direct expenses and program revenues for each segment of the business-type activities of the County and for each function of the County’s governmental activities. Direct expenses are those that are specifically associated with a program or function and, therefore, are clearly identifiable to a particular function. Program revenues include: 1) charges paid by the recipients of goods or services offered by the programs, including fines and penalties, and 2) grants and contributions that are restricted to meet the operational or capital requirements of a particular program. Revenues that are not classified as program revenues, including all taxes imposed by the County, are presented instead as general revenues. When both restricted and unrestricted net position is available, unrestricted resources are used only after restricted resources are depleted. Fund Financial Statements The fund financial statements provide information about the County’s funds, including fiduciary funds and blended component units. Separate statements for each fund category – governmental, proprietary and fiduciary – are presented. The emphasis of fund financial statements is on major governmental and enterprise funds, each displayed in a separate column. All remaining governmental and enterprise funds are separately aggregated and reported as nonmajor funds. Proprietary funds distinguish operating revenues and expenses from nonoperating items. Operating revenues and expenses generally result from providing services in connection with the fund’s principal ongoing operations. The principal operating revenues of the County’s enterprise and internal service funds are charges for customer services including: medical center charges for services, sanitation and airport fees, insurance charges, employee benefits, employee retirement, healthcare, information services, vehicle and maintenance services and printing support charges. Operating expenses for enterprise funds and internal service funds include the cost of services, administrative expenses and depreciation on capital assets. All revenues and expenses not meeting this definition are reported as nonoperating revenues and expenses.
The County reports the following major governmental and enterprise funds:
General Fund is the general operating fund of the County. It accounts for all financial resources except those required to be accounted for in another fund.
SCVMC Enterprise Fund accounts for hospital and clinic services provided to County residents. Revenues consist primarily of patient service fees. An annual operating subsidy is provided by the General Fund to supplement SCVMC programs.
The County reports the following additional fund types:
Internal Service Funds provide for information technology, vehicle and maintenance, and printing services provided to County departments; life and dental insurance benefits, workers’ compensation, unemployment, retirement healthcare, and pension financing costs for County employees; and other liability claims against the County.
COUNTY OF SANTA CLARA
Notes to the Basic Financial Statements (Continued) June 30, 2014
(Dollars in thousands)
41
(1) Summary of Significant Accounting Policies (Continued)
Investment Trust Funds account for commingled pool assets held in trust for schools, other special districts and other agencies which use the County Treasury as their depository, as well as account for separate investments acquired for the Mountain View – Los Altos School District, Palo Alto Unified School District, San Jose-Evergreen Community College District, and West Valley Mission Community College District.
Private Purpose Trust Funds are used to account for resources for conservatees managed by the public guardians and administrators. These resources are restricted to a specified purpose that benefits individuals.
Agency Funds are custodial in nature and do not involve measurement of results of operations and account for assets held by the County as an agent for various local governments and individuals. Included are funds for child support payments; bail money posted for the Superior Court; employees’ long-term disability and supplemental life insurance premiums; and apportioned taxes for other local governmental agencies.
(c) Basis of Accounting
The government-wide financial statements are reported using the economic resources measurement focus and the accrual basis of accounting, as are the proprietary fund and fiduciary fund financial statements (excluding agency funds). Revenues are recorded when earned and expenses are recorded at the time liabilities are incurred, regardless of when the related cash flows take place. Non-exchange transactions, in which the County gives (or receives) value without directly receiving (or giving) equal value in exchange, include property and sales taxes, grants, entitlements and donations. On an accrual basis, revenues from property taxes are recognized in the fiscal year for which the taxes are levied. Revenues from sales tax are recognized when the underlying transactions take place. Revenues from grants, entitlements and donations are recognized in the fiscal year in which all eligibility requirements have been satisfied. Governmental funds are reported using the current financial measurement focus and modified accrual basis of accounting. Under this method, revenues are recognized when “susceptible to accrual” (i.e., when they become both measurable and available). “Measurable” means the amount of the transaction can be determined and “available” means that revenues are collectible within the current period or soon enough thereafter to be used to pay liabilities of the current period. Property tax revenues are recognized in the current year if they are collected within 60 days of year-end. For all other revenues, the County considers revenues to be available if they are collected within 120 days of the end of the current fiscal period. Revenues not considered available are recorded as deferred inflows of resources. The County’s other primary revenue sources: investment income, intergovernmental revenues, and charges for services have been treated as “susceptible to accrual” under the modified accrual basis. Licenses and permits, fines, forfeitures and penalties, and other revenue are not considered “susceptible to accrual” under the modified accrual basis and are recorded as revenues when received. Expenditures generally are recorded when a liability is incurred. However, debt service expenditures, as well as expenditures related to compensated absences and claims and judgments, are recorded when payment is due.

COUNTY OF SANTA CLARA
Notes to the Basic Financial Statements (Continued) June 30, 2014
(Dollars in thousands)
42
(1) Summary of Significant Accounting Policies (Continued)
(d) Federal, State, and Local Grant Funds
Proprietary funds’ federal, state, and local grants are accounted for in accordance with the purpose for which the grants are intended. Approved grants for the acquisition of land, buildings, and equipment are reported as capital contributions and grants for operating assistance are recorded as non-operating revenues in the year in which the grants are applicable and the related grant conditions are met.
(e) County Commingled Investment Pool
The County Treasurer manages a common cash and investment pool for the County, school and community college districts, special districts, and other local public agencies. Investments made by the Treasurer are regulated by the California Government Code and by a County investment policy approved annually by the Board after receiving recommendations from the County Treasury Oversight Committee. Adherence to the statutes and policies is monitored by the Board and the Treasury Oversight Committee. The pool consists of cash and investments that are either unrestricted or legally restricted to certain trust, bond issue, and specific expenditure purposes. The pool is not registered with the SEC as an investment company. State law requires that the County and its public school districts invest with the County Treasury. These involuntary external members’ shares comprise 61% of the pool. Investments of the pool are stated at fair value. The County Treasurer determines the fair value of the pool on a monthly basis, based on quoted market prices. The County has not provided nor obtained any legally binding guarantees during the year ended June 30, 2014 to support the value of shares in the pool. The value of the participants’ pool shares that may be withdrawn is determined on an amortized cost basis, which is different from the fair value of the participants’ positions in the pool. Separate Investments The County Treasurer oversees separate investments for most of the County’s reserve, payment, and capital resources arising from the issuance of various construction and technology bonds. In addition, self-insurance trusts and benefit plans for the County, Park Charter Fund, and certain school districts own additional separate investments managed by the Treasurer. All of these investments are classified as either unrestricted or restricted for other purposes on the accompanying balance sheets and statement of net position. The Santa Clara County Financing Authority maintains restricted cash and investments in separate bank accounts. Separate investments held by the County Treasury are also stated at fair value. The County Treasurer determines the fair value of these investments on a monthly basis, based on quoted market prices. Outside trustees provide monthly statements to report the fair value and pricing of the assets held by them, which are also based on quoted market prices.

COUNTY OF SANTA CLARA
Notes to the Basic Financial Statements (Continued) June 30, 2014
(Dollars in thousands)
43
(1) Summary of Significant Accounting Policies (Continued) Investment Income Realized earnings are allocated quarterly to the commingled investment pool participants based on the participants’ average daily cash balance relative to the entire pool. A negative average cash balance results in negative earnings that are netted against interest income. Changes in fair value are included in investment income for financial statement reporting purposes. The County follows legal or contractual provisions regarding the assignment of interest revenue to certain other funds. Interest on bond monies held in the non-major governmental funds have such arrangements. The assignment of other interest is based on management’s discretion. In accordance with Governmental Accounting Standards Board (GASB) Statement No. 31, Accounting and Financial Reporting for Certain Investments and External Investment Pools, interest revenue is reported in the fund in which it is earned. Subsequent assignments are reported as transfers.
(f) Statement of Cash Flows
For purposes of the accompanying statement of cash flows, the County considers all highly liquid investments (including restricted assets) with a maturity of three months or less from the original purchase to be cash equivalents. The majority of the proprietary funds’ deposits in the County Treasurer’s commingled pool is in substance, demand deposits and is, therefore, considered cash equivalents for purposes of the statement of cash flows.
(g) Inventories Inventories are stated at cost (using the first-in, first-out method), which approximates market, and consist of expendable supplies that are reduced as consumed. Inventories reported in governmental funds are offset by a corresponding nonspendable fund balance, which indicates that they are not in spendable form even though they are a component of current assets.
(h) Loans Receivable
For the purpose of the fund financial statements, governmental expenditures relating to long-term loan receivables arising from loan subsidy programs are charged to operations upon funding and the loans are recorded, net of an estimated allowance for potentially uncollectible loans, with an offset to a deferred inflows of resources account. The balance of the long-term receivable includes loans that may be forgiven if certain terms and conditions of the loans are met.
(i) Capital Assets The County defines capital assets as assets with an initial, individual cost of more than $150 for infrastructure and buildings and improvements, $100 for internally generated software, and $5 for equipment and vehicles with an estimated useful life in excess of one year. Donated capital assets are stated at their estimated fair market value on the date donated. Capital assets used in operations are depreciated or amortized (assets under capital leases and other intangible assets) using the straight-line method over the capital lease period or their estimated useful lives in the government-wide statements and proprietary fund statements. Certain assets, for which actual historical costs are

COUNTY OF SANTA CLARA
Notes to the Basic Financial Statements (Continued) June 30, 2014
(Dollars in thousands)
44
(1) Summary of Significant Accounting Policies (Continued) not available, have been reported using methods that approximate their historical costs. Depreciation of exhaustible capital assets is charged as an expense against the County’s operations, over their estimated useful lives in the government-wide statements and proprietary fund statements. Depreciation is computed using the straight-line method over the following estimated useful lives:
Infrastructure 20 to 50 years
Buildings and improvements 5 to 50 years
Equipment and vehicles 3 to 30 years
Interest is capitalized on proprietary funds’ construction in progress. Interest capitalized is the total interest cost from the date of the borrowing net of any interest earned on temporary investments of the proceeds of those borrowings until the specified asset is ready for its intended use.
(j) Property Tax Levy, Collection, and Maximum Rate The State’s Constitution, Article XIII A provides that the combined maximum ad valorem property tax rate on any given property may not exceed 1% of its assessed value except for rates levied to pay principal and interest on general obligation debt. Such debt shall have voter approval unless incurred prior to June 6, 1978. Assessed value is calculated at 100% of market value as defined by Article XIII A and may be increased no more than 2% per year unless the property is sold or transferred. Whenever there are changes in ownership, completed construction, or demolition, properties are subject to supplemental assessment based on the change in assessed valuation. Supplemental taxes are levied on the value change and prorated for the balance of the tax year. The State Legislature, through Assembly Bill 8 of 1979 and subsequent legislation, defined the methodology for distributing the 1% tax levy and collections among the County, cities, schools, and other local jurisdictions such as districts providing water, fire and library services. The County assesses property values and levies, bills and collects the related taxes as follows:
Secured UnsecuredLien dates January 1 January 1Levy dates October 1 July 1Due Dates 50% on November 1 Upon receipt of billing
50% on February 1Delinquent after December 10 (for November) August 31
April 10 (for February) Annually, the Board sets the rates to be applied to the tax roll for the benefit of local taxing jurisdictions as provided by State code. These taxes are secured by liens on the property being taxed. Taxes secured by land and improvements are levied on the Secured Tax Roll, while those taxes secured by personal property are levied on the Unsecured Tax Roll.

COUNTY OF SANTA CLARA
Notes to the Basic Financial Statements (Continued) June 30, 2014
(Dollars in thousands)
45
(1) Summary of Significant Accounting Policies (Continued) In 1994, the Board adopted the Alternative Method of Tax Apportionment (the Teeter Plan). Under this method, the County distributes 100% of the secured tax levy to participating jurisdictions, regardless of collections. To cover losses on delinquent tax sales, counties using the Teeter Plan must maintain a Tax Losses Reserve Fund. The Tax Losses Reserve Fund is included in the County’s “Apportioned Tax Resources” Agency Fund. When the balance in this fund exceeds the minimum balance required by the State code, the excess may be transferred to the General Fund.
(k) Interfund Transactions
Interfund transactions are reflected as loans, services provided, reimbursements or transfers. Loans reported as receivables and payables, as appropriate, are subject to elimination upon consolidation. The fund financial statements referred to these loans as either “due to/from other funds” (i.e., the current portion of interfund loans) or “advances to/from other funds” (i.e. the noncurrent portion of interfund loans). Any residual balances outstanding between the governmental activities and the business-type activities are reported in the government-wide statements as “internal balances.” Services provided, deemed to be at market or near market rates, are treated as revenues and expenditures or expenses. Reimbursements occur when one fund incurs a cost, charges the appropriate benefiting fund and reduces its related cost as a reimbursement. All other interfund transactions are treated as transfers. Transfers between governmental or proprietary funds are netted as part of the reconciliation to the government-wide presentation.
(l) Bond Issuance Costs, Original Issue Discounts and Premiums, and Debt Refundings Bond premiums, discounts and prepaid insurance costs for the government-wide statement of net position and proprietary fund types are recorded and amortized over the term of the bonds using a method that approximates the interest method. Bond premiums and discounts in the government-wide statements and in proprietary fund types are presented as an increase or reduction of the face amount of bonds payable, whereas prepaid insurance costs are recorded as an asset. The County also has losses on refunding of debt, which result from the difference in the carrying value of refunded debt and its reacquisition price. This amount is recorded as a deferred outflow of resources and amortized over the shorter of the life of the refunded or the refunding debt. In the fund financial statements, governmental funds recognize bond premiums and discounts as other financing sources and uses, respectively. Issuance costs, including prepaid insurance costs, whether or not withheld from the actual debt proceeds received, are reported as debt service expenditures.
(m) Leases The County leases various assets under both operating and capital lease agreements. For governmental fund types, assets under capital leases and the related long-term lease obligations are reported as capital assets and long-term liabilities in the governmental-wide statement of net position, respectively. For proprietary fund types, the assets and related capital lease obligations are recorded in the appropriate proprietary fund.
COUNTY OF SANTA CLARA
Notes to the Basic Financial Statements (Continued) June 30, 2014
(Dollars in thousands)
46
(1) Summary of Significant Accounting Policies (Continued) (n) Accrued Vacation and Sick Leave
Accumulated unpaid vacation and sick leave are recorded as a liability when future payments for such compensated absences have been earned by employees based on pay and salary rates in effect at year-end. This liability is recorded in the government-wide statement of net position and in the various proprietary funds to reflect the County’s obligation to fund such costs from future operations. The County includes its share of Social Security and Medicare payments made on behalf of the employees in its accrual for compensated absences. Unused vacation and sick leave are paid out upon separation from the County based on the terms stated in the Memorandum of Understanding between the employees’ bargaining units and the County. The County does not accrue for compensated absences in its governmental fund statements and recognizes liabilities for compensated absences only if they are due and payable in an event such as termination.
(o) Deferred Outflows/Inflows of Resources
In addition to assets, the statement of financial position will sometimes report a separate section for deferred outflows of resources. This separate financial statement element represents a consumption of net position that applies to a future period(s) and so will not be recognized as an outflow of resources (expense/expenditure) until then. In addition to liabilities, the statement of financial position will sometimes report a separate section for deferred inflows of resources. This separate financial statement element represents an acquisition of net position that applies to a future period(s) and so will not be recognized as an inflow of resources (revenue) until that time. The County also reports deferred inflows of resources in the governmental funds balance sheet when revenues from property taxes, from the federal and State, and other sources are not available. These amounts are deferred and recognized as revenues in the period the amounts become available.
(p) Effects of New Pronouncements
During the year ended June 30, 2014, the County implemented the following GASB Statements: In March 2012, GASB issued Statement No. 65, Items Previously Reported as Assets and Liabilities, which is intended to clarify the appropriate reporting of deferred outflows of resources and deferred inflows of resources to ensure consistency in financial reporting. The statement also recognizes, as outflows of resources or inflows of resources, certain items that were previously reported as assets and liabilities. As of July 1, 2013, the County adopted the provisions of GASB Statement No. 65 and restated the beginning net positions of its governmental activities, business-type activities, proprietary funds and internal service funds in the amount of $10,957, $3,188, $3,188 and $1,257, respectively, to write off unamortized bond issuance costs. The County also restated the beginning net positions of its governmental activities, business-type activities, and proprietary funds in the amount of $881, $3,363 and $3,363, respectively, to write off unamortized bond issuance costs included in the loss on refunding debt balance. In addition, the remaining balance of the loss on refunding debt was reclassified from a contra liability to a deferred outflows of resources in the government-wide and proprietary funds statements of net position. The County also reclassified revenues totaled $228,321 at July 1, 2013 that are unavailable in governmental funds to deferred inflow of resources.

COUNTY OF SANTA CLARA
Notes to the Basic Financial Statements (Continued) June 30, 2014
(Dollars in thousands)
47
(1) Summary of Significant Accounting Policies (Continued) The adoption of this Statement changed the presentation of the Housing Authority’s financial statements to reclassify items from assets to deferred outflows of resources and liabilities to deferred inflows of resources for the year ended June 30, 2014. In March 2012, GASB issued Statement No. 66, Technical Corrections – 2012 - An Amendment of GASB Statements No. 10 and No. 62. This statement resolves conflicting accounting and financial reporting guidance that could diminish the consistency of financial reporting. This statement amends Statement No. 10, Codification of Accounting and Financial Reporting for Risk Financing and Related Insurance Issues, by removing the provision that limits fund-based reporting of a state or local government’s risk financing activities to the general fund and the internal service fund type. This statement also amends Statement No. 62, Codification of Accounting and Financial Reporting Guidance Contained in Pre-November 30, 1989 FASB and AICPA Pronouncements, by modifying the specific guidance on accounting for (1) operating lease payments that vary from a straight-line basis, (2) the difference between the initial investment (purchase price) and the principal amount of a purchased loan or group of loans, and (3) servicing fees related to mortgage loans that are sold when the stated service fee rate differs significantly from a current servicing fee rate. Implementation of this statement did not have a significant impact on the County for the fiscal year ended June 30, 2014. In April 2013, the GASB issued Statement No. 70, Accounting and Financial Reporting for Nonexchange Financial Guarantees. The statement establishes accounting and financial reporting standards for governments that offer or receive financial guarantees that are nonexchange transactions. The new standard is effective for periods beginning after June 15, 2013. Implementation of this statement did not have a significant impact on the County for the fiscal year ended June 30, 2014. The County is currently analyzing its accounting practices to determine the potential impact on the financial statements for the following GASB Statements: In June 2012, GASB issued two new standards, GASB Statement No. 67, Financial Reporting for Pension Plans - An Amendment of GASB Statement No. 25 and GASB Statement No. 68, Accounting and Financial Reporting for Pensions - An Amendment of GASB Statement No. 27 to improve the guidance for accounting and reporting on the pensions that governments provide to their employees. In November 2013, the GASB issued Statement No. 71, Pension Transition for Contributions Made Subsequent to the Measurement Date – an amendment of GASB Statement No. 68, which clarifies reporting for contributions made after the measurement date of the pension liability. Key changes include the following:
Separating the determination of accounting and financial reporting from how pensions are funded.
Employers with defined benefit pension plans will recognize a net pension liability, as defined by the standard, in their government-wide, proprietary and fiduciary fund financial statements.

COUNTY OF SANTA CLARA
Notes to the Basic Financial Statements (Continued) June 30, 2014
(Dollars in thousands)
48
(1) Summary of Significant Accounting Policies (Continued)
Incorporating ad hoc cost-of-living adjustments and other ad hoc postemployment benefit changes into projections of benefit payments, if an employer’s past practice and future expectations of granting them indicate they are essentially automatic.
Using a discount rate that applies (a) the expected long-term rate of return on pension plan investments for which plan assets are expected to be available to make projected benefit payments, and (b) the yield or index rate on tax-exempt 20-year general obligation municipal bonds with an average rating of AA/Aa or higher to projected benefit payments for which plan assets are not expected to be available for long-term investment in a qualified trust.
Adopting a single actuarial cost allocation method – entry age normal – rather than the current choice among six actuarial cost methods.
Requiring more extensive note disclosures and required supplementary information.
The statements relate to accounting and financial reporting and do not apply to a government’s approach for funding of its pension plan. At present, there generally is a close connection between the ways many governments fund pensions and how they account for and report information about them in financial statements. The statements would separate how the accounting and financial reporting is determined from how pensions are funded. The County does not report a pension trust fund and as such the implementation of Statement No. 67 did not have an impact on the County for the fiscal year ended June 30, 2014. Application of Statements Nos. 68 and 71 must be simultaneously and are effective for the County’s fiscal year ending June 30, 2015.
The County is also currently analyzing its accounting practices to determine the potential impact on the financial statements for GASB Statement No. 69, Government Combinations and Disposals of Government Operations. The statement establishes accounting and financial reporting standards for governments that combine or dispose of their operations. The new standard is effective for periods beginning after December 15, 2013. Application of this statement is effective for the County’s fiscal year ending June 30, 2015.
(q) Use of Estimates The preparation of basic financial statements in conformity with accounting principles generally accepted in the United States of America requires management to make estimates and assumptions that affect the reported amounts and disclosures. Actual results could differ from those estimates.
(2) Stewardship, Compliance and Accountability
Deficit Net Position At June 30, 2014, the Workers’ Compensation, Retiree Healthcare, and Pension Obligation Internal Service Funds have deficit net position of $45,353, $190,329, and $47,354, respectively. For the Workers’ Compensation Internal Service Fund, beginning with the annual contribution for 2014-15 fiscal year, the County implemented a 6-year funding plan to bring program assets to the actuarial determined required level by June 30, 2020. The County has developed a funding plan to reduce its deficit in the Retiree Health Care Internal Service Fund by increasing funding over the next four years to attain the Annual Required Contribution (ARC) level in fiscal year 2018 and maintaining ARC payments over the next 30 years. The deficit for the Pension Obligation Internal Service Fund is expected to be eliminated through rate increases for repayment of the 2007 Taxable Pension Funding Bonds.

COUNTY OF SANTA CLARA
Notes to the Basic Financial Statements (Continued) June 30, 2014
(Dollars in thousands)
49
(3) Cash and Investments
(a) Description The County Treasurer maintains common cash and investment pools in which cash may be invested by individual County funds and certain independent local governmental agencies. In addition, investments are held separately by the Treasurer for other County funds, including: County Parks, the Retiree Healthcare Internal Service Fund and certain school districts. Each fund type’s share of the common pool is combined with cash and investments held separately and shown on the accompanying balance sheet and statement of net position as “cash and investments” and “restricted cash and investments.” Cash and investments – restricted with fiscal agents represent monies held by trustees that are legally restricted for the retirement of long-term debt. Cash and investments – other restricted includes monies held in the County Treasury restricted by debt covenants for construction projects and professional services and restricted for specific purposes consisting primarily of reserves for employee benefits and certain other debt service funds.
(b) Investment Policies
The objectives of the County’s investment policy, in order of priority, are safety of principal to ensure preservation of capital in the overall portfolio, maintenance of liquidity sufficient to meet anticipated operating requirements, and to attain a market rate of return throughout budgetary and economic cycles, taking into account the County’s investment risk constraints and cash flow characteristics. The objectives of the policy also insure mitigation of interest rate risk, credit risk, and concentration of credit risk.

COUNTY OF SANTA CLARA
Notes to the Basic Financial Statements (Continued) June 30, 2014
(Dollars in thousands)
50
(3) Cash and Investments (Continued) The table below identifies the investment types that are authorized for the County by the California Government Code (or the County’s investment policy, where more restrictive). This table does not address investments of debt proceeds held by bond trustees that are governed by the provisions of debt agreements, rather than the general provisions of the California Government Code or the County’s investment policy.
Maximum Maximum Credit Ratings
Maximum Percentage Investment MinimumAuthorized Investment Type Maturity Of Portfolio In One Issuer (2 Ratings)U.S. Treasury Obligations 5 years None None N/AU.S. Agency Securities 5 years None None N/AState Local Agency Investment Fund (LAIF) N/A None $50 million N/ARepurchase Agreements 92 days None None N/AReverse Repurchase Agreements 92 days 20% $90 million * NoneSecurities Lending 92 days 20% * None N/ACollateralized Bank Deposits 5 years None None NoneNegotiable Certificates of Deposit 5 years 30% 5% A-1/P-1/F1 *Bankers' Acceptances 180 days 40% 5% A-1/P-1/F1 *Commercial Paper 270 days 40% 5% A-1/P-1/F1 *Medium-Term Corporate Notes 5 years 30% 5% Aa3/AA-/AA-*
MIG-1/SP-1/F1A3/A-/A-
Money Market Funds - Taxable N/A 20% 10% Aaa/AAA/AAA Money Market Funds - Tax-Exempt N/A 20% 10% Aaa/AAA/AAA **Federal Agency Mortgage Backed Securities 5 years 20% * None None
Asset Backed Securities 5 years 20% NoneA3/A-/A- for issuer, Aa3/AA-/AA- for
security
None10% *5 yearsMunicipal Obligations
_______________
* Represents restriction in which the County’s investment policy is more restrictive than the California Code
** Minimum of one credit rating required for Tax-Exempt Money Market Funds
In accordance with Government Code Sections 53620-53622 the assets of the Santa Clara County Retiree Healthcare Plan, which is reported in an Internal Service Fund, may be invested in bonds that have a final maturity of 30 years or less from purchase date and in bonds with a Moody’s credit rating of A3 or higher, Standard and Poor’s rating of A- or higher, or Fitch’s rating of A- or higher at time of purchase. Additionally, the Board has determined that up to 67% of the Retiree Healthcare Plan assets, excluding near-term liability payouts, may be invested in equities through mutual funds or through the direct purchase of common stocks by a money management firm(s) approved by the Board. Investments of debt proceeds held by bond trustees are governed by provisions of debt agreements, rather than the general provisions of the California Government Code or the County’s investment policy.

COUNTY OF SANTA CLARA
Notes to the Basic Financial Statements (Continued) June 30, 2014
(Dollars in thousands)
51
(3) Cash and Investments (Continued)
(c) Summary of Cash and Investments Total County cash and investments are reported as follows:
Unrestricted Restricted TotalPrimary Government 1,228,012$ 486,604$ 1,714,616$ Component Units 156,307 22,723 179,030 Investment Trust Funds 2,945,723 5 2,945,728 Private-Purpose Trust Fund 39,861 347 40,208 Agency Funds 219,004 259 219,263
Total cash and investments 4,588,907$ 509,938$ 5,098,845$
The County’s cash and investments are as follows:
Cash and deposits:Cash on hand 77$ Deposits of the County 170,787 Restricted deposits 2,028 Deposits with component units:
Housing Authority 54,024 FIRST 5 1,450 Health Authority 28,266
Total cash and deposits 256,632
Investments:With Treasurer 4,731,289 With Treasurer - FIRST 5 1,574 With Treasurer - Health Authority 10,231 With fiscal agents 15,632 With Housing Authority 19,830 With FIRST 5 63,657
Total investments 4,842,213
Total cash, deposits and investments 5,098,845$
(d) Custodial Credit Risk – Deposits Custodial credit risk for deposits is the risk that, in the event of the failure of a depository financial institution, the County will not be able to recover its deposits or will not be able to recover collateral securities that are in the possession of an outside party. The California Government Code and the County’s investment policy do not contain legal or policy requirements that would limit the exposure to custodial credit risk for deposits, other than the following provision. The California Government Code requires that a financial institution secure deposits made by state or local governmental units by pledging securities in an undivided collateral pool held by a depository regulated under state law (unless so waived by the governmental unit). The market value of the pledged securities in the collateral pool must equal at least 110% of the total amount deposited by the public agencies. California law also allows financial institutions to secure County deposits by pledging first trust deed mortgage notes having a value of 150% of the secured public deposits.

COUNTY OF SANTA CLARA
Notes to the Basic Financial Statements (Continued) June 30, 2014
(Dollars in thousands)
52
(3) Cash and Investments (Continued)
(e) Investment Composition As of June 30, 2014, the major classes of the County’s investments consisted of the following:
Interest Rates Par Value Fair Value 0 - 1 1 - 3 3 - 5 5 - 10With Treasurer:
Commingled pool:U.S. Treasury Notes 0.25% - 0.63% 235,000$ 235,401$ 75,145$ 160,256$ -$ -$ U.S. Agencies - Coupon 0.11% - 5.05% 3,042,164 3,052,087 1,153,555 1,888,209 10,323 - U.S. Agencies - Discount 0.05% - 0.18% 245,000 244,953 244,953 - - - Medium-term corporate notes 0.50% - 2.25% 168,500 169,205 73,699 95,506 - - Asset Backed Securities 0.18% - 1.98% 200,046 200,238 53,839 128,347 18,052 - Municipal Bonds 1.25% - 8.3% 56,895 59,842 1,074 39,329 19,439 - Repurchase Agreements 0.04% - 0.06% 125,000 125,000 125,000 - - - Commercial paper 0.20% 100,000 99,775 99,775 - - - Negotiable Certificates of Deposit 0.19% - 0.65% 200,000 200,022 185,009 15,013 - - Money Market Mutual Funds 0.03% 240,777 240,776 240,776 - - - LAIF 0.23% 40,000 40,000 40,000 - - -
Subtotal commingled pool 4,653,382 4,667,299 2,292,825 2,326,660 47,814 -
Separate investments:U.S. Treasury Notes 24,500 24,715 13,443 11,272 - - U.S. Agencies - Coupon 14,600 14,528 10,053 - 4,475 - Municipal bonds 20,470 23,080 100 8,961 11,251 2,768 Money market mutual funds 13,473 13,472 13,472 - - -
Subtotal separate investments 73,043 75,795 37,068 20,233 15,726 2,768
Subtotal with Treasurer 4,726,425 4,743,094 2,329,893 2,346,893 63,540 2,768
With fiscal agents:U.S. Treasury Notes 4,240 4,251 - 1,961 2,290 - U.S. Agencies - Coupon 7,400 7,478 1,962 3,321 2,195 - Medium-term corporate notes 1,430 1,459 102 833 524 - Asset Backed Securities 879 880 - 234 646 - Money market mutual funds 1,564 1,564 1,564 - - -
Subtotal with fiscal agents 15,513 15,632 3,628 6,349 5,655 -
With Housing Authority:Money market mutual funds 26 26 26 - - - LAIF 19,804 19,804 19,804 - - -
Subtotal with Housing Authority 19,830 19,830 19,830 - - -
With FIRST 5:U.S. Treasury Notes 13,723 13,715 - 6,730 6,985 - U.S. Agencies - Coupon 26,750 27,108 759 16,929 9,420 - Medium-term corporate notes 16,155 16,356 3,283 5,626 7,447 - Money market funds 358 358 358 - - - Asset Backed Securities 4,871 4,876 2,068 1,542 1,266 - Commercial paper 1,245 1,244 1,244 - - -
Subtotal with FIRST 5 63,102 63,657 7,712 30,827 25,118 -
Total investments 4,824,870$ 4,842,213$ 2,361,063$ 2,384,069$ 94,313$ 2,768$
Investment Maturities (in years)
Custodial Credit Risk – Investments The custodial credit risk for investments is the risk that, in the event of the failure of the counterparty (e.g., broker-dealer) to a transaction, a government will not be able to recover the value of its investment or collateral securities that are in the possession of another party. The California Government Code and the County’s investment policy do not contain legal or policy requirements that would limit the exposure to custodial credit risk for investments.

COUNTY OF SANTA CLARA
Notes to the Basic Financial Statements (Continued) June 30, 2014
(Dollars in thousands)
53
(3) Cash and Investments (Continued) Interest Rate Risk Through its investment policy, the County manages its exposure to fair value losses arising from increasing interest rates by limiting the weighted average maturity of its commingled pool to eighteen months. At June 30, 2014, the County’s weighted average maturity of its commingled pool is 416 days. The County invested in callable Federal Agency Bonds ($526,549 of the County’s U.S. Agencies coupon position of $3,052,087) and Corporate Bonds ($50,124 of the County’s Corporate Bonds position of $169,205) within its commingled pool. These investments are highly sensitive to interest rate changes and are callable at par prior to maturity based on these rate changes. Credit Risk Credit risk is the risk that a debt issuer will fail to pay interest or principal in a timely manner, or that negative perceptions of the issuer’s ability to make these payments will cause security prices to decline. The following is a summary of the credit quality distribution for securities with credit exposure as a percentage of investments with Treasury (Commingled Pool and Separate), fiscal agent, Housing Authority, and FIRST 5 as rated by Moody’s Investors Service:
% of % of % of Commingled Separate % of investments % of
Moody's Pool investments investments investments with Housing investmentsInvestment Rating with the Treasury with the Treasury with fiscal agents Authority with FIRST 5U.S. Treasury Aaa 5.0% 32.6% 27.2% 0.0% 21.5%U.S. Agencies- Discount Aaa 5.2% 0.0% 0.0% 0.0% 0.0%U.S. Agencies- Coupon Aaa 65.4% 19.2% 47.8% 0.0% 42.6%Asset Backed Securities Aaa 2.3% 0.0% 0.0% 0.0% 4.8%Asset Backed Securities P-1 0.4% 0.0% 0.0% 0.0% 0.0%Asset Backed Securities Unrated 1.6% 0.0% 0.0% 0.0% 2.8%Municipal bonds Aaa 0.0% 8.9% 0.0% 0.0% 0.0%Municipal bonds Aa1 0.0% 18.5% 0.0% 0.0% 0.0%Municipal bonds Aa2 0.0% 3.0% 0.0% 0.0% 0.0%Municipal bonds Aa3 1.3% 0.1% 0.0% 0.0% 0.0%Medium-term corporate notes Aaa 1.0% 0.0% 1.3% 0.0% 0.0%Medium-term corporate notes Aa1 0.1% 0.0% 2.3% 0.0% 2.4%Medium-term corporate notes Aa2 0.6% 0.0% 2.6% 0.0% 2.9%Medium-term corporate notes Aa3 1.0% 0.0% 3.2% 0.0% 1.3%Medium-term corporate notes A1 0.9% 0.0% 0.0% 0.0% 11.5%Medium-term corporate notes A2 0.0% 0.0% 0.0% 0.0% 7.6%Commercial paper P-1 1.1% 0.0% 5.6% 0.0% 2.0%Commercial paper Unrated 1.1% 0.0% 0.0% 0.0% 0.0%Negotiable Certificate of Deposits P-1 0.5% 0.0% 0.0% 0.0% 0.0%Negotiable Certificate of Deposits Aa2 0.3% 0.0% 0.0% 0.0% 0.0%Negotiable Certificate of Deposits Unrated 3.4% 0.0% 0.0% 0.0% 0.0%Repurchase Agreement Aaa 2.7% 0.0% 0.0% 0.0% 0.0%Money market funds Aaa 5.2% 0.1% 10.0% 0.0% 0.2%Money market funds Unrated 0.0% 17.6% 0.0% 0.1% 0.4%State Local Agency Investment Fund Unrated 0.9% 0.0% 0.0% 99.9% 0.0%
Total Investments 100.0% 100.0% 100.0% 100.0% 100.0%

COUNTY OF SANTA CLARA
Notes to the Basic Financial Statements (Continued) June 30, 2014
(Dollars in thousands)
54
(3) Cash and Investments (Continued)
Government Code Section 16429.1 authorizes each local government agency to invest funds in the State Treasurer’s Local Agency Investment Fund (LAIF) administered by the California State Treasurer. The total amount recorded by all public agencies in LAIF at June 30, 2014, was approximately $21.1 billion. LAIF is part of the State’s Pooled Money Investment Account (PMIA). PMIA has a total of approximately $64.8 billion as of June 30, 2014. Of that amount, 98.14% was invested in non-derivative financial products and 1.86% in structured notes and asset backed securities. The Local Investment Advisory Board (Board) has oversight responsibility for LAIF. The Board consists of five members as designated by State statute. The value of the pool shares in LAIF, which may be withdrawn, is determined on an amortized cost basis, which is different than the fair value of the County’s position in the pool. Concentration of Credit Risk Concentration of credit risk is the risk of loss attributed to the magnitude of an investor’s holdings in a single issuer. The County diversifies its portfolio by limiting the percentage of the portfolio that can be invested in any one issuer’s name. Investments in U.S. Treasuries, U.S. Agency securities explicitly backed by the U.S., and mutual and pooled funds are not subject to this limitation. More than 5% of the County’s pooled investments are invested with the Federal National Mortgage Association, Federal Home Loan Bank, Federal Home Loan Mortgage Corporation, and Federal Farm Credit Bank, which represent 24.2%, 17.4%, 16.4%, and 12.7%, respectively, of the County’s pooled investments. More than 5% of the FIRST 5’s investments are invested with the Federal Home Loan Mortgage Corporation, Federal Home Loan Bank, Federal National Mortgage Association, and Federal Farm Credit Bank which represent 11.9%, 11.5%, 11.2%, and 6.0%, respectively, of the First 5’s investments.
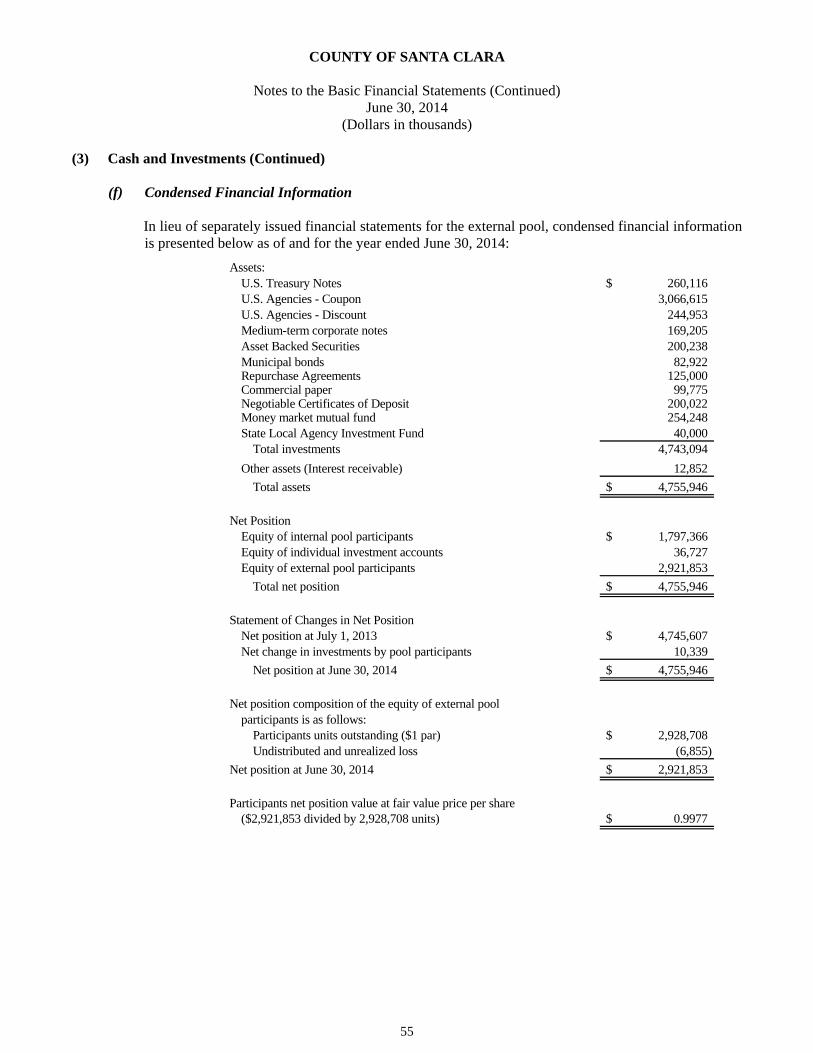
COUNTY OF SANTA CLARA
Notes to the Basic Financial Statements (Continued) June 30, 2014
(Dollars in thousands)
55
(3) Cash and Investments (Continued)
(f) Condensed Financial Information In lieu of separately issued financial statements for the external pool, condensed financial information is presented below as of and for the year ended June 30, 2014:
Assets:U.S. Treasury Notes 260,116$ U.S. Agencies - Coupon 3,066,615 U.S. Agencies - Discount 244,953 Medium-term corporate notes 169,205 Asset Backed Securities 200,238 Municipal bonds 82,922 Repurchase Agreements 125,000 Commercial paper 99,775 Negotiable Certificates of Deposit 200,022 Money market mutual fund 254,248 State Local Agency Investment Fund 40,000
Total investments 4,743,094
Other assets (Interest receivable) 12,852
Total assets 4,755,946$
Net PositionEquity of internal pool participants 1,797,366$ Equity of individual investment accounts 36,727 Equity of external pool participants 2,921,853
Total net position 4,755,946$
Statement of Changes in Net PositionNet position at July 1, 2013 4,745,607$ Net change in investments by pool participants 10,339
Net position at June 30, 2014 4,755,946$
Net position composition of the equity of external pool participants is as follows:
Participants units outstanding ($1 par) 2,928,708$ Undistributed and unrealized loss (6,855)
Net position at June 30, 2014 2,921,853$
Participants net position value at fair value price per share($2,921,853 divided by 2,928,708 units) 0.9977$

COUNTY OF SANTA CLARA
Notes to the Basic Financial Statements (Continued) June 30, 2014
(Dollars in thousands)
56
(4) Receivables
Receivables at year-end for the County’s major individual funds, nonmajor and internal service funds, and governmental and business-type activities in the aggregate, including the applicable allowances for uncollectible accounts are as follows:
Nonmajor Internal Government-Wide TotalReceivables - General Governmental Service Service Concession GovernmentalGovernmental Activities Fund Funds Funds Arrangement Activities
Property tax 2,886$ -$ -$ -$ 2,886$ Loans receivable - 59,184 - - 59,184 Other 190,563 2,562 5,041 7,237 205,403
Gross receivables 193,449 61,746 5,041 7,237 267,473 Less: allowance for uncollectibles (170,532) (285) - - (170,817)
Total receivables, net 22,917$ 61,461$ 5,041$ 7,237$ 96,656$
Nonmajor TotalReceivables - Enterprise Business-typeBusiness-type Activities SCVMC Funds Activities
Patient accounts receivable 851,179$ -$ 851,179$ Other 2,321 727 3,048
Gross receivables 853,500 727 854,227 Less allowance for uncollectibles (721,961) - (721,961)
Total receivables, net 131,539$ 727$ 132,266$
Net loan receivables from housing programs in the amount of $58,899 are not expected to be collected within the subsequent year. The other receivables of General Fund in the amount of $190,563 represent receivables of various County departments and majority of the balances were allowed for at year-end. At June 30, 2014, the General Fund’s due from other governmental agencies is net of allowances for uncollectible accounts in the amount of $233,730. Governmental funds report deferred inflows of resources in connection with receivables for revenues not considered available to liquidate liabilities of the current period. At June 30, 2014, the deferred inflows of resources balance consists of the following:
General Fund
Nonmajor Governmental
Funds
Total Governmental
FundsDue from other governmental agencies 149,008$ -$ 149,008$ Other receivables 6,754 59,254 66,008
Total deferred inflows of resources 155,762$ 59,254$ 215,016$
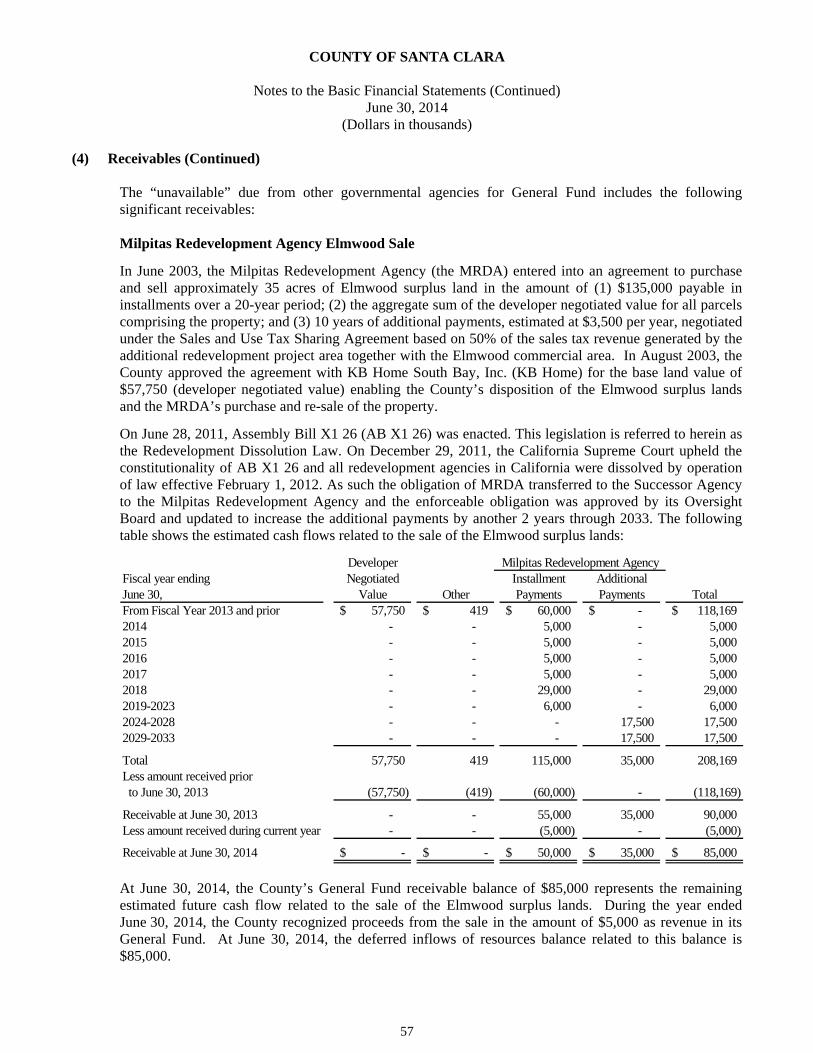
COUNTY OF SANTA CLARA
Notes to the Basic Financial Statements (Continued) June 30, 2014
(Dollars in thousands)
57
(4) Receivables (Continued) The “unavailable” due from other governmental agencies for General Fund includes the following significant receivables: Milpitas Redevelopment Agency Elmwood Sale In June 2003, the Milpitas Redevelopment Agency (the MRDA) entered into an agreement to purchase and sell approximately 35 acres of Elmwood surplus land in the amount of (1) $135,000 payable in installments over a 20-year period; (2) the aggregate sum of the developer negotiated value for all parcels comprising the property; and (3) 10 years of additional payments, estimated at $3,500 per year, negotiated under the Sales and Use Tax Sharing Agreement based on 50% of the sales tax revenue generated by the additional redevelopment project area together with the Elmwood commercial area. In August 2003, the County approved the agreement with KB Home South Bay, Inc. (KB Home) for the base land value of $57,750 (developer negotiated value) enabling the County’s disposition of the Elmwood surplus lands and the MRDA’s purchase and re-sale of the property. On June 28, 2011, Assembly Bill X1 26 (AB X1 26) was enacted. This legislation is referred to herein as the Redevelopment Dissolution Law. On December 29, 2011, the California Supreme Court upheld the constitutionality of AB X1 26 and all redevelopment agencies in California were dissolved by operation of law effective February 1, 2012. As such the obligation of MRDA transferred to the Successor Agency to the Milpitas Redevelopment Agency and the enforceable obligation was approved by its Oversight Board and updated to increase the additional payments by another 2 years through 2033. The following table shows the estimated cash flows related to the sale of the Elmwood surplus lands:
DeveloperFiscal year ending Negotiated Installment AdditionalJune 30, Value Other Payments Payments TotalFrom Fiscal Year 2013 and prior 57,750$ 419$ 60,000$ -$ 118,169$ 2014 - - 5,000 - 5,000 2015 - - 5,000 - 5,000 2016 - - 5,000 - 5,000 2017 - - 5,000 - 5,000 2018 - - 29,000 - 29,000 2019-2023 - - 6,000 - 6,000 2024-2028 - - - 17,500 17,500 2029-2033 - - - 17,500 17,500
Total 57,750 419 115,000 35,000 208,169 Less amount received prior to June 30, 2013 (57,750) (419) (60,000) - (118,169)
Receivable at June 30, 2013 - - 55,000 35,000 90,000 Less amount received during current year - - (5,000) - (5,000)
Receivable at June 30, 2014 -$ -$ 50,000$ 35,000$ 85,000$
Milpitas Redevelopment Agency
At June 30, 2014, the County’s General Fund receivable balance of $85,000 represents the remaining estimated future cash flow related to the sale of the Elmwood surplus lands. During the year ended June 30, 2014, the County recognized proceeds from the sale in the amount of $5,000 as revenue in its General Fund. At June 30, 2014, the deferred inflows of resources balance related to this balance is $85,000.

COUNTY OF SANTA CLARA
Notes to the Basic Financial Statements (Continued) June 30, 2014
(Dollars in thousands)
58
(4) Receivables (Continued) San Jose Redevelopment Agency In 1983, the County and the San Jose Redevelopment Agency (SJRDA) entered into a tax sharing agreement under which the SJRDA would pay a portion of tax increment revenue generated in the Merged Area and part of the Rincon de los Esteros Project Area (County Pass-Through Payment). In December 1993, the SJRDA, County, and City of San Jose entered into a settlement agreement, which continued the County Pass-Through Payment and in May 2001, the County, City of San Jose, and SJRDA approved an Amended and Restated Agreement (Amended Agreement). In September 2009, the SJRDA informed the County that due to the State’s Supplemental Educational Revenue Augmentation Funds requirement and insufficient tax increment revenues, it did not have sufficient unrestricted funds to make the fiscal year 2009-2010 County Pass-Through Payment. The SJRDA further informed the County that it has held funds for the fiscal year 2008-2009 County Pass-Through Payments pending negotiations regarding the payment. At June 30, 2010, the County recorded a receivable from the SJRDA in the amount of $45.2 million, which included the fiscal years 2008-2009 and 2009-10 County Pass-Through Payments, accumulated interest and other administration fees. In March 2011, a settlement agreement was reached and entered into between the County, SJRDA, and City of San Jose in which the SJRDA: (1) paid the County $26.5 million during fiscal year 2010-2011; (2) transferred title to the former San Jose City Hall (valued at $8.6 million) to the County on June 30, 2011; and agreed to pay the remaining $23.78 million in five equal annual installments no later than June 30 of 2014, 2015, 2016, 2017, and 2018. Upon dissolution of the SJRDA, the enforceable obligation was approved by its Oversight Board. Under the modified accrual basis of accounting, the unavailable revenues is reported as a deferred inflows of resources in governmental fund financial statements until the revenues are available to the County. At June 30, 2014, the deferred inflows of resources reported related to this receivable is $23.78 million.

COUNTY OF SANTA CLARA
Notes to the Basic Financial Statements (Continued) June 30, 2014
(Dollars in thousands)
59
(5) Interfund Transactions Interfund receivables, payables, and transfers as of and for the fiscal year ended June 30, 2014, by individual fund/fund type are summarized as follows: Due to/from other funds:
Receivable Fund Payable Fund AmountGeneral Fund Nonmajor Governmental Funds 1,943$ General Fund SCVMC 1,558 General Fund Nonmajor Enterprise Funds 936 General Fund Internal Service Funds 744 Nonmajor Governmental Funds General Fund 102 Nonmajor Governmental Funds Nonmajor Governmental Funds 2 Nonmajor Governmental Funds SCVMC 2,493 Nonmajor Governmental Funds Internal Service Funds 170 SCVMC General Fund 900 Nonmajor Enterprise Funds General Fund 1 Nonmajor Enterprise Funds SCVMC 1,369 Internal Service Funds General Fund 21
Total 10,239$
The General Fund is due $1,943 from Nonmajor Governmental Funds to reimburse for Mental Health Service Act expenditures incurred by the General Fund and $1,558 from the SCVMC for current borrowings for working capital. The Nonmajor Governmental Funds are due $2,493 from the SCVMC to reimburse costs incurred for capital projects. In addition, the interfund balances of $57,595 between the County’s Agency Funds represent current borrowings for working capital expected to be repaid during the following year. All remaining interfund balances resulted from the time lag between the dates that (1) interfund goods and services are provided or reimbursable expenditures occur, (2) transactions are recorded in the accounting system, and (3) payments between funds are made. Advance from/to other funds: In February 2013, the Board approved an interfund loan from the General Fund to the Child Support nonmajor special revenue fund for tenant improvements in the amount of $1,000 to be repaid over the ten-year term of the lease. The actual amount of the loan was $693. The terms of the loan include a maturity of June 30, 2023 and interest is based on the quarterly rate of return of the County Commingled Pool. At June 30, 2014, the advance balance was $607.
Payable to primary government:
As described in Note 9(a), the Housing Authority reported its lease obligations to the County in the amount of $7,635 as a payable to primary government on its statement of net position.

COUNTY OF SANTA CLARA
Notes to the Basic Financial Statements (Continued) June 30, 2014
(Dollars in thousands)
60
(5) Interfund Transactions (Continued)
Transfer in/out between funds: The following schedule briefly summarizes the County’s transfer activities: Between Governmental and Business-type Activities: Transfer From Transfer To Amount PurposeGeneral Fund SCVMC 176,231$ Transfer funds for operating subsidy.General Fund SCVMC 5,015 Transfer funds to reimburse payment of retiree benefits.General Fund Nonmajor Enterprise Fund 2,000 Transfer funds to provide SVC for Covered California.General Fund Nonmajor Enterprise Fund 11 Transfer funds to cover rent costs for the animal rescue clinic.General Fund Nonmajor Enterprise Fund 88 Transfer funds to reimburse payment of retiree benefits.
SCVMC General Fund 1,033 Transfer funds to reimburse services rendered from community health service.
SCVMC General Fund4,389
Transfer funds to pay for FQHC Clinic service provided by Mental Health Department.
SCVMC Nonmajor Governmental Fund 2,495 Transfer funds to increase SCVMC services and supplies and capital budgets.
SCVMC Nonmajor Enterprise Fund15,346 Transfer funds for the establishment of a nonmajor enterprise fund previously accounted
for in the SCVMC major enterprise fund.
SCVMC Nonmajor Governmental Funds13,871 Transfer bond proceeds to the General Capital Improvement fund for Valley Health
Center Project.
Nonmajor Enterprise Fund General Fund 2,000 Transfer funds to increase the Valley Health Plan budget for enrollment increases in FY14.
Subtotal Between Governmental and Business-type Activities: 222,479
Between Funds within the Governmental or Business-type Activities*: General Fund Internal Service Fund 2,440 Transfer funds to reimburse payment of retiree benefits.
520 Transfer funds to add positions within the Information Services Department.2,960
General Fund Nonmajor Governmental Fund 834 Transfer funds to pay debt service for Hospital Facilities Authority bonds.
36,960 Transfer funds to finance Facilities and Fleet Department capital projects.
20 Transfer funds to the Fire Districts for fireworks education.51 Transfer funds to the County Library fund for annual contribution per Joint Power
Authority agreement.174 Transfer funds to reimburse household waste program.112 Transfer funds to the Roads Department for school crossing guard project.119 Transfer funds to pay for operating expenses of the tobacco fund.385 Transfer to the Roads fund for Measure B Transportation Projects.200 Transfer to the Roads fund for the 2014 circulation and planning study.
1,111 Transfer funds to reimburse payment of retiree benefits.1,408 Transfer bonds proceeds to Morgan Hill Courthouse.
41,374
Nonmajor Governmental funds General Fund 121 Transfer funds to General Fund to pay for various debt services.144 Transfer fund from the Vital Statistic fund for specified ongoing operations.
538 Transfer funds from Department of Child Support Services to reimburse moving costs.
65,673 Transfer funds for Proposition 63 nonmajor fund for planning administrative, and program costs for the mental health services programs.
4,703 Transfer funds for technology project reimbursements.256 Transfer unspent funds to Sheriff Department.76 Transfer funds to enable payment of retiree benefits.
206 Transfer funds to Housing and Community Development Department to enable the Housing Fast Program.
1 Transfer of funds to enable county-wide environmental training.
71,718
Nonmajor Governmental Fund Nonmajor Governmental Fund 950 Transfer funds to the Parks Department for Parks Capital Projects.
2,219 Transfer QECB proceeds to fund qualified facilities and fleet capital projects.
3,169 Subtotal: Between Funds within Governmental or Business-type Activities: 119,221
Total Transfers: 341,700$
* These transfers were eliminated in the consolidation, by column, for the Governmental and Business-type activities.

COUNTY OF SANTA CLARA
Notes to the Basic Financial Statements (Continued) June 30, 2014
(Dollars in thousands)
61
(6) Capital Assets
Capital asset activity for the fiscal year ended June 30, 2014, was as follows:
Balance, Reductions/ Balance,July 1, 2013 Additions Adjustments Transfers June 30, 2014
Governmental activitiesCapital assets, not being depreciated:
Land 258,272$ -$ (323)$ 2,643$ 260,592$ Construction in progress 91,479 76,417 - (33,045) 134,851
Total capital assets, not being depreciated 349,751 76,417 (323) (30,402) 395,443
Capital assets, being depreciated:Infrastructure 313,474 - 17,381 330,855 Buildings and improvements 949,120 230 (76) 10,696 959,970 Equipment, software and vehicles 203,735 12,897 (9,989) 2,325 208,968
Total capital assets, being depreciated 1,466,329 13,127 (10,065) 30,402 1,499,793
Less accumulated depreciation for:Infrastructure (119,054) (12,511) - - (131,565) Buildings and improvements (431,861) (15,791) 38 - (447,614) Equipment, software and vehicles (150,440) (18,420) 9,940 - (158,920)
Total accumulated depreciation (701,355) (46,722) 9,978 - (738,099)
Total capital assets, being depreciated, net 764,974 (33,595) (87) 30,402 761,694
Governmental activities, capital assets, net 1,114,725$ 42,822$ (410)$ -$ 1,157,137$
Business-type activitiesCapital assets, not being depreciated:
Land 6,310$ -$ -$ -$ 6,310$ Construction in progress 457,900 133,814 (189) (17,345) 574,180
Total capital assets, not being depreciated 464,210 133,814 (189) (17,345) 580,490
Capital assets, being depreciated:Buildings and improvements 818,556 97 (58) (24,972) 793,623 Equipment and vehicles 175,381 9,350 (7,274) 42,317 219,774 Leasehold improvements 2,073 - - - 2,073
Total capital assets, being depreciated 996,010 9,447 (7,332) 17,345 1,015,470
Less accumulated depreciation for:Buildings and improvements (357,421) (33,688) 58 15,136 (375,915) Equipment and vehicles (82,927) (13,382) 7,195 (15,136) (104,250) Leasehold improvements (1,711) (104) - - (1,815)
Total accumulated depreciation (442,059) (47,174) 7,253 - (481,980)
Total capital assets, being depreciated, net 553,951 (37,727) (79) 17,345 533,490
Business-type activities, capital assets, net 1,018,161$ 96,087$ (268)$ -$ 1,113,980$
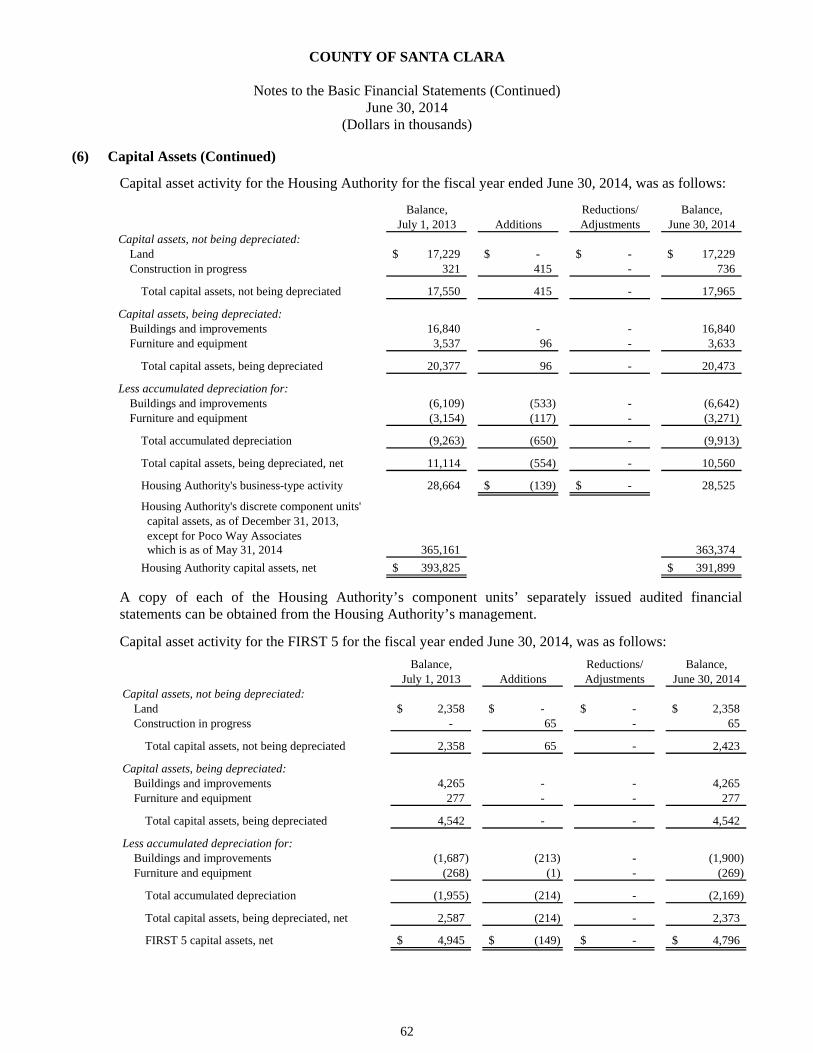
COUNTY OF SANTA CLARA
Notes to the Basic Financial Statements (Continued) June 30, 2014
(Dollars in thousands)
62
(6) Capital Assets (Continued)
Capital asset activity for the Housing Authority for the fiscal year ended June 30, 2014, was as follows:
Balance, Reductions/ Balance,July 1, 2013 Additions Adjustments June 30, 2014
Capital assets, not being depreciated:Land 17,229$ -$ -$ 17,229$ Construction in progress 321 415 - 736
Total capital assets, not being depreciated 17,550 415 - 17,965
Capital assets, being depreciated:Buildings and improvements 16,840 - - 16,840 Furniture and equipment 3,537 96 - 3,633
Total capital assets, being depreciated 20,377 96 - 20,473
Less accumulated depreciation for:Buildings and improvements (6,109) (533) - (6,642) Furniture and equipment (3,154) (117) - (3,271)
Total accumulated depreciation (9,263) (650) - (9,913)
Total capital assets, being depreciated, net 11,114 (554) - 10,560
Housing Authority's business-type activity 28,664 (139)$ -$ 28,525
Housing Authority's discrete component units' capital assets, as of December 31, 2013, except for Poco Way Associates which is as of May 31, 2014 365,161 363,374
Housing Authority capital assets, net 393,825$ 391,899$
A copy of each of the Housing Authority’s component units’ separately issued audited financial statements can be obtained from the Housing Authority’s management.
Capital asset activity for the FIRST 5 for the fiscal year ended June 30, 2014, was as follows:
Balance, Reductions/ Balance,
July 1, 2013 Additions Adjustments June 30, 2014Capital assets, not being depreciated:
Land 2,358$ -$ -$ 2,358$ Construction in progress - 65 - 65
Total capital assets, not being depreciated 2,358 65 - 2,423
Capital assets, being depreciated:Buildings and improvements 4,265 - - 4,265 Furniture and equipment 277 - - 277
Total capital assets, being depreciated 4,542 - - 4,542
Less accumulated depreciation for:Buildings and improvements (1,687) (213) - (1,900) Furniture and equipment (268) (1) - (269)
Total accumulated depreciation (1,955) (214) - (2,169)
Total capital assets, being depreciated, net 2,587 (214) - 2,373
FIRST 5 capital assets, net 4,945$ (149)$ -$ 4,796$
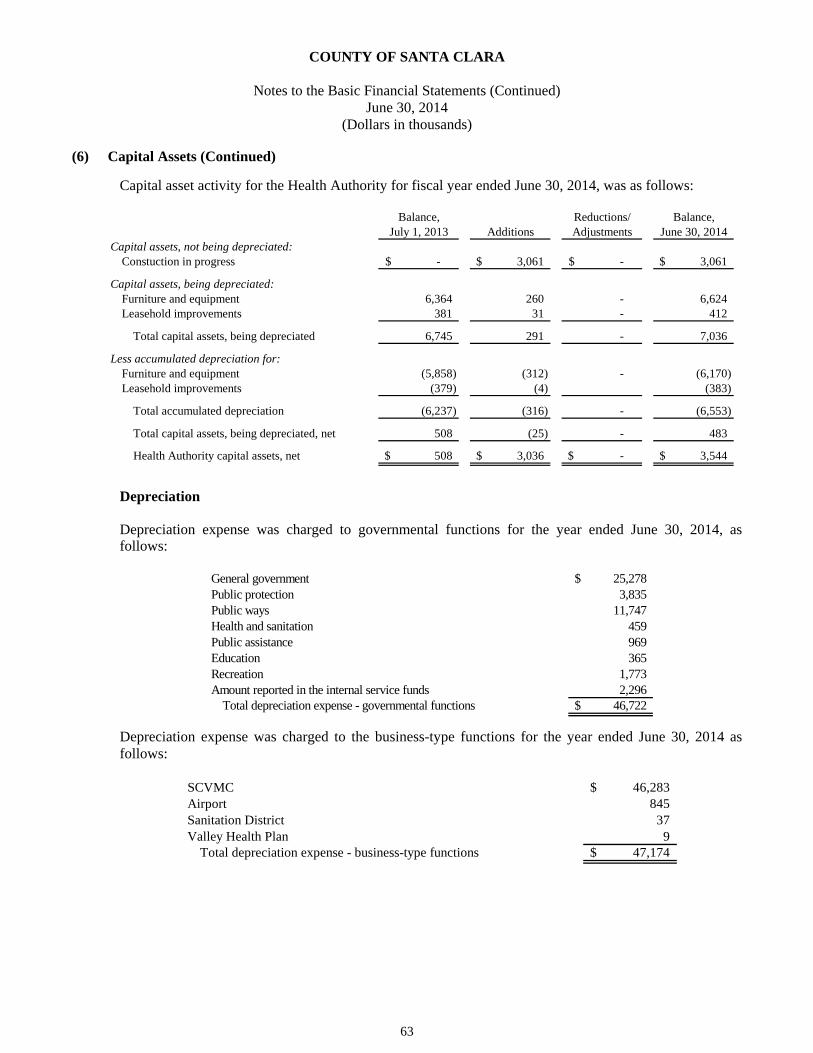
COUNTY OF SANTA CLARA
Notes to the Basic Financial Statements (Continued) June 30, 2014
(Dollars in thousands)
63
(6) Capital Assets (Continued) Capital asset activity for the Health Authority for fiscal year ended June 30, 2014, was as follows:
Balance, Reductions/ Balance,
July 1, 2013 Additions Adjustments June 30, 2014Capital assets, not being depreciated:
Constuction in progress -$ 3,061$ -$ 3,061$
Capital assets, being depreciated:Furniture and equipment 6,364 260 - 6,624 Leasehold improvements 381 31 - 412
Total capital assets, being depreciated 6,745 291 - 7,036
Less accumulated depreciation for:Furniture and equipment (5,858) (312) - (6,170) Leasehold improvements (379) (4) (383)
Total accumulated depreciation (6,237) (316) - (6,553)
Total capital assets, being depreciated, net 508 (25) - 483
Health Authority capital assets, net 508$ 3,036$ -$ 3,544$
Depreciation
Depreciation expense was charged to governmental functions for the year ended June 30, 2014, as follows:
General government 25,278$ Public protection 3,835 Public ways 11,747 Health and sanitation 459 Public assistance 969 Education 365 Recreation 1,773 Amount reported in the internal service funds 2,296
Total depreciation expense - governmental functions 46,722$
Depreciation expense was charged to the business-type functions for the year ended June 30, 2014 as follows:
SCVMC 46,283$ Airport 845 Sanitation District 37 Valley Health Plan 9
Total depreciation expense - business-type functions 47,174$

COUNTY OF SANTA CLARA
Notes to the Basic Financial Statements (Continued) June 30, 2014
(Dollars in thousands)
64
(6) Capital Assets (Continued)
Capital Projects Commitments As of June 30, 2014, the SCVMC and the Airport have active construction projects that include construction of the seismic compliance for SCVMC buildings and infrastructure and facility improvement of airport projects.
The County’s commitments for business-type activities as of June 30, 2014, are as follows:
ProjectsExpended to
June 30, 2014Committed as of
June 30, 2014Hospital Projects 573,409$ 17,961$ Airport Projects 771 -
Total 574,180$ 17,961$
Nonmajor governmental funds (Special Revenue and Capital Projects Funds) also have active construction projects as of June 30, 2014. They are as follows: Road projects include: rehabilitation and replacement; road, highway and bridge repair, maintenance
and improvements; Intelligent Transportation System; neighborhood protection projects; spot safety projects; and pedestrian and bicycle route improvements.
Parks projects include: Almaden Park quicksilver toxic mitigation; Martial Cottle master plan phase I;
and improvement to various County Parks facilities. General Capital projects include: construction of the County Library Headquarters; demolition and
abatement of the former San Jose Medical clinic in the downtown area of San Jose; construction of the San Jose downtown health center; Malech road water supply replacement project; and repair, rehabilitation and improvement of County buildings.
The County’s governmental activities commitments at June 30, 2014, are as follows:
Expended to Committed as of Projects June 30, 2014 June 30, 2014Road projects 31,185$ 9,852$ Park projects 36,621 10,442 Fire district projects 363 - General capital projects 66,682 2,523
Total 134,851$ 22,817$

COUNTY OF SANTA CLARA
Notes to the Basic Financial Statements (Continued) June 30, 2014
(Dollars in thousands)
65
(7) Capital Leases The County leases certain vehicles and equipment, obtained under various lease financing agreements. The leases expire at various times through fiscal year 2017. As of June 30, 2014, the governmental activities’ capital assets and accumulated depreciation under capital leases are:
DescriptionEquipment and vehicles 602$ Less accumulated depreciation (199)
Net capital assets 403$
The future minimum lease payments under governmental activities capital leases are:
Fiscal year ending June 30,2015 124$ 2016 88 2017 77
Total 289 Amount representing interest at rates from 0.43% to 6.48% (18)
Present value of future minimum lease payments 271$
(8) Short-Term Debt
(a) Teeter Plan Obligation Commercial Paper Notes
As discussed in Note 1(j), in 1994 the Board adopted the Teeter Plan. The Teeter Plan provides for a tax distribution procedure in which secured roll (exclusive of the supplemental roll) taxes are distributed to participating taxing agencies within the County on the basis of the tax levy, rather than on the basis of actual tax collections. Taxing entities that maintain funds in the County Treasury are included in the Teeter Plan; other taxing entities may elect to be included in the Teeter Plan. Taxing entities that do not elect to participate in the Teeter Plan (City of Sunnyvale and Town of Los Gatos) are paid as taxes are collected.
On June 25, 2013, the Teeter notes of $109,285 were rolled over in the amount of $85,000 with initial maturity dates ranging from August 15, 2013 through September 11, 2013 and interest rates of 0.10% to 0.13%. On September 11, 2013, the County paid off these notes and discontinued the Teeter financing program.

COUNTY OF SANTA CLARA
Notes to the Basic Financial Statements (Continued) June 30, 2014
(Dollars in thousands)
66
(8) Short-Term Debt (Continued)
(b) Tax and Revenue Anticipation notes (TRANS)
On September 4, 2013, the County issued Tax and Revenue Anticipation Notes (TRANS) in the amount of $118,000 with a premium of $1,036 that bear fixed interest at 1.25% per annum. The purpose of the TRANS is to assist the County in meeting its short term cash flow requirements. The proceeds were used by the County for any purpose for which the County is authorized to expend funds from the General Fund. The County repaid the TRANS in June 2014.
(c) Housing Authority Line of Credit
The Housing Authority maintains a $3,000 line of credit, which provides the Housing Authority with a ready means of short-term financing. On June 30, 2014 the maturity date was extended to June 29, 2015. The line of credit, payable monthly, bears interest at the prime rate, which was 3.25% at June 30, 2014.
(d) Short-Term Debt Activity
Primary ComponentGovernment Units
Balance, beginning of year 85,000$ 224$ Additions 119,036 - Reductions (204,036) (224)
Balance, end of year -$ -$

COUNTY OF SANTA CLARA
Notes to the Basic Financial Statements (Continued) June 30, 2014
(Dollars in thousands)
67
(9) Long-Term Liabilities
As of June 30, 2014, outstanding long-term obligations consisted of the following:
Final Interest Annual Principal Original Issue Outstanding atMaturity Rates Installments Amount June 30, 2014
Governmental activities:2007 Taxable Pension Funding Bonds 8/1/14 - 8/1/36 5.786% - 6.111% $3,975 - $51,560 389,485$ 375,419$
2009 Series A General Obligation Bonds 8/1/14 - 8/1/39 3.00% - 5.00% $1,100 - $32,500 350,000 314,700 2013 Series B General Obligation Bonds 8/1/14 - 8/1/43 3.00% - 5.00% $4,420 - $29,340 490,000 490,000
Financing Authority:1994 Series B Lease Revenue Bonds 11/15/23 - 11/15/25 (1) $233 - $262 742 742 2006 Series I Lease Revenue Bonds 5/15/15 - 5/15/31 4.00% - 5.00% $2,949 - $5,927 87,575 72,545 2007 Series K Lease Revenue Bonds 5/15/15 - 5/15/37 4.00% - 5.00% $525 - $1,460 22,655 20,755 2008 Series A Lease Revenue Bonds 11/15/14 - 11/15/22 5.00% $161 - $238 5,579 1,778 2008 Series L Lease Revenue Bonds 5/15/15 - 5/15/36 4.00% - 5.25% $1,125 - $4,600 59,800 53,535 2010 Series N Lease Revenue Bonds 5/15/15 - 5/15/17 4.54% - 5.00% $5,605 - 5,915 47,188 17,385 2011 Series A Lease Revenue Bonds 2/1/15 - 2/1/26 5.90% $871 - $2,153 20,368 16,618 2011 Series B Lease Revenue Bonds 2/1/15 - 2/1/26 4.91% $247- $282 3,639 3,166 2012 Series A Lease Revenue Bonds 2/1/15 - 2/1/24 4.00% - 5.00% $1,460 - $2,180 19,315 17,910 2014 Series O Lease Revenue Bonds 5/15/15 - 5/15/23 3.00% - 4.00% $1,120 - $1,490 11,715 11,715 Housing Authority:
2004 Series A Lease Revenue Bonds 9/1/14 - 9/1/29 (2) $110 - $255 3,550 2,820 2006 Series A Lease Revenue Bonds 9/1/14 - 9/1/38 5.00% $55 - $510 5,125 4,815
Silicon Valley Tobacco Securitization Authority:Tobacco Settlement Asset-Backed Bonds 6/1/36 - 6/1/56 5.63% - 6.85% $4,408 - $43,604 102,030 102,030
2006 Series TT Vector Control COP 6/1/15 - 6/1/27 3.75% - 6.50% $190- $330 4,495 3,275
Total governmental activities 1,623,261$ 1,509,208$
Business-type activitiesSCVMC:
Financing Authority:1994 Series B Lease Revenue Bonds 11/15/23 - 11/15/25 (1) $15,967 - $17,938 50,758$ 50,758$ 2006 Series I Lease Revenue Bonds 5/15/15 - 5/15/31 4.00% - 5.00% $2,066 - $4,153 62,165 50,830 2007 Sereis K Lease Revenue Bonds 5/15/15 - 5/15/37 4.00% - 5.00% $1,640 - $4,565 70,885 64,960 2008 Series A Lease Revenue Bonds 11/15/14 - 11/15/22 3.00% - 5.00% $10,674- $15,657 120,831 117,502 2008 Series L Lease Revenue Bonds 5/15/32 - 5/15/36 5.25% $9,530 - $11,750 53,040 53,040 2008 Series M Lease Revenue Bonds 5/15/14 - 5/15/35 (3) $4,450 - $8,300 143,105 129,650 2012 Series A Lease Revenue Bonds 2/1/15 - 2/1/24 4.00% - 5.00% $5,110 - $7,630 67,605 62,690
Total SCVMC 568,389 529,430
Airport:ABAG Series 2002-1 Lease Revenue Bonds 7/1/14 - 7/1/32 4.50% - 5.00% $220 - $355 6,780 4,600
Total business-type activities 575,169$ 534,030$
(1)Variable rate, 0.06% effective as of June 30, 2014.
(2)Variable rate, 0.08% effective as of June 30, 2014.
(3)Variable rate, 0.07% effective as of June 30, 2014.
Type of indebtedness (purpose)

COUNTY OF SANTA CLARA
Notes to the Basic Financial Statements (Continued) June 30, 2014
(Dollars in thousands)
68
(9) Long-Term Liabilities (Continued) The following is a summary of long-term liabilities transactions for the fiscal year ended June 30, 2014:
Balance, Balance, AmountsJune 30, 2013 June 30, Due Within(as restated) Additions Retirements 2014 One Year
Governmental activities:Lease Revenue Bonds 251,345$ 11,715$ (39,276)$ 223,784$ 15,336$
Unamortized premium 7,338 909 (1,234) 7,013 1,016
Tobacco Settlement Asset-Backed Bonds 102,030 - - 102,030 - Accreted interest on capital appreciation bonds 46,279 8,882 - 55,161 -
Taxable Pension Funding Bonds 378,995 - (3,576) 375,419 3,975 Accreted interest on capital appreciation bonds 37,071 7,311 (1,464) 42,918 1,975
Certificates of Participation 3,455 - (180) 3,275 190 Unamortized premium 120 - (8) 112 8
General Obligation Bonds 805,800 - (1,100) 804,700 5,520 Unamortized premium 51,904 - (1,779) 50,125 1,779
Subtotal governmental bonds 1,684,337 28,817 (48,617) 1,664,537 29,799
Capital Lease Obligations (Note 7) 491 - (219) 272 114 Accrued litigation liability 2,500 3,156 - 5,656 - Insurance claims (Note 13) 117,932 74,880 (50,943) 141,869 40,722 Net OPEB Obligation (Note 12(f) and 12(g)) 321,709 2,014 (46,596) 277,127 - Pollution Remediation Obligations (Note 15) 5,900 430 - 6,330 - Accrued vacation & sick leave 140,364 100,365 (94,231) 146,498 13,403
Total governmental activities 2,273,233$ 209,662$ (240,606)$ 2,242,289$ 84,038$
Business-type activities:SCVMC Lease Revenue Bonds 563,827$ -$ (34,397)$ 529,430$ 23,939$
Unamortized discount (29) - 29 - - Unamortized premium 18,724 - (1,671) 17,053 1,671
Subtotal SCVMC bonds 582,522 - (36,039) 546,483 25,610
Airport Lease Revenue Bonds 4,785 - (185) 4,600 220 Unamortized discount (15) - - (15) (1)
Subtotal Airport bonds 4,770 - (185) 4,585 219
Accrued vacation & sick leave 67,974 60,473 (56,854) 71,593 12,561
Total business-type activities 655,266$ 60,473$ (93,078)$ 622,661$ 38,390$
Component Units:Housing Authority:
Notes payable 1,398$ -$ -$ 1,398$ 20$ Payment in lieu of taxes 39 45 - 84 8 Accrued vacation & sick leave 848 887 (849) 886 49 Long-term interest payable 578 23 - 601 -
Housing Authority's business type activity 2,863 955$ (849)$ 2,969 77
Housing Authority's discrete component units' long-term obligations as of December 31, 2013, except for Poco Way Associates which is as of May 31, 2014 Notes, loans, and bonds payable 281,501 283,401 9,840 Long-term interest payable 24,904 27,601 - Housing Authority's discrete component units 306,405 311,002 9,840 Total Housing Authority 309,268$ 313,971$ 9,917$
FIRST 5:Accrued vacation & sick leave 178$ -$ (14)$ 164$ -$
__________
The June 30, 2013 balance was restated to reflect the impact of GASB Statement No. 65. The unamortized loss on refunding of debt was reclassified to deferred outflows of resources. A copy of each of the Housing Authority’s component units separately issued audited financial statements can be obtained from the Housing Authority’s management.

COUNTY OF SANTA CLARA
Notes to the Basic Financial Statements (Continued) June 30, 2014
(Dollars in thousands)
69
(9) Long-Term Liabilities (Continued) (a) Governmental Activities
2007 Taxable Pension Funding Bonds In July 2007, the County issued 2007 Taxable Pension Funding Bonds in the amount of $389,485 to refinance a portion of the County’s statutory obligations to make payments to the State of California Public Employees’ Retirement System (PERS) for certain amounts arising as a result of retirement benefits accruing to County employees. The bonds were comprised of current interest bonds and capital appreciation bonds. The current interest bonds were issued for $302,180 and bear fixed interest rates ranging from 5.56% to 6.11%, and have a final maturity date of August 1, 2036. The capital appreciation bonds were issued for $87,305 with interest rates ranging from 5.74% to 6.14% and have a final maturity date of August 1, 2029. 2009 Series A and 2013 Series B General Obligation Bonds On November 4, 2008, the County voters approved Measure A – Hospital Seismic Safety and Medical Facilities authorizing the issuance of $840,000 in general obligation bonds to rebuild and improve the seismically deficient medical facilities. On May 27, 2009, the County issued 2009 Series A General Obligation Bonds in the amount of $350,000. The bonds bear fixed interest rates ranging from 3.00% to 5.00% which are payable semi-annually commencing February 1, 2010 and have a final maturity of August 1, 2039. On March 6, 2013, the County issued 2013 Series B General Obligation Bonds in the amount of $490,000. The bonds bear fixed interest rates ranging from 3.00% to 5.00% which are payable semi-annually commencing August 1, 2013. The series will mature on August 1, 2043. Santa Clara County - El Camino Hospital District Hospital Facilities Authority The Santa Clara County – El Camino Hospital District Hospital Facilities Authority (Hospital Facilities Authority) was organized in 1979 as a governmental agency by a Joint Exercise of Powers Agreement between the County and the El Camino Hospital District. The Hospital Facilities Authority was organized to finance the construction of a kidney dialysis facility, hospital administrative and storage facilities, and other improvements adjacent to El Camino Hospital, and to provide for the construction and renovation of the Santa Clara Valley Medical Center (SCVMC). The El Camino facilities were completed in 1982 and the SCVMC facilities were substantially completed in 1990. The 1985 Series A and B Adjustable Convertible Extendable Securities (ACES) Lease Revenue Bonds were issued by the Hospital Facilities Authority to provide financing for the acquisition, construction, and renovation of various Santa Clara Valley Health and Hospital System projects, including the Valley Health Center, Patient Care Tower, Psychiatric Inpatient Facility, and Cogeneration Facility. On August 1, 2013, the Hospital Facilities Authority repaid all of its outstanding bonds payable in the amount of $21,700 with cash and investments held by the Hospital Facilities Authority. The County terminated Hospital Facilities Authority in January 2014.

COUNTY OF SANTA CLARA
Notes to the Basic Financial Statements (Continued) June 30, 2014
(Dollars in thousands)
70
(9) Long-Term Liabilities (Continued) Financing Authority The Santa Clara County Financing Authority (the Financing Authority) was formed in 1994 by a joint exercise of powers agreement between the County and the Santa Clara County Central Fire Protection District (Central Fire). The Financing Authority commenced operations in the County with the issuance of bonds pursuant to the Marks-Roos Local Bond Pooling Act of 1985.
2003 Series C Lease Revenue Bonds – On December 18, 2003, the County through the Financing Authority issued 2003 Series C Lease Revenue Bonds in the amount of $20,025. These bonds were issued to embark on a number of long-term capital projects including the construction of a new courthouse in the City of Morgan Hill. The bonds were refunded on May 15, 2014 with proceeds from the 2014 Series O Lease Revenue Bonds.
2010 Series N Lease Revenue Bonds – On February 18, 2010, the Financing Authority issued $50,110 of 2010 Series N Lease Revenue Bonds on behalf of the County and SCVMC. The bond proceeds including premiums of $4,264 were used to current refund the outstanding 1998 Series A and 2000 Series B Lease Revenue Bonds. The bonds bear fixed interest rates ranging from 4.00% to 5.00% and have a final maturity date of May 15, 2017. The SCVMC portion of this debt of $2,922 matured on May 15, 2012. 2014 Series O Lease Revenue Bonds – On April 22, 2014, the County through the Financing Authority issued $11,715 of 2014 Series O Lease Revenue Bonds. The bond proceeds including premiums of $909 and County contributions of $1,408, of which $1,090 was deposited into the refunding escrow that were used to current refund the outstanding 2003 Series C Lease Revenue Bonds. The bonds bear fixed interest rates ranging from 3.00% to 4.00% and have a final maturity date of May 15, 2023. The refunding achieved $1,724 in gross debt service savings and net present value savings of $1,579. 2011 Series A & B Qualified Energy Conservation Bonds – On February 10, 2011 the County through the Financing Authority, issued the taxable 2011 Series A Lease Revenue Bonds, Qualified Energy Conservation Bonds (QECB), in the amount of $20,368 pursuant to an allocation to the County by the California Debt Limit Allocation Committee. On October 27, 2011, the Financing Authority issued another series of QECB, 2011 Series B Lease Revenue Bonds, in the amount of $3,639 on behalf of the County. Series A was to finance acquisition, installation, implementation and construction of solar electric generation systems on four County sites, cost of issuance and related fees and expenses. Series B was to fund lighting upgrades and lighting controls with energy efficient systems. Both series will mature on February 1, 2026.
QECBs are a form of taxable lease revenue bonds which receive a direct subsidy payment from the Federal government to help offset the cost of the borrowing. The subsidy is intended to promote qualified energy projects. The federal subsidy equates to approximately 70% of the interest cost of the financing. Effective March 1, 2013, due to the effect of sequester reductions, the Federal interest subsidy was reduced by 8.7% through September 30, 2013. Effective October 1, 2013 through September 30, 2014, the Federal interest subsidy will be reduced by 7.2%. Absent of Congressional action, the sequester reductions will continue through and including Federal’s fiscal year ended September 30, 2021 and the sequester reduction percentage will vary between future years.

COUNTY OF SANTA CLARA
Notes to the Basic Financial Statements (Continued) June 30, 2014
(Dollars in thousands)
71
(9) Long-Term Liabilities (Continued) Debt service payments for the QECBs are serviced by the General Fund. The actual savings will depend on the actual reduction in future utility costs as a result of the solar panel and energy efficient system projects. Housing Authority Lease Revenue Bonds - On September 1, 2004, the County through the Financing Authority issued 2004 Series A Lease Revenue Bonds in the amount of $3,550 that bear interest that is set each week by the remarketing agent based upon prevailing interest rates for 7-day variable rate demand bonds of similar credit quality trading in the municipal market place during the week. The bonds were issued to refund and redeem the Housing Authority’s 1993 Certificates of Participation (COPS) in fiscal year 2005. On October 19, 2006, the Financing Authority issued $5,125 of 2006 Lease Revenue Bonds (2006 Bonds) on behalf of the Santa Clara County. The bond proceeds were used to provide additional financing for the renovation of an office building used by the Housing Authority. The 2006 Bonds bear fixed interest rates of 5.00% and are payable semi-annually commencing September 1, 2008 and mature on September 1, 2038. The Housing Authority has reported its lease obligations to the County as payable to primary government on its statement of net position. In connection with the issuance of the 2004 Series A Lease Revenue Bonds, the County, on behalf of the Financing Authority, obtained an irrevocable letter of credit as a credit facility with U.S. Bank N.A. for these bonds. At June 30, 2014, the letter of credit was set to expire on September 1, 2015. The Financing Authority’s repayment of unreimbursed draws made on the credit facility bears interest at rates as defined in the reimbursement agreement up to LIBOR plus 4% per annum with the principal due at September 1, 2015. The Financing Authority is required to pay U.S. Bank N.A. an annual commitment fee of 1.50% based on the outstanding principal amount of the bonds supported by the credit facility. For the year ended June 30, 2014, the Housing Authority paid an annual commitment fee in the amount of $44.
The Business-type Activities section of this note at (b) describes the governmental activities portions of the Financing Authority’s 1994, 1997, 2006, 2007, 2008, and 2012 Lease Revenue Bonds.
Silicon Valley Tobacco Securitization Authority
In accordance with GASB Technical Bulletin 2004-1, Tobacco Settlement Recognition and Financial Reporting Entity Issues, the Silicon Valley Tobacco Securitization Authority (JPA) and the Santa Clara County Tobacco Securitization Corporation (Corporation) have been included in the basic financial statements as blended component units of the County. The Corporation borrowed from the JPA the proceeds of the Series 2007 Tobacco Settlement Asset-Backed Bonds issued by the JPA on January 12, 2007 for $102,030 pursuant to a secured loan agreement. The Corporation then applied the loan proceeds to purchase the County’s portion of its rights, title and interest in the Tobacco Settlement Revenues (TSRs) according to a purchase and sale agreement dated as of January 1, 2007 between the County and the Corporation (sale agreement). The Series 2007 bonds are primarily secured by a portion of TSRs that are payable to the County and sold to the Corporation pursuant to the sale agreement.

COUNTY OF SANTA CLARA
Notes to the Basic Financial Statements (Continued) June 30, 2014
(Dollars in thousands)
72
(9) Long-Term Liabilities (Continued) The first Series A Capital Appreciation Bonds (CABs) were issued for $43,604 with an interest rate of 5.63%, final turbo redemption date on June 1, 2031 and due date of June 1, 2036. The second Series A CABs were issued for $11,338 with an interest rate 5.68%, final turbo redemption date on June 1, 2033 and due date on June 1, 2041. The third Series A CABs were issued for $13,618 with an interest rate of 5.70%, final turbo redemption date on June 1, 2036 and due date on June 1, 2047. Series B CABs were issued for $4,408 with an interest rate of 5.85%, final turbo redemption date on June 1, 2036 and due date of June 1, 2047. Series C CABS were issued for $20,161 with an interest rate of 6.30%, final turbo redemption date on June 1, 2042 and due date of June 1, 2056. Series D CABs were issued for $8,901 with an interest rate of 6.85%, final turbo redemption date on June 1, 2046 and due date of June 1, 2056.
In the event of a decline in the tobacco settlement revenues for any reason, including the default or bankruptcy of a participating cigarette manufacturer, resulting in a decline in the tobacco settlement revenues and possible default on the Tobacco Securitization debt, neither the JPA, County, nor Corporation has any liability to make up any such shortfall. 2006 Series TT Vector Control Certificates of Participation During November 2006, the County issued 2006 Series TT Certificates of Participation in the amount of $4,495 through the California Special Districts Association Finance Corporation to finance the acquisition of an office building. The Certificates bear fixed interest rates ranging from 3.625% to 5.00% and have a final maturity date of June 1, 2027.
(b) Business-type Activities SCVMC Financing Authority 1994 Series A & B Lease Revenue Bonds - On December 15, 1994, the Financing Authority issued the 1994 Series A and B Lease Revenue Bonds. The proceeds financed the design, construction, remodeling, and equipping of existing and new medical facilities at the SCVMC. The County leases to, and then leases back from, the Financing Authority the projects financed along with the real property on which they are situated. Annual base rental payments from the County approximate the bonds’ debt service requirements. If necessary, monies apportioned to the County in the State’s Motor Vehicle License Fee Account can be used toward meeting the lease obligation. The 1994 Series A Lease Revenue Bonds matured on November 15, 2011. The Series B bonds, issued for $51,500, bear interest at variable rates set daily, weekly, semi-annually, or on a term basis, as determined by the remarketing agent. Series B bonds also contain an early redemption provision, allowed at call rates of 100% of the bonds’ face value, plus accrued interest. The 1994 Series B bonds are secured by an irrevocable letter of credit (credit facility) pursuant to a Standby Bond Purchase Agreement with JP Morgan Chase Bank N.A. dated November 1, 2000. At June 30, 2014, the irrevocable letter of credit amount was $52,126 and the expiration date is November 1, 2016. The Financing Authority’s repayment of unreimbursed draws made on the credit facility bear interest at rates as defined in the Standby Bond Purchase Agreement

COUNTY OF SANTA CLARA
Notes to the Basic Financial Statements (Continued) June 30, 2014
(Dollars in thousands)
73
(9) Long-Term Liabilities (Continued)
up to 12% per annum with the principal due at November 1, 2016. The Financing Authority is required to pay JP Morgan Chase Bank N.A. an annual commitment fee of 1.15% effective July 6, 2012 and 0.625% effective November 1, 2013 based on the outstanding principal amount of the bonds supported by the credit facility. For the year ended June 30, 2014, the Financing Authority paid an annual commitment fee in the amount of $424.
1997 Series A Lease Revenue Bonds and 2008 Series A Lease Revenue Bonds - The Financing Authority’s 1997 Series A Lease Revenue Bonds, issued for $188,405 on October 1, 1997, advance refunded $146,975 of the 1994 Series A Lease Revenue Bonds and all $16,405 of outstanding debt for the Public Facilities Corporation 1988 COPs. Debt payments on the 1997 Series A Lease Revenue Bonds are insured by a municipal bond insurance policy issued by AMBAC Assurance Corporation. On February 14, 2008, the Financing Authority issued $126,410 of 2008 Series A Lease Revenue Bonds on behalf of the County and SCVMC to current refund a portion of outstanding 1997 Series A Lease Revenue Bonds. The 2008 Series A Bonds net proceeds and amounts available from the refunded bonds were used to establish a refunding escrow on the date of the issuance of the 2008 Series A Lease Revenue Bonds. The 1997 Series A Lease Revenue Bonds in the amount of $131,415 were redeemed on March 17, 2008 and have been removed from the County’s basic financial statements. The 2008 Series A Lease Revenue Bonds bear fixed interest rates ranging from 3.00% to 5.00% and have a final maturity date of November 15, 2022. 2006 Series I Lease Revenue Bonds - On March 2, 2006, the County through the Financing Authority issued 2006 Series I Lease Revenue Bonds in the amount of $149,740. The bonds were issued to finance the construction costs of the County Crime Laboratory Facility; the Valley Health Clinics at Fair Oaks and in Gilroy; and seismic retrofitting costs of the County Courthouse. The bonds bear fixed interest rates ranging from 4.00% to 5.00% and have a final maturity date of May 15, 2031. 2007 Series K Lease Revenue Bonds - On August 15, 2007, the Financing Authority issued $93,540 of 2007 Series K Lease Revenue Bonds on behalf of the County and SCVMC. The bond proceeds were used for (i) the acquisition, site preparation, construction, furnishing and equipping of the Fleet Facility; (ii) the acquisition, site preparation, construction, furnishing and equipping of the Milpitas Health Clinic, including a nearby parking garage; and (iii) the seismic retrofitting of the Los Gatos Courthouse and the Hall of Justice – West. The bonds bear fixed interest rates ranging from 4.00% to 5.00% and have a final maturity date of May 15, 2037. 2008 Series L Lease Revenue Bonds - On May 22, 2008, the Financing Authority issued $112,840 of 2008 Series L Lease Revenue Bonds on behalf of the County and SCVMC to refund the County’s outstanding 2003 Series D and 2005 Series H bond, and SCVMC’s outstanding 2006 Series J Lease Revenue Bonds. The 2008 Series L Lease Revenue Bonds bear fixed interest rates ranging from 4.00% to 5.25% and have a final maturity date of May 15, 2036.
2008 Series M Lease Revenue Bonds - On May 29, 2008, the Financing Authority issued $143,105 of 2008 Series M Lease Revenue Bonds on behalf of the County and SCVMC. The bond proceeds were used to refund the outstanding 2005 Series F and 2005 Series G Lease Revenue Bonds on June 4, 2008. The bonds initially bear variable interest based on the weekly interest rate as defined in the bond indenture and have a final maturity date of May 15, 2035.
COUNTY OF SANTA CLARA
Notes to the Basic Financial Statements (Continued) June 30, 2014
(Dollars in thousands)
74
(9) Long-Term Liabilities (Continued)
In connection with the issuance of the 2008 Series M Lease Revenue Bonds, the Financing Authority obtained an irrevocable letter of credit as a credit facility with Bank of America, N.A. The letter of credit is set to expire on October 31, 2015. If Bank of America, N.A. elected not to extend the expiration date, the variable rate bonds would convert to Bank Bonds with repayments made in accordance with the maturity schedule provided in the Trust Agreement and these Bank Bonds would bear interest at the Bank Rate which is up to 12% per annum. The Financing Authority is required to pay Bank of America, N.A. an annual commitment fee of 0.60%, effective September 18, 2012 based on the outstanding principal amount of the bonds supported by the credit facility. For the year ended June 30, 2014, the Financing Authority paid an annual commitment fee in the amount of $829.
Interest Rate Swap Related to the 2008 Series M Lease Revenue Bonds
In May 2005, the County through the Financing Authority issued 2005 Series F and 2005 Series G Lease Revenue Bonds (2005 Series F and G bonds) in the amount of $71,025 and $71,025, respectively. The bonds were issued to provide funds for the Charcot Center, Valley Specialty Center and Morgan Hill Courthouse. In May 2008, the County through the Financing Authority issued lease revenue bonds 2008 Series M in the amount of $143,105 to fully refund the 2005 Series F and G in the total amount of $142,050. The difference of principal amount between the 2008 Series M and the refunded 2005 Series F and G bonds in the amount of $1,055 represents additional funding for the cost of issuance of 2008 Series M and was fully paid on fiscal year 2011. The payment schedule for the 2008 Series M starting fiscal year 2012 remains the same as the combined debt service schedule for the refunded 2005 Series F and G bonds. Objective of the Interest Rate Swaps. As a means to lower its borrowing costs, when compared against fixed-rate bonds at the time of issuance in May 2005, the Financing Authority entered into interest rate swap agreements with Citibank, N.A. (Citibank) in connection with its $71,025 Series F and $71,025 Series G variable rate lease revenue bonds. The intention of the swaps was to effectively change the Financing Authority’s variable interest rates on the 2005 Series F and G bonds to a synthetic fixed rate of 3.185%. The Financing Authority continued to hedge the 2008 Series M bonds with the 2005 swap agreement. Significant Terms. The bonds and related swap agreements both mature on May 15, 2035. The swaps’ notional amount matches the $142,050 principal amount of the 2008 Series M variable rate bonds. The swaps were entered into at the same time the 2005 Series F and G bonds were issued in May 2005. Starting fiscal year 2012, the notional value of the swaps declines as the principal amount of the associated debt begins to be repaid. Under the swaps, the Financing Authority pays the counterparty a fixed payment of 3.185% and receives a variable payment computed as 56.5% of USD-LIBOR-BBA plus 0.33%. Fair Value. The swaps had a combined aggregate negative fair value of $16,976 as of June 30, 2014. Since coupons on the Financing Authority’s variable rate securities adjust to changing interest rates, they do not have a corresponding fair value increase. The fair value is the net present value of the swaps using market data and the terms of the swaps, which include the expectations of the probability of occurrence of certain underlying events as defined in the swaps’ documentation.

COUNTY OF SANTA CLARA
Notes to the Basic Financial Statements (Continued) June 30, 2014
(Dollars in thousands)
75
(9) Long-Term Liabilities (Continued) Credit Risk. The aggregate fair value of the swaps represented the Financing Authority’s credit exposure to the counterparties as of June 30, 2014. Should the counterparties fail to perform according to terms of the swap contracts, the Financing Authority faced a maximum possible loss equivalent to the aggregate fair value of the swaps. At June 30, 2014, the Financing Authority was not exposed to credit risk because the swaps had a negative fair value of $16,976. To mitigate the potential credit risk, the counterparties are required to post collateral, in the form of cash or federal government securities, if their credit ratings for long-term unsecured debt obligations fall below “A” by Moody’s Investors Service or “A” by Standard and Poor’s or Fitch Ratings. As of June 30, 2014, Citibank’s ratings were A2 by Moody’s, A by Standard and Poor’s, and A by Fitch Ratings. Basis Risk. The Financing Authority has chosen a variable index based on a percentage of LIBOR plus a spread, which historically has closely approximated the variable rates payable on the related bonds. However, the Financing Authority is subject to the risk that a change in the relationship between the LIBOR-based swap rate and the variable rates would cause a material mismatch between the two rates. Changes that cause the payments received from the counterparty to be insufficient to make the payments due on the associated bonds result in an increase in the synthetic interest rate on the bonds, while changes that cause the counterparty payments to exceed the payments due on the associated bonds result in a decrease in the synthetic interest rate on the bonds. As a result of changing basis between LIBOR and the rate on the Financing Authority’s bonds during the course of the year, the synthetic fixed rate for the fiscal year ended June 30, 2014, was 2.837%. Termination Risk. The Financing Authority or Citibank may terminate the swaps if the other party fails to perform under the terms of the contract. The swaps may be terminated by the Financing Authority if Citibank’s credit rating of long-term, unsecured, unenhanced senior debt obligations is withdrawn, suspended or falls below “Baa1” as determined by Moody’s Investors Service, or “BBB+” as determined by Standard and Poor’s, or fail to have any rated long-term, unsecured, unenhanced senior debt obligations. The swaps may be terminated by Citibank if the County’s rating of long-term, unsecured, unenhanced senior debt obligations or lease obligations of the County is withdrawn, suspended or falls below “Baa3” as determined by Moody’s Investors Service, or “BBB-” as determined by Standard and Poor’s, or the County fails to have any rated long-term, unsecured, unenhanced senior debt obligations or lease obligations. Counterparty Risk. The Financing Authority is exposed to counterparty risk, which is related to credit and termination risk. The termination of the swaps may result in a payment to the counterparty. The Financing Authority may also be exposed to counterparty risk in a high interest rate environment in the event the counterparty is unable to perform its obligations on a swap transaction leaving the Financing Authority exposed to the variable rates on the associated debt.
Interest Rate Risk. The swaps are structured to reduce the County’s exposure to interest rate risk.
Rollover Risk. The Financing Authority is not exposed to rollover risk as the swaps matched the terms of the 2008 Series M Bonds starting fiscal year 2012.

COUNTY OF SANTA CLARA
Notes to the Basic Financial Statements (Continued) June 30, 2014
(Dollars in thousands)
76
(9) Long-Term Liabilities (Continued) Swap Payments and Associated Debt Service Payments. Using rates as of June 30, 2014, debt service requirements of the 2008 Series M bonds and net swap payments, assuming current interest rates remain the same for the term, were as follows. As rates vary, variable rate bond interest payments and net swap payments will vary.
Year Ending Variable Net Swap TotalJune 30, Principal Interest (1) Interest (2) Interest
2015 4,450$ 90$ 3,558$ 3,648$ 2016 4,600 87 3,439 3,526 2017 4,700 84 3,320 3,404 2018 4,850 81 3,202 3,283 2019 5,050 77 3,044 3,121
2020-2024 27,600 332 13,123 13,455 2025-2029 32,275 229 9,052 9,281 2030-2034 37,825 108 4,269 4,377 2035-2035 8,300 6 198 204
129,650$ 1,094$ 43,205$ 44,299$
_________________________________
(1) Variable interest on the 2008 Series M is estimated using interest rate at June 30, 2014, of 0.07%. (2) Net swap interest on the 2008 Series M is estimated using USD-LIBOR-BBA rate at June 30, 2014, of 0.153%. Net
swap interest at June 30, 2014, is calculated as follows: 3.185% minus (0.155% * 56.5% + 0.33%) equals to 2.767%.
Impact on Financial Statements. The impact of the interest rate swaps on the financial statements for the year ended June 30, 2014, is as follows:
Derivative Deferred outflows instrument
of resources liabilitiesBalance at July 1, 2013 17,007$ 17,007$ Change in fair value (31) (31)
Balance at June 30, 2014 16,976$ 16,976$
Derivative instrument liabilities of $16,976 as of June 30, 2014, represent the fair value of the interest rate swap agreements and deferred outflows on resources of $16,976 as of June 30, 2014, represent accumulated decreases in fair value of hedging derivatives.

COUNTY OF SANTA CLARA
Notes to the Basic Financial Statements (Continued) June 30, 2014
(Dollars in thousands)
77
(9) Long-Term Liabilities (Continued) 2012 Series A Lease Revenue Bonds - On August 8, 2002, the Financing Authority issued $86,920 of 2012 Series A Lease Revenue Bonds on behalf of the County and SCVMC. The bonds were issued to provide funds to finance various public capital improvements and projects related to the Santa Clara Valley Health and Hospital System Enterprise Core Health Care Information System. The 2012 Series A Lease Revenue Bonds bear fixed interest rates ranging from 4.00% to 5.00% and have a final maturity date of February 1, 2024.
Division of the Lease Revenue Bonds
The division of the lease revenue bonds between the governmental activities and the SCVMC is based on the usage of bond proceeds by the governmental activities and business-type activities (SCVMC) as follows:
Governmental Business-typeLease Revenue Bonds: Activities Activities
1985 ACES 15.9% 84.1%1994 Series B 1.4% 98.6%1997 Series A 9.4% 90.7%2006 Series I 58.5% 41.5%2007 Series K 24.2% 75.8%2008 Series A 4.4% 95.6%2008 Series L 53.0% 47.0%2012 Series A 22.2% 77.8%
Airport On July 1, 2003, the Association of Bay Area Governments (ABAG) issued Series 2002-1 Lease Revenue Bonds, in the amount of $13,370. These bonds were issued to finance or refinance certain capital improvements within their geographical boundaries. On June 4, 2002, the County Board approved a resolution to enter into a lease agreement with ABAG for $6,780 of this debt via a lease/leaseback arrangement of one or more properties to ABAG. The proceeds of the debt provided financing for the acquisition, construction, and renovation of certain capital improvements at the County’s airports.

COUNTY OF SANTA CLARA
Notes to the Basic Financial Statements (Continued) June 30, 2014
(Dollars in thousands)
78
(9) Long-Term Liabilities (Continued)
(c) Repayment Requirements As of June 30, 2014, the debt service requirements to maturity and the fund types from which principal payments will be made are as follows, excluding capital lease obligations, accrued litigation liability, insurance claims liabilities and accrued vacation and sick leave. Governmental Activities
Lease Tobacco Securtization Certificates of Taxable Pension GeneralFiscal year Revenue Bonds (1) Asset-Backed Bonds Participation Funding Bonds Obligation Bondending June 30: Principal Interest Principal Interest Principal Interest Principal Interest Principal Interest2015 15,336$ 10,407$ -$ -$ 190$ 160$ 3,975$ 19,479$ 5,520$ 35,460$ 2016 15,960 9,712 - - 195 152 4,326 20,074 6,595 35,179 2017 16,422 8,980 - - 205 144 4,647 20,727 7,740 34,847 2018 9,583 8,218 - - 215 134 4,924 21,461 8,955 34,463 2019 9,957 7,815 - - 225 124 5,169 22,251 10,235 34,003 2020-2024 57,075 31,905 - - 1,300 438 28,645 125,261 74,030 160,297 2025-2029 52,758 18,842 - - 945 96 30,997 154,444 121,595 136,123 2030-2034 38,058 6,886 - - - - 152,106 70,324 182,425 101,749 2035-2039 8,635 838 43,604 178,571 - - 140,630 13,214 255,825 56,586 2040-2044 - - 11,339 66,321 - - - - 131,780 10,004 2045-2049 - - 18,025 158,675 - - - - - - 2050-2054 - - - - - - - - - - 2055-2057 - - 29,062 648,788 - - - - - - Total 223,784$ 103,603$ 102,030$ 1,052,355$ 3,275$ 1,248$ 375,419$ 467,235$ 804,700$ 638,711$
_______
(1) Variable interest on the 1994 Series B Lease Revenue Bonds, the 2004 Series A Lease Revenue Bonds, and the 2008 Series M Lease Revenue Bonds are estimated using interest rate at June 30, 2014, of 0.06%, 0.08%, and 0.07%, respectively.
Certificates of participation retirement and related interest payments are serviced by revenues generated by the Santa Clara County Vector Control District. Taxable Pension Funding Bonds are serviced by future charges to County departments. Capital Lease Obligations are serviced by Santa Clara County Central Fire Protection District and South Santa Clara County Fire District. Accrued litigation liability, insurance claims payable and accrued vacation and sick leave are generally liquidated by the General Fund. Business-type Activities
SCVMC AirportFiscal year ending Lease Revenue Bonds (1) Lease Revenue BondsJune 30: Principal Interest Principal Interest2015 23,939$ 16,670$ 220 222 2016 24,978 15,767 155 213 2017 26,004 14,817 165 2062018 27,154 13,798 170 1982019 28,432 12,706 180 1902020-2024 146,066 45,590 1,050 801 2025-2029 114,565 28,321 1,335 505 2030-2034 94,032 19,098 1,325 137 2035-2037 44,260 3,151 - -
Total 529,430$ 169,918$ 4,600$ 2,472$
__________ (1) Variable interest on the 1994 Series B Lease Revenue Bonds, and the 2008 Series M Lease Revenue Bonds are
estimated using interest rate at June 30, 2014, of 0.06%, 0.08%, and 0.07%, respectively.

COUNTY OF SANTA CLARA
Notes to the Basic Financial Statements (Continued) June 30, 2014
(Dollars in thousands)
79
(9) Long-Term Liabilities (Continued)
(d) Pledged Revenues for Bonds
The lease revenue bonds issued by the Hospital Facilities Authority and the Financing Authority (Financing Authorities) are payable by a pledge of revenues from the base rental payments payable by the County, SCVMC, and the Housing Authority, pursuant to the Master Facility Lease Agreements between the County and the Financing Authorities and between the Housing Authority and the Financing Authority for the use of facilities acquired or constructed by the Financing Authorities. Under California law, the County, SCVMC, and the Housing Authority cannot make lease payments until the County, SCVMC, and the Housing Authority has constructive use or occupancy of the property being financed. Once construction is completed, the leases act like direct financing leases with lease payments equal to debt service payments. Total debt service requirements remaining on the lease revenue bonds is $1,026,735 payable through September 1, 2038. For the fiscal year ended June 30, 2014, the total lease payments made by the County, SCVMC, and the Housing Authority totaled to $76,041 and total debt service payments paid by the Financing Authorities totaled to $92,784.
The County’s Series 2007 Tobacco Settlement Asset-Backed Bonds are secured by the pledge of future tobacco settlement revenues made by participating cigarette manufacturers to the County. Tobacco settlement revenues due to the County on and after January 1, 2026 have been pledged until June 1, 2056, the final maturity date of the bonds. The total principal and interest remaining on these bonds is approximately $1,154,385. The County did not receive any tobacco settlement revenues for the bonds nor made any debt service payments on these bonds during the fiscal year ended June 30, 2014. The County’s Series 2009 General Obligation Bonds are payable from pledged ad valorem property taxes until August 1, 2039, the final maturity date of the bonds. The total principal and interest remaining on these bonds is approximately $613,135. For the fiscal year ended June 30, 2014, the County collected $13,208 in ad valorem property taxes and made total debt service payments in the amount of $16,740. The County’s Series 2013 General Obligation Bonds are payable from pledged ad valorem property taxes until August 1, 2043, the final maturity date of the bonds. The total principal and interest remaining on these bonds is approximately $830,275. The County will start collecting ad valorem property taxes for the bonds in fiscal year 2015 and has made total debt service payments in the amounts of $18,023 during the fiscal year ended June 30, 2014.
The Airport’s lease revenue bonds are secured by the pledge of revenues generated by the Airport and paid to ABAG as lease payments. The leases act like direct financing leases with lease payments received by ABAG equal to debt service payments made by the Airport. These revenues have been pledged until July 1, 2032, the final maturity date of the bonds. The total principal and interest remaining on these bonds is approximately $7,073. For the fiscal year ended June 30, 2014, the total principal and interest payment made by the Airport totaled to $413.
(e) Legal Debt Margin As of June 30, 2014, the County’s legal debt limit (1.25% of the total assessed valuation) was $4.18 billion. At June 30, 2014, the County has debt in the amount of $804.7 million applicable to the limit outstanding and the legal debt margin was $3.38 billion.

COUNTY OF SANTA CLARA
Notes to the Basic Financial Statements (Continued) June 30, 2014
(Dollars in thousands)
80
(9) Long-Term Liabilities (Continued)
(f) Arbitrage Rebate Payable Section 148 of the Internal Revenue Code requires issuers of most types of tax-exempt bonds to rebate investment earnings in excess of bond yield to the federal government in installment payments made at least once every five years, with the final installment made when the last bond in the issue is redeemed. A consulting firm calculates annual computation of all rebate requirements. Amounts in excess of allowable investment earnings are held pursuant to the Trust Indentures. At June 30, 2014, the County did not accrue amounts for arbitrage rebate payable in the government-wide statements – governmental activities, while $520 has been accrued in the government-wide statements – business-type activities and the SCVMC enterprise fund under the “Due to other governmental agencies” financial statement caption.
(g) Housing Authority Long-term Obligations Outstanding notes, loans, and bonds payable for the Housing Authority consisted of the following:
Interest Principal Original Issue Outstanding atType of indebtedness (purpose) Maturity Rates Installments Amount June 30, 2014
Business-type activity - notes payable:Redevelopment Agency of the
City of Morgan Hill 6/15/2021 1.00% (1) 425$ 425$
City of San Jose (Morrone Gardens) 9/23/2024 4.00% (1) 973 973
Subtotal business-type activity 1,398$ 1,398
Component units (as of December 31, 2013):AE Associates, Ltd. 4,662 Bascom HACSC Associates 12,760 Blossom River Associates 16,020 Clarendon Street, L.P. 22,465 Fairground Luxury Family Apartments, L.P. 40,387 Fairground Senior Apartments, L.P. 22,245 HACSC/Choices Familiy Associates 15,898 HACSC/Choices Senior Associates 11,347 Helzer Associates 21,598 Julian Street Partners, L.P. 40,023 Opportunity Center Associates 10,700 Poco Way Associates 219 Rincon Gardens Associates, L.P. 31,353 Rotary Placa/HACSC HDC, Inc. 8,324 S.P.G. Housing, Inc. 10,867 Thunderbird Associates 2,440 Villa San Pedro, Inc. 7,739 Willow/HACSC Associates 4,355
Subtotal component units 283,402
Total Housing Authority 284,800$ ___________(1) Deferred until maturity

COUNTY OF SANTA CLARA
Notes to the Basic Financial Statements (Continued) June 30, 2014
(Dollars in thousands)
81
(9) Long-Term Liabilities (Continued) The debt service requirements to maturity for the Housing Authority’s business-type activity’s notes payable are as follows:
Fiscal year endingJune 30: Principal Interest2015 20$ 43$ 2016 - 43 2017 - 43 2018 - 43 2019 - 43 2020 - 2024 1,378 213
Total 1,398$ 428$
A copy of each of the Housing Authority’s component units separately issued audited financial statements can be obtained from the Housing Authority’s management.
(10) Hospital Program Revenues
(a) Net Patient Service Revenue
Net patient service revenues are reported at the estimated net realizable amounts from patients, third-party payers, and others for services rendered at the SCVMC, including estimated adjustments under reimbursement agreements with third-party payers (contractual allowances) and the uncollectible portion of patient service revenues (bad debts provision). Net patient service revenues are calculated for the fiscal year ended June 30, 2014, as follows:
Patient service revenues 3,080,786$ Contractual allowances (2,143,959) Bad debts provision (40,856)
Net patient service revenues 895,971$
Differences between final settlements with third-party payors and the estimate originally recorded are included in operations in the year in which the settlement amounts become known. A substantial portion of SCVMC’s patient service revenues are derived from services provided to patients eligible for benefits under the Medi-Cal and Medicare programs. Revenue from the Medi-Cal and Medicare programs represents approximately 57% of net patient service revenue (excluding the effects of bad debts provision) for the fiscal year ended June 30, 2014. Revenue from the Medicare program represents approximately 16% of net patient service revenue (excluding the effects of bad debts provision) for the fiscal year ended June 30, 2014. Reimbursement for services provided under these programs is currently based on various contractual arrangements (see Note 14(c)).
COUNTY OF SANTA CLARA
Notes to the Basic Financial Statements (Continued) June 30, 2014
(Dollars in thousands)
82
(10) Hospital Program Revenues (Continued) (b) Other Program Revenues
Effective November 1, 2010, CMS and the State agreed on the standard terms and conditions of the 5 year renewal of the 1115 Medi-Cal waiver, officially called the California Bridge to Reform Demonstration. The funds available through the waiver will help California prepare for health care reform through investments in the safety net delivery system and expansion of coverage for adults between 0% and 200% of the Federal Poverty Level (FPL). The waiver establishes the Low Income Health Program (LIHP), which provides Federal matching funding for enrollees. The LIHP is the umbrella title for what is now a two component program: 1) Medicaid Coverage Expansion (MCE) covers adults with family incomes at or below 133%
(FPL). These enrollees will be eligible for Medi-Cal in 2014 and the Federal matching funding is uncapped.
2) Health Care Coverage Initiative (HCCI) covers adults with family incomes between 134% and 200% FPL. These enrollees will be eligible for the State Exchange in 2014.
Effective November 1, 2010, the LIHP program will be managed by the County and will augment the California Medical Services Program (CMSP) for the medically indigent.
Additionally, as part of the renewed 1115 Waiver, CMS authorized California to invest savings generated through the Demonstration to achieve critical objectives, such as improved quality of care and better care coordination through safety net providers. Over 5 years, up to $6.6 billion in federal funds will be available from a delivery system reform incentive pool (DSRIP), part of a $15.3 billion safety net care pool. Many key concepts underlying federal health care reform will be tested, evaluated, and refined in California. As a result of participation in the DSRIP, SCVMC received $55,000 in fiscal year 2014.
(c) Capital Contributions
Senate Bill 1732 (SB 1732) provides qualifying hospitals reimbursement for a portion of the debt service of qualified capital projects, in addition to their Medi-Cal contract reimbursement. SB 1732 revenues are classified as capital contributions for reporting purposes under accounting principles generally accepted in the United States of America. SB 1732 capital contributions as of June 30, 2014, are $7,234.
COUNTY OF SANTA CLARA
Notes to the Basic Financial Statements (Continued) June 30, 2014
(Dollars in thousands)
83
(10) Hospital Program Revenues (Continued) (d) Charity Care
The SCVMC has a policy for providing charity care to patients who are otherwise unable to afford health care services. Generally, charity care recipients are those patients for which an indigency standard has been established and for which the patient qualifies. Inability to pay may be determined through an interview process by the SCVMC, by the Department of Revenue, or by an outside collection agency. Determination of charity care status may be made prior to or at the time of service, or any time thereafter. The total amount of such charity care provided by the SCVMC for the fiscal year ended June 30, 2014, based on the cost incurred to perform these services, is as follows:
Charity care, at cost $ 190,678 Percentage of operating expenses 16%
Charity care at cost is calculated excluding the impact of other revenue received listed above.
(11) Net Position/Fund Balances
(a) Net Position Classifications
The government-wide and proprietary funds financial statements utilize a net position presentation. Net position is categorized as net investment in capital assets, restricted and unrestricted.
Net Investment in Capital Assets – This category groups all capital assets, including infrastructure, into one component of net position. Accumulated depreciation and the outstanding balances of debt that are attributable to the acquisition, construction or improvement of these assets reduce the balance in this category.
Restricted Net Position – This category consists of restricted assets reduced by liabilities and deferred inflows of resources related to those assets. Restricted net position includes restrictions for parks, mental health, capital facilities, debt service, housing programs, roads and other purposes.
Unrestricted Net Position – This category represents net position of the County not restricted for any project or purpose.
During fiscal year 2007, the County, through the JPA and Corporation, issued $102,030 of Tobacco Settlement Asset-Backed Bonds. In addition, in fiscal years 2009 and 2013, the County issued $350,000 and $490,000, respectively, in general obligation bonds. Proceeds received were used for the purpose of rebuilding and improving the seismic deficiencies of its medical facilities and the restricted bond proceeds were deposited in the SCVMC fund. These restricted debt proceeds are reported as part of restricted net position in the County’s business-type activities. However, the debt service will be paid with governmental revenues and as such these bonds are reported with unrestricted net position in the County’s governmental activities. In accordance with GASB guidance, at June 30, 2014, the County reclassified $362.6 million of the primary government’s total net position amounts from restricted to unrestricted and $594.3 million from net investment in capital assets to unrestricted to reflect the primary government as a whole perspective.

COUNTY OF SANTA CLARA
Notes to the Basic Financial Statements (Continued) June 30, 2014
(Dollars in thousands)
84
(11) Net Position/Fund Balances (Continued)
(b) Fund Balances Classifications
As prescribed by GASB Statement No. 54, governmental funds report fund balance in classifications based primarily on the extent to which the County is bound to honor constraints on the specific purposes for which amounts in the funds can be spent. As of June 30, 2014, fund balances for government funds are made up of the following: Nonspendable Fund Balance – This category represents amounts that are (a) not in spendable form, or (b) legally or contractually required to be maintained intact. The “not in spendable form” criterion includes items that are not expected to be converted to cash, for example: inventories, prepaid amounts, and long-term notes receivable. Restricted Fund Balance – This category represents amounts that can be spent only for specific purposes stipulated by external parties, constitutionally or through enabling legislation.
Committed Fund Balance – This category represents amounts that can only be used for the specific purposes determined by a formal action of the County’s highest level of decision-making authority. Commitments may be changed or lifted only by the County taking the same formal action that imposed the constraint originally. The Board is the County’s highest level of decision making. The highest level of formal action to commit resources is the passage of ordinances. Assigned Fund Balance – This category represents amounts intended to be used by the County for specific purposes that are neither restricted nor committed. Intent is expressed by (a) the Board, (b) standing committees of the Board, or (c) Director of Finance. Assignments are established by the Board through resolutions and delegation to the Director of Finance to set aside amounts to cover purchase orders, contracts, and other commitment for the expenditures of monies for budgetary purposes. Unassigned Fund Balance – This category represents the residual classification for the General Fund and includes all amounts not contained in the other classifications. Unassigned amounts are technically available for any purpose. In circumstances when an expenditure is made for a purpose for which amounts are available in multiple fund balance classification, fund balance is generally depleted in the order of restricted, committed, assigned, and unassigned.

COUNTY OF SANTA CLARA
Notes to the Basic Financial Statements (Continued) June 30, 2014
(Dollars in thousands)
85
(11) Net Position/Fund Balances (Continued) Fund balances for the governmental funds as of June 30, 2014, were distributed as follows:
General NonmajorFund Funds Total
Nonspendable:Inventory 2,165$ 613$ 2,778$ Advances to other fund 607 - 607 Prepaid items 7,038 - 7,038
Total nonspendable 9,810 613 10,423
Restricted for:Child support programs - 802 802 Clerk recorder programs - 11,766 11,766 Debt service - 55,472 55,472 Energy efficient system projects - 1,371 1,371 Health and human services 14,711 - 14,711 Housing and community development programs - 20,196 20,196 Law enforcement 29,472 - 29,472 Library services - 25,602 25,602 Mental health services - 98,119 98,119 Parks acquisition and development projects - 72,332 72,332 Public ways and facilities - 56,482 56,482 Stanford trails - 10,504 10,504 Technology projects - 8,826 8,826 Vector control programs - 14,433 14,433 Other purposes 16,323 4,711 21,034
Total restricted 60,506 380,616 441,122
Committed to:County parks operations - 14,663 14,663 Environmental health services - 19,669 19,669 Fire protection services - 12,500 12,500 General capital improvement projects - 51,403 51,403 Housing programs 11,410 - 11,410 Postemployment healthcare benefits 6,172 - 6,172 Public ways and facilities 555 593 1,148 Working capital 12,584 - 12,584 Other purposes 14,121 917 15,038
Total committed 44,842 99,745 144,587
Assigned to:Fire protection services - 37,197 37,197 General liability 5,656 - 5,656 Other purposes 6,289 - 6,289
Total assigned 11,945 37,197 49,142
Unassigned 237,856 - 237,856 Total 364,959$ 518,171$ 883,130$
COUNTY OF SANTA CLARA
Notes to the Basic Financial Statements (Continued) June 30, 2014
(Dollars in thousands)
86
(11) Net Position/Fund Balances (Continued)
County’s Contingency Reserve Policy. The Board adopted a contingency reserve policy that set the reserve at 5 percent of the General Fund’s revenues, net of pass-through. The contingency reserve can be used to support costs on a one-time basis for unanticipated and unforeseen events as stated in the policy or to support ongoing costs as a financing mechanism, when presented with critical program initiatives that have a time requirement that cannot be deferred. As of June 30, 2014, the County has a balance in its contingency reserve in the amount of $106,784 reported as part of the General Fund’s unassigned fund balance.
(12) Employee Benefit Plans
(a) California Public Employees’ Retirement System – County
Plan Description
All eligible County employees participate in the State’s Public Employees’ Retirement System (PERS). The County participates in four plans with PERS. Two plans (Miscellaneous and Safety) cover the Santa Clara Central Fire District (Central Fire) and two plans (Miscellaneous and Safety) cover all remaining eligible County and Superior Court employees. PERS provides retirement and disability benefits, annual cost-of-living adjustments, and death benefits based on the employees’ years of service, age and final compensation. The provisions and all other requirements are established by State statute and County through contracts with PERS. Copies of PERS’ annual financial report may be obtained from their executive office at 400 Q Street, Sacramento, California 95811. A separate report for the County’s plan in PERS is not available. Effective with the June 30, 2003 valuation, PERS converted the Central Fire’s Miscellaneous employees’ defined benefit retirement plan from an agent multiple-employer to a cost sharing multiple-employer. The Central Fire’s Miscellaneous employees’ retirement plan is under the PERS Miscellaneous 2.7% at 55 Risk Pool. The County employees’ plans (Miscellaneous and Safety) and the Central Fire Safety employees plan are agent multiple-employer defined benefit retirement plans. PERS acts as a common investment and administrative agent for participating public entities within the state. Public Employee’ Pension Reform Act of 2013 (PEPRA) required that all state, school, and local government employers offer a reduced benefit formula and increased retirement ages to new public employees, who first became PERS members on or after January 1, 2013. The new defined benefit formula is 2% at age 62 for newly hired Miscellaneous employees and 2.7% at age 57 for newly hired Safety employees. Funding Policy The contribution requirements of plan members and the County are established and may be amended by PERS. The County is required to contribute at an actuarially determined rate or prepay a discounted annual required contribution before the first payroll reported to PERS of the new fiscal year and after June 30. The County also paid employees share of the required contribution pursuant to the collective bargaining arrangements with the County’s employee unions ranging from 0% to 9% of their salary. Also, pursuant to the collective bargaining arrangements with the County’s employee unions, employees contribute a portion of the County’s annual required contribution ranging from 2.93% to 8% of an employee’s salary.
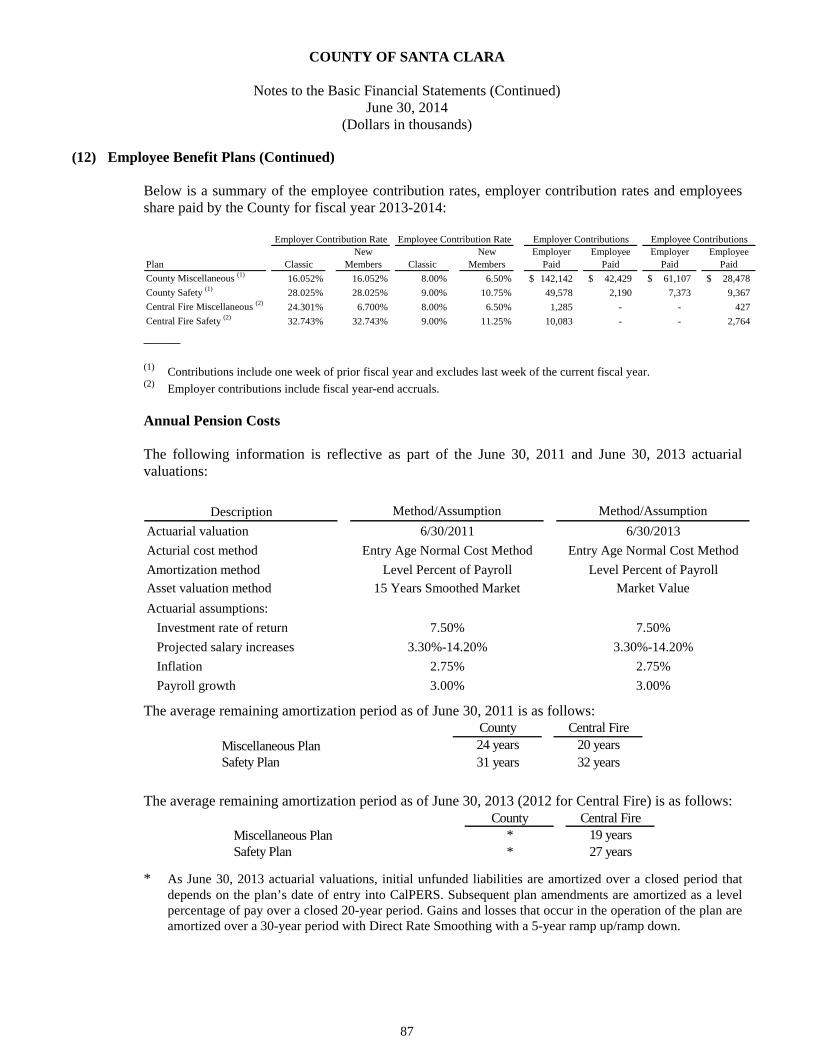
COUNTY OF SANTA CLARA
Notes to the Basic Financial Statements (Continued) June 30, 2014
(Dollars in thousands)
87
(12) Employee Benefit Plans (Continued) Below is a summary of the employee contribution rates, employer contribution rates and employees share paid by the County for fiscal year 2013-2014:
New New Employer Employee Employer EmployeePlan Classic Members Classic Members Paid Paid Paid Paid
County Miscellaneous (1) 16.052% 16.052% 8.00% 6.50% 142,142$ 42,429$ 61,107$ 28,478$
County Safety (1) 28.025% 28.025% 9.00% 10.75% 49,578 2,190 7,373 9,367
Central Fire Miscellaneous (2) 24.301% 6.700% 8.00% 6.50% 1,285 - - 427
Central Fire Safety (2) 32.743% 32.743% 9.00% 11.25% 10,083 - - 2,764
Employer Contributions Employee ContributionsEmployer Contribution Rate Employee Contribution Rate
_____ (1) Contributions include one week of prior fiscal year and excludes last week of the current fiscal year. (2) Employer contributions include fiscal year-end accruals.
Annual Pension Costs The following information is reflective as part of the June 30, 2011 and June 30, 2013 actuarial valuations:
Description Method/Assumption Method/Assumption
Actuarial valuation 6/30/2011 6/30/2013
Acturial cost method Entry Age Normal Cost Method Entry Age Normal Cost Method
Amortization method Level Percent of Payroll Level Percent of Payroll
Asset valuation method 15 Years Smoothed Market Market Value
Actuarial assumptions:
Investment rate of return 7.50% 7.50%
Projected salary increases 3.30%-14.20% 3.30%-14.20%
Inflation 2.75% 2.75%
Payroll growth 3.00% 3.00%
The average remaining amortization period as of June 30, 2011 is as follows: County Central Fire
Miscellaneous Plan 24 years 20 yearsSafety Plan 31 years 32 years
The average remaining amortization period as of June 30, 2013 (2012 for Central Fire) is as follows: County Central Fire
Miscellaneous Plan * 19 yearsSafety Plan * 27 years
* As June 30, 2013 actuarial valuations, initial unfunded liabilities are amortized over a closed period that
depends on the plan’s date of entry into CalPERS. Subsequent plan amendments are amortized as a level percentage of pay over a closed 20-year period. Gains and losses that occur in the operation of the plan are amortized over a 30-year period with Direct Rate Smoothing with a 5-year ramp up/ramp down.

COUNTY OF SANTA CLARA
Notes to the Basic Financial Statements (Continued) June 30, 2014
(Dollars in thousands)
88
(12) Employee Benefit Plans (Continued)
The County’s changes in net pension asset for the year ended June 30, 2014, were as follows:
County County CentralMiscellaneous Safety Fire
Annual required contribution 184,571$ 51,769$ 11,368$ Interest on net pension asset (20,901) (7,234) - Amortization of net pension asset 19,134 6,623 - Annual pension cost 182,804 51,158 11,368 Contributions made (184,571) (51,769) (11,368) Change in net pension asset (1,767) (611) - Net pension asset, beginning of year (278,678) (96,457) -
Net pension asset, end of year (280,445)$ (97,068)$ -$
Three-year trend information for the County’s Miscellaneous and Safety Plan are as follows:
Annual Percentage Net Pension Annual Percentage Net PensionFiscal Year Pension of APC Obligation Pension of APC Obligation
Ended Cost (APC) Contributed (Asset) Cost (APC) Contributed (Asset)6/30/2014 $ 182,804 101% $ (280,445) $ 51,158 101% $ (97,068)6/30/2013 172,453 102% (278,678) 46,032 102% (96,457)6/30/2012 167,814 102% (275,729) 46,170 103% (95,437)
County Safety County Miscellaneous
Three-year trend information for the Central Fire’s Miscellaneous and Safety Plans are as follows:
A nnual P ercentage N et P ensionF iscal Y ear P ension of A P C O bligation
E nded C ost (A P C ) C ontributed (A sset)6 /30 /2014 $ 11 ,368 100% $ - 6 /30 /2013 11 ,087 100% - 6 /30 /2012 11 ,324 100% -
Funded Status and Funding Progress
Summary of funding progress are as follows:
County County Central FireMiscellaneous Safety Safety
Plan Plan PlanActuarial valuation date 6/30/2013 6/30/2013 6/30/2012
Actuarial asset value 5,670,790$ 1,572,741$ 344,225$ Actuarial accrued liability - entry age 7,728,971 2,168,188 426,250
Unfunded actuarial accrued liability (UAAL) 2,058,181$ 595,447$ 82,025$
Funded ratio 73.4% 72.5% 80.8%Covered payroll 1,158,126$ 177,663$ 31,058$ UAAL as percentage of covered payroll 177.7% 335.2% 264.1%

COUNTY OF SANTA CLARA
Notes to the Basic Financial Statements (Continued) June 30, 2014
(Dollars in thousands)
89
(12) Employee Benefit Plans (Continued)
The schedule of funding progress, presented as required supplementary information (RSI) following the notes to the financial statements, presents multi-year trend information about whether the actuarial value of plan assets is increasing or decreasing over time relative to the actuarial accrued liability for benefits.
(b) County of Santa Clara Supplemental Benefit Plan - County During the fiscal year 2009, the County established a defined contribution retirement plan (County of Santa Clara Supplemental Benefit Plan (Supplemental Plan)). County employees hired or accepted written job offers before July 1, 2008 and with compensation in excess of the Internal Revenue Code (IRC) section 401(a)(17) limitations are eligible to participate in the Supplemental Plan. The Supplemental Plan is a tax-deferred plan that is subject to an annual contribution limit under the IRC and any supplemental benefits in excess of the IRC limit will be paid to the employee as taxable income. The County will contribute and deposit the supplemental benefits into the Supplemental Plan at the end of January, following the close of the plan’s calendar year. Employer contributions become fully vested at the time of the County’s contribution. The Supplemental Plan, which had 110 participants, had ending cash value of $19,193 at June 30, 2014. During the fiscal year ended June 30, 2014, the County contributed $2,195 to the Supplemental Plan.
(c) Housing Authority of the County of Santa Clara Retirement Plan Plan Description
In January 2009, the Housing Authority entered into a contract with PERS in order to participate in a PERS defined benefit pension plan (2% at age 55 Supplemental Formula for “classic” members or 2% at age 62 for “new” members). PEPRA defines classic members as those who are active PERS members prior to January 1, 2013 without a break in PERS service of greater than six months and new members as those who are active PERS members after January 1, 2013. All eligible Housing Authority employees participate in PERS, an agent multiple-employer defined benefit pension plan. PERS provides retirement, disability, and death benefits based on the employees’ years of service, age and final compensation. These provisions and all other requirements are established by State statute and Authority resolutions. Copies of PERS’ annual financial report may be obtained from their executive office: 400 Q Street, Sacramento, CA 95811.
Funding Policy
The contribution requirements of plan members and the Housing Authority are established and may be amended by PERS. Active plan members have an obligation to contribute a percentage of their annual covered salary to PERS. For classic employees (employees hired before January 1, 2013 or employees hired after January 1, 2013 and have been in the PERS system), the Housing Authority contributes the 7% employee portion on behalf of its employees since January 1, 2010. For new members (employees hired after January 1, 2013 and are new entrants to the PERS system), employees pay the 6.25% which is 50% of the total normal cost rate for the new benefit formula. The Housing Authority is required to contribute the actuarially determined remaining amounts necessary to fund the 2% at age 55 retirement plan benefits for its classic members and 2% at age 62 retirement plan benefits for its new members under PEPRA provisions. The actuarial methods and assumptions used are those adopted by the PERS Board of Administration. Based on the PERS valuation report as

COUNTY OF SANTA CLARA
Notes to the Basic Financial Statements (Continued) June 30, 2014
(Dollars in thousands)
90
(12) Employee Benefit Plans (Continued)
of June 30, 2012, the required employer contribution rate for the classic members for the year ended June 30, 2014 was 7.531%. The required employer contribution rate for the new members for the year ended June 30, 2014 was 7.531%. The contribution requirements of the plan members are established by State statute and the employer contribution rate is established and may be amended by PERS.
Annual Pension Cost
The Housing Authority’s actual contribution rates were determined as part of the June 30, 2011 actuarial valuation. The June 30, 2011 actuarial valuation used the entry age actuarial cost method. The actuarial assumptions included (a) 7.50% investment rate of return (net of administrative expenses), (b) projected annual salary increases of 3.30% to 14.20% depending on age, service, and type of employment, (c) overall payroll growth assumptions of 3.0%, and (d) 2.75% per year inflation adjustment. CalPERS’ unfunded actuarial accrued liability is being amortized as a level percentage of projected payroll on a closed basis. The average remaining amortization period as of June 30, 2014 is 7 years. The Housing Authority’s changes in deferred pension cost for the year ended June 30, 2014, were as follows:
Annual required contribution 820$ Interest on net pension asset (1,286) Amortization of net pension asset 2,685 Annual pension cost 2,219 Contributions made 820 Change in deferred pension cost 1,399 Deferred pension cost, beginning of year (16,594) Deferred pension cost, end of year (15,195)$
Three-year trend information for the Housing Authority is as follows:
Annual Percentage DeferredFiscal Year Pension of APC Pension
Ended Cost (APC) Contributed Cost6/30/2014 $ 2,219 37% $ (15,195)6/30/2013 1,898 37% (16,594)6/30/2012 894 311% (17,784)
Funded Status and Funding Progress The Housing Authority’s June 30, 2012 actuarial valuation (the most recent valuation available) used the entry age actuarial cost method. The actuarial assumptions included (a) 7.50% investment rate of return (net of administrative expenses), (b) projected salary increases of 3.30% to 14.20% depending on age, service and type of employment, (c) overall payroll growth assumptions of 3.0%, and (d) 2.75% per year inflation adjustment. PERS’ unfunded actuarial accrued liability is being amortized as a level percentage of projected payrolls on a closed basis. The average remaining amortization period as of June 30, 2014 is 7 years.
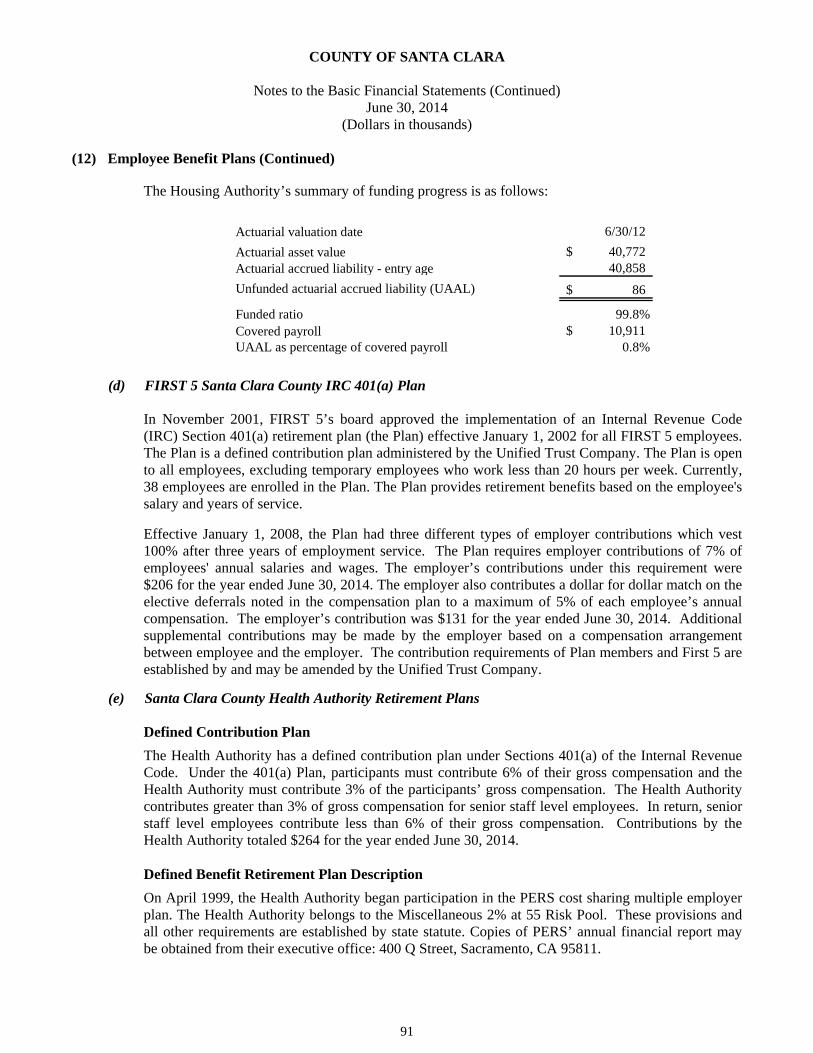
COUNTY OF SANTA CLARA
Notes to the Basic Financial Statements (Continued) June 30, 2014
(Dollars in thousands)
91
(12) Employee Benefit Plans (Continued) The Housing Authority’s summary of funding progress is as follows:
Actuarial valuation date 6/30/12
Actuarial asset value 40,772$ Actuarial accrued liability - entry age 40,858
Unfunded actuarial accrued liability (UAAL) 86$
Funded ratio 99.8%Covered payroll 10,911$ UAAL as percentage of covered payroll 0.8%
(d) FIRST 5 Santa Clara County IRC 401(a) Plan In November 2001, FIRST 5’s board approved the implementation of an Internal Revenue Code (IRC) Section 401(a) retirement plan (the Plan) effective January 1, 2002 for all FIRST 5 employees. The Plan is a defined contribution plan administered by the Unified Trust Company. The Plan is open to all employees, excluding temporary employees who work less than 20 hours per week. Currently, 38 employees are enrolled in the Plan. The Plan provides retirement benefits based on the employee's salary and years of service.
Effective January 1, 2008, the Plan had three different types of employer contributions which vest 100% after three years of employment service. The Plan requires employer contributions of 7% of employees' annual salaries and wages. The employer’s contributions under this requirement were $206 for the year ended June 30, 2014. The employer also contributes a dollar for dollar match on the elective deferrals noted in the compensation plan to a maximum of 5% of each employee’s annual compensation. The employer’s contribution was $131 for the year ended June 30, 2014. Additional supplemental contributions may be made by the employer based on a compensation arrangement between employee and the employer. The contribution requirements of Plan members and First 5 are established by and may be amended by the Unified Trust Company.
(e) Santa Clara County Health Authority Retirement Plans Defined Contribution Plan
The Health Authority has a defined contribution plan under Sections 401(a) of the Internal Revenue Code. Under the 401(a) Plan, participants must contribute 6% of their gross compensation and the Health Authority must contribute 3% of the participants’ gross compensation. The Health Authority contributes greater than 3% of gross compensation for senior staff level employees. In return, senior staff level employees contribute less than 6% of their gross compensation. Contributions by the Health Authority totaled $264 for the year ended June 30, 2014. Defined Benefit Retirement Plan Description
On April 1999, the Health Authority began participation in the PERS cost sharing multiple employer plan. The Health Authority belongs to the Miscellaneous 2% at 55 Risk Pool. These provisions and all other requirements are established by state statute. Copies of PERS’ annual financial report may be obtained from their executive office: 400 Q Street, Sacramento, CA 95811.
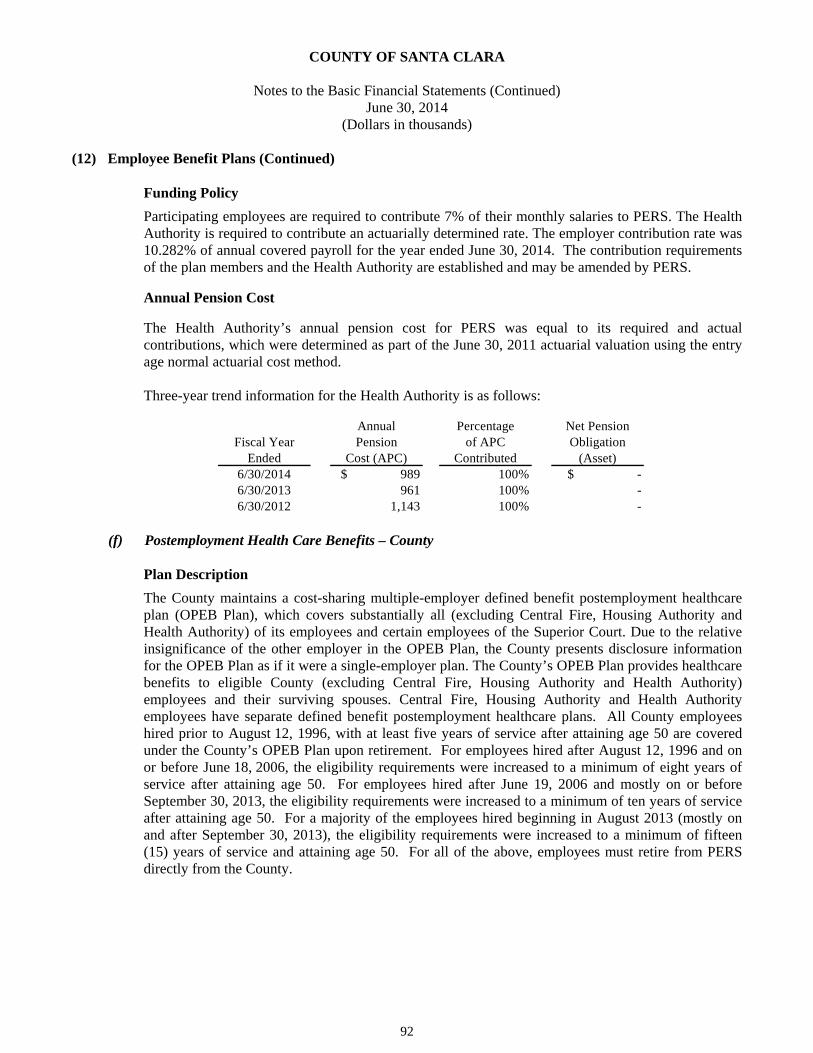
COUNTY OF SANTA CLARA
Notes to the Basic Financial Statements (Continued) June 30, 2014
(Dollars in thousands)
92
(12) Employee Benefit Plans (Continued) Funding Policy
Participating employees are required to contribute 7% of their monthly salaries to PERS. The Health Authority is required to contribute an actuarially determined rate. The employer contribution rate was 10.282% of annual covered payroll for the year ended June 30, 2014. The contribution requirements of the plan members and the Health Authority are established and may be amended by PERS.
Annual Pension Cost
The Health Authority’s annual pension cost for PERS was equal to its required and actual contributions, which were determined as part of the June 30, 2011 actuarial valuation using the entry age normal actuarial cost method. Three-year trend information for the Health Authority is as follows:
Annual Percentage Net PensionFiscal Year Pension of APC Obligation
Ended Cost (APC) Contributed (Asset)6/30/2014 $ 989 100% $ - 6/30/2013 961 100% - 6/30/2012 1,143 100% -
(f) Postemployment Health Care Benefits – County
Plan Description
The County maintains a cost-sharing multiple-employer defined benefit postemployment healthcare plan (OPEB Plan), which covers substantially all (excluding Central Fire, Housing Authority and Health Authority) of its employees and certain employees of the Superior Court. Due to the relative insignificance of the other employer in the OPEB Plan, the County presents disclosure information for the OPEB Plan as if it were a single-employer plan. The County’s OPEB Plan provides healthcare benefits to eligible County (excluding Central Fire, Housing Authority and Health Authority) employees and their surviving spouses. Central Fire, Housing Authority and Health Authority employees have separate defined benefit postemployment healthcare plans. All County employees hired prior to August 12, 1996, with at least five years of service after attaining age 50 are covered under the County’s OPEB Plan upon retirement. For employees hired after August 12, 1996 and on or before June 18, 2006, the eligibility requirements were increased to a minimum of eight years of service after attaining age 50. For employees hired after June 19, 2006 and mostly on or before September 30, 2013, the eligibility requirements were increased to a minimum of ten years of service after attaining age 50. For a majority of the employees hired beginning in August 2013 (mostly on and after September 30, 2013), the eligibility requirements were increased to a minimum of fifteen (15) years of service and attaining age 50. For all of the above, employees must retire from PERS directly from the County.
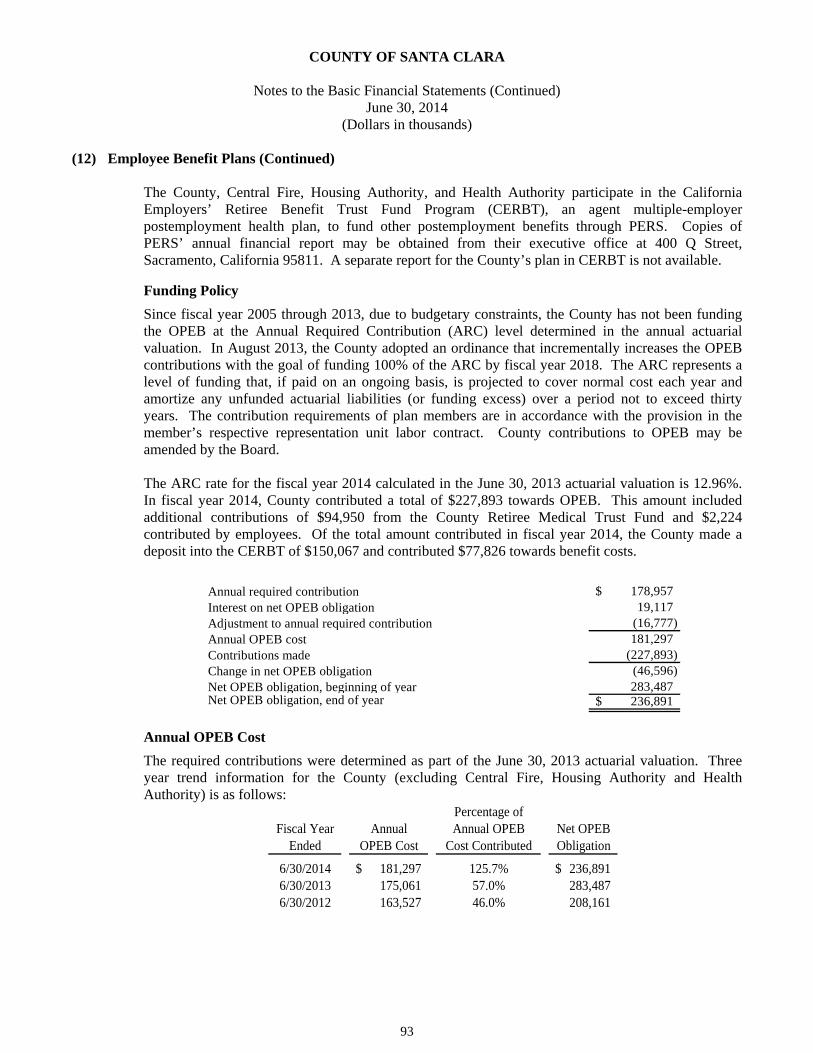
COUNTY OF SANTA CLARA
Notes to the Basic Financial Statements (Continued) June 30, 2014
(Dollars in thousands)
93
(12) Employee Benefit Plans (Continued) The County, Central Fire, Housing Authority, and Health Authority participate in the California Employers’ Retiree Benefit Trust Fund Program (CERBT), an agent multiple-employer postemployment health plan, to fund other postemployment benefits through PERS. Copies of PERS’ annual financial report may be obtained from their executive office at 400 Q Street, Sacramento, California 95811. A separate report for the County’s plan in CERBT is not available.
Funding Policy
Since fiscal year 2005 through 2013, due to budgetary constraints, the County has not been funding the OPEB at the Annual Required Contribution (ARC) level determined in the annual actuarial valuation. In August 2013, the County adopted an ordinance that incrementally increases the OPEB contributions with the goal of funding 100% of the ARC by fiscal year 2018. The ARC represents a level of funding that, if paid on an ongoing basis, is projected to cover normal cost each year and amortize any unfunded actuarial liabilities (or funding excess) over a period not to exceed thirty years. The contribution requirements of plan members are in accordance with the provision in the member’s respective representation unit labor contract. County contributions to OPEB may be amended by the Board. The ARC rate for the fiscal year 2014 calculated in the June 30, 2013 actuarial valuation is 12.96%. In fiscal year 2014, County contributed a total of $227,893 towards OPEB. This amount included additional contributions of $94,950 from the County Retiree Medical Trust Fund and $2,224 contributed by employees. Of the total amount contributed in fiscal year 2014, the County made a deposit into the CERBT of $150,067 and contributed $77,826 towards benefit costs.
Annual required contribution 178,957$ Interest on net OPEB obligation 19,117 Adjustment to annual required contribution (16,777) Annual OPEB cost 181,297 Contributions made (227,893) Change in net OPEB obligation (46,596) Net OPEB obligation, beginning of year 283,487 Net OPEB obligation, end of year 236,891$
Annual OPEB Cost
The required contributions were determined as part of the June 30, 2013 actuarial valuation. Three year trend information for the County (excluding Central Fire, Housing Authority and Health Authority) is as follows:
Percentage ofFiscal Year Annual Annual OPEB Net OPEB
Ended OPEB Cost Cost Contributed Obligation
6/30/2014 181,297$ 125.7% 236,891$ 6/30/2013 175,061 57.0% 283,487 6/30/2012 163,527 46.0% 208,161

COUNTY OF SANTA CLARA
Notes to the Basic Financial Statements (Continued) June 30, 2014
(Dollars in thousands)
94
(12) Employee Benefit Plans (Continued) Actuarial Methods and Assumptions
Actuarial valuations of an ongoing plan involve estimates of the value of reported amounts and assumptions about the probability of occurrence of certain events far into the future. Examples include assumptions about future employment, mortality, and healthcare cost trends. Amounts determined regarding the funded status of the plan and the annual required contributions of the employer are subject to continual revision as actual results are compared with past expectations and new estimates are made about the future. The significant actuarial methods and assumptions used to compute the actuarially determined OPEB annual required contributions and the funded status are as follows:
Description Method/Assumption Method/AssumptionValuation date June 30, 2013 June 30, 2014
Actuarial cost methodEntry age normal; Level percent of salary Entry age normal; Level percent of salary
Amortization method for actuarial accrued liabilities
30 years, open, level percent of payroll 30 years, open, level percent of payroll
Remaining amortization period 30 years as of June 30, 2013 30 years as of June 30, 2014
Actuarial asset valuation method Market value Market value
Investment rate of return 6.74% * 6.45% *
Price inflation 2.75% 2.75%
Wage inflation 3.00% 3.00%
Projected payroll increases Increase of 3.40% to 12.90% depending on age, service and type of employment.
Increase of 3.30% to 16.90% depending on age, service and type of employment.
Healthcare cost trend rate:Medical 8.00% before reflecting additional
PPACA fees of 2% for Kaiser and Valley Health Plan, additional 2.47% for Health Net aplied to 2013-14 plan year premiums to calculate 2014-15 plan year premiums, then 7.5% and graded down by 0.5% per year until 5.0% ultimate rate is reached.
7.00% applied to 2014-2015 plan year premiums to calculate 2015-2016 plan year premiums, then 6.75% and graded down by 0.25% per year until 5.00% ultimate rate is reached.
* Determined as a blended rate of the expected long-term investment returns on plan assets and on the County’s
investments, based on the funded level of the plan at the valuation date. The discount rate used is a blended rate based on the expected return for assets invested with CERBT of 7.28% and 7.36% for valuations at June 30, 2014 and 2013, respectively and the expected return on the County’s investments of 4.50% and 5.30% for valuations at June 30, 2014 and 2013, respectively. The expected return on the County’s investments is 4.69%, which was developed by the County using a weighted average of returns from the County’s commingled pool, historical returns from the Retiree Health Plan and the Treasury Bonds.

COUNTY OF SANTA CLARA
Notes to the Basic Financial Statements (Continued) June 30, 2014
(Dollars in thousands)
95
(12) Employee Benefit Plans (Continued) Funding Status and Funding Progress
Projections of benefits for financial reporting purposes are based on the substantive plan (the plan as understood by the employer and the plan members) and include the types of benefits provided at the time of each valuation and the historical pattern of sharing of benefit costs between the employer and plan members to that point. The actuarial methods and assumptions used for all County’s OPEB plans include techniques that are designed to reduce the effects of short-term volatility in actuarial accrued liabilities and the actuarial value of assets, consistent with the long-term perspective of the calculations.
As of June 30, 2014, the most recent actuarial valuation date, the funded status of the plan was as follows:
Actuarial accrued liability (AAL) 2,430,157$ Actuarial value of plan assets 560,257
Unfunded actuarial accrued liability (UAAL) 1,869,900$
Funded ratio (actuarial value of plan assests/AAL) 23.1%
Covered payroll (active plan members) 1,462,928$
UAAL as a percentage of covered payroll 127.8%
The schedules of funding progress, presented as required supplementary information following the notes to the financial statements, presents multi-year trend information about whether the actuarial value of plan assets is increasing or decreasing over time relative to the actuarial accrued liabilities for benefits.
(g) Postemployment Health Care Benefits – Santa Clara County Central Fire Protection District
Plan Description
The Central Fire maintains a separate OPEB plan from the County. Under this plan, Central Fire provides for lifetime medical coverage to retirees who meet eligibility requirements. Currently, employees who retire directly from the Central Fire, have accrued seven years of service and were hired between January l, 1995 and December 31, 2006, inclusive, or retire directly from the Central Fire, have accrued 10 years of service and were hired after December 31, 2006 are eligible. The Central Fire also provides lifetime medical insurance to retirees and his/her spouse if the retiree retired on or before January l, 1978. The Central Fire will pay for the spouse’s coverage so long as the retiree maintains eligibility. An employee who retires after January 1, 1978 may include his/her dependent on the plan at the retiree's cost.

COUNTY OF SANTA CLARA
Notes to the Basic Financial Statements (Continued) June 30, 2014
(Dollars in thousands)
96
(12) Employee Benefit Plans (Continued) Funding Policy and Annual OPEB Cost
Central Fire began prefunding with the CERBT in 2011/2012. The Central Fire’s annual required contribution for the year 2013-14 is determined based on the June 30, 2013 actuarial valuation. The table below summarizes the position of the Central Fire’s OPEB plan for the fiscal year ended June 30, 2014.
Annual required contribution 6,105$ Interest on beginning net OPEB obligation 2,675 Amortization of net OPEB obligation (2,253) Annual OPEB cost 6,527 Contributions made (4,513) Change in net OPEB obligation 2,014 Net OPEB obligation, beginning of year 38,222 Net OPEB obligation, end of year 40,236$
The following table represents annual OPEB cost for the past three years, the percentage of annual OPEB cost contributed, and net OPEB obligations:
Percentage ofFiscal Year Annual Annual OPEB Net OPEB
Ended OPEB Cost Cost Contributed Obligation
6/30/2014 6,527$ 69% 40,236$ 6/30/2013 6,531 58% 38,2226/30/2012 8,060 95% 34,982
Actuarial Methods and Assumptions
As discussed earlier, projections of benefits for financial reporting purposes are based on the substantive plan (the plan as understood by the employer and the plan members) and include the types of benefits provided at the time of each valuation and the historical pattern of sharing of benefit costs between the employer and plan members to that point. The actuarial methods and assumptions used include techniques that are designed to reduce effects of short-term volatility in actuarial accrued liabilities and the actuarial value of assets, consistent with the long-term perspective of the calculations. The actuarial cost method used in the Central Fire’s June 30, 2013 actuarial valuation was the modified Projected Unit Credit actuarial cost method. The actuarial assumptions included an annual discount rate of a 7.00%. The assumed annual healthcare trend rates for the various benefit types were initially between 5.00% and 8.50%, and each graded down to an ultimate rate of 4.50% by fiscal year 2021/2022. Medical/drug costs were based on combined active and retiree experience for the 36 months ending October 2013 with annual per-capital costs trended to 2014-15, adjusted from paid to incurred and then combining by taking a weighted average. All discount and trend rates included an assumed 3.0% general inflation assumption. The actuarial value of CERBT assets was determined using techniques that spread the effects of short-term volatility in the market value of investments over a five-year period. For Central Fire’s calculation of annual required contribution, the unfunded liability was amortized as a level percentage of projected payroll on a closed basis using an assumed aggregate payroll increase of 3.00% per year. The remaining amortization period at July 1, 2014 was 27 years.

COUNTY OF SANTA CLARA
Notes to the Basic Financial Statements (Continued) June 30, 2014
(Dollars in thousands)
97
(12) Employee Benefit Plans (Continued) Funding Status and Funding Progress
As of June 30, 2013, the most recent actuarial valuation date, the funded status of the plan was as follows:
Actuarial accrued liability (AAL) 84,335$ Actuarial value of plan assets 7,296
Unfunded actuarial accrued liability (UAAL) 77,039$
Funded ratio (actuarial value of plan assets/AAL) 9%Annual covered payroll 37,233$ UAAL as a percentage of annual covered payroll 207%
The schedule of funding progress, presented as required supplementary information following the notes to the financial statements, presents multi-year trend information about whether the actuarial value of plan assets is increasing or decreasing over time relative to the actuarial accrued liabilities for benefits. Details of the Central Fire’s OPEB plan may be found in its financial report for the fiscal year ended June 30, 2014. The report may be obtained by writing to the Santa Clara County Central Fire Protection District at 14700 Winchester Boulevard, Los Gatos, California, 95032.
(h) Postemployment Health Care Benefits – Housing Authority Plan Description
The Housing Authority maintains a separate OPEB plan. The Housing Authority provides eligible employees with post-retirement medical healthcare benefits. Upon retirement, qualified employees and spouses/domestic partners are eligible for continued medical coverage up to the Employer Coverage Cap in effect on the date of the employee's retirement. Medical provider at the time of retirement will be the same medical provider during the final year of employment unless the employee moves from the plan service area. In the event the employee moves out of the plan service area, a supplemental medical plan will be made available at that time. Participation in Part A and Part B of the Medicare plan available at the time of retirement is a requirement of the plan. The surviving spouse or domestic partner may continue to purchase medical coverage after the death of the retiree at the surviving spouse/partner's expense. Funding Policy
The contribution requirements of plan members and the Housing Authority are established and may be amended by the Board. The Housing Authority contributes the amounts necessary to fund the annual required contribution. Annual OPEB Cost and Actuarial Methods and Assumptions
For the year ended June 30, 2014, the Housing Authority’s annual OPEB cost equals to its ARC and based on the Housing Authority’s most recent OPEB actuarial valuation that was performed as of July 1, 2013. In the Housing Authority’s July 1, 2013 actuarial valuation, the entry age normal cost method was used. Under this method, the actuarial present value of the projected health benefits of

COUNTY OF SANTA CLARA
Notes to the Basic Financial Statements (Continued) June 30, 2014
(Dollars in thousands)
98
(12) Employee Benefit Plans (Continued) each individual included in the valuation is allocated as a level percent of expected salary for each year of employment between entry age (age of hire) and assumed exit (maximum retirement age). The actuarial assumptions included a 6.39% investment rate of return and an annual healthcare cost trend rate of 8.5% for 2015, reduced by decrements to an ultimate rate of 5.5% in year 2021 and beyond. The actuarial assumptions also include a 3.25% salary increase. The actuarial value of assets was determined using the market value of the assets. The Housing Authority’s unfunded actuarial accrued liability is being amortized over one year on a closed basis. Three-year trend information for the Housing Authority’s OPEB plan is as follows:
Percentage of DeferredFiscal Year Annual Annual OPEB OPEB
Ended OPEB Cost Cost Contributed Cost
6/30/2014 185$ 232.4% (245)$ 6/30/2013 186 100.0% - 6/30/2012 192 100.0% -
Funding Status and Funding Progress
As of July 1, 2013, the most recent actuarial valuation date, the funded status of the plan was as follows:
Actuarial accrued liability (AAL) 7,634$ Actuarial value of plan assets 6,921
Unfunded actuarial accrued liability (UAAL) 713$
Funded ratio (actuarial value of plan assets/AAL) 90.7%Annual covered payroll 8,970$ UAAL as a percentage of annual covered payroll 7.9%
In July 2014, the Housing Authority paid $713 to CERBT to fund its unfunded actuarial accrued liability. Details of the Housing Authority’s OPEB plan may be found in its financial report for the fiscal year ended June 30, 2013. The report may be obtained by writing to the Housing Authority at 505 W. Julian Street, San Jose, CA 95110.
(i) Postemployment Health Care Benefits – Health Authority Plan Description
The Health Authority also maintains a separate OPEB plan. The Health Authority must contribute the minimum required amount of $5 or the ARC, whichever is lower. Retired employees who retire directly from the health plan are eligible to receive contributions from Santa Clara Family Health Plan toward their monthly Public Employees’ Medical and Hospital Care Act if they meet certain age and service eligibility requirements as outlined in the plan document, and approved by the Board of Directors of the Health Authority. All employees who attain age 50 with a minimum of 5 years of PERS service and employed by the Health Authority at the time of retirement are eligible. Retirees are required to fund 10% of the cost of their monthly premiums.
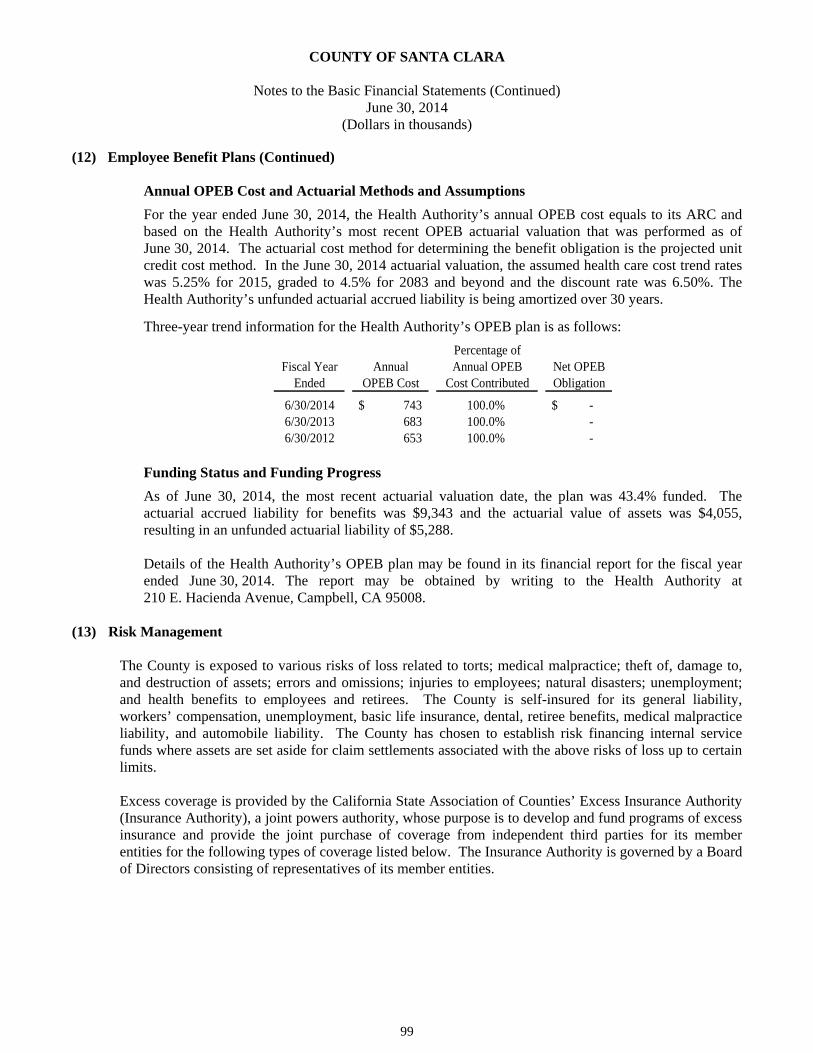
COUNTY OF SANTA CLARA
Notes to the Basic Financial Statements (Continued) June 30, 2014
(Dollars in thousands)
99
(12) Employee Benefit Plans (Continued) Annual OPEB Cost and Actuarial Methods and Assumptions
For the year ended June 30, 2014, the Health Authority’s annual OPEB cost equals to its ARC and based on the Health Authority’s most recent OPEB actuarial valuation that was performed as of June 30, 2014. The actuarial cost method for determining the benefit obligation is the projected unit credit cost method. In the June 30, 2014 actuarial valuation, the assumed health care cost trend rates was 5.25% for 2015, graded to 4.5% for 2083 and beyond and the discount rate was 6.50%. The Health Authority’s unfunded actuarial accrued liability is being amortized over 30 years. Three-year trend information for the Health Authority’s OPEB plan is as follows:
Percentage ofFiscal Year Annual Annual OPEB Net OPEB
Ended OPEB Cost Cost Contributed Obligation
6/30/2014 743$ 100.0% -$ 6/30/2013 683 100.0% - 6/30/2012 653 100.0% -
Funding Status and Funding Progress
As of June 30, 2014, the most recent actuarial valuation date, the plan was 43.4% funded. The actuarial accrued liability for benefits was $9,343 and the actuarial value of assets was $4,055, resulting in an unfunded actuarial liability of $5,288.
Details of the Health Authority’s OPEB plan may be found in its financial report for the fiscal year ended June 30, 2014. The report may be obtained by writing to the Health Authority at 210 E. Hacienda Avenue, Campbell, CA 95008.
(13) Risk Management
The County is exposed to various risks of loss related to torts; medical malpractice; theft of, damage to, and destruction of assets; errors and omissions; injuries to employees; natural disasters; unemployment; and health benefits to employees and retirees. The County is self-insured for its general liability, workers’ compensation, unemployment, basic life insurance, dental, retiree benefits, medical malpractice liability, and automobile liability. The County has chosen to establish risk financing internal service funds where assets are set aside for claim settlements associated with the above risks of loss up to certain limits. Excess coverage is provided by the California State Association of Counties’ Excess Insurance Authority (Insurance Authority), a joint powers authority, whose purpose is to develop and fund programs of excess insurance and provide the joint purchase of coverage from independent third parties for its member entities for the following types of coverage listed below. The Insurance Authority is governed by a Board of Directors consisting of representatives of its member entities.

COUNTY OF SANTA CLARA
Notes to the Basic Financial Statements (Continued) June 30, 2014
(Dollars in thousands)
100
(13) Risk Management (Continued)
Self-insurance and Insurance Authority limits are as follows:
Type of CoverageSelf-Insurance
(per occurrence) Self-Retained (1)
Purchase Insurance Policies
(per occurrence)Automobile Up to $2,000 $0 $33,000General Liability Up to $2,000 $0 $33,000Medical Malpractice Up to $500 $1,500 per occurrence $20,000
$50,000 annual aggregateWorkers' Compensation Up to $4,000 $1,000 per occurrence Statutory
Property Damage Up to $50 (2) $3,000 per occurrence Up to $1,800,000 (3)
(This is deductible) $10,000 annual aggregate
Earthquake 5% of property value Up to $560,000 (4)
$100 minimum deductibleCyber Liability (5) Up to $100 $2,000
$20,000 annual aggregateAirport None $30,000Crime Bond Up to $25 $15,000Pollution Up to $250 $10,000
(1) The self-retained layer is required by the insurance company and acts as an additional amount to pay claims before a loss
is paid by the insurance company. This self-retained layer is contributed by the member entities and remains their assets. Once the self-retained layer is exhausted, the insurance company pays all claims above the County’s self-insurance amount. Any funds left in the self-retained layer can be used to fund self-retained amounts in future years.
(2) Deductible for the Fairgrounds is $5 per occurrence. All properties are insured at full replacement value. (3) Insured values are split between 3 schedules with limits of $600,000 each for a total of $1,800,000. (4) Insured values are split between 3 schedules with limits of $90,000 per tower shared with all other members in towers II,
III and IV, plus a rooftop of $290,000 shared with all member in towers I, II, III, IV and V for a total of $560,000. (5) $50 per claim for each member with total insurable value up to $500 at the time of loss. $100 per claim for each member with total insurable value greater than $500 at the time of loss.
There have been no settlement amounts exceeding commercial or Insurance Authority insurance coverage since self-insurance was introduced in 1978. It is the County’s practice to obtain full actuarial studies annually for the self-insured automobile liability, general liability, medical malpractice, and workers’ compensation liability issues. The unpaid claims liabilities included in the self-insurance internal service funds for these risks are based on the results of actuarial studies and include amounts for claims incurred but not reported and loss adjustment expenses. Claim liabilities are calculated considering the effects of inflation, recent claim settlement trends, including frequency and amount of payouts, and other economic and social factors.

COUNTY OF SANTA CLARA
Notes to the Basic Financial Statements (Continued) June 30, 2014
(Dollars in thousands)
101
(13) Risk Management (Continued)
The County computes its claims liability based on the expected value discounted at 1.0% for General and Automobile Liability claims, 2.0% for Malpractice claims and 2.0% for Workers’ Compensation claims. Changes in the balances of claims liabilities during the past two fiscal years ended June 30 for the County’s self-insurance internal service funds are as follows:
2014 2013Unpaid claims, beginning of year 117,932$ 116,721$ Incurred claims and changes in estimate 74,880 57,550Claim payments (50,943) (56,339)
Unpaid claims, end of year 141,869$ 117,932$
Annual premiums are charged by each self-insurance fund using various allocation methods that include actual costs, trends in claims experience, and number of participants. Premiums paid by the self-insurance internal service funds totaled $13,613 for the fiscal year ended June 30, 2014.
(14) Commitments and Contingencies
(a) Commitments The County has various non-cancelable operating leases as lessees primarily for office space and equipment (accounted for principally in the General Fund). Approximate future minimum operating lease commitments are as follows:
Governmental Business-typeFiscal year ended June 30, Activities Activities Total2015 32,551$ 5,579$ 38,130$ 2016 33,772 5,716 39,488 2017 35,041 5,878 40,919 2018 35,751 6,044 41,795 2019 36,395 6,216 42,611 2020-2024 198,405 33,830 232,235 2025-2029 226,402 38,925 265,327 2030-2034 258,469 44,800 303,269
Total 856,786$ 146,988$ 1,003,774$
Rent expense for fiscal year 2014 was approximately $37,519 and $7,643 for the governmental activities and business-type activities, respectively.

COUNTY OF SANTA CLARA
Notes to the Basic Financial Statements (Continued) June 30, 2014
(Dollars in thousands)
102
(14) Commitments and Contingencies (Continued) The County has entered into operating leases as lessor on various properties with businesses and other governmental agencies (accounted for principally in the General Fund). The future minimum payments to be received are as follows:
Governmental Business-typeFiscal year ending June 30, Activities Activities Total2015 3,838$ 465$ 4,303$ 2016 3,713 98 3,811 2017 3,718 100 3,818 2018 3,677 102 3,779 2019 3,675 104 3,779 2020-2024 19,007 406 19,413 2025-2029 20,399 - 20,399 2030-2034 19,928 - 19,928
Total 77,955$ 1,275$ 79,230$
At June 30, 2014, the leased assets had a net book value of $18,363. Rent income for fiscal year 2014 was approximately $7,903 and $2,773 for the governmental activities and business-type activities, respectively. The County has entered into various service concession arrangements with governmental and nongovernmental entities (operators) to provide services to the public. Rental incomes received from these service concessions arrangements are included in the above table. As part of service concession arrangements, County facilities were conveyed to the operators to provide services related to the primary function of the facility. The operators agreed to operate and maintain the County’s facilities and collect the related fees during the term of the agreements. The operators agreed to pay the County a certain percentage of revenues they collected and/or pay installment payments to the County. Some operators also agreed to construct new facilities or improve existing facilities. The County reported the new facilities or the improvements as capital assets at fair value when it is placed in operations. The County has no contractual obligation related to the facilities or obligations related to the maintenance of a minimum level of the service in connection with the operations of the facilities. In accordance with GASB Statement No. 60, the County recognized the present value of the future installment payments as a receivable, the fair value of newly constructed facilities or improvements as capital assets, and offset the balances with deferred inflows of resources. The capital assets are depreciated using the straight-line method based on the useful lives in accordance with the County’s capital asset policy. Revenues are recognized over the term of the arrangements. At June 30, 2014, the governmental activities reported total deferred inflows of resources for the service concession arrangements of $13,870, of which $7,237 is related to the receivables and $6,633 is related to the capital assets.

COUNTY OF SANTA CLARA
Notes to the Basic Financial Statements (Continued) June 30, 2014
(Dollars in thousands)
103
(14) Commitments and Contingencies (Continued) (b) Litigation
The County accounts for claims in the internal service funds and the General Fund. As of June 30, 2014, the County had accrued amounts which management believes are adequate to provide for claims and litigation, which arose during the normal course of activities. There are other outstanding claims and litigation for which County management believes the ultimate outcome of these claims and litigation will not significantly impact the County’s financial position.
(c) Patient Service Revenue and Receivables The SCVMC grants credit without collateral to its patients, most of who are local residents and are insured under third-party payer agreements. Net patient service revenue is reported at estimated net realizable amounts from patients, third-party payers and others for services rendered and include estimated retroactive revenue adjustments due to future audits, reviews, and investigations. Retroactive adjustments are considered in the recognition of revenue on an estimated basis in the period the related services are rendered, and such amounts are adjusted in future periods as adjustments become known or as years are no longer subject to such audits, reviews, or investigations.
(d) Seismic Safety Building Standards The County is affected by State of California Senate Bill 1953 (SB 1953), which requires certain seismic safety building standards for acute care hospital facilities. SCVMC has reviewed the SB 1953 compliance requirements and developed multiple plans of action to achieve such compliance, the estimated time frame for complying with such requirements, and the cost of performing necessary remediation of certain of the properties. SCVMC estimates the total remediation cost to make its facilities SB 1953-compliant will be approximately $1.4 billion. Costs incurred through June 30, 2014 were $609.5 million. In fiscal year 2007 the County sold its right to a portion of its tobacco settlement revenues. The sale consisted primarily of tobacco settlement revenues due to the County on and after January 1, 2026. The proceeds from the sale, net of issuance cost, in the amount of $100,000 were transferred to the SCVMC and are restricted to meeting the seismic requirements of SB 1953. In fiscal year 2009, after authorization at an election of the County voters on November 4, 2008, the County issued General Obligation Bonds Series 2009 A and 2013 B in May 2009 and March 2013, respectively. The proceeds from the sale in the amount of $350,000 and $490,000 for Series 2009 A and 2013 B, respectively, were transferred to the SCVMC and are restricted to meeting the seismic requirements of SB 1953.

COUNTY OF SANTA CLARA
Notes to the Basic Financial Statements (Continued) June 30, 2014
(Dollars in thousands)
104
(14) Commitments and Contingencies (Continued)
(e) Conduit Debt - Single and Multiple Family Mortgage Revenue Bonds The County, acting as coordinator with certain cities, issued Tax-Exempt Mortgage Revenue Bonds with periodic maturities through May 2040. At June 30, 2014, the outstanding balance of these bonds was $25,325. Single family mortgage revenue bonds were issued to provide funds to purchase mortgage loans secured by first trust deeds on newly constructed and existing residences. The purpose of this program is to provide below market interest rate home mortgages to persons who are unable to qualify for conventional mortgages at market rates. Multiple family mortgage revenue bonds were issued to provide financing to developers of specified multiple family housing projects. These developers agree to rent a percentage of units to qualified families at below market rates. The bonds are not considered obligations of the County and are payable solely from payments made on the related secured mortgage loans.
(f) Conduit Debt - Insured Revenue Bonds On March 16, 2007, the Financing Authority served as the conduit issuer of the 2007 Insured Revenue Bonds Series A ($50,000), Series B ($50,000), and Series C ($50,000) (collectively, “2007 Insured Revenue Bonds”) in order to provide funds for the construction, renovation, and improvement of the El Camino Hospital, a nonprofit public corporation. These bonds were issued to fund a portion of the construction of a new five-level main hospital building and purchasing and installing equipment (El Camino Hospital Project).
On May 15, 2008, the 2007 Insured Revenue Bonds were mandatory tendered at which time Series A ($49,175), Series B ($49,175), and Series C ($49,175) (collectively, “2007 Remarketed Insured Revenue Bonds”) were remarketed as fixed interest rate bonds. The 2007 Remarketed Insured Revenue Bonds bear fixed interest rates ranging from 4.00% to 5.75%, and have a final maturity date of February 1, 2041. At June 30, 2014, the total outstanding balances of these conduit bonds were $131,100.
On March 30, 2009, the Financing Authority served as the conduit issuer of the 2009 Variable Rate Revenue Bonds (2009 Bonds) in the amount of $50,000 in order to provide funds for the El Camino Hospital Project. The 2009 Bonds bear variable interest rate based on Weekly Interest Rate as defined in the bond indenture. The 2009 Bonds have a final maturity date of February 1, 2044. At June 30, 2014, the total outstanding balance for the 2009 Bonds was $50,000. The Financing Authority and the County have no obligation for these bonds as the bonds are secured under the provisions of the Indenture and will be payable solely from payments made by the El Camino Hospital under the Loan Agreements. These bonds are not payable from any revenues or assets of the County. Neither the faith and credit nor the taxing power of the County, the State or any political subdivision thereof are pledged for the payment of the principal or interest on the bonds.
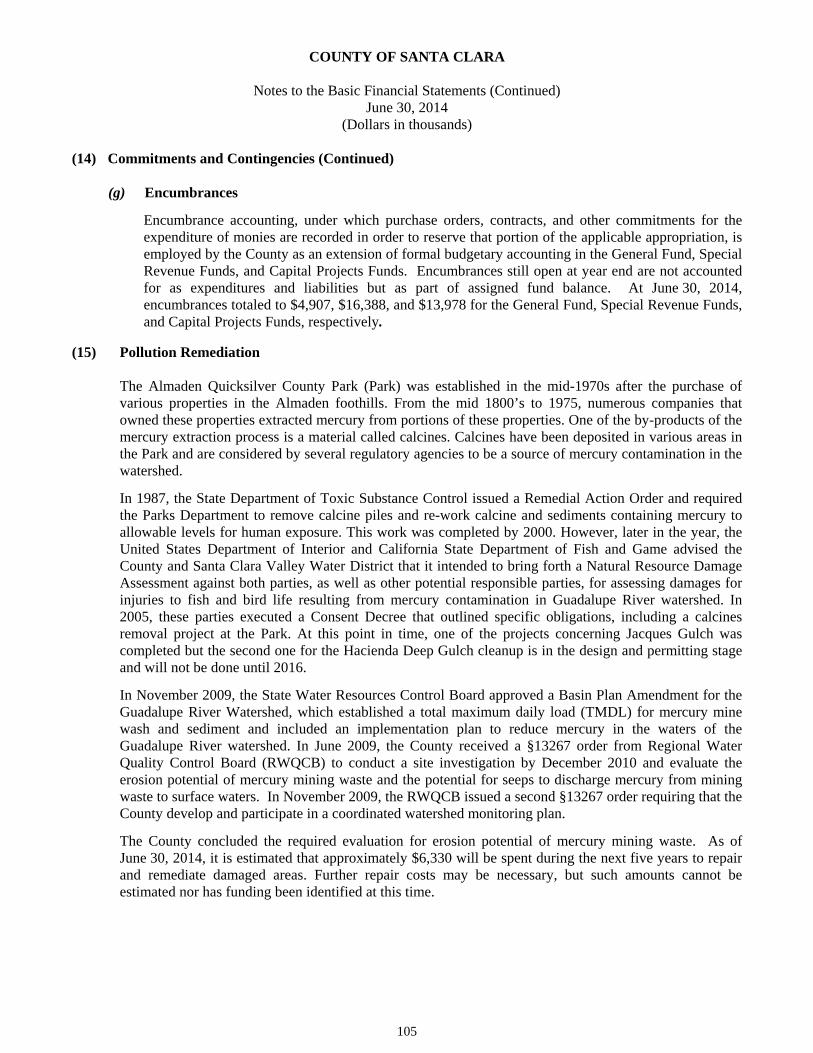
COUNTY OF SANTA CLARA
Notes to the Basic Financial Statements (Continued) June 30, 2014
(Dollars in thousands)
105
(14) Commitments and Contingencies (Continued)
(g) Encumbrances
Encumbrance accounting, under which purchase orders, contracts, and other commitments for the expenditure of monies are recorded in order to reserve that portion of the applicable appropriation, is employed by the County as an extension of formal budgetary accounting in the General Fund, Special Revenue Funds, and Capital Projects Funds. Encumbrances still open at year end are not accounted for as expenditures and liabilities but as part of assigned fund balance. At June 30, 2014, encumbrances totaled to $4,907, $16,388, and $13,978 for the General Fund, Special Revenue Funds, and Capital Projects Funds, respectively.
(15) Pollution Remediation
The Almaden Quicksilver County Park (Park) was established in the mid-1970s after the purchase of various properties in the Almaden foothills. From the mid 1800’s to 1975, numerous companies that owned these properties extracted mercury from portions of these properties. One of the by-products of the mercury extraction process is a material called calcines. Calcines have been deposited in various areas in the Park and are considered by several regulatory agencies to be a source of mercury contamination in the watershed.
In 1987, the State Department of Toxic Substance Control issued a Remedial Action Order and required the Parks Department to remove calcine piles and re-work calcine and sediments containing mercury to allowable levels for human exposure. This work was completed by 2000. However, later in the year, the United States Department of Interior and California State Department of Fish and Game advised the County and Santa Clara Valley Water District that it intended to bring forth a Natural Resource Damage Assessment against both parties, as well as other potential responsible parties, for assessing damages for injuries to fish and bird life resulting from mercury contamination in Guadalupe River watershed. In 2005, these parties executed a Consent Decree that outlined specific obligations, including a calcines removal project at the Park. At this point in time, one of the projects concerning Jacques Gulch was completed but the second one for the Hacienda Deep Gulch cleanup is in the design and permitting stage and will not be done until 2016.
In November 2009, the State Water Resources Control Board approved a Basin Plan Amendment for the Guadalupe River Watershed, which established a total maximum daily load (TMDL) for mercury mine wash and sediment and included an implementation plan to reduce mercury in the waters of the Guadalupe River watershed. In June 2009, the County received a §13267 order from Regional Water Quality Control Board (RWQCB) to conduct a site investigation by December 2010 and evaluate the erosion potential of mercury mining waste and the potential for seeps to discharge mercury from mining waste to surface waters. In November 2009, the RWQCB issued a second §13267 order requiring that the County develop and participate in a coordinated watershed monitoring plan.
The County concluded the required evaluation for erosion potential of mercury mining waste. As of June 30, 2014, it is estimated that approximately $6,330 will be spent during the next five years to repair and remediate damaged areas. Further repair costs may be necessary, but such amounts cannot be estimated nor has funding been identified at this time.
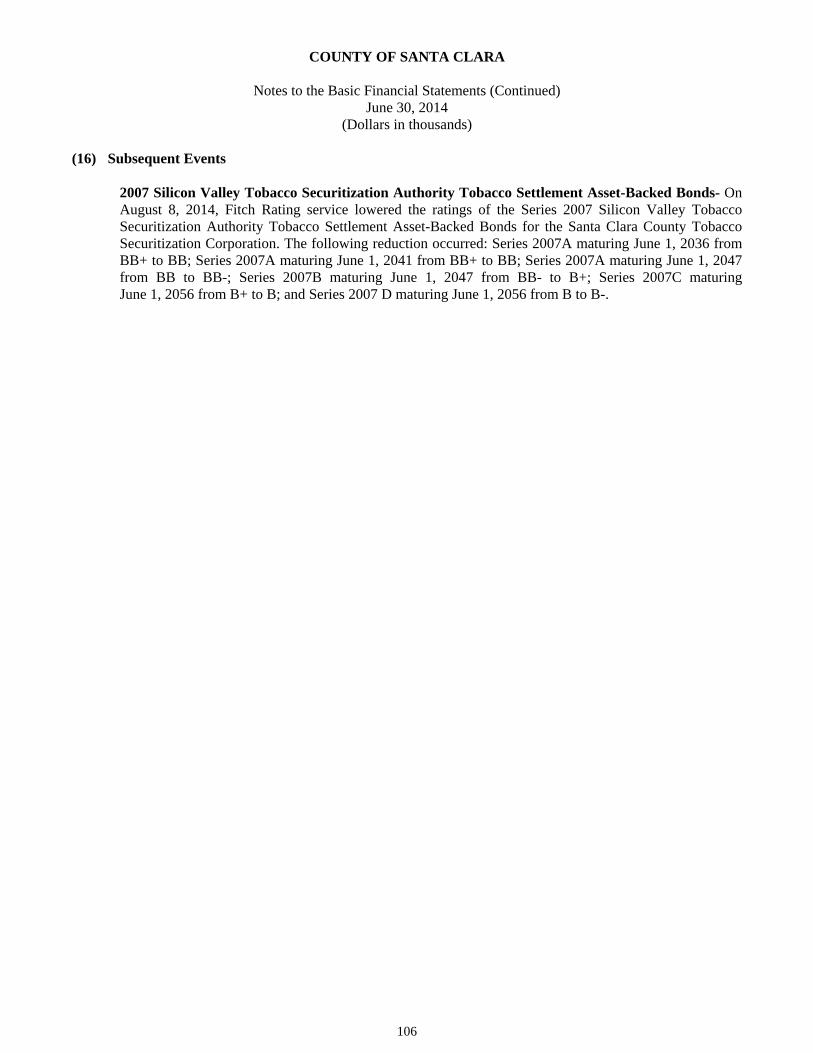
COUNTY OF SANTA CLARA
Notes to the Basic Financial Statements (Continued) June 30, 2014
(Dollars in thousands)
106
(16) Subsequent Events 2007 Silicon Valley Tobacco Securitization Authority Tobacco Settlement Asset-Backed Bonds- On August 8, 2014, Fitch Rating service lowered the ratings of the Series 2007 Silicon Valley Tobacco Securitization Authority Tobacco Settlement Asset-Backed Bonds for the Santa Clara County Tobacco Securitization Corporation. The following reduction occurred: Series 2007A maturing June 1, 2036 from BB+ to BB; Series 2007A maturing June 1, 2041 from BB+ to BB; Series 2007A maturing June 1, 2047 from BB to BB-; Series 2007B maturing June 1, 2047 from BB- to B+; Series 2007C maturing June 1, 2056 from B+ to B; and Series 2007 D maturing June 1, 2056 from B to B-.

Required Supplementary Information

This page intentionally left blank.

COUNTY OF SANTA CLARA
Required Supplementary Information (Unaudited) Schedules of Funding Progress
June 30, 2014 (Dollars in thousands)
107
PERS Defined Benefit Pension - County Miscellaneous Plan:
Unfunded UAALActuarial Actuarial as
Actuarial Actuarial Accrued Accrued PercentageValuation Asset Liability- Liability Funded Covered of Covered
Date Value Entry Age (UAAL) Ratio Payroll Payroll6/30/2013 5,670,790$ 7,728,971$ 2,058,181$ 73.4% 1,158,126$ 177.7%6/30/2012 6,069,267 7,336,967 1,267,700 82.7% 1,143,618 110.9%6/30/2011 5,741,951 6,930,682 1,188,731 82.8% 1,152,298 103.2%
PERS Defined Benefit Pension - County Safety Plan:
Unfunded UAALActuarial Actuarial as
Actuarial Actuarial Accrued Accrued PercentageValuation Asset Liability- Liability Funded Covered of Covered
Date Value Entry Age (UAAL) Ratio Payroll Payroll6/30/2013 1,572,741$ 2,168,188$ 595,447$ 72.5% 177,663$ 335.2%6/30/2012 1,700,830 2,068,173 367,343 82.2% 182,063 201.8%6/30/2011 1,635,628 1,991,108 355,480 82.1% 197,330 180.1%
PERS Defined Benefit Pension - Central Fire Safety Plan:
Unfunded UAALActuarial Actuarial as
Actuarial Actuarial Accrued Accrued PercentageValuation Asset Liability- Liability Funded Covered of Covered
Date Value Entry Age (UAAL) Ratio Payroll Payroll6/30/2012 344,225$ 426,250$ 82,025$ 80.8% 31,058$ 264.1%6/30/2011 330,808 412,761 81,953 80.1% 31,515 260.0%6/30/2010 314,505 393,045 78,540 80.0% 32,467 241.9%
PERS Defined Benefit Pension - Housing Authority:
Unfunded UAALActuarial as
Actuarial Actuarial Actuarial Accrued PercentageValuation Asset Accrued Liability Funded Covered of Covered
Date Value Liability (UAAL) Ratio Payroll Payroll6/30/2012 40,772$ 40,858$ 86$ 99.8% 10,911$ 0.8%6/30/2011 37,178 38,573 1,395 96.4% 11,740 11.9%6/30/2010 31,452 35,087 3,635 89.6% 13,363 27.2%
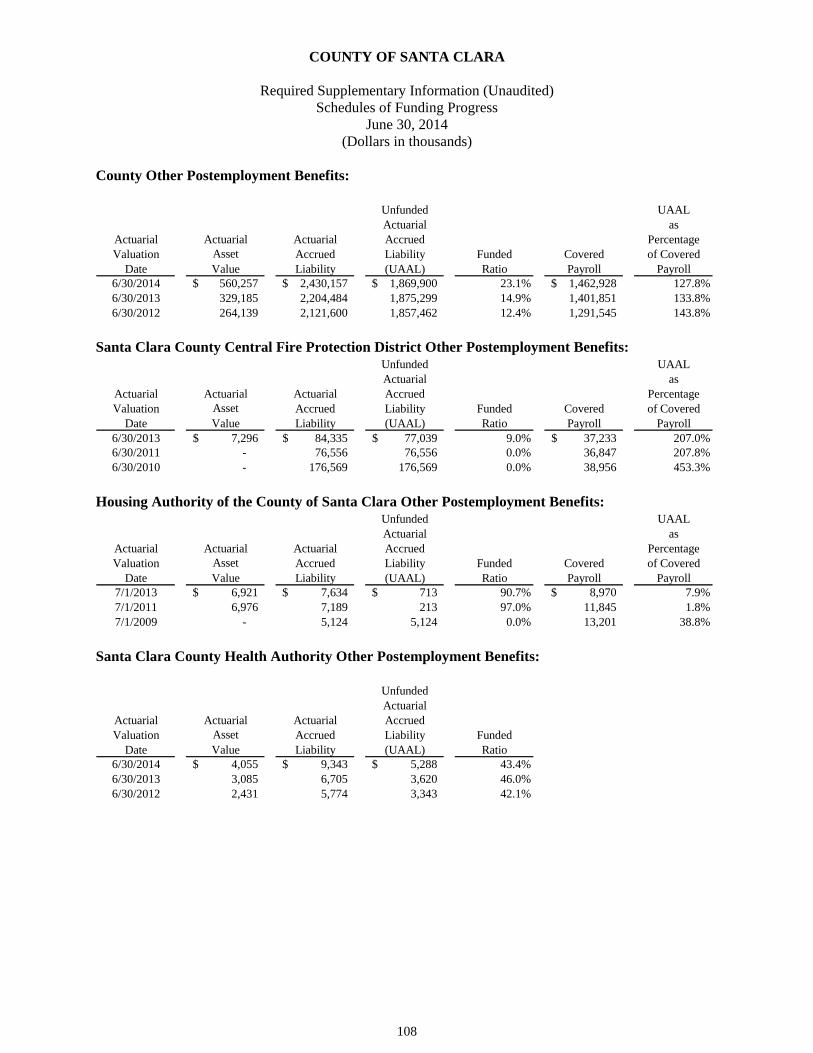
COUNTY OF SANTA CLARA
Required Supplementary Information (Unaudited) Schedules of Funding Progress
June 30, 2014 (Dollars in thousands)
108
County Other Postemployment Benefits:
Unfunded UAALActuarial as
Actuarial Actuarial Actuarial Accrued PercentageValuation Asset Accrued Liability Funded Covered of Covered
Date Value Liability (UAAL) Ratio Payroll Payroll6/30/2014 560,257$ 2,430,157$ 1,869,900$ 23.1% 1,462,928$ 127.8%6/30/2013 329,185 2,204,484 1,875,299 14.9% 1,401,851 133.8%6/30/2012 264,139 2,121,600 1,857,462 12.4% 1,291,545 143.8%
Santa Clara County Central Fire Protection District Other Postemployment Benefits:
Unfunded UAALActuarial as
Actuarial Actuarial Actuarial Accrued PercentageValuation Asset Accrued Liability Funded Covered of Covered
Date Value Liability (UAAL) Ratio Payroll Payroll6/30/2013 7,296$ 84,335$ 77,039$ 9.0% 37,233$ 207.0%6/30/2011 - 76,556 76,556 0.0% 36,847 207.8%6/30/2010 - 176,569 176,569 0.0% 38,956 453.3%
Housing Authority of the County of Santa Clara Other Postemployment Benefits:
Unfunded UAALActuarial as
Actuarial Actuarial Actuarial Accrued PercentageValuation Asset Accrued Liability Funded Covered of Covered
Date Value Liability (UAAL) Ratio Payroll Payroll7/1/2013 6,921$ 7,634$ 713$ 90.7% 8,970$ 7.9%7/1/2011 6,976 7,189 213 97.0% 11,845 1.8%7/1/2009 - 5,124 5,124 0.0% 13,201 38.8%
Santa Clara County Health Authority Other Postemployment Benefits:
UnfundedActuarial
Actuarial Actuarial Actuarial AccruedValuation Asset Accrued Liability Funded
Date Value Liability (UAAL) Ratio6/30/2014 4,055$ 9,343$ 5,288$ 43.4%6/30/2013 3,085 6,705 3,620 46.0%6/30/2012 2,431 5,774 3,343 42.1%

COUNTY OF SANTA CLARA
109
General Fund The General Fund is the general operating fund of the County. It accounts for all financial activities except those required to be accounted for in another fund. The accompanying Budgetary Comparison Schedule represents the primary expense classification of services provided by the County through the General Fund.
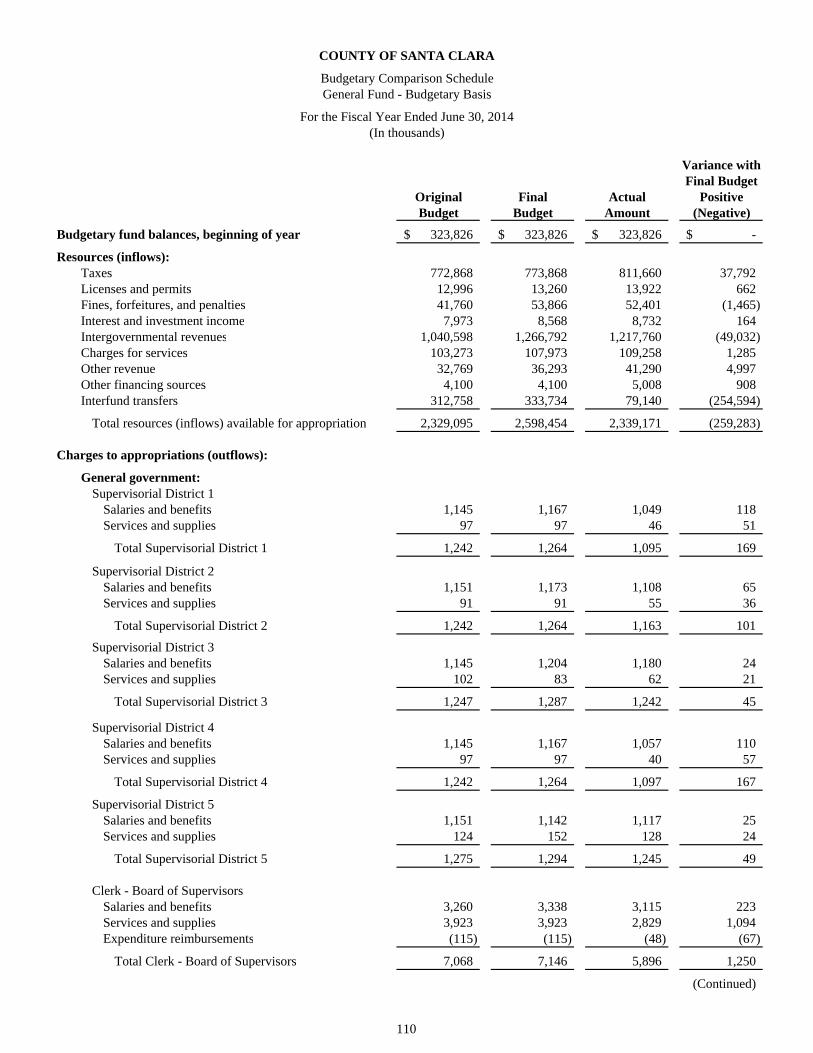
Variance withFinal Budget
Original Final Actual PositiveBudget Budget Amount (Negative)
Budgetary fund balances, beginning of year 323,826$ 323,826$ 323,826$ -$
Resources (inflows):Taxes 772,868 773,868 811,660 37,792 Licenses and permits 12,996 13,260 13,922 662 Fines, forfeitures, and penalties 41,760 53,866 52,401 (1,465) Interest and investment income 7,973 8,568 8,732 164 Intergovernmental revenues 1,040,598 1,266,792 1,217,760 (49,032) Charges for services 103,273 107,973 109,258 1,285 Other revenue 32,769 36,293 41,290 4,997 Other financing sources 4,100 4,100 5,008 908 Interfund transfers 312,758 333,734 79,140 (254,594)
Total resources (inflows) available for appropriation 2,329,095 2,598,454 2,339,171 (259,283)
Charges to appropriations (outflows):
General government:Supervisorial District 1
Salaries and benefits 1,145 1,167 1,049 118 Services and supplies 97 97 46 51
Total Supervisorial District 1 1,242 1,264 1,095 169
Supervisorial District 2Salaries and benefits 1,151 1,173 1,108 65 Services and supplies 91 91 55 36
Total Supervisorial District 2 1,242 1,264 1,163 101
Supervisorial District 3Salaries and benefits 1,145 1,204 1,180 24 Services and supplies 102 83 62 21
Total Supervisorial District 3 1,247 1,287 1,242 45
Supervisorial District 4Salaries and benefits 1,145 1,167 1,057 110 Services and supplies 97 97 40 57
Total Supervisorial District 4 1,242 1,264 1,097 167
Supervisorial District 5Salaries and benefits 1,151 1,142 1,117 25 Services and supplies 124 152 128 24
Total Supervisorial District 5 1,275 1,294 1,245 49
Clerk - Board of SupervisorsSalaries and benefits 3,260 3,338 3,115 223 Services and supplies 3,923 3,923 2,829 1,094 Expenditure reimbursements (115) (115) (48) (67)
Total Clerk - Board of Supervisors 7,068 7,146 5,896 1,250
(Continued)
(In thousands)
COUNTY OF SANTA CLARA
Budgetary Comparison ScheduleGeneral Fund - Budgetary Basis
For the Fiscal Year Ended June 30, 2014
110

Variance withFinal Budget
Original Final Actual PositiveBudget Budget Amount (Negative)
General government (continued):Office of the County Executive
Salaries and benefits 13,137$ 13,508$ 13,289$ 219$ Services and supplies 19,279 25,905 17,104 8,801 Expenditure reimbursements (662) (699) (508) (191)
Total Office of the County Executive 31,754 38,714 29,885 8,829
Controller-TreasurerSalaries and benefits 11,564 11,814 10,984 830 Services and supplies 9,610 11,321 9,437 1,884 Expenditure reimbursements (35,741) (35,711) (35,112) (599) Interfund transfers - 1,793 1,793 -
Total Controller-Treasurer (14,567) (10,783) (12,898) 2,115
Tax CollectorSalaries and benefits 6,551 6,997 6,887 110 Services and supplies 17,412 18,410 17,178 1,232
Total Tax Collector 23,963 25,407 24,065 1,342
Office of the AssessorSalaries and benefits 29,761 30,472 29,317 1,155 Services and supplies 3,505 1,759 231 1,528 Interfund transfers - 2,250 - 2,250
Total Office of the Assessor 33,266 34,481 29,548 4,933
PurchasingSalaries and benefits 4,380 4,472 4,203 269 Services and supplies 572 722 491 231 Expenditure reimbursements (558) (558) (558) -
Total Purchasing 4,394 4,636 4,136 500
Office of Budget and Analysis - Special ProgramsServices and supplies 4,757 5,757 3,407 2,350 Interfund transfers 172,814 196,758 187,186 9,572
Total Office of Budget and Analysis - Special Programs 177,571 202,515 190,593 11,922
Office of the County CounselSalaries and benefits 24,842 24,761 24,761 - Services and supplies 6,667 8,659 8,608 51 Expenditure reimbursements (18,465) (18,470) (17,979) (491)
Total Office of the County Counsel 13,044 14,950 15,390 (440)
(Continued)
(In thousands)
COUNTY OF SANTA CLARA
Budgetary Comparison ScheduleGeneral Fund - Budgetary Basis
For the Fiscal Year Ended June 30, 2014
111

Variance withFinal Budget
Original Final Actual PositiveBudget Budget Amount (Negative)
General government (continued):
PersonnelSalaries and benefits 17,816$ 18,136$ 18,025$ 111$ Services and supplies 6,802 6,866 5,168 1,698 Capital outlay - 11 8 3 Expenditure reimbursements (8,547) (8,547) (8,057) (490)
Total Personnel 16,071 16,466 15,144 1,322
Registrar of VotersSalaries and benefits 7,593 7,705 7,556 149 Services and supplies 6,993 6,993 6,172 821 Capital outlay 326 326 225 101
Total Registrar of Voters 14,912 15,024 13,953 1,071
Information ServicesSalaries and benefits 2,640 1,840 578 1,262 Services and supplies 45,259 44,301 28,700 15,601 Capital outlay 150 1,173 759 414 Expenditure reimbursements (1,491) (1,491) (1,405) (86) Interfund transfers - 520 521 (1)
Total Information Services 46,558 46,343 29,153 17,190
Department of RevenueSalaries and benefits 8,290 8,526 8,169 357 Services and supplies 1,906 1,869 1,367 502 Capital outlay - 37 37 -
Total Department of Revenue 10,196 10,432 9,573 859
CommunicationSalaries and benefits 14,316 14,517 13,879 638 Services and supplies 13,427 14,854 11,988 2,866 Expenditure reimbursements (10,468) (10,696) (9,162) (1,534)
Total Communication 17,275 18,675 16,705 1,970
Department of Planning & DevelopmentSalaries and benefits 11,166 11,409 10,878 531 Services and supplies 3,261 3,247 2,817 430 Capital outlay - 6 6 - Expenditure reimbursements (401) (401) (502) 101 Interfund transfers - 200 200 -
Total Department of Planning & Development 14,026 14,461 13,399 1,062 (Continued)
(In thousands)
COUNTY OF SANTA CLARA
Budgetary Comparison ScheduleGeneral Fund - Budgetary Basis
For the Fiscal Year Ended June 30, 2014
112

Variance withFinal Budget
Original Final Actual PositiveBudget Budget Amount (Negative)
General government (continued):Facilities and Fleet Department
Salaries and benefits 26,153$ 26,616$ 24,466$ 2,150$ Services and supplies 68,799 68,746 64,945 3,801 Expenditure reimbursements (50,047) (47,110) (45,661) (1,449) Interfund transfers 31,360 32,697 30,604 2,093
Total Facilities and Fleet Department 76,265 80,949 74,354 6,595
General government - subtotals:Salaries and benefits 187,206 189,964 181,618 8,346 Services and supplies 212,683 223,852 180,773 43,079 Capital outlay 476 1,553 1,035 518 Expenditure reimbursements (126,495) (123,798) (118,992) (4,806) Interfund transfers 204,174 234,218 220,304 13,914
Total general government 478,044 525,789 464,738 61,051
Public protection:
Clerk RecorderSalaries and benefits 5,401 5,482 5,403 79 Services and supplies 747 794 753 41
Total Clerk Recorder 6,148 6,276 6,156 120
District AttorneySalaries and benefits 87,364 90,024 88,841 1,183 Services and supplies 15,574 20,028 19,875 153 Capital outlay 308 422 291 131 Expenditure reimbursements (5,845) (9,417) (8,605) (812)
Total District Attorney 97,401 101,057 100,402 655
Public DefenderSalaries and benefits 45,758 47,070 46,104 966 Services and supplies 4,961 7,211 6,275 936 Capital outlay 2,500 27 22 5 Expenditure reimbursements (425) (257) (257) -
Total Public Defender 52,794 54,051 52,144 1,907
Pretrial ServicesSalaries and benefits 4,869 4,968 4,820 148 Services and supplies 951 951 597 354 Expenditure reimbursements (277) (277) (262) (15)
Total Pretrial Services 5,543 5,642 5,155 487
Criminal Justice SupportServices and supplies 46,938 44,876 43,545 1,331
Total Criminal Justice Support 46,938 44,876 43,545 1,331 (Continued)
(In thousands)
COUNTY OF SANTA CLARA
Budgetary Comparison ScheduleGeneral Fund - Budgetary Basis
For the Fiscal Year Ended June 30, 2014
113

Variance withFinal Budget
Original Final Actual PositiveBudget Budget Amount (Negative)
Public protection (continued):
Sheriff AdministrationSalaries and benefits 117,009$ 117,175$ 109,059$ 8,116$ Services and supplies 19,450 21,237 19,775 1,462 Capital outlay - 336 88 248 Expenditure reimbursements (8,270) (8,984) (6,280) (2,704)
Total Sheriff Administration 128,189 129,764 122,642 7,122
Sheriff - Department of Correction ServicesSalaries and benefits 116,189 118,361 118,220 141 Services and supplies 397 - - -
Total Sheriff - Department of Correction Services 116,586 118,361 118,220 141
Department of CorrectionSalaries and benefits 29,369 29,984 29,706 278 Services and supplies 47,417 47,803 47,448 355 Capital outlay 235 290 288 2 Expenditure reimbursements (184) (184) (173) (11)
Total Department of Correction 76,837 77,893 77,269 624
Probation DepartmentSalaries and benefits 119,913 123,602 122,378 1,224 Services and supplies 26,115 26,521 16,697 9,824 Capital outlay - 44 73 (29) Expenditure reimbursements (405) (371) (457) 86
Total Probation Department 145,623 149,796 138,691 11,105
Department of Agriculture/Weights & Measures/Animal Control
Salaries and benefits 6,688 6,812 6,727 85 Services and supplies 2,213 2,409 2,095 314 Capital outlay 26 39 36 3 Interfund transfers 185 495 495 - Expenditure reimbursements (1,311) (1,311) (1,223) (88)
Total Department of Agriculture/Weights & Measures/Animal Control 7,801 8,444 8,130 314
Medical Examiner - CoronerSalaries and benefits 3,164 3,239 3,174 65 Services and supplies 675 675 658 17
Total Medical Examiner - Coroner 3,839 3,914 3,832 82
Public protection - subtotals:Salaries and benefits 535,724 546,717 534,432 12,285 Services and supplies 165,041 172,505 157,718 14,787 Capital outlay 3,466 1,158 798 360 Interfund transfers 185 495 495 - Expenditure reimbursements (16,717) (20,801) (17,257) (3,544)
Total public protection 687,699 700,074 676,186 23,888 (Continued)
(In thousands)
COUNTY OF SANTA CLARA
Budgetary Comparison ScheduleGeneral Fund - Budgetary Basis
For the Fiscal Year Ended June 30, 2014
114

Variance withFinal Budget
Original Final Actual PositiveBudget Budget Amount (Negative)
Public ways and facilities:
Measure BServices and supplies 3,426$ 5,364$ 5,329$ 35$ Interfund transfers 1,016 1,016 385 631
Total Measure B 4,442 6,380 5,714 666 Health and sanitation:
Health Services AdministrationSalaries and benefits 55,280 55,416 54,017 1,399 Services and supplies 37,547 36,140 29,345 6,795 Capital outlay 6 96 32 64 Expenditure reimbursements (2,346) (2,895) (3,168) 273
Total Health Services Administration 90,487 88,757 80,226 8,531
Mental Health BureauSalaries and benefits 49,612 50,722 46,098 4,624 Services and supplies 276,514 290,355 262,402 27,953 Interfund transfers 2,500 - - - Expenditure reimbursements (3,615) (5,362) (4,090) (1,272)
Total Mental Health Bureau 325,011 335,715 304,410 31,305
Custody Health ServicesSalaries and benefits 36,792 35,121 34,245 876 Services and supplies 14,068 16,081 14,840 1,241 Capital outlay 637 637 56 581 Expenditure reimbursements (46,124) (46,124) (44,302) (1,822)
Total Custody Health Services 5,373 5,715 4,839 876
Bureau of Alcohol & Drug ProgramsSalaries and benefits 19,300 19,884 18,280 1,604 Services and supplies 29,231 30,693 27,981 2,712 Capital outlay 19 39 37 2 Expenditure reimbursements (1,299) (2,078) (1,608) (470)
Total Bureau of Alcohol & Drug Programs 47,251 48,538 44,690 3,848
Community Outreach ProgramSalaries and benefits 9,367 9,712 9,296 416 Services and supplies 6,373 6,771 5,778 993 Expenditure reimbursements (2,013) (2,180) (1,061) (1,119)
Total Community Outreach Program 13,727 14,303 14,013 290
(Continued)
(In thousands)
COUNTY OF SANTA CLARA
Budgetary Comparison ScheduleGeneral Fund - Budgetary Basis
For the Fiscal Year Ended June 30, 2014
115

Variance withFinal Budget
Original Final Actual PositiveBudget Budget Amount (Negative)
Health and sanitation (continued):
Healthy ChildrenServices and supplies 4,500$ 4,500$ 3,606$ 894$ Capital outlay - 3,000 - 3,000
Total Healthy Children 4,500 7,500 3,606 3,894
Health and sanitation - subtotals:Salaries and benefits 170,351 170,855 161,936 8,919 Services and supplies 368,233 384,540 343,952 40,588 Capital outlay 662 3,772 125 3,647 Interfund transfers 2,500 - - - Expenditure reimbursements (55,397) (58,639) (54,229) (4,410)
Total health and sanitation 486,349 500,528 451,784 48,744
Public assistance:In-House Support Services
Services and supplies 104,117 117,114 116,902 212
Total In-House Support Services 104,117 117,114 116,902 212
Office of Affordable HousingSalaries and benefits 849 867 802 65 Services and supplies 148 2,482 267 2,215 Expenditure reimbursements (982) (982) (922) (60)
Total Office of Affordable Housing 15 2,367 147 2,220
Social Services AdministrationSalaries and benefits 273,772 293,948 277,826 16,122 Services and supplies 120,742 130,029 114,385 15,644 Capital outlay - 610 602 8 Interfund transfers - 4,255 4,255 - Expenditure reimbursements (604) (692) (1,803) 1,111
Total Social Services Administration 393,910 428,150 395,265 32,885
Nutrition Services to the AgedSalaries and benefits 1,049 1,071 1,045 26 Services and supplies 6,123 6,216 6,078 138
Total Nutrition Services to the Aged 7,172 7,287 7,123 164
Categorical Aids PaymentsServices and supplies 194,469 193,833 160,303 33,530
Total Categorical Aids Payments 194,469 193,833 160,303 33,530
Public assistance - subtotals:Salaries and benefits 275,670 295,886 279,673 16,213 Services and supplies 425,599 449,674 397,935 51,739 Capital outlay - 610 602 8 Interfund transfers - 4,255 4,255 - Expenditure reimbursements (1,586) (1,674) (2,725) 1,051
Total public assistance 699,683 748,751 679,740 69,011
(Continued)
(In thousands)
COUNTY OF SANTA CLARA
Budgetary Comparison ScheduleGeneral Fund - Budgetary Basis
For the Fiscal Year Ended June 30, 2014
116

Variance withFinal Budget
Original Final Actual PositiveBudget Budget Amount (Negative)
Debt service:County debt service
Principal retirement 10,991$ 10,369$ 10,056$ 313$ Interest and fiscal charges 13,973 14,973 12,487 2,486 Interfund transfers 1,173 2,073 2,240 (167)
Total debt service 26,137 27,415 24,783 2,632
Reserves:
OMB Special ProgramsGeneral government 63,229 18,175 - 18,175
Total OMB Special Programs 63,229 18,175 - 18,175
Criminal Justice SupportPublic protection 7,527 4,589 - 4,589
Total Criminal Justice Support 7,527 4,589 - 4,589
Social Services AdministrationPublic assistance 2,197 2,364 - 2,364
Total Social Services Administration 2,197 2,364 - 2,364
Nutrition Services to the AgedPublic assistance 90 337 - 337
Total Nutrition Services to the Aged 90 337 - 337
Appropriation ContingenciesTotal Appropriation Contingencies 106,583 106,784 - 106,784
Total reserves 179,626 132,249 - 132,249
Total charges to appropriations 2,561,980 2,641,186 2,302,945 338,241
Budgetary fund balances, end of year 90,941$ 281,094$ 360,052$ 78,958$
(Continued)
(In thousands)
COUNTY OF SANTA CLARA
Budgetary Comparison ScheduleGeneral Fund - Budgetary Basis
For the Fiscal Year Ended June 30, 2014
117

Explanation of Differences between Budgetary Inflows and Outflows and GAAP Revenues and Expenditures: Sources/inflows of resources
Actual amounts (budgetary basis) "total resources" from the budgetary comparison schedule 2,339,171$
Differences - budget to GAAP:Proceeds from sale of capital assets are inflows of budgetary resources
but are not revenues for financial reporting purposes (5,008)
Transfers from other funds are inflows of budgetary resources but are not revenues for financial reporting purposes (79,140)
Total revenues as reported on the statement of revenues, expenditures andchanges in fund balances - general fund 2,255,023$
Uses/outflows of resourcesActual amounts (budgetary basis) "total charges to appropriations"
from the budgetary comparison schedule 2,302,945$
Differences - budget to GAAP:Encumbrances for services and supplies ordered but not received is reported
in the year the order is placed for budgetary purposes, but in the year servicesare incurred or goods received for financial reporting purposes (4,907)
Transfers to other funds are outflows of budgetary resources but are not expendituresfor financial reporting purposes (227,679)
Total expenditures as reported on the statement of revenues, expenditures andchanges in fund balances - general fund 2,070,359$
The notes to the required supplementary information are an integral part of this statement.
(In thousands)
COUNTY OF SANTA CLARA
Budgetary Comparison ScheduleGeneral Fund - Budgetary Basis
For the Fiscal Year Ended June 30, 2014
118

COUNTY OF SANTA CLARA
Notes to Required Supplementary Information June 30, 2014
(Dollars in thousands)
119
Budgets and Budgetary Accounting
The County is a charter county and, under the general laws of the State, adopts final annual operating budgets before September 1 for all governmental funds. From the effective date of the budgets, which are adopted by the Board after public hearings, the proposed expenditures become appropriations to the various County departments. Only the Board has the authority to approve new appropriations. The County Executive has a limited authority to approve appropriation transfers of $100 between the objects within a budget unit. The Board must approve transfers among budget units and may amend the budget during the fiscal year. Unencumbered and unexpended appropriations lapse at fiscal year-end. During the year, the Board approved various supplemental appropriations.
The County also adopts budgets annually for capital projects funds. Such budgets are based on a project time frame, rather than a fiscal year, and unused appropriations are re-appropriated from year to year until project completion.
Budgeted revenues and expenditures in the budgetary comparison schedule represent the original budget and the final budget modified by authorized adjustments during the year. Final budgeted expenditure amounts represent original appropriations adjusted for supplemental appropriations during the year that were contingent upon new or additional revenue sources and re-appropriated amounts for prior year encumbrances. Expenditures may not legally exceed budgeted appropriations at the budget unit level within each department. Interdepartmental expenditure reimbursements do not have the budgetary status of legal appropriations. Therefore, variances between estimated and actual reimbursements are not disclosed in the notes to the basic financial statements but are displayed in the supplemental section of the Comprehensive Annual Financial Report.
Encumbrance accounting, under which purchase orders, contracts, and other commitments for the expenditure of monies are recorded in order to reserve that portion of the applicable appropriation, is employed as an extension of formal budgetary accounting in the General Fund, special revenue funds, and capital projects funds.
Budgetary Results of Operations Reconciled to Results of Operations in Accordance with GAAP
The County’s budget is based upon accounting for certain transactions on a budget basis rather than accounting principles generally accepted in the United States of America (GAAP) basis. The results of operations on a budget basis for the general, special revenue, debt service, and capital projects funds differ from operations on a GAAP basis due to the proceeds from sales of capital assets, interfund transfers, and the inclusion of year-end encumbrances with expenditures on a budget basis. Accordingly, the results of operations presented in the accompanying budgetary comparison schedule reflect adjustments for proceeds from sales of capital assets, interfund transfers, other financing sources and encumbrances in order to provide a meaningful comparison with the adopted County budget.

120
This page intentionally left blank.

Discrete Component Units

This page intentionally left blank.

COUNTY OF SANTA CLARA
121
Discrete Component Units Housing Authority – accounts for the activity of the Housing Authority of the County of Santa Clara. Most of the housing programs administered by the Housing Authority are funded by contributions from the U.S. Department of Housing and Urban Development. FIRST 5 Santa Clara County – accounts for the receipts of Proposition 10 (additional excise tax imposed on tobacco products) revenues that are used for promoting, supporting, and improving the early development of children from the prenatal stage to five years of age. Health Authority – accounts for the activity of the Santa Clara County Health Authority. The Health Authority accounts for its community-based health plan, the Santa Clara Family Health Plan that provides coverage to Medi-Cal Managed Care recipients; the Healthy Family Program for uninsured children in working families who do not qualify for Medi-Cal; the Healthy Kids Program that provides health coverage for children from low income families who do not qualify for Midi-Cal or Healthy Families, and Healthy Workers to make affordable health coverage available for small businesses with lower wage employees.

Housing HealthAuthority FIRST 5 Authority Total
Assets:Cash and investments 51,130$ 66,680$ 38,497$ 156,307$ Receivables, net of allowance
for uncollectibles 12,536 276 64,645 77,457 Due from other governmental agencies 12,652 4,355 - 17,007 Receivables from component units and
related parties 58,262 - - 58,262 Other assets 15,505 16 7,811 23,332 Restricted cash and investments 22,723 - - 22,723 Capital assets:
Nondepreciable 49,678 2,423 3,061 55,162 Depreciable, net of
accumulated depreciation 342,221 2,373 483 345,077
Total assets 564,707 76,123 114,497 755,327
Deferred outflows of resources 16,576 - - 16,576
Liabilities:Accounts payable 2,827 8,134 39,322 50,283 Accrued salaries and benefits - 135 - 135 Accrued liabilities 6,106 45 29,808 35,959 Due to other governmental agencies 141 - 4,495 4,636 Due to component units and related parties 11,098 - - 11,098 Unearned revenue 214 - - 214 Due to primary government 7,635 - - 7,635 Noncurrent liabilities:
Due within one year 9,917 - - 9,917 Due in more than one year 304,055 164 - 304,219
Total liabilities 341,993 8,478 73,625 424,096
Deferred inflows of resources 2,501 - - 2,501
Net position:Net investment in capital assets 76,544 4,796 3,544 84,884 Restricted 20,903 - 305 21,208 Unrestricted 139,342 62,849 37,023 239,214
Total net position 236,789$ 67,645$ 40,872$ 345,306$
June 30, 2014(In thousands)
COUNTY OF SANTA CLARA
Combining Statement of Net Position
Discrete Component Units
122

Housing HealthAuthority FIRST 5 Authority Total
Program expense:Housing Authority programs 295,089$ -$ -$ 295,089$ FIRST 5 programs - 25,906 - 25,906 Health Authority programs - - 413,699 413,699
Total program expenses 295,089 25,906 413,699 734,694
Program revenues:Charges for services 304,332 - 415,788 720,120 Operating grants and contributions 57 19,072 - 19,129 Capital grants and contributions 10,770 - - 10,770
Total program revenues 315,159 19,072 415,788 750,019
Net program revenue (expense) 20,070 (6,834) 2,089 15,325
General revenue (expense):Investment income 2,572 1,077 234 3,883 Other income - 1,488 5,997 7,485
Total general revenue 2,572 2,565 6,231 11,368
Change in net position 22,642 (4,269) 8,320 26,693
Net position, beginning of year, as previously reported 214,232 71,914 32,552 318,698
Prior period adjustments (85) - - (85)
Net position, beginning of year, as restated 214,147 71,914 32,552 318,613
Net position, end of year 236,789$ 67,645$ 40,872$ 345,306$
(In thousands)
COUNTY OF SANTA CLARA
Combining Statement of ActivitiesDiscrete Component Units
For the Fiscal Year Ended June 30, 2014
123

124
This page intentionally left blank.

Combining Nonmajor
Governmental Funds Statements

This page intentionally left blank.

TotalNonmajor
Special Debt Capital Permanent GovernmentalRevenue Service Projects Endowments Funds
Assets:Cash and investments:
Unrestricted 338,482$ -$ 143,760$ 52$ 482,294$ Restricted with fiscal agents 676 6 - - 682 Other restricted 301 55,424 - - 55,725
Other receivables 61,107 42 312 - 61,461 Due from other funds 272 - 2,495 - 2,767 Due from other governmental agencies 12,061 - - - 12,061 Inventories 613 - - - 613 Other assets 610 - - - 610
Total assets 414,122$ 55,472$ 146,567$ 52$ 616,213$
Liabilities, Deferred Inflows of Resources,and Fund Balances:Liabilities:
Accounts payable 4,803$ -$ 9,634$ -$ 14,437$ Accrued salaries and benefits 6,055 - - - 6,055 Other accrued liabilities 9,921 - 3,000 - 12,921 Due to other funds 1,943 - 2 - 1,945 Due to other governmental agencies 663 - - - 663 Advances from other funds 607 - - - 607 Unearned revenue 2,160 - - - 2,160
Total liabilities 26,152 - 12,636 - 38,788
Deferred inflows of resources:Unavailable revenue 59,254 - - - 59,254
Fund balances:Nonspendable 613 - - - 613 Restricted 242,563 55,472 82,529 52 380,616 Committed 48,343 - 51,402 - 99,745 Assigned 37,197 - - - 37,197
Total fund balances 328,716 55,472 133,931 52 518,171
Total liabilities, deferred inflows of resources, and fund balances 414,122$ 55,472$ 146,567$ 52$ 616,213$
(In thousands)
COUNTY OF SANTA CLARA
Combining Balance SheetNonmajor Governmental Funds
June 30, 2014
125

COUNTY OF SANTA CLARA
For the Fiscal Year Ended June 30, 2014(In thousands)
TotalNonmajor
Special Debt Capital Permanent GovernmentalRevenue Service Projects Endowments Funds
Revenues:Taxes 146,040$ 13,208$ 8,457$ -$ 167,705$ Licenses and permits 23,445 - - - 23,445 Fines, forfeitures, and penalties 3,239 6,023 70 - 9,332 Interest and investment income 4,124 191 655 - 4,970 Intergovernmental revenues 154,904 68 567 - 155,539 Charges for services 35,314 - 50 - 35,364 Other revenue 9,462 - 29 - 9,491
Total revenues 376,528 19,490 9,828 - 405,846
Expenditures:Current:
General government 204 - - - 204 Public protection 136,610 - - - 136,610 Public ways and facilities 57,854 - - - 57,854 Health and sanitation 29,404 - - - 29,404 Public assistance 2,323 - - - 2,323 Education 35,093 - - - 35,093 Recreation and culture 37,387 - - - 37,387
Capital outlay 8,720 - 58,268 - 66,988 Debt service:
Principal retirement 399 16,920 - - 17,319 Interest and fiscal charges 168 36,122 - - 36,290 Advance refunding escrow - 1,090 - - 1,090 Cost of issuance - 308 - - 308
Total expenditures 308,162 54,440 58,268 - 420,870
Excess (deficiency) of revenues over(under) expenditures 68,366 (34,950) (48,440) - (15,024)
Other financing sources (uses):Proceeds from sale of capital assets 193 - 71 - 264 Bond premium - 909 - - 909 Proceeds of refunding bonds - 11,715 - - 11,715 Payment to bond refunding escrow - (12,310) - - (12,310) Transfers in 2,171 2,242 56,496 - 60,909 Transfers out (67,511) (121) (7,255) - (74,887)
Total other financing sources (uses) (65,147) 2,435 49,312 - (13,400)
Net change in fund balances 3,219 (32,515) 872 - (28,424)
Fund balances, beginning of year 325,497 87,987 133,059 52 546,595
Fund balances, end of year 328,716$ 55,472$ 133,931$ 52$ 518,171$
Combining Statement of Revenues, Expenditures, and Changes in Fund BalancesNonmajor Governmental Funds
126

Nonmajor Special
Revenue Funds

This page intentionally left blank.

COUNTY OF SANTA CLARA
Nonmajor Governmental Funds
127
Special Revenue Funds Special Revenue Funds are used to account for and report the proceeds of specific revenue sources that are restricted or committed to expenditure for specified purposes other than debt service or capital projects. The following summarizes the County’s significant Special Revenue Funds:
Roads – accounts for the operation and maintenance of roadways and specialized engineering services to other governmental units and the public. The program is primarily funded by the state’s highway use tax and supplemented by federal funds, vehicle code fines and fees, and reimbursement for engineering services.
County Library – accounts for library services for unincorporated areas and nine member cities. The library operates under a joint powers agreement between the County and cities. The library’s governing board consists of one council member of each city and two County Board of Supervisors. Revenues consist primarily of property taxes and federal and state aid.
Parks Operations and Maintenance – accounts for the operation and maintenance of County parks. The primary source of revenue are charges for services and special assessments. An annual transfer from the Parks Acquisition and Development Capital Projects Fund supplements the program.
Housing and Community Development – accounts for grants from the Federal Department of Housing and Community Development.
Clerk-Recorder – accounts for special recording fees collected to support, maintain, and improve document creation, storage retrieval systems.
Fire Districts – accounts for fire protection for the unincorporated areas and certain incorporated cities within the County. Revenues consist of property taxes, state assistance, and contract reimbursements.
Emergency Medical Services – accounts for emergency medical service activities that are funded through special assessments, court fines and by the tobacco tax imposed through a voter approved proposition.
Environmental Health – includes education, inspection, plan review and permit services related to food, water supply, sewage disposal, noise control, disaster preparedness, and lead contamination. The department enforces regulations related to food and hazardous materials. Revenues originate from fees, permits, grants, and municipal contributions.
Vector Control – accounts for the operational activities of the Santa Clara County Vector Control District, which detects and minimizes vector-borne diseases, abates mosquitoes, and assists the public in resolving problems with rodents, wildlife, and insects of medical significance. Revenues come from special assessments.
Tobacco Securitization – accounts for revenues and expenditures related to the activities of the tobacco settlement agreement with the U.S. tobacco companies.
Proposition 63 – accounts for expenditures related to the Mental Health Services Act, which includes expanded County Mental Health service to children, adults, and older adults with severe mental illnesses. Child Support – accounts for child support operations. Primary source of revenue is from State cash advances and interest earnings. The fund reimburses the General Fund for expenditures incurred. Other – accounts for activities of various programs including: Mortgage and Rental Assistance, Survey Monument Preservation, Weed Abatement, Correctional Facility, Integrated Waste Management, Juvenile Welfare, LAFCO, Fish & Game, and Health & Vital Statistics.

Parks HousingOperation and Emergency
County and Community Clerk- Fire MedicalRoads Library Maintenance Development Recorder Districts Services
Assets:Cash and investments:
Unrestricted 53,375$ 26,123$ 15,758$ 20,493$ 11,810$ 59,350$ 2,412$ Restricted with fiscal agents - - - - - - - Other restricted - - - - - 301 -
Other receivables 133 22 307 58,969 11 1,274 3 Due from other funds 71 18 - - - 170 - Due from other governmental agencies 5,957 405 - 401 - 2,734 - Inventories 613 - - - - - - Other assets - - - - - - -
Total assets 60,149$ 26,568$ 16,065$ 79,863$ 11,821$ 63,829$ 2,415$
Liabilities, Deferred Inflows of Resources,and Fund Balances:Liabilities:
Accounts payable 1,760$ 412$ 570$ 346$ 21$ 894$ 13$ Accrued salaries and benefits 683 485 549 - 33 3,057 - Other accrued liabilities 17 - 282 30 - 8,944 - Due to other funds - - - - - 27 - Due to other governmental agencies 1 2 1 37 - - - Advances from other funds - - - - - - - Unearned revenue – other - 67 - - - 1,210 -
Total liabilities 2,461 966 1,402 413 54 14,132 13
Deferred inflows of resources:Unavailable revenue - - - 59,254 - - -
Fund balances:Nonspendable 613 - - - - - - Restricted 56,482 25,602 - 20,196 11,767 - 2,402 Committed 593 - 14,663 - - 12,500 - Assigned - - - - - 37,197 -
Total fund balances 57,688 25,602 14,663 20,196 11,767 49,697 2,402
Total liabilities, deferred inflows of resources, and fund balances 60,149$ 26,568$ 16,065$ 79,863$ 11,821$ 63,829$ 2,415$
COUNTY OF SANTA CLARA
Combining Balance SheetNonmajor Special Revenue Funds
June 30, 2014(In thousands)
128

Environmental Vector Tobacco Proposition Child OtherHealth Control Securitization 63 Support Funds Total
Assets:Cash and investments:
20,547$ 14,222$ -$ 99,811$ 625$ 13,956$ 338,482$ Unrestricted- 351 325 - - - 676 Restricted with fiscal agents- - - - - - 301 Other restricted
20 12 - 152 3 201 61,107 Other receivables12 - - - 1 - 272 Due from other funds
1,610 19 - - 935 - 12,061 Due from other governmental agencies- - - - - - 613 Inventories- - - - 610 - 610 Other assets
22,189$ 14,604$ 325$ 99,963$ 2,174$ 14,157$ 414,122$ Total assets
Liabilities, Deferred Inflows of Resources,and Fund Balances:Liabilities:
670$ 77$ 17$ -$ 2$ 21$ 4,803$ Accounts payable361 94 - - 762 31 6,055 Accrued salaries and benefits
- - - - - 648 9,921 Other accrued liabilities- - - 1,844 - 72 1,943 Due to other funds
606 - - - 1 15 663 Due to other governmental agencies- - - - 607 - 607 Advances from other funds
883 - - - - - 2,160 Unearned revenue – other
2,520 171 17 1,844 1,372 787 26,152 Total liabilities
Deferred inflows of resources:- - - - - - 59,254 Unavailable revenue
Fund balances:- - - - - - 613 Nonspendable- 14,433 308 98,119 802 12,452 242,563 Restricted
19,669 - - - - 918 48,343 Committed- - - - - - 37,197 Assigned
19,669 14,433 308 98,119 802 13,370 328,716 Total fund balances
Total liabilities, deferred inflows of resources, 22,189$ 14,604$ 325$ 99,963$ 2,174$ 14,157$ 414,122$ and fund balances
COUNTY OF SANTA CLARA
Combining Balance Sheet Nonmajor Special Revenue Funds
June 30, 2014 (In thousands)
129

Parks HousingOperation and Emergency
County and Community Clerk- Fire MedicalRoads Library Maintenance Development Recorder Districts Services
Revenues:Taxes 252$ 33,599$ 33,830$ -$ -$ 71,431$ -$ Licenses and permits 933 - - 1,412 - 581 - Fines, forfeitures, and penalties - 941 45 - - - 2,249 Interest and investment income 843 87 1,587 305 78 429 12 Intergovernmental revenues 48,820 1,566 251 2,441 - 3,959 - Charges for services 718 14 4,269 57 2,681 26,238 - Other revenue 5,912 606 430 68 - 1,357 20
Total revenues 57,478 36,813 40,412 4,283 2,759 103,995 2,281
Expenditures:Current:
General government - - - - - - - Public protection - - - - 3,171 94,216 - Public ways and facilities 57,854 - - - - - - Health and sanitation - - - - - - 3,051 Public assistance - - - 2,323 - - - Education - 35,093 - - - - - Recreation and culture - - 37,387 - - - -
Capital outlay - 4,392 - - - 4,175 - Debt service:
Principal retirement - - - - - 219 - Interest and fiscal charges - - - - - - -
Total expenditures 57,854 39,485 37,387 2,323 3,171 98,610 3,051
Excess (deficiency) of revenues over(under) expenditures (376) (2,672) 3,025 1,960 (412) 5,385 (770)
Other financing sources (uses):Proceeds from sale of capital assets 159 3 - - - 31 - Transfers in 946 252 201 - 12 20 - Transfers out - - (950) (206) - - -
Total other financing sources (uses) 1,105 255 (749) (206) 12 51 -
Net change in fund balances 729 (2,417) 2,276 1,754 (400) 5,436 (770)
Fund balances, beginning of year 56,959 28,019 12,387 18,442 12,167 44,261 3,172
Fund balances, end of year 57,688$ 25,602$ 14,663$ 20,196$ 11,767$ 49,697$ 2,402$
(In thousands)
COUNTY OF SANTA CLARA
Combining Statement of Revenues, Expenditures, and Changes in Fund BalancesNonmajor Special Revenue Funds
For the Fiscal Year Ended June 30, 2014
130

Environmental Vector Tobacco Proposition Child OtherHealth Control Securitization 63 Support Funds Total
Revenues:-$ 6,928$ -$ -$ -$ -$ 146,040$ Taxes
20,455 - - - - 64 23,445 Licenses and permits- - - - - 4 3,239 Fines, forfeitures, and penalties
80 52 - 611 (7) 47 4,124 Interest and investment income1,932 3 - 57,737 37,743 452 154,904 Intergovernmental revenues
776 - - - - 561 35,314 Charges for services46 49 - - 20 954 9,462 Other revenue
23,289 7,032 - 58,348 37,756 2,082 376,528 Total revenues
Expenditures:Current:
- - 92 - - 112 204 General government- - - - 37,317 1,906 136,610 Public protection- - - - - - 57,854 Public ways and facilities
20,640 5,713 - - - - 29,404 Health and sanitation- - - - - - 2,323 Public assistance- - - - - - 35,093 Education- - - - - - 37,387 Recreation- 153 - - - - 8,720 Capital outlay
Debt service:- 180 - - - - 399 Principal retirement- 168 - - - - 168 Interest and fiscal charges
20,640 6,214 92 - 37,317 2,018 308,162 Total expenditures
Excess (deficiency) of revenues over2,649 818 (92) 58,348 439 64 68,366 (under) expenditures
Other financing sources (uses):- - - - - - 193 Proceeds from sale of capital assets
117 36 119 - 282 186 2,171 Transfers in- - - (65,673) (538) (144) (67,511) Transfers out
117 36 119 (65,673) (256) 42 (65,147) Total other financing sources (uses)
2,766 854 27 (7,325) 183 106 3,219 Net change in fund balances
16,903 13,579 281 105,444 619 13,264 325,497 Fund balances, beginning of year
19,669$ 14,433$ 308$ 98,119$ 802$ 13,370$ 328,716$ Fund balances, end of year
For the Fiscal Year Ended June 30, 2014 (In thousands)
COUNTY OF SANTA CLARA
Combining Statement of Revenues, Expenditures, and Changes in Fund BalancesNonmajor Special Revenue Funds
131
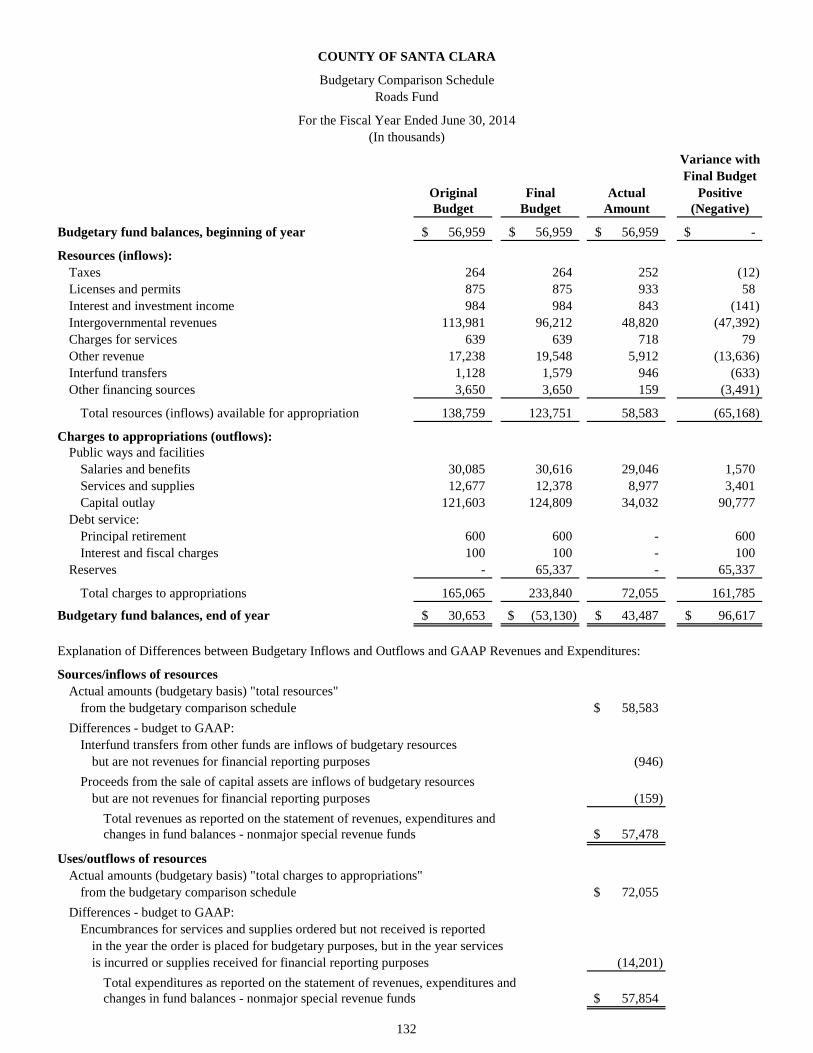
Variance withFinal Budget
Original Final Actual PositiveBudget Budget Amount (Negative)
Budgetary fund balances, beginning of year 56,959$ 56,959$ 56,959$ -$
Resources (inflows):Taxes 264 264 252 (12) Licenses and permits 875 875 933 58 Interest and investment income 984 984 843 (141) Intergovernmental revenues 113,981 96,212 48,820 (47,392) Charges for services 639 639 718 79 Other revenue 17,238 19,548 5,912 (13,636) Interfund transfers 1,128 1,579 946 (633) Other financing sources 3,650 3,650 159 (3,491)
Total resources (inflows) available for appropriation 138,759 123,751 58,583 (65,168)
Charges to appropriations (outflows):Public ways and facilities
Salaries and benefits 30,085 30,616 29,046 1,570 Services and supplies 12,677 12,378 8,977 3,401 Capital outlay 121,603 124,809 34,032 90,777
Debt service:Principal retirement 600 600 - 600 Interest and fiscal charges 100 100 - 100
Reserves - 65,337 - 65,337
Total charges to appropriations 165,065 233,840 72,055 161,785
Budgetary fund balances, end of year 30,653$ (53,130)$ 43,487$ 96,617$
Explanation of Differences between Budgetary Inflows and Outflows and GAAP Revenues and Expenditures:
Sources/inflows of resourcesActual amounts (budgetary basis) "total resources"
from the budgetary comparison schedule 58,583$
Differences - budget to GAAP:Interfund transfers from other funds are inflows of budgetary resources
but are not revenues for financial reporting purposes (946)
Proceeds from the sale of capital assets are inflows of budgetary resourcesbut are not revenues for financial reporting purposes (159)
Total revenues as reported on the statement of revenues, expenditures andchanges in fund balances - nonmajor special revenue funds 57,478$
Uses/outflows of resourcesActual amounts (budgetary basis) "total charges to appropriations"
from the budgetary comparison schedule 72,055$
Differences - budget to GAAP:Encumbrances for services and supplies ordered but not received is reported
in the year the order is placed for budgetary purposes, but in the year servicesis incurred or supplies received for financial reporting purposes (14,201)
Total expenditures as reported on the statement of revenues, expenditures andchanges in fund balances - nonmajor special revenue funds 57,854$
(In thousands)
COUNTY OF SANTA CLARA
Budgetary Comparison ScheduleRoads Fund
For the Fiscal Year Ended June 30, 2014
132

Variance withFinal Budget
Original Final Actual PositiveBudget Budget Amount (Negative)
Budgetary fund balances, beginning of year 28,019$ 28,019$ 28,019$ -$
Resources (inflows):Taxes 29,888 29,888 33,599 3,711 Fines, forfeitures, and penalties 940 940 941 1 Interest and investment income 140 140 87 (53) Intergovernmental revenues 1,481 1,521 1,566 45 Charges for services 14 14 14 - Other revenue 20 400 606 206 Interfund transfers 6,051 6,252 252 (6,000) Proceeds from sale of capital assets - - 3 3
Total resources (inflows) available for appropriation 38,534 39,155 37,068 (2,087)
Charges to appropriations (outflows):Education
Salaries and benefits 22,414 22,659 22,262 397 Services and supplies 12,283 13,828 11,877 1,951 Capital outlay 4,944 5,269 4,832 437
Interfund transfers 6,000 6,000 - 6,000 Reserves 10,152 34,381 1,461 32,920
Total charges to appropriations 55,793 82,137 40,432 41,705
Budgetary fund balances, end of year 10,760$ (14,963)$ 24,655$ 39,618$
Explanation of Differences between Budgetary Inflows and Outflows and GAAP Revenues and Expenditures:
Sources/inflows of resourcesActual amounts (budgetary basis) "total resources"
from the budgetary comparison schedule 37,068$
Differences - budget to GAAP:Interfund transfers from other funds are inflows of budgetary resources
but are not revenues for financial reporting purposes (252) Proceeds from the sale of capital assets are inflows of budgetary resources
but are not revenues for financial reporting purposes (3)
Total revenues as reported on the statement of revenues, expenditures andchanges in fund balances - nonmajor special revenue funds 36,813$
Uses/outflows of resourcesActual amounts (budgetary basis) "total charges to appropriations"
from the budgetary comparison schedule 40,432$
Differences - budget to GAAP:Encumbrances for services and supplies ordered but not received is reported
in the year the order is placed for budgetary purposes, but in the year servicesis incurred or supplies received for financial reporting purposes (947)
Total expenditures as reported on the statement of revenues, expenditures andchanges in fund balances - nonmajor special revenue funds 39,485$
(In thousands)
COUNTY OF SANTA CLARA
Budgetary Comparison ScheduleCounty Library Fund
For the Fiscal Year Ended June 30, 2014
133

Variance withFinal Budget
Original Final Actual PositiveBudget Budget Amount (Negative)
Budgetary fund balances, beginning of year 12,387$ 12,387$ 12,387$ -$
Resources (inflows):Taxes 32,115 32,115 33,830 1,715 Fines, forfeitures, and penalties - - 45 45 Interest and investment income 1,490 1,490 1,587 97 Intergovernmental revenues 574 574 251 (323) Charges for services 3,887 3,887 4,269 382 Other revenue 438 438 430 (8) Interfund transfers - 201 201 -
Total resources (inflows) available for appropriation 38,504 38,705 40,613 1,908
Charges to appropriations (outflows):Recreation
Salaries and benefits 24,943 25,405 24,733 672 Services and supplies 11,131 11,322 11,552 (230) Capital outlay 1,667 2,147 1,438 709
Interfund transfers 1,600 1,600 950 650 Reserves 100 11,760 - 11,760
Total charges to appropriations 39,441 52,234 38,673 13,561
Budgetary fund balances, end of year 11,450$ (1,142)$ 14,327$ 15,469$
Explanation of Differences between Budgetary Inflows and Outflows and GAAP Revenues and Expenditures:
Sources/inflows of resourcesActual amounts (budgetary basis) "total resources"
from the budgetary comparison schedule 40,613$
Differences - budget to GAAP:Interfund transfers from other funds are inflows of budgetary resources
but are not revenues for financial reporting purposes (201)
Total revenues as reported on the statement of revenues, expenditures andchanges in fund balances - nonmajor special revenue funds 40,412$
Uses/outflows of resourcesActual amounts (budgetary basis) "total charges to appropriations"
from the budgetary comparison schedule 38,673$
Differences - budget to GAAP:Encumbrances for services and supplies ordered but not received is reported
in the year the order is placed for budgetary purposes, but in the year servicesis incurred or supplies received for financial reporting purposes (336)
Interfund transfers to other funds are outflows of budgetary resources but are not expenditures for financial reporting purposes (950)
Total expenditures as reported on the statement of revenues, expenditures andchanges in fund balances - nonmajor special revenue funds 37,387$
(In thousands)
COUNTY OF SANTA CLARA
Budgetary Comparison ScheduleParks Operation and Maintenance Fund
For the Fiscal Year Ended June 30, 2014
134

Variance withFinal Budget
Original Final Actual PositiveBudget Budget Amount (Negative)
Budgetary fund balances, beginning of year 18,442$ 18,442$ 18,442$ -$
Resources (inflows):Licenses and permits 1,936 1,936 1,412 (524) Interest and investment income 83 83 305 222 Intergovernmental revenues 4,891 5,116 2,441 (2,675) Charges for Services 67 67 57 (10) Other revenue 44 44 68 24 Interfund transfers 462 462 - (462)
Total resources (inflows) available for appropriation 7,483 7,708 4,283 (3,425)
Charges to appropriations (outflows):Public assistance
Services and supplies 14,516 14,742 2,954 11,788 Interfund transfers - 300 206 94 Reserves - 4,198 - 4,198
Total charges to appropriations 14,516 19,240 3,160 16,080
Budgetary fund balances, end of year 11,409$ 6,910$ 19,565$ 12,655$
Explanation of Differences between Budgetary Outflows and GAAP Expenditures: Uses/outflows of resources
Actual amounts (budgetary basis) "total charges to appropriations" from the budgetary comparison schedule 3,160$
Differences - budget to GAAP:Encumbrances for services and supplies ordered but not received is reported
in the year the order is placed for budgetary purposes, but in the year servicesis incurred or supplies received for financial reporting purposes (631)
Interfund transfers to other funds are outflows of budgetary resources but are not expenditures for financial reporting purposes (206)
Total expenditures as reported on the statement of revenues, expenditures andchanges in fund balances - nonmajor special revenue funds 2,323$
(In thousands)
COUNTY OF SANTA CLARA
Budgetary Comparison ScheduleHousing and Community Development Fund
For the Fiscal Year Ended June 30, 2014
135

Variance withFinal Budget
Original Final Actual PositiveBudget Budget Amount (Negative)
Budgetary fund balances, beginning of year 12,167$ 12,167$ 12,167$ -$
Resources (inflows):Interest and investment income 42 42 78 36 Charges for services 4,185 4,185 2,681 (1,504) Interfund transfers - 12 12 -
Total resources (inflows) available for appropriation 4,227 4,239 2,771 (1,468)
Charges to appropriations (outflows):Public protection
Salaries and employees benefits 1,637 1,603 1,582 21 Services and supplies 3,197 2,881 1,388 1,493 Capital outlay - 222 220 2
Reserves - 12,002 - 12,002
Total charges to appropriations 4,834 16,708 3,190 13,518
Budgetary fund balances, end of year 11,560$ (302)$ 11,748$ 12,050$
Explanation of Differences between Budgetary Inflows and Outflows and GAAP Revenues and Expenditures: Sources/inflows of resources
Actual amounts (budgetary basis) "total resources" from the budgetary comparison schedule 2,771$
Differences - budget to GAAP:Interfund transfers from other funds are inflows of budgetary resources
but are not revenues for financial reporting purposes (12)
Total revenues as reported on the statement of revenues, expenditures andchanges in fund balance - nonmajor special revenue funds 2,759$
Uses/outflows of resourcesActual amounts (budgetary basis) "total charges to appropriations"
from the budgetary comparison schedule 3,190$
Differences - budget to GAAP:Encumbrances for services and supplies ordered but not received is reported
in the year the order is placed for budgetary purposes, but in the year servicesis incurred or supplies received for financial reporting purposes (19)
Total expenditures as reported on the statement of revenues, expenditures andchanges in fund balances - nonmajor special revenue funds 3,171$
(In thousands)
COUNTY OF SANTA CLARA
Budgetary Comparison ScheduleClerk-Recorder Fund
For the Fiscal Year Ended June 30, 2014
136

Variance withFinal Budget
Original Final Actual PositiveBudget Budget Amount (Negative)
Budgetary fund balances, beginning of year 44,261$ 44,261$ 44,261$ -$
Resources (inflows):Taxes 66,659 66,659 71,431 4,773 Licenses and permits 469 669 581 (88) Fines, forfeitures, and penalties 800 800 - (800) Interest and investment income 284 284 429 145 Intergovernmental revenues 3,022 4,033 3,959 (74) Charges for services 25,744 25,764 26,238 474 Other revenue 1,084 1,084 1,357 274 Proceeds from sale of capital assets 20 20 31 11 Interfund transfers - - 20 20
Total resources (inflows) available for appropriation 98,082 99,313 104,046 4,733
Charges to appropriations (outflows):Public protection
Salaries and benefits 69,779 70,723 69,220 1,503 Services and supplies 28,255 28,542 25,215 3,327 Capital outlay 6,887 6,887 4,175 2,712
Reserves 6,070 6,070 - 6,070
Total charges to appropriations 110,991 112,222 98,610 13,612
Budgetary fund balances, end of year 31,352$ 31,352$ 49,697$ 18,345$
Explanation of Differences between Budgetary Inflows and Outflows and GAAP Revenues and Expenditures: Sources/inflows of resources
Actual amounts (budgetary basis) "total resources" from the budgetary comparison schedule 104,046$
Differences - budget to GAAP:Interfund transfers from other funds are inflows of budgetary resources
but are not revenues for financial reporting purposes (20)
Proceeds from the sale of capital assets are inflows of budgetary resourcesbut are not revenues for financial reporting purposes (31)
Total revenues as reported on the statement of revenues, expenditures andchanges in fund balances - nonmajor special revenue funds 103,995$
(In thousands)
COUNTY OF SANTA CLARA
Budgetary Comparison ScheduleFire Districts Fund
For the Fiscal Year Ended June 30, 2014
137

Variance withFinal Budget
Original Final Actual PositiveBudget Budget Amount (Negative)
Budgetary fund balances, beginning of year 3,172$ 3,172$ 3,172$ -$
Resources (inflows):Fines, forfeitures, and penalties 2,500 3,057 2,249 (808) Interest and investment income - - 12 12 Other revenue - - 20 20
Total resources (inflows) available for appropriation 2,500 3,057 2,281 (776)
Charges to appropriations (outflows):Health and sanitation
Services and supplies 2,500 3,057 3,051 6 Reserves - 3,172 - 3,172
Total charges to appropriations 2,500 6,229 3,051 3,178
Budgetary fund balances, end of year 3,172$ -$ 2,402$ 2,402$
(In thousands)
COUNTY OF SANTA CLARA
Budgetary Comparison ScheduleEmergency Medical Services Fund
For the Fiscal Year Ended June 30, 2014
138

Variance withFinal Budget
Original Final Actual PositiveBudget Budget Amount (Negative)
Budgetary fund balances, beginning of year 16,903$ 16,903$ 16,903$ -$
Resources (inflows):Licenses and permits 21,401 21,401 20,455 (946) Interest and investment income 94 94 80 (14) Intergovernmental revenues 1,891 1,891 1,932 41 Charges for services 703 703 776 73 Other revenue - - 46 46 Interfund transfers - 117 117 -
Total resources (inflows) available for appropriation 24,089 24,206 23,406 (800)
Charges to appropriations (outflows):Health and sanitation
Salaries and benefits 15,882 16,060 14,970 1,090 Services and supplies 3,086 2,991 2,227 764 Capital outlay 243 846 577 269
Reserves - 16,861 - 16,861
Total health and sanitation 19,211 36,758 17,774 18,984
Public protectionSalaries and benefits 1,107 1,121 980 141 Services and supplies 3,452 3,432 2,115 1,317 Capital outlay - 20 20 -
Reserves - 16,861 - 16,861
Total public protection 4,559 21,434 3,115 18,319
Total charges to appropriations 23,770 58,192 20,889 37,303 Budgetary fund balances, end of year 17,222$ (17,083)$ 19,420$ 36,503$
Explanation of Differences between Budgetary Inflows and Outflows and GAAP Revenues and Expenditures:
Sources/inflows of resourcesActual amounts (budgetary basis) "total resources"
from the budgetary comparison schedule 23,406$ Differences - budget to GAAP:
Interfund transfers from other funds are inflows of budgetary resourcesbut are not revenues for financial reporting purposes (117)
Total revenues as reported on the statement of revenues, expenditures andchanges in fund balances - nonmajor special revenue funds 23,289$
Uses/outflows of resourcesActual amounts (budgetary basis) "total charges to appropriations"
from the budgetary comparison schedule 20,889$
Differences - budget to GAAP:Encumbrances for services and supplies ordered but not received is reported
in the year the order is placed for budgetary purposes, but in the year servicesis incurred or supplies received for financial reporting purposes (249)
Total expenditures as reported on the statement of revenues, expenditures andchanges in fund balances - nonmajor special revenue funds 20,640$
(In thousands)
COUNTY OF SANTA CLARA
Budgetary Comparison ScheduleEnvironmental Health Fund
For the Fiscal Year Ended June 30, 2014
139

Variance withFinal Budget
Original Final Actual PositiveBudget Budget Amount (Negative)
Budgetary fund balances, beginning of year 13,579$ 13,579$ 13,579$ -$
Resources (inflows):Taxes 6,986 6,986 6,928 (58) Interest and investment income 93 93 52 (41) Intergovernmental revenues 1 1 3 2 Other revenue 43 43 49 6 Interfund transfers - 36 36 -
Total resources (inflows) available for appropriation 7,123 7,159 7,068 (91)
Charges to appropriations (outflows):Health and sanitation
Salaries and benefits 3,958 4,046 3,954 92 Services and supplies 2,574 2,523 1,765 758
135 264 153 111 Debt service:
Principal retirement 212 212 180 32 Interest and fiscal charges 168 168 168 -
Reserves - 13,658 - 13,658 Total charges to appropriations 7,047 20,871 6,220 14,651
Budgetary fund balances, end of year 13,655$ (133)$ 14,427$ 14,560$
Explanation of Differences between Budgetary Inflows and Outflows and GAAP Revenues and Expenditures:
Sources/inflows of resourcesActual amounts (budgetary basis) "total resources"
from the budgetary comparison schedule 7,068$
Differences - budget to GAAP:Interfund transfers from other funds are inflows of budgetary resources
but are not revenues for financial reporting purposes (36)
Total revenues as reported on the statement of revenues, expenditures andchanges in fund balances - nonmajor special revenue funds 7,032$
Uses/outflows of resourcesActual amounts (budgetary basis) "total charges to appropriations"
from the budgetary comparison schedule 6,220$
Differences - budget to GAAP:Encumbrances for services and supplies ordered but not received is reported
in the year the order is placed for budgetary purposes, but in the year servicesis incurred or supplies received for financial reporting purposes (6)
Total expenditures as reported on the statement of revenues, expenditures andchanges in fund balances - nonmajor special revenue funds 6,214$
Capital assets
(In thousands)
COUNTY OF SANTA CLARA
Budgetary Comparison ScheduleVector Control Fund
For the Fiscal Year Ended June 30, 2014
140

Variance withFinal Budget
Original Final Actual PositiveBudget Budget Amount (Negative)
Budgetary fund balances, beginning of year 281$ 281$ 281$ -$
Resources (inflows):Interfund transfers - - 119 119
Charges to appropriations (outflows):General government
Services and supplies - 92 92 -
Budgetary fund balances, end of year 281$ 189$ 308$ 119$
Explanation of Differences between Budgetary Inflows and GAAP Revenues: and Expenditures: Sources/inflows of resources
Actual amounts (budgetary basis) "total resources" from the budgetary comparison schedule 119$
Differences - budget to GAAP:Interfund transfers from other funds are inflows of budgetary resources
but are not revenues for financial reporting purposes (119)
Total revenues as reported on the statement of revenues, expenditures andchanges in fund balance - nonmajor special revenue funds -$
(In thousands)
COUNTY OF SANTA CLARA
Budgetary Comparison ScheduleTobacco Securitization Fund
For the Fiscal Year Ended June 30, 2014
141

Variance withFinal Budget
Original Final Actual PositiveBudget Budget Amount (Negative)
Budgetary fund balances, beginning of year 105,444$ 105,444$ 105,444$ -$
Resources (inflows):Interest and investment income - - 611 611 Intergovernmental revenues 82,243 83,233 57,737 (25,496)
Total resources (inflows) available for appropriation 82,243 83,233 58,348 (24,885)
Charges to appropriations (outflows):Public protectionInterfund transfers 86,222 87,212 65,673 21,539 Reserves - 101,465 - 101,465
Total charges to appropriations 86,222 188,677 65,673 123,004
Budgetary fund balances, end of year 101,465$ -$ 98,119$ 98,119$
Explanation of Differences between Budgetary Outflows and GAAP Expenditures:
Uses/outflows of resourcesActual amounts (budgetary basis) "total charges to appropriations"
from the budgetary comparison schedule 65,673$
Differences - budget to GAAP:Interfund transfers to other funds are outflows of budgetary resources but
are not expenditures for financial reporting purposes (65,673)
Total expenditures as reported on the statement of revenues, expenditures andchanges in fund balances - nonmajor special revenue funds -$
(In thousands)
COUNTY OF SANTA CLARA
Budgetary Comparison ScheduleProposition 63 Fund
For the Fiscal Year Ended June 30, 2014
142
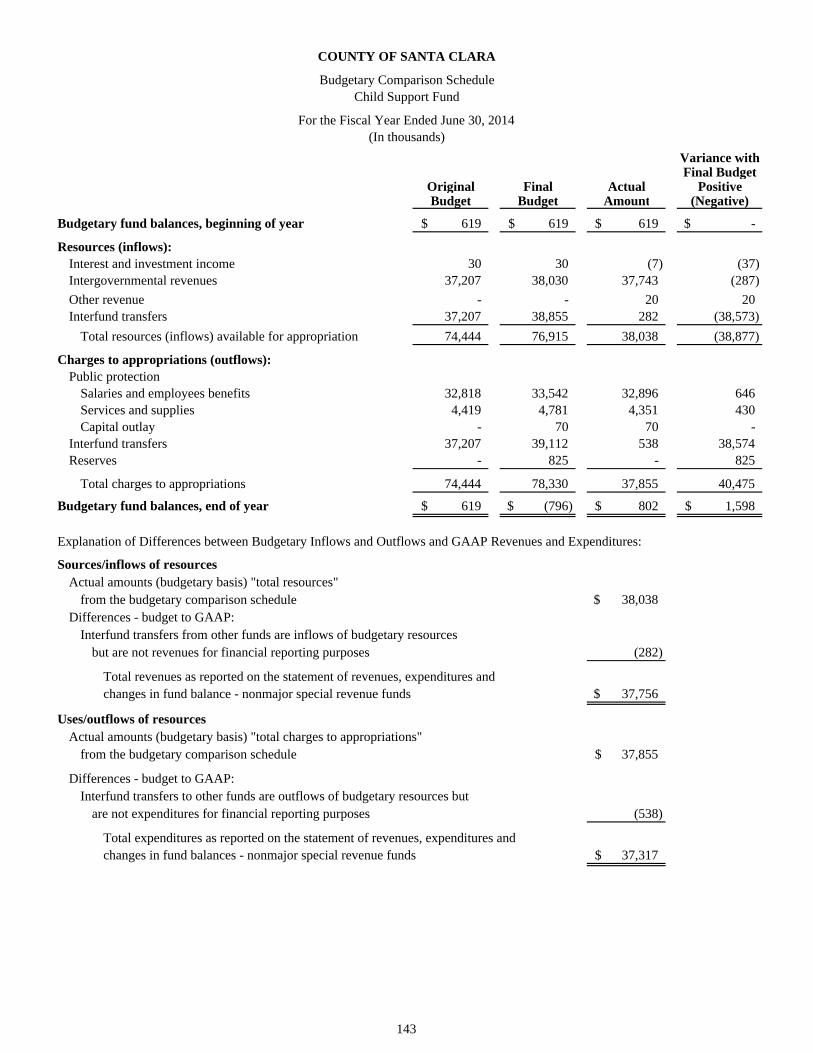
Variance withFinal Budget
Original Final Actual PositiveBudget Budget Amount (Negative)
Budgetary fund balances, beginning of year 619$ 619$ 619$ -$
Resources (inflows):Interest and investment income 30 30 (7) (37) Intergovernmental revenues 37,207 38,030 37,743 (287)
Other revenue - - 20 20 Interfund transfers 37,207 38,855 282 (38,573)
Total resources (inflows) available for appropriation 74,444 76,915 38,038 (38,877)
Charges to appropriations (outflows):Public protection
Salaries and employees benefits 32,818 33,542 32,896 646 Services and supplies 4,419 4,781 4,351 430 Capital outlay - 70 70 -
Interfund transfers 37,207 39,112 538 38,574 Reserves - 825 - 825
Total charges to appropriations 74,444 78,330 37,855 40,475
Budgetary fund balances, end of year 619$ (796)$ 802$ 1,598$
Explanation of Differences between Budgetary Inflows and Outflows and GAAP Revenues and Expenditures:
Sources/inflows of resourcesActual amounts (budgetary basis) "total resources"
from the budgetary comparison schedule 38,038$ Differences - budget to GAAP:
Interfund transfers from other funds are inflows of budgetary resourcesbut are not revenues for financial reporting purposes (282)
Total revenues as reported on the statement of revenues, expenditures andchanges in fund balance - nonmajor special revenue funds 37,756$
Uses/outflows of resourcesActual amounts (budgetary basis) "total charges to appropriations"
from the budgetary comparison schedule 37,855$
Differences - budget to GAAP:Interfund transfers to other funds are outflows of budgetary resources but
are not expenditures for financial reporting purposes (538)
Total expenditures as reported on the statement of revenues, expenditures andchanges in fund balances - nonmajor special revenue funds 37,317$
(In thousands)
COUNTY OF SANTA CLARA
Budgetary Comparison ScheduleChild Support Fund
For the Fiscal Year Ended June 30, 2014
143
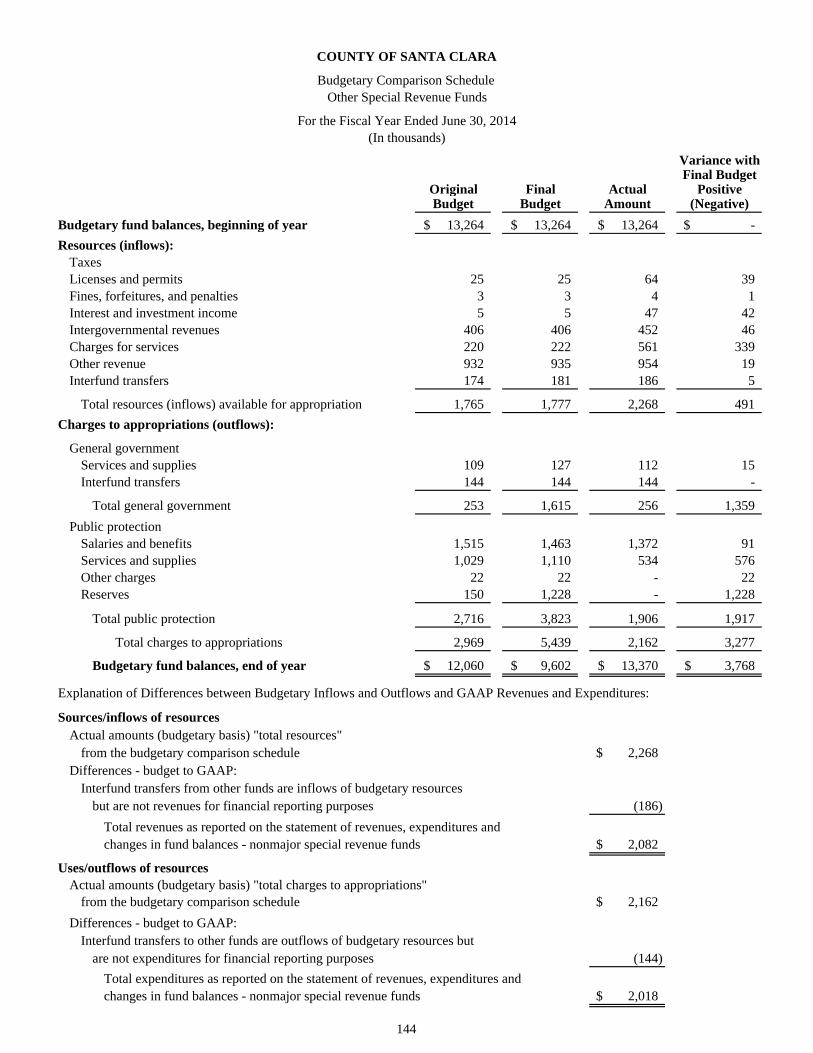
Variance withFinal Budget
Original Final Actual PositiveBudget Budget Amount (Negative)
Budgetary fund balances, beginning of year 13,264$ 13,264$ 13,264$ -$
Resources (inflows):TaxesLicenses and permits 25 25 64 39 Fines, forfeitures, and penalties 3 3 4 1 Interest and investment income 5 5 47 42 Intergovernmental revenues 406 406 452 46 Charges for services 220 222 561 339 Other revenue 932 935 954 19 Interfund transfers 174 181 186 5
Total resources (inflows) available for appropriation 1,765 1,777 2,268 491
Charges to appropriations (outflows):
General governmentServices and supplies 109 127 112 15 Interfund transfers 144 144 144 -
Total general government 253 1,615 256 1,359
Salaries and benefits 1,515 1,463 1,372 91 Services and supplies 1,029 1,110 534 576 Other charges 22 22 - 22 Reserves 150 1,228 - 1,228
Total public protection 2,716 3,823 1,906 1,917
Total charges to appropriations 2,969 5,439 2,162 3,277
Budgetary fund balances, end of year 12,060$ 9,602$ 13,370$ 3,768$
Explanation of Differences between Budgetary Inflows and Outflows and GAAP Revenues and Expenditures: Sources/inflows of resources
Actual amounts (budgetary basis) "total resources" from the budgetary comparison schedule 2,268$
Differences - budget to GAAP:Interfund transfers from other funds are inflows of budgetary resources
but are not revenues for financial reporting purposes (186)
Total revenues as reported on the statement of revenues, expenditures andchanges in fund balances - nonmajor special revenue funds 2,082$
Uses/outflows of resourcesActual amounts (budgetary basis) "total charges to appropriations"
from the budgetary comparison schedule 2,162$
Differences - budget to GAAP:Interfund transfers to other funds are outflows of budgetary resources but
are not expenditures for financial reporting purposes (144)
Total expenditures as reported on the statement of revenues, expenditures andchanges in fund balances - nonmajor special revenue funds 2,018$
Public protection
(In thousands)
COUNTY OF SANTA CLARA
Budgetary Comparison Schedule Other Special Revenue Funds
For the Fiscal Year Ended June 30, 2014
144
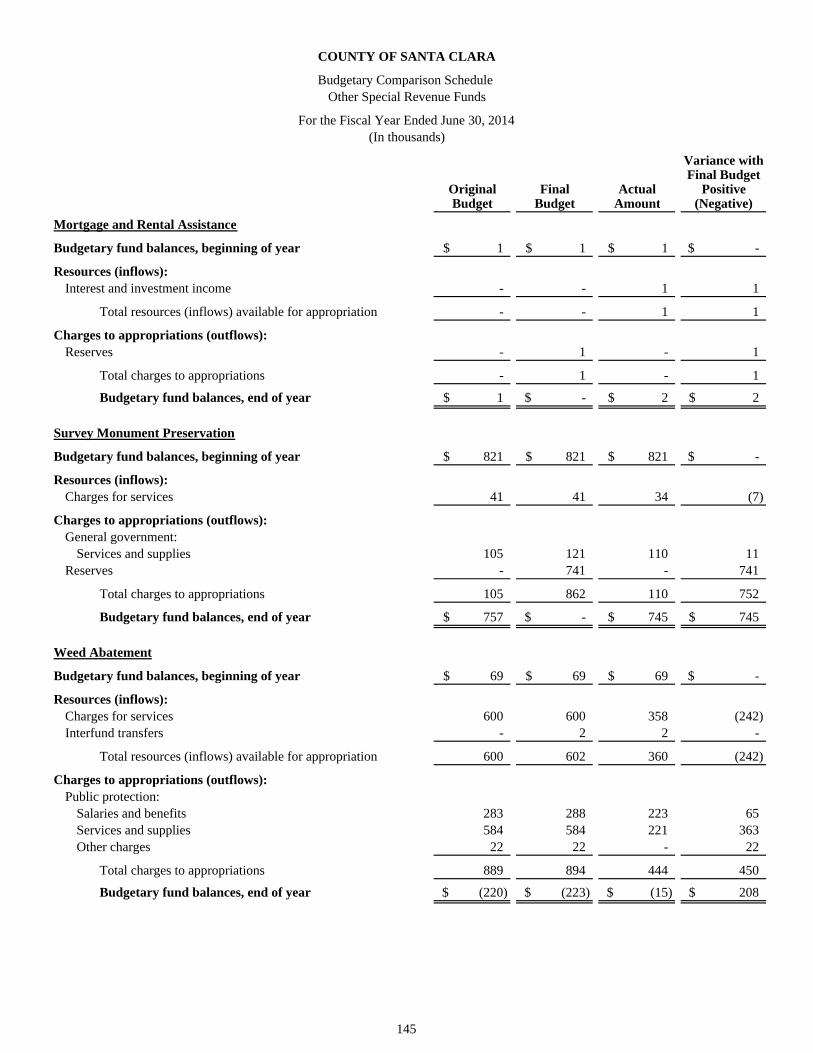
Variance withFinal Budget
Original Final Actual PositiveBudget Budget Amount (Negative)
Mortgage and Rental Assistance
Budgetary fund balances, beginning of year 1$ 1$ 1$ -$
Resources (inflows):Interest and investment income - - 1 1
Total resources (inflows) available for appropriation - - 1 1
Charges to appropriations (outflows):- 1 - 1
Total charges to appropriations - 1 - 1
Budgetary fund balances, end of year 1$ -$ 2$ 2$
Survey Monument Preservation
Budgetary fund balances, beginning of year 821$ 821$ 821$ -$
Resources (inflows):Charges for services 41 41 34 (7)
Charges to appropriations (outflows):General government:
Services and supplies 105 121 110 11 - 741 - 741
Total charges to appropriations 105 862 110 752
Budgetary fund balances, end of year 757$ -$ 745$ 745$
Weed Abatement
Budgetary fund balances, beginning of year 69$ 69$ 69$ -$
Resources (inflows):Charges for services 600 600 358 (242) Interfund transfers - 2 2 -
Total resources (inflows) available for appropriation 600 602 360 (242)
Charges to appropriations (outflows):Public protection:
Salaries and benefits 283 288 223 65 Services and supplies 584 584 221 363 Other charges 22 22 - 22
Total charges to appropriations 889 894 444 450
Budgetary fund balances, end of year (220)$ (223)$ (15)$ 208$
COUNTY OF SANTA CLARA
Budgetary Comparison Schedule Other Special Revenue Funds
For the Fiscal Year Ended June 30, 2014
Reserves
Reserves
(In thousands)
145

Variance withFinal Budget
Original Final Actual PositiveBudget Budget Amount (Negative)
Integrated Waste Management
Budgetary fund balances, beginning of year 818$ 818$ 818$ -$
Resources (inflows):Intergovernmental revenue 1 1 - (1) Other revenue 932 932 947 15 Interfund transfers 174 181 181 -
Total resources (inflows) available for appropriation 1,107 1,114 1,128 14
Charges to appropriations (outflows):Public protection:
Salaries and benefits 798 724 698 26 Services and supplies 264 354 294 60
Reserves - 853 - 853
Total charges to appropriations 1,062 1,931 992 939
Budgetary fund balances, end of year 863$ 1$ 954$ 953$
Juvenile Welfare
Budgetary fund balances, beginning of year 179$ 179$ 179$ -$
Resources (inflows):Charges for services 35 35 - (35) Other revenue - - 7 7
Total resources (inflows) available for appropriation 35 35 7 (28)
Charges to appropriations (outflows):Public protection:
Services and supplies 35 35 14 21 Reserves - 179 - 179
Total charges to appropriations 35 214 14 200
Budgetary fund balances, end of year 179$ -$ 172$ 172$
LAFCO
Budgetary fund balances, beginning of year 310$ 310$ 310$ -$
Resources (inflows):
Licenses and permits 25 25 64 39 Interest and investment income 5 5 3 (2) Intergovernmental revenues 406 406 452 46 Interfund transfers - 3 3 -
Total resources (inflows) available for appropriation 436 439 522 83
Charges to appropriations (outflows):Public protection:
Salaries and benefits 434 451 451 - Services and supplies 146 137 5 132
150 196 - 196
Total charges to appropriations 730 784 456 328
Budgetary fund balances, end of year 16$ (35)$ 376$ 411$
Reserves
(In thousands)
COUNTY OF SANTA CLARA
Budgetary Comparison Schedule Other Special Revenue Funds
For the Fiscal Year Ended June 30, 2014
146

Variance withFinal Budget
Original Final Actual PositiveBudget Budget Amount (Negative)
Fish and Game
Budgetary fund balances, beginning of year 10$ 10$ 10$ -$
Resources (inflows):Fines, forfeitures, and penalties 3 3 4 1
Charges to appropriations (outflows):General government:
Services and supplies 4 6 2 4 - 7 - 7
Total charges to appropriations 4 13 2 11
Budgetary fund balances, end of year 9$ -$ 12$ 12$
Health Vital Statistics
Budgetary fund balances, beginning of year 596$ 596$ 596$ -$
Resources (inflows):Charges for services 144 144 169 25 Other financing sources
Amounts available for appropriation 144 144 169 25
Charges to appropriations (outflows):General government:
Interfund transfer 144 144 144 - Reserves - 596 - 596
Total charges to appropriations 144 740 144 596
Budgetary fund balances, end of year 596$ -$ 621$ 621$
County/ Stanford Trail
Budgetary fund balances, beginning of year 10,460$ 10,460$ 10,460$ -$
Resources (inflows):Interest and investment income - - 44 44
Budgetary fund balances, end of year 10,460$ 10,460$ 10,504$ 44$
Reserves
COUNTY OF SANTA CLARA
Budgetary Comparison Schedule Other Special Revenue Funds
For the Fiscal Year Ended June 30, 2014(In thousands)
147

148
This page intentionally left blank.

Nonmajor Debt
Service Funds

This page intentionally left blank.

COUNTY OF SANTA CLARA
Nonmajor Governmental Funds
149
Debt Service Funds Debt Service Funds are used to account for and report financial resources that are restricted, committed, or assigned to expenditure for principal and interest. The following are the County’s Debt Service Funds: Multiple Facilities Bonds – accounts for the required debt service reserve amount of the 2006 Series I lease revenue bonds, 2007 Series K lease revenue bonds, 2008 Series A and L lease revenue bonds, and 2010 Series N lease revenue bonds. Hospital Facilities Bonds – accounts for the required debt service reserve amount and the principal retirement and related interest payments of the Hospital Facilities Authority Bonds. Revenue sources consist of interest earnings on the reserve amount and transfers from the General Fund. Justice Facilities Bonds – accounts for the principal retirement and related interest payments of the Justice Facilities Bonds. Revenue sources consist of interest earnings and fines and forfeitures. Morgan Hill Courthouse Bonds – accounts for the principal retirement and related interest payments of the 2003 Series C lease revenue bonds and 2008 Series L lease revenue bonds. Revenue sources consist of interest earnings and transfers from the Morgan Hill Courthouse Capital Projects fund. General Obligation Bonds – accounts for the required principal retirement and related interest payments of the County’s General Obligation Bonds. These bonds were approved by Measure A to provide funding to rebuild, improve and seismic retrofit of Valley Medical Center. Revenue sources consist of interest earnings and property tax revenue collected to service debt. Qualified Energy Conservation Bonds – accounts for collection of investment interest earned by proceeds of 2011 Series A and B lease revenue bonds to be used for County’s solar electric systems project construction, and to finance lighting upgrades and lighting controls with Energy Efficient Systems and required principal retirements and related interest payments. Technology Bonds – accounts for collection of investment interest earned by proceeds of 2012 Series A lease revenue bonds to be used for various public capital improvements and projects relating to selected County technology projects.

Multiple Hospital Justice Morgan HillFacilities Facilities Facilities Courthouse
Bonds Bonds Bonds Bonds
Assets:Cash and investments:
Restricted with fiscal agents -$ -$ -$ 6$ Other restricted 12,763 - 6,848 -
Other receivables 13 - 6 -
Total assets 12,776$ -$ 6,854$ 6$
Fund Balances:Restricted 12,776$ -$ 6,854$ 6$
COUNTY OF SANTA CLARA
Combining Balance SheetNonmajor Debt Service Funds
June 30, 2014(In thousands)
150

Qualified General Energy
Obligation Conservation Technology Bonds Bonds Bonds Total
Assets:Cash and investments:
-$ -$ -$ 6$ Restricted with fiscal agents33,565 168 2,080 55,424 Other restricted
8 2 13 42 Other receivables
33,573$ 170$ 2,093$ 55,472$ Total assets
Fund Balances:33,573$ 170$ 2,093$ 55,472$ Restricted
COUNTY OF SANTA CLARA
Combining Balance SheetNonmajor Debt Service Funds
June 30, 2014(In thousands)
151

Multiple Hospital Justice Morgan HillFacilities Facilities Facilities Courthouse
Bonds Bonds Bonds BondsRevenues:
Taxes -$ -$ -$ -$ Fines, forfeitures, and penalties - - 6,023 - Interest and investment income 54 1 28 - Intergovernmental revenue - - - -
Total revenues 54 1 6,051 -
Expenditures: Debt service:
Principal retirement - 10,710 5,110 - Interest and fiscal charges - 1,134 975 318 Payment to bond refunding escrow - - - 1,090 Cost of issuance - - - 308
Total expenditures - 11,844 6,085 1,716
Excess (deficiency) of revenues over(under) expenditures 54 (11,843) (34) (1,716)
Other financing sources (uses):Bond premium - - - 909 Proceeds of refunding bonds - - - 11,715 Payment to bond refunding escrow - - (12,310) Transfers in - 834 - 1,408 Transfers out (115) - - (6)
Total other financing sources (uses) (115) 834 - 1,716
Net change in fund balances (61) (11,009) (34) -
Fund balances, beginning of year 12,837 11,009 6,888 6
Fund balances, end of year 12,776$ -$ 6,854$ 6$
COUNTY OF SANTA CLARA
Combining Statement of Revenues, Expenditures, and Changes in Fund BalancesNonmajor Debt Service Funds
For the Fiscal Year Ended June 30, 2014(In thousands)
152

Qualified General Energy
Obligation Conservation Technology Bonds Bonds Bonds Total
Revenues:13,208$ -$ -$ 13,208$ Taxes
- - - 6,023 Fines, forfeitures, and penalties34 13 61 191 Interest and investment income 68 - - 68 Intergovernmental revenue
13,310 13 61 19,490 Total revenues
Expenditures: Debt service:
1,100 - - 16,920 Principal retirement33,695 - - 36,122 Interest and fiscal charges
- - - 1,090 Payment to bond refunding escrow- - - 308 Cost of issuance
34,795 - - 54,440 Total expenditures
Excess (deficiency) of revenues over(21,485) 13 61 (34,950) (under) expenditures
Other financing sources (uses):- - - 909 Bond premium- - - 11,715 Proceeds of refunding bonds- - - (12,310) Payment to bond refunding escrow- - - 2,242 Transfers in- - - (121) Transfers out
- - - 2,435 Total other financing sources (uses)
(21,485) 13 61 (32,515) Net change in fund balances
55,058 157 2,032 87,987 Fund balances, beginning of year
33,573$ 170$ 2,093$ 55,472$ Fund balances, end of year
(In thousands)
COUNTY OF SANTA CLARA
Combining Statement of Revenues, Expenditures, and Changes in Fund BalancesNonmajor Debt Service Funds
For the Fiscal Year Ended June 30, 2014
153

Variance withFinal Budget
Original Final Actual PositiveBudget Budget Amount (Negative)
Budgetary fund balances, beginning of year 12,837$ 12,837$ 12,837$ -$
Resources (inflows):Interest and investment income - - 54 54
Charges to appropriations (outflows):Interfund transfers 115 115 115 - Reserves - 3 - 3
Total charges to appropriations 115 118 115 3
Budgetary fund balances, end of year 12,722$ 12,719$ 12,776$ 57$
Explanation of Differences between Budgetary Outflows and GAAP Expenditures: Uses/outflows of resources
Actual amounts (budgetary basis) "total charges to appropriations" from the budgetary comparison schedule 115$
Differences - budget to GAAP:Interfund transfers to other funds are outflows of budgetary resources
but are not expenditures for financial reporting purposes (115)
Total expenditures as reported on the statement of revenues, expenditures andchanges in fund balances - nonmajor debt service funds -$
(In thousands)
COUNTY OF SANTA CLARA
Budgetary Comparison ScheduleMultiple Facilities Bonds Fund
For the Fiscal Year Ended June 30, 2014
154

Variance withFinal Budget
Original Final Actual PositiveBudget Budget Amount (Negative)
Budgetary fund balances, beginning of year 11,009$ 11,009$ 11,009$ -$
Resources (inflows):Interest and investment income 18 18 1 (17) Interfund transfers 1,173 1,173 834 (339)
Total resources (inflows) available for appropriation 1,191 1,191 835 (356)
Charges to appropriations (outflows):Debt service:
Principal retirement 803 803 10,710 (9,907) Interest and fiscal charges 388 388 1,134 (746)
Reserves - 11,009 - 11,009
Total charges to appropriations 1,191 12,200 11,844 356
Budgetary fund balances, end of year 11,009$ -$ -$ -$
Explanation of Differences between Budgetary Inflows and GAAP Revenues: and Expenditures:
Sources/inflows of resourcesActual amounts (budgetary basis) "total resources"
from the budgetary comparison schedule 835$
Differences - budget to GAAP:Transfers from other funds are inflows of budgetary resources
but are not revenues for financial reporting purposes (834)
Total revenues as reported on the statement of revenues, expenditures andchanges in fund balances - nonmajor debt service funds 1$
(In thousands)
COUNTY OF SANTA CLARA
Budgetary Comparison ScheduleHospital Facilities Bonds Fund
For the Fiscal Year Ended June 30, 2014
155

Variance withFinal Budget
Original Final Actual PositiveBudget Budget Amount (Negative)
Budgetary fund balances, beginning of year 6,888$ 6,888$ 6,888$ -$
Resources (inflows):Fines, forfeitures, and penalties 6,020 6,020 6,023 3 Interest and investment income 65 65 28 (37)
Total resources (inflows) available for appropriation 6,085 6,085 6,051 (34)
Charges to appropriations (outflows):Debt service:
Principal retirement 5,110 5,110 5,110 - Interest and fiscal charges 975 975 975 - Reserves - 319 - 319
Total charges to appropriations 6,085 6,404 6,085 319
Budgetary fund balances, end of year 6,888$ 6,569$ 6,854$ 285$
(In thousands)
COUNTY OF SANTA CLARA
Budgetary Comparison ScheduleJustice Facilities Bonds Fund
For the Fiscal Year Ended June 30, 2014
156

Variance withFinal Budget
Original Final Actual PositiveBudget Budget Amount (Negative)
Budgetary fund balances, beginning of year 6$ 6$ 6$ -$
Resources (inflows):Interfund transfers - - 1,408 1,408
Charges to appropriations (outflows):Debt service:
Interest and fiscal charges - - 626 (626) Interfund transfers 6 6 6 -
Total charges to appropriations 6 6 632 (626)
Budgetary fund balances, end of year -$ -$ 782$ 782$
Explanation of Differences between Budgetary Outflows and GAAP Expenditures:
Sources/inflows of resourcesActual amounts (budgetary basis) "total resources"
from the budgetary comparison schedule 1,408$ Differences - budget to GAAP:
Transfers from other funds are inflows of budgetary resourcesbut are not revenues for financial reporting purposes (1,408)
Differences - budget to GAAP:Total revenues as reported on the statement of revenues, expenditures andchanges in fund balances - nonmajor debt service funds -$
Uses/outflows of resourcesActual amounts (budgetary basis) "total charges to appropriations"
from the budgetary comparison schedule 632$
Differences - budget to GAAP:Payment to bond refunding escrow are expenditures for financial reporting purposes
but are not outflows of budgetary resources 1,090 Interfund transfers to other funds are outflows of budgetary resources
but are not expenditures for financial reporting purposes (6)
Total expenditures as reported on the statement of revenues, expenditures andchanges in fund balances - nonmajor debt service funds 1,716$
(In thousands)
COUNTY OF SANTA CLARA
Budgetary Comparison ScheduleMorgan Hill Courthouse Bonds Fund
For the Fiscal Year Ended June 30, 2014
157

Variance withFinal Budget
Original Final Actual PositiveBudget Budget Amount (Negative)
Budgetary fund balances, beginning of year 55,058$ 55,058$ 55,058$ -$
Resources (inflows):Taxes 16,781 16,781 13,208 (3,573) Interest and investment income - - 34 34 Intergovernmental revenues - - 68 68
Total resources (inflows) available for appropriation 34,804 34,804 13,310 (21,494)
Charges to appropriations (outflows):Debt service:
Principal retirement 1,100 1,100 1,100 - Interest and fiscal charges 33,704 33,704 33,695 9 Interfund transfers 18,023 18,023 - 18,023 Reserves - 37,035 - 37,035
Total charges to appropriations 52,827 89,862 34,795 55,067
Budgetary fund balances, end of year 37,035$ -$ 33,573$ 33,573$
(In thousands)
COUNTY OF SANTA CLARA
Budgetary Comparison ScheduleGeneral Obligation Bonds Fund
For the Fiscal Year Ended June 30, 2014
158
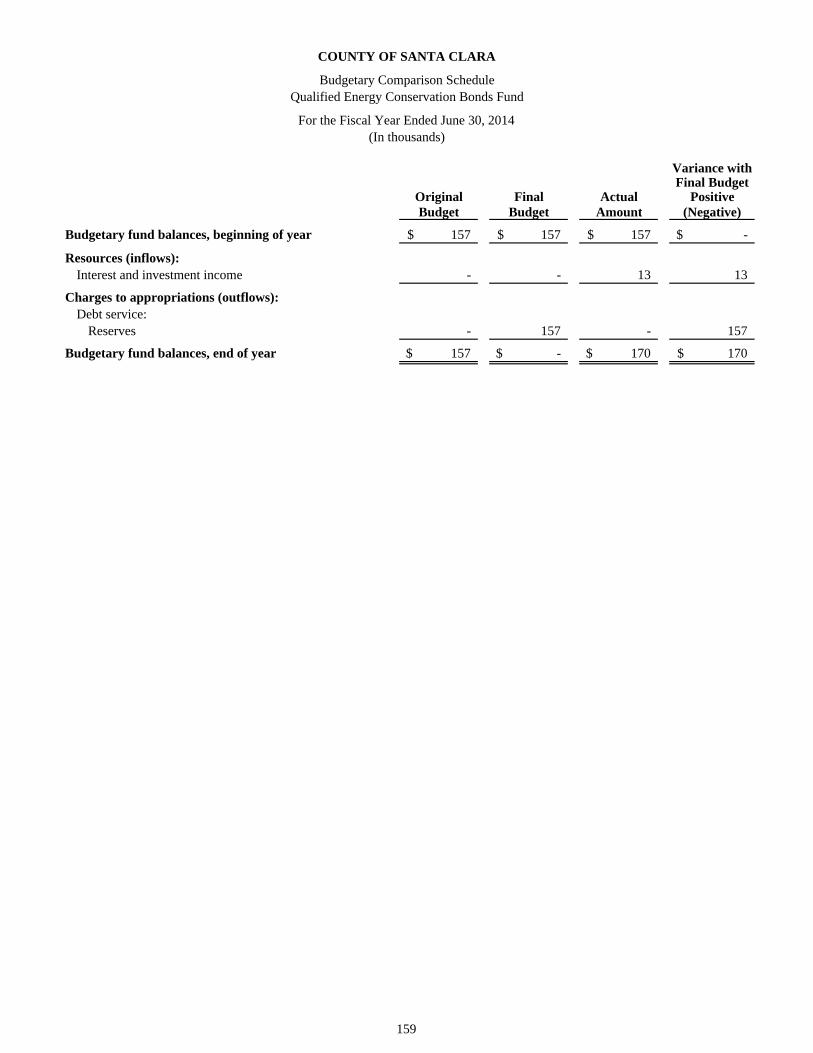
Variance withFinal Budget
Original Final Actual PositiveBudget Budget Amount (Negative)
Budgetary fund balances, beginning of year 157$ 157$ 157$ -$
Resources (inflows):Interest and investment income - - 13 13
Charges to appropriations (outflows):Debt service:
Reserves - 157 - 157
Budgetary fund balances, end of year 157$ -$ 170$ 170$
COUNTY OF SANTA CLARA
Budgetary Comparison ScheduleQualified Energy Conservation Bonds Fund
For the Fiscal Year Ended June 30, 2014(In thousands)
159

Variance withFinal Budget
Original Final Actual PositiveBudget Budget Amount (Negative)
Budgetary fund balances, beginning of year 2,032$ 2,032$ 2,032$ -$
Resources (inflows):Interest and investment income - - 61 61
Charges to appropriations (outflows):Debt service:
Reserves - 2,032 - 2,032
Budgetary fund balances, end of year 2,032$ -$ 2,093$ 2,093$
COUNTY OF SANTA CLARA
Budgetary Comparison ScheduleTechnology Bonds Fund
For the Fiscal Year Ended June 30, 2014(In thousands)
160

Nonmajor Capital
Project Funds

This page intentionally left blank.

COUNTY OF SANTA CLARA
Nonmajor Governmental Funds
161
Capital Projects Funds
Capital Projects Funds are used to account for and report financial resources that are restricted, committed or assigned to expenditure for capital outlays, including the acquisition or construction of capital facilities and other capital assets. The following summarizes the County’s Capital Projects Funds: General Capital Improvement Fund – accounts for general improvements to County facilities, including the reconstruction and expansion of major capital facilities owned or leased by the County. Revenue sources consist of proceeds from the use and sale of property, interest earnings, and contributions from other County funds. Parks Acquisition and Development – accounts for the acquisition, development, and maintenance of County parks. The source of revenue is primarily property taxes. Qualified Energy Conservation Bonds – accounts for installation, implementation and construction of solar electric systems, lighting upgrades, and lighting controls with Energy Efficient Systems for the County. The projects are financed by proceeds of 2011 Series A and B lease revenue bonds. Technology Bonds – accounts for various public capital improvements and projects relating to selected County technology projects. The projects are financed by proceeds of 2012 Series A lease revenue bonds.

Parks QualifiedGeneral Acquisition EnergyCapital and Conservation Technology
Improvement Development Bonds Bonds Total
Assets:Cash and investments:
Unrestricted 56,406$ 77,155$ 1,373$ 8,826$ 143,760$ Other receivables 193 119 - - 312 Due from other funds 2,495 - - - 2,495
Total assets 59,094$ 77,274$ 1,373$ 8,826$ 146,567$
Liabilities and Fund Balances:Liabilities:
Accounts payable 7,692$ 1,942$ -$ -$ 9,634$ Other accrued liabilities - 3,000 - - 3,000 Due to other funds - - 2 - 2
Total liabilities 7,692 4,942 2 - 12,636
Fund Balances:Restricted - 72,332 1,371 8,826 82,529 Committed 51,402 - - - 51,402
Total fund balances 51,402 72,332 1,371 8,826 133,931
Total liabilities and fund balances 59,094$ 77,274$ 1,373$ 8,826$ 146,567$
COUNTY OF SANTA CLARA
Combining Balance Sheet
June 30, 2014 (In thousands)
Nonmajor Capital Projects Funds
162

Parks QualifiedGeneral Acquisition EnergyCapital and Conservation Technology
Improvement Development Bonds Bonds TotalRevenues:
Taxes -$ 8,457$ -$ -$ 8,457$ Fines, forfeitures, and penalties - 70 - - 70 Interest and investment income 127 528 - - 655 Intergovernmental revenues - 567 - - 567 Charges for services - 50 - - 50 Other revenue 4 25 - - 29
Total revenues 131 9,697 - - 9,828
Expenditures:Capital outlay 33,406 24,862 - - 58,268
Excess (deficiency) of revenues over(under) expenditures (33,275) (15,165) - - (48,440)
Other financing sources (uses):Proceeds from sales of capital assets - 71 - - 71 Transfers in 55,545 951 - - 56,496 Transfers out (333) - (2,220) (4,702) (7,255)
Total other financing sources (uses) 55,212 1,022 (2,220) (4,702) 49,312
Net change in fund balances 21,937 (14,143) (2,220) (4,702) 872
Fund balances, beginning of year 29,465 86,475 3,591 13,528 133,059
Fund balances, end of year 51,402$ 72,332$ 1,371$ 8,826$ 133,931$
(In thousands)
COUNTY OF SANTA CLARA
Combining Statement of Revenues, Expenditures, and Changes in Fund BalancesNonmajor Capital Projects Funds
For the Fiscal Year Ended June 30, 2014
163

Variance withFinal Budget
Original Final Actual PositiveBudget Budget Amount (Negative)
Budgetary fund balances, beginning of year 29,465$ 29,465$ 29,465$ -$
Resources (inflows):Interest and investment income - - 127 127 Other revenue 44 35 4 (31) Interfund transfers 78,849 84,216 55,545 (28,671)
Total resources (inflows) available for appropriation 78,893 84,251 55,676 (28,575)
Charges to appropriations (outflows):
Capital outlay 107,788 88,548 35,929 52,619 Interfund transfers - 333 333 -
Total charges to appropriations 107,788 88,881 36,262 52,619
Budgetary fund balances, end of year 570$ 24,835$ 48,879$ 24,044$
Explanation of Differences between Budgetary Inflows and Outflows and GAAP Revenues and Expenditures:
Sources/inflows of resourcesActual amounts (budgetary basis) "total resources"
from the budgetary comparison schedule 55,676$
Differences - budget to GAAP:Interfund transfers from other funds are inflows of budgetary resources
but are not revenues for financial reporting purposes (55,545)
Total revenues as reported on the statement of revenues, expenditures andchanges in fund balances - nonmajor capital projects funds 131$
Uses/outflows of resourcesActual amounts (budgetary basis) "total charges to appropriations"
from the budgetary comparison schedule 36,262$
Differences - budget to GAAP:Encumbrances for services and supplies ordered but not received is reported
in the year the order is placed for budgetary purposes, but in the year servicesis incurred or supplies received for financial reporting purposes (2,523)
Total expenditures as reported on the statement of revenues, expenditures andchanges in fund balances - nonmajor capital projects funds 33,406$
(In thousands)
COUNTY OF SANTA CLARA
Budgetary Comparison ScheduleGeneral Capital Improvement Fund
For the Fiscal Year Ended June 30, 2014
164

Variance withFinal Budget
Original Final Actual PositiveBudget Budget Amount (Negative)
Budgetary fund balances, beginning of year 86,475$ 86,475$ 86,475$ -$
Resources (inflows):Taxes 7,976 7,976 8,457 481 Fines, forfeitures, and penalties - - 70 70 Interest and investment income 1,100 1,100 528 (572) Intergovernmental revenues 57 57 567 510 Charges for services - - 50 50 Other revenue - - 25 25 Interfund transfers 1,690 1,690 951 (739) Other financing sources - - 71 71
Total resources (inflows) available for appropriation 10,823 10,823 10,719 (104)
Charges to appropriations (outflows):Recreation:
Services and supplies 368 368 161 207 Capital outlay 82,840 83,090 35,146 47,944 Interfund transfers 90 90 - 90 Reserves - 86,940 - 86,940
Total charges to appropriations 83,298 170,488 35,307 135,181
Budgetary fund balances, end of year 14,000$ (73,190)$ 61,887$ 135,077$
Explanation of Differences between Budgetary Inflows and Outflows and GAAP Revenues and Expenditures:
Sources/inflows of resourcesActual amounts (budgetary basis) "total resources"
from the budgetary comparison schedule 10,719$
Differences - budget to GAAP:Proceeds from sale of capital assets are inflows of budgetary resources
but are not revenues for financial reporting purposes (71)
Interfund transfers from other funds are inflows of budgetary resourcesbut are not revenues for financial reporting purposes (951)
Total revenues as reported on the statement of revenues, expenditures andchanges in fund balances - nonmajor capital projects funds 9,697$
Uses/outflows of resourcesActual amounts (budgetary basis) "total charges to appropriations"
from the budgetary comparison schedule 35,307$
Differences - budget to GAAP:Encumbrances for services and supplies ordered but not received is reported
in the year the order is placed for budgetary purposes, but in the year servicesis incurred or supplies received for financial reporting purposes (10,445)
Total expenditures as reported on the statement of revenues, expenditures andchanges in fund balances - nonmajor capital projects funds 24,862$
(In thousands)
COUNTY OF SANTA CLARA
Budgetary Comparison ScheduleParks Acquisition and Development Fund
For the Fiscal Year Ended June 30, 2014
165

Variance withFinal Budget
Original Final Actual PositiveBudget Budget Amount (Negative)
Budgetary fund balances, beginning of year 3,591$ 3,591$ 3,591$ -$
Charges to appropriations (outflows):Capital outlay - 1,008 1,008 - Interfund transfers 3,558 2,550 2,219 331
Total charges to appropriations 3,558 3,558 3,227 331
Budgetary fund balances, end of year 33$ 33$ 364$ 331$
Explanation of Differences between Budgetary Inflows and Outflows and GAAP Revenues and Expenditures:
Uses/outflows of resourcesActual amounts (budgetary basis) "total charges to appropriations"
from the budgetary comparison schedule 3,227$
Differences - budget to GAAP:Interfund transfers to other funds are outflows of budgetary resources but
are not expenditures for financial reporting purposes (2,219)
Encumbrances for capital outlay that are reported for budgetary purpose but are not expenditures for financial reporting purpose (1,008)
Total expenditures as reported on the statement of revenues, expenditures andchanges in fund balances - nonmajor capital projects funds -$
(In thousands)
COUNTY OF SANTA CLARA
Budgetary Comparison ScheduleQualified Energy Conservation Bonds Fund
For the Fiscal Year Ended June 30, 2014
166

Variance withFinal Budget
Original Final Actual PositiveBudget Budget Amount (Negative)
Budgetary fund balances, beginning of year 13,528$ 13,528$ 13,528$ -$
Charges to appropriations (outflows):Interfund transfers 13,528 13,528 4,703 8,825
Budgetary fund balances, end of year -$ -$ 8,825$ 8,825$
Explanation of Differences between Budgetary Inflows and Outflows and GAAP Revenues and Expenditures:
Uses/outflows of resourcesActual amounts (budgetary basis) "total charges to appropriations"
from the budgetary comparison schedule 4,703$
Differences - budget to GAAP:Interfund transfers to other funds are outflows of budgetary resources but
are not expenditures for financial reporting purposes (4,703)
Total expenditures as reported on the statement of revenues, expenditures andchanges in fund balances - nonmajor capital projects funds -$
COUNTY OF SANTA CLARA
Budgetary Comparison ScheduleTechnology Bond Fund
For the Fiscal Year Ended June 30, 2014(In thousands)
167

168
This page intentionally left blank.

Nonmajor Enterprise Funds

This page intentionally left blank.
COUNTY OF SANTA CLARA
Nonmajor Enterprise Funds
169
Enterprise Funds account for operations that operate in a manner similar to private business enterprises where the intent of the governing body is that the costs of providing goods and services to the general public on a continuing basis be financed primarily through user charges. The following summarizes the County’s nonmajor Enterprise Funds: Airport – accounts for the maintenance and operation of the County airports. Revenues consist primarily of user service charges. Sanitation District – accounts for the operation of the County Sanitation District 2 – 3 of Santa Clara County. Revenues consist primarily of user service charges. Valley Health Plan – provides health insurance services to large employer groups, such as Santa Clara County and individuals insured under various plans such as Covered California, and is delegated by Santa Clara Family Health Plan (SCFHP) to provide health insurance to Medi-Cal members. Revenues are primarily received from employer groups, individual premiums, SCFHP, and other sources.

COUNTY OF SANTA CLARA
Combining Statement of Fund Net PositionNonmajor Enterprise Funds
June 30, 2014
(In thousands)
Sanitation ValleyAssets Airport District Health Plan TotalCurrent assets:
Cash and investments:Unrestricted 2,106$ 7,076$ 46,410$ 55,592$ Restricted with fiscal agent 775 - - 775
Other receivables 125 6 596 727 Due from other funds - - 1,370 1,370
Total current assets 3,006 7,082 48,376 58,464
Noncurrent assets:Other assets - 22 - 22 Capital assets:
Nondepreciable 4,182 - - 4,182 Depreciable 11,630 1,285 9,317 22,232
Capital assets, net 15,812 1,285 9,317 26,414
Total noncurrent assets 15,812 1,307 9,317 26,436
Total assets 18,818 8,389 57,693 84,900
LiabilitiesCurrent liabilities:
Accounts payable 119 742 23,698 24,559 Accrued salaries and benefits 29 - 347 376 Accrued liabilities 159 3 5,282 5,444 Due to other funds - - 936 936 Unearned revenue 64 - 5,375 5,439 Current portion of accrued
vacation and sick leave 8 - 72 80 Current portion of bonds payable 219 - - 219
Total current liabilities 598 745 35,710 37,053
Noncurrent liabilities:Noncurrent portion of accrued
vacation and sick leave 113 - 907 1,020 Noncurrent portion of bonds payable 4,366 - - 4,366
Total noncurrent liabilities 4,479 - 907 5,386
Total liabilities 5,077 745 36,617 42,439
Net PositionNet investment in capital assets 11,227 1,285 9,317 21,829 Restricted for debt service 333 - - 333 Unrestricted 2,181 6,359 11,759 20,299
Total net position 13,741$ 7,644$ 21,076$ 42,461$
170

Sanitation ValleyAirport District Health Plan Total
Operating revenues:Charges for service 3,039$ 2,371$ 281,583$ 286,993$
Operating expenses:Salaries and benefits 1,331 - 10,824 12,155 Services and supplies 1,164 9 265,332 266,505 Professional services - 510 - 510 Depreciation and amortization 845 37 9 891 Insurance - 43 - 43 Other - 1,219 1 1,220
Total operating expenses 3,340 1,818 276,166 281,324
Operating income (loss) (301) 553 5,417 5,669
Nonoperating revenues (expenses):Interest income 12 26 235 273 Interest expense (227) - - (227) Loss on disposal of capital assets (189) - - (189) Other, net - - 4 4
Total nonoperating revenues (expenses), net (404) 26 239 (139)
Income (loss) before transfers (705) 579 5,656 5,530
Transfers in 25 - 17,420 17,445 Transfers out - - (2,000) (2,000)
Change in net position (680) 579 21,076 20,975
Net position, beginning of year 14,421 7,065 - 21,486
Net position, end of year 13,741$ 7,644$ 21,076$ 42,461$
(In thousands)
COUNTY OF SANTA CLARA
Combining Statement of Revenues, Expenses, and Changes in Fund Net PositionNonmajor Enterprise Funds
For the Fiscal Year Ended June 30, 2014
171

Sanitation ValleyAirport District Health Plan Total
Cash flows from operating activities:Cash receipts from customers and users 3,005$ 2,371$ 282,051$ 287,427$ Cash payment to suppliers for goods and services (1,021) (1,888) (245,166) (248,075) Cash payment to employees for services (1,325) - (10,562) (11,887) Other receipts - - 4 4
Net cash provided by operating activities 659 483 26,327 27,469
Cash flows from noncapital financing activities:Transfers in 25 - 32,512 32,537 Transfers out - - (2,000) (2,000) Cash payments to other funds - - (1,370) (1,370)
Net cash provided by noncapital financing activities 25 - 29,142 29,167
Cash flows from capital and related financing activities:Repayment of bonds (185) - - (185) Interest paid (227) - - (227) Acquisition of capital assets (56) (97) (9,294) (9,447)
Net cash used in capital and related financing activities (468) (97) (9,294) (9,859)
Cash flows from investing activities:Investment income received 12 26 235 273
Net change in cash and cash equivalents 228 412 46,410 47,050
Cash and cash equivalents, beginning of year 2,653 6,664 - 9,317
Cash and cash equivalents, end of year 2,881$ 7,076$ 46,410$ 56,367$
Cash and cash equivalents:Cash and investments:
Unrestricted 2,106$ 7,076$ 46,410$ 55,592$ Restricted with fiscal agent 775 - - 775
Total cash and cash equivalents 2,881$ 7,076$ 46,410$ 56,367$
Reconciliation of operating income (loss) to net cash provided by operating activities:Operating income (loss) (301)$ 553$ 5,417$ 5,669$ Adjustments to reconcile operating income (loss)
to net cash provided by operating activities:Depreciation and amortization 845 37 9 891 Miscellaneous nonoperating revenues - - 4 4 Decrease (increase) in assets:
Receivables (18) - (547) (565) Prepaid and other assets 142 (1) - 141
Increase (decrease) in liabilities:Accounts payable (3) (105) 19,136 19,028 Accrued salaries and benefits 6 - 113 119 Accrued liabilities 4 (1) 1,031 1,034 Accrued vacation and sick leave - - 149 149 Unearned revenue (16) - 1,015 999
Net cash provided by operating activities 659$ 483$ 26,327$ 27,469$
Supplemental disclosure of noncash noncapital related financing activities:
Transfer of current assets from other funds -$ -$ 49$ 49$ Transfer of capital assets from other funds - - 32 32 Transfer of current liabilities from other funds - - 14,413 14,413 Transfer of noncurrent liabilities from other funds - - 760 760
(In thousands)
COUNTY OF SANTA CLARA
Combining Statement of Cash FlowsNonmajor Enterprise Funds
For the Fiscal Year Ended June 30, 2014
172

Internal Service Funds

This page intentionally left blank.

COUNTY OF SANTA CLARA
Internal Service Funds
173
Internal Service Funds account for the financing of goods and services by one department or agency to other departments or agencies of the County, or to other governments, on a cost – reimbursement basis. Internal Service Funds bill users for services provided. The following are the County’s Internal Service Funds: Information Services – accounts for centralized information management services. Fleet Management – accounts for vehicles and maintenance service provided to County departments. Insurance – accounts for liability claims against the County, the administration of the insurance program, and associated legal and adjustment expenses. Printing – accounts for printing service functions such as reproduction, layouts and forms. Unemployment Insurance – accounts for unemployment compensation claims filed against the County. Workers’ Compensation – accounts for disability, medical, and rehabilitation expenses and related costs associated with on-the-job injuries. Employee Benefits – accounts for employee life insurance and dental insurance benefits related to the settlement of employee claims. Retiree Healthcare – accounts for contributions from the County and its employees and earnings from investments. Disbursements are made to retirees for healthcare, disability and death benefits (based on a defined benefit formula) and administrative expenses. Pension Obligation – accounts for the issuance of pension obligation bonds to pay a portion of the County’s unfunded actuarial accrued liability (UAAL). Contributions will be collected from departments through bi-weekly payroll and debt service payments will be made on the pension obligation bonds.

Information Fleet UnemploymentServices Management Insurance Printing Insurance
Assets:Current assets:
Cash and investments:Unrestricted 14,961$ 9,376$ 25,916$ 1,118$ 4,064$ Restricted with fiscal agent - - 14,177 - - Other restricted - - - - -
Accounts receivable, net 23 368 157 1 48 Due from other funds 12 1 - - - Due from other governmental agencies 62 - - - - Inventories 222 1,029 - 148 - Prepaid rent/insurance 802 - 1,216 - -
Total current assets 16,082 10,774 41,466 1,267 4,112
Noncurrent assets:Net pension asset - - - - - Other assets - - - - - Capital assets:
Nondepreciable - 1,295 - - - Depreciable 2,098 5,426 - 72 -
Total noncurrent assets 2,098 6,721 - 72 -
Total assets 18,180 17,495 41,466 1,339 4,112
Liabilities:Current liabilities:
Accounts payable 4,821 349 1,386 83 3 Accrued salaries and benefits 669 135 29 24 - Accrued liabilities - - - - - Due to other funds - - - - - Due to other governmental agencies 12 1 - - - Current portion of insurance claims - - 11,087 - 1,448 Current portion of accrued vacation and sick leave 277 44 5 3 - Current portion of bonds payable - - - - -
Total current liabilities 5,779 529 12,507 110 1,451
Noncurrent liabilities:Noncurrent portion of insurance claims - - 17,831 - - Noncurrent portion of accrued vacation and sick leave 3,802 582 167 216 - Noncurrent portion of bonds payable - - - - - Net OPEB obligation - - - - -
Total noncurrent liabilities 3,802 582 17,998 216 -
Total liabilities 9,581 1,111 30,505 326 1,451
Net Position:Net investment in capital assets 2,098 6,721 - 72 - Unrestricted (deficit) 6,501 9,663 10,961 941 2,661
Total net position (deficit) 8,599$ 16,384$ 10,961$ 1,013$ 2,661$
June 30, 2014(In thousands)
COUNTY OF SANTA CLARA
Combining Statement of Fund Net PositionInternal Service Funds
174

Workers’ Employee Retiree Pension Compensation Benefits Healthcare Obligation Total
Assets:Current assets:
Cash and investments:61,981$ 4,607$ 45,923$ -$ 167,946$ Unrestricted
- - - - 14,177 Restricted with fiscal agent- 511 - - 511 Other restricted
3,120 555 268 501 5,041 Accounts receivable, net8 - - - 21 Due from other funds- 1,195 373 - 1,630 Due from other governmental agencies- - - - 1,399 Inventories- - - - 2,018 Prepaid rent/insurance
65,109 6,868 46,564 501 192,743 Total current assets
Noncurrent assets:- - - 377,513 377,513 Net pension asset- - - 971 971 Other assets
Capital assets:- - - - 1,295 Nondepreciable- - - - 7,596 Depreciable
- - - 378,484 387,375 Total noncurrent assets
65,109 6,868 46,564 378,985 580,118 Total assets
Liabilities:Current liabilities:
841 1,318 2 4 8,807 Accounts payable96 - - - 953 Accrued salaries and benefits
- - - 7,254 7,254 Accrued liabilities170 - - 744 914 Due to other funds
1 - - - 14 Due to other governmental agencies25,622 2,565 - - 40,722 Current portion of insurance claims
10 - - - 339 Current portion of accrued vacation and sick leave- - - 5,950 5,950 Current portion of bonds payable
26,740 3,883 2 13,952 64,953 Total current liabilities
Noncurrent liabilities:83,316 - - - 101,147 Noncurrent portion of insurance claims
406 - - - 5,173 Noncurrent portion of accrued vacation and sick leave - - - 412,387 412,387 Noncurrent portion of bonds payable- - 236,891 - 236,891 Net OPEB obligation
83,722 - 236,891 412,387 755,598 Total noncurrent liabilities
110,462 3,883 236,893 426,339 820,551 Total liabilities
Net position:- - - - 8,891 Net investment in capital assets
(45,353) 2,985 (190,329) (47,354) (249,324) Unrestricted (deficit)
(45,353)$ 2,985$ (190,329)$ (47,354)$ (240,433)$ Total net position (deficit)
June 30, 2014 (In thousands)
Combining Statement of Fund Net Position
COUNTY OF SANTA CLARA
Internal Service Funds
175
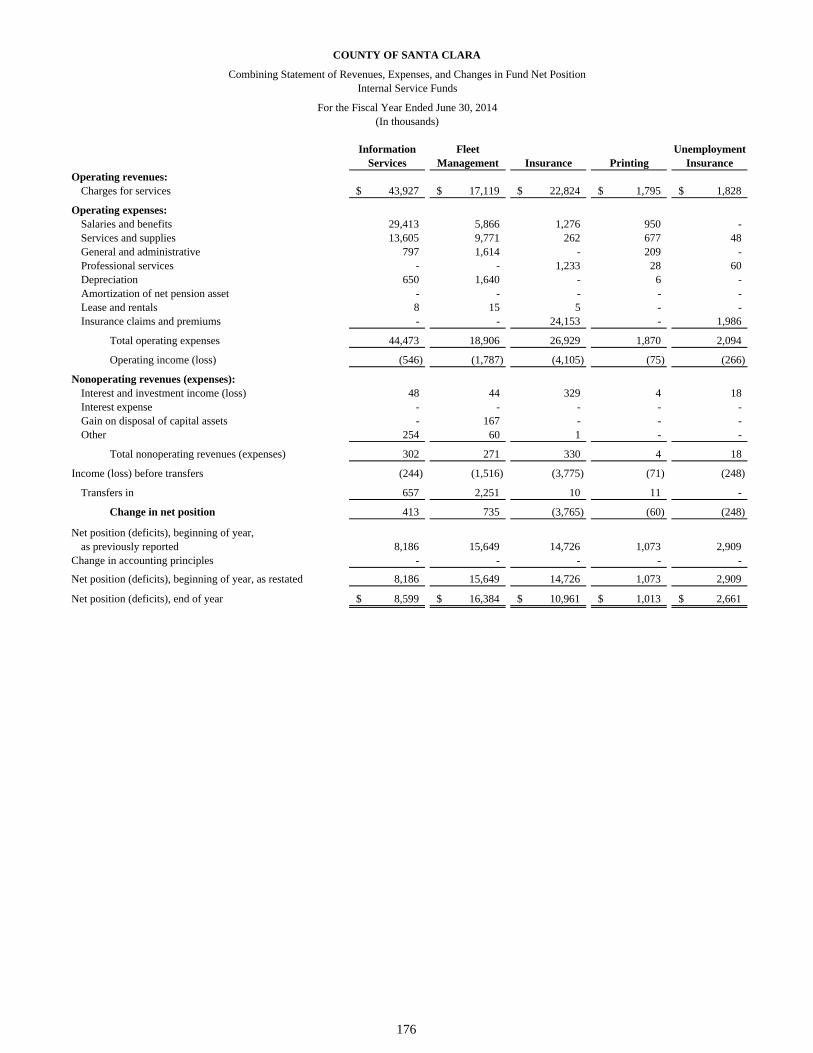
Information Fleet UnemploymentServices Management Insurance Printing Insurance
Operating revenues:Charges for services 43,927$ 17,119$ 22,824$ 1,795$ 1,828$
Operating expenses:Salaries and benefits 29,413 5,866 1,276 950 - Services and supplies 13,605 9,771 262 677 48 General and administrative 797 1,614 - 209 - Professional services - - 1,233 28 60 Depreciation 650 1,640 - 6 - Amortization of net pension asset - - - - - Lease and rentals 8 15 5 - - Insurance claims and premiums - - 24,153 - 1,986
Total operating expenses 44,473 18,906 26,929 1,870 2,094
Operating income (loss) (546) (1,787) (4,105) (75) (266)
Nonoperating revenues (expenses):Interest and investment income (loss) 48 44 329 4 18 Interest expense - - - - - Gain on disposal of capital assets - 167 - - - Other 254 60 1 - -
Total nonoperating revenues (expenses) 302 271 330 4 18
Income (loss) before transfers (244) (1,516) (3,775) (71) (248)
Transfers in 657 2,251 10 11 -
Change in net position 413 735 (3,765) (60) (248)
Net position (deficits), beginning of year,as previously reported 8,186 15,649 14,726 1,073 2,909
Change in accounting principles - - - - -
Net position (deficits), beginning of year, as restated 8,186 15,649 14,726 1,073 2,909
Net position (deficits), end of year 8,599$ 16,384$ 10,961$ 1,013$ 2,661$
COUNTY OF SANTA CLARA
Combining Statement of Revenues, Expenses, and Changes in Fund Net Position Internal Service Funds
(In thousands)For the Fiscal Year Ended June 30, 2014
176

Workers’ Employee Retiree Pension Compensation Benefits Healthcare Obligation Total
Operating revenues:36,878$ 16,248$ 117,370$ 22,530$ 280,519$ Charges for services
Operating expenses:4,106 - 179,418 - 221,029 Salaries and benefits5,313 1,132 69 - 30,877 Services and supplies
368 253 1,015 - 4,256 General and administrative- - - - 1,321 Professional services- - - - 2,296 Depreciation- - - (3,635) (3,635) Amortization of net pension asset- - - - 28 Lease and rentals
41,857 20,484 - - 88,480 Insurance claims and premiums
51,644 21,869 180,502 (3,635) 344,652 Total operating expenses
(14,766) (5,621) (63,132) 26,165 (64,133) Operating income (loss)
Nonoperating revenues (expenses):510 34 2,005 (32) 2,960 Interest and investment income (loss)
- (3) - (26,116) (26,119) Interest expense- - - - 167 Gain on disposal of capital assets
51 - - - 366 Other
561 31 2,005 (26,148) (22,626) Total nonoperating revenues (expenses)
(14,205) (5,590) (61,127) 17 (86,759) Income (loss) before transfers
31 - - - 2,960 Transfers in
(14,174) (5,590) (61,127) 17 (83,799) Change in net position
Net position (deficits), beginning of year,(31,179) 8,575 (129,202) (46,114) (155,377) as previously reported
- - - (1,257) (1,257) Change in accounting principles
(31,179) 8,575 (129,202) (47,371) (156,634) Net position (deficits), beginning of year, as restated
(45,353)$ 2,985$ (190,329)$ (47,354)$ (240,433)$ Net position (deficits), end of year
COUNTY OF SANTA CLARA
Combining Statement of Revenues, Expenses, and Changes in Fund Net Assets Internal Service Funds
For the Fiscal Year Ended June 30, 2014 (In thousands)
177

Information Fleet UnemploymentServices Management Insurance Printing Insurance
Cash flows from operating activities:Cash receipts from customers and users 46,327$ 17,171$ 22,845$ 1,797$ 1,846$ Cash payment to suppliers for goods and services (11,698) (11,811) (1,390) (858) (108) Cash payment to employees for services (27,926) (5,777) (1,266) (920) - Cash payment for retirement benefits - - - - - Cash payment for judgments and claims - - (18,853) - (2,074) Other receipts 254 60 1 - -
Net cash provided by (used in) operating activities 6,957 (357) 1,337 19 (336)
Cash flows from noncapital financing activities: Cash receipts from short term borrowing from other funds - - - - - Principal paid on pension obligation bonds - - - - - Interest paid on pension obligation bonds - - - - - Transfers in 657 2,251 10 11 -
Net cash provided by (used in) noncapital financing activities 657 2,251 10 11 -
Cash flows from capital and related financing activities:Interest paid - - - - - Acquisition of capital assets (1,519) (4,055) - (58) - Proceeds from sale of capital assets - 175 - - -
Net cash used in capital and related financing activities (1,519) (3,880) - (58) -
Cash flows from investing activities:Proceeds from sale of investments - - - - - Investment income received 48 44 329 4 18 Investment expenses paid - - - - -
Net cash provided by (used in) investing activities 48 44 329 4 18
Net change in cash and cash equivalents 6,143 (1,942) 1,676 (24) (318)
Cash and cash equivalents, beginning of year 8,818 11,318 38,417 1,142 4,382
Cash and cash equivalents, end of year 14,961$ 9,376$ 40,093$ 1,118$ 4,064$
Cash and cash equivalents:Cash and investments:
Unrestricted 14,961$ 9,376$ 25,916$ 1,118$ 4,064$ Restricted with fiscal agent - - 14,177 - - Other restricted - - - - - Less deposits and investments not meeting the
definition of cash and cash equivalents - - - - -
Cash and cash equivalents 14,961$ 9,376$ 40,093$ 1,118$ 4,064$
Reconciliation of operating income (loss) to net cash provided by (used in) operating activities:Operating income (loss) (546)$ (1,787)$ (4,105)$ (75)$ (266)$ Adjustments to reconcile operating income (loss) to net cash
provided by (used in) operating activities:Depreciation 650 1,640 - 6 - Amortization of net pension asset - - - - - Miscellaneous nonoperating income 254 60 1 - - Decrease (increase) in assets:
Receivables (4) 53 21 - 18 Due from other funds 2,441 (1) - - - Due from other governmental agencies (37) - - 2 - Inventories (3) (201) - 9 - Prepaid rent/insurance (275) - 110 - -
Increase (decrease) in liabilities:Accounts payable 2,978 (210) (13) 47 - Accrued liabilities 278 32 9 6 - Accrued vacation and sick leave 1,209 57 1 24 - Insurance claims - - 5,313 - (88) Due to other governmental agencies 12 - - - - Due to other funds - - - - - Net OPEB obligation - - - - -
Net cash provided by (used in) operating activities 6,957$ (357)$ 1,337$ 19$ (336)$
Supplemental disclosure of noncash investing activities:Net depreciation in investments reported at
fair value but not considered cash and cash equivalents -$ -$ -$ -$ -$
Supplemental disclosure of noncash noncapital financing activities:financing activities:Accretion of interest on capital appreciation bonds -$ -$ -$ -$ -$
(In thousands)
COUNTY OF SANTA CLARA
Combining Statement of Cash FlowsInternal Service Funds
For the Fiscal Year Ended June 30, 2014
178

Workers’ Employee Retiree Pension Compensation Benefits Healthcare Obligation Total
Cash flows from operating activities:37,086$ 14,498$ 120,109$ 22,469$ 284,148$ Cash receipts from customers and users(5,335) (1,191) (1,244) - (33,635) Cash payment to suppliers for goods and services(4,023) - - - (39,912) Cash payment to employees for services
- - (227,893) - (227,893) Cash payment for retirement benefits(23,519) (20,110) - - (64,556) Cash payment for judgments and claims
51 - - - 366 Other receipts
4,260 (6,803) (109,028) 22,469 (81,482) Net cash provided by (used in) operating activities
Cash flows from noncapital financing activities:- - - 105 105 Cash receipts from short term borrowing from other funds- - - (3,576) (3,576) Principal paid on pension obligation bonds- - - (18,968) (18,968) Interest paid on pension obligation bonds
31 - - - 2,960 Transfers in
31 - - (22,439) (19,479) Net cash provided by (used in) noncapital financing activities
Cash flows from capital and related financing activities:- (3) - - (3) Interest paid- - - - (5,632) Acquisition of capital assets- - - - 175 Proceeds from sale of capital assets
- (3) - - (5,460) Net cash used in capital and related financing activities
Cash flows from investing activities:- - 126,160 - 126,160 Proceeds from sale of investments
510 34 8,607 - 9,594 Investment income received- - - (32) (32) Investment expenses paid
510 34 134,767 (32) 135,722 Net cash provided by (used in) investing activities
4,801 (6,772) 25,739 (2) 29,301 Net change in cash and cash equivalents
57,180 11,430 19,174 2 151,863 Cash and cash equivalents, beginning of year
61,981$ 4,658$ 44,913$ -$ 181,164$ Cash and cash equivalents, end of year
Cash and cash equivalents:Cash and investments:
61,981$ 4,607$ 45,923$ -$ 167,946$ Unrestricted- - - - 14,177 Restricted with fiscal agent- 511 - - 511 Other restricted
Less deposits and investments not meeting the- - (1,010) - (1,010) definition of cash and cash equivalents
61,981$ 5,118$ 44,913$ -$ 181,624$ Cash and cash equivalents
Reconciliation of operating income (loss) to net cash provided by (used in) operating activities:
(14,766)$ (5,621)$ (63,132)$ 26,165$ (64,133)$ Operating income (loss)Adjustments to reconcile operating (loss) to net cash
provided by (used in) operating activities:- - - - 2,296 Depreciation- - - (3,635) (3,635) Amortization of net pension asset
51 - - - 366 Miscellaneous nonoperating incomeDecrease (increase) in assets:
216 (555) 838 (61) 526 Receivables(8) - - - 2,432 Due from other funds
- (1,195) 22 - (1,208) Due from other governmental agencies- - - - (195) Inventories- - - - (165) Prepaid rent/insurance
Increase (decrease) in liabilities:175 194 (160) - 3,011 Accounts payable32 - - - 357 Accrued liabilities51 - - - 1,342 Accrued vacation and sick leave
18,338 374 - - 23,937 Insurance claims1 - - - 13 Due to other governmental agencies
170 - - - 170 Due to other funds- - (46,596) - (46,596) Net OPEB obligation
4,260$ (6,803)$ (109,028)$ 22,469$ (81,482)$ Net cash provided by (used in) operating activities
Supplemental disclosure of noncash investing activities:Net depreciation in investments reported at
-$ -$ (6,602)$ -$ (6,602)$ fair value but not considered cash and cash equivalents
Supplemental disclosure of noncash noncapitalfinancing activities:
-$ -$ -$ 7,311$ 7,311$ Accretion of interest on capital appreciation bonds
COUNTY OF SANTA CLARA
Combining Statement of Cash FlowsInternal Service Funds
For the Fiscal Year Ended June 30, 2014(In thousands)
179

180
This page intentionally left blank.

Fiduciary Funds

This page intentionally left blank.

COUNTY OF SANTA CLARA
181
Fiduciary Funds
Fiduciary Funds account for assets held by the County in a trustee capacity, or as an agent for private organizations, other governmental units, or other funds. The following are the County’s Fiduciary Funds:
Investment Trust Funds Commingled Pool – accounts for the assets of legally separate entities that deposit cash with the County Treasurer. These include school and community college districts, other special districts and other agencies (other than schools and special districts), which use the County Treasury as their depository. Individual Investment Account – accounts for specific investments acquired for the Mountain View – Los Altos School District, Palo Alto Unified School District, San Jose-Evergreen Community College District, and West Valley Mission Community College District, and Mountain View – Los Altos School District. These investments are separate from the County’s investment pool.
Private Purpose Trust Fund Private Purpose Trust fund – accounts for resources held in a trust capacity for and benefits primarily individuals, private organizations and other governments.
Agency Funds County Income Protection Plan – accounts for premiums deducted from the employees’ paychecks and remitted to the County’s long-term disability insurance providers. Administrative fees owed and paid to the County’s long-term disability insurance providers are also accounted for in this fund. County Supplemental Life Insurance – accounts for premiums deducted from the employees’ paychecks and remitted to the County’s insurance providers for supplemental life insurance for these County employees. Administrative fees owed and paid to the insurance providers are also accounted for in this fund. Apportioned Tax Resources – accounts for funds reserved for losses and property tax receipts apportioned to other local government agencies participating in the Teeter Plan. Other Agency – accounts for assets held for other governmental agencies and governmental units by the County in a fiduciary capacity.

Other IndividualSpecial School Investment InvestmentDistricts Districts Trust Account Total
Assets:Cash and investments:
Unrestricted 137,629$ 2,771,571$ -$ 36,523$ 2,945,723$ Other restricted 5 - - - 5
Interest receivable 580 12,068 - 204 12,852
Total assets 138,214 2,783,639 - 36,727 2,958,580
Net position held in trust for pool participants 138,214$ 2,783,639$ -$ 36,727$ 2,958,580$
Commingled Pool
(In thousands)June 30, 2014
COUNTY OF SANTA CLARA
Combining Statement of Fiduciary Net PositionInvestment Trust Funds
182

Other IndividualSpecial School Investment Investment Districts Districts Trust Account Total
Additions:Contributions to pooled investments 300,233$ 10,250,493$ (16,437)$ 8,053$ 10,542,342$ Interest and investment income 491 8,897 82 9,470
Total additions 300,724 10,259,390 (16,437) 8,135 10,551,812
Deductions:Distributions and administrative expenses 289,629 10,126,034 - 32,219 10,447,882
Net change in net position 11,095 133,356 (16,437) (24,084) 103,930
Net position held in trust, beginning of year 127,119 2,650,283 16,437 60,811 2,854,650
Net position held in trust, end of year 138,214$ 2,783,639$ -$ 36,727$ 2,958,580$
Commingled Pool
COUNTY OF SANTA CLARA
(In thousands)For the Fiscal Year Ended June 30, 2014
Investment Trust FundsCombining Statement of Changes in Fiduciary Net Position
183
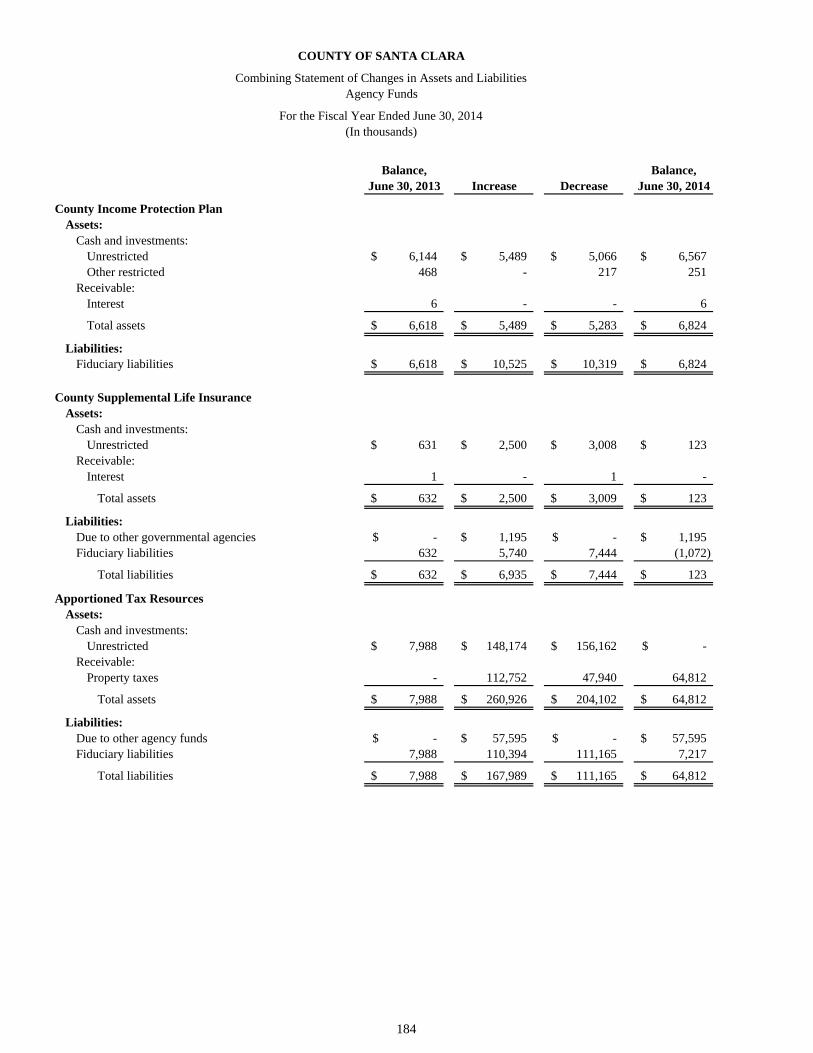
Balance, Balance,June 30, 2013 Increase Decrease June 30, 2014
County Income Protection PlanAssets:
Cash and investments:Unrestricted 6,144$ 5,489$ 5,066$ 6,567$ Other restricted 468 - 217 251
Receivable:Interest 6 - - 6
Total assets 6,618$ 5,489$ 5,283$ 6,824$
Liabilities:Fiduciary liabilities 6,618$ 10,525$ 10,319$ 6,824$
County Supplemental Life InsuranceAssets:
Cash and investments:Unrestricted 631$ 2,500$ 3,008$ 123$
Receivable:Interest 1 - 1 -
Total assets 632$ 2,500$ 3,009$ 123$
Liabilities:Due to other governmental agencies -$ 1,195$ -$ 1,195$ Fiduciary liabilities 632 5,740 7,444 (1,072)
Total liabilities 632$ 6,935$ 7,444$ 123$
Apportioned Tax ResourcesAssets:
Cash and investments:Unrestricted 7,988$ 148,174$ 156,162$ -$
Receivable:Property taxes - 112,752 47,940 64,812
Total assets 7,988$ 260,926$ 204,102$ 64,812$
Due to other agency funds -$ 57,595$ -$ 57,595$ Fiduciary liabilities 7,988 110,394 111,165 7,217
Total liabilities 7,988$ 167,989$ 111,165$ 64,812$
COUNTY OF SANTA CLARA
Combining Statement of Changes in Assets and Liabilities
Liabilities:
(In thousands)For the Fiscal Year Ended June 30, 2014
Agency Funds
184

Balance, Balance,June 30, 2013 Increase Decrease June 30, 2014
Other AgencyAssets:
Cash and investments:Unrestricted 189,158$ 30,586,637$ 30,563,481$ 212,314$ Other restricted 8 - - 8
Receivable:Property taxes 12,867 - 12,867 - Interest 7,325 28,547 29,446 6,426 Other 171 77 3 245
Due from other agency funds - 57,595 - 57,595 Due from other governmental agencies 678 2,203 1,906 975 Other assets 2,467 1 - 2,468
Total assets 212,674$ 30,675,060$ 30,607,703$ 280,031$
Liabilities:Due to other governmental agencies 2$ 75$ 62$ 15$ Fiduciary liabilities 212,672 21,803,158 21,735,814 280,016
Total liabilities 212,674$ 21,803,233$ 21,735,876$ 280,031$
TotalsAssets:
Cash and investments:Unrestricted 203,921$ 30,742,800$ 30,727,717$ 219,004$ Other restricted 476 - 217 259
Receivable:Property taxes 12,867 112,752 60,807 64,812 Interest 7,332 28,547 29,447 6,432 Other 171 77 3 245
Due from other agency funds - 57,595 - 57,595 Due from other governmental agencies 678 2,203 1,906 975 Other assets 2,467 1 - 2,468
Total assets 227,912$ 30,943,975$ 30,820,097$ 351,790$
Liabilities:Due to other agency funds -$ 57,595$ -$ 57,595$ Due to other governmental agencies 2 1,270 62 1,210 Fiduciary liabilities 227,910 21,929,817 21,864,742 292,985
Total liabilities 227,912$ 21,988,682$ 21,864,804$ 351,790$
(In thousands)
COUNTY OF SANTA CLARA
Combining Statement of Changes in Assets and Liabilities (Continued)Agency Funds
For the Fiscal Year Ended June 30, 2014
185

186
This page intentionally left blank.

Statistical Section

This page intentionally left blank.
COUNTY OF SANTA CLARA
187
Statistical Section
This part of the County’s comprehensive annual financial report presents detailed information as a context for understanding what the information in the financial statements, note disclosures, and required supplementary information says about the County’s overall financial health. Financial Trends These schedules contain trend information to help the reader understand how the County’s financial performance and well-being have changed over time.
Revenue Capacity These schedules contain information to help the reader assess the County’s most significant local revenue source, the property tax. Debt Capacity These schedules present information to help the reader assess the affordability of the County’s current levels of outstanding debt and the County’s ability to issue additional debt in the future. Economic & Demographic Information These schedules offer demographic and economic indicators to help the reader understand the environment within which the County’s financial activities take place. Operating Information These schedules contain service and capital asset data to help the reader understand how the information in the County’s financial report relates to the services the County provides and the activities it performs.

Fiscal Year2005 2006 2007 2008 2009
Governmental activities
Net investment in capital assets,1 671,131$ 598,143$ 673,075$ 693,874$ 725,107$ Restricted for:
Capital facilities 864 322 - - - Debt service 29,743 48,032 11,030 24,589 20,540 Parks 62,591 72,565 83,087 92,748 97,179 Housing programs 17,238 14,988 41,817 43,283 45,745 Roads 23,785 26,358 29,060 35,138 35,999 Mental health 31,888 31,698 Other purposes 9,976 9,231 24,131 41,793 41,037
Unrestricted 987,503 1,006,875 866,616 763,198 247,145 Subtotal governmental activities net position 1,802,831 1,776,514 1,728,816 1,726,511 1,244,450
Business-type activities Net investment in capital assets (25,665) 21,529 42,466 65,821 151,827 Restricted for:
Capital facilities - - 115,383 132,783 402,536 Debt service 25,608 39,026 3,962 4,767 1,442
Unrestricted (5,503) (11,347) 18,729 (60,565) (58,654) Subtotal business-type activities net position (5,560) 49,208 180,540 142,806 497,151
Primary government Net investment in capital assets 645,466 619,672 715,541 759,695 876,934 Restricted
Capital facilities 864 322 115,383 132,783 52,536 Debt service 55,351 87,058 14,992 29,356 21,982 Parks 62,591 72,565 83,087 92,748 97,179 Housing programs 17,238 14,988 41,817 43,283 45,745 Roads 23,785 26,358 29,060 35,138 35,999 Mental health 31,888 31,698 Other purposes 9,976 9,231 24,131 41,793 41,037
Subtotal restricted 169,805 210,522 308,470 406,989 326,176 Unrestricted 982,000 995,528 885,345 702,633 538,491
Total primary government net position 2 1,797,271$ 1,825,722$ 1,909,356$ 1,869,317$ 1,741,601$
(1)
and vehicles.(2)
(3)
Source: Comprehensive Annual Financial Reports - County of Santa Clara
perspective for governmental debt issued for business-type activities' capital projects.
Capital assets include land, easements, infrastructure, construction in progress, buildings and improvements,
When applicable, prior year numbers have been reclassified to make them comparable to the current year.
and Net Invested in Capital Assets to unrestricted to reflect the primary government as a whole
capital assets; restricted; and unrestricted. Net position are considered restricted only when an external party,
the state or federal government, places a restriction on how resources may be used, or through enabling
enacted by the County.
In accordance with GASB guidance, the County reclassified net position from restricted for capital facilities to unrestricted
Accounting standards require that net position be reported in three components in the financial statements: net
(Unaudited)
COUNTY OF SANTA CLARA
Net Position by Component
Last Ten Fiscal Years (accrual basis of accounting)
(Dollars in thousands)
188

Fiscal Year2010 2011 2012 2013 2014
Governmental activities
801,069$ 851,562$ 875,610$ 897,189$ 959,157$ Net investment in capital assets,1
Restricted for:- - - - - Capital facilities
12,237 40,949 22,328 367 21,248 Debt service85,280 92,672 82,589 86,475 72,332 Parks46,454 47,049 69,888 76,198 79,450 Housing programs52,652 48,767 55,944 55,550 56,482 Roads52,526 105,834 99,986 105,444 98,119 Mental health59,934 61,373 98,111 114,956 128,762 Other purposes4,996 (139,831) (189,986) (645,094) (751,862) Unrestricted
1,115,148 1,108,375 1,114,470 691,085 663,688 Subtotal governmental activities net position
Business-type activities 211,047 279,321 401,591 498,066 617,486 Net investment in capital assets
Restricted for:327,856 266,277 148,680 493,351 362,574 Capital facilities
2,057 1,233 1,001 1,039 1,038 Debt service(34,921) (22,984) (52,201) (77,277) (110,596) Unrestricted 506,039 523,847 499,071 915,179 870,502 Subtotal business-type activities net position
Primary government 889,972 960,230 999,051 928,872 982,361 3 Net investment in capital assets
Restricted - - - - - 3 Capital facilities
14,294 42,182 23,329 1,406 22,286 Debt service85,280 92,672 82,589 86,475 72,332 Parks46,454 47,049 69,888 76,198 79,450 Housing programs52,652 48,767 55,944 55,550 56,482 Roads52,526 105,834 99,986 105,444 98,119 Mental health59,934 61,373 98,111 114,956 128,762 Other purposes
311,140 397,877 429,847 440,029 457,431 Subtotal restricted420,075 274,115 176,643 237,363 94,398 3 Unrestricted
1,621,187$ 1,632,222$ 1,605,541$ 1,606,264$ 1,534,190$ Total primary government net position 2
-
200,000
400,000
600,000
800,000
1,000,000
1,200,000
1,400,000
1,600,000
1,800,000
2,000,000
2005 2006 2007 2008 2009 2010 2011 2012 2013 2014
Dol
lars
in T
hous
ands
Fiscal Year
Net Position by Component
Unrestricted
Subtotal restricted
Net investment in capital assets
189

Fiscal Year2005 2006 2007 2008 2009
Expenses Governmental activities:
General government 171,077$ 192,708$ 198,510$ 252,828$ 260,666$ Public protection 639,554 664,477 696,216 728,482 770,776 Public ways and facilities 140,842 110,554 89,741 83,103 64,907 Health and sanitation 334,667 369,511 392,171 424,495 419,663 Public assistance 561,919 606,717 601,222 641,710 677,714 Education 25,353 26,157 27,932 33,640 31,687 Recreation and culture 23,214 25,105 26,681 29,433 32,070 Interest on long-term liabilities 6,607 12,032 18,887 22,008 23,296
Total governmental activities expenses 1,903,233 2,007,261 2,051,360 2,215,699 2,280,779
Business-type activities: Healthcare 732,453 756,638 823,409 928,986 997,496 Airport 3,473 3,534 3,451 3,589 3,713 Sanitation 1,634 1,928 2,514 2,772 2,672 Total business-type activities expenses 737,560 762,100 829,374 935,347 1,003,881 Total primary government expenses 2,640,793 2,769,361 2,880,734 3,151,046 3,284,660
Program Revenues Governmental activities:
Charges for services General government 72,340 70,080 84,076 79,568 103,962 Public protection 120,629 111,275 118,731 126,609 135,284 Public ways and facilities 1,785 2,726 2,309 2,776 2,200 Health and sanitation 33,935 46,095 40,855 41,798 38,171 Public assistance 3,444 2,908 2,495 2,689 1,843 Education 916 979 938 888 1,005 Recreation and culture 3,997 4,256 4,455 4,610 4,705 Operating grants and contributions 933,070 1,021,337 1,042,424 1,141,284 1,099,534 Capital grants and contributions 5,212 6,181 10,203 13,847 7,061
Total governmental activities program revenues 1,175,328 1,265,837 1,306,486 1,414,069 1,393,765 Business-type activities: Charges for services Healthcare 478,812 529,543 642,894 727,061 776,931 Airport 2,556 2,678 2,948 3,147 3,148 Sanitation 1,864 1,870 1,883 2,152 2,151 Operating grants and contributions 116,884 14,264 9,138 9,276 8,261 Capital grants and contributions 6,200 15,865 9,230 11,560 8,778 Total business-type activities program revenues 606,316 564,220 666,093 753,196 799,269 Total primary government program revenues 1,781,644 1,830,057 1,972,579 2,167,265 2,193,034
Net Expense Governmental activities (727,905) (741,424) (744,874) (824,690) (887,014) Business-type activities (131,244) (197,880) (163,281) (182,151) (204,612)
Total primary government net expense (1)(859,149)$ (939,304)$ (908,155)$ (1,006,841)$ (1,091,626)$
When applicable, prior year numbers have been reclassified to make them comparable to the current year.
(1) Net expense is the difference between the expenses and program revenues of a function or program. It indicates the extent to which a function or program supports itself with its own fees and grants versus its reliance upon funding from taxes and other general revenues.Numbers in parentheses are net expenses, indicating that expenses are greater than program revenues and therefore general revenueswere needed to finance that function or program.
(Unaudited)
COUNTY OF SANTA CLARAChanges in Net PositionLast Ten Fiscal Years
(accrual basis of accounting)(Dollars in thousands)
190
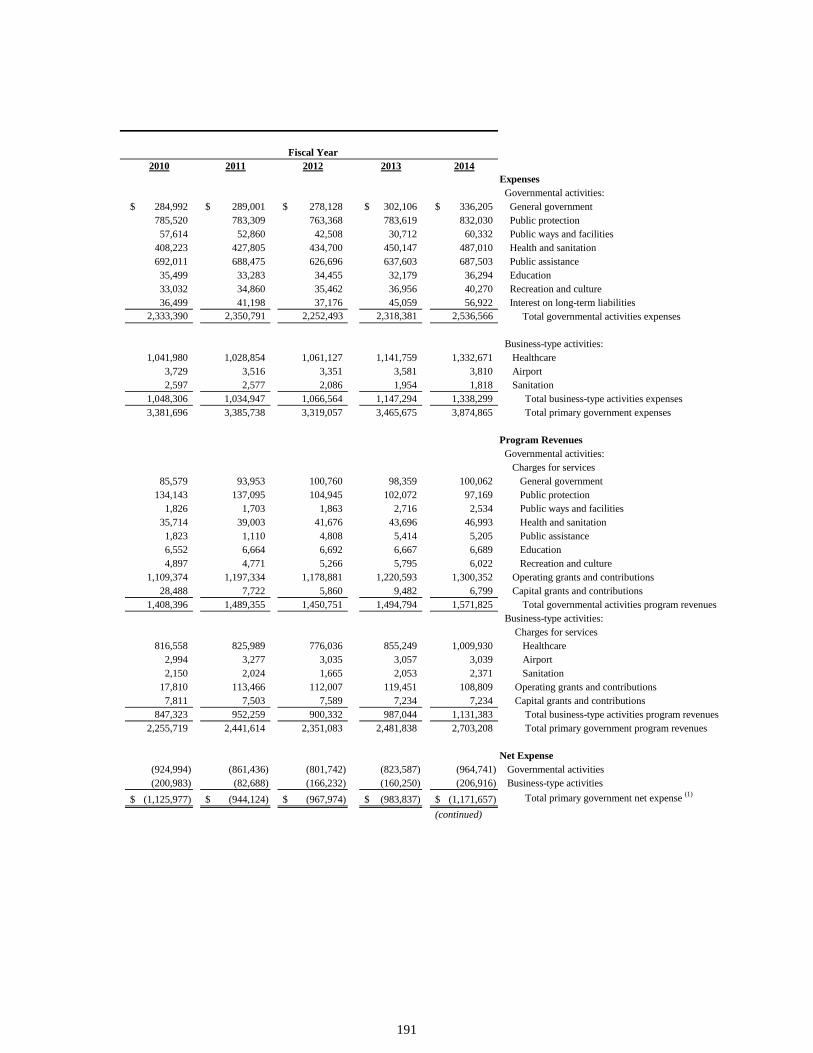
Fiscal Year2010 2011 2012 2013 2014
Expenses Governmental activities:
284,992$ 289,001$ 278,128$ 302,106$ 336,205$ General government785,520 783,309 763,368 783,619 832,030 Public protection57,614 52,860 42,508 30,712 60,332 Public ways and facilities
408,223 427,805 434,700 450,147 487,010 Health and sanitation692,011 688,475 626,696 637,603 687,503 Public assistance35,499 33,283 34,455 32,179 36,294 Education33,032 34,860 35,462 36,956 40,270 Recreation and culture36,499 41,198 37,176 45,059 56,922 Interest on long-term liabilities
2,333,390 2,350,791 2,252,493 2,318,381 2,536,566 Total governmental activities expenses
Business-type activities:1,041,980 1,028,854 1,061,127 1,141,759 1,332,671 Healthcare
3,729 3,516 3,351 3,581 3,810 Airport2,597 2,577 2,086 1,954 1,818 Sanitation
1,048,306 1,034,947 1,066,564 1,147,294 1,338,299 Total business-type activities expenses3,381,696 3,385,738 3,319,057 3,465,675 3,874,865 Total primary government expenses
Program Revenues Governmental activities:
Charges for services85,579 93,953 100,760 98,359 100,062 General government
134,143 137,095 104,945 102,072 97,169 Public protection1,826 1,703 1,863 2,716 2,534 Public ways and facilities
35,714 39,003 41,676 43,696 46,993 Health and sanitation1,823 1,110 4,808 5,414 5,205 Public assistance6,552 6,664 6,692 6,667 6,689 Education4,897 4,771 5,266 5,795 6,022 Recreation and culture
1,109,374 1,197,334 1,178,881 1,220,593 1,300,352 Operating grants and contributions28,488 7,722 5,860 9,482 6,799 Capital grants and contributions
1,408,396 1,489,355 1,450,751 1,494,794 1,571,825 Total governmental activities program revenues Business-type activities: Charges for services
816,558 825,989 776,036 855,249 1,009,930 Healthcare2,994 3,277 3,035 3,057 3,039 Airport2,150 2,024 1,665 2,053 2,371 Sanitation
17,810 113,466 112,007 119,451 108,809 Operating grants and contributions7,811 7,503 7,589 7,234 7,234 Capital grants and contributions
847,323 952,259 900,332 987,044 1,131,383 Total business-type activities program revenues2,255,719 2,441,614 2,351,083 2,481,838 2,703,208 Total primary government program revenues
Net Expense(924,994) (861,436) (801,742) (823,587) (964,741) Governmental activities(200,983) (82,688) (166,232) (160,250) (206,916) Business-type activities
(1,125,977)$ (944,124)$ (967,974)$ (983,837)$ (1,171,657)$ Total primary government net expense (1)
(continued)
191

Fiscal Year2005 2006 2007 2008 2009
General Revenues and Other Changes in Net Position Governmental activities:
Property taxes 586,999 639,557 702,776 748,462 781,914 Sales and use taxes 148,775 123,623 7,437 6,974 5,028 Other taxes 440 413 424 449 407 Unrestricted motor vehicle in lieu taxes 102,471 59,850 60,228 59,093 52,908 Other grants/contributions not restricted
to specific programs 22,497 22,055 39,490 25,862 30,927 Investment income 39,841 53,136 105,118 19,234 (5,294) Securities lending activities: Securities lending income - - - - 616 Securities lending expenses - - - - (347) Gain on sale of capital assets 8,707 4,300 217 - - Other 57,148 51,173 56,353 60,757 80,565 Transfers (100,271) (239,000) (274,867) (121,506) (541,771)
Total governmental activities general revenues 866,607 715,107 697,176 799,325 404,953
Business-type activities: Sales & use tax 9,611 9,664 10,056 8,202 9,025 Investment income 4,873 2,740 10,008 14,472 9,011 Securities lending activities: Securities lending income - - - - 86 Securities lending expenses - - - - (49) Transfers 100,271 239,000 274,867 121,506 541,771
Total business-type activities general revenues 114,755 251,404 294,931 144,180 559,844 Total primary government 981,362 966,511 992,107 943,505 964,797 Changes in Net Position Governmental activities 138,702 (26,317) (47,698) (2,305) (482,061) Business-type activities (16,489) 53,524 131,650 (37,971) 355,232 Total primary government 122,213$ 27,207$ 83,952$ (40,276)$ (126,829)$
Source: Comprehensive Annual Financial Reports - County of Santa Clara
COUNTY OF SANTA CLARAChanges in Net Position (Continued)
Last Ten Fiscal Years(accrual basis of accounting)
(Dollars in thousands)(Unaudited)
192
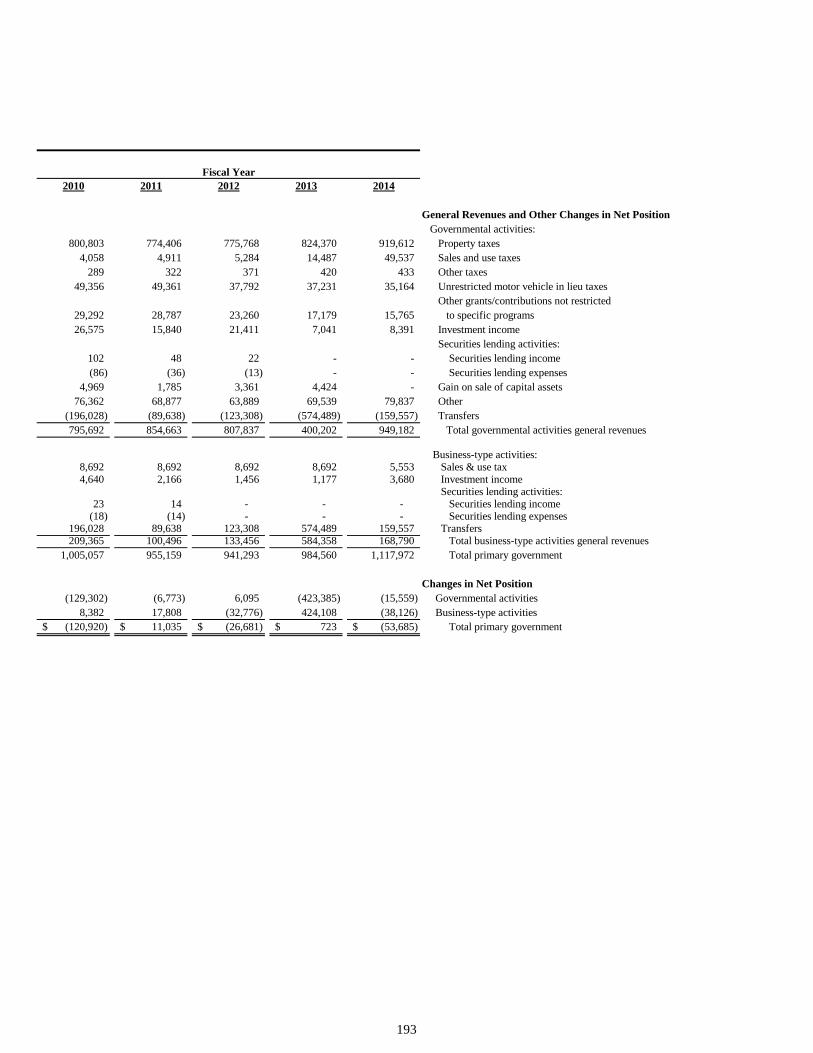
Fiscal Year2010 2011 2012 2013 2014
General Revenues and Other Changes in Net Position Governmental activities:
800,803 774,406 775,768 824,370 919,612 Property taxes4,058 4,911 5,284 14,487 49,537 Sales and use taxes
289 322 371 420 433 Other taxes49,356 49,361 37,792 37,231 35,164 Unrestricted motor vehicle in lieu taxes
Other grants/contributions not restricted 29,292 28,787 23,260 17,179 15,765 to specific programs26,575 15,840 21,411 7,041 8,391 Investment income
Securities lending activities:102 48 22 - - Securities lending income(86) (36) (13) - - Securities lending expenses
4,969 1,785 3,361 4,424 - Gain on sale of capital assets76,362 68,877 63,889 69,539 79,837 Other
(196,028) (89,638) (123,308) (574,489) (159,557) Transfers795,692 854,663 807,837 400,202 949,182 Total governmental activities general revenues
Business-type activities:8,692 8,692 8,692 8,692 5,553 Sales & use tax4,640 2,166 1,456 1,177 3,680 Investment income
Securities lending activities:23 14 - - - Securities lending income
(18) (14) - - - Securities lending expenses196,028 89,638 123,308 574,489 159,557 Transfers209,365 100,496 133,456 584,358 168,790 Total business-type activities general revenues
1,005,057 955,159 941,293 984,560 1,117,972 Total primary government Changes in Net Position
(129,302) (6,773) 6,095 (423,385) (15,559) Governmental activities8,382 17,808 (32,776) 424,108 (38,126) Business-type activities
(120,920)$ 11,035$ (26,681)$ 723$ (53,685)$ Total primary government
193

Fiscal year 2005 2006 2007 2008 2009 2010General fund
Reserved for:Encumbrances 7,872$ 9,344$ 12,908$ 3,896$ 3,402$ 5,833$ Inventories, other assets and advances 19,828 25,216 14,104 37,911 26,608 19,905
Unreserved : Designated 378,095 299,519 232,391 324,712 201,094 90,632 Undesignated 245,412 254,434 201,824 109,734 183,195 140,955 Total General fund 651,207 588,513 461,227 476,253 414,299 257,325
All other governmental funds Reserved for:
Encumbrances 60,787 115,934 62,696 23,999 32,314 31,685 Debt service 47,206 64,923 52,105 52,919 56,723 78,152 Inventories and advances 589 562 582 495 598 727
Unreserved, reported in: Special revenue funds 102,526 111,939 121,642 171,481 174,450 203,856 Capital projects funds 118,436 109,817 117,093 134,790 113,446 71,802 Permanent funds 53 54 55 56 53 52
Total all other governmental funds 329,597 403,229 354,173 383,740 377,584 386,274
Total Governmental Funds (1)
Reserved for:Encumbrances 68,659 125,278 75,604 27,895 35,716 37,518 Debt service 47,206 64,923 52,105 52,919 56,723 78,152 Inventories and advances 20,417 25,778 14,686 38,406 27,206 20,632
Unreserved, reported in: General fund- Designated 378,095 299,519 232,391 324,712 201,094 90,632 General fund- Undesignated 245,412 254,434 201,824 109,734 183,195 140,955 Special revenue funds 102,526 111,939 121,642 171,481 174,450 203,856 Capital projects funds 118,436 109,817 117,093 134,790 113,446 71,802 Permanent funds 53 54 55 56 53 52
Total governmental funds 980,804$ 991,742$ 815,400$ 859,993$ 791,883$ 643,599$
(1) Governmental funds include general fund, special revenue funds, debt service funds, capital project funds and permanent funds.
COUNTY OF SANTA CLARA
Fund Balances of Governmental Funds
Last Ten Fiscal Years
(modified accrual basis of accounting)
(Dollars in thousands)
(Unaudited)
194
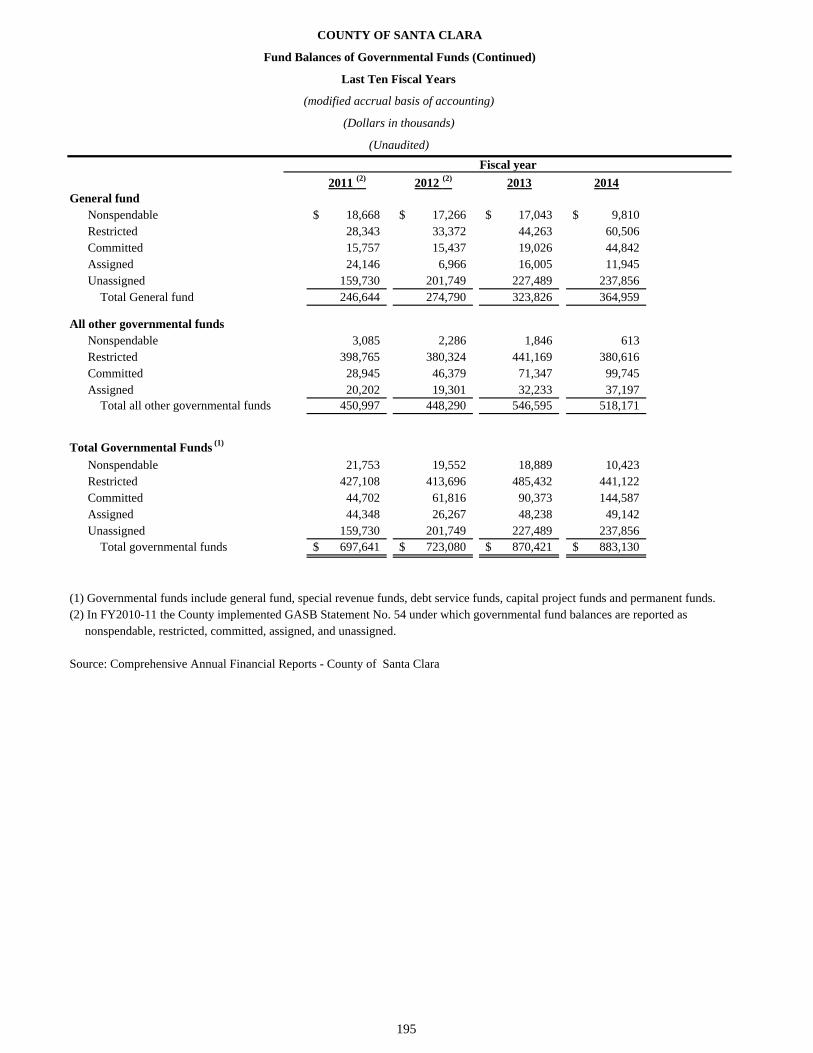
2011 (2) 2012 (2) 2013 2014General fund
Nonspendable 18,668$ 17,266$ 17,043$ 9,810$ Restricted 28,343 33,372 44,263 60,506 Committed 15,757 15,437 19,026 44,842 Assigned 24,146 6,966 16,005 11,945 Unassigned 159,730 201,749 227,489 237,856
Total General fund 246,644 274,790 323,826 364,959
All other governmental funds Nonspendable 3,085 2,286 1,846 613 Restricted 398,765 380,324 441,169 380,616 Committed 28,945 46,379 71,347 99,745 Assigned 20,202 19,301 32,233 37,197
Total all other governmental funds 450,997 448,290 546,595 518,171
Total Governmental Funds (1)
Nonspendable 21,753 19,552 18,889 10,423 Restricted 427,108 413,696 485,432 441,122 Committed 44,702 61,816 90,373 144,587 Assigned 44,348 26,267 48,238 49,142 Unassigned 159,730 201,749 227,489 237,856
Total governmental funds 697,641$ 723,080$ 870,421$ 883,130$
(1) Governmental funds include general fund, special revenue funds, debt service funds, capital project funds and permanent funds. (2) In FY2010-11 the County implemented GASB Statement No. 54 under which governmental fund balances are reported as nonspendable, restricted, committed, assigned, and unassigned.
Source: Comprehensive Annual Financial Reports - County of Santa Clara
Fiscal year
COUNTY OF SANTA CLARA
Fund Balances of Governmental Funds (Continued)
Last Ten Fiscal Years
(modified accrual basis of accounting)
(Dollars in thousands)
(Unaudited)
195

Fiscal Year 2005 2006 2007 2008 2009
Revenues:Taxes 731,953$ 766,099$ 713,361$ 758,209$ 790,488$ Licenses and permits 22,352 24,979 25,597 28,274 28,846 Fines, forfeitures, and penalties 54,483 47,110 53,874 49,542 73,777 Interest and investment income 25,618 37,042 57,980 47,460 26,717 Securities lending activities: Securities lending income - - - - 258 Securities lending expenditures - - - - (146) Intergovernmental revenues 1,035,387 1,092,830 1,110,434 1,243,645 1,193,288 Charges for services 165,893 158,992 167,275 163,714 187,307 Other revenue 50,452 47,532 64,758 34,434 35,540
Total revenues 2,086,138 2,174,584 2,193,279 2,325,278 2,336,075
Expenditures:General government 138,979 156,370 171,236 178,549 181,880 Public protection 615,463 661,180 695,571 717,252 745,788 Public ways and facilities 137,189 102,002 88,936 74,125 60,604 Health and sanitation 331,011 368,969 396,360 419,993 415,198 Public assistance 556,403 606,065 601,214 633,675 668,721 Education 25,199 26,132 30,827 32,234 32,142 Recreation and culture 22,693 24,827 26,629 28,376 30,977 Capital outlay 46,725 94,474 178,218 160,661 101,108 Debt service:
Principal retirement 8,895 77,890 83,023 12,286 14,770 Interest and fiscal charges 9,440 15,642 16,552 15,876 15,343 Advance refunding escrow and cost of issuance 539 1,136 2,112 758 1,937 Total expenditures 1,892,536 2,134,687 2,290,678 2,273,785 2,268,468
Excess (deficiency) of revenues over (under) expenditures 193,602 39,897 (97,399) 51,493 67,607
Other financing sources (uses):Proceeds from sale of capital assets 52,280 25,285 4,982 4,200 4,254 Capital lease financing - - 425 - - Long-term debt proceeds 40,725 87,575 106,525 22,655 350,000 Bond premium 1,003 181 1,935 12,208 Proceeds of refunding bonds - - - 65,379 - Payment to refunded bond escrow agent - - - (66,015) - Transfers in 284,866 237,757 490,790 465,746 363,512 Transfers out (385,137) (380,579) (681,846) (500,800) (865,691)
Total other financing sources (uses) (7,266) (28,959) (78,943) (6,900) (135,717)
Net change in fund balance 186,336$ 10,938$ (176,342)$ 44,593$ (68,110)$
Debt service as a percentage of non-capital expenditures 1.026% 4.652% 4.858% 1.371% 1.482%
Source: Comprehensive Annual Financial Reports - County of Santa ClaraWhen applicable, prior year numbers have been reclassified to make them comparable to the current year.
(Unaudited)
COUNTY OF SANTA CLARAChanges in Fund Balances of Governmental Funds
Last Ten Fiscal Years (modified accrual basis of accounting)
(Dollars in thousands)
196

Fiscal Year2010 2011 2012 2013 2014
Revenues:807,357$ 788,419$ 790,901$ 855,259$ 979,365$ Taxes
26,464 30,026 34,878 39,904 37,367 Licenses and permits76,010 73,331 65,458 62,629 61,733 Fines, forfeitures, and penalties18,670 14,294 15,585 11,412 13,702 Interest and investment income
Securities lending activities:42 32 18 - - Securities lending income
(43) (25) (11) - - Securities lending expenditures1,214,309 1,293,578 1,212,653 1,231,199 1,373,299 Intergovernmental revenues
171,980 182,705 149,208 147,929 144,622 Charges for services31,414 25,969 59,611 47,169 50,781 Other revenue
2,346,203 2,408,329 2,328,301 2,395,501 2,660,869 Total revenues
Expenditures:206,140 197,618 174,495 197,790 240,986 General government 763,732 758,835 741,377 766,736 810,310 Public protection
52,763 51,967 55,862 59,680 63,183 Public ways and facilities 404,369 423,155 428,515 444,488 481,190 Health and sanitation 683,797 678,952 615,277 636,240 677,546 Public assistance
33,729 31,801 32,537 30,814 35,093 Education31,773 33,181 33,250 34,634 37,387 Recreation and culture
106,855 54,800 44,520 28,018 67,984 Capital outlayDebt service:
15,945 31,722 35,944 16,317 27,375 Principal retirement25,632 32,054 32,453 31,629 48,777 Interest and fiscal charges
480 231 143 4,730 1,398 Advance refunding escrow and cost of issuance2,325,215 2,294,316 2,194,373 2,251,076 2,491,229 Total expenditures
Excess (deficiency) of revenues 20,988 114,013 133,928 144,425 169,640 over (under) expenditures
Other financing sources (uses):13,599 6,466 11,180 24,300 5,272 Proceeds from sale of capital assets
186 520 - - - Capital lease financing- 20,368 3,639 509,316 - Long-term debt proceeds
4,048 - - 44,622 909 Bond premium47,188 - - - 11,715 Proceeds of refunding bonds
(52,575) - - - (12,310) Payment to bond refunding escrow 118,981 197,642 98,363 117,658 140,049 Transfers in
(300,699) (284,967) (221,671) (692,980) (302,566) Transfers out(169,272) (59,971) (108,489) 2,916 (156,931) Total other financing sources (uses)
(148,284)$ 54,042$ 25,439$ 147,341$ 12,709$ Net change in fund balance
Debt service as a percentage of 1.900% 2.870% 3.226% 2.417% 3.221% non-capital expenditures
197
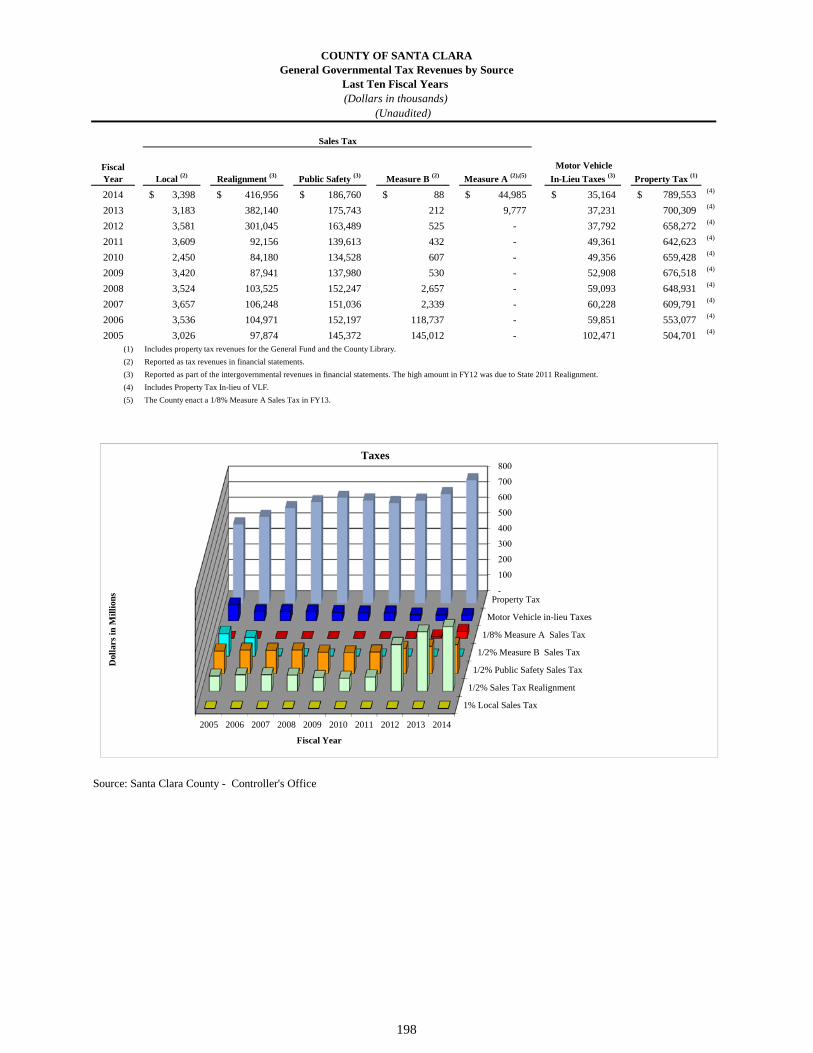
(Unaudited)
Fiscal Year Local (2) Realignment (3) Public Safety (3) Measure B (2) Measure A (2),(5)
Motor Vehicle
In-Lieu Taxes (3) Property Tax (1)
2014 3,398$ 416,956$ 186,760$ 88$ 44,985$ 35,164$ 789,553$ (4)
2013 3,183 382,140 175,743 212 9,777 37,231 700,309 (4)
2012 3,581 301,045 163,489 525 - 37,792 658,272 (4)
2011 3,609 92,156 139,613 432 - 49,361 642,623 (4)
2010 2,450 84,180 134,528 607 - 49,356 659,428 (4)
2009 3,420 87,941 137,980 530 - 52,908 676,518 (4)
2008 3,524 103,525 152,247 2,657 - 59,093 648,931 (4)
2007 3,657 106,248 151,036 2,339 - 60,228 609,791 (4)
2006 3,536 104,971 152,197 118,737 - 59,851 553,077 (4)
2005 3,026 97,874 145,372 145,012 - 102,471 504,701 (4)
(1) Includes property tax revenues for the General Fund and the County Library.
(2) Reported as tax revenues in financial statements.
(3) Reported as part of the intergovernmental revenues in financial statements. The high amount in FY12 was due to State 2011 Realignment.
(4) Includes Property Tax In-lieu of VLF.
(5) The County enact a 1/8% Measure A Sales Tax in FY13.
Source: Santa Clara County - Controller's Office
COUNTY OF SANTA CLARAGeneral Governmental Tax Revenues by Source
Last Ten Fiscal Years (Dollars in thousands)
Sales Tax
1% Local Sales Tax
1/2% Sales Tax Realignment
1/2% Public Safety Sales Tax
1/2% Measure B Sales Tax
1/8% Measure A Sales Tax
Motor Vehicle in-lieu Taxes
Property Tax
2014201320122011201020092008200720062005
Dol
lars
in M
illi
ons
Fiscal Year
Taxes
198

Unsecured
Fiscal
Year
Residential
Property
Commercial
Property Total Secured
Personal
Property Net of
Exemptions Total (1)
Less
Exemptions
Net Assessed
Value
Total Direct
Tax Rate
2014 246,399,339$ 65,056,915$ 311,456,254$ 23,021,092$ 334,477,346$ 1,920,733$ 332,556,613$ 1.00%2013 224,864,630 61,516,026 286,380,656 22,225,683 308,606,339 1,951,818 306,654,521 1.00%2012 217,740,850 60,376,982 278,117,832 20,791,740 298,909,572 1,978,658 296,930,914 1.00%2011 212,611,696 64,011,522 276,623,218 19,652,921 296,276,139 2,007,881 294,268,258 1.00%2010 215,625,995 66,608,703 282,234,698 21,112,122 303,346,820 2,007,990 301,338,831 1.00%2009 217,698,528 64,628,647 282,327,175 20,381,412 302,708,587 2,005,174 300,703,413 1.00%2008 206,352,644 58,108,270 264,460,914 18,578,047 283,038,961 1,992,833 281,046,128 1.00%2007 190,838,222 53,075,552 243,913,774 17,998,933 261,912,707 1,963,081 259,949,626 1.00%2006 172,705,596 48,875,129 221,580,725 18,802,938 240,383,663 1,956,373 238,427,290 1.00%2005 155,523,933 48,929,860 204,453,793 17,712,735 222,166,528 1,945,661 220,220,867 1.00%
Notes: Article XIIIA, added to California Constitution by Proposition 13 in 1978, fixed the base for valuation of property subject to taxes at the full cash value which appeared on the Assessor's 1975-76 assessment roll. Thereafter, full cash value can be increased: a) to reflect annual inflation up to 2 percent; or b) to reflect fair market value at the time of ownership change; or c) to reflect fair value for new construction.
(1) Includes secured public utility property values and excludes aircrafts.
Source: Tax Rate publication and Assessor's report - County of Santa Clara
(Unaudited)
Secured
COUNTY OF SANTA CLARATaxable Assessed Value of Property
Last Ten Fiscal Years(Dollars in thousands)
-
50,000,000
100,000,000
150,000,000
200,000,000
250,000,000
300,000,000
350,000,000
400,000,000
2014201320122011201020092008200720062005
Do
llar
s in
Th
ou
san
ds
Fiscal Year
Taxable Assessed Value of Property
Total (1)
Personal Property Net of Exemptions
Total Secured
199

Direct and Overlapping
Total (2)
Fiscal Year County ( 1 ) Other
County Direct Rate
(1) CitiesSchool
DistrictsSpecial
Districts2014 0.1493 0.8507 1.0000 0.0133 0.1287 0.0525 1.19452013 0.1492 0.8508 1.0000 0.0144 0.1282 0.0538 1.19642012 0.1491 0.8510 1.0000 0.0156 0.1138 0.0532 1.18262011 0.1494 0.8506 1.0000 0.0161 0.1093 0.0586 1.18412010 0.1503 0.8497 1.0000 0.0136 0.1010 0.0603 1.17502009 0.1498 0.8502 1.0000 0.0136 0.0859 0.0455 1.14502008 0.1496 0.8504 1.0000 0.0141 0.0839 0.0465 1.14442007 0.1490 0.8510 1.0000 0.0124 0.0963 0.0466 1.15532006 0.1501 0.8499 1.0000 0.0111 0.0850 0.0471 1.14312005 0.1513 0.8487 1.0000 0.0103 0.0781 0.0483 1.1368
(1) Proposition 13 allows each county to levy a maximum tax of $1 per $100 of full cash value. Full cash value is equivalent to assessed value pursuant to Statutes of 1978, Senate Bill 1656.
(2) On June 6, 1978, California voters approved a constitutional amendment to Article XIIIA of the California Constitution,commonly known as Proposition 13, that limits the taxing power of California public agencies. Legislation enacted to implement Article XIIIA (Statutes of 1978, Chapter 292, as amended) provides that notwithstanding any other law, localagencies may not levy property tax except to pay debt service on indebtedness approved by voters prior to July 1, 1978 or any bonded indebtedness for the acquisition or improvement of real property approved on or after July 1, 1978 by two-thirdsof the voting public.
Source: Santa Clara County - Controller's Office
Countywide Rate Overlapping Governments
COUNTY OF SANTA CLARAProperty Tax Rate - Direct and Overlapping Governments
Last Ten Fiscal Years
(Unaudited)(Per $100 Assessed Valuation)
0
0.02
0.04
0.06
0.08
0.1
0.12
0.14
2014201320122011201020092008200720062005
Pro
per
ty T
ax R
ate
(per
$10
0)
Fiscal Year
Overlapping Governments Property Tax Rates
Cities
School Districts
Special Districts
200

Percentage of Percentage of Taxable Taxable Taxable Taxable
Taxpayer Assessed Value (1) Rank Assessed Value Assessed Value (1) Rank Assessed Value
Pacific Gas & Electric Company 1,725,986$ 1 0.52% 1,141,289$ 4 0.52%Cisco Technology Inc. 1,342,248 2 0.40% n/aGoogle Inc. 1,231,057 3 0.37% n/aThe Irvine Company LLC 1,025,965 4 0.31% n/aBlackhawk Parent LLC 982,105 5 0.30% n/aApple computers Inc 849,170 6 0.26%Westfield Malls 844,260 7 0.25% 771,943 9 0.35%Campus Holdings Inc. 829,180 8 0.25% n/aNetwork Appliance Inc 707,145 9 0.21%Pacific Bell Telephone Co. DBA AT&T California 484,862 10 0.15% n/aSobrato Interests - n/a 1,670,136 1 0.76%Spieker Properties LP - n/a 1,323,541 2 0.60%Intel Corporation - n/a 1,278,916 3 0.58%Hewlett Packard Company - n/a 985,432 5 0.45%Berg & Berg Developers, et al - n/a 897,793 6 0.41%Arrillaga, Perry, et al - n/a 835,283 7 0.38%Applied Materials - n/a 804,112 8 0.37%SBC California n/a 634,435 10 0.29%
Total 10,021,978$ 3.01% 10,342,880$ 4.70%
Net Assessed Value of Taxable Property 332,556,612$ 220,220,867$
(1)
COUNTY OF SANTA CLARAPrincipal Property Taxpayers
Current year and Nine years ago(Dollars in thousands)
Source: Santa Clara County Tax Collector's Office
Fiscal Year 2005
(Unaudited)
Fiscal Year 2014
The taxable assessed value includes tax assessments on real property and personal property.
201
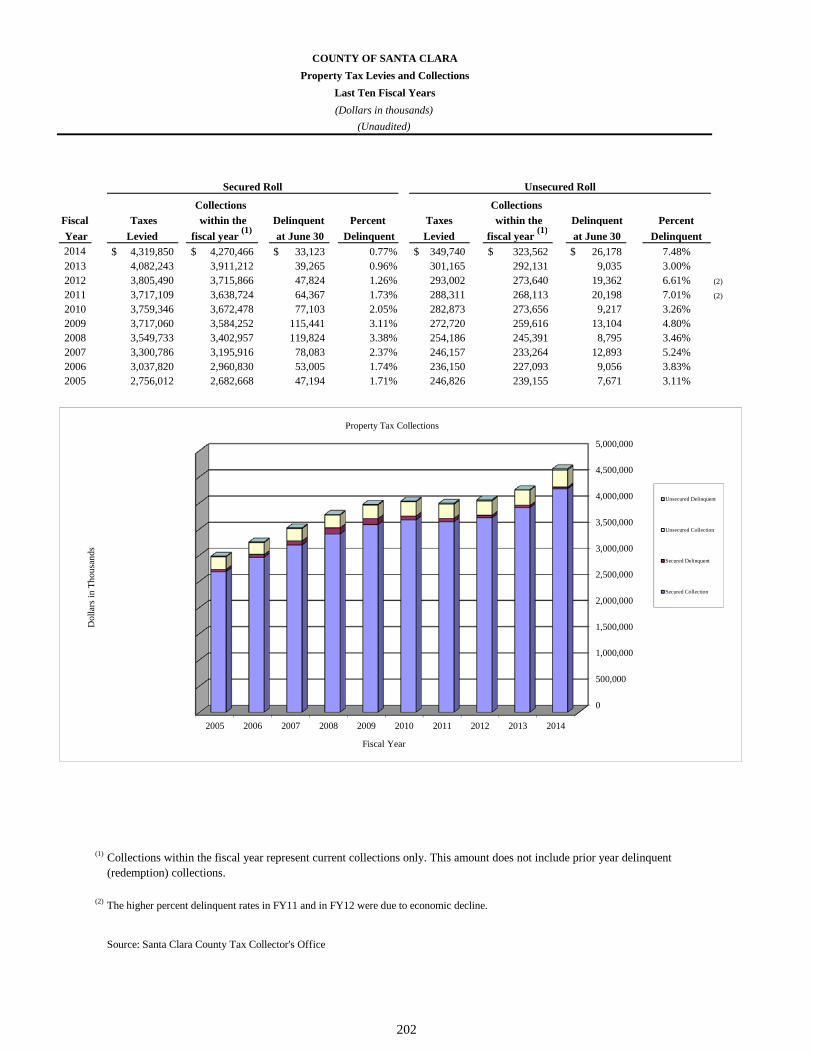
Collections Collections
Fiscal Taxes within the Delinquent Percent Taxes within the Delinquent Percent
Year Levied fiscal year (1)
at June 30 Delinquent Levied fiscal year (1)
at June 30 Delinquent2014 4,319,850$ 4,270,466$ 33,123$ 0.77% 349,740$ 323,562$ 26,178$ 7.48%2013 4,082,243 3,911,212 39,265 0.96% 301,165 292,131 9,035 3.00%2012 3,805,490 3,715,866 47,824 1.26% 293,002 273,640 19,362 6.61% (2)
2011 3,717,109 3,638,724 64,367 1.73% 288,311 268,113 20,198 7.01% (2)
2010 3,759,346 3,672,478 77,103 2.05% 282,873 273,656 9,217 3.26%2009 3,717,060 3,584,252 115,441 3.11% 272,720 259,616 13,104 4.80%2008 3,549,733 3,402,957 119,824 3.38% 254,186 245,391 8,795 3.46%2007 3,300,786 3,195,916 78,083 2.37% 246,157 233,264 12,893 5.24%2006 3,037,820 2,960,830 53,005 1.74% 236,150 227,093 9,056 3.83%2005 2,756,012 2,682,668 47,194 1.71% 246,826 239,155 7,671 3.11%
(1) Collections within the fiscal year represent current collections only. This amount does not include prior year delinquent (redemption) collections.
(2) The higher percent delinquent rates in FY11 and in FY12 were due to economic decline.
Source: Santa Clara County Tax Collector's Office
Unsecured RollSecured Roll
COUNTY OF SANTA CLARA
Property Tax Levies and Collections
Last Ten Fiscal Years
(Dollars in thousands)
(Unaudited)
0
500,000
1,000,000
1,500,000
2,000,000
2,500,000
3,000,000
3,500,000
4,000,000
4,500,000
5,000,000
2014201320122011201020092008200720062005
Dol
lars
in T
hous
ands
Fiscal Year
Property Tax Collections
Unsecured Delinquent
Unsecured Collection
Secured Delinquent
Secured Collection
202

Fiscal
Year
Tobacco
Settlement
Asset-Back
Bonds
Pension
Funding Bonds
General
Obligation
Bonds
Special
Obligation
Bonds
Lease Revenue
Bonds (1)
Certificates of
Participation
(2)
Capital Leases
(3)
Sewer Bonds
Series A & B
Lease Revenue
Bonds (1)
Total Primary
Government
Percentage of
Personal
Income (4)
Debt Per
Capita (4)
2014 157,190$ 419,801$ 854,826$ -$ 229,912$ 3,387$ 271$ -$ 541,516$ 2,206,903$ n/a 1,181$
2013 148,309 416,066 857,704 - 256,616 3,575 491 - 573,108 2,255,869 n/a 1,225
2012 139,931 412,963 327,717 - 250,177 3,758 323 - 518,143 1,653,012 1.4% 910
2011 132,029 409,221 346,235 - 264,537 3,936 459 - 539,440 1,695,857 1.5% 944
2010 124,575 404,895 361,754 - 260,951 4,110 278 - 560,006 1,716,569 1.7% 913
2009 117,544 400,044 362,173 - 278,260 4,279 652 - 576,982 1,739,934 1.7% 937
2008 110,911 394,716 - - 292,981 4,438 3,119 - 593,785 1,399,950 1.3% 762
2007 104,654 - - - 281,902 4,872 4,168 - 533,533 929,129 0.9% 514
2006 - - - 71,626 288,130 550 5,289 - 543,389 908,984 0.9% 513
2005 - - - 142,868 208,770 805 4,472 1,322 435,659 793,896 0.9% 451
(1) Lease revenue bonds are limited obligations of Santa Clara County Financing Authority payable solely from, and secured by, revenuesof the Authority. The Authority's revenues primarily consist of base rental payments receivable from the County under a Master Lease.
(2) Certificates of participation represent shares of lease-purchase payments. These tax-exempt certificates are sold publicly or privately to investors. (3) Capital lease obligations arise from lease agreements which are in-substance like purchases. The agreements convey property rights to the lessee
and the lessee assumes substantially all of the risks and benefits of ownership.(4) Ratios are calculated using personal income and population data shown in Demographic and Economic statistics schedule.
Source: Comprehensive Annual Financial Reports- County of Santa Clara
Governmental Activities Business-Type Activities
COUNTY OF SANTA CLARA
Ratios of Outstanding Debt by Type
Last Ten Fiscal Years
(Dollars in thousands, except per capita amount)
(Unaudited)
0
200,000
400,000
600,000
800,000
1,000,000
1,200,000
1,400,000
1,600,000
1,800,000
2014201320122011201020092008200720062005
Dol
lars
in t
hous
ands
Fiscal Year
Governmental Activities Debt OutstandingSpecial Obligation Bonds
General Obligation Bonds
Pension Funding Bonds
Capital Leases (3)
Certificates of Participation (2)
Lease Revenue Bonds (1)
Tobacco Settlement Asset-Back Bonds
0
100,000
200,000
300,000
400,000
500,000
600,000
2014201320122011201020092008200720062005
Dol
lars
in t
hou
san
ds
Fiscal Year
Business-type Activities Debt Outstanding
Lease Revenue Bonds (1) Sewer Bonds Series A & B
203

204
This page intentionally left blank.

Less: Percentage of
General Amounts Percentage of Actual Value
Obligation Restricted to Personal of Taxable
Bonds - Principal Repaying Principal Total Income (3) Property (2) Per Capita (3)804,700$ 33,573$ 771,127$ 0.63% (1) 0.23% 412.69$ 805,800 55,048 750,752 0.67% (1) 0.24% 407.52 316,800 16,873 299,927 0.29% (1) 0.10% 165.11 334,900 34,809 300,091 0.30% (1) 0.10% 166.96 350,000 35,573 314,427 0.30% (1) 0.10% 167.17 350,000 10,294 339,706 0.33% (1) 0.11% 182.87
- - - - - -- - - - - -
- - - - - -
- - - - - -
(1) 2014 percentage is calculated using 2012 personal income data, which is the most recent available for FY14.
2013 percentage is calculated using 2011 personal income data, which is the most recent available for FY13.
2012 percentage was calculated using 2010 personal income data, which was the most recent available for FY12.
2011 percentage was calculated using 2009 personal income data, which was the most recent available for FY11.
2009 and 2010 percentages were calculated using 2008 personal income data, which was the most recent available then.
(2) See "Taxable Assessed Value of Property" table for property value data.
(3) Population and personal income data can be found in the "Demographic and Economic Statistics" table.
Source: County of Santa Clara Controller's Office
County of Santa Clara Assessor's Office
State of California - Department of Finance
U.S. Department of Commerce - Bureau of Economic Analysis
20082007
2006
2005
COUNTY OF SANTA CLARA
Ratios of General Bonded Debt Outstanding
Last Ten Fiscal Years
(Dollars in thousands)
(Unaudited)
201120102009
Fiscal
Year201420132012
205
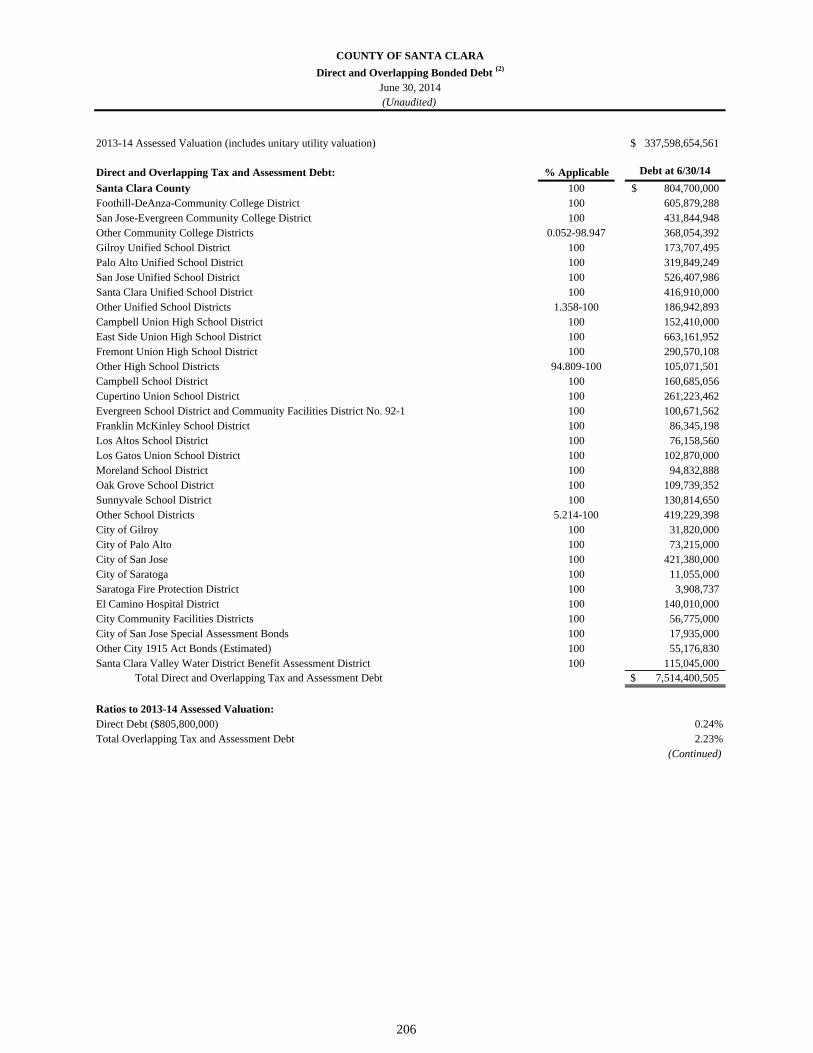
2013-14 Assessed Valuation (includes unitary utility valuation) 337,598,654,561$
Direct and Overlapping Tax and Assessment Debt: % Applicable Debt at 6/30/14
Santa Clara County 100 804,700,000$ Foothill-DeAnza-Community College District 100 605,879,288 San Jose-Evergreen Community College District 100 431,844,948 Other Community College Districts 0.052-98.947 368,054,392 Gilroy Unified School District 100 173,707,495 Palo Alto Unified School District 100 319,849,249 San Jose Unified School District 100 526,407,986 Santa Clara Unified School District 100 416,910,000 Other Unified School Districts 1.358-100 186,942,893 Campbell Union High School District 100 152,410,000 East Side Union High School District 100 663,161,952 Fremont Union High School District 100 290,570,108 Other High School Districts 94.809-100 105,071,501 Campbell School District 100 160,685,056 Cupertino Union School District 100 261,223,462 Evergreen School District and Community Facilities District No. 92-1 100 100,671,562 Franklin McKinley School District 100 86,345,198 Los Altos School District 100 76,158,560 Los Gatos Union School District 100 102,870,000 Moreland School District 100 94,832,888 Oak Grove School District 100 109,739,352 Sunnyvale School District 100 130,814,650 Other School Districts 5.214-100 419,229,398 City of Gilroy 100 31,820,000 City of Palo Alto 100 73,215,000 City of San Jose 100 421,380,000 City of Saratoga 100 11,055,000 Saratoga Fire Protection District 100 3,908,737 El Camino Hospital District 100 140,010,000 City Community Facilities Districts 100 56,775,000 City of San Jose Special Assessment Bonds 100 17,935,000 Other City 1915 Act Bonds (Estimated) 100 55,176,830 Santa Clara Valley Water District Benefit Assessment District 100 115,045,000
Total Direct and Overlapping Tax and Assessment Debt 7,514,400,505$
Ratios to 2013-14 Assessed Valuation:Direct Debt ($805,800,000) 0.24%Total Overlapping Tax and Assessment Debt 2.23%
(Continued)
COUNTY OF SANTA CLARA
Direct and Overlapping Bonded Debt (2)
June 30, 2014(Unaudited)
206

Direct and Overlapping General Fund Debt: % Applicable Debt at 6/30/14
Santa Clara County General Fund Obligations 100 224,317,683$ (1)
Santa Clara County Pension Obligations 100 375,419,144 Santa Clara County Office of Education Certificates of Participation 100 9,730,000 Foothill-De Anza Community College District General Fund Obligations 100 13,468,694 San Jose-Evergreen Community College District Other Post-Employment Benefit Obligations 100 47,450,000 West Valley-Mission Community College District General Fund Obligations 98.947 64,409,550 Gilroy Unified School District Certificates of Participation 100 30,850,000 Other Unified School District School General Fund Obligations 100 32,935,000 Santa Clara Unified School District Certificates of Participation 100East Side Union High School District Benefit Obligations 100 30,795,000 Other Union High School District General Fund Obligations 94.809-100 21,843,504 Alum Rock Union School District Certificates of Participation 100 25,000,000 Other School District General Fund Obligations 22.080-100 13,635,456 City of Cupertino Certificates of Participation 100 42,020,000 City of Gilroy Certificates of Participation 100 45,550,000 City of San Jose General Fund Obligations 100 706,145,000 City of Santa Clara General Fund Obligations 100 25,246,000 City of Sunnyvale General Fund Obligations 100 22,195,000 Other City General Fund Obligations 100 33,680,843 Santa Clara County Vector Control District Certificates of Participation 100 3,275,000 Midpeninsula Regional Park District General Fund Obligations 68.856 92,123,844
Total Direct and Overlapping General Fund Debt 1,860,089,718
Overlapping Tax Increment Debt 100 2,323,848,984$
Total Direct Debt 1,404,436,827$ Total Combined Overlapping Debt 10,293,902,380$
Combined Total Debt 11,698,339,207$ (2)
Ratios to 2013-14 Assessed Valuation:Total Direct Debt ($1,404,436,827) 0.42%Combined Total Debt 3.47%
Ratios to Redevelopment Incremental Valuation ($35,215,222,404):Total Overlapping Tax Increment Debt 6.60%
(1) Excludes $533,496,637 in lease revenue bonds that are repaid with VMC and airport operating revenues. (2) Includes all bonded debt obligations that are supported in whole or in part by a property tax or assessment or are supported by a
pledge of the general fund or general taxing power of a governmental entity. Only long-term debt obligations are included. Excludes tax and revenue anticipation notes, enterprise revenue, mortgage revenue and non-bonded capital lease obligations, bond premiums, discounts and accreted interest. Qualified Zone Academy Bonds are included based on principal due at maturity.
Source: California Municipal Statistics, Inc.
June 30, 2014(Unaudited)
COUNTY OF SANTA CLARA
Direct and Overlapping Bonded Debt (2)
207

Total Legal General Legal
Fiscal Assessed Debt Bonded Debt
Year Valuation (1) Limit (2) Debt (3, 5) Margin (4)
2014 334,477,346$ 4,180,967$ 804,700$ 3,376,267$ 2013 308,606,339 3,857,579 805,800 3,051,779 2012 298,909,572 3,736,370 316,800 3,419,570 2011 296,276,139 3,703,452 334,900 3,368,552 2010 303,346,820 3,791,835 350,000 3,441,835 2009 302,708,587 3,783,857 350,000 3,433,857
2008 283,038,961 3,537,987 -- 3,537,987 2007 261,912,708 3,273,909 -- 3,273,909
2006 240,383,663 3,004,796 -- 3,004,796
2005 222,166,528 2,777,082 -- 2,777,082
(1) Total assessed valuation includes exempt property.
(2) The legal debt limit is set by statute at 1.25 percent of the total assessed valuation.
(3) The County issued General Obligation Bonds in FY09.
(4) The legal debt margin is the legal debt limit reduced by all general bonded debt.
(5) The County issued Additional General Obligation Bonds in FY13.
Source: County of Santa Clara Controller's Office
County of Santa Clara Assessor's Office
(Unaudited)
COUNTY OF SANTA CLARA
Legal Debt Margin Information
Last Ten Fiscal Years
(Dollars in thousands)
208

Santa Clara County Financing Authority (SCCFA) (2)
Fiscal Gross Operating Net Available
Year Revenues (3) Expenses (4) Revenues Principal Interest Total Coverage (5)
2014 72,273$ 1,501$ 70,772$ 38,573$ 32,509$ 71,082$ 1.00 2013 66,002 1,929 64,073 31,830 32,243 64,073 1.00 2012 68,316 2,138 66,178 34,570 31,608 66,178 1.00 2011 68,156 1,173 66,983 33,130 33,853 66,983 1.00 2010 65,123 1,093 64,030 30,395 33,636 64,031 1.00 2009 66,728 1,120 65,608 28,665 36,392 65,057 1.01 2008 58,903 965 57,938 19,995 36,337 56,332 1.03 2007 129,668 969 128,699 90,520 35,448 125,968 1.02 2006 116,501 829 115,672 85,050 32,392 117,442 0.98 2005 40,334 397 39,937 15,675 25,645 41,320 0.97 2004 38,538 282 38,256 14,935 24,829 39,764 0.96
Santa Clara County - El Camino Hospital District Hospital Facilities Authority (HFA) (2)
Fiscal Gross Operating Net Available
Year Revenues (3) Expenses (4) Revenues Principal Interest Total Coverage (5)
2014 5,269$ 10$ 5,259$ 21,700 2 21,702$ 0.24 2013 6,663 147 6,516 5,900 31 5,931 1.10 2012 6,377 179 6,198 5,300 35 5,335 1.16 2011 5,929 207 5,722 4,800 109 4,909 1.17 2010 5,462 242 5,220 4,300 84 4,384 1.19 2009 5,086 269 4,817 3,900 534 4,434 1.09 2008 5,512 311 5,201 3,500 1,405 4,905 1.06 2007 5,551 305 5,246 3,100 1,761 4,861 1.08 2006 4,980 309 4,671 2,800 1,514 4,314 1.08 2005 4,231 386 3,845 2,500 977 3,477 1.11 2004 3,442 347 3,095 2,300 617 2,917 1.06
Business-type activities - Airport
Fiscal Gross Operating Net Available
Year Revenues (3) Expenses (4) Revenues Principal Interest Total Coverage (5)
2014 3,051$ 2,352$ 699$ 185$ 228$ 413$ 1.69 2013 3,068 2,402 666 181 233 414 1.61 2012 3,046 2,215 831 170 240 410 2.03 2011 3,287 2,257 1,030 160 247 407 2.53 2010 3,004 2,575 429 160 256 416 1.03 2009 3,173 2,632 541 156 261 417 1.30 2008 3,200 2,501 699 265 265 530 1.32 2007 3,047 2,505 542 241 277 518 1.05 2006 2,821 2,342 479 230 286 516 0.93 2005 2,648 2,189 459 225 298 523 0.88 2004 2,639 1,913 726 210 333 543 1.34
Note: Tobacco Settlement Asset-Backed Bonds issued in FY07 have not been presented on this schedule as the Capital Appreciation Bonds will have debt service requirements starting on June 1, 2026.
(1) Lease Revenue bonds consist of various bond series. (2) Lease Revenue bonds of SCCFA and HFA include Governmental and Business-type activities-SCVMC.(3)
(4)
(5) Debt service payments not covered by available revenues were funded by reserve funds with the trustees, or subsidy from the County.
Source: Comprehensive Annual Financial Reports - County of Santa ClaraAudited financial statement for Santa Clara County Financing AuthorityAudited financial statement for Santa Clara County - El Camino Hospital District Hospital Facilities Authority
(Dollars in thousands)
(Unaudited)
Debt Service
COUNTY OF SANTA CLARA
Pledge Revenue Coverage
Last Ten Fiscal Years
Lease Revenue Bonds (1) and Special Obligation Bonds Series 2003
Gross Revenues include operating revenue and non-operating interest income.Operating expenses excludes interest, depreciation, or amortization expense.
Debt Service
Debt Service
Lease Revenue Bonds (1)
Lease Revenue Bonds (1)
209

Fiscal County Personal Income Per Capita School Unemployment
Year Population (1) (in thousands) (2) Personal Income (2) Median Age (3) Enrollment (4) Rate (5)
2014 1,868,558 n/a n/a n/a 276,175 6.1%2013 1,842,254 n/a n/a n/a 273,701 7.6%2012 1,816,486 $122,259,021 $66,535 36.6 269,858 9.0%2011 1,797,375 111,880,131 61,833 36.4 265,543 10.5%2010 1,880,876 103,636,350 58,018 36.2 262,126 11.6%2009 1,857,621 99,549,995 55,781 36.2 259,800 8.7%2008 1,837,075 103,992,999 59,227 36.6 259,116 5.1%2007 1,808,056 104,102,421 60,107 36.4 255,722 4.4%2006 1,773,258 95,911,624 55,735 36.1 254,622 5.0%2005 1,759,585 87,154,432 51,112 36.2 253,065 5.8%
Sources:(1) State of California - Department of Finance(2) U.S. Department of Commerce- Bureau of Economic Analysis(3) Association of Bay Area Census (California)(4) Santa Clara County Office of Education(5) State of California - Employment Development Department
COUNTY OF SANTA CLARA
Demographic and Economic Statistics
Last Ten Fiscal Years
(Unaudited)
210

Estimated Percentage of Estimated Percentage of Number of Total County Number of Total County
Company or Organization Employees (2) Rank Employment Employees (3) Rank Employment
Cisco Technology Inc. 16,819 1 1.91% 13,000 2 1.67%County of Santa Clara 16,408 2 1.87% 17,477 1 2.25%Apple Computer, Inc. 15,000 3 1.71% 6,000 7 0.77%Stanford University 14,641 4 1.66% 11,920 3 1.54%Kaiser Permanente 13,500 5 1.53% 5,000 10 0.64%Google Inc. 11,000 6 1.25% 5,680 8 0.73%Stanford Hospital & Clinics 8,451 7 0.96% 5,500 9 0.71%Lockheed Martin Space Systems Co. 6,400 8 0.73% 8,000 5 1.03%Intel Corporation 5,800 9 0.66% 5,000 10 0.64%City of San Jose 5,650 10 0.64%Hewlett-Packard Co. 9,400 4 1.21%International Business Machines (IBM) Corp. 7,000 6 0.90%
Total - Top 10 Employers 113,669 79,977
Total County Employment (1)879,500 776,158
Source: (1) State Employment Development Department, Labor Market Information Division
(2) Silicon Valley/San Jose Business Journal, Book of Lists 2014, December 27, 2013.City of San Jose 2013-2014 Adopted Budget in Brief.Stanford University 2014-2015 Budget Plan.http://stanfordhospital.org/aboutUs/facts.html.County of Santa Clara Finance Department.
(3) County of Santa Clara Finance Department.Standford University 2014-2015 Budget Plan.City of Cupertino FY2013 CAFR.Google Annual Report 2005.
COUNTY OF SANTA CLARAPrincipal Employers
Current Year and Nine Years ago(Unaudited)
Fiscal Year 2014 Fiscal Year 2005
211

212
This page intentionally left blank.

Function/ Program 2005 2006 2007 2008 2009 2010 2011 2012 2013 2014
General Government 2,019 2,080 2,112 2,099 2,053 2,006 1,976 1,542 1,626 1,719
Public Protection 3,662 3,687 3,775 3,777 3,846 3,861 3,816 3,909 3,949 3,972
Public Ways and Facilities 258 262 262 259 253 246 246 245 246 247
Health & Sanitation 6,323 6,576 6,716 6,840 6,761 6,764 6,802 6,783 6,953 7,496
Public Assistance 2,369 2,455 2,467 2,515 2,489 2,435 2,400 2,231 2,283 2,389
Education 291 286 292 303 303 310 302 289 285 343
Recreation and Cultural Services 207 209 215 218 221 218 216 220 222 243
Total full-time equivalent employees 15,129 15,555 15,839 16,011 15,926 15,840 15,758 15,219 15,564 16,408
Source: Santa Clara County Controller's Office
COUNTY OF SANTA CLARA
Full-time Equivalent County Employees by Function/Program
Last Ten Fiscal Years
(Unaudited)
0
1,000
2,000
3,000
4,000
5,000
6,000
7,000
8,000
2005 2006 2007 2008 2009 2010 2011 2012 2013 2014
Em
ploy
ee C
ount
Fiscal Year
Full-time Equivalent County Employees by Function/Program
Function/ Program
General Government
Public Protection
Public Ways andFacilitiesHealth & Sanitation
213

Fiscal Year
2005 2006 2007 2008 2009Governmental Activities General Government
Total number of secured and unsecured assessment roll units - Assessor 508,936 563,399 563,579 567,996 545,036 Ratio of revenue collections to expenditures - Department of Revenue 10.3:1 10.4:1 10.1:1 9.4:1 9.5:1Number of new voter registrations - Registrar of Voters 150,233 56,661 55,961 99,539 120,602 Number of Vote by Mail ballots issued in major elections - Registrar of Voters 232,321 229,711 271,188 487,336 559,122 Number of documents recorded by the Clerk Recorder 695,005 680,799 595,569 469,688 464,068
Public Protection9-1-1 emergency calls received - Communications Department 264,734 314,849 236,469 244,109 236,572
Emergency calls answered within 10 seconds (2.5 rings) 94% 94% 93% 86% 92%Number of fires extinguished by the County fire department n/a 1,001 1,464 496 478 Number of fire prevention inspections 10,621 10,998 10,726 10,148 9,395
Number of child support cases (1) - Department of Child Support Services 63,366 62,047 54,509 50,887 50,319
Number of cases reviewed for possible criminal filing by the District Attorney (2) 44,205 42,525 37,786 41,220 43,568 Number of criminal complaints received - Sheriff 1,430 2,209 2,039 3,169 2,987 Number of citations issued - Sheriff 20,977 22,479 32,761 46,973 38,813
Number of priority 1, 2, 3 calls (3) dispatched - Sheriff 41,194 44,692 72,781 41,981 42,037 Number of inmates booked - Department of Correction 55,084 55,839 58,196 69,502 65,088 Average daily inmate population in all jail facilities 4,278 4,553 4,501 4,657 4,497 Rate of successful completion of probation (adult) 57% 57% 61% 56% 53%Rate of successful completion of probation (juvenile) 89% 80% 76% 80% 72%Rate of successful enrollment in school, training, or employment (adult) 50% 42% 45% 43% 45%Rate of successful enrollment in school, training, or employment (juvenile) 84% 94% 86% 79% 78%
Public Ways and FacilitiesNumber of gross miles maintained by the Roads Department 684 684 672 670 655
Average to ideal PCI (4) - urban roads 109% 109% 107% 109% 104%
Average to ideal PCI (4) - expressways 116% 106% 115% 118% 116%
Average to ideal PCI (4) - mountain roads 114% 114% 109% 107% 106%
Average to ideal PCI (4) - arterial/collector roads 111% 111% 111% 106% 109%
Health and SanitationNumber of vector control service requests 8,368 7,729 7,290 5,722 4,710 Household hazardous waste collected (number of pounds) 2,100,000 2,339,000 2,340,526 2,940,653 3,200,000 Hazardous underground storage tanks inspected 68 53 53 52 88 Critical hazard violations in food facilities 5,744 5,931 4,756 3,503 2,890
Public Assistance
Number of low income individuals assisted with housing services (5) 59,436 61,436 23,722 24,920 15,827 Number of Adult Protective Services (APES) reports 1,975 2,400 2,601 2,862 2,701 Number of monthly In-Home Supportive Services (IHSS) authorized cases 10,107 11,942 12,545 13,923 15,778 Average monthly number of active Medi-Cal cases 91,281 74,973 76,352 80,729 99,591 Number of children and families diverted from Child Welfare Services 2,385 2,271 3,087 2,543 1,600 Average monthly number of clients working - off aid receiving services 1,329 1,058 1,175 1,124 1,008
EducationAverage number of books borrowed per capita 22.6 23.1 23.3 24.5 26.5 Library visits 3,136,222 2,977,698 3,024,199 3,439,339 3,571,571
Recreation and CultureNumber of visitors in County parks 2,002,217 2,245,036 1,791,891 2,496,875 2,230,557 Total volunteer hours in County parks 34,337 33,457 38,039 34,714 50,968
Business-type activities - SCVMCTotal patient days 121,935 125,138 132,516 130,638 120,243 Average daily census 334 351 363 357 329 Total hospital visits 657,403 674,656 702,860 750,849 799,820
Notes: n/a Data is not available.(1) Data is compiled per federal fiscal year ending September 30.(2) Data is compiled on a calendar year basis.(3) Priority 1 - A life endangering situation, special circumstances, or person at risk.
Priority 2 - Any crime against a person not life threatening.Priority 3 - Any crime against a person or property with no special circumstances.
(4) PCI - Pavement condition index(5) Number for fiscal year 2010 is based on estimate.
Source: Santa Clara County Departments
COUNTY OF SANTA CLARA
Operating Indicators by Function / Program
Last Ten Fiscal Years
(Unaudited)
214

Fiscal Year
2010 2011 2012 2013 2014Governmental Activities General Government
545,413 547,365 555,023 558,490 n/a Total number of secured and unsecured assessment roll units - Assessor9.8:1 10:6/1 9:2/1 8:9/1 7.2/1 Ratio of revenue collections to expenditures - Department of Revenue
51,024 80,620 131,475 153,719 36,269 Number of new voter registrations - Registrar of Voters547,351 559,956 546,590 603,588 575,261 Number of Vote by Mail ballots issued in major elections - Registrar of Voters497,383 545,403 589,705 651,946 407,429 Number of documents recorded by the Clerk Recorder
Public Protection233,682 236,122 231,516 243,270 252,869 9-1-1 emergency calls received - Communications Department
93% 91% 90% 92% 91% Emergency calls answered in less than 12 seconds (2 rings).423 366 400 413 317 Number of fires extinguished by the County fire department
4,575 4,345 4,083 10,378 9,554 Number of fire prevention inspections
45,149 43,432 40,961 39,667 37,909 Number of child support cases (1) - Department of Child Support Services
36,625 34,079 37,595 35,090 39,603 Number of cases reviewed for possible criminal filing by the District Attorney (2)
2,139 2,090 1,302 1,064 1,589 Number of criminal complaints received - Sheriff39,612 36,143 23,265 20,188 24,910 Number of citations issued - Sheriff
57,116 36,886 28,062 41,496 40,670 Number of priority 1, 2, 3 calls (3) dispatched - Sheriff
58,032 51,521 49,358 46,465 49,120 Number of inmates booked - Department of Correction4,127 3,679 3,743 3,816 4,139 Average daily inmate population in all jail facilities
53% 55% 55% 51% 51% Rate of successful completion of probation (adult)71% 66% 66% 64% 68% Rate of successful completion of probation (juvenile)44% 44% 42% 43% 41% Rate of successful enrollment in school, training, or employment (adult)79% 76% 67% 70% 75% Rate of successful enrollment in school, training, or employment (juvenile)
Public Ways and Facilities646 635 635 634 637 Number of gross miles maintained by the Roads Department
100% 96% 106% 106% 97% Average to ideal PCI (4) - urban roads
105% 106% 104% 98% 96% Average to ideal PCI (4) - expressways
94% 94% 101% 103% 103% Average to ideal PCI (4) - mountain roads
96% 97% 103% 103% 103% Average to ideal PCI (4) - arterial/collector roads
Health and Sanitation4,498 4,984 4,585 4,754 4,941 Number of vector control service requests
3,500,000 3,450,000 3,308,379 3,000,000 2,400,000 Household hazardous waste collected (number of pounds)88 88 366 390 383 Hazardous underground storage tanks inspected
1,537 1,848 1,975 2,116 2,292 Critical hazard violations in food facilities
Public Assistance
15,000 3,090 4,282 9,249 4,162 Number of low income individuals assisted with housing services (5)
2,545 2,756 3,106 3,216 3,736 Number of Adult Protective Services (APES) reports16,887 17,220 17,251 17,308 18,647 Number of monthly In-Home Supportive Services (IHSS) authorized cases
106,125 109,354 108,396 110,769 140,921 Average monthly number of active Medi-Cal cases1,342 1,439 1,706 1,957 1,838 Number of children and families diverted from Child Welfare Services
800 952 1,341 1,239 1,202 Average monthly number of clients working - off aid receiving services
Education28.4 28.8 23.7 23.5 22.0 Average number of books borrowed per capita
3,743,054 3,684,131 3,123,369 3,257,843 3,253,377 Library visits
Recreation and Culture2,237,595 2,049,625 2,603,830 2,482,308 2,837,336 Number of visitors in County parks
45,686 53,930 62,683 70,970 93,082 Total volunteer hours in County parks
Business-type activities - SCVMC116,746 115,002 105,755 108,500 111,093 Total patient days
320 315 289 297 304 Average daily census824,594 828,258 823,240 844,758 790,434 Total hospital visits
215

Fiscal Year2005 2006 2007 2008 2009
Governmental Activities General Government
Number of main administration buildings 13 15 16 16 16
Number of electronic voting machines (1) 5,500 5,500 5,500 5,500 5,500Number of animal shelters 1 1 1 1 1
Public ProtectionNumber of children shelters 1 1 1 1 1
Number of 9-1-1 communications sites (2) 30 30 31 39 39Number of crime labs 1 1 1 1 1Number of Sheriff's stations and substations 3 3 3 3 3Number of helicopters owned by the County 1 1 1 1 1Number of bomb trucks owned by the County 1 1 1 1 1Number of jail facilities 2 2 2 2 2Total capacity of Main jail 1,353 1,353 1,409 1,689 1,689Total capacity of Elmwood correctional facility 2,472 2,472 3,092 3,711 3,711
Number of juvenile probation facilities 4 3 (3) 3 3 3
Total capacity of all juvenile probation facilities 589 481 (3) 550 550 550Number of adult probation facilities 2 2 2 0 0Total capacity of all adult probation facilities 320 320 320 0 0Number of fire stations 8 8 8 8 8Number of fire trucks 5 5 5 5 5Number of fire engines 28 28 28 34 32Number of Court buildings 8 8 8 8 8
Public Ways and FacilitiesRoad gross miles (urban, rural and expressways) 684 684 672 670 655Number of bridges 175 175 175 173 172Number of traffic lights 164 164 163 163 163Number of maintenance trucks 250 248 244 249 216
Health and SanitationNumber of neighborhood health centers 7 7 7 7 7Number of alcohol and drug abuse recovery centers 1 1 1 1 1
EducationNumber of county libraries 8 8 8 8 8Number of books (in thousands) 1,631 1,634 1,646 1,705 1,776
Recreation and CultureNumber of multi-use parks 26 26 26 26 26
Acreage of parks 44,546 44,546 44,953 44,953 44,657Lakes and reservoirs 12 12 12 12 12Boat launch ramps 11 11 11 11 11Miles of park trails 291 291 298 298 302Number of campsites in County parks 319 319 319 319 317
Business - type activities
Number of main administration buildings 2 2 2 2 1Number of County hospitals 1 1 1 1 1Number of licensed beds in acute care hospital 574 574 574 574 574Operating rooms 14 14 14 14 12Neighborhood health centers / satellite clinics 7 7 7 7 7
Internal Service Departments
Number of law enforcement vehicles 666 651 638 636 558Number of all other vehicles 1,156 1,152 1,219 1,298 1,264
Notes:(1) Prior to 2004, the County used punched card style voting equipment.(2) In FY13 the County had 10 primary microwave repeater and radio sites and 30 secondary radio sites.(3) Holden Ranch Juvenile facility was closed in FY06.
Source: Santa Clara County Departments
COUNTY OF SANTA CLARA
Capital Asset Statistics by Function / ProgramLast Ten Fiscal Years
(Unaudited)
216

Fiscal Year2010 2011 2012 2013 2014
Governmental Activities General Government
16 17 17 17 17 Number of main administration buildings
5,500 5,500 5,500 5,500 5,500 Number of electronic voting machines (1) 1 1 1 1 1 Number of animal shelters
Public Protection0 0 0 0 0 Number of children shelters
40 40 40 40 40 Number of 9-1-1 communications sites (2) 1 1 1 1 1 Number of crime labs3 3 3 3 3 Number of Sheriff's stations and substations1 1 1 1 1 Number of helicopters owned by the County1 1 1 1 1 Number of bomb trucks owned by the County2 2 2 2 2 Number of jail facilities
1,353 1,353 1,353 1,353 1,710 Total capacity of Main jail2,472 2,472 2,472 2,472 3,843 Total capacity of Elmwood correctional facility
3 3 3 2 2 Number of juvenile probation facilities
550 538 538 474 474 Total capacity of all juvenile probation facilities0 0 0 0 0 Number of adult probation facilities0 0 0 0 0 Total capacity of all adult probation facilities8 8 8 15 15 Number of fire stations5 5 5 5 3 Number of fire trucks
37 37 36 19 19 Number of fire engines8 9 9 9 9 Number of Court buildings
Public Ways and Facilities638 635 635 634 637 Road gross miles (urban, rural and expressways)172 173 173 173 125 Number of bridges 164 164 167 164 168 Number of traffic lights213 212 207 219 210 Number of maintenance trucks
Health and Sanitation7 7 8 8 8 Number of neighborhood health centers1 1 1 1 1 Number of alcohol and drug abuse recovery centers
Education8 8 8 8 8 Number of county libraries
1,757 1,829 1,888 1,922 1,850 Number of books (in thousands)
Recreation and Culture29 29 29 29 29 Number of multi-use parks
46,225 46,225 46,225 48,513 49,261 Acreage of parks15 15 15 15 15 Lakes and reservoirs11 11 11 11 11 Boat launch ramps
314 316 321 326 337 Miles of park trails324 326 326 326 326 Number of campsites in County parks
Business - type activities
1 1 1 1 1 Number of main administration buildings1 1 1 1 1 Number of County hospitals
574 574 574 574 574 Number of licensed beds in acute care hospital12 12 12 12 10 Operating rooms7 7 8 8 8 Neighborhood health centers / satellite clinics
Internal Service Departments
534 475 428 440 438 Number of law enforcement vehicles1,222 1,177 967 959 908 Number of all other vehicles
217

This page intentionally left blank.
218
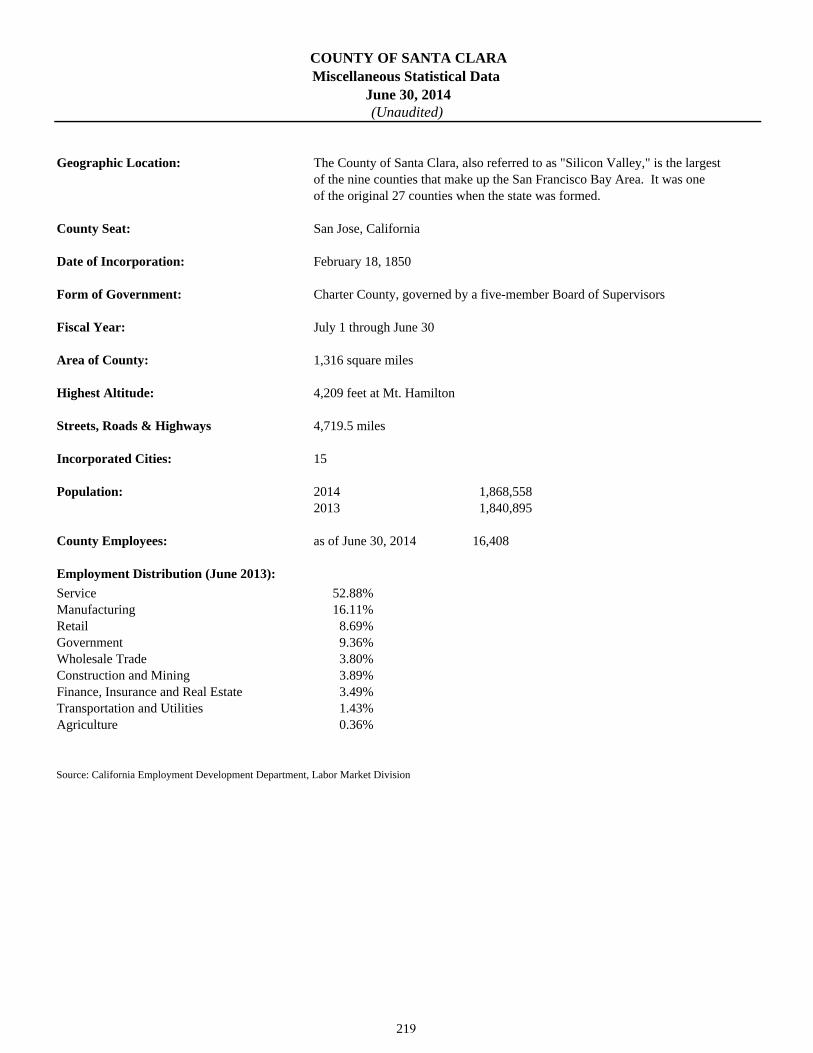
Geographic Location:
of the original 27 counties when the state was formed.
County Seat: San Jose, California
Date of Incorporation: February 18, 1850
Form of Government: Charter County, governed by a five-member Board of Supervisors
Fiscal Year: July 1 through June 30
Area of County: 1,316 square miles
Highest Altitude: 4,209 feet at Mt. Hamilton
Streets, Roads & Highways 4,719.5 miles
Incorporated Cities: 15
Population: 2014 1,868,5582013 1,840,895
County Employees: as of June 30, 2014 16,408
Employment Distribution (June 2013):
Service 52.88%Manufacturing 16.11%Retail 8.69%Government 9.36%Wholesale Trade 3.80%Construction and Mining 3.89%Finance, Insurance and Real Estate 3.49%Transportation and Utilities 1.43%Agriculture 0.36%
Source: California Employment Development Department, Labor Market Division
June 30, 2014
The County of Santa Clara, also referred to as "Silicon Valley," is the largestof the nine counties that make up the San Francisco Bay Area. It was one
COUNTY OF SANTA CLARAMiscellaneous Statistical Data
(Unaudited)
219

This page intentionally left blank.
220

Glossary

This page intentionally left blank.

COUNTY OF SANTA CLARA
Glossary for the Comprehensive Annual Financial Report
221
ACCOUNTS PAYABLE. A short-term liability account reflecting
amounts owed to private persons or organizations for goods and
services received by a government.
ACCOUNTS RECEIVABLE. An asset account reflecting amounts
due from private persons or organizations for goods and services
furnished by a government (but not including amounts due from
other funds or other governments).
ACCRUAL BASIS. The recording of the financial effects on a
government of transactions and other events and circumstances that
have cash consequences for the government in the periods in which
those transactions, events and circumstances occur, rather than only
in the periods in which cash is received or paid by the government.
ACCUMULATED DEPRECIATION. A contra-asset account used
to report the accumulation of periodic credits to reflect the expiration
of the estimated service life of capital assets.
ADVANCE FROM OTHER FUNDS. A liability account used to
record noncurrent portions of a long-term debt owed by one fund to
another fund within the same reporting entity. See DUE TO
OTHER FUNDS and INTERFUND RECEIVABLE/PAYABLE.
ADVANCE TO OTHER FUNDS. An asset account used to record
noncurrent portions of a long-term loan from one fund to another
fund within the same reporting entity. See DUE FROM OTHER
FUNDS.
AGENCY FUND. A fund normally used to account for assets held
by a government as an agent for individuals, private organizations or
other governments and/or other funds.
AMORTIZATION. (1) The portion of the cost of a limited-life or
intangible asset charged as an expense during a particular period. (2)
The reduction of debt by regular payments of principal and interest
sufficient to retire the debt by maturity.
APPROPRIATION. A legal authorization granted by a legislative
body to make expenditures and to incur obligations for specific
purposes. An appropriation usually is limited in amount and time it
may be expended.
ASSESSED VALUATION. A valuation set upon real estate or other
property by a government as a basis for levying taxes.
ASSIGNED FUND BALANCE. Amounts intended to be used by
the County for specific purposes that are neither restricted nor
committed. Intent is expressed by (a) the Board of Supervisors or (b)
a body (for example: a budget or finance committee) or official to
which the Board has delegated the authority to assign amounts to be
used for specific purposes.
AUCTION RATE SECURITIES (ARS). Long term, variable rate
bonds tied to short term interest rates. ARS have a long term nominal
maturity with interest rates reset through a modified Dutch auction,
at predetermined short term intervals, usually 7, 28, or 35 days. ARS
trade at par and are callable at par on any interest payment date at the
option of the issuer. Interest is paid at the current period based on the
interest rate determined in the prior auction period.
AUDITOR’S REPORT. In the context of a financial audit, a
statement by the auditor describing the scope of the audit and the
auditing standards applied in the examination, and setting forth the
auditor's opinion on the fairness of presentation of the financial
information in conformity with GAAP or some other comprehensive
basis of accounting.
BALANCE SHEET. The financial statement disclosing the assets,
deferred outflows of resources, liabilities, deferred inflows of
resources, and equity of an entity at a specified date in conformity
with GAAP.
BASIC FINANCIAL STATEMENTS (BFS). The minimum
combination of financial statements and note disclosures required for
fair presentation in conformity with GAAP. Basic financial
statements have three components: government-wide financial
statements, fund financial statements and notes to the financial
statements.
BASIS OF ACCOUNTING. A term used to refer to when revenues,
expenditures, expenses, and transfers - and the related assets and
liabilities are recognized in the accounts and reported in the financial
statements. Specifically, it relates to the timing of the measurements
made, regardless of the nature of the measurement, on either the cash
or the accrual method.
BUDGET. A plan of financial operation embodying an estimate of
proposed expenditures for a given period and the proposed means of
financing them. Used without any modifier, the term usually
indicates a financial plan for a single fiscal year. The term "budget"

COUNTY OF SANTA CLARA
Glossary for the Comprehensive Annual Financial Report
222
is used in two senses in practice. Sometimes it designates the
financial plan presented to the appropriating governing body for
adoption, and sometimes, the plan finally approved by that body.
BUDGETARY CONTROL. The control or management of a
government or enterprise in accordance with an approved budget to
keep expenditures within the limitations of available appropriations
and available revenues.
CAPITAL ASSETS. Long-lived tangible assets obtained or
controlled as a result of past transactions, events or circumstances.
Capital assets include buildings, equipment, and improvements other
than buildings, land and infrastructure. In the private sector, these
assets are referred to most often as property, plant and equipment.
CAPITAL EXPENDITURES. Expenditures resulting in the
acquisition of or addition to the government's general capital assets.
CAPITALIZATION POLICY. The criteria used by a government
to determine which outlays should be reported as capital assets.
CAPITAL LEASE. An agreement that conveys the right to use
property, plant or equipment, usually for a stated period of time. See
LEASE-PURCHASE AGREEMENTS.
CAPITAL PROJECTS FUND. A fund created to account for
financial resources to be used for the acquisition or construction of
major capital facilities (other than those financed by proprietary
funds and trust funds).
CASH BASIS. A basis of accounting under which transactions are
recognized only when cash is received or disbursed.
CASH WITH FISCAL AGENT. An asset account reflecting
deposits with fiscal agents, such as commercial banks, for the
payment of bond principal and interest.
CERTIFICATE OF ACHIEVEMENT FOR EXCELLENCE IN
FINANCIAL REPORTING PROGRAM. A voluntary program
administered by the GFOA to encourage governments to publish
efficiently organized and easily readable CAFR’s and to provide
technical assistance and peer recognition to the finance officers
preparing them.
CHANGE IN THE FAIR VALUE OF INVESTMENTS. The
difference between the fair value of investments at the beginning of
the year and at the end of the year, taking into consideration
investment purchases, sales, and redemptions.
COMMITTED FUND BALANCE. Amounts that can only be used
for the specific purpose determined by a formal action of the
County’s highest level of decision-making authority, the Board of
Supervisors. Commitments may be changed or lifted only be the
County taking the same formal action that imposed the constraint
originally.
COMPENSATED ABSENCES. Absences, such as vacation, illness
and holidays, for which it is expected employees will be paid. The
term does not encompass severance or termination pay,
postretirement benefits, deferred compensation or other long-term
fringe benefits, such as group insurance and long-term disability pay.
COMPREHENSIVE ANNUAL FINANCIAL REPORT (CAFR).
A financial report that encompasses all funds and component units of
the government. The CAFR should contain (a) the basic financial
statements and required supplementary information, (b) combining
statements to support columns in the basic financial statements that
aggregate information from more than one fund or component unit,
and (c) individual fund statements as needed. The CAFR is the
governmental unit’s official annual report and also should contain
introductory information, schedules necessary to demonstrate
compliance with finance-related legal and contractual provisions, and
statistical data.
CONCENTRATION OF CREDIT RISK. The risk of loss
attributed to the magnitude of a government’s investment in a single
issuer.
CONTINGENT LIABILITY. Items that may become liabilities as
a result of conditions undetermined at a given date, such as
guarantees, pending lawsuits, judgments under appeal, unsettled
disputed claims, unfilled purchase orders and uncompleted contracts.
Contingent liabilities should be disclosed within the financial
statements (including the notes) when there is a reasonable
possibility a loss may have been incurred. Guarantees, however,
should be disclosed even though the possibility of loss may be
remote.
CREDIT RISK. The risk that an issuer or a counter-party to an
investment will not fulfill its obligations.

COUNTY OF SANTA CLARA
Glossary for the Comprehensive Annual Financial Report
223
CURRENT FINANCIAL RESOURCES MEASUREMENT
FOCUS. Measurement focus according to which the aim of a set of
financial statements is to report the near-term (current) inflows,
outflows, and balances of expendable (spendable) financial
resources. The current financial resources measurement focus is
unique to accounting and financial reporting for state and local
governments and is used solely for reporting the financial position
and results of operations of governmental funds.
DEBT. An obligation resulting from the borrowing of money or
from the purchase of goods and services. Debts of governments
include bonds, time warrants and notes.
DEBT SERVICE FUND. A fund established to account for the
accumulation of resources for, and the payment of, general long-term
debt principal and interest.
DEFERRED CHARGES. Expenditures that are not chargeable to
the fiscal period in which they were made but that are carried as an
asset on the balance sheet, pending amortization or other disposition
(e.g. bond issuance costs). Deferred charges differ from prepaid
items in that they usually extend over a long period of time (more
than five years) and are not regularly recurring costs of operation.
DEFERRED INFLOWS/OUTFLOWS. Net resources acquired
(inflow) or consumed (outflow) by a government that is applicable to
a future reporting period.
DEFICIT. (1) The excess of the liabilities of a fund over its assets.
(2) The excess of expenditures over revenues during an accounting
period or, in the case of proprietary funds, the excess of expenses
over revenues during an accounting period.
DEFINED BENEFIT PENSION PLAN. A pension plan having
terms that specify the amount of pension benefits to be provided at a
future date or after a certain period of time; the amount specified
usually is a function of one or more factors such as age, years of
service, and compensation.
DEPRECIATION. (1) Expiration in the service life of capital
assets, other than wasting assets, attributable to wear and tear,
deterioration, action of the physical elements, inadequacy and
obsolescence. (2) The portion of the cost of a capital asset, other than
a wasting asset, charged as an expense during a particular period. In
accounting for depreciation, the cost of a capital asset, less any
salvage value, is prorated over the estimated service life of such an
asset, and each period is charged with a portion of such cost.
Through this process, the entire cost of the asset is ultimately charged
off as an expense.
DUE FROM OTHER FUNDS. An asset account used to indicate
amounts owed to a particular fund by another fund for goods sold or
services rendered. This account includes only short-term obligations
on open account, not interfund loans.
DUE TO OTHER FUNDS. A liability account reflecting amounts
owed by a particular fund to another fund for goods sold or services
rendered. These amounts include only short-term obligations on open
account, not interfund loans.
ECONOMIC RESOURCES MEASUREMENT FOCUS.
Measurement focus under which the aim of a set of financial
statements is to report all inflows, outflows, and balances affecting or
reflecting an entity’s net position. The economic resources
measurement focus is used for proprietary and fiduciary funds, as
well as for government-wide financial reporting. It is also used by
business enterprises in the private sector.
ENCUMBRANCES. Commitments related to unperformed
(executory) contracts for goods or services. Used in budgeting,
encumbrances are not GAAP expenditures or liabilities, but represent
the estimated amount of expenditures ultimately to result if
unperformed contracts in process are completed.
ENTERPRISE FUND. Proprietary fund type used to report an
activity for which a fee is charged to external users for goods and
services.
EXPENDITURE-DRIVEN GRANTS. Government-mandated or
voluntary nonexchange transactions in which expenditure is the
prime factor for determining eligibility. Also referred to as
reimbursement grants.
EXCHANGE-LIKE TRANSACTION. Transaction in which there
is an identifiable exchange between the reporting government and
another party, but the values exchanged may not be quite equal or the
direct benefits of the exchange may not be exclusively for the parties
to the exchange.

COUNTY OF SANTA CLARA
Glossary for the Comprehensive Annual Financial Report
224
EXPENDITURES. Decreases in net financial resources.
Expenditures include current operating expenses requiring the
present or future use of net current assets, debt service and capital
outlays, and intergovernmental grants, entitlement and shared
revenues.
EXPENSES. Outflows or other using up of assets or incurrences of
liabilities (or a combination of both) from delivering or producing
goods, rendering services or carrying out other activities that
constitute the entity's ongoing major or central operations.
EXTERNAL AUDITORS. Independent auditors typically engaged
to conduct an audit of a government’s financial statements.
EXTERNAL INVESTMENT POOL. An arrangement that
commingles (pools) the moneys of more than one legally separate
entity and invests, on the participants’ behalf, in an investment
portfolio; one or more of the participants is not part of the sponsors
reporting entity. An external investment pool can be sponsored by an
individual government, jointly by more than one government, or by a
nongovernmental entity. An investment pool that is sponsored by an
individual state or local government is an external investment pool if
it includes participation by a legally separate entity that is not part of
the same reporting entity as the sponsoring government. If a
government-sponsored pool includes only the primary government
and its component units, it is an internal investment pool and not an
external investment pool.
FAIR VALUE. The amount at which a financial instrument could be
exchanged in a current transaction between willing parties, other than
in a forced or liquidation sale.
FEDERAL DEPOSIT INSURANCE CORPORATION. A
corporation created by the federal government that insures deposits
in banks and savings associations.
FIDUCIARY FUNDS. The trust and agency funds used to account
for assets held by a government unit in a trustee capacity or as an
agent for individuals, private organizations, other government units
and/or other funds.
FINANCIAL RESOURCES. Resources that are or will become
available for spending. Financial resources include cash and
resources ordinarily expected to be converted to cash (e.g.
receivables, investments). Financial resources may also include
inventories and pre-paids (because they obviate the need to expend
current available resources).
FISCAL AGENT. A fiduciary agent, usually a bank or county
treasurer, who performs the function of paying debt principal and
interest when due.
FOREIGN EXCHANGE RISK. The risk that changes in exchange
rate will adversely affect the fair value of an investment or a deposit.
FUND. A fiscal and accounting entity with a self-balancing set of
accounts in which cash and other financial resources, all related
liabilities and residual equities, or balances, and changes therein, are
recorded and segregated to carry on specific activities or attain
certain objectives in accordance with special regulations, restrictions
or limitations.
FUND BALANCE. The difference between fund assets and fund
liabilities of governmental and similar trust funds.
FUND FINANCIAL STATEMENTS. Basic financial statements
presented on the basis of funds. Term used in contrast with
government-wide financial statements.
FUND TYPE. Any one of eleven categories into which all funds are
classified in governmental accounting. The eleven fund types are:
general, special revenue, debt service, capital projects, permanent,
enterprise, internal service, pension (and other employee benefit)
trust, investment trust, private-purpose trust, and agency.
GENERAL REVENUES. All revenues that are not required to be
reported as program revenues. All taxes, even those that are levied
for a specific purpose, are general revenues and should be reported
by type of tax – for example, property tax, sales tax, transient
occupancy tax. All other nontax revenues (including interest,
unrestricted grants and contributions) that do not meet the criteria to
be reported as program revenues should also be reported as general
revenues.
GENERAL FUND. The general fund is one of five governmental
fund types and typically serves as the chief operating fund of the
government. The general fund is used to account for all financial
resources except those required to be accounted for in another fund.

COUNTY OF SANTA CLARA
Glossary for the Comprehensive Annual Financial Report
225
GENERALLY ACCEPTED ACCOUNTING PRINCIPLES
(GAAP). The conventions, rules, and procedures that serve as the
norm for the fair presentation of financial statements. The various
sources of GAAP for state and local governments are set forth by
SAS No. 69, The Meaning of “Present Fairly in Conformity with
Generally Accepted Accounting Principles” in the Independent
Auditor’s Report.
GOVERNMENTAL ACCOUNTING. The composite activity of
analyzing, recording, summarizing, reporting and interpreting the
financial transactions of governments.
GOVERNMENTAL ACCOUNTING STANDARDS BOARD
(GASB). The ultimate authoritative accounting and financial
reporting standard-setting body for state and local governments. The
GASB was established in June 1984 to replace the National Council
on Governmental Accounting (NCGA).
GOVERNMENTAL FUNDS. Funds generally used to account for
tax-supported activities. There are five different types of
governmental funds: the general fund, special revenue funds, debt
service funds, capital projects funds and permanent funds.
GOVERNMENT-WIDE FINANCIAL STATEMENTS. Financial
statements that incorporate all of a government’s governmental and
business-type activities, as well as its nonfiduciary component units.
There are two basic government-wide financial statements: the
statement of net position and the statement of activities. Both basic
governmental financial statements are presented using the economic
resources measurement focus and the accrual basis of accounting.
INFRASTRUCTURE. Long-lived capital assets that normally are
stationary in nature and normally can be preserved for a significantly
greater number of years than most capital assets. Examples of
infrastructure assets include roads, bridges, tunnels, drainage
systems, water and sewer systems, dams and lighting systems.
INTEREST RATE RISK. The risk that changes in interest rates
will adversely affect the fair value of an investment or a deposit.
INTERFUND RECEIVABLE/PAYABLE. Short-term loans made
by one fund to another, or the current portion of an advance to or
from another fund.
INTERFUND TRANSFERS. Flow of assets (such as cash or
goods) between funds and blended component units of the primary
government without equivalent flows of assets in return and without
a requirement for payment.
INTERNAL SERVICE FUND. A fund used to account for the
financing of goods or services provided by one department or agency
to other departments or agencies of a government, or to other
governments, on a cost-reimbursement basis.
JOINT VENTURE. A legal entity or other contractual arrangement
in which a government participates as a separate and specific activity
for the benefit of the public or service recipients and in which the
government retains an ongoing financial interest.
LAPSE. As applied to appropriations, the automatic termination of
an appropriation. Except for indeterminate appropriations and
continuing appropriations, an appropriation is made for a certain
period of time. At the end of this period, any unexpended or
unencumbered balance thereof lapses, unless otherwise provided by
law.
LEASE-PURCHASE AGREEMENTS. Contractual agreements
that are termed leases, but that in substance are purchase contracts.
LEGAL LEVEL OF BUDGETARY CONTROL. The level at
which spending in excess of budgeted amounts would be a violation
of law.
LEVEL OF BUDGETARY CONTROL. The level at which a
government’s management may not reallocate resources without
special approval from the legislative body.
LIABILITIES. Probable future sacrifices of economic benefits,
arising from present obligations of a particular entity to transfer
assets or provide services to other entities in the future as a result of
past transactions or events.
LOANS RECEIVABLE. An asset account reflecting amounts
loaned to individuals or organizations external to a government,
including notes taken as security for such loans. Loans to other funds
and governments should be recorded and reported separately.
MAJOR FUND. A governmental fund or enterprise fund reported as
a separate column in the basic fund financial statements. The general
fund is always a major fund. Otherwise, major funds are funds whose

COUNTY OF SANTA CLARA
Glossary for the Comprehensive Annual Financial Report
226
revenues/expenditures, assets or liabilities are at least 10 percent of
corresponding totals for all government or enterprise funds and at
least 5 percent of the aggregate amount for all governmental and
enterprise funds for the same item. Any other government or
enterprise fund may be reported as a major fund if the government’s
officials believe that fund is particularly important to financial
statement users.
MANAGEMENT’S DISCUSSION AND ANALYSIS. A
component of required supplementary information used to introduce
the basic financial statements and to provide an analytical overview
of the government’s financial activities.
MEASUREMENT FOCUS. A way of presenting an entity’s
financial performance and position by considering which resources
are measured (financial or economic) and when the effects of
transactions or events involving those resources are recognized (the
basis of accounting). The measurement focus of government-wide
financial statements, proprietary fund financial statements and
fiduciary fund financial statements is economic resources. The
measurement focus of governmental fund financial statements is
current financial resources.
MODIFIED ACCRUAL BASIS. The accrual basis of accounting
adapted to the governmental fund-type measurement focus. Under it,
revenues and other financial resource increments (e.g. bond issue
proceeds) are recognized when they become susceptible to accrual,
that is when they become both "measurable" and "available to
finance expenditures of the current period." "Available" means
collectible in the current period or soon enough thereafter to be used
to pay liabilities of the current period. Generally, expenditures are
recognized when the fund liability is incurred. All governmental
funds, expendable trust funds and agency funds are accounted for
using the modified accrual basis of accounting.
NET PENSION/OPEB OBLIGATION/ASSET. In the context of
defined benefit pension and other postemployment benefit plans, the
cumulative difference between annual pension cost and the
employer’s contributions to the plan, including the pension/OPEB
liability (asset) at transition, if any, and excluding (a) short-term
differences and (b) unpaid contributions that have been converted to
pension-related/OPEB-related debt/asset.
NONSPENDABLE FUND BALANCE. Amounts that are (a) not in
spendable form or (b) legally or contractually required to be
maintained intact. The “not in spendable form” criterion includes
items that are not expected to be converted to cash, for example:
inventories, prepaid amounts, and long-term notes receivable.
OTHER FINANCING SOURCES. An increase in current financial
resources that is reported separately from revenues to avoid
distorting revenue trends. The use of the other financing sources
category is limited to items so classified by GAAP.
OTHER POSTEMPLOYMENT BENEFIT (OPEB).
Postemployment benefits other than pension benefits. OPEB include
postemployment healthcare benefits, regardless of the type of plan
that provides them, and all postemployment benefits provided
separately from a pension plan, excluding benefits as termination
offers and benefits.
OPERATING LEASE. When a lease dose not transfer ownership
rights, risks and rewards from the lessor to the lessee, the lease is
called an operation lease and is similar to a rental.
OTHER FINANCING USES. A decrease in current financial
resources that is reported separately from expenditures to avoid
distorting expenditure trends. The use of other financing uses
category is limited to items so classified by GAAP.
OVERLAPPING DEBT. The proportionate share property within
each government must bear of the debts of all local governments
located wholly or in part within the geographic boundaries of the
reporting government. Except for special assessment debt, the
amount of debt of each unit applicable to the reporting unit is arrived
at by (1) determining what percentage of the total assessed value of
the overlapping jurisdiction lies within the limits of the reporting
unit, and (2) applying this percentage to the total debt of the
overlapping jurisdiction. Special assessment debt is allocated on the
basis of the ratio of assessment receivable in each jurisdiction, which
will be used wholly or in part to pay off the debt, to total assessments
receivable, which will be used wholly or in part for this purpose.
PROGRAM REVENUES. Term used in connection with the
government-wide statement of activities. Revenues that derive
directly from the program itself or from parties outside the reporting
government’s taxpayers or citizenry, as a whole; they reduce the net
cost of the function to be financed from the government’s general
revenues.

COUNTY OF SANTA CLARA
Glossary for the Comprehensive Annual Financial Report
227
PROPRIETARY FUNDS. Funds that focus on the determination of
operating income, changes in net position (or cost recovery),
financial position, and cash flows. There are two different types of
proprietary funds: enterprise funds and internal service funds.
REBATABLE ARBITRAGE. A term used in connection with the
reinvestment of the proceeds of tax-exempt debt. A requirement to
remit to the federal government interest revenue in excess of interest
costs when the proceeds from the sale of tax-exempt securities are
reinvested in a taxable money market instrument with a materially
higher yield.
REPORTING ENTITY. The oversight unit and all of its component
units, if any, that are combined in the CAFR/BFS.
REQUIRED SUPPLEMENTARY INFORMATION. Consists of
statements, schedules, statistical data or other information which,
according to the GASB, is necessary to supplement, although not
required to be a part of the basic financial statements.
RESTRICTED ASSETS. Assets whose use is subject to constraints
that are either (a) externally imposed by creditors (such as through
debt covenants), grantors, contributors, or laws or regulations of
other governments or (b) imposed by law through constitutional
provisions or enabling legislation.
RESTRICTED NET POSITION. A component of net position
calculated by reducing the carrying value of restricted assets by the
amount of any related debt outstanding.
REVENUE BONDS. Bonds whose principal and interest are
payable exclusively from earnings of an enterprise fund. In addition
to a pledge of revenues, such bonds sometimes contain a mortgage
on the enterprise fund's property.
RISK MANAGEMENT. All the ways and means used to avoid
accidental loss or to reduce its consequences if it does occur.
SELF-INSURANCE. A term often used to describe the retention by
an entity of a risk of loss arising out of the ownership of property or
from some other cause, instead of transferring that risk to an
independent third party through the purchase of an insurance policy.
It is sometimes accompanied by the setting aside of assets to fund
any related losses. Because no insurance is involved, the term self-
insurance is a misnomer.
SINGLE AUDIT. An audit performed in accordance with the Single
Audit Act of 1984, as amended in 1996 and Office of Management
and Budget’s (OMB) Circular A-133, Audits of State and Local
Governments and Non-Profit Organizations. The Single Audit Act
allows or requires governments (depending on the amount of federal
assistance expended) to have one audit performed to meet the needs
of all federal agencies.
SPECIAL DISTRICT. An independent unit of local government
organized to perform a single government function or a restricted
number of related functions. Special districts usually have the power
to incur debt and levy taxes; however, certain types of special
districts are entirely dependent upon enterprise earnings and cannot
impose taxes. Examples of special districts are water districts,
drainage districts, flood control districts, hospital districts, fire
protection districts, transit authorities, port authorities and electric
power authorities.
SPECIAL REVENUE FUND. A fund used to account for the
proceeds of specific revenue sources (other than expendable trusts or
major capital projects) that are legally restricted to expenditure for
specified purposes.
TAX AND REVENUE ANTICIPATION NOTES (TRANS).
Notes issued in anticipation of the collection of taxes and revenues,
usually retirable only from tax collections, and frequently only from
the proceeds of the tax and revenues levy whose collection they
anticipate.
TRUST FUNDS. Funds used to account for assets held by a
government in a trustee capacity for individuals, private
organizations, other governments and/or other funds.
UNASSIGNED FUND BALANCE. The residual classification for
the General Fund and includes all spendable amounts not contained
in the other classifications. Unassigned amounts are technically
available for any purpose.
UNMODIFIED OPINION. An opinion rendered without
modifications by the independent auditor that financial statements are
fairly presented.
UNRESTRICTED NET POSITION. That portion of net position
that is neither restricted nor invested in capital assets (net of related
debt).

COUNTY OF SANTA CLARA
Glossary for the Comprehensive Annual Financial Report
228
VARIABLE-RATE INVESTMENT. An investment with terms
that provide for the adjustment of its interest rate (such as the last day
of the month or a calendar quarter) and that, upon each adjustment
until the final maturity of the instrument or the period remaining until
the principal amount can be recovered through demand, can
reasonably be expected to have a fair value that will be unaffected by
interest rate change.

Comprehensive Annual Financial ReportFiscal Year Ended June 30, 2014 5334 REV 12/14