Embed Size (px)
Citation preview
County Offices of EducationRoles and Responsibilities
February 4, 2015
Wendy Benkert, Ed.D.Associate Superintendent, Business Services
Chris LombardoDirector, Business Services
2
Topics Role of the County Superintendent of
Schools Local Control Funding Formula Local Control Accountability Plans Relationships Interaction with the Property Tax
Manager Recent legislation
3
Role of the County Superintendent of Schools
4
County Superintendents California’s 58 County Superintendents of Schools
support the financial and academic soundness of every district and school in the state.
County Superintendents work collaboratively with school districts to ensure that every student benefits from a quality educational experience, regardless of their circumstances, including students with disabilities, juvenile offenders, students at risk of dropping out or who thrive in alternative classroom settings, or students in high-priority schools.
County Superintendents strive to ensure that every student in every community achieves and is prepared to learn continuously throughout life, to successfully enter the workforce, and to be active citizens.
5
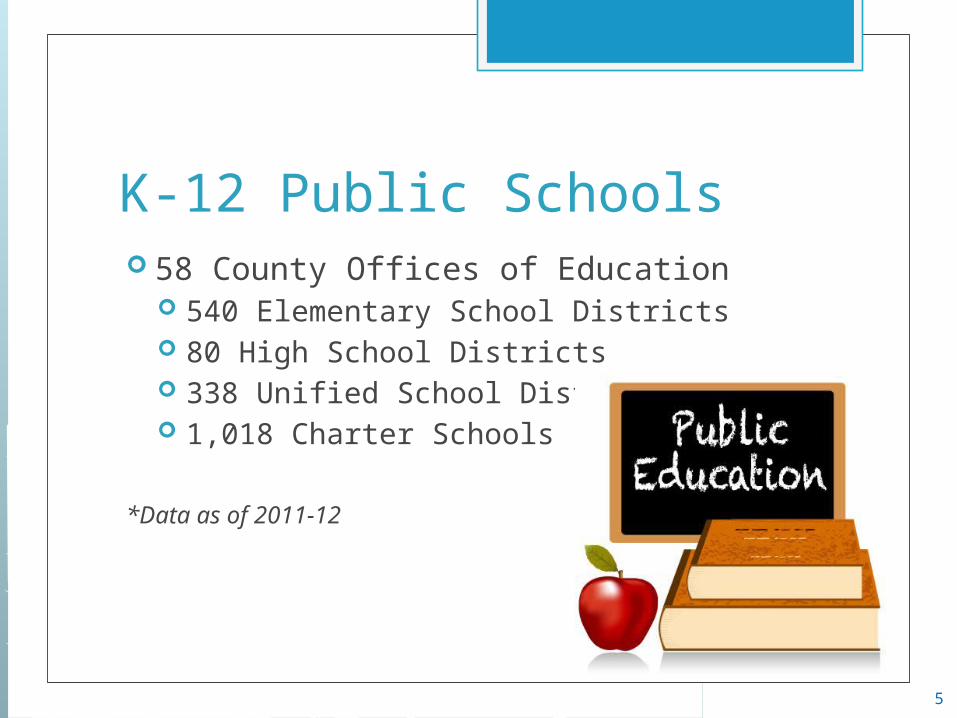
K-12 Public Schools 58 County Offices of Education
540 Elementary School Districts 80 High School Districts 338 Unified School Districts 1,018 Charter Schools
*Data as of 2011-12
6
Los Angeles
Orange
San Bernardino
Sacramento
Fresno
Contra Costa
San Joaquin
Tulare
Monterey
Placer
Solano
Merced
Imperial
Marin
Madera
-
200
,000
400
,000
600
,000
800
,000
1,0
00,0
00
1,2
00,0
00
1,4
00,0
00
1,6
00,0
00
1,8
00,0
00
1,552,704 503,096 500,487
426,227 411,583
276,175 240,216
222,681 198,460
179,680 173,020
141,978 141,720
106,126 101,099 94,667
74,684 70,932 70,141 67,686 63,825 58,394 56,461
40,295 36,976 34,747 32,793 31,069 30,861
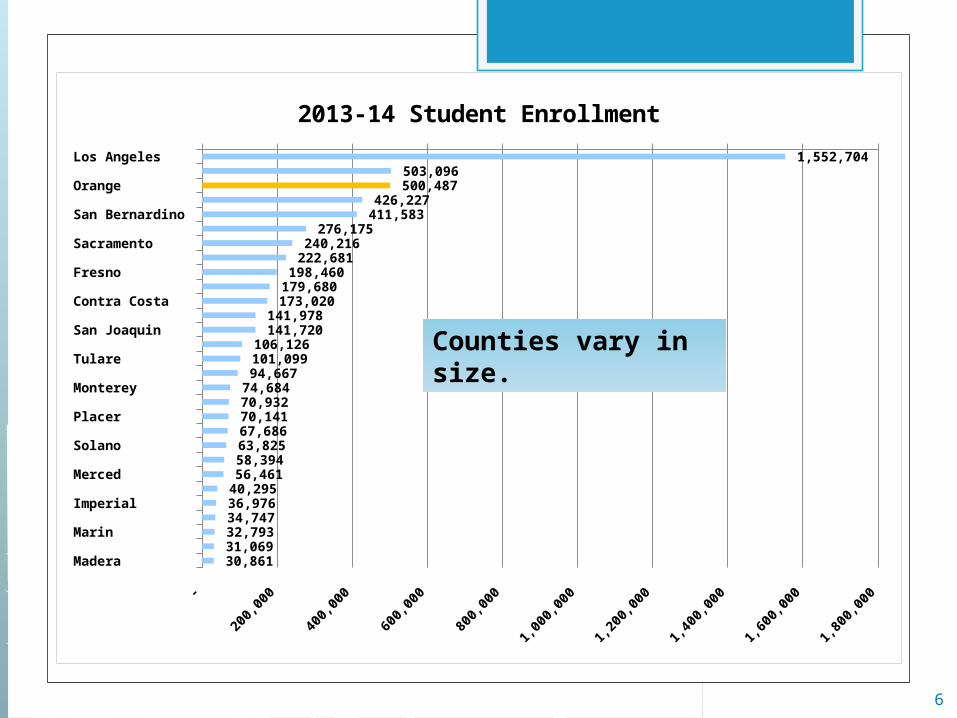
2013-14 Student Enrollment
Counties vary in size.
7
Yolo Kings
El Dorado Shasta Sutter Napa
Humboldt Yuba
Mendocino Nevada San Benito Tehama
Lake Tuolumne
Siskiyou Calaveras
Glenn Inyo
Lassen Colusa
Amador Del Norte Plumas Mono
Mariposa Trinity
Modoc Sierra Alpine
- 5,000 10,000 15,000 20,000 25,000 30,000 35,000
29,185 28,628
27,237 26,935
21,390 20,868
18,054 13,892
13,148 12,354
11,206 10,502
9,016 6,236
5,847 5,837
5,544 5,080
4,541 4,518
4,165 4,144
2,163 2,006 1,895
1,577 1,454
377 90
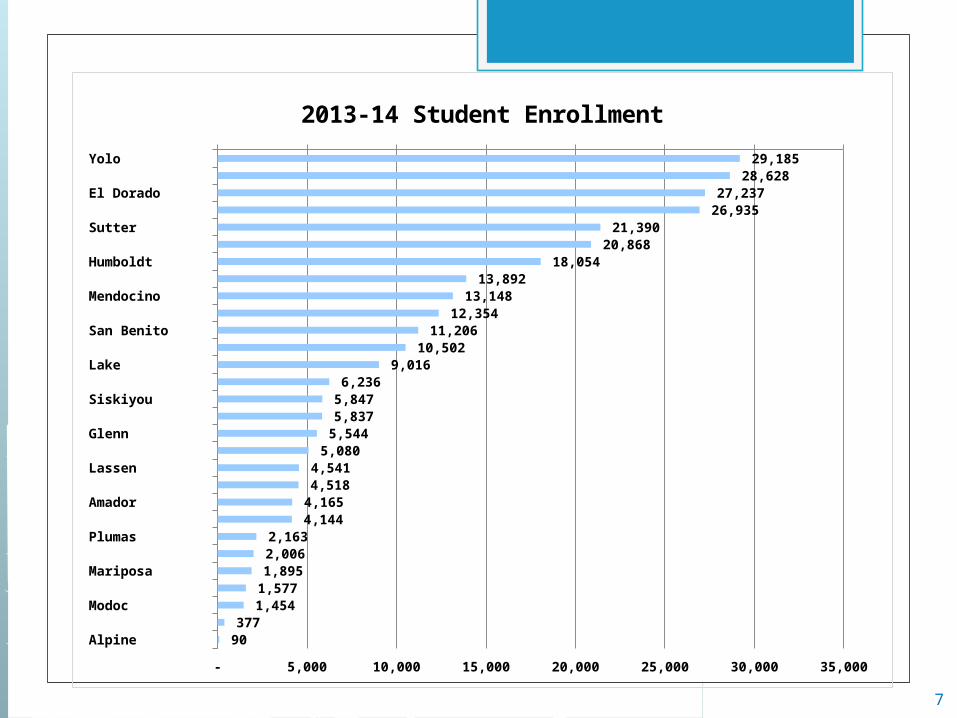
2013-14 Student Enrollment
8
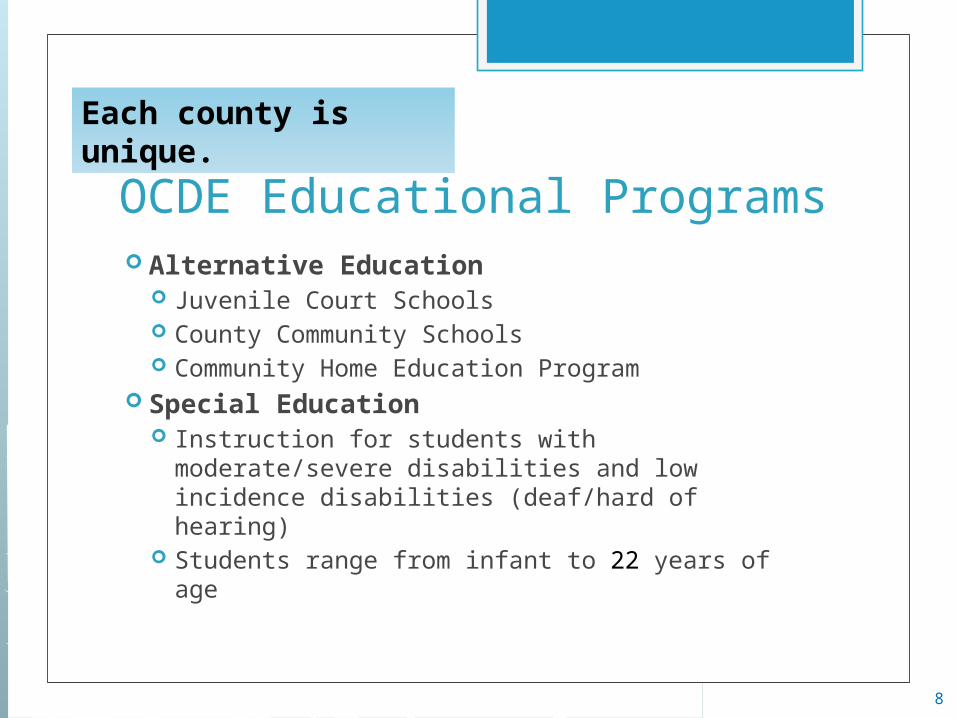
OCDE Educational Programs Alternative Education
Juvenile Court Schools County Community Schools Community Home Education Program
Special Education Instruction for students with
moderate/severe disabilities and low incidence disabilities (deaf/hard of hearing)
Students range from infant to 22 years of age
Each county is unique.
9
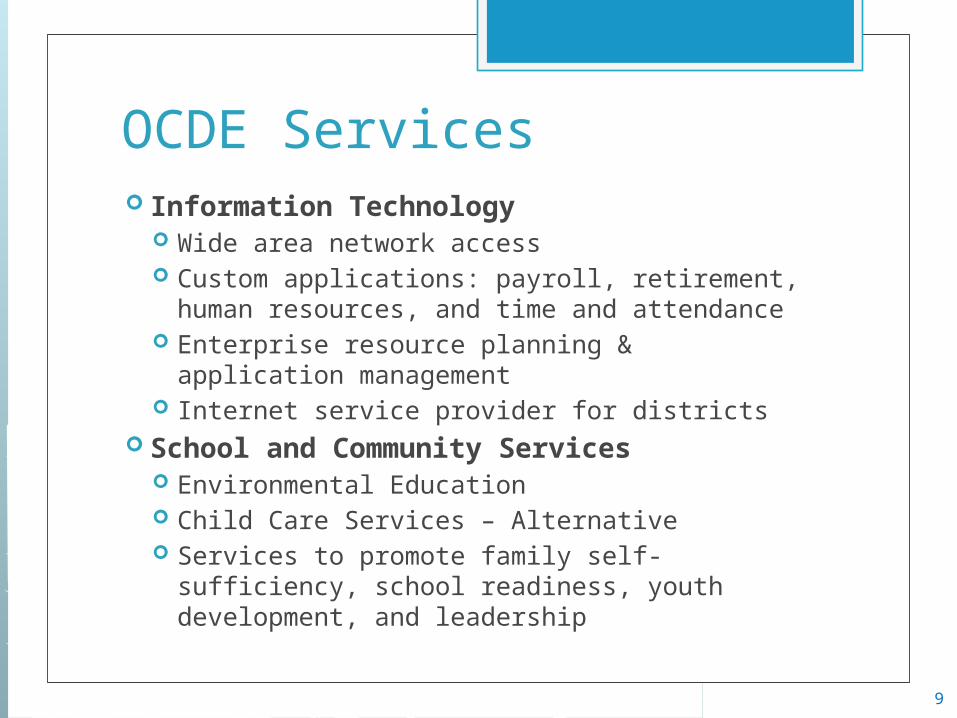
OCDE Services Information Technology
Wide area network access Custom applications: payroll, retirement,
human resources, and time and attendance Enterprise resource planning & application
management Internet service provider for districts
School and Community Services Environmental Education Child Care Services – Alternative Services to promote family self-sufficiency,
school readiness, youth development, and leadership
10
Behind-the-Scenes Business FunctionsDeliver services in a collaborative
manner that support the educational programs of districts & OCDE, partner agencies & business community
11
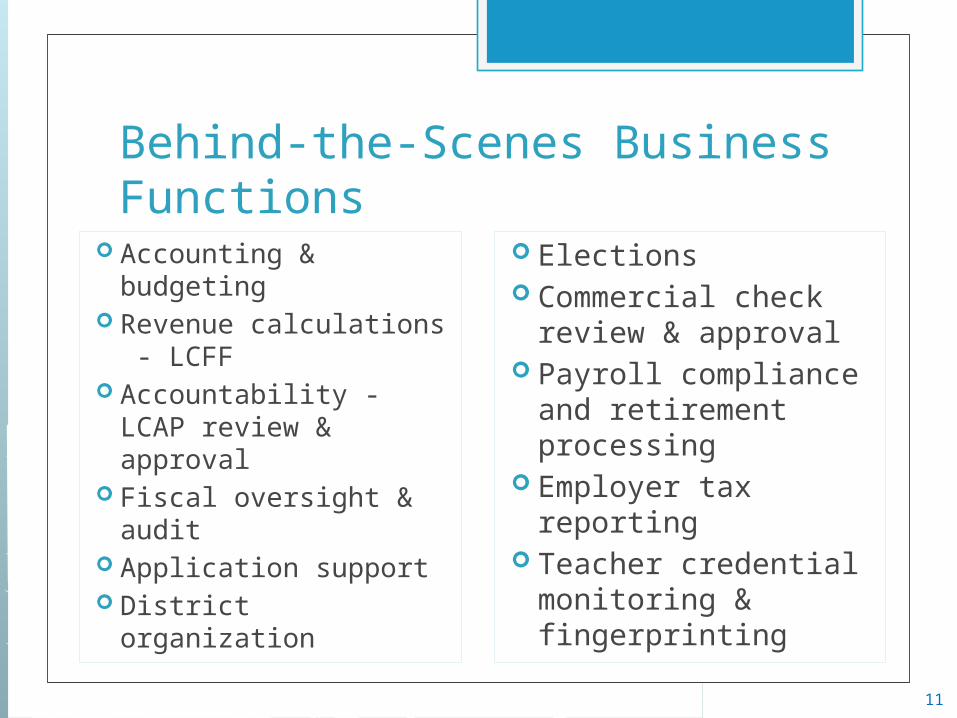
Behind-the-Scenes Business Functions
Accounting & budgeting
Revenue calculations - LCFF
Accountability - LCAP review & approval
Fiscal oversight & audit
Application support District organization
Elections Commercial check
review & approval Payroll compliance
and retirement processing
Employer tax reporting
Teacher credential monitoring & fingerprinting
12
Behind-the-Scenes Business Functions Liaison to state, federal & county agencies
Conduit to state agencies for districts and schools operated by county office
Meet on a monthly basis with district counterparts Meet on a monthly basis with state leaders in
finance (Department of Finance, California Department of Education, Fiscal Crisis Management Assistance Team (FCMAT)
Share information from local districts with staff & policy makers so they understand impact of policies
Liaison to county agencies on behalf of districts (Treasurer-Tax Collector, Auditor-Controller, Assessor, Registrar of Voters)
13
Local Control Funding Formula
14
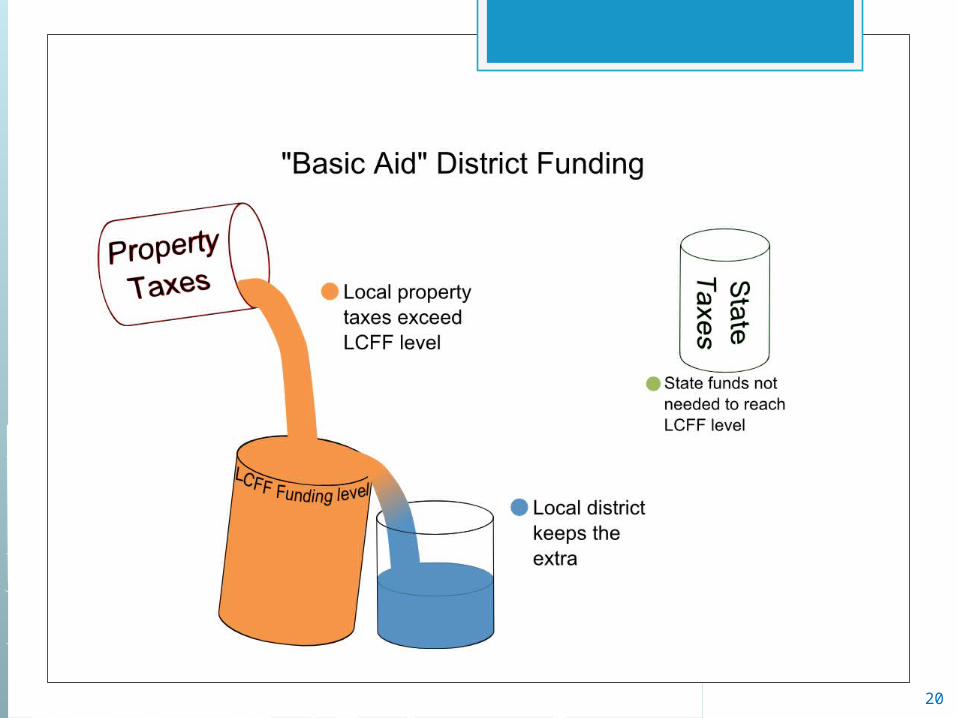
Local Control Funding Formula (LCFF) For 40 years, schools were funded with
a formula called “Revenue Limits” In 2013-14, Governor Jerry Brown
implemented the “Local Control Funding Formula” (LCFF)
LCFF eliminated over 50 state restricted programs (categoricals) and redistributes future funding based on student needs
15
LCFF Additional funding goes to school
districts with English Learners, students eligible for free or reduced price meals, and Foster Youths Funds are directed to districts based on
unduplicated pupil counts One of the primary goals of the LCFF is
to close the achievement gap The LCFF formula promotes equity,
transparency, and performance
16
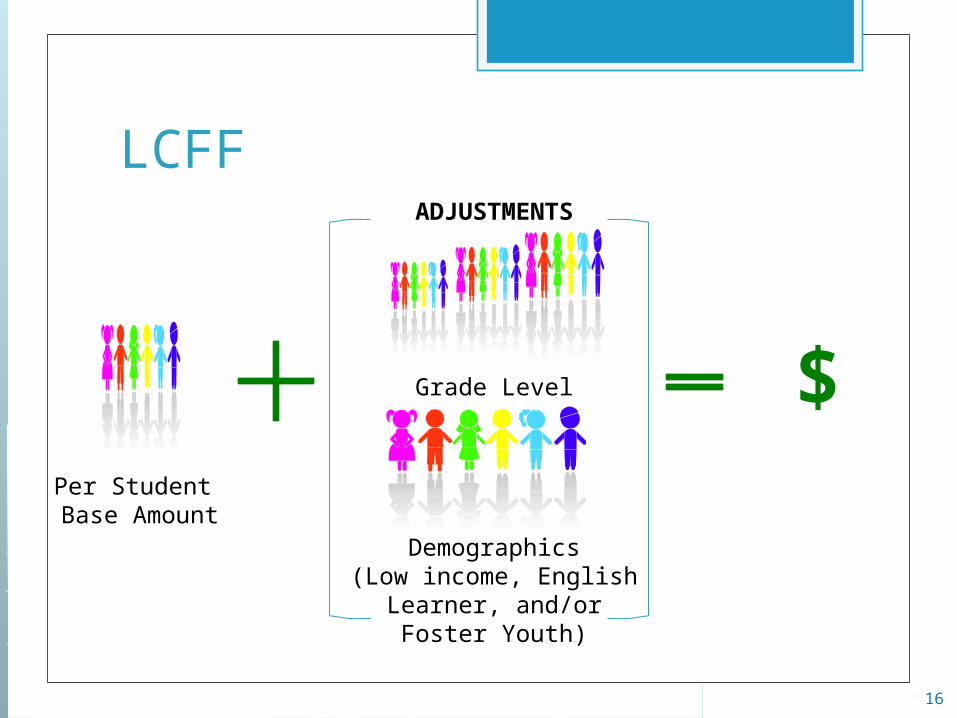
LCFF
$Per Student Base Amount
Grade Level
Demographics(Low income, English Learner, and/or Foster
Youth)
ADJUSTMENTS
17
MercedMaderaTulare
ImperialMonterey
FresnoColusaGlenn
San BernardinoLake
MendocinoKern
Los AngelesYuba
TehamaStanislaus
KingsModoc
San JoaquinDel Norte
Santa BarbaraSan Francisco
SutterRiverside
TrinityButte
Statewide AverageSacramento
AlpineMono
SiskiyouShasta
Santa CruzSan Benito
YoloMariposa
HumboldtInyo
San DiegoVenturaPlumasSolanoOrange
TuolumneSonoma
NapaCalaveras
SierraAlameda
San Luis ObispoLassen
Santa ClaraContra Costa
AmadorSan Mateo
NevadaEl Dorado
PlacerMarin
0% 10% 20% 30% 40% 50% 60% 70% 80% 90%
81%79%79%79%
76%75%
75%73%73%73%73%
73%72%72%
71%71%70%70%70%
68%67%67%67%67%
65%63%63.28%
62%62%
61%61%
60%59%
59%58%
57%57%56%
55%55%
54%54%54%
53%51%
50%50%49%49%
48%47%
45%44%
44%43%
42%32%
32%29%
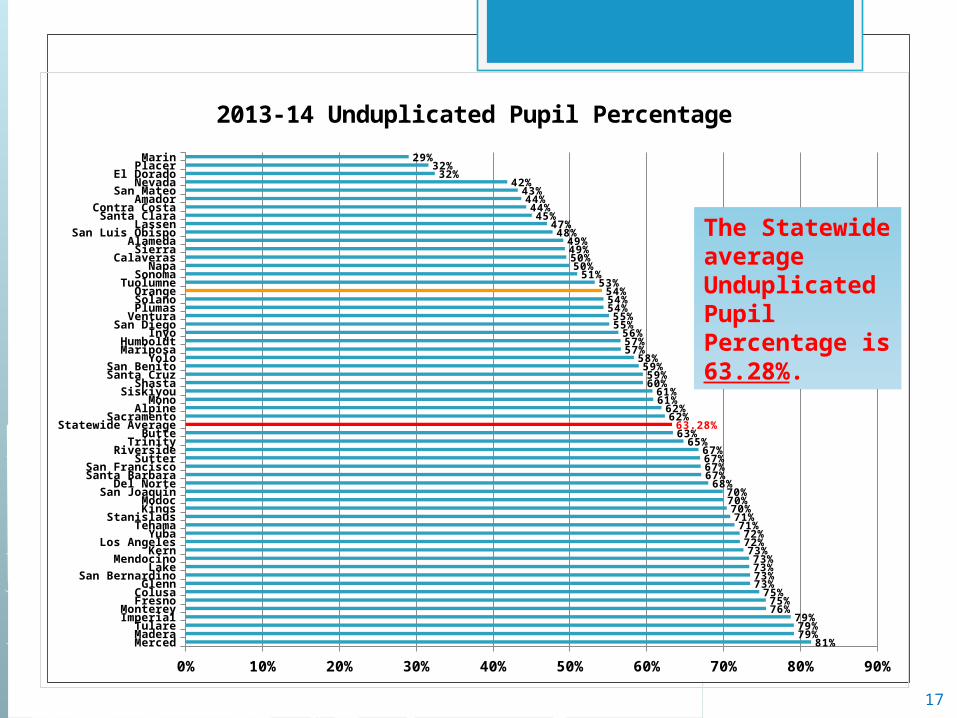
2013-14 Unduplicated Pupil Percentage
The Statewide average Unduplicated Pupil Percentage is 63.28%.
18
1 2 3 4 5 6 7 8 9 10 11 12 13 14 15 16 17 18 19 20 21 22 23 24 25 26 270%
10%
20%
30%
40%
50%
60%
70%
80%
90%
100%
10% 15% 2
0%
23% 2
8%
30%
31%
33%
33% 3
9% 44%
45%
45%
46%
48%
50%
52%
68% 7
5%
76%
79%
79%
80%
80%
88%
91% 94%
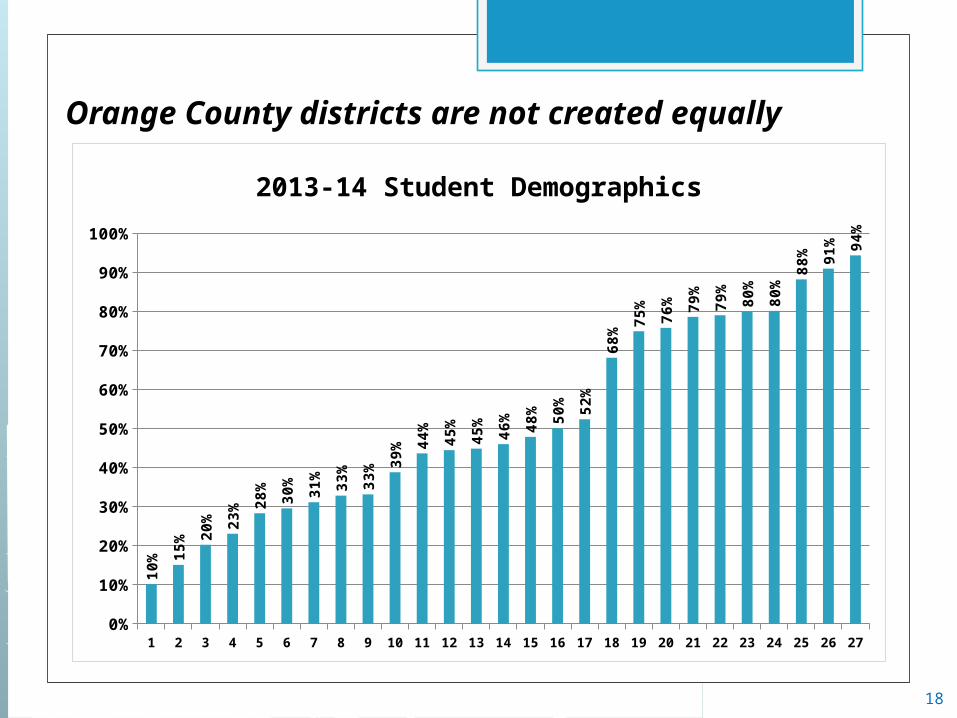
2013-14 Student Demographics
Orange County districts are not created equally
19
20
21
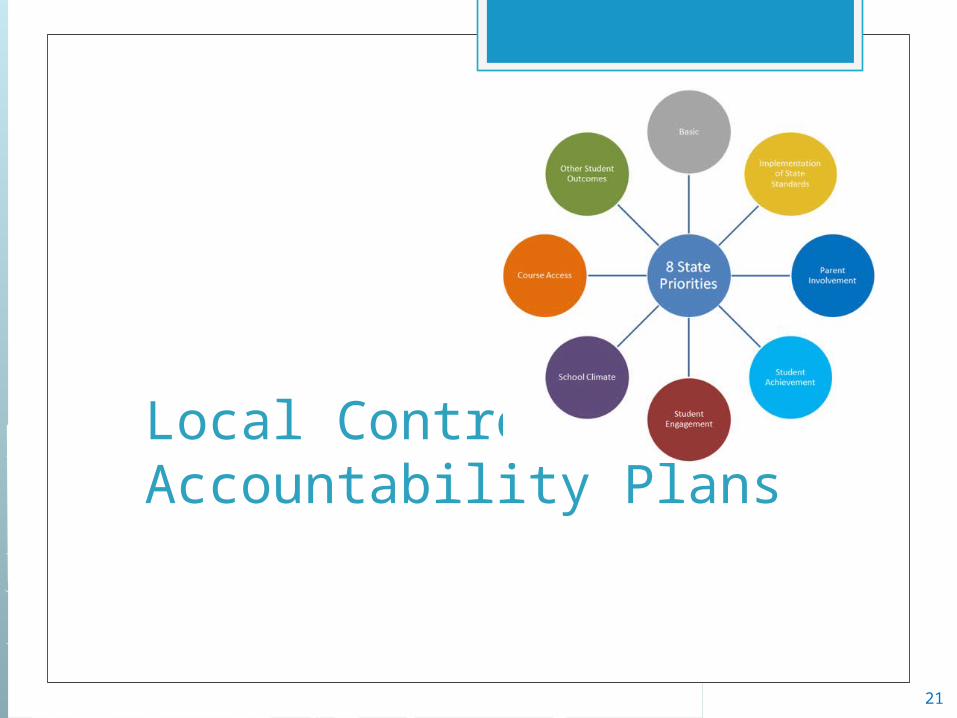
Local Control Accountability Plans
22
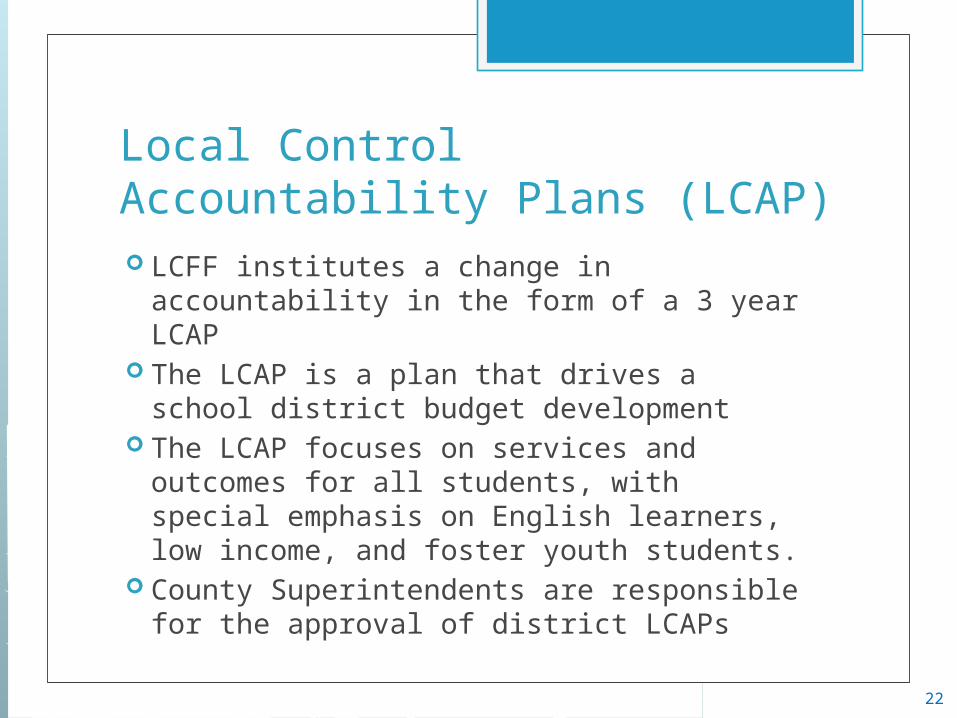
Local Control Accountability Plans (LCAP) LCFF institutes a change in accountability
in the form of a 3 year LCAP The LCAP is a plan that drives a school
district budget development The LCAP focuses on services and
outcomes for all students, with special emphasis on English learners, low income, and foster youth students.
County Superintendents are responsible for the approval of district LCAPs
23
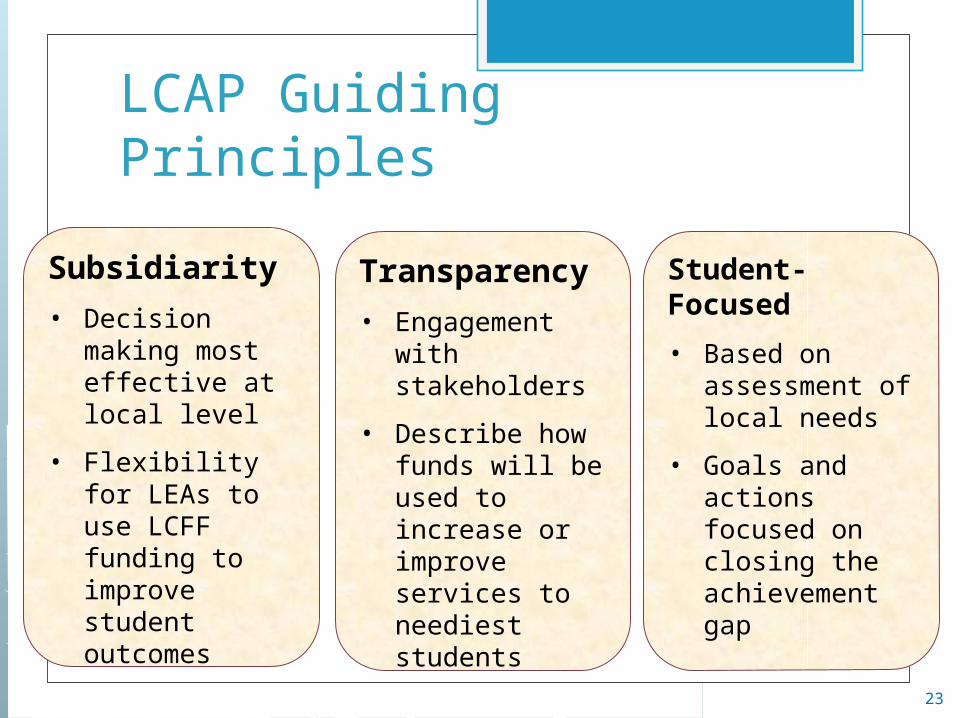
LCAP Guiding Principles
Subsidiarity
• Decision making most effective at local level
• Flexibility for LEAs to use LCFF funding to improve student outcomes
Transparency
• Engagement with stakeholders
• Describe how funds will be used to increase or improve services to neediest students
Student-Focused
• Based on assessment of local needs
• Goals and actions focused on closing the achievement gap
24
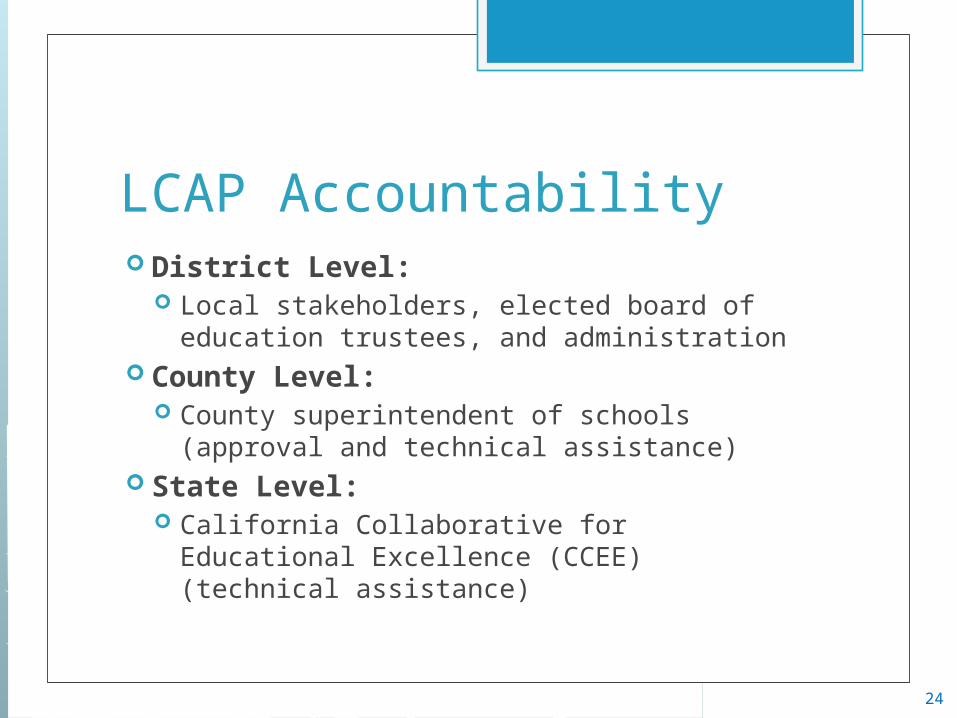
LCAP Accountability District Level:
Local stakeholders, elected board of education trustees, and administration
County Level: County superintendent of schools
(approval and technical assistance) State Level:
California Collaborative for Educational Excellence (CCEE) (technical assistance)
25
Relationships
26
Relationships Meet and greet Timely follow through on all requests Provide accurate, contextualized, and
meaningful data and support Clear explanations of services offered
and how these services may be obtained
Sharing best practices
27
Interaction with the Property Tax Manager
28
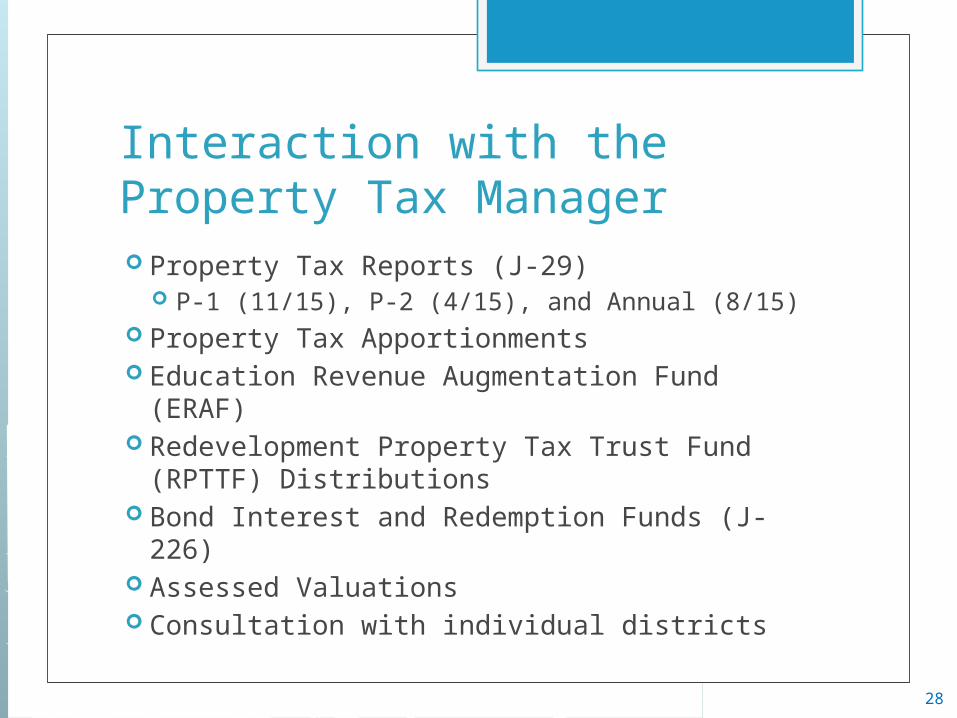
Interaction with the Property Tax Manager Property Tax Reports (J-29)
P-1 (11/15), P-2 (4/15), and Annual (8/15) Property Tax Apportionments Education Revenue Augmentation Fund
(ERAF) Redevelopment Property Tax Trust Fund
(RPTTF) Distributions Bond Interest and Redemption Funds (J-
226) Assessed Valuations Consultation with individual districts
29
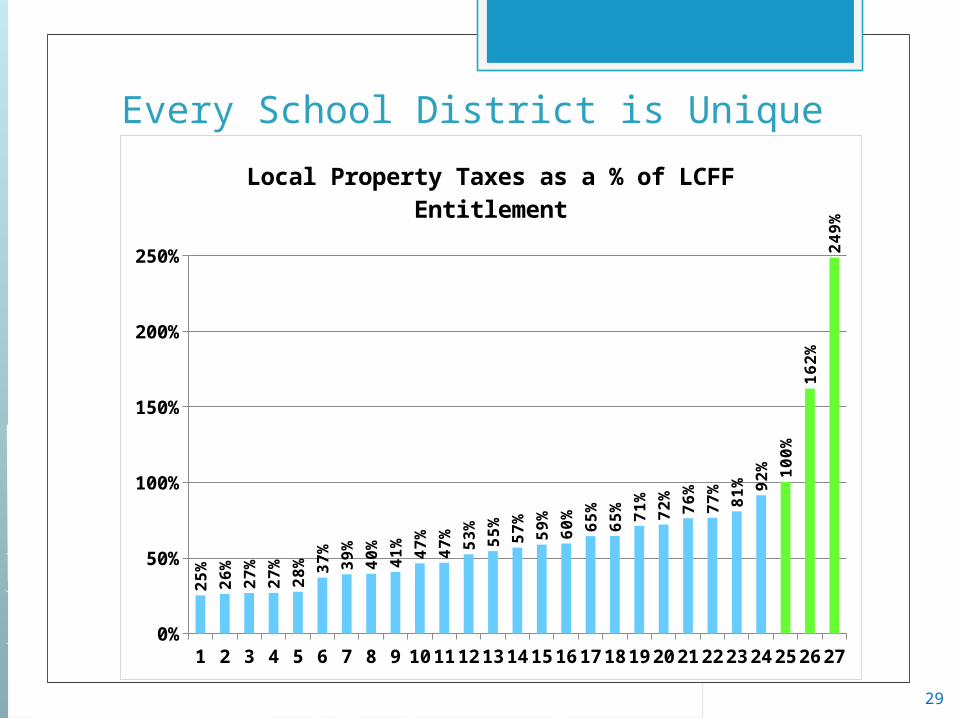
Every School District is Unique
1 3 5 7 9 11 13 15 17 19 21 23 25 270%
50%
100%
150%
200%
250%
25%
26%
27%
27%
28% 37%
39%
40%
41%
47%
47%
53%
55%
57%
59%
60%
65%
65%
71%
72%
76%
77%
81% 92% 100%
162%
249%
Local Property Taxes as a % of LCFF En-titlement
30
Quick Facts about School District Property Taxes The most reliable revenue source for schools Provide a large source of school district cash flow Secured taxes are the lion’s share of taxes (In
Orange County, secured accounts for 86% of Total Taxes)
Property taxes account for 46% of Orange County K-12 general fund revenues
Schools account for property taxes on a cash basis
Triple flip is projected to end after 2014-15
31
Recent Legislation
32
Recent Legislation ABx1 26 – Redevelopment Dissolution
Local taxes for schools now distributed by county auditors
Schools now receive three types of apportionments:1. Pass-throughs2. Residuals3. One-time distributions
AB 182 – School Bonds
33
Future for K-12 Education LCFF is not anticipated to be fully
implemented until 2020-21 In 2015-16, schools are to receive additional
funds for LCFF, reversal of deferrals, and partial payment for prior year mandate claims
Increased employer rates for CalSTRS and CalPERS
LCAP implementation continues Redevelopment dissolution continues

34
Thank you Questions?