Embed Size (px)
DESCRIPTION
California’s housing market continued to pick up steam as existing home sales and prices propelled higher, with both posting back-to-back increases in March. The County MLS median price and sales data in the tables are generated from a survey of more than 90 associations of REALTORS® throughout the state, and represent statistics of existing single-family detached homes only.
Citation preview
CALIFORNIAHOUSING MARKETUPDATE
Monthly Sales and Price Statistics
April 2015
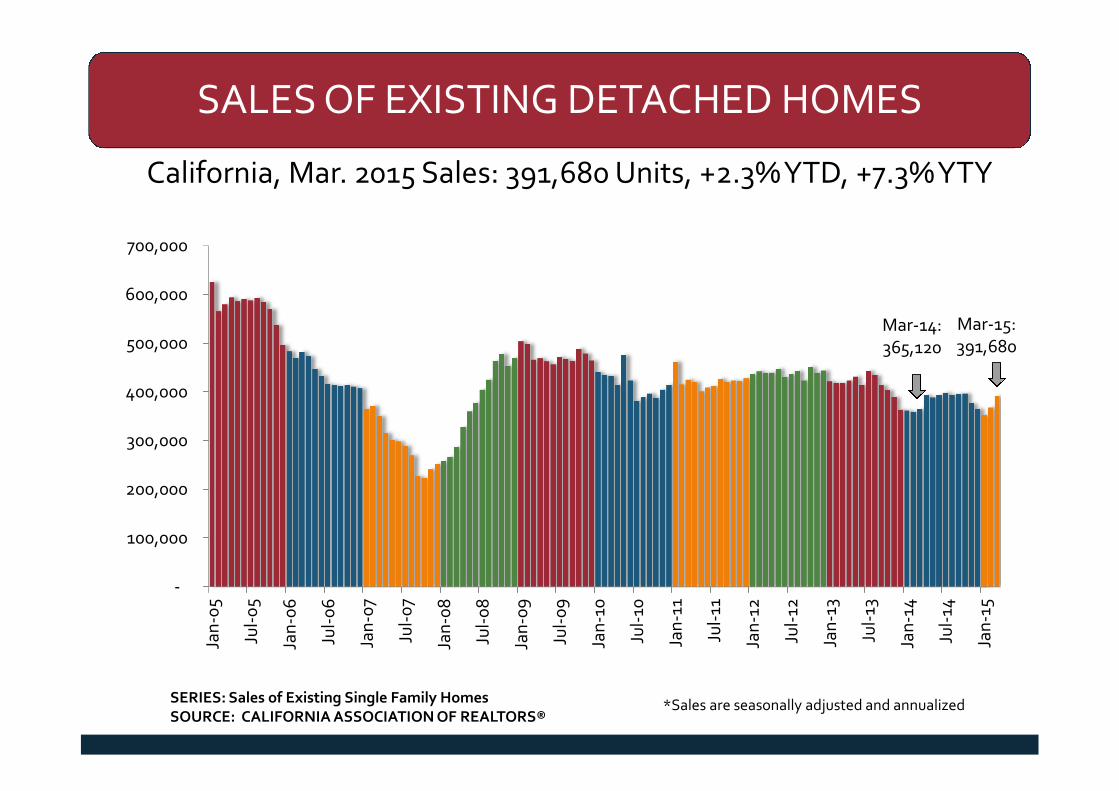
SALES OF EXISTING DETACHED HOMES
California, Mar. 2015 Sales: 391,680 Units, +2.3%YTD, +7.3%YTY
-
100,000
200,000
300,000
400,000
500,000
600,000
700,000
Jan
-05
Jul-
05
Jan
-06
Jul-
06
Jan
-07
Jul-
07
Jan
-08
Jul-
08
Jan
-09
Jul-
09
Jan
-10
Jul-
10
Jan
-11
Jul-
11
Jan
-12
Jul-
12
Jan
-13
Jul-
13
Jan
-14
Jul-
14
Jan
-15
*Sales are seasonally adjusted and annualizedSERIES: Sales of Existing Single Family HomesSOURCE: CALIFORNIA ASSOCIATION OF REALTORS®
Mar-15:391,680
Mar-14:365,120
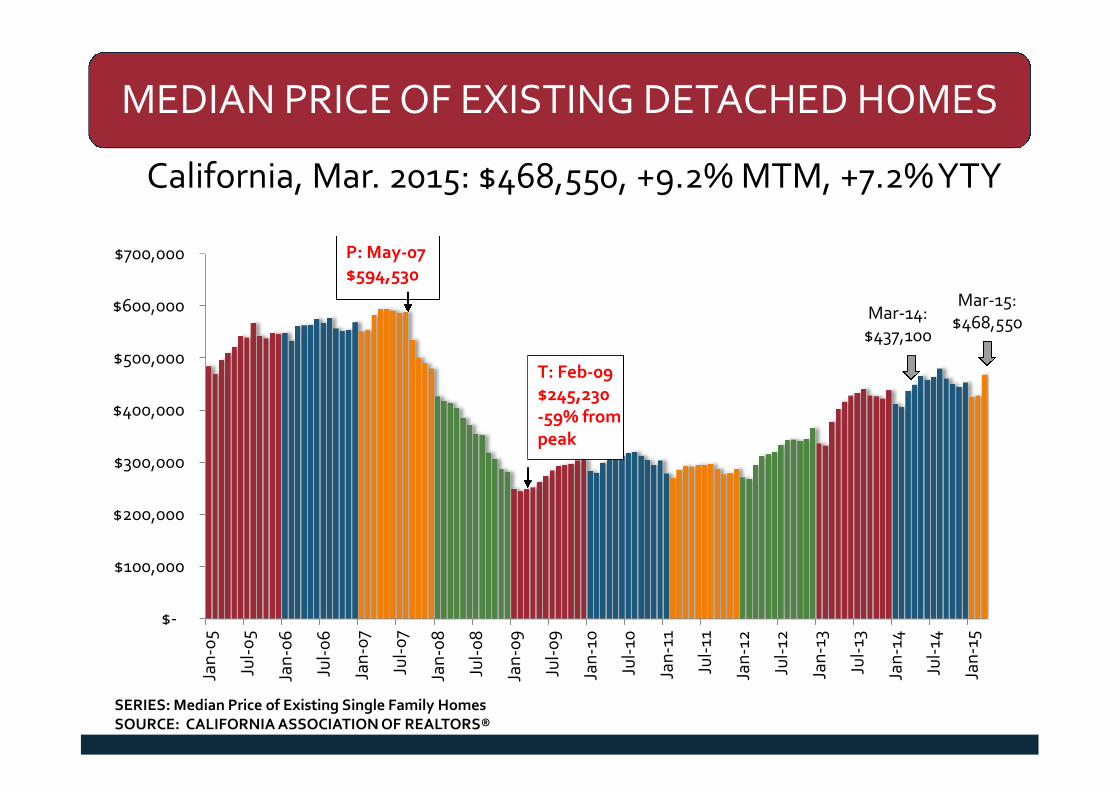
MEDIAN PRICE OF EXISTING DETACHED HOMES
California, Mar. 2015: $468,550, +9.2% MTM, +7.2%YTY
$-
$100,000
$200,000
$300,000
$400,000
$500,000
$600,000
$700,000
Jan
-05
Jul-
05
Jan
-06
Jul-
06
Jan
-07
Jul-
07
Jan
-08
Jul-
08
Jan
-09
Jul-
09
Jan
-10
Jul-
10
Jan
-11
Jul-
11
Jan
-12
Jul-
12
Jan
-13
Jul-
13
Jan
-14
Jul-
14
Jan
-15
P: May-07$594,530
T: Feb-09$245,230-59% frompeak
SERIES: Median Price of Existing Single Family HomesSOURCE: CALIFORNIA ASSOCIATION OF REALTORS®
Mar-15:$468,550
Mar-14:$437,100
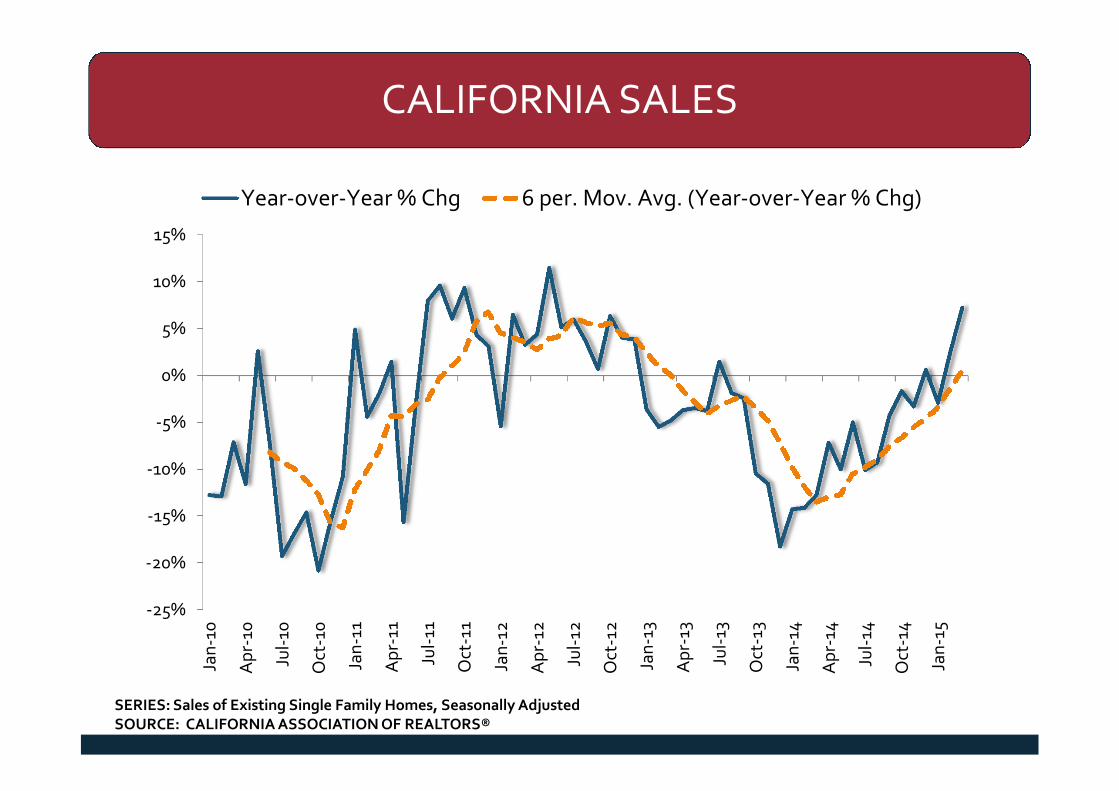
CALIFORNIA SALES
SERIES: Sales of Existing Single Family Homes, Seasonally AdjustedSOURCE: CALIFORNIA ASSOCIATION OF REALTORS®
-25%
-20%
-15%
-10%
-5%
0%
5%
10%
15%
Jan
-10
Ap
r-10
Jul-
10
Oct
-10
Jan
-11
Ap
r-11
Jul-
11
Oct
-11
Jan
-12
Ap
r-12
Jul-
12
Oct
-12
Jan
-13
Ap
r-13
Jul-
13
Oct
-13
Jan
-14
Ap
r-14
Jul-
14
Oct
-14
Jan
-15
Year-over-Year % Chg 6 per. Mov. Avg. (Year-over-Year % Chg)
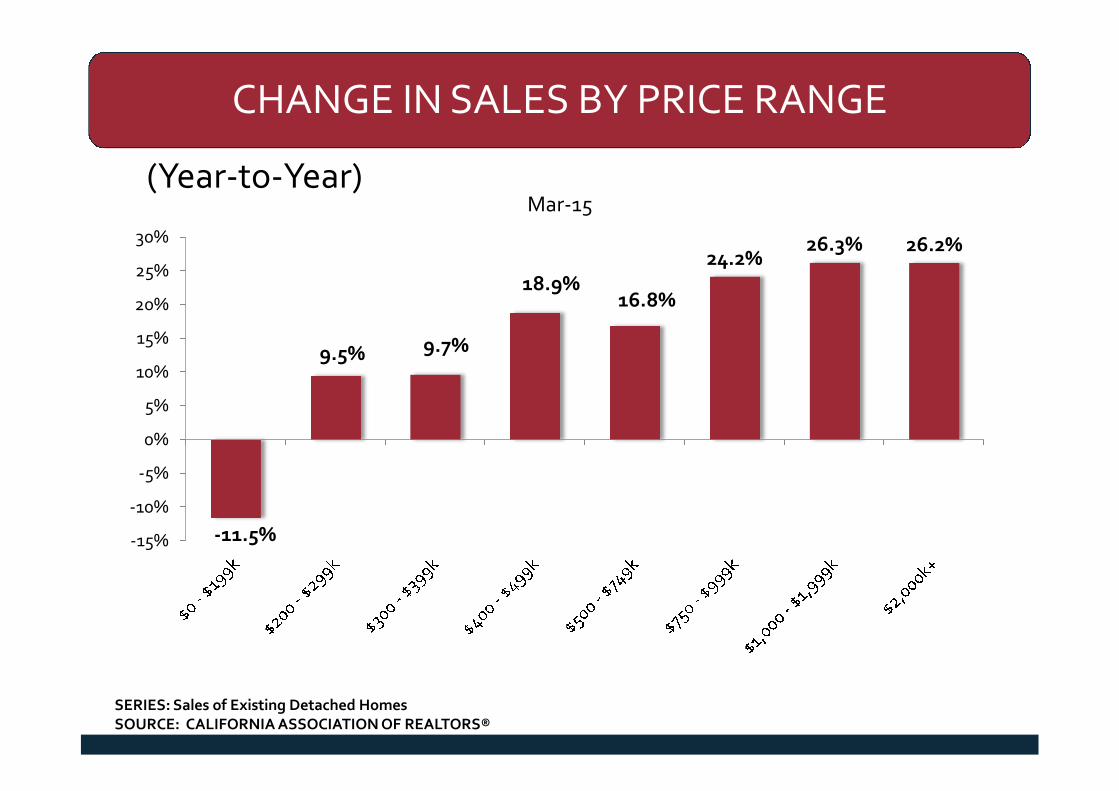
CHANGE IN SALES BY PRICE RANGE
(Year-to-Year)
-11.5%
9.5% 9.7%
18.9%16.8%
24.2%26.3% 26.2%
-15%
-10%
-5%
0%
5%
10%
15%
20%
25%
30%
Mar-15
SERIES: Sales of Existing Detached HomesSOURCE: CALIFORNIA ASSOCIATION OF REALTORS®
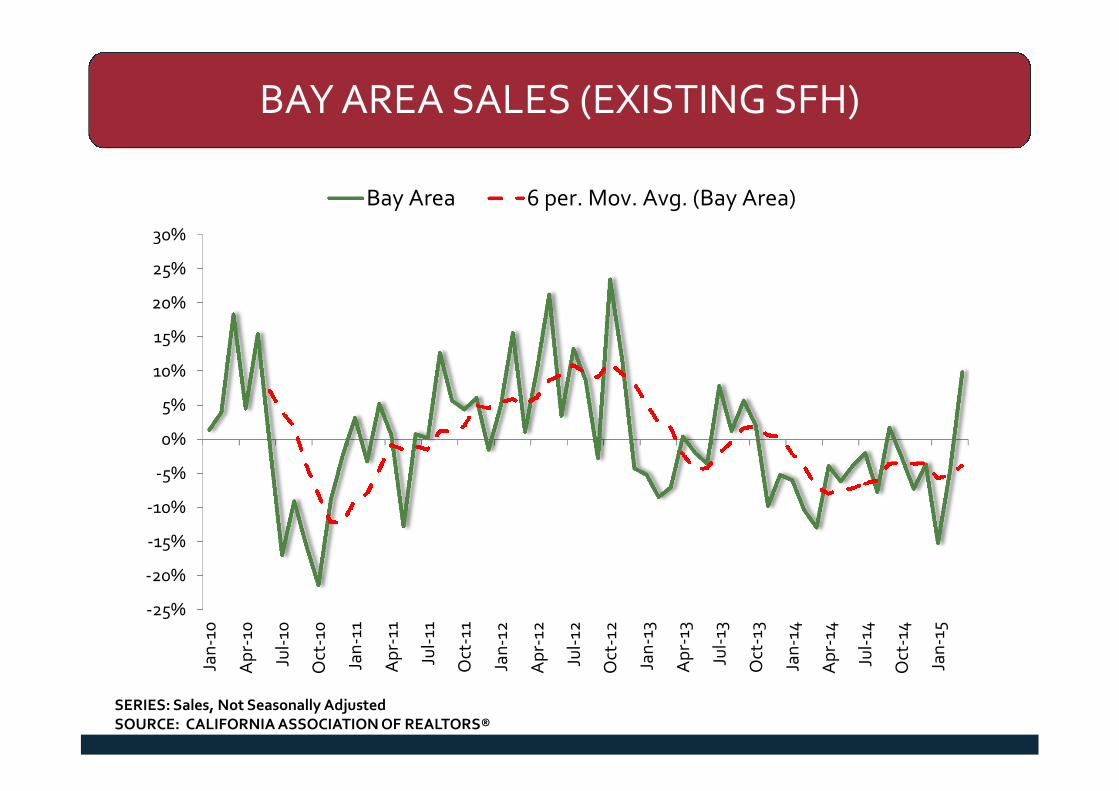
BAY AREA SALES (EXISTING SFH)
SERIES: Sales, Not Seasonally AdjustedSOURCE: CALIFORNIA ASSOCIATION OF REALTORS®
-25%
-20%
-15%
-10%
-5%
0%
5%
10%
15%
20%
25%
30%
Jan
-10
Ap
r-10
Jul-
10
Oct
-10
Jan
-11
Ap
r-11
Jul-
11
Oct
-11
Jan
-12
Ap
r-12
Jul-
12
Oct
-12
Jan
-13
Ap
r-13
Jul-
13
Oct
-13
Jan
-14
Ap
r-14
Jul-
14
Oct
-14
Jan
-15
Bay Area 6 per. Mov. Avg. (Bay Area)
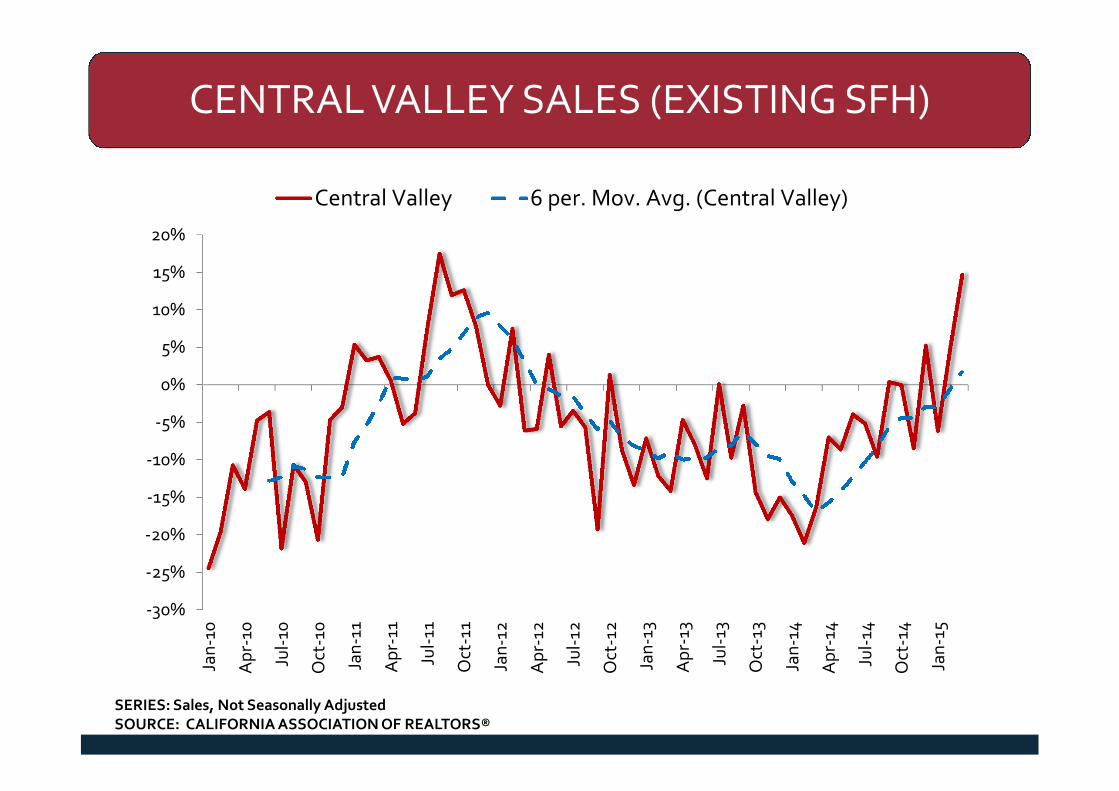
CENTRAL VALLEY SALES (EXISTING SFH)
SERIES: Sales, Not Seasonally AdjustedSOURCE: CALIFORNIA ASSOCIATION OF REALTORS®
-30%
-25%
-20%
-15%
-10%
-5%
0%
5%
10%
15%
20%
Jan
-10
Ap
r-10
Jul-
10
Oct
-10
Jan
-11
Ap
r-11
Jul-
11
Oct
-11
Jan
-12
Ap
r-12
Jul-
12
Oct
-12
Jan
-13
Ap
r-13
Jul-
13
Oct
-13
Jan
-14
Ap
r-14
Jul-
14
Oct
-14
Jan
-15
Central Valley 6 per. Mov. Avg. (Central Valley)
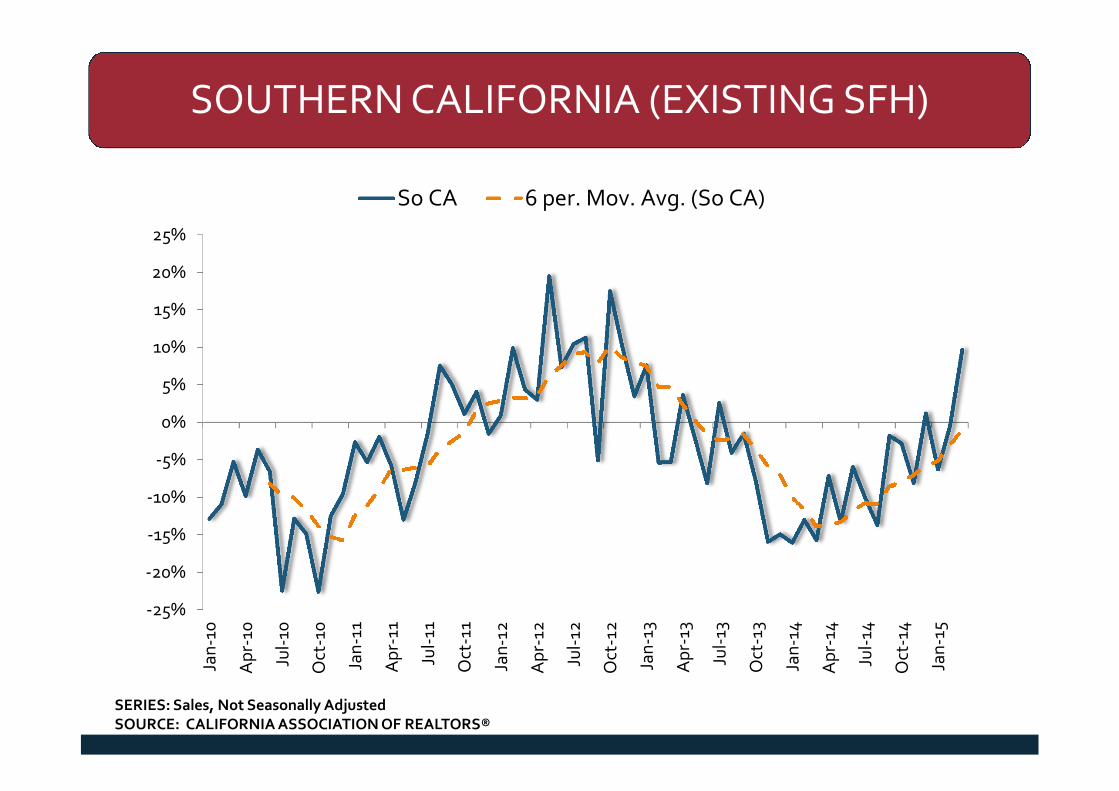
SOUTHERN CALIFORNIA (EXISTING SFH)
SERIES: Sales, Not Seasonally AdjustedSOURCE: CALIFORNIA ASSOCIATION OF REALTORS®
-25%
-20%
-15%
-10%
-5%
0%
5%
10%
15%
20%
25%
Jan
-10
Ap
r-10
Jul-
10
Oct
-10
Jan
-11
Ap
r-11
Jul-
11
Oct
-11
Jan
-12
Ap
r-12
Jul-
12
Oct
-12
Jan
-13
Ap
r-13
Jul-
13
Oct
-13
Jan
-14
Ap
r-14
Jul-
14
Oct
-14
Jan
-15
So CA 6 per. Mov. Avg. (So CA)
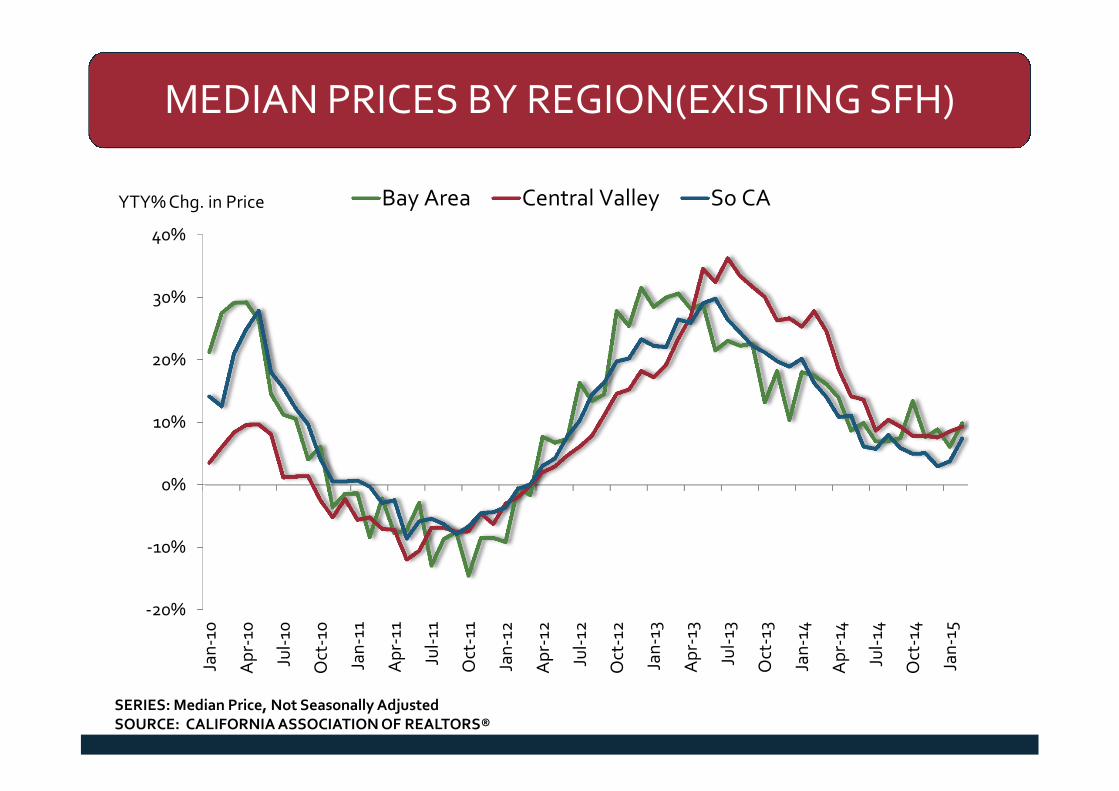
MEDIAN PRICES BY REGION(EXISTING SFH)
SERIES: Median Price, Not Seasonally AdjustedSOURCE: CALIFORNIA ASSOCIATION OF REALTORS®
-20%
-10%
0%
10%
20%
30%
40%
Jan
-10
Ap
r-10
Jul-
10
Oct
-10
Jan
-11
Ap
r-11
Jul-
11
Oct
-11
Jan
-12
Ap
r-12
Jul-
12
Oct
-12
Jan
-13
Ap
r-13
Jul-
13
Oct
-13
Jan
-14
Ap
r-14
Jul-
14
Oct
-14
Jan
-15
Bay Area Central Valley So CAYTY% Chg. in Price
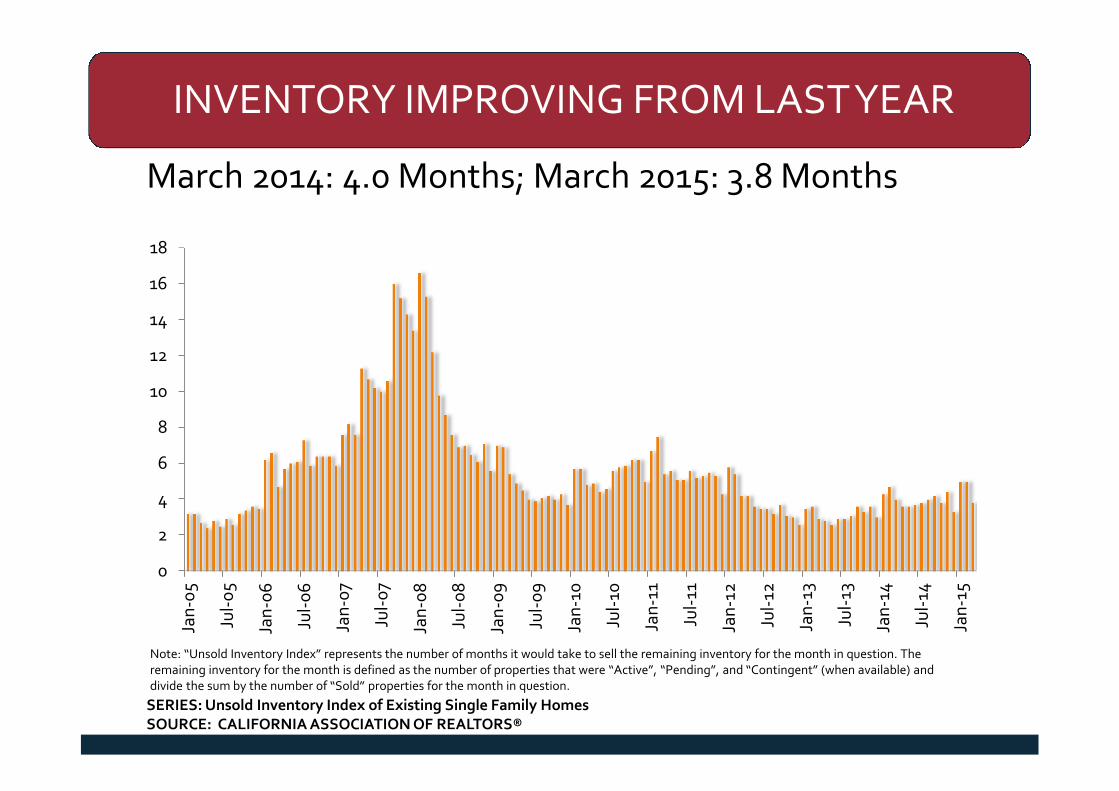
INVENTORY IMPROVING FROM LASTYEAR
March 2014: 4.0 Months; March 2015: 3.8 Months
Note: “Unsold Inventory Index” represents the number of months it would take to sell the remaining inventory for the month in question. Theremaining inventory for the month is defined as the number of properties that were “Active”, “Pending”, and “Contingent” (when available) anddivide the sum by the number of “Sold” properties for the month in question.
0
2
4
6
8
10
12
14
16
18
Jan
-05
Jul-
05
Jan
-06
Jul-
06
Jan
-07
Jul-
07
Jan
-08
Jul-
08
Jan
-09
Jul-
09
Jan
-10
Jul-
10
Jan
-11
Jul-
11
Jan
-12
Jul-
12
Jan
-13
Jul-
13
Jan
-14
Jul-
14
Jan
-15
SERIES: Unsold Inventory Index of Existing Single Family HomesSOURCE: CALIFORNIA ASSOCIATION OF REALTORS®
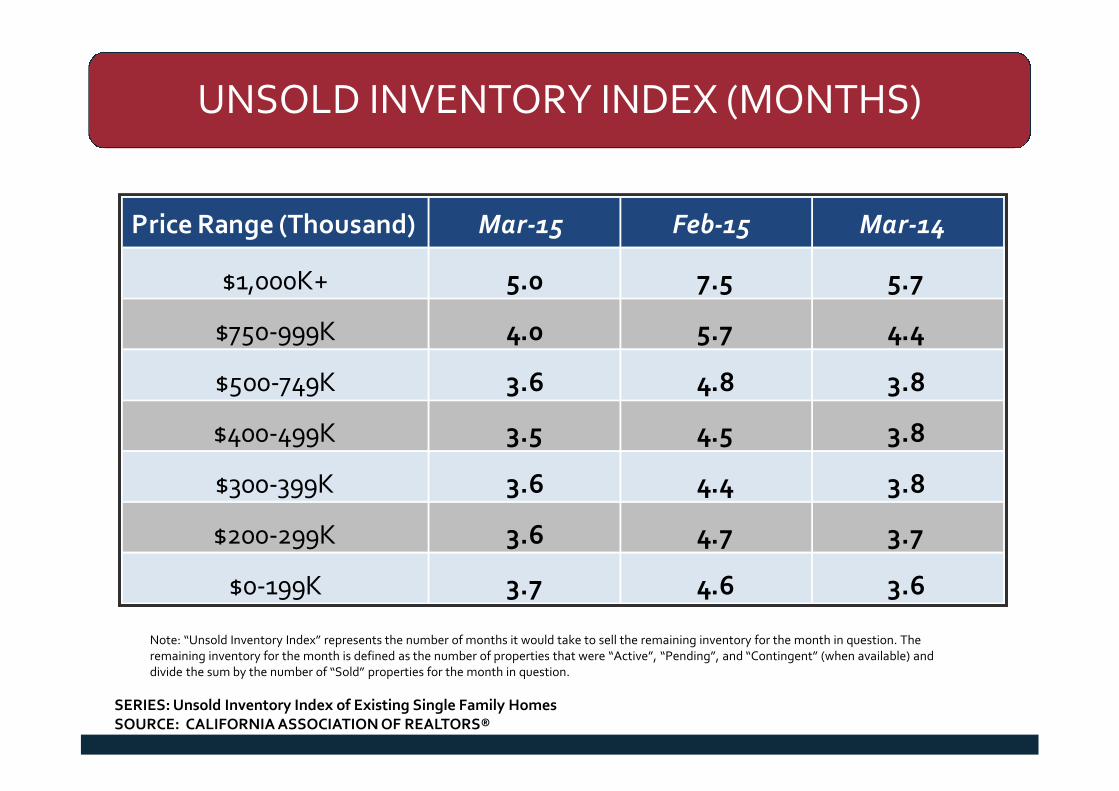
UNSOLD INVENTORY INDEX (MONTHS)
Note: “Unsold Inventory Index” represents the number of months it would take to sell the remaining inventory for the month in question. Theremaining inventory for the month is defined as the number of properties that were “Active”, “Pending”, and “Contingent” (when available) anddivide the sum by the number of “Sold” properties for the month in question.
Price Range (Thousand) Mar-15 Feb-15 Mar-14
$1,000K+ 5.0 7.5 5.7
$750-999K 4.0 5.7 4.4
$500-749K 3.6 4.8 3.8
$400-499K 3.5 4.5 3.8
$300-399K 3.6 4.4 3.8
$200-299K 3.6 4.7 3.7
$0-199K 3.7 4.6 3.6
SERIES: Unsold Inventory Index of Existing Single Family HomesSOURCE: CALIFORNIA ASSOCIATION OF REALTORS®
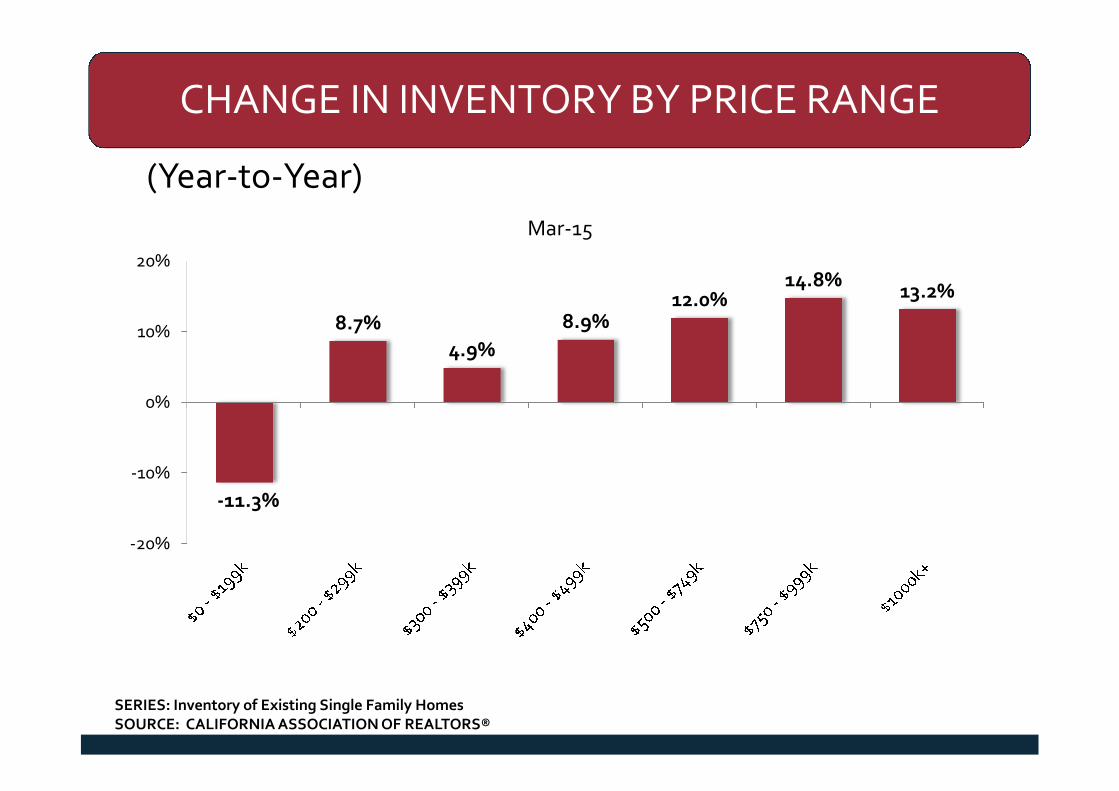
SERIES: Inventory of Existing Single Family HomesSOURCE: CALIFORNIA ASSOCIATION OF REALTORS®
CHANGE IN INVENTORY BY PRICE RANGE
(Year-to-Year)
-11.3%
8.7%
4.9%
8.9%12.0%
14.8%13.2%
-20%
-10%
0%
10%
20%
Mar-15
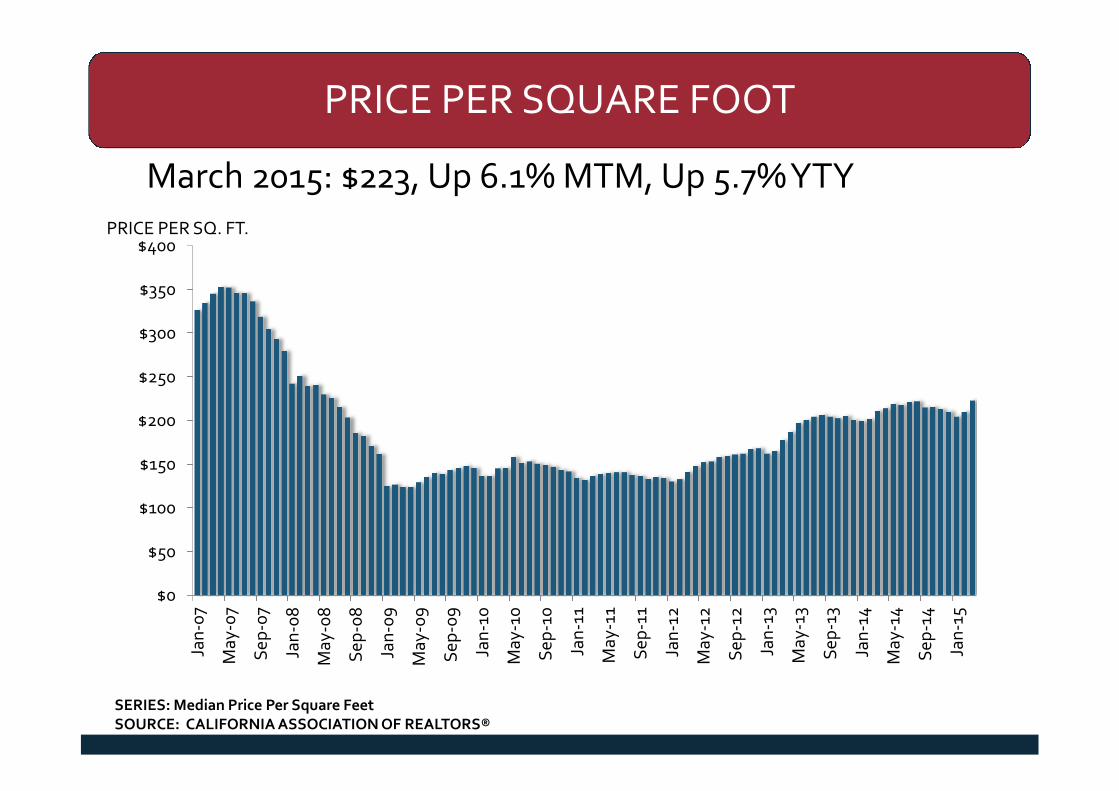
PRICE PER SQUARE FOOT
March 2015: $223, Up 6.1% MTM, Up 5.7%YTY
$0
$50
$100
$150
$200
$250
$300
$350
$400
Jan
-07
May
-07
Sep
-07
Jan
-08
May
-08
Sep
-08
Jan
-09
May
-09
Sep
-09
Jan
-10
May
-10
Sep
-10
Jan
-11
May
-11
Sep
-11
Jan
-12
May
-12
Sep
-12
Jan
-13
May
-13
Sep
-13
Jan
-14
May
-14
Sep
-14
Jan
-15
PRICE PER SQ. FT.
SERIES: Median Price Per Square FeetSOURCE: CALIFORNIA ASSOCIATION OF REALTORS®
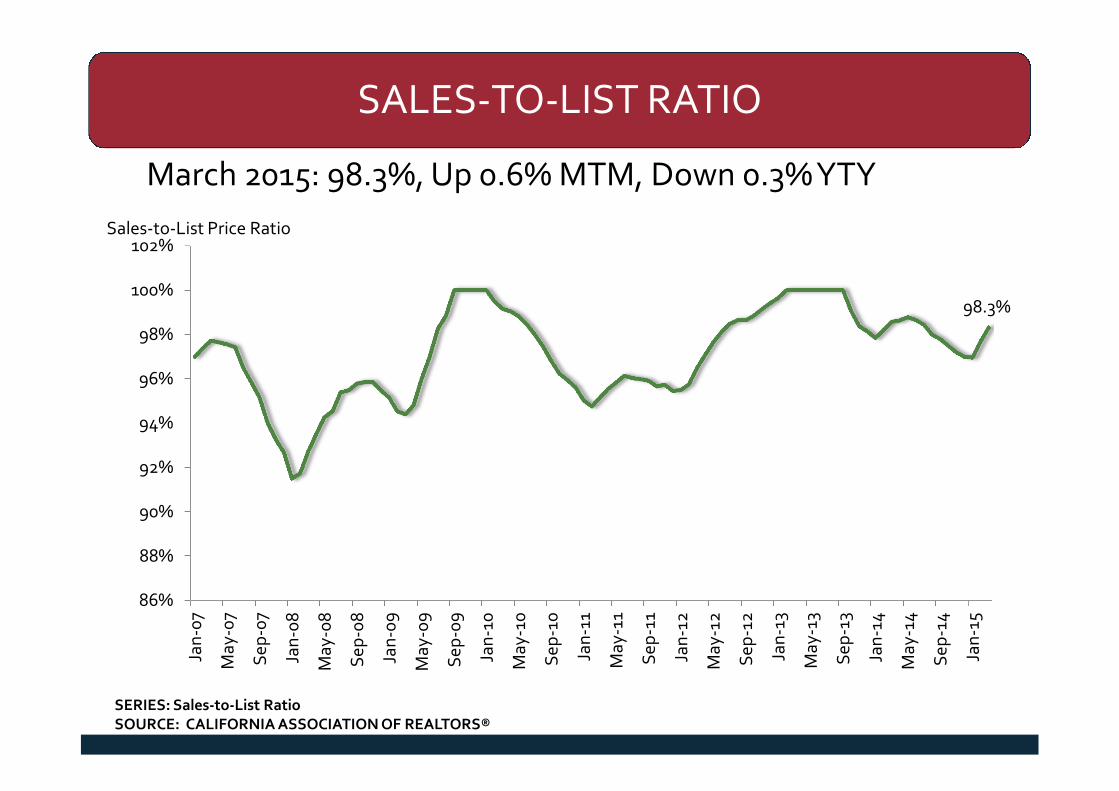
SALES-TO-LIST RATIO
March 2015: 98.3%, Up 0.6% MTM, Down 0.3%YTY
98.3%
86%
88%
90%
92%
94%
96%
98%
100%
102%
Jan
-07
May
-07
Sep
-07
Jan
-08
May
-08
Sep
-08
Jan
-09
May
-09
Sep
-09
Jan
-10
May
-10
Sep
-10
Jan
-11
May
-11
Sep
-11
Jan
-12
May
-12
Sep
-12
Jan
-13
May
-13
Sep
-13
Jan
-14
May
-14
Sep
-14
Jan
-15
Sales-to-List Price Ratio
SERIES: Sales-to-List RatioSOURCE: CALIFORNIA ASSOCIATION OF REALTORS®