Embed Size (px)
Citation preview
Bulgarian Chemical Communications, Special Edition F, (pp. 183 – 192) 2016
183
Coupled heat and mass transfer in annular adsorption bed
D. D. Gao, Y. X. Li, Z. X. Yuan*, S. W. Du
College of Environmental and Energy Engineering, Beijing University of Technology
Received February 12, 2016; Revised December 26, 2016
A numerical simulation has been conducted to investigate the heat and mass transfer in the adsorption process of an
annular cavity bed. The silica gel and the water was taken as the working pair. The 2D model of the heat and mass
transfer has been established for the adsorption problem. To clarify the cooling effect of different situations, the air
cooling mode and the water cooling mode were considered to apply onto the bed. Based on the numerical results the
change of the temperature and the vapor concentration of the bed was analyzed and discussed. The influence of the bed
layer porosity and the evaporation temperature on the performance was examined too. The results have revealed that the
bed temperature increased largely at the first 400 seconds of the adsorption time. This time corresponded to the rapid
adsorption and the large amount of the heat generation. Beyond a summit, the temperature of the bed decreased
gradually while the bed concentration kept increasing. The bed layer porosity affected the adsorption only in a small
scale, while increasing the evaporation temperature promoted the adsorption largely.
Keywords: adsorption bed, heat and mass transfer, temperature, dynamic
AIMS AND BACKGROUND
Nowadays much attention in the world is being
paid to the excessive energy consumption and the
environment pollution. Many technologies have
been proposed to conserve energy and to reduce the
harm to the environment. Specially, utilizing the
solar energy as the driving source of the
refrigeration system has got the attention of the
researchers. Compared to the conventional
vapor-compressed refrigeration technique, the
adsorption cooling system has the advantage of low
grade demanding of the heat source, low noise, and
less pollution to the environment [1,2]. Therefore,
the related study on such a topic has drawn many
researchers around the world [2,3].
In adsorption refrigeration system the adsorbent
bed is the most important component. Its
characteristic directly affects the performance of the
system. Especially, for the solar-driven adsorption
system, the performance of the bed is highly
affected by the heat and mass transfer in the bed.
The solar energy should be transferred into the bed
quickly to cause the bed to desorb. On the other
hand, the reaction heat in the adsorption process
must be discharged out as soon as possible so that
the material can fully adsorb the refrigerant vapor.
Some measurements have been proposed in the
literature to enhance the heat transfer in the bed.
Groll reviewed [4] the typical beds in the
adsorption system, he emphasized the same
importance of the heat transfer in both the external
and the internal sides of the bed. Pons et al studied
[5] the dynamic temperature change in the bed and
demonstrated the impact of the flow-rate of the
circulating fluid. The application of zeolite-active
carbon compound in the tube bed could promote
the heat transfer by absorbing the solar energy
directly [6]. Using the zeolite-coated bed for a
sorption air conditioning system, Restuccia et al
investigated the optimum conditions to reach the
most effective heat and mass transfer [7]. Heat
pipes or optimized thermal loops may also improve
the performance of a sorption system. A novel
design of passive evaporation known as the rising
film evaporation was reported in [8], in which the
gravity heat pipe was employed to enhance the heat
transfer in the evaporator. The author also
emphasized the significance of the appropriate
arrangement of the thermal fluid and the refrigerant
vapor. Niazmand et al [9] conducted a research on
the coupling heat and mass transfer in the
evacuated tube bed with fins. The numerical results
revealed that increasing the fin number and
decreasing the bed height was both able to reduce
the cycle time.
Considering the intrinsic feature of the coupled
heat and mass transfer in the bed, it is necessary to
take into account of both them together in the study,
so that the mutually-affected mechanism can be
clearly verified. For this purpose, the current study
is focused on the investigation into the heat and
mass transfer in an evacuated tube bed during the * To whom all correspondence should be sent:
E-mail [email protected]
2016 Bulgarian Academy of Sciences, Union of Chemists in Bulgaria
D. D. Gao et al.: Coupled heat and mass transfer in annular adsorption bed
184
adsorption process. The numerical results of the
temperature and the adsorption concentration of the
bed will be presented and discussed. In addition,
the effect of the material porosity and the
evaporation temperature will also be paid attention.
PHYSICAL AND MATHEMATICAL MODEL
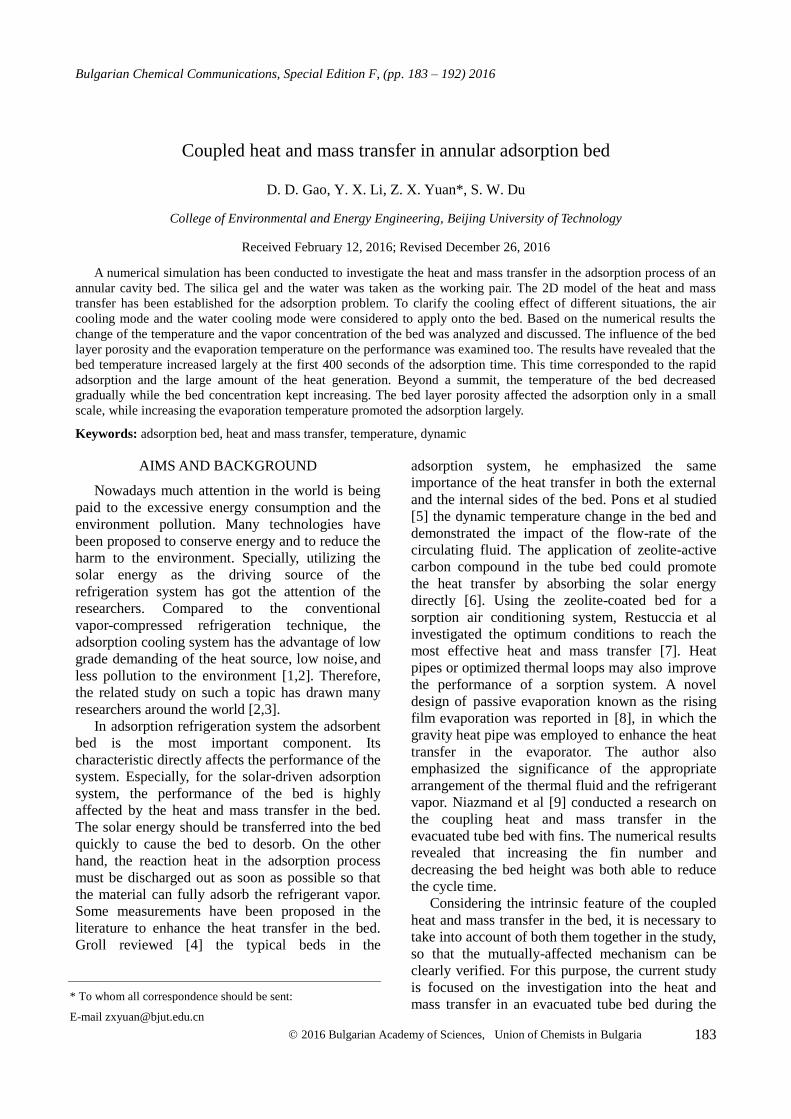
For simplification, the heat and mass transfer in
the evacuated tube bed is reduced to be a 2-D
axially symmetrical problem, as shown in Figure 1
and Figure 2. The outer alloy tube and the inner
copper tube forms the annular adsorption bed. The
silica gel is used as the adsorbent. Through the
annular inlet at the left the water vapor flows into
the bed. At the same time, the circulating fluid
flows through the copper tube to keep the bed
cooling down. In the desorption process, which is
not involved in this study, the solar irradiation heats
the alloy tube through the outmost glass tube. The
bed is exposed to the solar radiation and the cooling
channel is shut down. Beyond the critical pressure,
the desorbed water vapor is delivered to the
condenser and liquefied. As the first part of the
study, the result here is only for the heat and mass
transfer in the adsorption process. The large amount
of the reaction heat during the adsorption is rejected
by the cooling fluid of either the air or the water.
No solar heat is put on the bed during the
adsorption process.
Fig.1. The two-dimensional model of the tube bed
Fig.2. Cross-sectional schematic of the bed
In the numerical model the following
assumptions are considered and followed, (a) The
adsorbent particle is of the same size. The physical
property of the bed material is isotropic, (b) All
physical properties are constant and independent of
the temperature and the concentration, and (c) The
contact resistance between the adsorbent and the
tube wall is neglected.
Energy Equation
In the energy equation the balance of the
transient source term, the heat conduction, and the
vapor convection are involved. The adsorption
concentration q of the bed is taken as a heat source
term [10]. The energy equation of the adsorption
bed is as
2
2
1(1 ) (1 )
(1 )
s s st s ps b g pg t s pw eff
g pg s t s ads
T T Tc c qc r
t r r r z
qc T u H
z t
(1)
where, psc and pgc is the specific heat of the
adsorbent material and the refrigerant vapor,
respectively. pwc is the specific heat of the liquid
refrigerant. u indicates the flowing velocity of the
refrigerant vapor in the bed. eff is the effective
heat conductivity, which was determined by the
weighted sum of the adsorbent’s and the vapor’s
conductivity. adsH is the reaction heat of
adsorption. The total porosity of the bed t is
determined by the weighted sum of the bed layer
porisity b and the particle porosity p ,
(1 )t b b p (2)
The boundary condition for the energy equation
is
1r r , ( , )
| ( )eff w w f
T r zh T T
r
(3)
2r r , ( , )
| 0eff w
T r z
r
(4)
1 2
10 110
, 0s s
z z
T Tr r r
z z
(5)
Where h is the convective heat transfer
coefficient between the coolant fluid and tube wall.
Both the air and the water are taken as the coolant
fluid. By the reference of the heat transfer
handbook, we took h = 6 W/(m2·K) for the natural
air convection, and h = 500W/(m2·K) for the forced
water convection. These two thermal boundary
conditions will be the basis of the following
comparison for the different cooling situation. In
addition, the initial condition of the bed in the
simulation is considered as
0( , , ) | 298 ( )tT r z t K (6)

D. D. Gao et al.: Coupled heat and mass transfer in annular adsorption bed
185
The property of the type-A silica gel was
adopted in the simulation. The diameter of the silica
gel particle was taken as d = 1.0mm. The other
properties of the silica gel are listed in Table 1.
Mass Equation
The mass equation describes the transient
equivalence between the vapor convection and the
vapor mass change in the pores of the bed
( )( )
t g
g mu St
(7)
The source term Sm reflects the change of the
adsorption concentration per unit time. It takes a
negative value in the adsorption process and a
positive value in the desorption process. The Sm
term can be determined directly by the change of
the concentration with the time
(1 )m t s
qS
t
(8)
Velocity Equation
For the hydrodynamic problem in a porous
media where the effective porosity is not very high,
the Darcy's law of the hydromechanics is applied.
The Darcy's law describes the relation of the fluid
velocity and the pressure gradient. Provided that the
viscosity of the fluid and the apparent
permeability Kapp of the material is known, the
velocity u has the relation to the pressure p as
appK pu
z
(9)
The corresponding boundary condition for the
current problem is
110
0z
p
z
10 ezp p
(10)
The initial pressure of the bed is assumed as p =
0.
The apparent permeability Kapp is related to the
intrinsic permeability of the material K and the
physical property of the fluid [11,12]
p
app gK K Dp
(11)
Where is the collision factor and gD is the
diffusivity of the fluid. According to the theory of
the transport phenomena, K is determined by the
particle size d and the bed layer porosity εb , and is
calculated by the semi-empirical Blake-Kozeny
formula 3 2
2150(1 )
b
b
dK
(12)
The diffusitivity gD of the refrigerant vapor in
Eq.(11) is determined by the formula [13,14]
1/ 1/ 1/g m kD D D (13)
where mD and kD is the molecular diffusivity and
the Knudsen diffusivity respectively
3
2
/0.02628m
T MD
p
(14)
1/252 10 8
3
p
k
r RTD
M
(15)
In Eq.(14) and (15), M is the molecular mass of
the vapor. R is the universal ideal gas constant. is
the collision diameter for the Lennard-Jones
potential, and is the collision integral. rp denotes
the radius of the adsorbent particle.
Adsorption Equation
The current adsorption problem is a typical
non-equilibrium process. Based on the reaction
kinetics theory, Sakoda and Suzuki studied the
adsorption dynamics in the silica gel-water system.
They argued that the adsorption rate was strongly
influenced by the surface diffusion of the adsorbent
particle [15]. To reflect the feature of the actual
non-equilibrium in the adsorption process, they
took into account the effect of the surface diffusion
into the adsorption rate, and proposed the dynamic
model as
*
2
15 exp( / )( )so a
p
D E RTqq q
t r
(16)
The initial condition is q = 0 for t = 0, and soD is
the surface diffusivity of the material. q* is the
equilibrium concentration that is determined by the
modified Dubinin-Astakhov equation 1
* ( / )ne sq k p p (17)
k and n are constants related to the working pair.
For the silica gel - water system, k = 0.346 gw/gs
and n = 1.6. pe is the evaporation pressure, and ps is
the saturation vapor pressure corresponding to the
bed temperature Ts. In the numerical simulation, we
adopted the empirical Antoine formula to determine
the relationship of the saturation pressure and the
temperature of water [16,17]
lg /( )p A B T C (18)
A = 8.10765, B = 1750.29, C = 235, for T = 0 ~
60 oC, and A = 7.96681, B = 1668.21, C = 228,
for T = 60 ~ 150 oC.
It needs to note that the unit of the pressure in
Eq.(18) is in mmHg.

D. D. Gao et al.: Coupled heat and mass transfer in annular adsorption bed
186
Table 1. Physical properties of type A silica gel[10].
Average
pore size
(nm)
Specific
surface
(m2/g)
Pore
volume
(ml/g)
Specific heat
psc (kJ/(kg·K))
Thermal
conductivity
s (W/(m·K))
Bulk
density
s (kg/m3)
True
density
(kg/m3)
Apparent
density
(/kg/m3)
2.0-3.0 650-800 0.35-0.45 0.92 0.175 790 2200 1170
Table 2. The parameter values for the numerical model
Parameter Symbol Value Unit
Initial inlet pressure
Surface diffusion coefficient
Activation energy of surface diffusion [18]
Universal gas constant18
Specific gas constant for water vapor
Adsorption heat of silica gel [13]
Particle density of silica gel
Thermal conductivity of silica gel
Specific heats of silica gel
Particle porosity of silica gel [10]
Bed porosity [10]
Specific heat of water vapor
Specific heat of water
Molecular weight of water
Viscosity of water vapor
Thermal conductivity of water vapor [19]
Collision factor [13]
Collision diameter for Lennard-Jones potential [13]
Collision integral [12]
Evaporation temperature
p0
Dso
Ea
R
Rg
ΔHads
ρs
λs
cps
εp
εb
cpg
cpw
M
μ
λg
τ
σ
Ω
Te
1703.5
2.54×10⁻⁴
4.2×10⁴
8.314
461.5
2560
790
0.175
0.920
0.42
0.37
1.874
4.187
18
9.06×10⁻⁶
0.0196
3
2.641
2.236
288
Pa
m2/s
J/mol
J/(mol·K)
J/(kg·K)
kJ/kg
kg/m3
W/(m·K)
kJ/(kg·K)
—
—
kJ/(kg·K)
kJ/(kg·K)
g/mol
N·s/m2
W/(m·K)
—
Å
—
K
Table 3. Converged temperature of the monitored points for different grid system, water cooling condition at T f =
298K, h = 500 W/(m2·K)
Grid number TA (K) TC (K) TD (K)
14500
25737
57500
103193
307.69
307.38
307.30
307.44
308.04
307.64
307.67
307.83
318.31
318.30
318.23
318.25
NUMERICAL METHOD
The numerical simulation to the current problem
was conducted by using the FLUENT software.
The GAMGIT program involved in the software
package was used to generate the grid system. In
advance of the simulation, the parameters that are
involved in the equations above must be preset. By
reference of the open literature that was related to
the dynamic adsorption problem, the corresponding
parameters were adopted and listed in Table 2.
In a simulation it is necessary to check the
grid-independence of the numerical domain prior to
the formal calculation. The appropriate grid system
guarantees the convergence of the iteration and the
accuracy of the numerical result. For this purpose, a
preliminary study was conducted for the water
cooling case. In the process of the iteration the
temperature, the pressure and the adsorption
concentration of the bed were monitored. The
monitored points are denoted by A, B, C, and D as
shown in Figure 3, which coordinator value is as
A(30, 15.6), B(50, 15.6), C(70, 15.6) and D(50,
27.6) respectively.
In the preliminary simulation, the temperature of
point A, C and D was monitored for the different
grid system. The checked result is presented in
Table 3. With the grid number increasing from
14500 to 103193, the temperature changed not very
much. The changing range of the temperature was
in between 0.08K and 0.40K, with the maximum
for point C and the minimum for point D. Therefore
it was considered that the grid number in the range
above did not affect the numerical accuracy too
much, and then the grid number of 25737 was
adopted in the formal study.
D. D. Gao et al.: Coupled heat and mass transfer in annular adsorption bed
187
Table 4. Relation of the evaporation temperature to
the pressure.
T (oC) 5 8 12 15
ps (Pa) 871.5 1072.1 1401.5 1703.5
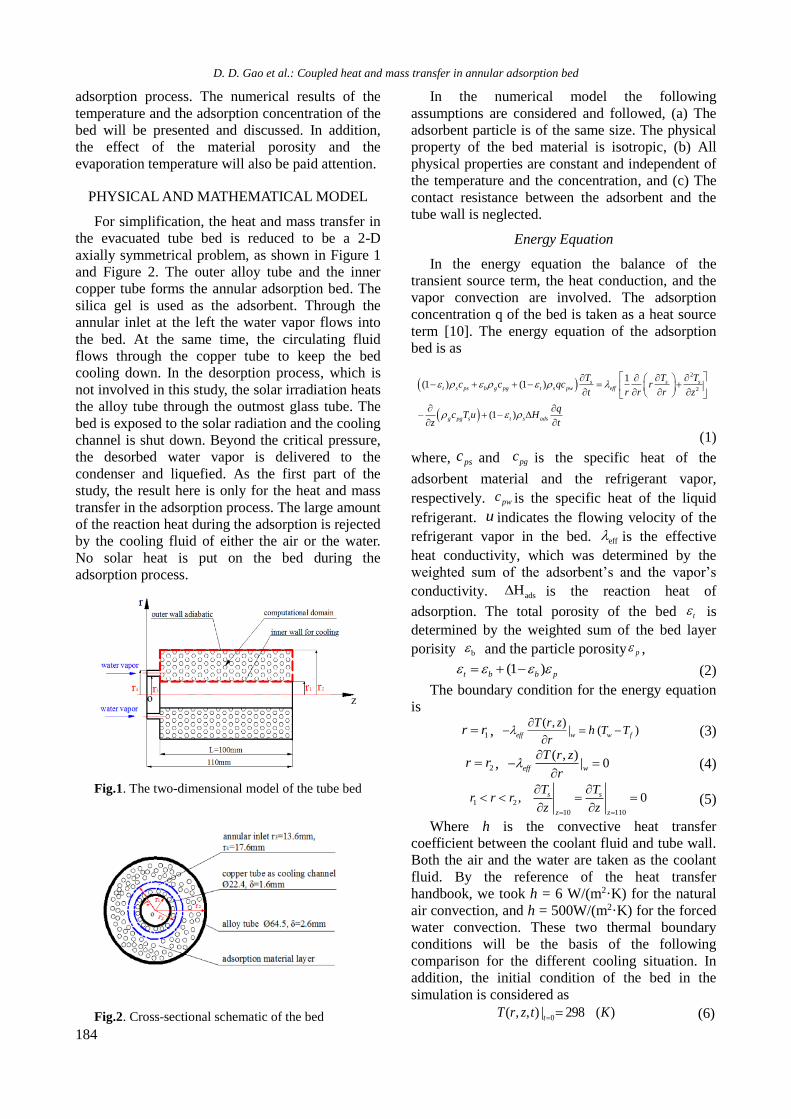
Fig.3. The numerical domain and the monitored
points position.
(a) time = 0.5 hours
(b) time = 2 hours
Fig. 4. Comparison of the temperature field for the
air cooling and the water cooling, as adsorption time was
0.5 hour and 2 hours, respectively.
RESULTS AND DISCUSSION
Temperature and Concentration Field
To analyze the distribution of the temperature,
two sets of the temperature filed of the bed at
different time were presented in Figure 4. Figure 4
(a) and (b) is for the t = 0.5 hours and for the t = 2
hours of the adsorption time respectively.
Obviously, the bed temperature distributed much
more evenly at t = 2 hours as compared to that at
time = 0.5 hours. After one and a half hours
adsorption, the non-uniformity degree of the
temperature had decreased from 25K to 15K for the
air cooling, and from 45K to 15K for the water
cooling. It is seen from the figure that the
temperature changes more seriously along the
radial direction rather than the axial direction. This
tells us that the heat transfer was mainly towards
the radial direction. As to the effect of the cooling
mode, the cold area reflects the difference. In
comparison, the cold area of the water-cooling
patterns is clearly larger than that of the air cooling
patterns. This demonstrates that the water cooling
mode is better than the air cooling mode. The
cooling effectiveness of the bed is very important in
view of the sufficient adsorption of the material.
The lower temperature promotes the adsorption
while the high temperature frustrates the
adsorption.
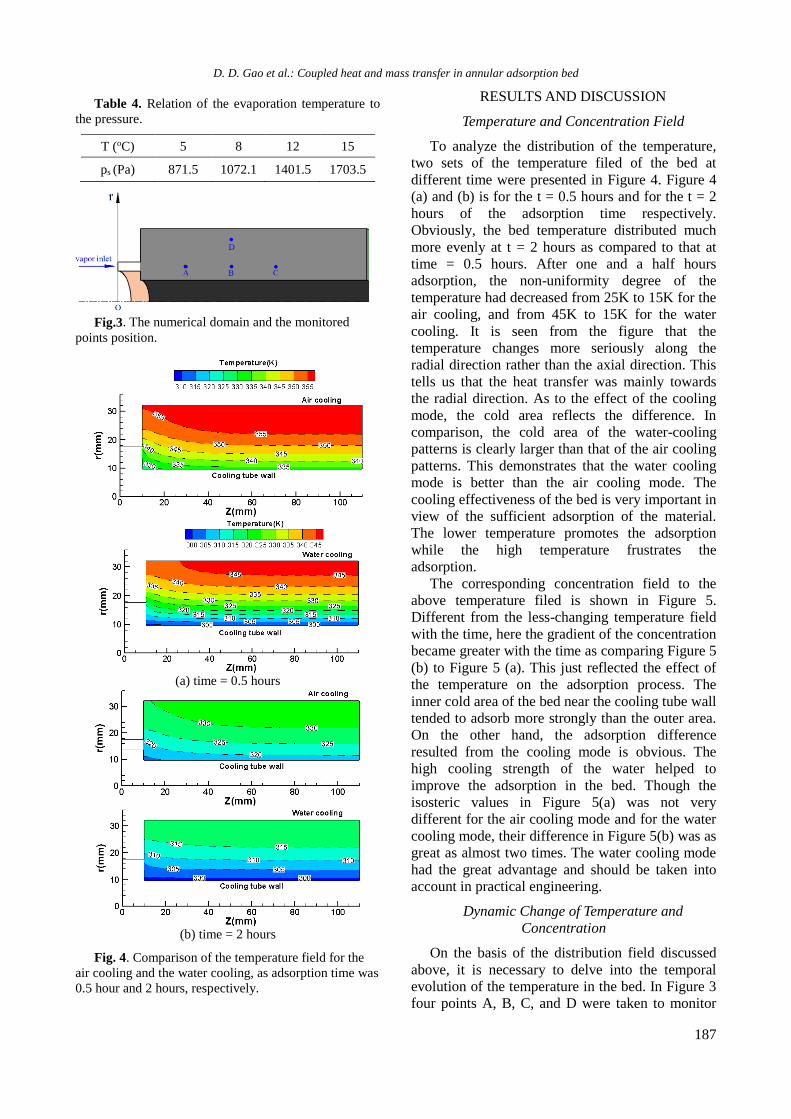
The corresponding concentration field to the
above temperature filed is shown in Figure 5.
Different from the less-changing temperature field
with the time, here the gradient of the concentration
became greater with the time as comparing Figure 5
(b) to Figure 5 (a). This just reflected the effect of
the temperature on the adsorption process. The
inner cold area of the bed near the cooling tube wall
tended to adsorb more strongly than the outer area.
On the other hand, the adsorption difference
resulted from the cooling mode is obvious. The
high cooling strength of the water helped to
improve the adsorption in the bed. Though the
isosteric values in Figure 5(a) was not very
different for the air cooling mode and for the water
cooling mode, their difference in Figure 5(b) was as
great as almost two times. The water cooling mode
had the great advantage and should be taken into
account in practical engineering.
Dynamic Change of Temperature and
Concentration
On the basis of the distribution field discussed
above, it is necessary to delve into the temporal
evolution of the temperature in the bed. In Figure 3
four points A, B, C, and D were taken to monitor
D. D. Gao et al.: Coupled heat and mass transfer in annular adsorption bed
188
the change of the bed parameters. The dynamic
response of the temperature and the concentration
of the monitored points are shown in Figure 6 and
Figure 7.
(a) time = 0.5 hours
(b) time = 2 hours
Fig. 5. Comparison of the concentration field for the
air cooling and the water cooling mode, as adsorption
time was 0.5 hour and 2 hours, respectively.
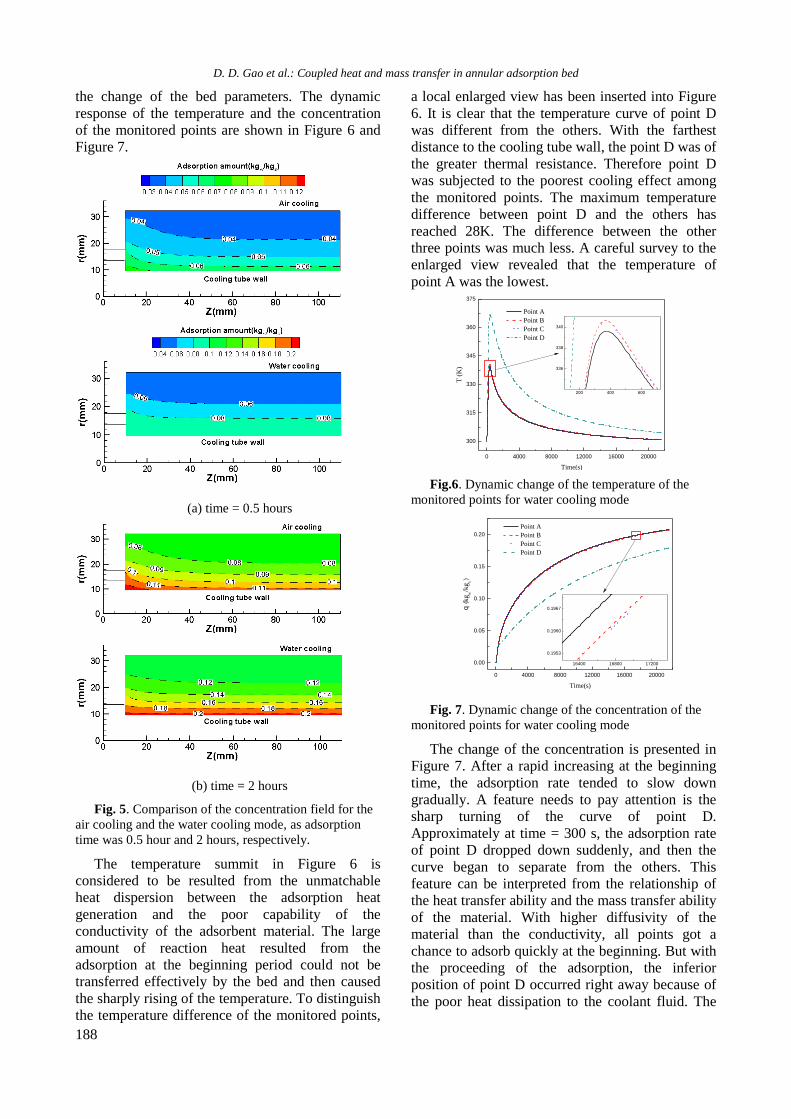
The temperature summit in Figure 6 is
considered to be resulted from the unmatchable
heat dispersion between the adsorption heat
generation and the poor capability of the
conductivity of the adsorbent material. The large
amount of reaction heat resulted from the
adsorption at the beginning period could not be
transferred effectively by the bed and then caused
the sharply rising of the temperature. To distinguish
the temperature difference of the monitored points,
a local enlarged view has been inserted into Figure
6. It is clear that the temperature curve of point D
was different from the others. With the farthest
distance to the cooling tube wall, the point D was of
the greater thermal resistance. Therefore point D
was subjected to the poorest cooling effect among
the monitored points. The maximum temperature
difference between point D and the others has
reached 28K. The difference between the other
three points was much less. A careful survey to the
enlarged view revealed that the temperature of
point A was the lowest.
200 400 600
336
338
340
0 4000 8000 12000 16000 20000
300
315
330
345
360
375
T (
K)
Time(s)
Point A
Point B
Point C
Point D
Fig.6. Dynamic change of the temperature of the
monitored points for water cooling mode
0 4000 8000 12000 16000 20000
0.00
0.05
0.10
0.15
0.20
16400 16800 17200
0.1953
0.1960
0.1967
q (
kg
w/k
gs)
Time(s)
Point A
Point B
Point C
Point D
Fig. 7. Dynamic change of the concentration of the
monitored points for water cooling mode
The change of the concentration is presented in
Figure 7. After a rapid increasing at the beginning
time, the adsorption rate tended to slow down
gradually. A feature needs to pay attention is the
sharp turning of the curve of point D.
Approximately at time = 300 s, the adsorption rate
of point D dropped down suddenly, and then the
curve began to separate from the others. This
feature can be interpreted from the relationship of
the heat transfer ability and the mass transfer ability
of the material. With higher diffusivity of the
material than the conductivity, all points got a
chance to adsorb quickly at the beginning. But with
the proceeding of the adsorption, the inferior
position of point D occurred right away because of
the poor heat dissipation to the coolant fluid. The
D. D. Gao et al.: Coupled heat and mass transfer in annular adsorption bed
189
bad cooling effect of point D frustrated its effective
adsorption further more. As to point A, B, and C,
not much difference was detected because they all
share the same radial coordinate value.
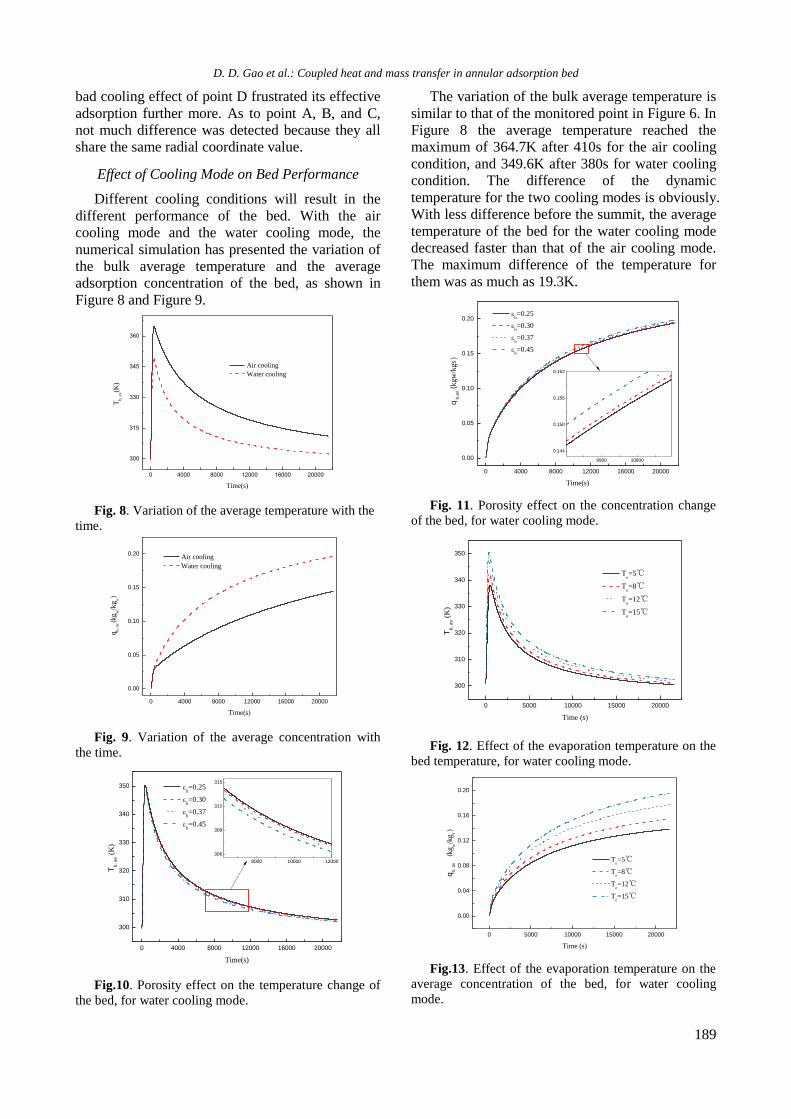
Effect of Cooling Mode on Bed Performance
Different cooling conditions will result in the
different performance of the bed. With the air
cooling mode and the water cooling mode, the
numerical simulation has presented the variation of
the bulk average temperature and the average
adsorption concentration of the bed, as shown in
Figure 8 and Figure 9.
0 4000 8000 12000 16000 20000
300
315
330
345
360
Tb,
av(K
)
Time(s)
Air cooling
Water cooling
Fig. 8. Variation of the average temperature with the
time.
0 4000 8000 12000 16000 20000
0.00
0.05
0.10
0.15
0.20
qb,
av(k
gw/k
gs)
Time(s)
Air cooling
Water cooling
Fig. 9. Variation of the average concentration with
the time.
0 4000 8000 12000 16000 20000
300
310
320
330
340
350
8000 10000 12000
306
309
312
315
Tb
, a
v (
K)
Time(s)
b=0.25
b=0.30
b=0.37
b=0.45
Fig.10. Porosity effect on the temperature change of
the bed, for water cooling mode.
The variation of the bulk average temperature is
similar to that of the monitored point in Figure 6. In
Figure 8 the average temperature reached the
maximum of 364.7K after 410s for the air cooling
condition, and 349.6K after 380s for water cooling
condition. The difference of the dynamic
temperature for the two cooling modes is obviously.
With less difference before the summit, the average
temperature of the bed for the water cooling mode
decreased faster than that of the air cooling mode.
The maximum difference of the temperature for
them was as much as 19.3K.
0 4000 8000 12000 16000 20000
0.00
0.05
0.10
0.15
0.20
9900 10800
0.144
0.150
0.156
0.162
q b
,av (
kgw
/kgs)
Time(s)
b=0.25
b=0.30
b=0.37
b=0.45
Fig. 11. Porosity effect on the concentration change
of the bed, for water cooling mode.
0 5000 10000 15000 20000
300
310
320
330
340
350
Tb
, a
v (
K)
Time (s)
Te=5℃
Te=8℃
Te=12℃
Te=15℃
Fig. 12. Effect of the evaporation temperature on the
bed temperature, for water cooling mode.
0 5000 10000 15000 20000
0.00
0.04
0.08
0.12
0.16
0.20
qb
, a
v
(kg
w/k
gs)
Time (s)
Te=5℃
Te=8℃
Te=12℃
Te=15℃
Fig.13. Effect of the evaporation temperature on the
average concentration of the bed, for water cooling
mode.

D. D. Gao et al.: Coupled heat and mass transfer in annular adsorption bed
190
The bulk averaged concentration of the bed is
presented in Figure 9. The figure shows the
different tendency of the average concentration for
the two cooling modes. The water cooling mode
generates a smoothly increasing profile of the qb,av,
while the increasing of the concentration of the air
cooling mode slowed down after a time period. The
maximum difference of the concentration for the
two cooling modes has reached 26.4%. The
causation of this phenomenon is similar to what is
mentioned in the discussion of Figure 7. After the
transient effective adsorption at the beginning time,
the good cooling way of the water mode tended to
keep the bed in a sustainable good work state, while
the air cooling mode does not have such ability
because of the less cooling effect. Usually the
power output of the refrigeration machine depends
mainly on the adsorption amount per unit time, so
the appropriate cooling way is highly appreciated.
Effect of Porosity of Adsorbent on Bed Performance
As aforementioned the total porosity of the bed
consists of the particle porosity p and the bed layer
porosity b. The p is an intrinsic attribute of the
adsorption material, which is determined by the
product type, but the b is changeable with the
compactness of the bed. Leong et al [20] once
conducted a study of the compressing effect of the
adsorbent particle on the heat and mass transfer of
the bed. Their result suggested that although the
compacted bed improved the heat transfer, the
decreased bed porosity affected the adsorption
inversely. With the bed porosity decreasing, the
mass transfer resistance increased, which would
hinder the adsorption of the bed.
In the current study the bed porosity b was
considered as a variable. In the range of b from
0.25 to 0.45, the effect of the bed porosity was
numerically identified. The related variation of the
Tb,av and qb,av with the time is as shown in Figure 10
and Figure 11. It is seen that the effect of the bed
porosity on the performance is not seriously. The
maximum temperature difference for the different
porosities was only about 1.8K, and the maximum
concentration difference was about 2.2%. In
addition, the result of the porosity effect was
consistent with the conclusion of the study by
Leong et al in [20]. The higher porosity did lower
the average temperature of the bed to some extent,
and promoted the adsorption slightly.
Effect of Evaporation Temperature on Bed
Performance
The pressure of the refrigerant vapor is another
significant factor to influence the adsorption. The
equilibrium concentration of the adsorbent material
usually increases with the pressure and decreases
with the temperature. On the other hand, the
influence of the two elements is not in the same
level. In the current study, a series of simulation has
been performed on the effect of the inlet pressure of
the refrigerant vapor. The numerical condition was
the same as presented in Table 2 with the water
cooling mode. Four pressure values were adopted,
and their relation to the evaporation temperature is
as shown in Table 4. The ps is the saturation
pressure at the given temperature. Figure 12
presented the change of the bed temperature Tb,av at
different evaporation temperatures. As seen in the
figure, the bed temperature increased largely with
the evaporation temperature. Increasing the
evaporation temperature implies improving the inlet
pressure of the vapor into the bed. The higher
pressure upgraded the driving force of the
adsorption. The improved adsorption generated
more reaction heat and resulted in the temperature
rising up quickly.
The effect of the evaporation temperature on the
bed concentration is presented in Figure 13.
Obviously, the evaporation temperature affected the
bed concentration more strongly than the bed
porosity, as shown in Figure 11. The maximum
difference of the qb,av for Te = 5 oC and 15 oC has
reached as much as 67.7%. If we relate the qb,av
curve to the Tb,av curve in Figure 12, an interesting
relationship is revealed. Corresponding to the
shooting up of the temperature curve at the
beginning time, the concentration curve increased
fast too. To the declining temperature beyond the
summit, the concentration curve tended to be flat.
The higher temperature profile corresponded to the
higher concentration profile. This feature is just the
reverse to the relation of the Tb,av and the qb,av
discussed above about the effect of the cooling
mode and the bed porosity. The high temperature of
the bed itself frustrated the adsorption, while the
high temperature of the evaporator helped to
promote the adsorption. This reflects the difference
of the adsorption driving potential from the outside
and the inside of the adsorbent particle.
CONCLUSIONS
Based on the established model of the annular
bed, the numerical simulation was performed on the
characteristics of the adsorption process. The
results revealed that the heat and mass transfer in
the bed was highly coupled and affected each other.
The temperature distribution of the bed was the
integrated result of the adsorption and the cooling
mode. The bed temperature also reacts against the

D. D. Gao et al.: Coupled heat and mass transfer in annular adsorption bed
191
adsorption strongly. For the annular bed with the
internal cooling tube, the water cooling mode
resulted in a much better adsorption performance
than the air cooling mode. At the beginning time
the adsorption happened in a high rate, and a large
amount of the reaction heat was generated. The heat
generation resulted in a rapid rise of the
temperature within the first 400 seconds or so. After
reaching the summit, the bed temperature declined
gradually. Correspondingly, the adsorption
experienced a process from fast to slowing down.
Further study revealed that the higher bed porosity
tended to reduce the mass transfer resistance and to
improve the adsorption slightly. On the other hand,
increasing the inlet vapor pressure of the bed
promoted the adsorption in large scale. In general,
applying the effective cooling mode, optimizing the
bed structure, and reducing the heat and mass
transfer resistance, are considered as the effective
ways to improve the performance of the adsorption
bed.
NOMENCLATURE
cps
cpg
cpw
[J/(kg·K)]
[J/(kg·K)]
[J/(kg·K)]
specific heat of silica gel
specific heat of refrigerant vapor
specific heat of refrigerant liquid
d
Dg
[m]
[m2/s]
particle diameter
diffusivity of refrigerant vapor
Dk
Dm
Dso
[m2/s]
[m2/s]
[m2/s]
Knudsen diffusivity of the material
molecular diffusivity of the material
surface diffusion coefficient
Ea [J/mol] diffusional activation energy
h [W/(m2·K)] convective heat transfer coefficient
K
Kapp
k
M
n
p
pb,av
ps
[m2]
[m2]
[-]
[g/mol]
[-]
[Pa]
[Pa]
[Pa]
intrinsic permeability of porous material
apparent permeability of porous material
constant in Eq.(17)
molecular mass
constant in Eq.(17)
pressure
average pressure of adsorbent bed
saturated vapor pressure
q
q*
qb,av
R
[kgw/kgs]
[kgw/kgs]
[kgw/kgs]
[J/(mol·K)]
adsorption concentration
equilibrium adsorption concentration
average adsorption capacity of bed
universal ideal gas constant
r
r1
r2
rp
Sm
T
Tb,a v
Te
Tf
Ts
Tw
T0
t
u
[mm]
[mm]
[mm]
[m]
[kg/(m3·s)]
[K]
[K]
[K]
[K]
[K]
[K]
[K]
[s]
[m/s]
radial coordination
radius of the cooling tube
radius of the solar-absorbing alloy tube
radius of adsorbent particle
mass source term in Eq.(7)
temperature
average temperature of adsorbent bed
evaporation temperature
temperature of the cooling fluid
temperature of the adsorbent
wall temperature of the cooling tube
initial temperature of the bed
time
velocity
Greek symbol
μ
ρg
ρs
[N·s/m2]
[kg/m3]
[kg/m3]
dynamic viscosity
density of water vapor
density of adsorbent
ΔHads
εb
εp
εt
[kJ/kg]
[-]
[-]
[-]
heat generation of adsorption
bed layer porosity
particle porosity
total porosity
τ
σ
Ω
λeff
λg
λs
[-]
[Å]
[-]
[W/(m·K)]
[W/(m·K)]
[W/(m·K)]
collision factor
collision diameter for Lennard-Jones potential
collision integral
effective thermal conductivity
thermal conductivity of water vapor
thermal conductivity of adsorbent

D. D. Gao et al.: Coupled heat and mass transfer in annular adsorption bed
192
Acknowledgements: This research work was
sponsored by the National Natural Science
Foundation of China (Grant No. 51276005) and the
National Key Basic Research Program of China
(No.2015CB251303).
REFERENCES
1. W. Gazda, J. Koziol, Appl. Energy, 101, 49 (2013).
2. H.Z. Hassan, A.A. Mohamad, R. Bennacer, Energy,
36, 530 (2011).
3. R.Z. Wang, Renewable Sustainable Energy Rev, 5, 1
(2001).
4. M. Groll, Heat Recovery Syst. CHP, 13, 341 (1993).
5. M. Pons, D. Laurent, F. Meunier, Appl. Therm Eng,
16, 395 (1996).
6. Z.Y. Liu, Y.Z. Lu, J.X. Zhao, Sol. Energy Mater. Sol.
Cells, 52, 45 (1998).
7. G. Restuccia, A. Freni, G. Maggio, Appl. Therm. Eng,
22, 619 (2002).
8. R.Z. Wang, Z.Z. Xia, L.W. Wang, Z.S. Lu, S.L. Li,
T.X. Li, J.Y. Wu, S. He, Energy, 36, 5425 (2011).
9. H. Niazmand, I. Dabzadeh, Int. J. Refrig, 35, 581
(2012).
10. H.T. Chua, K.C. Ng, W. Wang, C. Yap, X.L. Wang,
Int. J. of Heat Mass Transfer, 47, 659 (2004).
11. K.C. Leong, Y. Liu, Int. J. of Heat Mass Transfer, 47,
4761 (2004).
12. R.B. Bird, W.E. Stewart, E.N. Lightfoot, Transport
Phenomena, Wiley, New York, 1960.
13. H. Demir, M. Mobedi, S. Ülkü, Int Commun Heat
Mass Transfer, 36, 372 (2009).
14. D.M. Ruthven, Principles of adsorption and
adsorption processes, John Wiley & Sons, New York,
1984, p. 124
15. A. Sakoda, M. Suzuki, J. Chem. Eng. Jpn, 17, 52
(1984).
16. R.C. Reid, J.M. Prausnitz, T.K. Sherwood, The
properties of gases and liquids, fourth ed.,
McGraw-Hill, New York, 1987.
17. A. Senol, J. Chem. Thermodyn, 67, 28 (2013).
18. J. Di, J.Y. Wu, Z.Z. Xia, R.Z. Wang, Theoretical Int.
J. Refrig, 30, 515 (2007).
19. İ. Solmuş, D. Andrew, S. Rees, C. Yamali, D. Baker,
B. Kaftanoğlu, Int. J. Refrig, 35, 652 (2012).
20. K.C. Leong, Y. Liu, Appl. Therm. Eng, 24,
2359(2004).