Embed Size (px)
Citation preview
This journal is© the Owner Societies 2015 Phys. Chem. Chem. Phys.
Cite this:DOI: 10.1039/c5cp04443j
Coupled phase field, heat conduction, andelastodynamic simulations of kinetic superheatingand nanoscale melting of aluminum nanolayerirradiated by picosecond laser
Yong Seok Hwanga and Valery I. Levitas*b
An advanced continuum model for nanoscale melting and kinetic superheating of an aluminum nanolayer
irradiated by a picosecond laser is formulated. Barrierless nucleation of surface premelting and melting
occurs, followed by a propagation of two solid–melt interfaces toward each other and their collision. For a
slow heating rate of Q = 0.015 K ps�1 melting occurs at the equilibrium melting temperature under uniaxial
strain conditions Teeq = 898.1 K (i.e., below equilibrium melting temperature Teq = 933.67 K) and corres-
ponding biaxial stresses, which relax during melting. For a high heating rate of Q = 0.99–84 K ps�1, melting
occurs significantly above Teq. Surprisingly, an increase in heating rate leads to temperature reduction at the
3 nm wide moving interfaces due to fast absorption of the heat of fusion. A significant, rapid temperature
drop (100–500 K, even below melting temperature) at the very end of melting is revealed, which is caused
by the collision of two finite-width interfaces and accelerated melting in about the 5 nm zone. For
Q = 25–84 K ps�1, standing elastic stress waves are observed in a solid with nodal points at the moving
solid–melt interfaces, which, however, do not have a profound effect on melting time or temperatures.
When surface melting is suppressed, barrierless bulk melting occurs in the entire sample, and elastodynamic
effects are more important. Good correspondence with published, experimentally-determined melting time
is found for a broad range of heating rates. Similar approaches can be applied to study various phase trans-
formations in different materials and nanostructures under high heating rates.
Melting of metals induced by ultra-fast laser heating has beenstudied for the past several decades from both academic andapplied points of view. In industrial applications, ultra-fastheating and melting of metals are utilized for various purposes,even without a full understanding of melting mechanisms.Examples include the reforming of micron particles (and henceproducing nanoparticles1), production of hollow nanoparticles,2
laser-induced forward transfer (LIFT),3 light-induced rapidannealing (LIRA)4 and nano-structuring.5 Ultra-fast heatingand melting are parts of more complex phenomena like fastcombustion of metallic nanoparticles6 and LIFT of a nanolayer.3
From basic perspectives, many theoretical, computational, andexperimental studies have been dedicated to this topic (seereviews6–8); however, there are still remaining puzzles, especiallyfor extreme conditions, which enable kinetic superheating.A melting mechanism under such high heating rates is not
governed by thermodynamics only but rather by a combinationof thermodynamics, kinetics, thermal conduction, mechanics,and several nanoscale effects, as well as their coupling. As will beshown, nanoscale effects are related to several characteristicdimensions. Two of them are the width of a sample (w = 25 nm)and variable distance between moving interfaces where astanding elastic wave is localized, which also depends on w.Three other scale parameters are independent of w: (a) width ofa pre-molten surface layer (1 nm) where melt nucleates;(b) width of a propagating solid–melt interface (3 nm) withinwhich all transformation-related processes occur, and (c) size ofinterface collapse region (5 nm) where temperature dropsdrastically. Simple models,9–12 which assumed that homogeneousmelt nucleation is the only mechanism, have failed to reproducethe superheating temperature observed in the experiments.13–15 Itis known that fast heating can produce elastic waves16 and thesewaves can interact with thermal physics by thermoelastic coupling.In the same way, phase transformation is coupled to thermalconduction, in particular through latent heat and the effect oftemperature on the kinetics of melting. Recent experimental studyfor a TiNi shape memory alloy also reported the observation ofnanoscale temperature variation coupled with mechanical loading
a Department of Aerospace Engineering, Iowa State University, Ames, Iowa 50011,
USA. E-mail: [email protected] Departments of Aerospace Engineering, Mechanical Engineering, and Material
Science and Engineering, Iowa State University, Ames, Iowa 50011, USA.
E-mail: [email protected]; Fax: +1 801 788 0026; Tel: +1 515 294 9691
Received 28th July 2015,Accepted 30th October 2015
DOI: 10.1039/c5cp04443j
www.rsc.org/pccp
PCCP
PAPER
Phys. Chem. Chem. Phys. This journal is© the Owner Societies 2015
and phase transformation.17 Note that properties of the shapememory alloys are highly sensitive to the temperature.17 Coupledmodels for the melting of metals, irradiated by an ultrafast laser, thatinclude mechanics and the two temperature model (TTM) forheating have been suggested in ref. 16 and 18. However, they didnot include kinetics of melting and were not able to resolve super-heating or the coupling of phase transformation with temperatureevolution. The melting models coupled to TTM for heating andan interface-tracking model based on melt nucleation kineticswere developed in ref. 19 and 20. However, they did not includemechanics and coupling between temperature evolution andmechanics. The model in ref. 21 was focused on heatingprocesses without the kinetics of melting and elastic waves.
Recently,15 we have suggested a phase field approach, whichcombined melting with the TTM for heating and mechanics. It wassuccessfully applied to the study of kinetic superheating and meltingbeyond the theoretically-predicted ultimate superheating limit ofaluminum, for example, 1.38Teq, based on the entropy catastrophe.22
However, this model has several drawbacks: temperature evolutionincludes laser heating only and neglects coupling to melting (latentheat of fusion) and mechanics. Also, the static equilibrium equationwas used instead of the dynamic equation of motion. This couldresult in an overestimation of kinetic superheating temperature andinaccuracy in melting kinetics. In ref. 23, this model was expandedby developing a new lattice temperature evolution equation, whichtakes into account thermoelastic coupling, transformation heat, andthe dissipation rate due to phase transformation. It was applied to arelatively slow heating rate; it was demonstrated that internal stressescan reduce the melting temperature for an Al nanolayer below thebulk melting temperature, Teq. Still, mechanical equilibrium wasimposed and electron temperature and electron–phonon couplingwere neglected. In the current research, in order to study higherheating rates, we further improved our model. Thus, we includedadvanced thermomechanical coupling, transformation heat, and thedissipation rate due to melting in the TTM and substituted theelastostatic formulation with an elastodynamic one. The melting of afree standing aluminum nanolayer irradiated by a picosecond laser14
is simulated and compared with experimentally observed meltingtimes to verify the validity of the model, and with the results of asimplified model.15 The details of melting and superheating physicsare analyzed and some surprising effects have been revealed. Inparticular, an increase in heating rate leads to temperature reductionat the moving solid–melt interfaces due to fast absorption of thelatent heat. Also, a sharp temperature decrease exceeding severalhundred K (even below melting temperature) at the final stage ofmelting occurs, which is caused by a collision of two interfaces andaccelerated melting. When surface melting is suppressed, barrierlessbulk melting occurs in the entire sample above the instabilitytemperature of the solid, promoted by elastodynamic effects.
1 Phase field, temperature evolution,and elastodynamic models
Governing equations are comprised of the coupled Ginzburg–Landau equation for melting, equations of elastodynamics or
elastostatics, and the TTM which includes contributions due toheat of fusion, thermoelastic effects, and dissipation due tomelting. They represent further development of equationsformulated in ref. 15 and 23–25.
Kinematics
Total strain tensor e = (=0u)s is decomposed into elastic ee,transformation et, and thermal ey strains in an additive way:
e = ee + et + ey; e = 1/3e0I + e; (1)
ein = einI = et + ey; et = 1/3e0t(1 � f(Z))I; (2)
ey = as(Teq � T0)I + (am + Daf(Z))(T � Teq)I. (3)
Here, u is the displacement vector; =0 is the gradient operatorin the undeformed state; the subscript s designates symmetri-zation; Z is the order parameter (Z = 1 represents solid and Z = 0is melt), as and am are the linear thermal expansion coefficientsfor solid and melt, respectively; Da = as � am, I is the unittensor; T0 is the reference temperature; e0 is the total volumetricstrain; e0t is the volumetric transformation strain for completemelting; e is the deviatoric strain, and f(Z) = Z2(3 � 2Z) is theinterpolation function for variation of any material propertybetween solid and melt.
Free energy
Free energy per unit undeformed volume is formulated as inref. 15 and 24:
c ¼ ce þ J �cy þ cy þ Jcr; �cy ¼ AZ2ð1� ZÞ2; (4)
ce = 0.5Ke0e2 + mee:ee; cy = H(T/Teq � 1)f(Z); (5)
cr = 0.5b|=Z|2, A := 3H(1 � Tc/Teq), (6)
where �cy, ce, cy, and cr are the double-well, elastic, thermal,and gradient energy, respectively; r0 and r are the massdensities in the undeformed and deformed states, respectively;J = r0/r = 1 + e0; K(Z) = Km + DKf(Z) and m(Z) = msf(Z) are the bulkand shear moduli, where DK = Ks � Km; b is the gradient energycoefficient; H is latent heat of fusion; = is the gradient operatorin the deformed state; and Tc is the melt instability temperature.
Stresses
A thermodynamic procedure similar to that in ref. 26–28 leadsto the following equations for the stress tensor r
r ¼ @c@e� J�1=Z� @c
@=Z¼ re þ rst;
re ¼ Ke0eI þ 2mee; rst ¼ cr þ �cy� �
I � b=Z� =Z;
(7)
where re and rst are the elastic stresses and interface stresses(interface tension), and # means the dyadic product of vectors.Correct expression for the interface stresses are obtainedby using the gradient operator in the deformed state of
the gradient energy cr and by multiplying �cy and cr by theJacobian J.
Paper PCCP
This journal is© the Owner Societies 2015 Phys. Chem. Chem. Phys.
Ginzburg–Landau equation
The explicit expression for the thermodynamic driving force X,work-conjugated to the _Z, can be obtained using the samethermodynamic procedure. A linear relationship between Xand _Z results in the Ginzburg–Landau equation for melting:
1
L
@Z@t¼ X ¼ �J�1@c
@Z
����e
þ = � J�1@c@=Z
� �
¼ J�1 �e0tpe þ 3peDa T � Teq
� � @f@Z
�J�1 0:5DKe0e2 þ mee : ee þHT
Teq� 1
� �� �@f@Z
�4AZð1� ZÞð0:5� ZÞ þ br2Z� BL;
(8)
where L is the kinetic coefficient, pe = re:I/3 = � %p is the meanelastic stress, %p is the elastic pressure (as usual, compressivepressure is positive), and B is the term that mimics thermalfluctuations.
The equation of motion
The equation of motion is written in a traditional form
r@2u
@t2¼ = � r: (9)
It allows the description of elastic waves caused by fast heatingand melting. When melting occurs at a time scale much largerthan that for an elastic wave, the static equilibrium equation,=�r = 0, is used instead.
Two-temperature model
The TTM states that energy absorbed by electron gas near themetal surface spreads over the electron gas by collisions ofelectrons within the femtosecond time scale and later transfersto a phonon by electron–phonon coupling.29 The heat transfermechanism can be represented by the lattice conduction equation,the electron conduction equation, and their coupling:
Cl@T
@t¼ = � kl=Tð Þ þ G Te � Tð Þ � 3T am þ Dafð Þ@pe
@t
þ @Z@t
� �2,
L� 3peDa�H
Teq
�T@f@Z@Z@t;
(10)
Ce@Te
@t¼ = � ke=Teð Þ þ I � G Te � Tð Þ; (11)
where T and Te are the temperature of lattice and electron gas,respectively, kl and ke are the lattice and electron thermal con-ductivity coefficients, respectively, I is the laser power absorbed bythe electrons, G is the electron–phonon coupling coefficient, andCl = Clm + (Cls � Clm)f(Z) is the lattice heat capacity where Clm andCls are the heat capacities for melt and solid, respectively. In thelattice heating eqn (10), the second term is due to electron–phononcoupling, the third term appears due to thermoelastic coupling, thefourth term is the dissipation due to melting, and the final term is acontribution due to heat of fusion and change in the thermal
expansion coefficient during melting. Usually, only heat of fusion isincluded in the temperature evolution equation.30 Also, sinceentropy of fusion H/Teq is considered to be constant, heat of fusiondecreases for melting below Teq at slow heating and increases forthe high heating rates with overheating.
2 Problem formulation for the laserheating
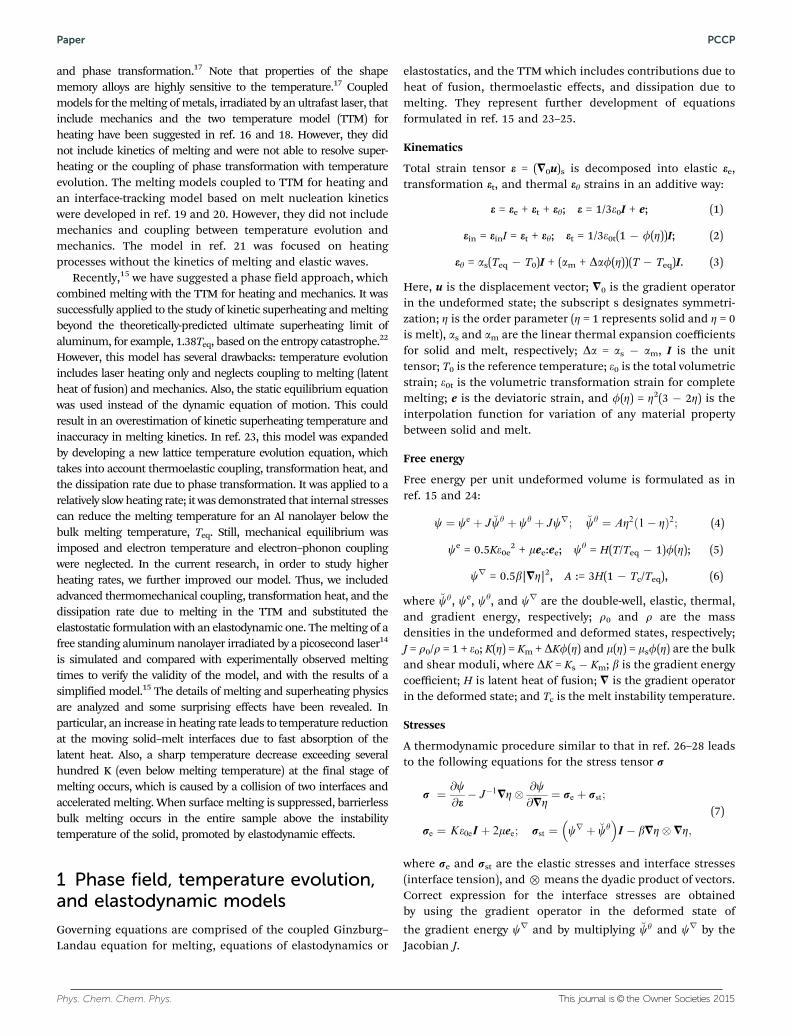
Experimental observation of the melting of a free-standingaluminum nanolayer with the thickness w = 25 nm, irradiatedby a picosecond laser,14 is simulated. Because the radius of theirradiated spot was much larger than w (mm vs. ns) the problemcould be safely considered to be a 1-D problem with zerodisplacements orthogonal to the laser axis; all parameters varyalong the laser axis x only. Fig. 1 shows the schematic of acomputational domain.
Six different laser fluences (7, 8, 9, 10, 11, 13 mJ cm�2) areused in simulations with corresponding pulse durations (1000,350, 180, 115, 60, 20 ps) in accordance with experimental data.14
While the laser beam may have Gaussian fluence distributionorthogonal to the axis across its 4 mm diameter, we operate withaveraged fluences due to two reasons. First, in ref. 14 theaveraged laser fluences were measured and reported for thecentral spot masked by 1 mm diameter hole, and the diameter ofexamining electron beam was even smaller, namely 500 mm,where the energy distribution on a Gaussian profile is possiblyflat. Second, accounting for such a distribution would requireconsideration of axisymmetric problem with the sample diameterof more than 2 mm, while resolving numerically 1 nm wide surfacemelt. This is not only computationally prohibitive but also notsmart. Cases with fluences 11 and 13 mJ cm�2 only are treated inelastodynamic formulation since the time scale for heating forother cases is at least more than an order of magnitude larger than
the acoustic time ta ¼w
2c’ 3 ps (i.e., the time of propagation of an
elastic wave with velocity c = 4000 m s�1 through half of a samplewidth w/2). The finite-element code COMSOL Multiphysics wasused for the simulations.31
Boundary and initial conditions, and source terms
Both plane boundaries are stress-free in the case of an elasto-dynamic problem, and one of the boundaries is fixed to prevent
Fig. 1 Schematics of a sample and distribution of irradiated energy.
PCCP Paper
Phys. Chem. Chem. Phys. This journal is© the Owner Societies 2015
translation and rotation of a sample for elastostatic formulation.Since energy irradiated by the laser is included as a volumetricheat source according to Beer–Lambert law in eqn (12), the heatflux was zero at both plane boundaries. Attenuation of the laserirradiated is modeled as16
I = I0 exp(�z(w � x)); I0 = zW/(1 � exp(�zw));
W = (1 � R)F0/tp, (12)
where z is the absorption coefficient, which is 1.21 � 108 m�1
for the 1064 nm laser used in the experiment; R is thereflectance, which was accepted as 0 since fully absorbedfluence was reported in experiment;14 tp is the pulse duration;and F0 is the fluence of a laser.
The boundary condition for the order parameter Z at thesurface with the unit normal n is
J@c@=Z
� n ¼ b=Z � n ¼ �dgdZ; (13)
where g(Z) = gm + (gs � gm)f(Z); gs and gm are the solid–vaporand melt–vapor surface energies, which depend on crystal facesat the surface, the state of the surface, and the surroundings.Reduction of the surface energy during melting produces anadditional driving force for melting, which can lead to barrierlesssurface premelting (incomplete melt, Z 4 0) and melting below thebulk melting temperature. This phenomenon is observed in experi-ments (see review7) and can be described well by boundary condi-tions eqn (13) (see ref. 15 and 23–25).
Two regimes will be considered:(a) The gs and gm presented in Table 123 lead to the surface-
induced melt nucleation and correspond to experimental con-ditions in ref. 14. Since for a homogeneous solid phase Z = 1,the driving force X = 0 in the Ginzburg–Landau eqn (8) anddg/dZ = 0 in eqn (13), one needs some perturbations at theboundary to initiate melting. We use the condition that if at theboundaries Z 4 1 � Z, then Z = 1 � Z, where perturbationZ = 10�5. Without this condition, even if the initial value ofZ o 1, it can return to Z = 1 during heating below the meltingtemperature and melting could not start. For surface-induced,melting we set B = 0 in the Ginzburg–Landau eqn (8), since bulkperturbations are not required.
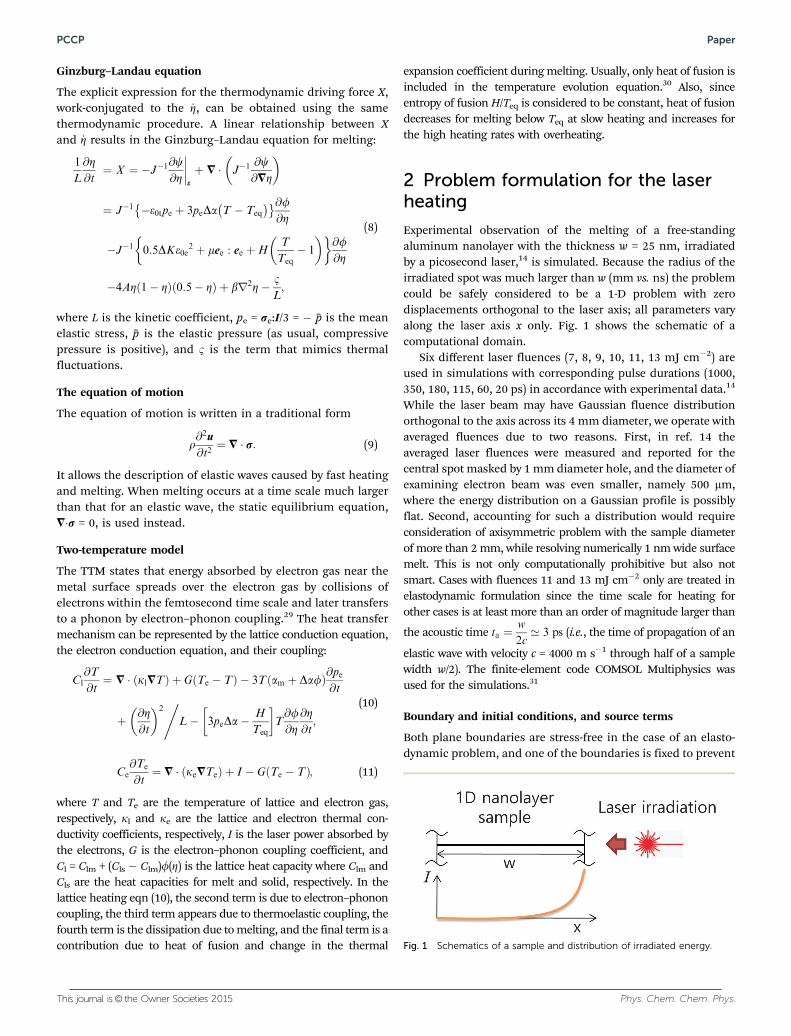
(b) To avoid surface-induced melting, we assume gs = gm. In thiscase, melting starts in the bulk after exceeding the temperature atwhich solid loses its stability. To model thermal fluctuations, onecan introduce Langevin noise B that satisfies the fluctuation–dissipation theorem.32,33 This, however, requires a separate studyand here we will use the simplest possible method to initiate bulkmelting. Thus, we assume B = 10�4 ps�1 if Z 4 0.999999 and B = 0otherwise. Independent of the time step in the numerical integra-tion, the piece-wise constant and homogeneous perturbation B is
introduced with a time step of 0.01 ps. Due to numerical errors insimulations, such a perturbation produces a random-like fluctua-tion of the order parameter as shown in Fig. 2. Without perturba-tion B, the magnitude of numerical errors is several orders ofmagnitude smaller. Heating rate Q = 84.15 K ps�1 is consideredfor this regime.
The initial temperature is T0 = 293.15 K, the sample isinitially stress free, and the initial Z = 0.999 for all cases.
Material properties
The lattice heat capacities are described by the followingequations:34
Cls = (2434.86 + 1.457(T� 300.0))� 103 J m�3 K�1 for T o 900.0 K;
Cls = 3308.87 � 103 J m�3 K�1 for T 4 900.0 K;
Clm = (2789.1 � 0.314(T � 933.0)) � 103 J m�3 K�1. (14)
The heat capacity of electron gas is Ce = �gTe, where �g =91.2 J m�3 K�2 is the electron heat capacity constant.35 Forthe electron–phonon coupling coefficient G, the theoreticallycalculated data is used:35
G = (3.663 � 1.218/(1 + (Te � 10�4/0.221)2.294)) � 1017. (15)
The electron thermal conductivity is approximated as ke = keqe Te/T
to take into account the non-equilibrium effect36,37
keqe = keq
em + f(Z)(keqes � keq
em), (16)
where keqes = 208 W m�1 K�1 for solid and keq
em = 102 W m�1 K�1
for melt.34 The lattice thermal conductivity is kl = 0.01ke (inref. 38). The critical temperature for the loss of stability of meltis Tc = 0.8Teq. Coefficients, constants, and properties used forthe simulation are presented in Table 1.23
Table 1 Properties of aluminum23
Teq (K) H (J m�3) Km (GPa) Ks (GPa) m (GPa) e0t am (K�1) as (K�1) gs (J m�2) gm (J m�2) b (N) L (m2 N�1 s�1)
933.67 933.57 � 106 41.3 71.1 27.3 0.06 4.268 � 10�5 3.032 � 10�5 1.050 0.921 3.21 � 10�10 532
Fig. 2 Distribution of fluctuations of the order parameter introduced byperturbations for fluence of 13 mJ cm�2.
Paper PCCP
This journal is© the Owner Societies 2015 Phys. Chem. Chem. Phys.
3 Surface-induced melting andinterface propagationSome definitions
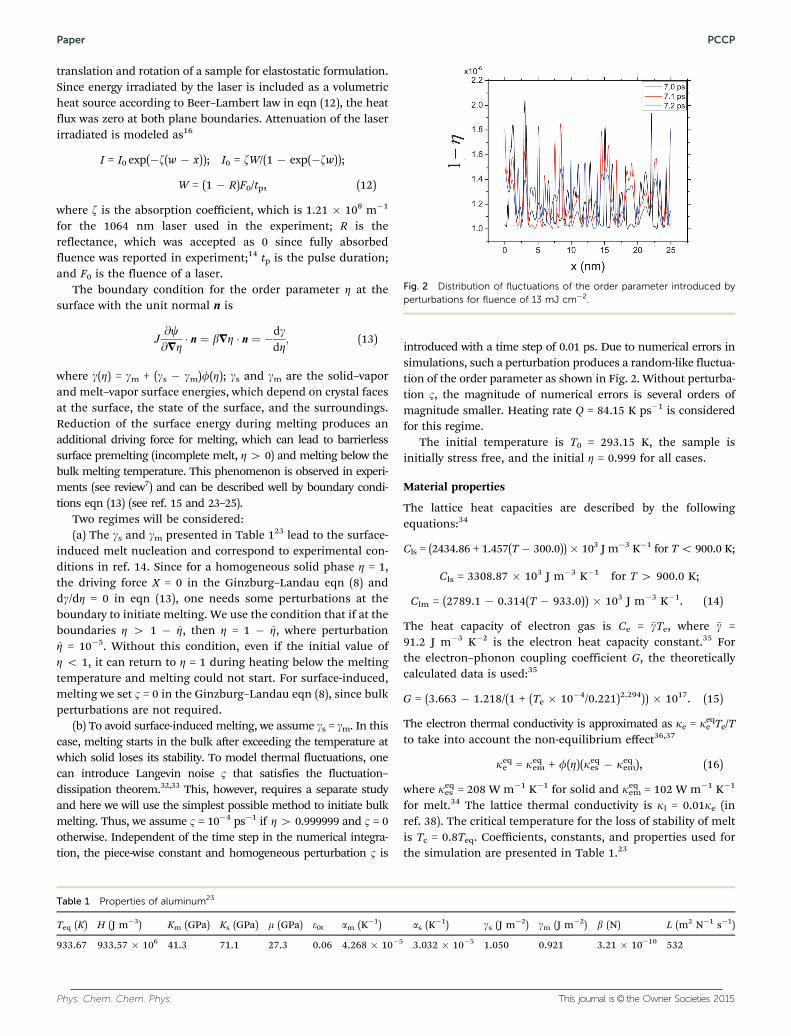
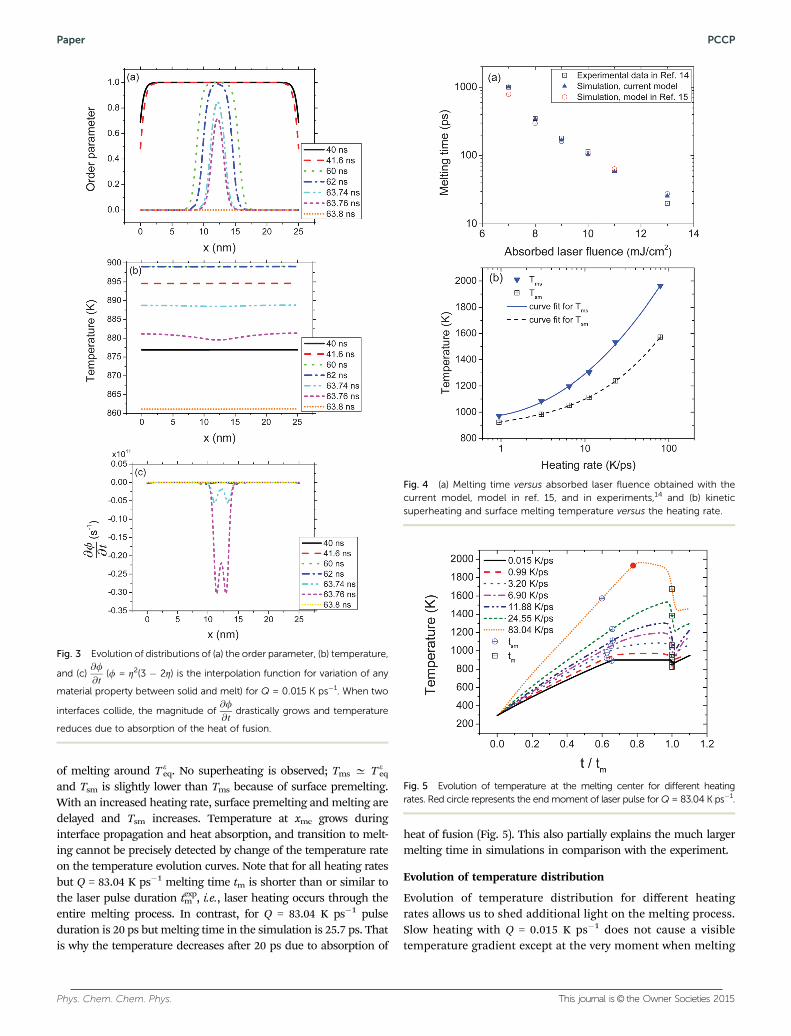
The melting of a 25 nm thin Al nanolayer irradiated by an ultrafastlaser is simulated. Conditions and results are summarized inTable 2. In all simulations, the melting of a sample starts fromboth surfaces driven by the reduction in surface energy duringmelting. Melt nucleation away from the solid–melt interfaces wasnot observed. Fig. 3(a) shows the typical evolution of the orderparameter Z. The melting time, tm, is defined as time from themoment of laser irradiation to the instant when two solid–meltinterfaces collide and merge together; the position of an interfaceis defined by Z = 0.5; and the point of meeting of interfaces (themelting center of the sample) is designated as xmc. This definitionis motivated by way of comparison with experiments, wheremelting time corresponds to the disappearance of X-ray peaksof solid phase. We define Tms as the maximum superheatingtemperature of the solid during melting, which is reached at themelting center while Z4 0.5. We designate time corresponding toTms as tms. As we will see tms is slightly smaller than tm, becausethere is a temperature drop, down to the temperature Tmf at theend of melting (see Fig. 5). The surface melting time, tsm, isdefined as the time when the order parameter reaches 0.5 forthe first time at the external surface and the surface meltingtemperature Tsm is defined as a temperature at the surface at tsm.
Heating rate is defined as Q ¼ Tsm � T0
tsmsince for most cases
temperature increases almost linearly before the initiation ofmelting.
Comparison with experiment in terms of melting time
For ‘‘slow’’ heating rate Q = 0.015 K ps�1, kinetic superheating isnot observed and the melting temperature is as low as T e
eq =898.1 K, i.e., significantly below Teq. T e
eq is the equilibrium meltingtemperature under uniaxial strain conditions and correspondingbiaxial stresses, which relax during melting,23 thus producing anadditional thermodynamic driving force for melting and reducingmelting temperature. This driving force exists for the high heatingrate as well, but it is overpowered by kinetic factors and meltingtemperature significantly exceeds Teq. The results for the slow
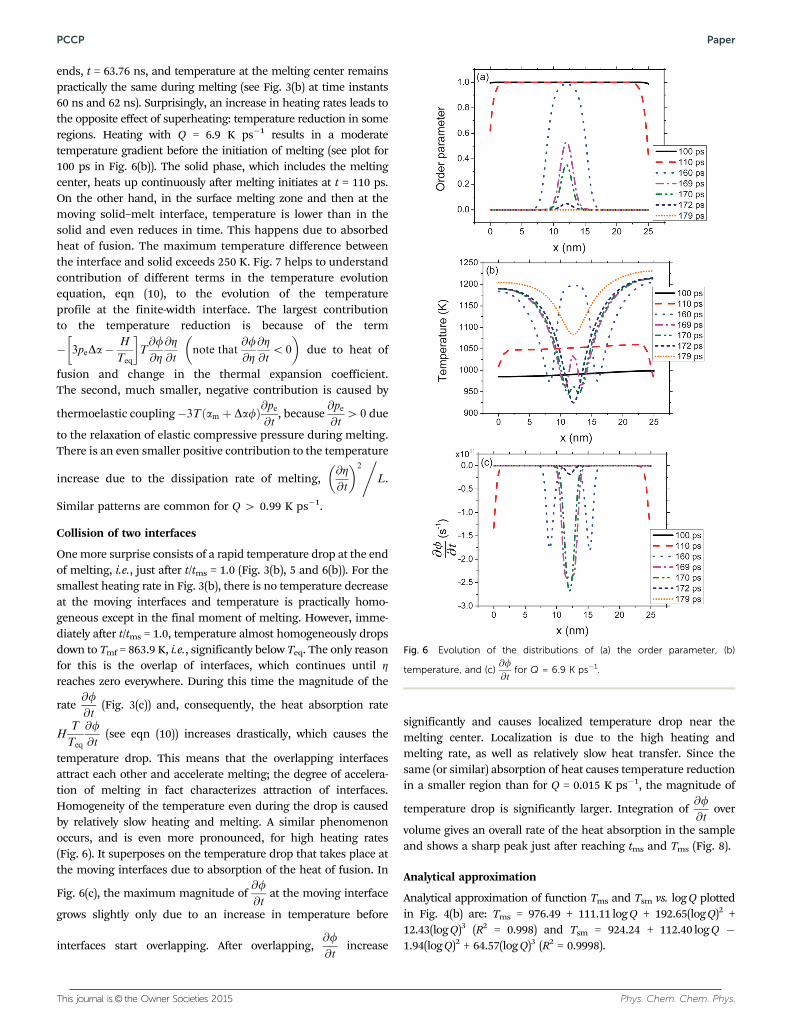
heating are included in Table 2 in order to quantify super-heating with respect to this temperature. As shown in Table 2,simulation results exhibit good agreement with experimentaldata in terms of melting time, except the strongest fluence case.The relative error between simulation result and the experi-mental measurement for the highest fluence is 29.5%; asidefrom this point, the relative error is 4.0% on average. With thecurrent fully coupled lattice heat conduction and meltingequations, the predictive capability of the simulation is signifi-cantly enhanced in comparison with the previous simulation,15
see Table 2 and Fig. 4(a).Since part of the melting time is related to time of propaga-
tion of two interfaces through the sample until they meet, totalmelting time and, consequently, superheating increase withthe sample thickness for this regime. For larger thicknesses,barrierless bulk melting can start in the remaining part of thesample and completes melting. In this case melting time andsuperheating are getting independent of the sample size.
While it may be surprising that the equilibrium meltingoccurs at constant temperature at the heating rate as high(from equilibrium perspective) as 0.015 K ps�1, this can besupported by the balance of the supplied and absorbed energyrates. Thus, the averaged heating rate by a laser irradiation,F0/(wtexp
m ) = 4.0� 107 J m�3 ns�1, is slightly lower than the averagedabsorbed energy rate is H/(tm � tsm) = 4.24 � 107 J m�3 ns�1, i.e.,temperature increase is impossible.
Kinetic superheating
Since the solid–melt interface has finite velocity, the tempera-ture of the solid at the center of a sample can reach muchhigher values than Tsm and Te
eq during fast heating before the
interface arrives. Superheating factors are defined as yec ¼Tms
T eeq
and yc ¼Tms
Teq. It is clear that yc/yec = 0.96. Evolution of tempera-
ture at point xmc is presented in Fig. 5. The melting center xmc
shifts left as laser power becomes stronger (Table 2) becausefaster heating produces a larger temperature gradient and theright interface appears earlier and propagates faster than theleft one. For slow heating with Q = 0.015 K ps�1, a plateauappears due to absorption of the latent heat, following initiation
Table 2 Summary of simulation conditions and results
Fluence (F0, mJ cm�2) tsm (ps) tms (ps) texpm
a (ps) tm (ps) tmd (ps) Q (K ps�1) Tsm (K) Tms (K) Tmf (K) yec xmc (nm)
10b 41 600 6 � 104 105 63 500 0.015 894.5 899.0 863.9 1.00 12.47 638 896 103 1013 789.8 0.99 921.9 971.8 784.8 1.08 12.358 216 321 350 344 296.8 3.20 983.4 1086.1 837.9 1.21 12.259 110 160 180 169 161.5 6.90 1052.4 1197.0 925.7 1.33 12.110 69 100 115 104.4 106.4 11.88 1112.5 1304.4 1004.3 1.45 11.9511 38.5 57 60 58.5 63.6 24.55 1238.3 1532.5 1210.3 1.71 11.8511c 37.5 60 58.0 25.26 1240.5 1538.6 1.71 11.8513 15.4 21.2 20 25.7 27.7 83.04 1572.0 1963.8 1441.5 2.19 11.513c 15.4 20 25.9 84.15 1589.1 1971.2 2.19 11.55
a Pulse duration tp in simulation is same as texpm in the experiment. b Imaginary slow heating case to evaluate equilibrium melting temperature
modified by biaxial stress. texpm for this case means the pulse duration in simulation. c An elastodynamic formulation and waves are included.
d Simulated melting time without couplings.15
PCCP Paper
Phys. Chem. Chem. Phys. This journal is© the Owner Societies 2015
of melting around T eeq. No superheating is observed; Tms C T e
eq
and Tsm is slightly lower than Tms because of surface premelting.With an increased heating rate, surface premelting and melting aredelayed and Tsm increases. Temperature at xmc grows duringinterface propagation and heat absorption, and transition to melt-ing cannot be precisely detected by change of the temperature rateon the temperature evolution curves. Note that for all heating ratesbut Q = 83.04 K ps�1 melting time tm is shorter than or similar tothe laser pulse duration texp
m , i.e., laser heating occurs through theentire melting process. In contrast, for Q = 83.04 K ps�1 pulseduration is 20 ps but melting time in the simulation is 25.7 ps. Thatis why the temperature decreases after 20 ps due to absorption of
heat of fusion (Fig. 5). This also partially explains the much largermelting time in simulations in comparison with the experiment.
Evolution of temperature distribution
Evolution of temperature distribution for different heatingrates allows us to shed additional light on the melting process.Slow heating with Q = 0.015 K ps�1 does not cause a visibletemperature gradient except at the very moment when melting
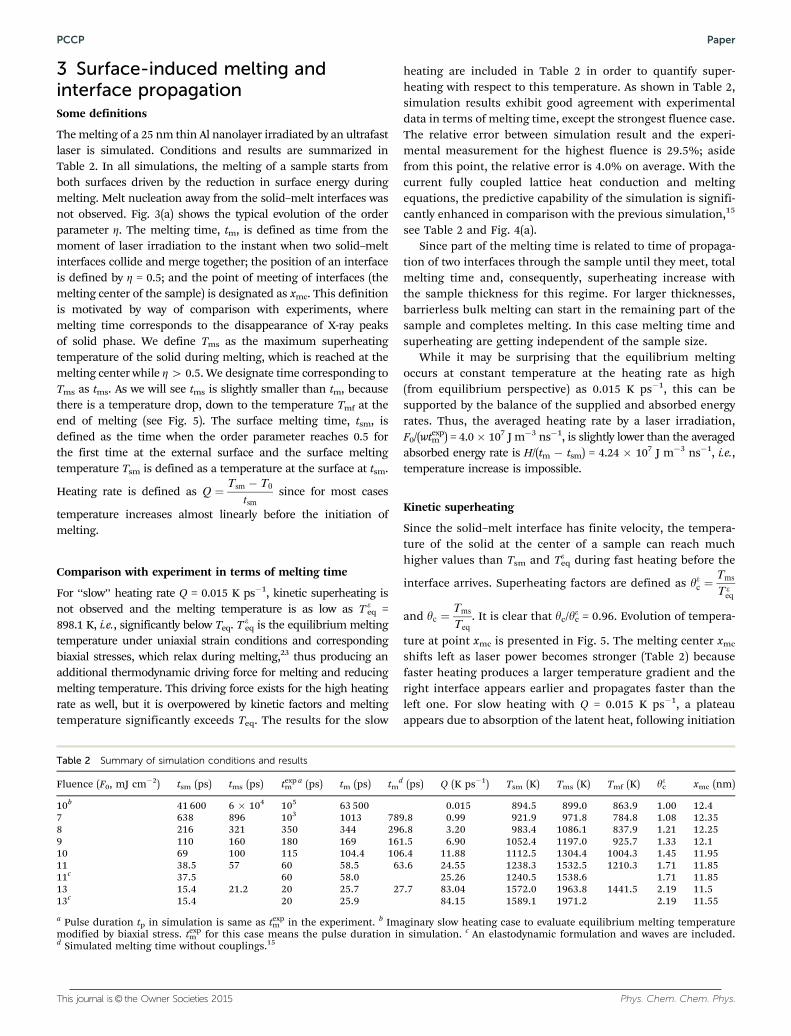
Fig. 3 Evolution of distributions of (a) the order parameter, (b) temperature,
and (c)@f@t
(f = Z2(3 � 2Z) is the interpolation function for variation of any
material property between solid and melt) for Q = 0.015 K ps�1. When two
interfaces collide, the magnitude of@f@t
drastically grows and temperature
reduces due to absorption of the heat of fusion.
Fig. 4 (a) Melting time versus absorbed laser fluence obtained with thecurrent model, model in ref. 15, and in experiments,14 and (b) kineticsuperheating and surface melting temperature versus the heating rate.
Fig. 5 Evolution of temperature at the melting center for different heatingrates. Red circle represents the end moment of laser pulse for Q = 83.04 K ps�1.
Paper PCCP
This journal is© the Owner Societies 2015 Phys. Chem. Chem. Phys.
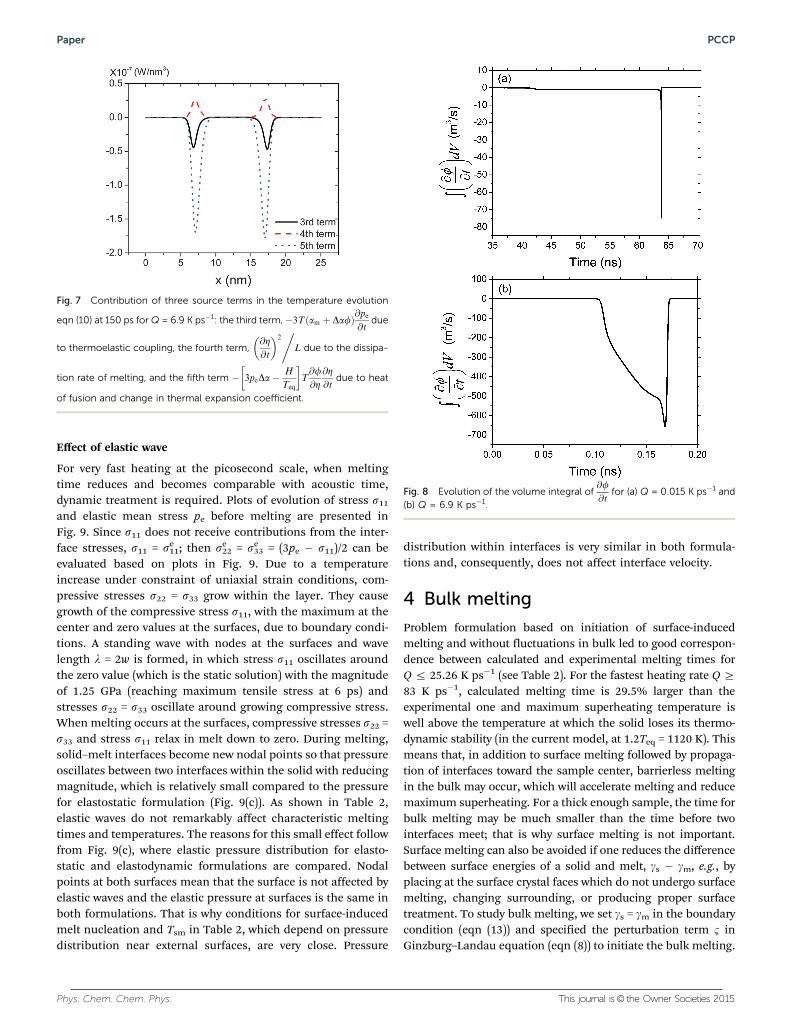
ends, t = 63.76 ns, and temperature at the melting center remainspractically the same during melting (see Fig. 3(b) at time instants60 ns and 62 ns). Surprisingly, an increase in heating rates leads tothe opposite effect of superheating: temperature reduction in someregions. Heating with Q = 6.9 K ps�1 results in a moderatetemperature gradient before the initiation of melting (see plot for100 ps in Fig. 6(b)). The solid phase, which includes the meltingcenter, heats up continuously after melting initiates at t = 110 ps.On the other hand, in the surface melting zone and then at themoving solid–melt interface, temperature is lower than in thesolid and even reduces in time. This happens due to absorbedheat of fusion. The maximum temperature difference betweenthe interface and solid exceeds 250 K. Fig. 7 helps to understandcontribution of different terms in the temperature evolutionequation, eqn (10), to the evolution of the temperatureprofile at the finite-width interface. The largest contributionto the temperature reduction is because of the term
� 3peDa�H
Teq
�T@f@Z@Z@t
note that@f@Z@Z@t
o 0
� �due to heat of
fusion and change in the thermal expansion coefficient.The second, much smaller, negative contribution is caused by
thermoelastic coupling�3T am þ Dafð Þ@pe@t
, because@pe@t
4 0 due
to the relaxation of elastic compressive pressure during melting.There is an even smaller positive contribution to the temperature
increase due to the dissipation rate of melting,@Z@t
� �2,
L.
Similar patterns are common for Q 4 0.99 K ps�1.
Collision of two interfaces
One more surprise consists of a rapid temperature drop at the endof melting, i.e., just after t/tms = 1.0 (Fig. 3(b), 5 and 6(b)). For thesmallest heating rate in Fig. 3(b), there is no temperature decreaseat the moving interfaces and temperature is practically homo-geneous except in the final moment of melting. However, imme-diately after t/tms = 1.0, temperature almost homogeneously dropsdown to Tmf = 863.9 K, i.e., significantly below Teq. The only reasonfor this is the overlap of interfaces, which continues until Zreaches zero everywhere. During this time the magnitude of the
rate@f@t
(Fig. 3(c)) and, consequently, the heat absorption rate
HT
Teq
@f@t
(see eqn (10)) increases drastically, which causes the
temperature drop. This means that the overlapping interfacesattract each other and accelerate melting; the degree of accelera-tion of melting in fact characterizes attraction of interfaces.Homogeneity of the temperature even during the drop is causedby relatively slow heating and melting. A similar phenomenonoccurs, and is even more pronounced, for high heating rates(Fig. 6). It superposes on the temperature drop that takes place atthe moving interfaces due to absorption of the heat of fusion. In
Fig. 6(c), the maximum magnitude of@f@t
at the moving interface
grows slightly only due to an increase in temperature before
interfaces start overlapping. After overlapping,@f@t
increase
significantly and causes localized temperature drop near themelting center. Localization is due to the high heating andmelting rate, as well as relatively slow heat transfer. Since thesame (or similar) absorption of heat causes temperature reductionin a smaller region than for Q = 0.015 K ps�1, the magnitude of
temperature drop is significantly larger. Integration of@f@t
over
volume gives an overall rate of the heat absorption in the sampleand shows a sharp peak just after reaching tms and Tms (Fig. 8).
Analytical approximation
Analytical approximation of function Tms and Tsm vs. log Q plottedin Fig. 4(b) are: Tms = 976.49 + 111.11 log Q + 192.65(log Q)2 +12.43(log Q)3 (R2 = 0.998) and Tsm = 924.24 + 112.40 log Q �1.94(log Q)2 + 64.57(log Q)3 (R2 = 0.9998).
Fig. 6 Evolution of the distributions of (a) the order parameter, (b)
temperature, and (c)@f@t
for Q = 6.9 K ps�1.
PCCP Paper
Phys. Chem. Chem. Phys. This journal is© the Owner Societies 2015
Effect of elastic wave
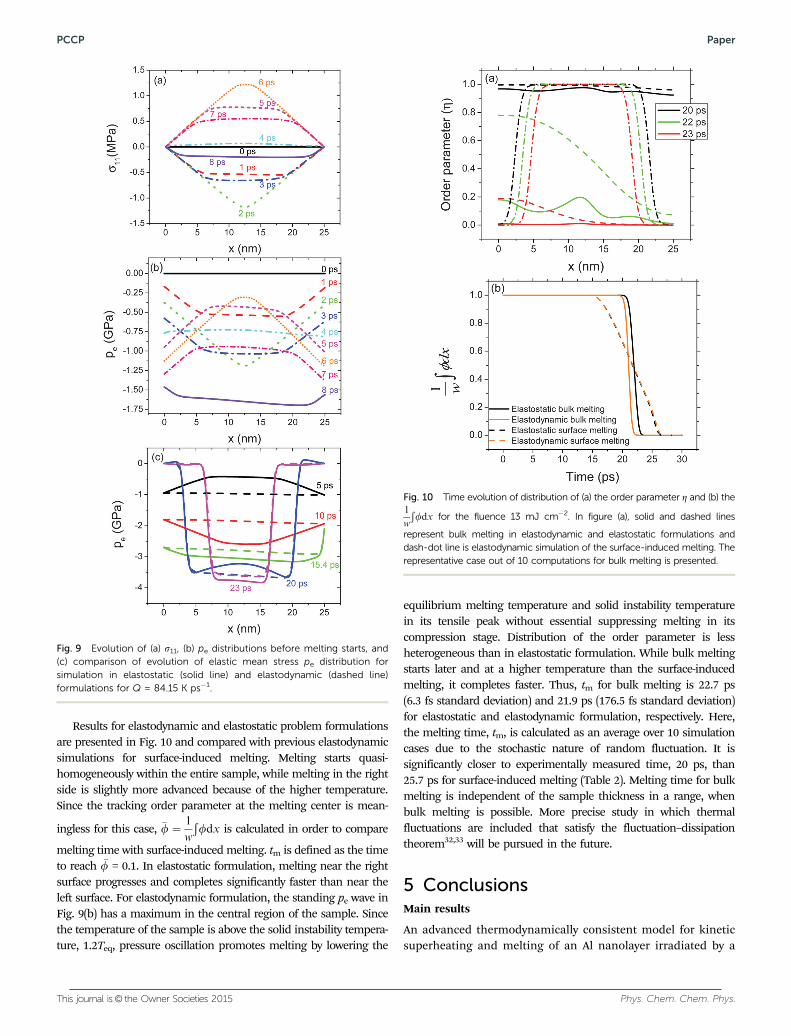
For very fast heating at the picosecond scale, when meltingtime reduces and becomes comparable with acoustic time,dynamic treatment is required. Plots of evolution of stress s11
and elastic mean stress pe before melting are presented inFig. 9. Since s11 does not receive contributions from the inter-face stresses, s11 = se
11; then se22 = se
33 = (3pe � s11)/2 can beevaluated based on plots in Fig. 9. Due to a temperatureincrease under constraint of uniaxial strain conditions, com-pressive stresses s22 = s33 grow within the layer. They causegrowth of the compressive stress s11, with the maximum at thecenter and zero values at the surfaces, due to boundary condi-tions. A standing wave with nodes at the surfaces and wavelength l = 2w is formed, in which stress s11 oscillates aroundthe zero value (which is the static solution) with the magnitudeof 1.25 GPa (reaching maximum tensile stress at 6 ps) andstresses s22 = s33 oscillate around growing compressive stress.When melting occurs at the surfaces, compressive stresses s22 =s33 and stress s11 relax in melt down to zero. During melting,solid–melt interfaces become new nodal points so that pressureoscillates between two interfaces within the solid with reducingmagnitude, which is relatively small compared to the pressurefor elastostatic formulation (Fig. 9(c)). As shown in Table 2,elastic waves do not remarkably affect characteristic meltingtimes and temperatures. The reasons for this small effect followfrom Fig. 9(c), where elastic pressure distribution for elasto-static and elastodynamic formulations are compared. Nodalpoints at both surfaces mean that the surface is not affected byelastic waves and the elastic pressure at surfaces is the same inboth formulations. That is why conditions for surface-inducedmelt nucleation and Tsm in Table 2, which depend on pressuredistribution near external surfaces, are very close. Pressure
distribution within interfaces is very similar in both formula-tions and, consequently, does not affect interface velocity.
4 Bulk melting
Problem formulation based on initiation of surface-inducedmelting and without fluctuations in bulk led to good correspon-dence between calculated and experimental melting times forQ r 25.26 K ps�1 (see Table 2). For the fastest heating rate Q Z
83 K ps�1, calculated melting time is 29.5% larger than theexperimental one and maximum superheating temperature iswell above the temperature at which the solid loses its thermo-dynamic stability (in the current model, at 1.2Teq = 1120 K). Thismeans that, in addition to surface melting followed by propaga-tion of interfaces toward the sample center, barrierless meltingin the bulk may occur, which will accelerate melting and reducemaximum superheating. For a thick enough sample, the time forbulk melting may be much smaller than the time before twointerfaces meet; that is why surface melting is not important.Surface melting can also be avoided if one reduces the differencebetween surface energies of a solid and melt, gs � gm, e.g., byplacing at the surface crystal faces which do not undergo surfacemelting, changing surrounding, or producing proper surfacetreatment. To study bulk melting, we set gs = gm in the boundarycondition (eqn (13)) and specified the perturbation term B inGinzburg–Landau equation (eqn (8)) to initiate the bulk melting.
Fig. 7 Contribution of three source terms in the temperature evolution
eqn (10) at 150 ps for Q = 6.9 K ps�1: the third term,�3T am þ Dafð Þ@pe@t
due
to thermoelastic coupling, the fourth term,@Z@t
� �2,
L due to the dissipa-
tion rate of melting, and the fifth term � 3peDa�H
Teq
�T@f@Z@Z@t
due to heat
of fusion and change in thermal expansion coefficient.
Fig. 8 Evolution of the volume integral of@f@t
for (a) Q = 0.015 K ps�1 and(b) Q = 6.9 K ps�1.
Paper PCCP
This journal is© the Owner Societies 2015 Phys. Chem. Chem. Phys.
Results for elastodynamic and elastostatic problem formulationsare presented in Fig. 10 and compared with previous elastodynamicsimulations for surface-induced melting. Melting starts quasi-homogeneously within the entire sample, while melting in the rightside is slightly more advanced because of the higher temperature.Since the tracking order parameter at the melting center is mean-
ingless for this case, �f ¼ 1
w
Ðfdx is calculated in order to compare
melting time with surface-induced melting. tm is defined as the timeto reach �f = 0.1. In elastostatic formulation, melting near the rightsurface progresses and completes significantly faster than near theleft surface. For elastodynamic formulation, the standing pe wave inFig. 9(b) has a maximum in the central region of the sample. Sincethe temperature of the sample is above the solid instability tempera-ture, 1.2Teq, pressure oscillation promotes melting by lowering the
equilibrium melting temperature and solid instability temperaturein its tensile peak without essential suppressing melting in itscompression stage. Distribution of the order parameter is lessheterogeneous than in elastostatic formulation. While bulk meltingstarts later and at a higher temperature than the surface-inducedmelting, it completes faster. Thus, tm for bulk melting is 22.7 ps(6.3 fs standard deviation) and 21.9 ps (176.5 fs standard deviation)for elastostatic and elastodynamic formulation, respectively. Here,the melting time, tm, is calculated as an average over 10 simulationcases due to the stochastic nature of random fluctuation. It issignificantly closer to experimentally measured time, 20 ps, than25.7 ps for surface-induced melting (Table 2). Melting time for bulkmelting is independent of the sample thickness in a range, whenbulk melting is possible. More precise study in which thermalfluctuations are included that satisfy the fluctuation–dissipationtheorem32,33 will be pursued in the future.
5 ConclusionsMain results
An advanced thermodynamically consistent model for kineticsuperheating and melting of an Al nanolayer irradiated by a
Fig. 9 Evolution of (a) s11, (b) pe distributions before melting starts, and(c) comparison of evolution of elastic mean stress pe distribution forsimulation in elastostatic (solid line) and elastodynamic (dashed line)formulations for Q = 84.15 K ps�1.
Fig. 10 Time evolution of distribution of (a) the order parameter Z and (b) the1
w
Ðfdx for the fluence 13 mJ cm�2. In figure (a), solid and dashed lines
represent bulk melting in elastodynamic and elastostatic formulations anddash-dot line is elastodynamic simulation of the surface-induced melting. Therepresentative case out of 10 computations for bulk melting is presented.
PCCP Paper
Phys. Chem. Chem. Phys. This journal is© the Owner Societies 2015
picosecond laser is formulated. It includes the coupled system ofphase field equations for melting, the two-temperature modelfor electron and lattice heat conduction, and the equations ofelastodynamics that allow for interface stresses. The Ginzburg–Landau equation for melting is fully coupled with elastodynamicand lattice thermal conduction. The lattice heat conductionequation includes electron–phonon coupling, heat of fusion,thermoelastic effects, and the dissipation rate due to melting.Reduction in surface energy during the melting is included inthe boundary conditions for the order parameter. This system ofequations was solved using finite element method and codeCOMSOL Multiphysics. Such a sophisticated physical formula-tion allowed us both to describe some nontrivial experimentalresults and reveal new phenomena. Two main regimes wereconsidered. In the first one, barrierless nucleation of surfacepremelting and melting occurs followed by the propagation oftwo solid–melt interfaces toward each other and their collision.For the slow heating rate Q = 0.015 K ps�1 melting occurs at theequilibrium melting temperature under uniaxial strain condi-tions Te
eq = 898.1 K (i.e., below Teq = 933.67 K) and correspondingbiaxial stress, which relax during melting. For a high heating rateQ = 0.99–84 K ps�1, significant overheating above Teq is observedbefore complete melting. Surprisingly, an increase in the heatingrate leads to a temperature reduction at the moving interfacesdue to fast heat of fusion absorption. A significant, rapidtemperature drop (even below melting temperature) at the veryend of melting is revealed, which is caused by the collision of twointerfaces and accelerated melting. For Q = 25–84 K ps�1,standing elastic stress waves are observed in the solid with nodalpoints at the moving solid–melt interfaces, which however, donot have a profound effect on melting time and temperatures.Simulation results are in good correspondence with knownexperiments14 in terms of time for complete melting, excludingthe highest heating rate Q = 84 K ps�1. For the second regimeand the highest heating rate of 84 K ps�1, the surface meltingwas suppressed but bulk thermal fluctuations have beenmimicked in a simple way. In this case, barrierless bulk meltingoccurs in the entire sample. Elastodynamic effects are moreimportant than in the first regime and much better correspon-dence with experimental melting time is obtained.
Future directions
The same approach can be applied to other metals by simplychanging material parameters. Similar approaches are applicableto study various phase transformations (martensitic, reconstructive,amorphization, etc.) in different materials (metals, ceramics, andnanocomposites) and nanostructures (single and multilayers,nanoparticles, nanowires, and core–shell structures) under highheating rates. In particular, instead of (or in addition to) theGinzburg–Landau equation for melting, one can utilize equationsfor martensitic transformations, twinning, dislocations, and theirinteraction.28,39–41 Also, surface melting (phase transformations)can be described more precisely if one explicitly introduces thefinite width of the external surface.42,43 This can also be done byconsidering nucleation of melt within an interface between twophases.44
Acknowledgements
Support from ONR (USA), Agency for Defense Development,Seyeon E&S corporation, and Gyeongsang National University(all South Korea) is gratefully acknowledged.
References
1 W. Nichols, G. Malyavanatham, D. Henneke, D. O’Brien,M. Becker and J. Keto, J. Nanopart. Res., 2002, 4, 423–432.
2 Z. Yan, Q. Zhao and D. B. Chrisey, Mater. Chem. Phys., 2011,130, 403–408.
3 P. Serra, M. Duocastella, J. Fernandez-Pradas and J. Morenza,Appl. Surf. Sci., 2009, 255, 5342–5345.
4 X. Chen, Y. Chen, J. Dai, M. Yan, D. Zhao, Q. Li and M. Qiu,Nanoscale, 2014, 6, 1756–1762.
5 P. Kazansky, M. Beresna, Y. Shimotsuma, K. Hirao andY. P. Svirko, LEOS Annual Meeting Conference Proceedings,2009, LEOS’09. IEEE, 2009, pp. 330–331.
6 V. I. Levitas, Philos. Trans. R. Soc., A, 2013, 371, 20120215.7 Q. Mei and K. Lu, Prog. Mater. Sci., 2007, 52, 1175–1262.8 J. Cheng, C. Liu, S. Shang, D. Liu, W. Perrie, G. Dearden and
K. Watkins, Opt. Laser Technol., 2013, 46, 88–102.9 B. Rethfeld, K. Sokolowski-Tinten, D. von der Linde and
S. I. Anisimov, Phys. Rev. B: Condens. Matter Mater. Phys.,2002, 65, 092103.
10 S. Luo and T. J. Ahrens, Appl. Phys. Lett., 2003, 82, 1836–1838.11 S. Luo, T. J. Ahrens, T. Çagin, A. Strachan, W. A. Goddard III
and D. C. Swift, Phys. Rev. B: Condens. Matter Mater. Phys.,2003, 68, 134206.
12 J. Wei, Z. Sun, F. Zhang, W. Xu, Y. Wang, F. Zhou andF. Gan, Chem. Phys. Lett., 2004, 392, 415–418.
13 B. J. Siwick, J. R. Dwyer, R. E. Jordan and R. J. Dwayne Miller,Science, 2003, 302, 1382–1385.
14 S. Williamson, G. Mourou and J. C. M. Li, Phys. Rev. Lett.,1984, 52, 2364–2367.
15 Y. S. Hwang and V. I. Levitas, Appl. Phys. Lett., 2013, 103, 263107.16 M. V. Shugaev and N. M. Bulgakova, Appl. Phys. A: Mater. Sci.
Process., 2010, 101, 103–109.17 A. Amini, C. Cheng, M. Naebe, J. S. Church, N. Hameed,
A. Asgari and F. Will, Nanoscale, 2013, 5, 6479–6484.18 Y. Meshcheryakov, M. Shugaev, T. Mattle, T. Lippert and
N. Bulgakova, Appl. Phys. A: Mater. Sci. Process., 2013, 113,521–529.
19 Y. Zhang and J. K. Chen, J. Appl. Phys., 2008, 104, 054910.20 K. Baheti, J. Huang, J. Chen and Y. Zhang, Int. J. Therm. Sci.,
2011, 50, 25–35.21 D. Sowdari and P. Majumdar, Opt. Laser Technol., 2010, 42,
855–865.22 H. J. Fecht and W. L. Johnson, Nature, 1988, 334, 50–51.23 Y. S. Hwang and V. I. Levitas, Appl. Phys. Lett., 2014, 104, 263106.24 V. I. Levitas and K. Samani, Phys. Rev. B: Condens. Matter
Mater. Phys., 2011, 84, 140103(R).25 V. I. Levitas and K. Samani, Nat. Commun., 2011, 2, 284.26 V. I. Levitas and M. Javanbakht, Phys. Rev. Lett., 2010,
105, 165701.
Paper PCCP
This journal is© the Owner Societies 2015 Phys. Chem. Chem. Phys.
27 V. I. Levitas, Acta Mater., 2013, 61, 4305–4319.28 V. I. Levitas, J. Mech. Phys. Solids, 2014, 70, 154–189.29 B. Rethfeld, A. Kaiser, M. Vicanek and G. Simon, Phys. Rev.
B: Condens. Matter Mater. Phys., 2002, 65, 214303.30 N. Provatas and K. Elder, Phase-Field Methods in Materials
Science and Engineering, Wiley-VCH, Weinheim, 1st edn,2010.
31 COMSOL Multiphysics Reference Manual, COMSOL, 2014.32 R. Kubo, Rep. Prog. Phys., 1966, 29, 255.33 A. Karma and W.-J. Rappel, Phys. Rev. E: Stat. Phys., Plasmas,
Fluids, Relat. Interdiscip. Top., 1999, 60, 3614–3625.34 J. E. Hatch, Aluminum: Properties and Physical Metallurgy,
American Society for Metals, 1984.35 Z. Lin, L. V. Zhigilei and V. Celli, Phys. Rev. B: Condens.
Matter Mater. Phys., 2008, 77, 075133.
36 A. N. Smith, J. L. Hostetler and P. M. Norris, Numer. HeatTransfer, Part A, 1999, 35, 859–873.
37 P. J. Antaki, Int. J. Heat Mass Transfer, 2002, 45, 4063–4067.38 B. Giordanengo, N. Benazzi, J. Vinckel, J. G. Gasser and
L. Roubi, J. Non-Cryst. Solids, 1999, 250, 377–383.39 V. I. Levitas and D.-W. Lee, Phys. Rev. Lett., 2007, 99, 245701.40 V. I. Levitas and M. Javanbakht, J. Mech. Phys. Solids, 2015,
82, 287–319.41 V. I. Levitas and M. Javanbakht, Nanoscale, 2014, 6, 162–166.42 V. I. Levitas and M. Javanbakht, Phys. Rev. Lett., 2011,
107, 175701.43 V. I. Levitas and K. Samani, Phys. Rev. B: Condens. Matter
Mater. Phys., 2014, 89, 075427.44 K. Momeni, V. I. Levitas and J. A. Warren, Nano Lett., 2015,
15, 2298–2303.
PCCP Paper