Embed Size (px)
Citation preview
Course Description
Integrated Math I
13
Integrated Math I
Course Rationale: Integrated Math I is designed as an enhancement course for topics in secondary mathematics education. Topics introduced in Integrated Math provide the foundation students require for future success in high school mathematics, critical thinking, and problem solving. The primary goal in Integrated Math is to help students develop more concrete mathematical knowledge and apply this knowledge to applications represented in Missouri EOC assessment tests. The Integrated Math curriculum samples from the diverse topics often found on the EOC, and places a special emphasis on developing a plan to understand and solve these types of problems. In addition, the curriculum of Integrated Math will mimic and reinforce many of the topics students will see in their Algebra I and Geometry studies at the secondary level. Course Description: Integrated Math I topics include recognizing and developing patterns using tables, graphs and equations. Mathematical modeling is stressed as a methodology for approaching the solution to problems. Students will explore operations on algebraic expressions, and apply mathematical properties to algebraic equations. Students will problem solve using equations, graphs and tables and investigate linear relationships, including comparing and contrasting options and decision-making using algebraic models. Reinforcement of topics from two-dimensional Geometry is integrated into this curriculum. This includes applications from the areas of area and perimeter, the Pythagorean Theorem and its applications, as well as geometric proportion. Finally, introductory instruction in the area of mathematical probability is provided to reinforce use of fractions and numerical modeling. Technology will be used to introduce and expand upon the areas of study listed above.
14
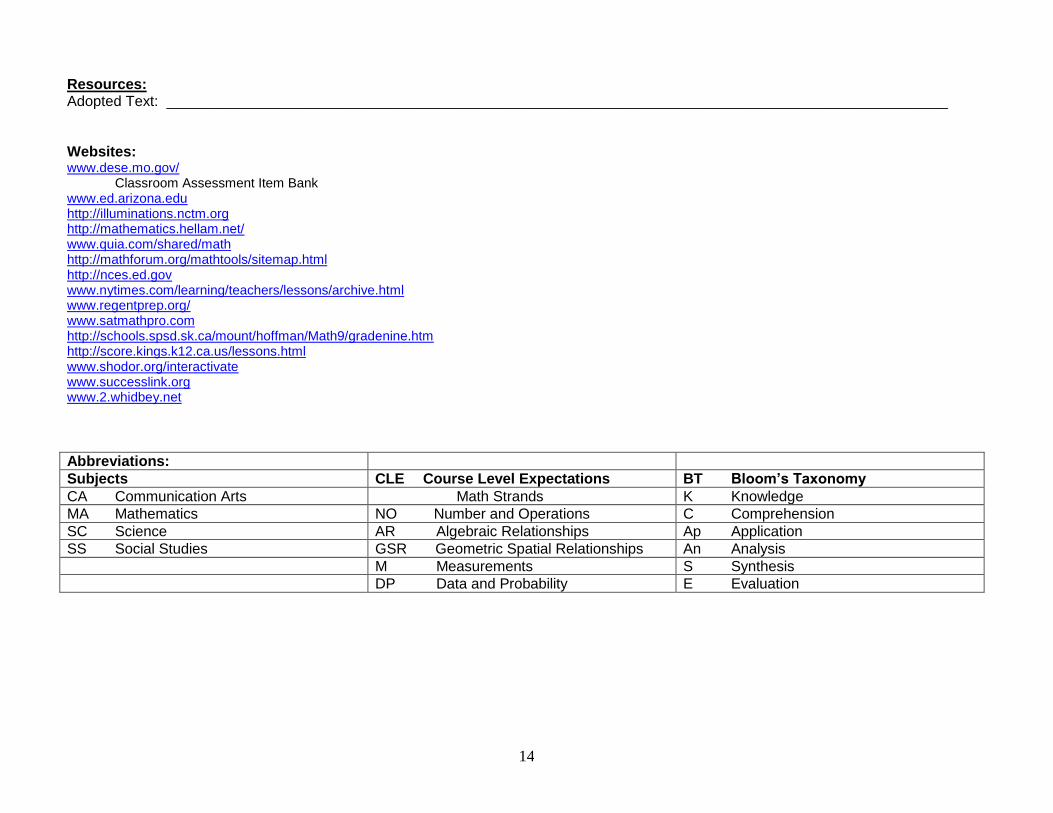
Resources: Adopted Text: ________________________________________________________________________________________________ Websites: www.dese.mo.gov/ Classroom Assessment Item Bank www.ed.arizona.edu http://illuminations.nctm.org http://mathematics.hellam.net/ www.quia.com/shared/math http://mathforum.org/mathtools/sitemap.html http://nces.ed.gov www.nytimes.com/learning/teachers/lessons/archive.html www.regentprep.org/ www.satmathpro.com http://schools.spsd.sk.ca/mount/hoffman/Math9/gradenine.htm http://score.kings.k12.ca.us/lessons.html www.shodor.org/interactivate www.successlink.org www.2.whidbey.net
Abbreviations:
Subjects CLE Course Level Expectations BT Bloom’s Taxonomy
CA Communication Arts Math Strands K Knowledge
MA Mathematics NO Number and Operations C Comprehension
SC Science AR Algebraic Relationships Ap Application
SS Social Studies GSR Geometric Spatial Relationships An Analysis
M Measurements S Synthesis
DP Data and Probability E Evaluation
15
Integrated Math I
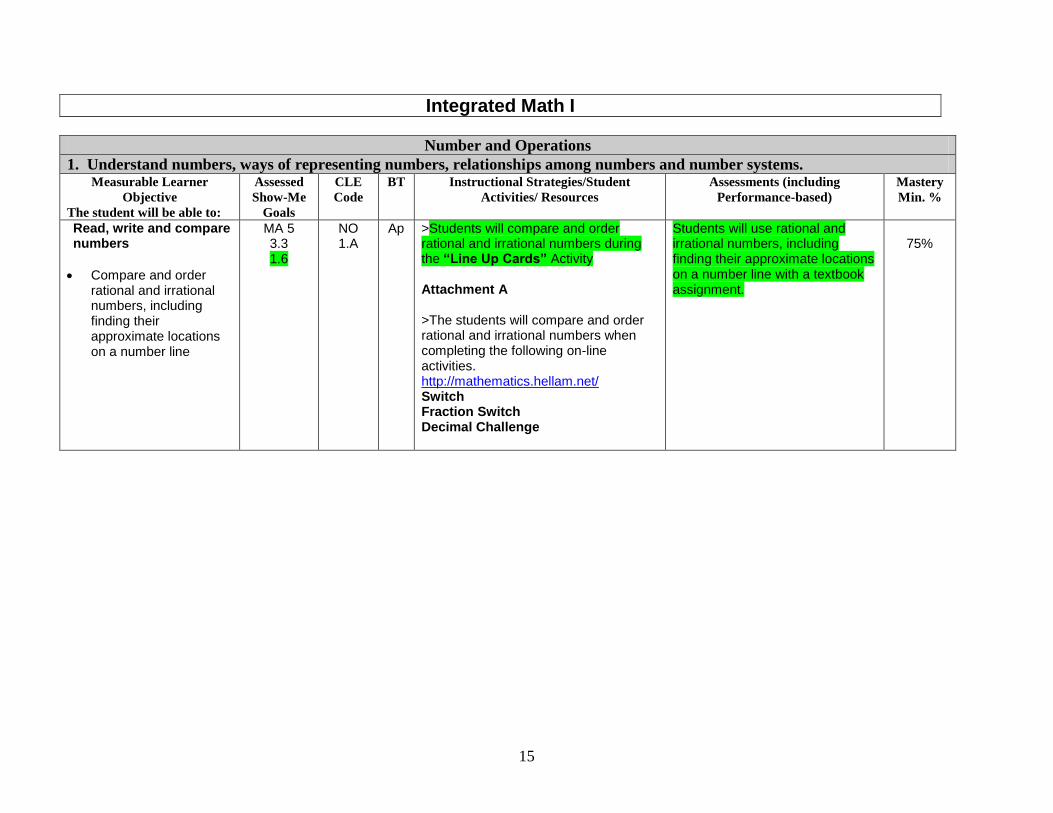
Number and Operations
1. Understand numbers, ways of representing numbers, relationships among numbers and number systems. Measurable Learner
Objective
The student will be able to:
Assessed
Show-Me
Goals
CLE
Code
BT Instructional Strategies/Student
Activities/ Resources
Assessments (including
Performance-based)
Mastery
Min. %
Read, write and compare numbers
Compare and order rational and irrational numbers, including finding their approximate locations on a number line
MA 5 3.3 1.6
NO 1.A
Ap >Students will compare and order rational and irrational numbers during the “Line Up Cards” Activity Attachment A >The students will compare and order rational and irrational numbers when completing the following on-line activities. http://mathematics.hellam.net/ Switch Fraction Switch Decimal Challenge
Students will use rational and irrational numbers, including finding their approximate locations on a number line with a textbook assignment.
75%
16
Number and Operations
2. Understand meanings of operations and how they relate to one another Measurable Learner
Objective
The student will be able to:
Assessed
Show-Me
Goals
CLE
Code
BT Instructional Strategies/Student
Activities/ Resources
Assessments (including
Performance-based)
Mastery
Min. %
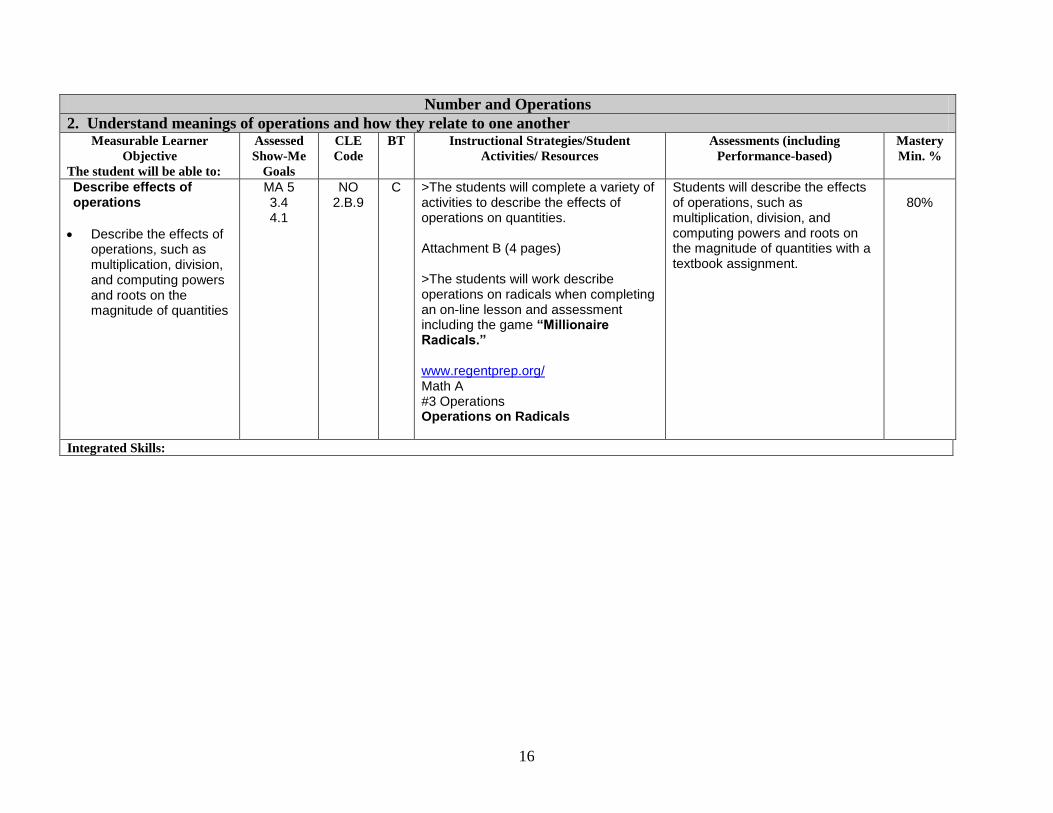
Describe effects of operations
Describe the effects of operations, such as multiplication, division, and computing powers and roots on the magnitude of quantities
MA 5 3.4 4.1
NO 2.B.9
C >The students will complete a variety of activities to describe the effects of operations on quantities. Attachment B (4 pages) >The students will work describe operations on radicals when completing an on-line lesson and assessment including the game “Millionaire Radicals.” www.regentprep.org/ Math A #3 Operations Operations on Radicals
Students will describe the effects of operations, such as multiplication, division, and computing powers and roots on the magnitude of quantities with a textbook assignment.
80%
Integrated Skills:
17
Number and Operations
2. Understand meanings of operations and how they relate to one another Measurable Learner
Objective
The student will be able to:
Assessed
Show-Me
Goals
CLE
Code
BT Instructional Strategies/Student
Activities/ Resources
Assessments (including
Performance-based)
Mastery
Min. %
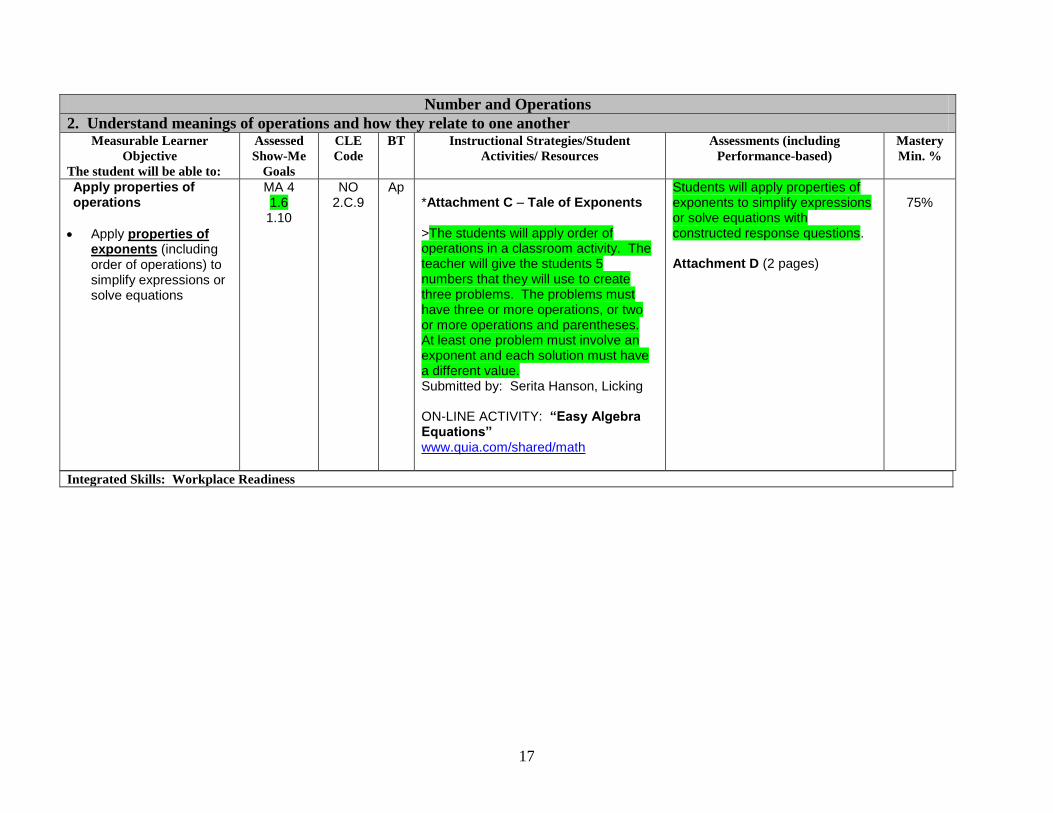
Apply properties of operations
Apply properties of exponents (including order of operations) to simplify expressions or solve equations
MA 4 1.6 1.10
NO 2.C.9
Ap *Attachment C – Tale of Exponents >The students will apply order of operations in a classroom activity. The teacher will give the students 5 numbers that they will use to create three problems. The problems must have three or more operations, or two or more operations and parentheses. At least one problem must involve an exponent and each solution must have a different value. Submitted by: Serita Hanson, Licking ON-LINE ACTIVITY: “Easy Algebra Equations” www.quia.com/shared/math
Students will apply properties of exponents to simplify expressions or solve equations with constructed response questions. Attachment D (2 pages)
75%
Integrated Skills: Workplace Readiness
18
Number and Operations
2. Understand meanings of operations and how they relate to one another Measurable Learner
Objective
The student will be able to:
Assessed
Show-Me
Goals
CLE
Code
BT Instructional Strategies/Student
Activities/ Resources
Assessments (including
Performance-based)
Mastery
Min. %
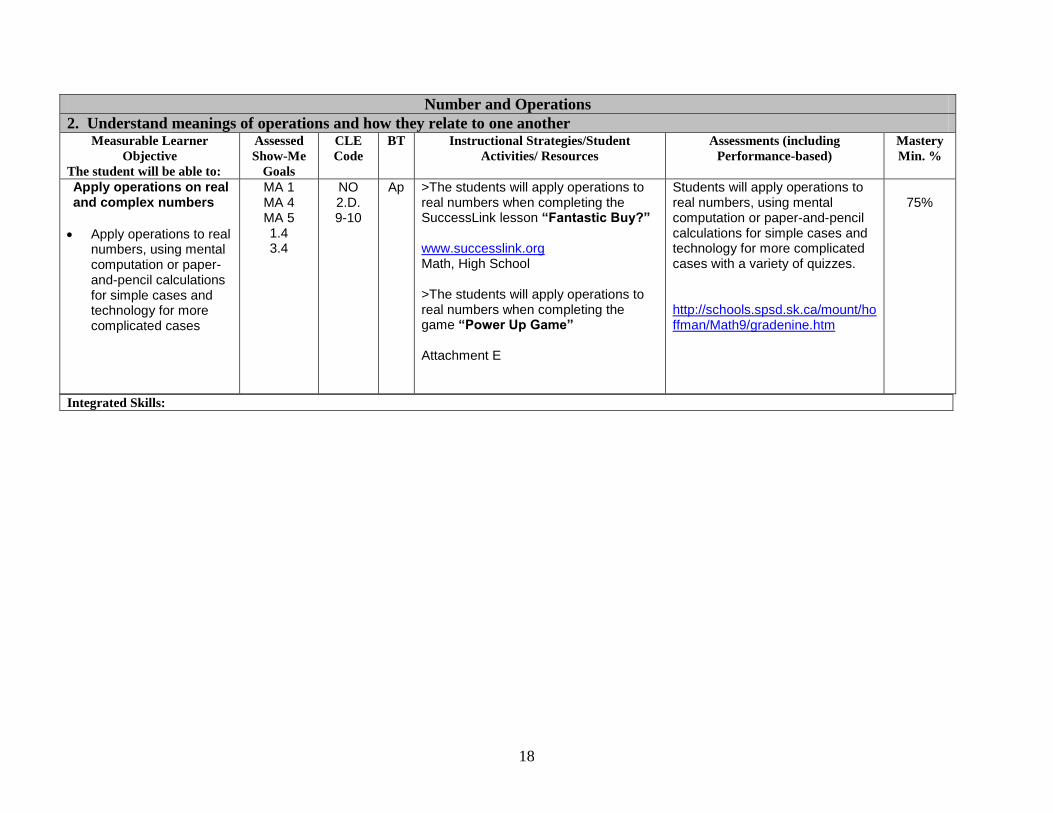
Apply operations on real and complex numbers
Apply operations to real numbers, using mental computation or paper-and-pencil calculations for simple cases and technology for more complicated cases
MA 1 MA 4 MA 5 1.4 3.4
NO 2.D. 9-10
Ap >The students will apply operations to real numbers when completing the SuccessLink lesson “Fantastic Buy?” www.successlink.org Math, High School >The students will apply operations to real numbers when completing the game “Power Up Game” Attachment E
Students will apply operations to real numbers, using mental computation or paper-and-pencil calculations for simple cases and technology for more complicated cases with a variety of quizzes. http://schools.spsd.sk.ca/mount/hoffman/Math9/gradenine.htm
75%
Integrated Skills:
19
Number and Operations
3. Compute fluently and make reasonable estimates. Measurable Learner
Objective
The student will be able to:
Assessed
Show-Me
Goals
CLE
Code
BT Instructional Strategies/Student
Activities/ Resources
Assessments (including
Performance-based)
Mastery
Min. %
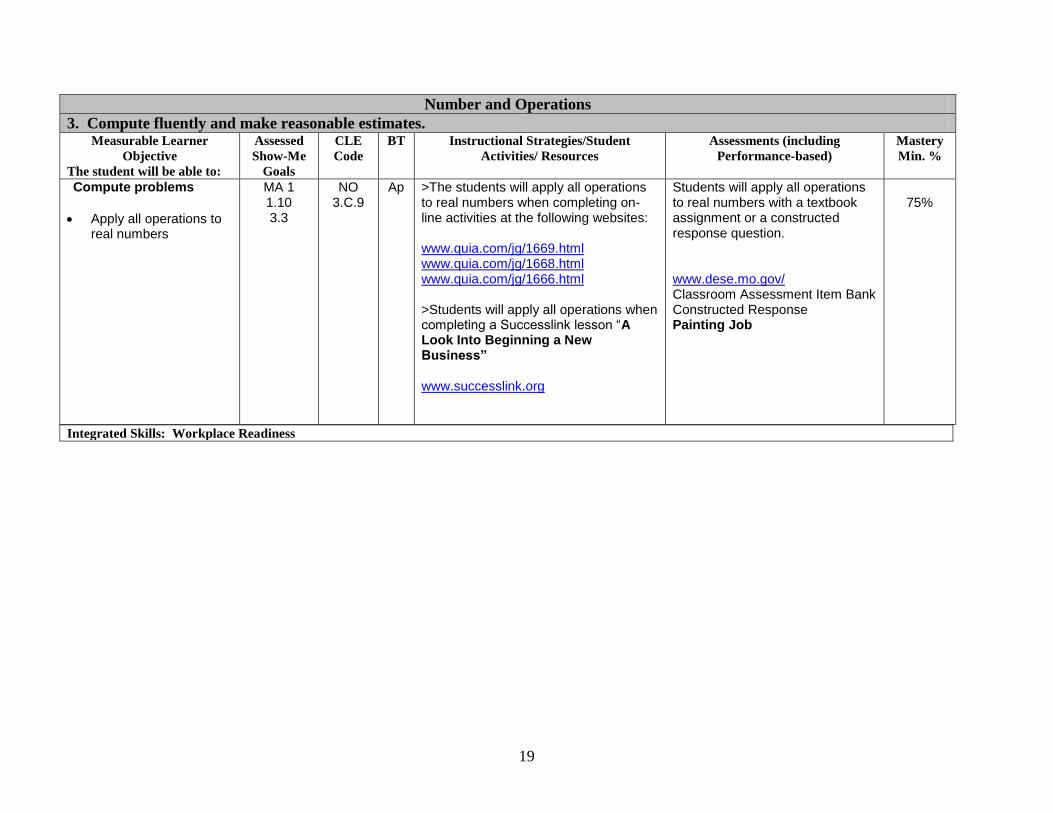
Compute problems
Apply all operations to real numbers
MA 1 1.10 3.3
NO 3.C.9
Ap >The students will apply all operations to real numbers when completing on-line activities at the following websites: www.quia.com/jg/1669.html www.quia.com/jg/1668.html www.quia.com/jg/1666.html >Students will apply all operations when completing a Successlink lesson “A Look Into Beginning a New Business” www.successlink.org
Students will apply all operations to real numbers with a textbook assignment or a constructed response question. www.dese.mo.gov/ Classroom Assessment Item Bank Constructed Response Painting Job
75%
Integrated Skills: Workplace Readiness
20
Number and Operations
3. Compute fluently and make reasonable estimates. Measurable Learner
Objective
The student will be able to:
Assessed
Show-Me
Goals
CLE
Code
BT Instructional Strategies/Student
Activities/ Resources
Assessments (including
Performance-based)
Mastery
Min. %
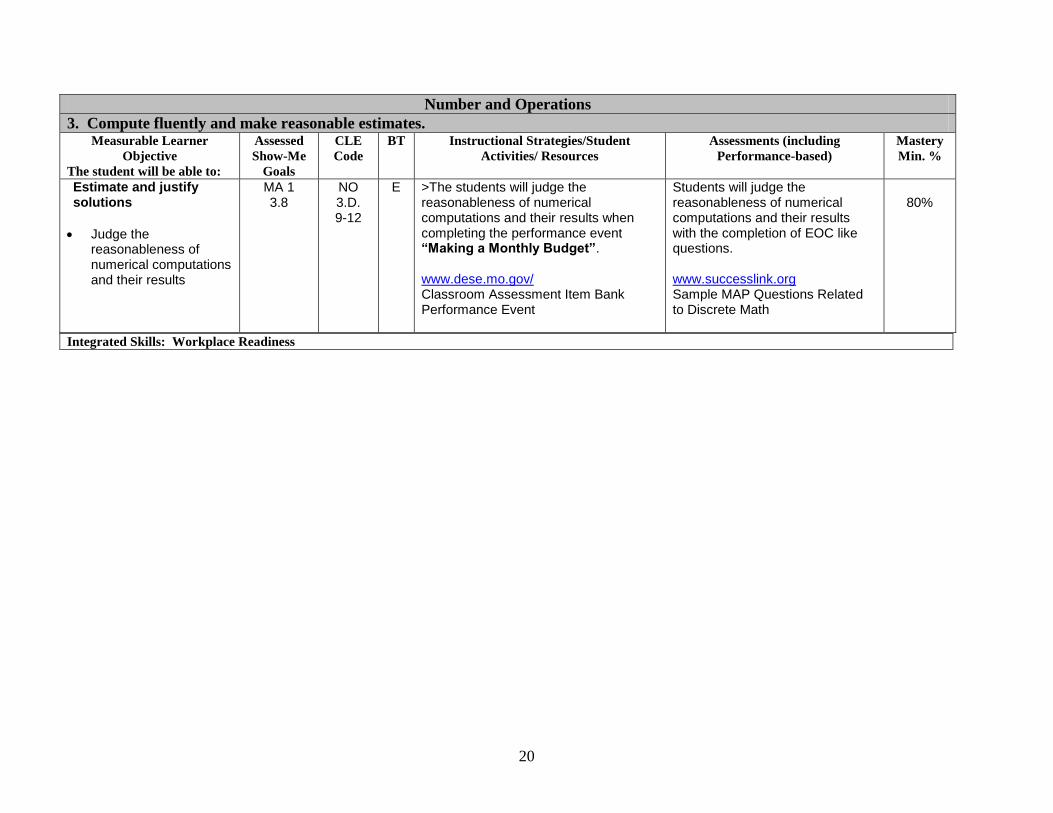
Estimate and justify solutions
Judge the reasonableness of numerical computations and their results
MA 1 3.8
NO 3.D. 9-12
E >The students will judge the reasonableness of numerical computations and their results when completing the performance event “Making a Monthly Budget”. www.dese.mo.gov/ Classroom Assessment Item Bank Performance Event
Students will judge the reasonableness of numerical computations and their results with the completion of EOC like questions. www.successlink.org Sample MAP Questions Related to Discrete Math
80%
Integrated Skills: Workplace Readiness
21
Number and Operations
3. Compute fluently and make reasonable estimates. Measurable Learner
Objective
The student will be able to:
Assessed
Show-Me
Goals
CLE
Code
BT Instructional Strategies/Student
Activities/ Resources
Assessments (including
Performance-based)
Mastery
Min. %
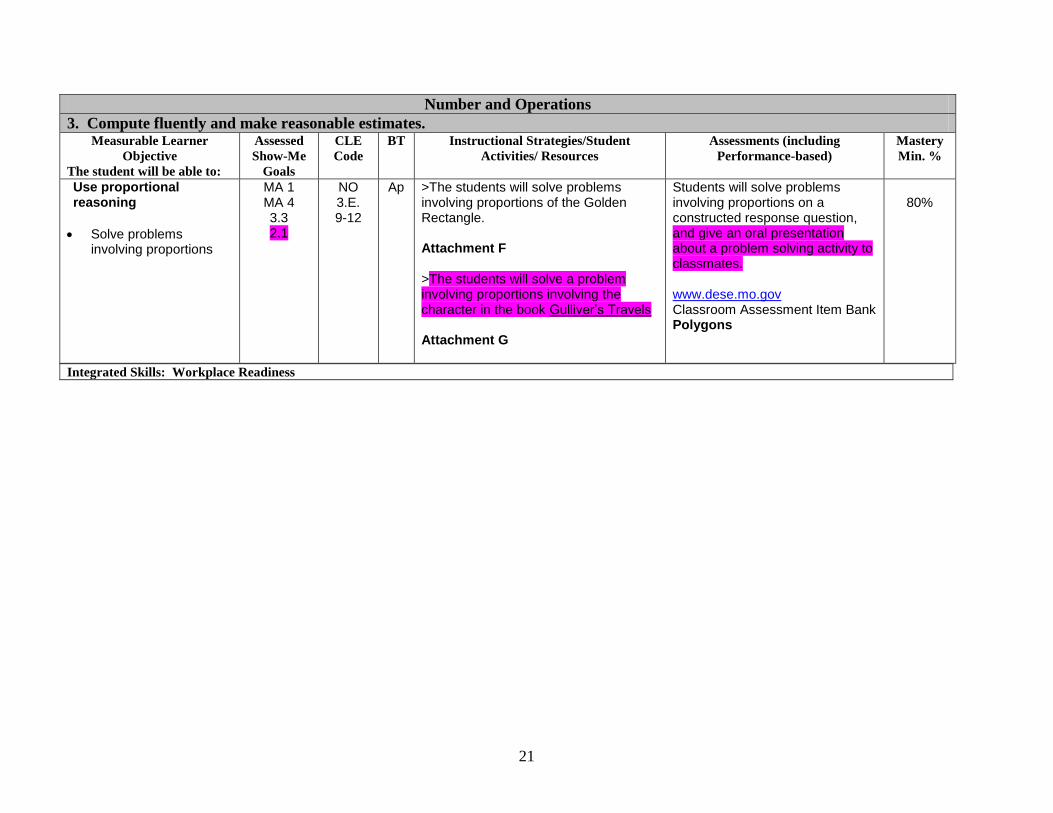
Use proportional reasoning
Solve problems involving proportions
MA 1 MA 4 3.3 2.1
NO 3.E. 9-12
Ap >The students will solve problems involving proportions of the Golden Rectangle. Attachment F >The students will solve a problem involving proportions involving the character in the book Gulliver’s Travels Attachment G
Students will solve problems involving proportions on a constructed response question, and give an oral presentation about a problem solving activity to classmates. www.dese.mo.gov Classroom Assessment Item Bank Polygons
80%
Integrated Skills: Workplace Readiness
22
Algebraic Relationships
1. Understand patterns, relations and functions Measurable Learner
Objective
The student will be able to:
Assessed
Show-Me
Goals
CLE
Code
BT Instructional Strategies/Student
Activities/ Resources
Assessments (including
Performance-based)
Mastery
Min. %
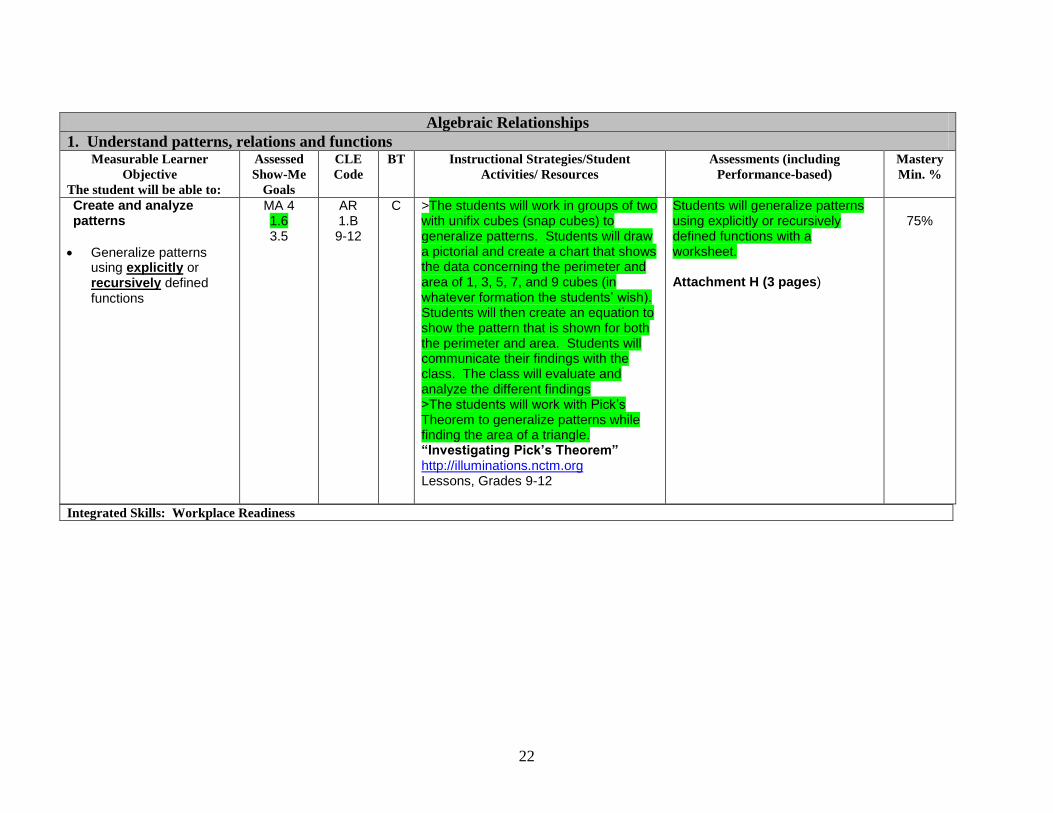
Create and analyze patterns
Generalize patterns using explicitly or recursively defined functions
MA 4 1.6 3.5
AR 1.B 9-12
C >The students will work in groups of two with unifix cubes (snap cubes) to generalize patterns. Students will draw a pictorial and create a chart that shows the data concerning the perimeter and area of 1, 3, 5, 7, and 9 cubes (in whatever formation the students’ wish). Students will then create an equation to show the pattern that is shown for both the perimeter and area. Students will communicate their findings with the class. The class will evaluate and analyze the different findings >The students will work with Pick’s Theorem to generalize patterns while finding the area of a triangle. “Investigating Pick’s Theorem” http://illuminations.nctm.org Lessons, Grades 9-12
Students will generalize patterns using explicitly or recursively defined functions with a worksheet. Attachment H (3 pages)
75%
Integrated Skills: Workplace Readiness
23
Algebraic Relationships
1. Understand patterns, relations and functions Measurable Learner
Objective
The student will be able to:
Assessed
Show-Me
Goals
CLE
Code
BT Instructional Strategies/Student
Activities/ Resources
Assessments (including
Performance-based)
Mastery
Min. %
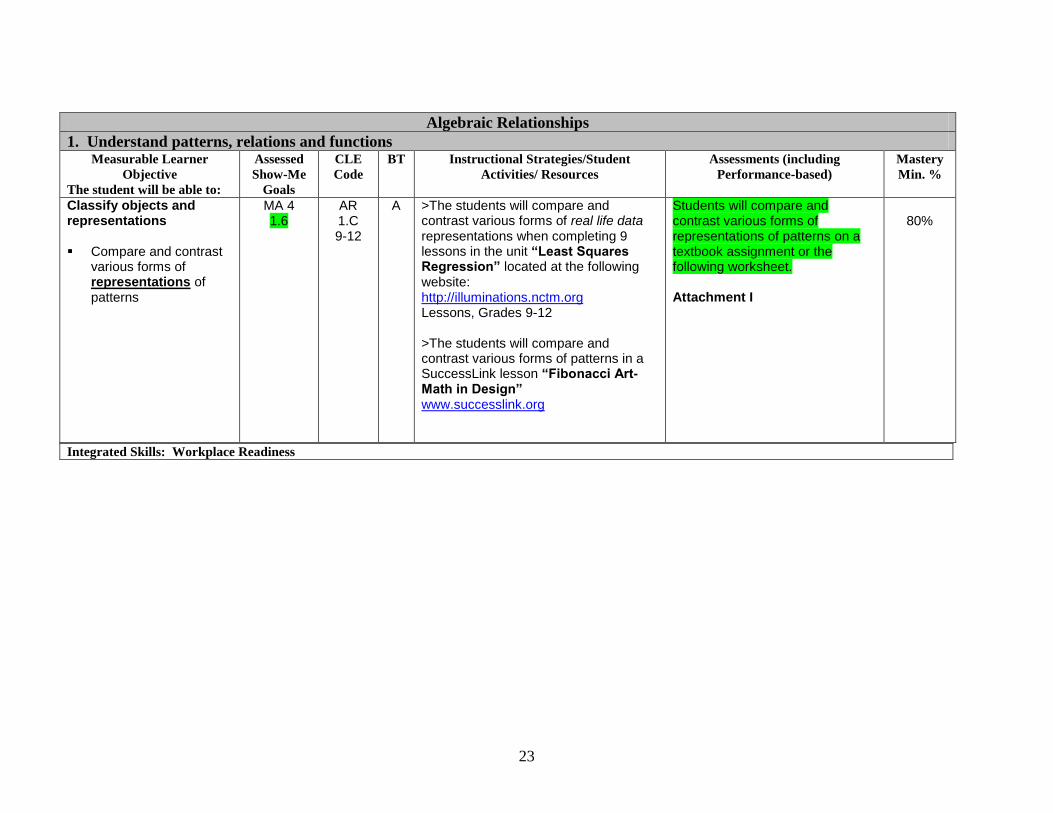
Classify objects and representations Compare and contrast
various forms of representations of patterns
MA 4 1.6
AR 1.C 9-12
A >The students will compare and contrast various forms of real life data representations when completing 9 lessons in the unit “Least Squares Regression” located at the following website: http://illuminations.nctm.org Lessons, Grades 9-12 >The students will compare and contrast various forms of patterns in a SuccessLink lesson “Fibonacci Art-Math in Design” www.successlink.org
Students will compare and contrast various forms of representations of patterns on a textbook assignment or the following worksheet. Attachment I
80%
Integrated Skills: Workplace Readiness
24
Algebraic Relationships
1. Understand patterns, relations and functions Measurable Learner
Objective
The student will be able to:
Assessed
Show-Me
Goals
CLE
Code
BT Instructional Strategies/Student
Activities/ Resources
Assessments (including
Performance-based)
Mastery
Min. %
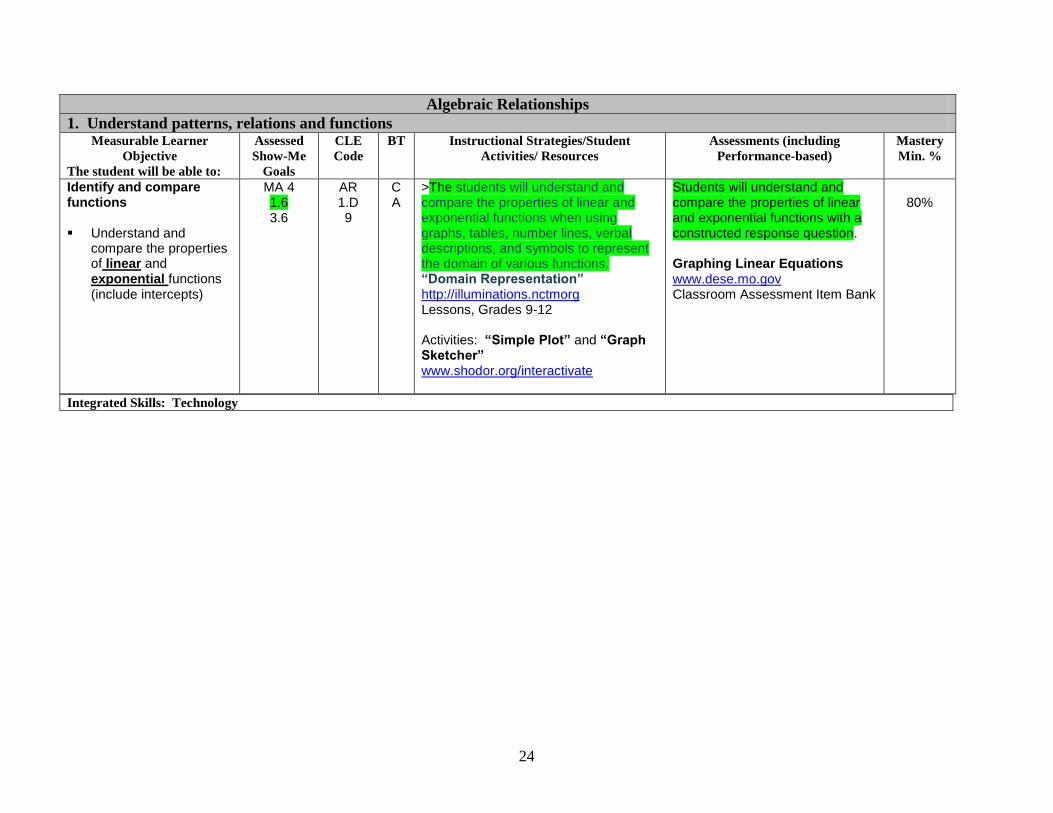
Identify and compare functions Understand and
compare the properties of linear and exponential functions (include intercepts)
MA 4 1.6 3.6
AR 1.D 9
C A
>The students will understand and compare the properties of linear and exponential functions when using graphs, tables, number lines, verbal descriptions, and symbols to represent the domain of various functions. “Domain Representation” http://illuminations.nctmorg Lessons, Grades 9-12 Activities: “Simple Plot” and “Graph Sketcher” www.shodor.org/interactivate
Students will understand and compare the properties of linear and exponential functions with a constructed response question. Graphing Linear Equations www.dese.mo.gov Classroom Assessment Item Bank
80%
Integrated Skills: Technology
25
Algebraic Relationships
1. Understand patterns, relations and functions Measurable Learner
Objective
The student will be able to:
Assessed
Show-Me
Goals
CLE
Code
BT Instructional Strategies/Student
Activities/ Resources
Assessments (including
Performance-based)
Mastery
Min. %
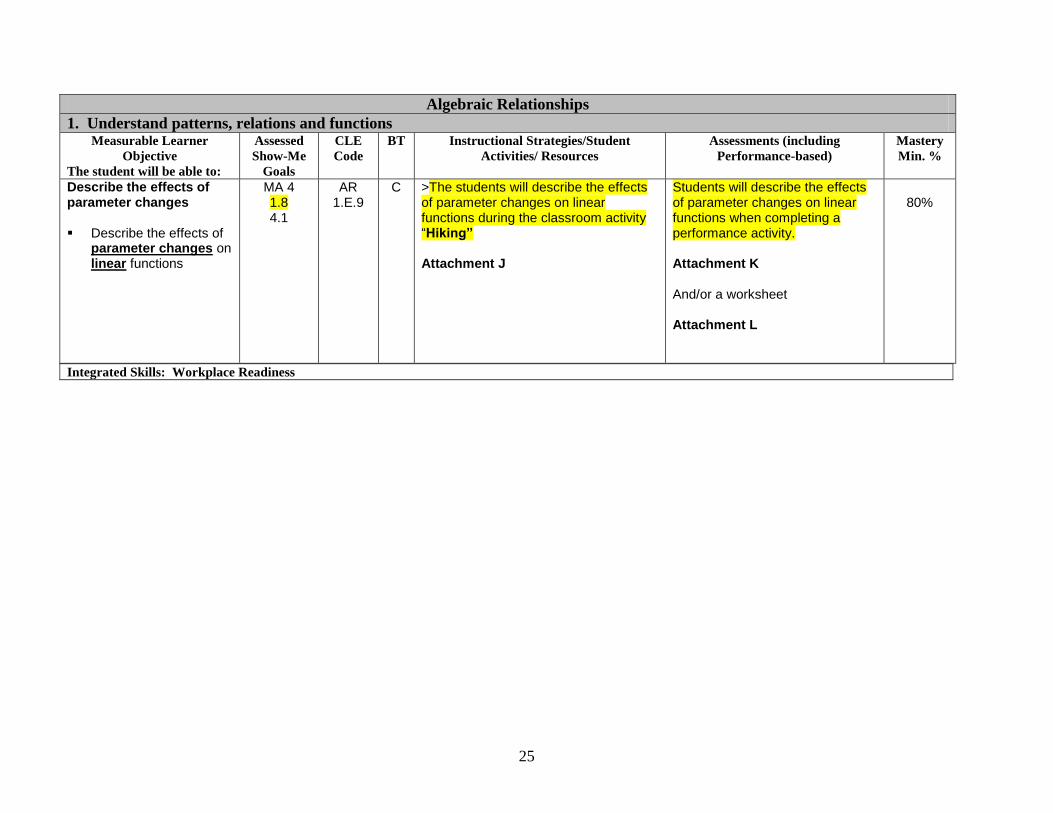
Describe the effects of parameter changes Describe the effects of
parameter changes on linear functions
MA 4 1.8 4.1
AR 1.E.9
C
>The students will describe the effects of parameter changes on linear functions during the classroom activity “Hiking” Attachment J
Students will describe the effects of parameter changes on linear functions when completing a performance activity. Attachment K And/or a worksheet Attachment L
80%
Integrated Skills: Workplace Readiness
26
Algebraic Relationships
2. Represent and analyze mathematical situations and structures using algebraic symbols. Measurable Learner
Objective
The student will be able to:
Assessed
Show-Me
Goals
CLE
Code
BT Instructional Strategies/Student Activities/
Resources
Assessments (including
Performance-based)
Mastery
Min. %
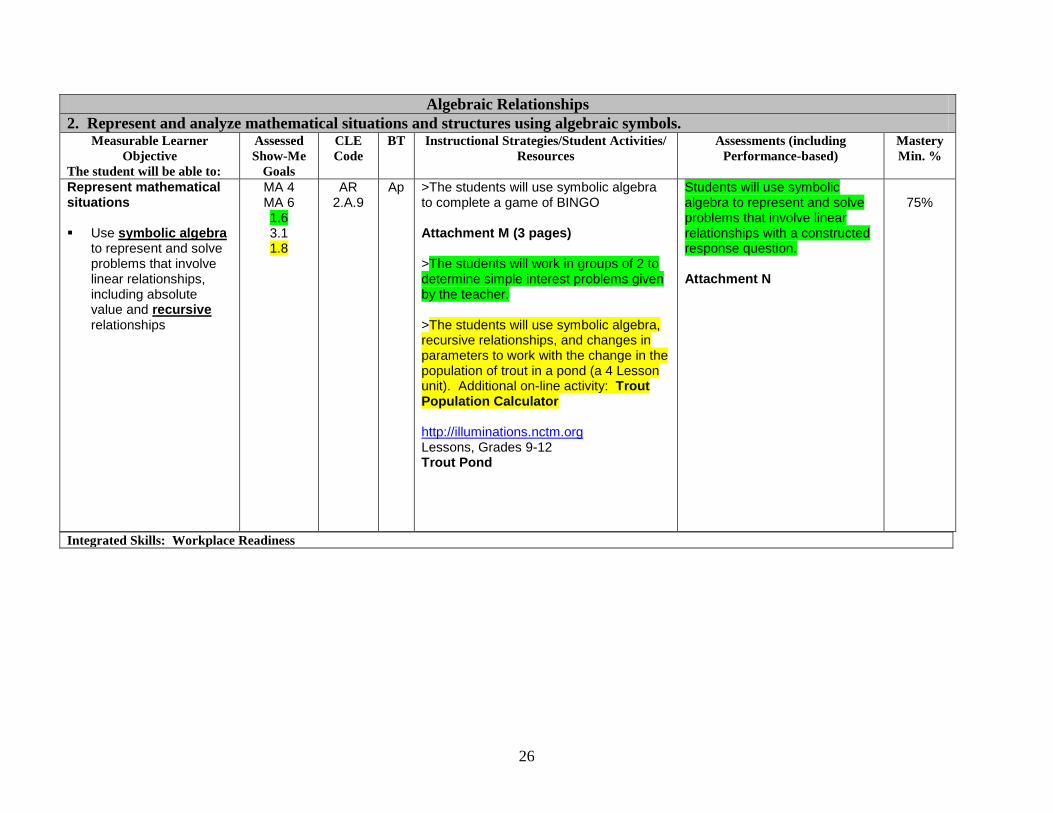
Represent mathematical situations Use symbolic algebra
to represent and solve problems that involve linear relationships, including absolute value and recursive relationships
MA 4 MA 6 1.6 3.1 1.8
AR 2.A.9
Ap
>The students will use symbolic algebra to complete a game of BINGO Attachment M (3 pages) >The students will work in groups of 2 to determine simple interest problems given by the teacher. >The students will use symbolic algebra, recursive relationships, and changes in parameters to work with the change in the population of trout in a pond (a 4 Lesson unit). Additional on-line activity: Trout Population Calculator http://illuminations.nctm.org Lessons, Grades 9-12 Trout Pond
Students will use symbolic algebra to represent and solve problems that involve linear relationships with a constructed response question. Attachment N
75%
Integrated Skills: Workplace Readiness
27
Algebraic Relationships
2. Represent and analyze mathematical situations and structures using algebraic symbols. Measurable Learner
Objective
The student will be able to:
Assessed
Show-Me
Goals
CLE
Code
BT Instructional Strategies/Student
Activities/ Resources
Assessments (including
Performance-based)
Mastery
Min. %
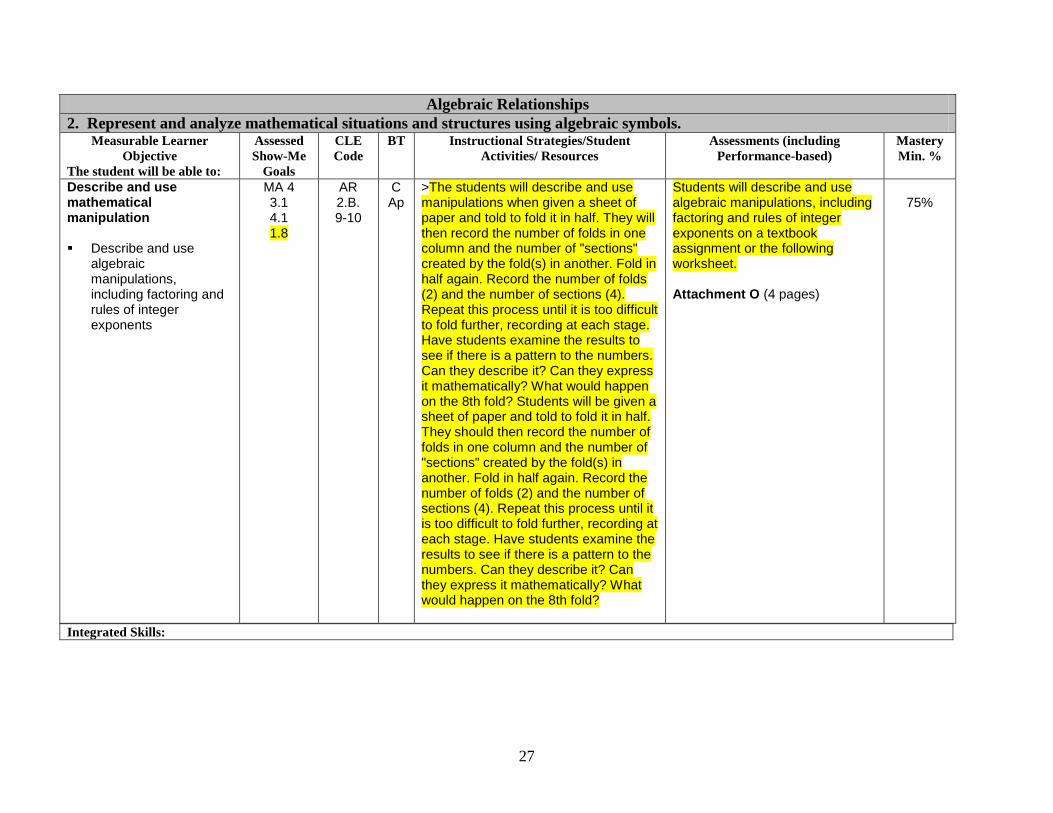
Describe and use mathematical manipulation Describe and use
algebraic manipulations, including factoring and rules of integer exponents
MA 4 3.1 4.1 1.8
AR 2.B. 9-10
C Ap
>The students will describe and use manipulations when given a sheet of paper and told to fold it in half. They will then record the number of folds in one column and the number of "sections" created by the fold(s) in another. Fold in half again. Record the number of folds (2) and the number of sections (4). Repeat this process until it is too difficult to fold further, recording at each stage. Have students examine the results to see if there is a pattern to the numbers. Can they describe it? Can they express it mathematically? What would happen on the 8th fold? Students will be given a sheet of paper and told to fold it in half. They should then record the number of folds in one column and the number of "sections" created by the fold(s) in another. Fold in half again. Record the number of folds (2) and the number of sections (4). Repeat this process until it is too difficult to fold further, recording at each stage. Have students examine the results to see if there is a pattern to the numbers. Can they describe it? Can they express it mathematically? What would happen on the 8th fold?
Students will describe and use algebraic manipulations, including factoring and rules of integer exponents on a textbook assignment or the following worksheet. Attachment O (4 pages)
75%
Integrated Skills:
28
Algebraic Relationships
2. Represent and analyze mathematical situations and structures using algebraic symbols. Measurable Learner
Objective
The student will be able to:
Assessed
Show-Me
Goals
CLE
Code
BT Instructional Strategies/Student
Activities/ Resources
Assessments (including
Performance-based)
Mastery
Min. %
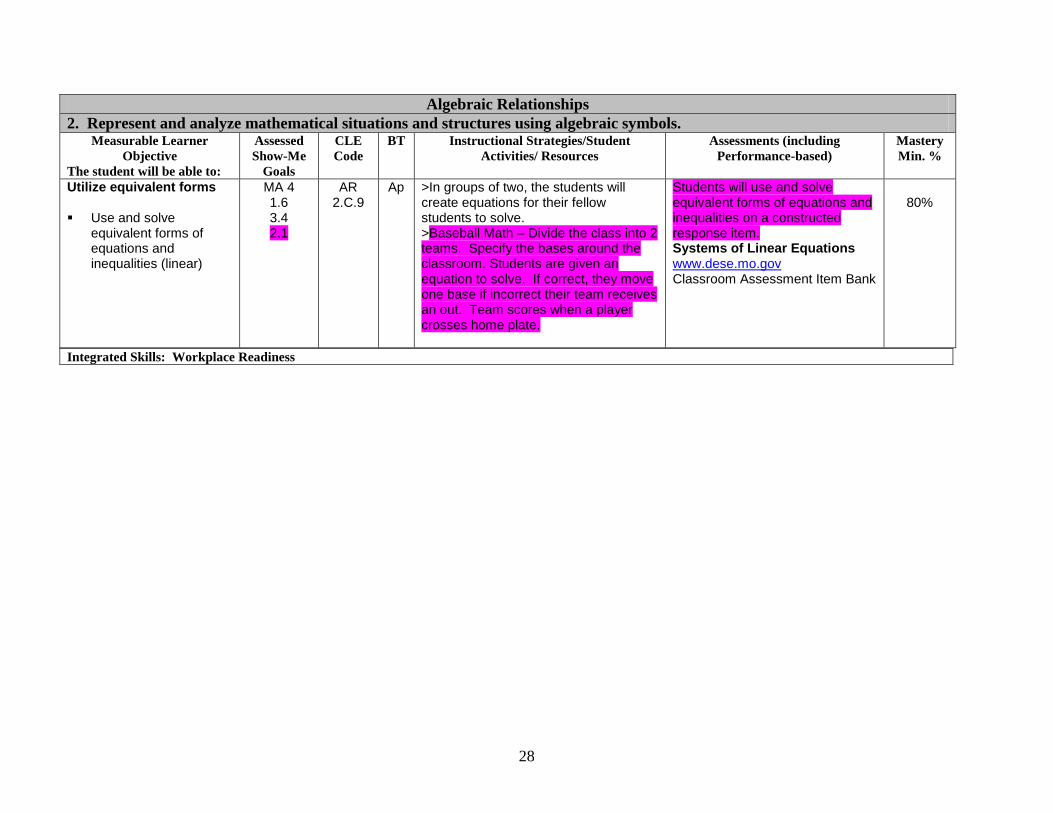
Utilize equivalent forms Use and solve
equivalent forms of equations and inequalities (linear)
MA 4 1.6 3.4 2.1
AR 2.C.9
Ap
>In groups of two, the students will create equations for their fellow students to solve. >Baseball Math – Divide the class into 2 teams. Specify the bases around the classroom. Students are given an equation to solve. If correct, they move one base if incorrect their team receives an out. Team scores when a player crosses home plate.
Students will use and solve equivalent forms of equations and inequalities on a constructed response item. Systems of Linear Equations www.dese.mo.gov Classroom Assessment Item Bank
80%
Integrated Skills: Workplace Readiness
29
Algebraic Relationships
2. Represent and analyze mathematical situations and structures using algebraic symbols. Measurable Learner
Objective
The student will be able to:
Assessed
Show-Me
Goals
CLE
Code
BT Instructional Strategies/Student
Activities/ Resources
Assessments (including
Performance-based)
Mastery
Min. %
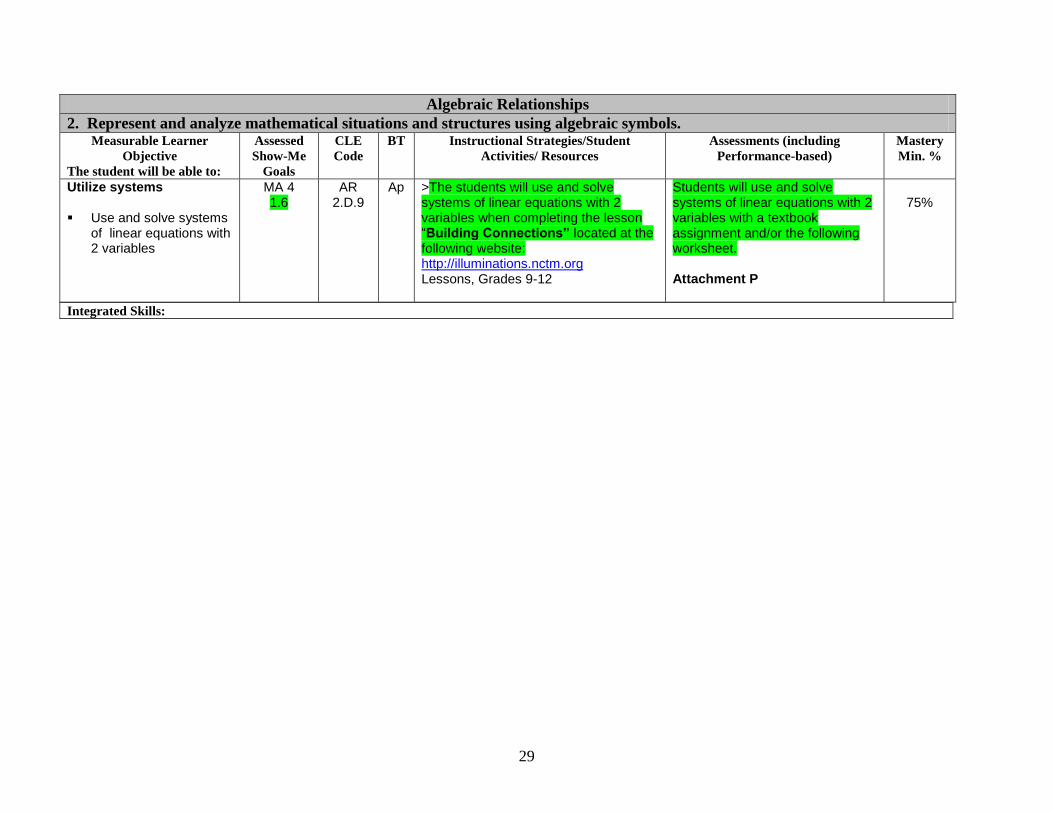
Utilize systems Use and solve systems
of linear equations with 2 variables
MA 4 1.6
AR 2.D.9
Ap
>The students will use and solve systems of linear equations with 2 variables when completing the lesson “Building Connections” located at the following website: http://illuminations.nctm.org Lessons, Grades 9-12
Students will use and solve systems of linear equations with 2 variables with a textbook assignment and/or the following worksheet. Attachment P
75%
Integrated Skills:
30
Algebraic Relationships
3. Use mathematical models to represent and understand quantitative relationships. Measurable Learner
Objective
The student will be able to:
Assessed
Show-Me
Goals
CLE
Code
BT Instructional Strategies/Student Activities/
Resources
Assessments (including
Performance-based)
Mastery
Min. %
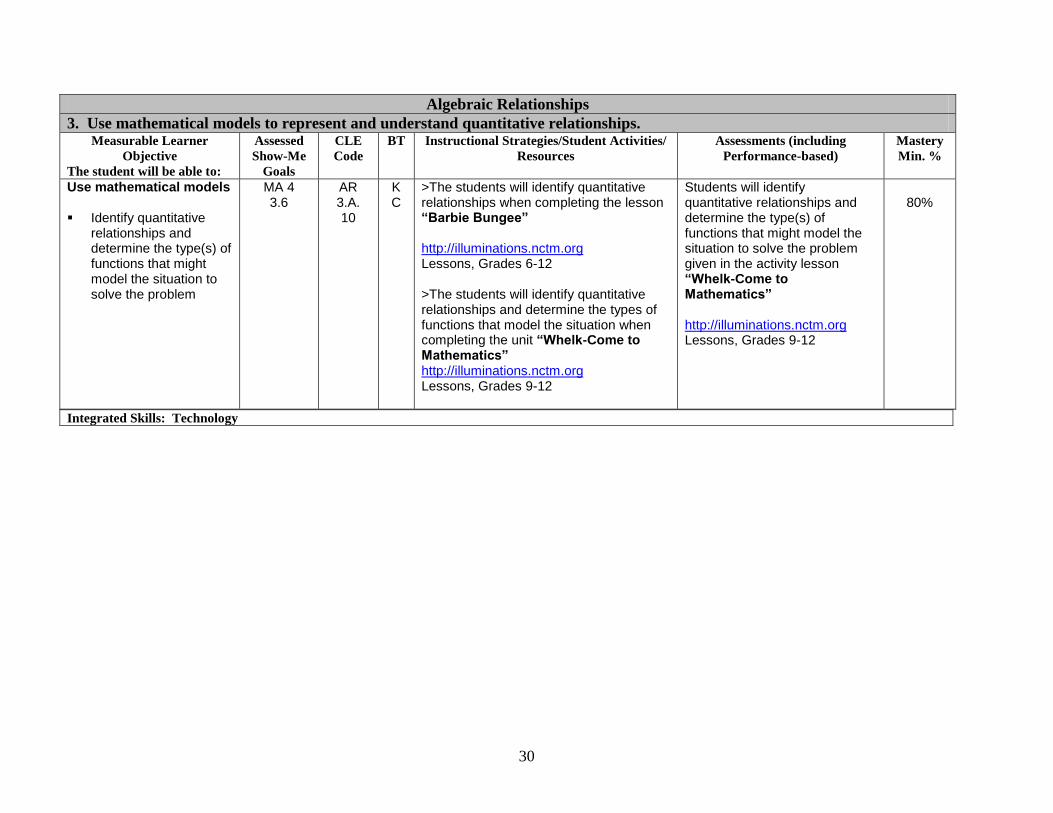
Use mathematical models Identify quantitative
relationships and determine the type(s) of functions that might model the situation to solve the problem
MA 4 3.6
AR 3.A. 10
K C
>The students will identify quantitative relationships when completing the lesson “Barbie Bungee” http://illuminations.nctm.org Lessons, Grades 6-12 >The students will identify quantitative relationships and determine the types of functions that model the situation when completing the unit “Whelk-Come to Mathematics” http://illuminations.nctm.org Lessons, Grades 9-12
Students will identify quantitative relationships and determine the type(s) of functions that might model the situation to solve the problem given in the activity lesson “Whelk-Come to Mathematics” http://illuminations.nctm.org Lessons, Grades 9-12
80%
Integrated Skills: Technology
31
Algebraic Relationships
4. Analyze change in various contexts. Measurable Learner
Objective
The student will be able to:
Assessed
Show-Me
Goals
CLE
Code
BT Instructional Strategies/Student
Activities/ Resources
Assessments (including
Performance-based)
Mastery
Min. %
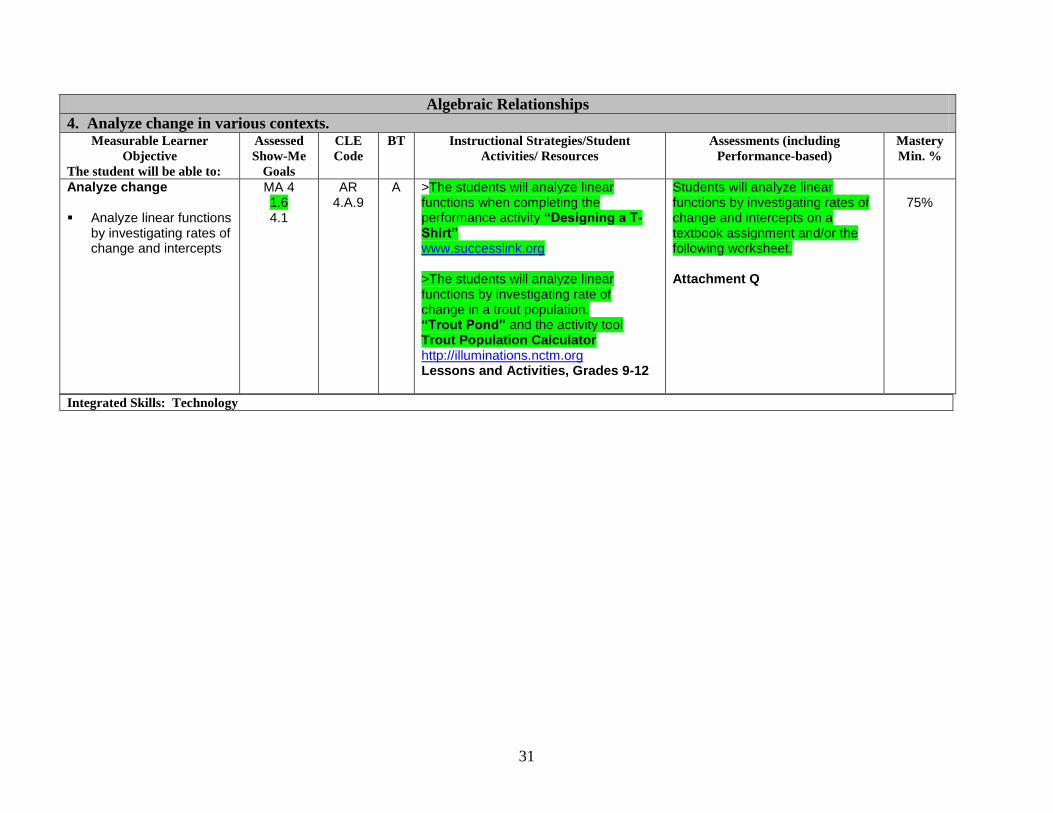
Analyze change Analyze linear functions
by investigating rates of change and intercepts
MA 4 1.6 4.1
AR 4.A.9
A
>The students will analyze linear functions when completing the performance activity “Designing a T-Shirt” www.successlink.org >The students will analyze linear functions by investigating rate of change in a trout population. “Trout Pond” and the activity tool Trout Population Calculator http://illuminations.nctm.org Lessons and Activities, Grades 9-12
Students will analyze linear functions by investigating rates of change and intercepts on a textbook assignment and/or the following worksheet. Attachment Q
75%
Integrated Skills: Technology
32
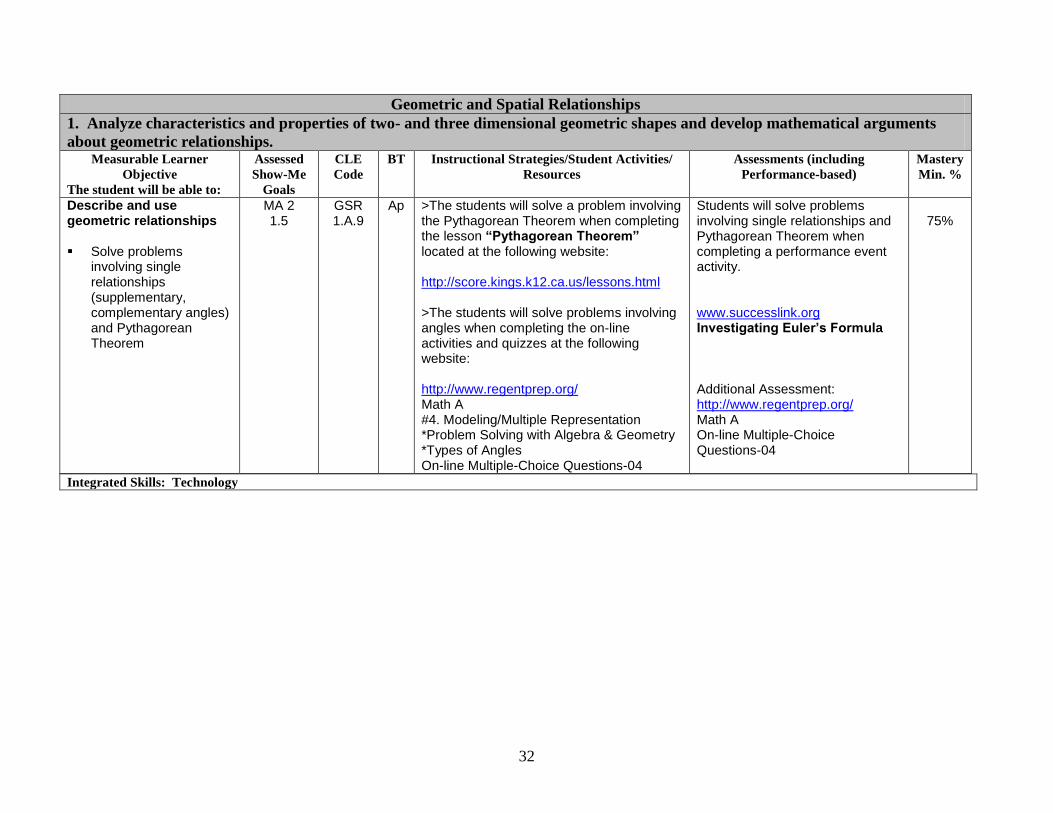
Geometric and Spatial Relationships
1. Analyze characteristics and properties of two- and three dimensional geometric shapes and develop mathematical arguments
about geometric relationships. Measurable Learner
Objective
The student will be able to:
Assessed
Show-Me
Goals
CLE
Code
BT Instructional Strategies/Student Activities/
Resources
Assessments (including
Performance-based)
Mastery
Min. %
Describe and use geometric relationships Solve problems
involving single relationships (supplementary, complementary angles) and Pythagorean Theorem
MA 2 1.5
GSR 1.A.9
Ap
>The students will solve a problem involving the Pythagorean Theorem when completing the lesson “Pythagorean Theorem” located at the following website: http://score.kings.k12.ca.us/lessons.html >The students will solve problems involving angles when completing the on-line activities and quizzes at the following website: http://www.regentprep.org/ Math A #4. Modeling/Multiple Representation *Problem Solving with Algebra & Geometry *Types of Angles On-line Multiple-Choice Questions-04
Students will solve problems involving single relationships and Pythagorean Theorem when completing a performance event activity. www.successlink.org Investigating Euler’s Formula Additional Assessment: http://www.regentprep.org/ Math A On-line Multiple-Choice Questions-04
75%
Integrated Skills: Technology
33
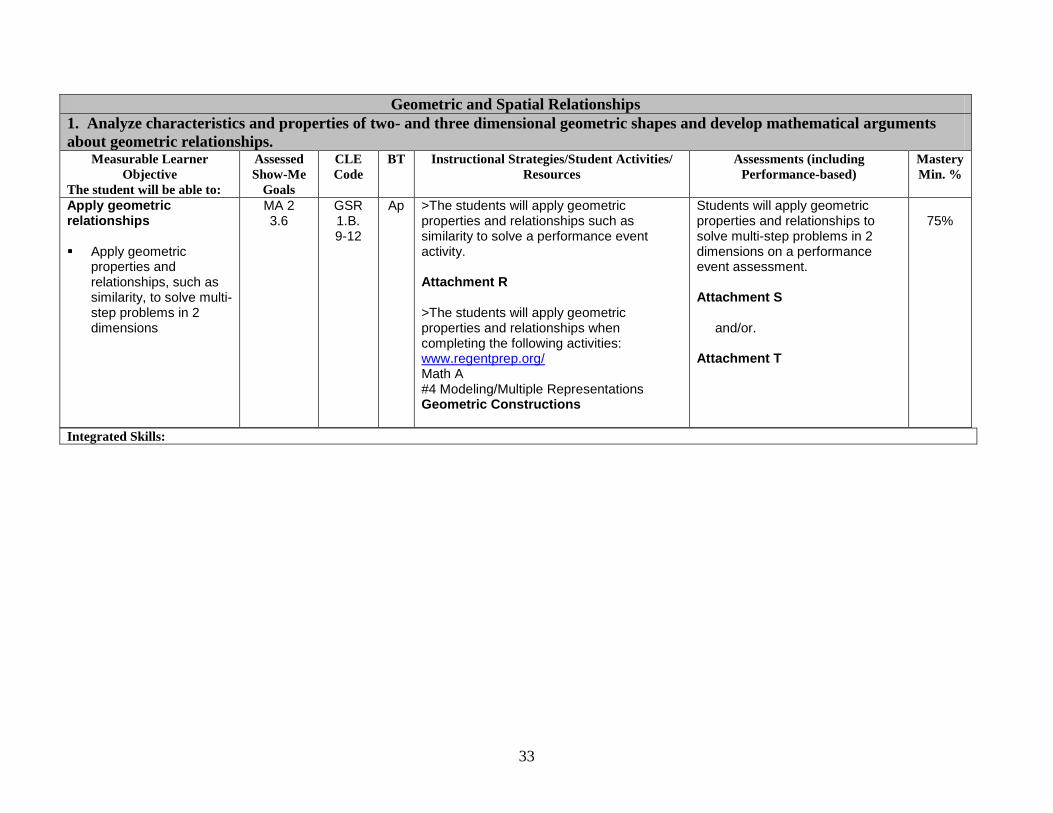
Geometric and Spatial Relationships
1. Analyze characteristics and properties of two- and three dimensional geometric shapes and develop mathematical arguments
about geometric relationships. Measurable Learner
Objective
The student will be able to:
Assessed
Show-Me
Goals
CLE
Code
BT Instructional Strategies/Student Activities/
Resources
Assessments (including
Performance-based)
Mastery
Min. %
Apply geometric relationships Apply geometric
properties and relationships, such as similarity, to solve multi-step problems in 2 dimensions
MA 2 3.6
GSR 1.B. 9-12
Ap
>The students will apply geometric properties and relationships such as similarity to solve a performance event activity. Attachment R >The students will apply geometric properties and relationships when completing the following activities: www.regentprep.org/ Math A #4 Modeling/Multiple Representations Geometric Constructions
Students will apply geometric properties and relationships to solve multi-step problems in 2 dimensions on a performance event assessment. Attachment S and/or. Attachment T
75%
Integrated Skills:
34
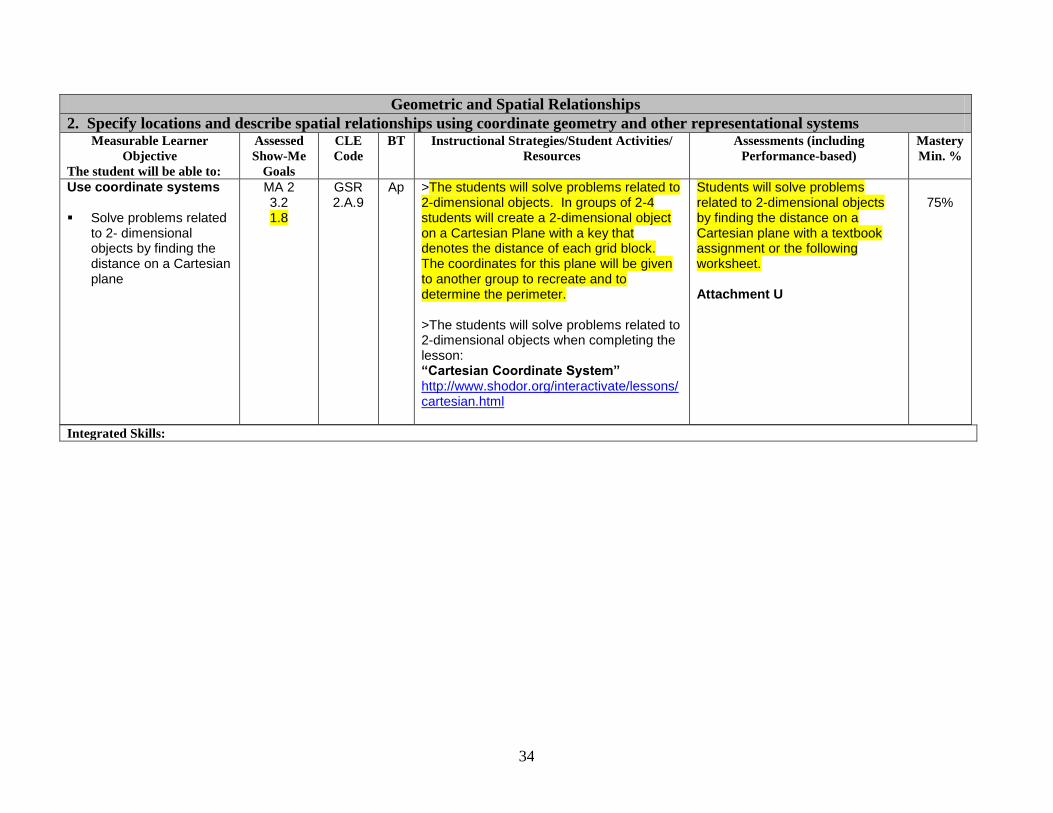
Geometric and Spatial Relationships
2. Specify locations and describe spatial relationships using coordinate geometry and other representational systems Measurable Learner
Objective
The student will be able to:
Assessed
Show-Me
Goals
CLE
Code
BT Instructional Strategies/Student Activities/
Resources
Assessments (including
Performance-based)
Mastery
Min. %
Use coordinate systems Solve problems related
to 2- dimensional objects by finding the distance on a Cartesian plane
MA 2 3.2 1.8
GSR 2.A.9
Ap
>The students will solve problems related to 2-dimensional objects. In groups of 2-4 students will create a 2-dimensional object on a Cartesian Plane with a key that denotes the distance of each grid block. The coordinates for this plane will be given to another group to recreate and to determine the perimeter. >The students will solve problems related to 2-dimensional objects when completing the lesson: “Cartesian Coordinate System” http://www.shodor.org/interactivate/lessons/cartesian.html
Students will solve problems related to 2-dimensional objects by finding the distance on a Cartesian plane with a textbook assignment or the following worksheet. Attachment U
75%
Integrated Skills:
35
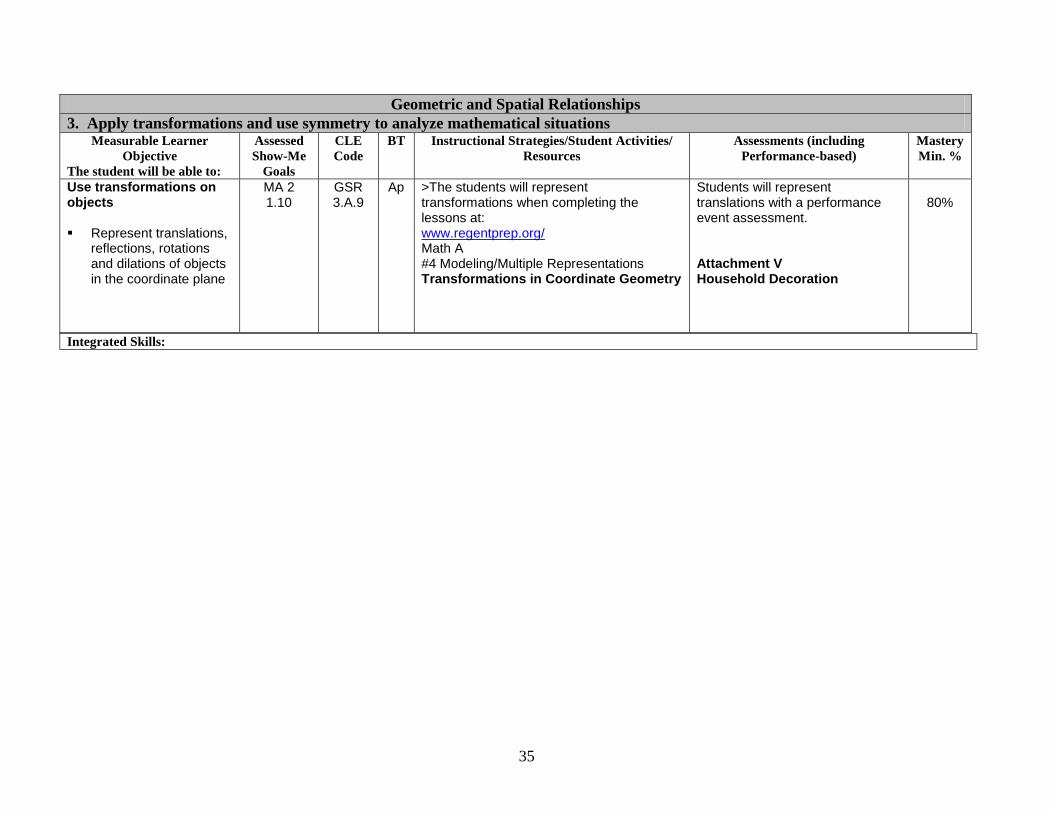
Geometric and Spatial Relationships
3. Apply transformations and use symmetry to analyze mathematical situations Measurable Learner
Objective
The student will be able to:
Assessed
Show-Me
Goals
CLE
Code
BT Instructional Strategies/Student Activities/
Resources
Assessments (including
Performance-based)
Mastery
Min. %
Use transformations on objects Represent translations,
reflections, rotations and dilations of objects in the coordinate plane
MA 2 1.10
GSR 3.A.9
Ap
>The students will represent transformations when completing the lessons at: www.regentprep.org/ Math A #4 Modeling/Multiple Representations Transformations in Coordinate Geometry
Students will represent translations with a performance event assessment. Attachment V Household Decoration
80%
Integrated Skills:
36
Geometric and Spatial Relationships
3. Apply transformations and use symmetry to analyze mathematical situations Measurable Learner
Objective
The student will be able to:
Assessed
Show-Me
Goals
CLE
Code
BT Instructional Strategies/Student Activities/
Resources
Assessments (including
Performance-based)
Mastery
Min. %
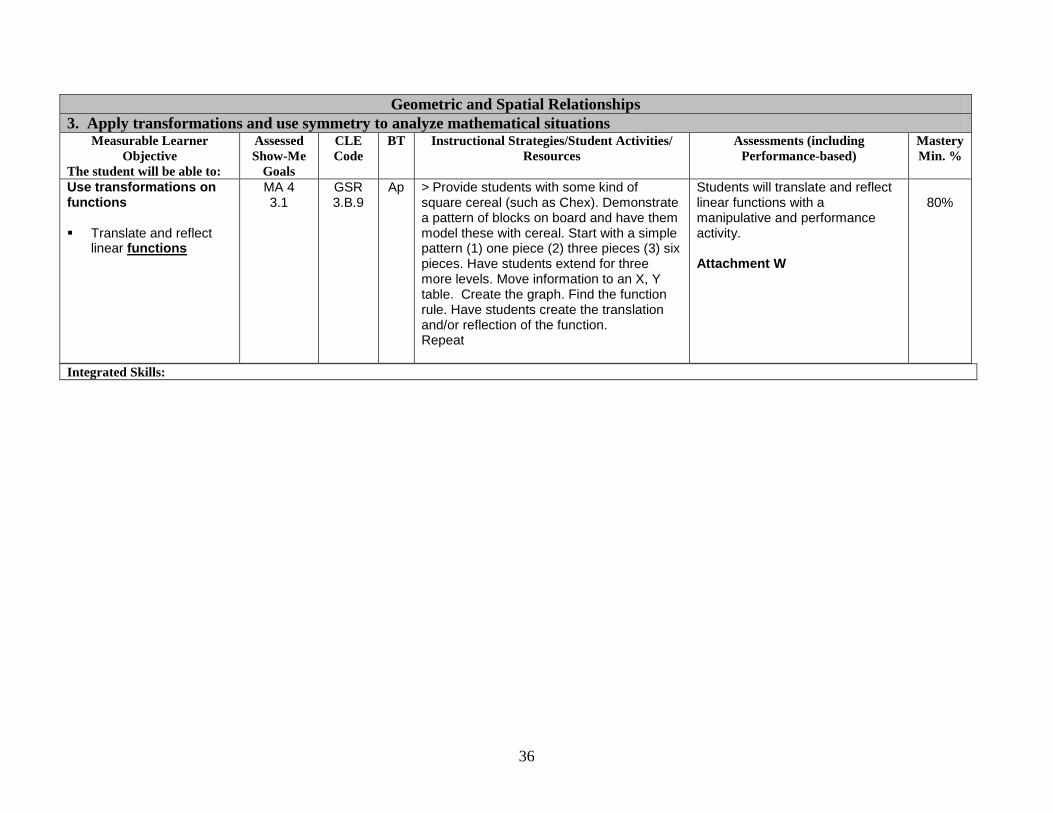
Use transformations on functions Translate and reflect
linear functions
MA 4 3.1
GSR 3.B.9
Ap
> Provide students with some kind of square cereal (such as Chex). Demonstrate a pattern of blocks on board and have them model these with cereal. Start with a simple pattern (1) one piece (2) three pieces (3) six pieces. Have students extend for three more levels. Move information to an X, Y table. Create the graph. Find the function rule. Have students create the translation and/or reflection of the function. Repeat
Students will translate and reflect linear functions with a manipulative and performance activity. Attachment W
80%
Integrated Skills:
37
Geometric and Spatial Relationships
4. Use visualization, spatial reasoning and geometric modeling to solve problems. Measurable Learner
Objective
The student will be able to:
Assessed
Show-Me
Goals
CLE
Code
BT Instructional Strategies/Student Activities/
Resources
Assessments (including
Performance-based)
Mastery
Min. %
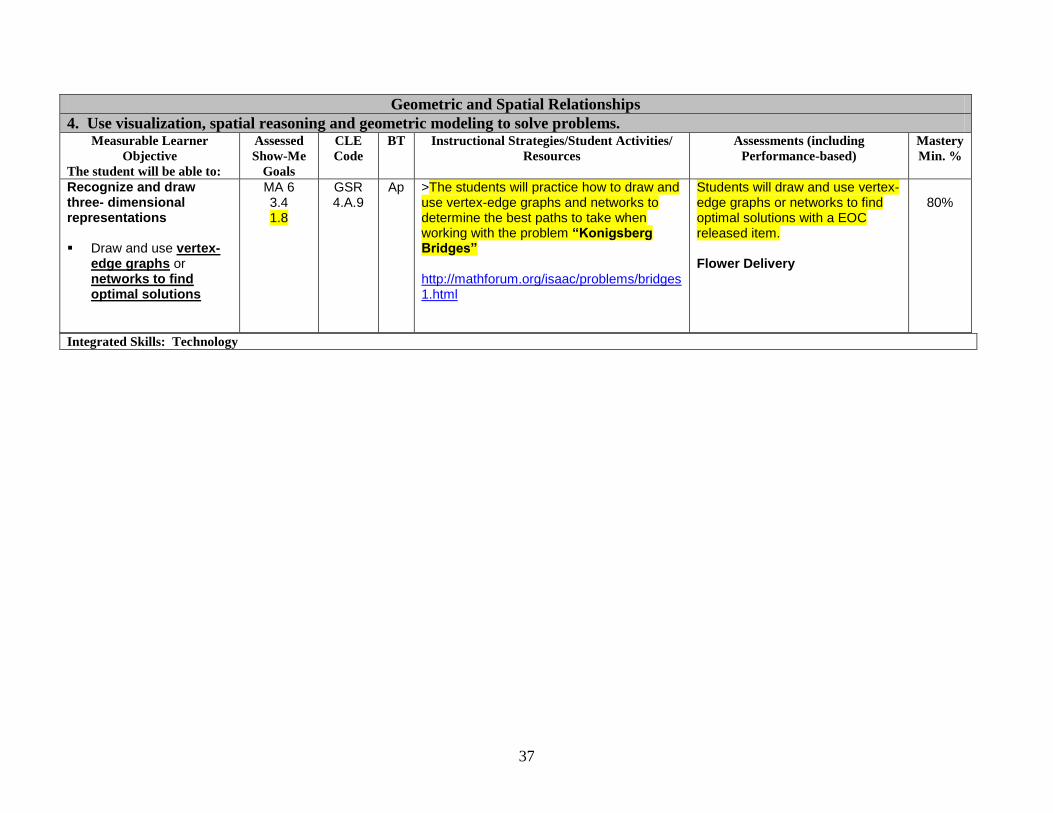
Recognize and draw three- dimensional representations Draw and use vertex-
edge graphs or networks to find optimal solutions
MA 6 3.4 1.8
GSR 4.A.9
Ap
>The students will practice how to draw and use vertex-edge graphs and networks to determine the best paths to take when working with the problem “Konigsberg Bridges” http://mathforum.org/isaac/problems/bridges1.html
Students will draw and use vertex-edge graphs or networks to find optimal solutions with a EOC released item. Flower Delivery
80%
Integrated Skills: Technology
38
Geometric and Spatial Relationships
4. Use visualization, spatial reasoning and geometric modeling to solve problems. Measurable Learner
Objective
The student will be able to:
Assessed
Show-Me
Goals
CLE
Code
BT Instructional Strategies/Student Activities/
Resources
Assessments (including
Performance-based)
Mastery
Min. %
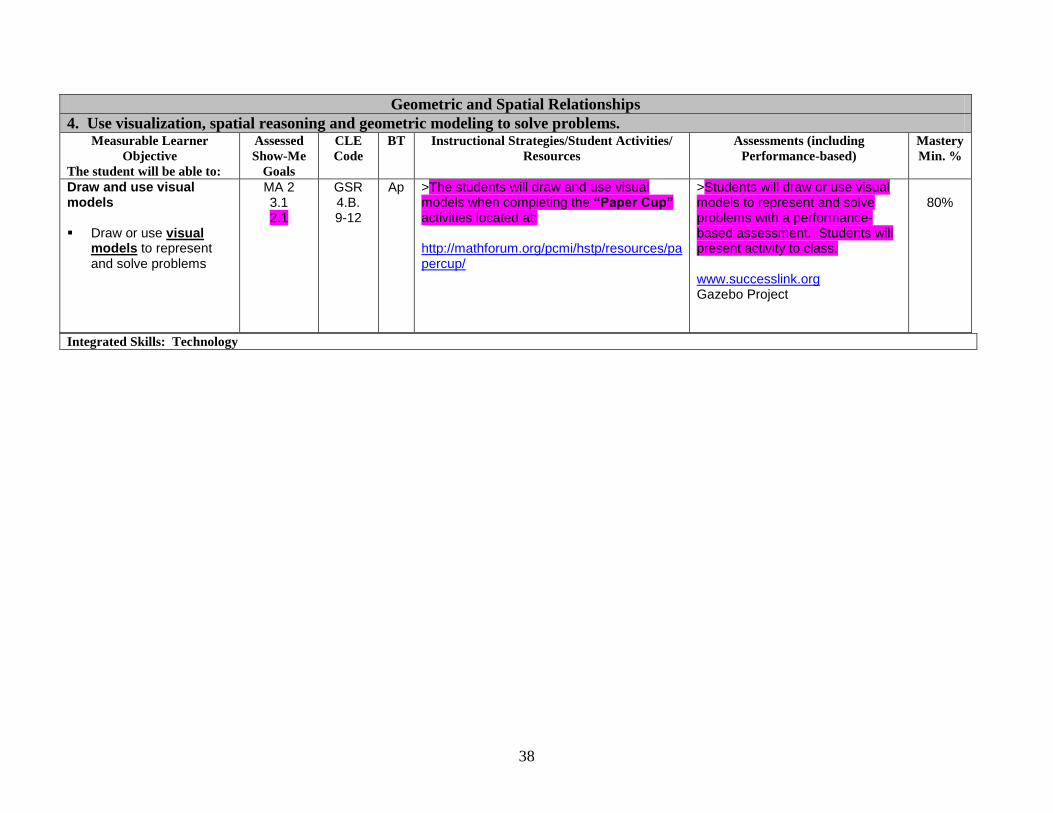
Draw and use visual models Draw or use visual
models to represent and solve problems
MA 2 3.1 2.1
GSR 4.B. 9-12
Ap
>The students will draw and use visual models when completing the “Paper Cup” activities located at: http://mathforum.org/pcmi/hstp/resources/papercup/
>Students will draw or use visual models to represent and solve problems with a performance-based assessment. Students will present activity to class. www.successlink.org Gazebo Project
80%
Integrated Skills: Technology
39
Measurement
1. Understand measurable attributes of objects and the units, systems and processes of measurement. Measurable Learner
Objective
The student will be able to:
Assessed
Show-Me
Goals
CLE
Code
BT Instructional Strategies/Student Activities/
Resources
Assessments (including
Performance-based)
Mastery
Min. %
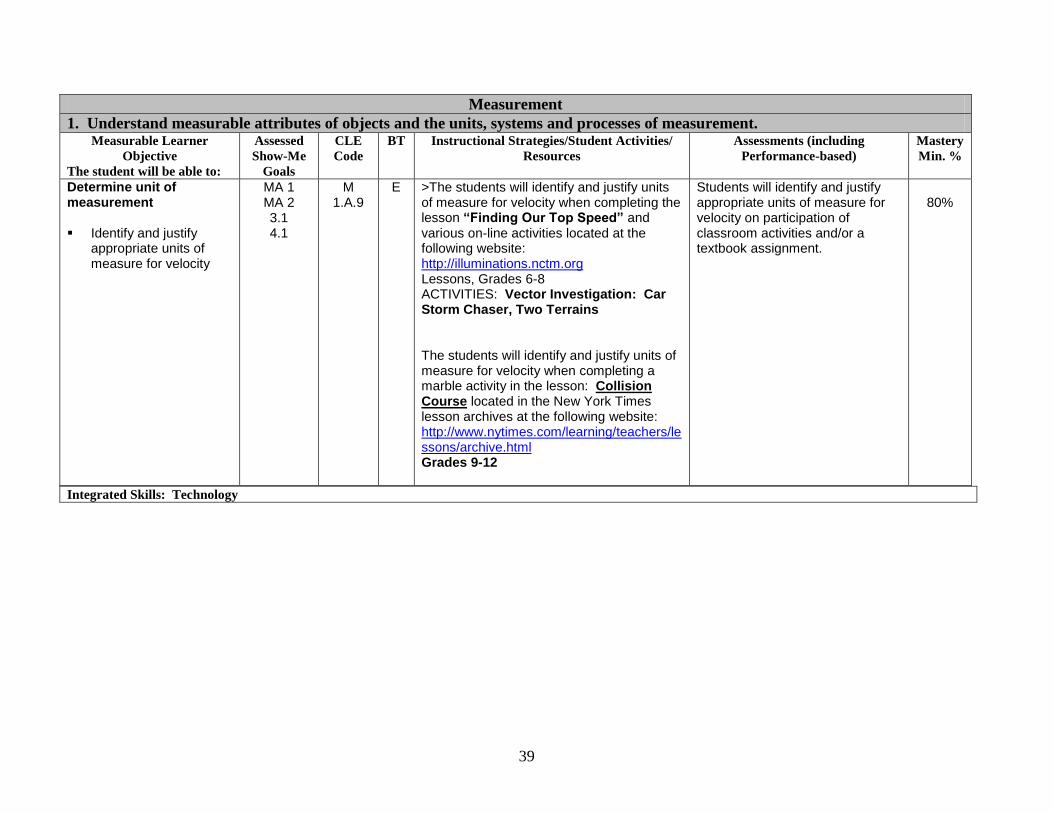
Determine unit of measurement Identify and justify
appropriate units of measure for velocity
MA 1 MA 2 3.1 4.1
M 1.A.9
E
>The students will identify and justify units of measure for velocity when completing the lesson “Finding Our Top Speed” and various on-line activities located at the following website: http://illuminations.nctm.org Lessons, Grades 6-8 ACTIVITIES: Vector Investigation: Car Storm Chaser, Two Terrains The students will identify and justify units of measure for velocity when completing a marble activity in the lesson: Collision Course located in the New York Times lesson archives at the following website: http://www.nytimes.com/learning/teachers/lessons/archive.html Grades 9-12
Students will identify and justify appropriate units of measure for velocity on participation of classroom activities and/or a textbook assignment.
80%
Integrated Skills: Technology
40
Measurement
2. Apply appropriate techniques, tools and formulas to determine measurements. Measurable Learner
Objective
The student will be able to:
Assessed
Show-Me
Goals
CLE
Code
BT Instructional Strategies/Student Activities/
Resources
Assessments (including
Performance-based)
Mastery
Min. %
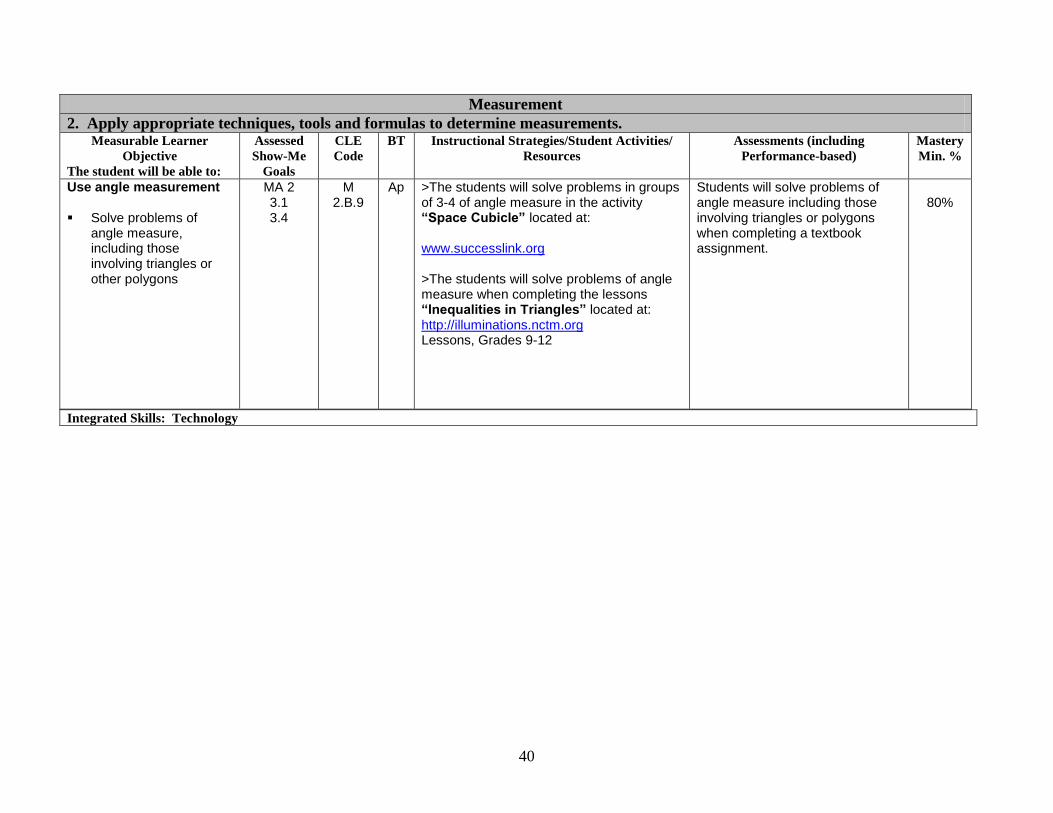
Use angle measurement Solve problems of
angle measure, including those involving triangles or other polygons
MA 2 3.1 3.4
M 2.B.9
Ap
>The students will solve problems in groups of 3-4 of angle measure in the activity “Space Cubicle” located at: www.successlink.org >The students will solve problems of angle measure when completing the lessons “Inequalities in Triangles” located at: http://illuminations.nctm.org Lessons, Grades 9-12
Students will solve problems of angle measure including those involving triangles or polygons when completing a textbook assignment.
80%
Integrated Skills: Technology
41
Measurement
2. Apply appropriate techniques, tools and formulas to determine measurements. Measurable Learner
Objective
The student will be able to:
Assessed
Show-Me
Goals
CLE
Code
BT Instructional Strategies/Student Activities/
Resources
Assessments (including
Performance-based)
Mastery
Min. %
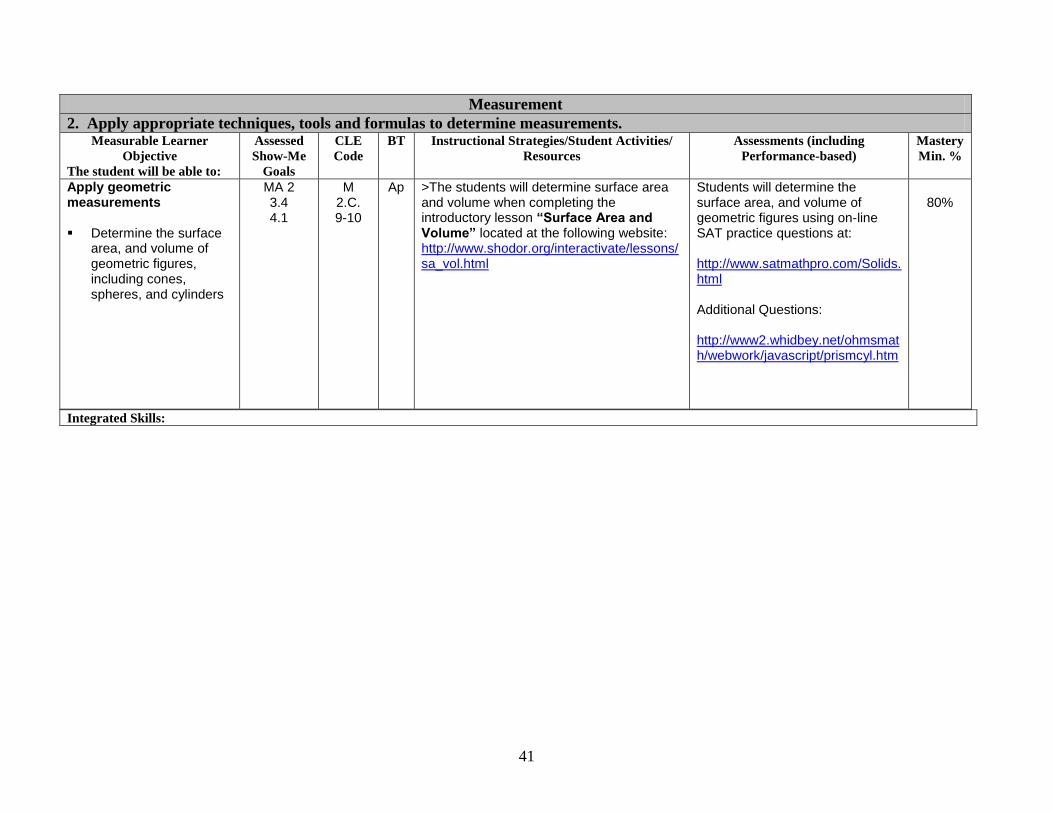
Apply geometric measurements Determine the surface
area, and volume of geometric figures, including cones, spheres, and cylinders
MA 2 3.4 4.1
M 2.C. 9-10
Ap
>The students will determine surface area and volume when completing the introductory lesson “Surface Area and Volume” located at the following website: http://www.shodor.org/interactivate/lessons/sa_vol.html
Students will determine the surface area, and volume of geometric figures using on-line SAT practice questions at: http://www.satmathpro.com/Solids.html Additional Questions: http://www2.whidbey.net/ohmsmath/webwork/javascript/prismcyl.htm
80%
Integrated Skills:
42
Measurement
2. Apply appropriate techniques, tools and formulas to determine measurements. Measurable Learner
Objective
The student will be able to:
Assessed
Show-Me
Goals
CLE
Code
BT Instructional Strategies/Student Activities/
Resources
Assessments (including
Performance-based)
Mastery
Min. %
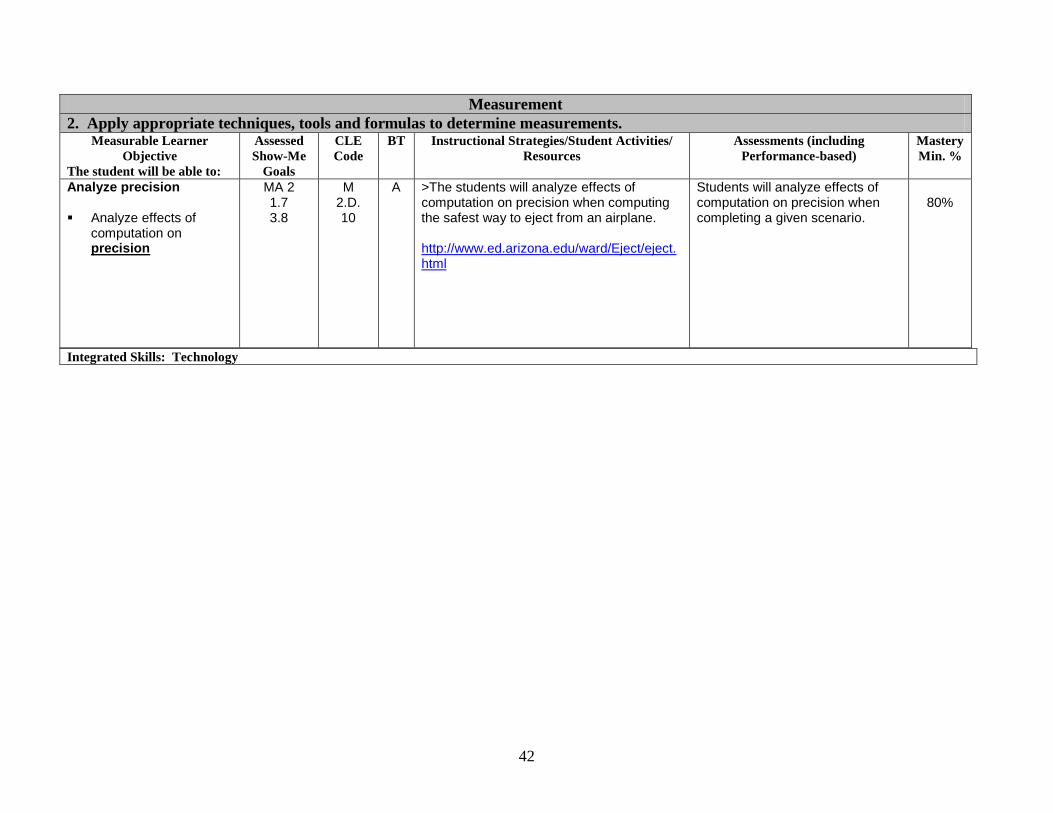
Analyze precision Analyze effects of
computation on precision
MA 2 1.7 3.8
M 2.D. 10
A
>The students will analyze effects of computation on precision when computing the safest way to eject from an airplane. http://www.ed.arizona.edu/ward/Eject/eject.html
Students will analyze effects of computation on precision when completing a given scenario.
80%
Integrated Skills: Technology
43
Measurement
2. Apply appropriate techniques, tools and formulas to determine measurements. Measurable Learner
Objective
The student will be able to:
Assessed
Show-Me
Goals
CLE
Code
BT Instructional Strategies/Student Activities/
Resources
Assessments (including
Performance-based)
Mastery
Min. %
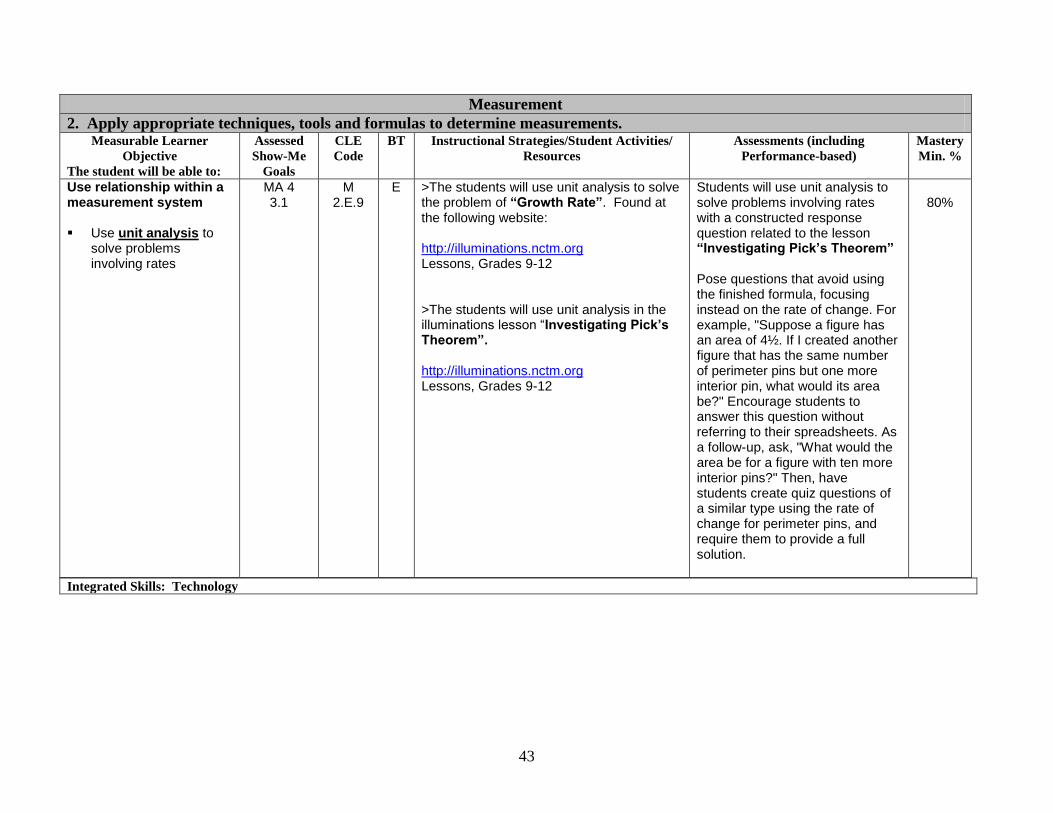
Use relationship within a measurement system Use unit analysis to
solve problems involving rates
MA 4 3.1
M 2.E.9
E
>The students will use unit analysis to solve the problem of “Growth Rate”. Found at the following website: http://illuminations.nctm.org Lessons, Grades 9-12 >The students will use unit analysis in the illuminations lesson “Investigating Pick’s Theorem”. http://illuminations.nctm.org Lessons, Grades 9-12
Students will use unit analysis to solve problems involving rates with a constructed response question related to the lesson “Investigating Pick’s Theorem” Pose questions that avoid using the finished formula, focusing instead on the rate of change. For example, "Suppose a figure has an area of 4½. If I created another figure that has the same number of perimeter pins but one more interior pin, what would its area be?" Encourage students to answer this question without referring to their spreadsheets. As a follow-up, ask, "What would the area be for a figure with ten more interior pins?" Then, have students create quiz questions of a similar type using the rate of change for perimeter pins, and require them to provide a full solution.
80%
Integrated Skills: Technology
44
Data and Probability
1. Formulate questions that can be addressed with data and collect, organize and display relevant data to answer them. Measurable Learner
Objective
The student will be able to:
Assessed
Show-Me
Goals
CLE
Code
BT Instructional Strategies/Student Activities/
Resources
Assessments (including
Performance-based)
Mastery
Min. %
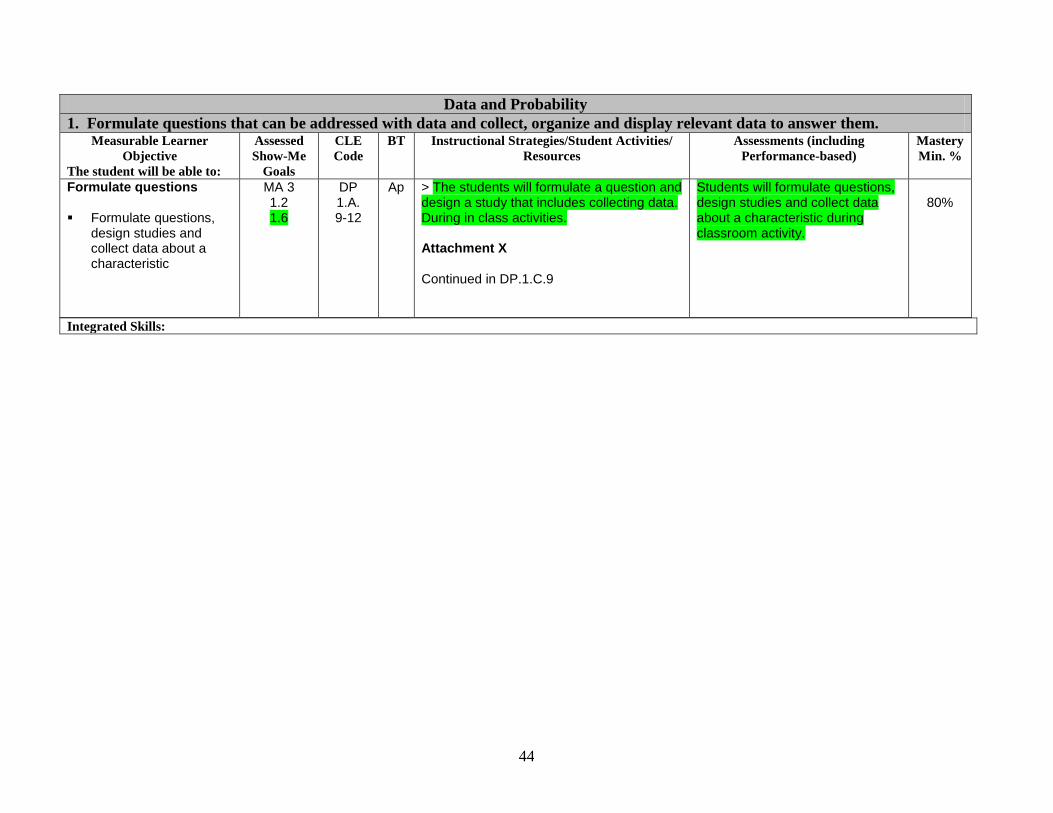
Formulate questions Formulate questions,
design studies and collect data about a characteristic
MA 3 1.2 1.6
DP 1.A. 9-12
Ap
> The students will formulate a question and design a study that includes collecting data. During in class activities. Attachment X Continued in DP.1.C.9
Students will formulate questions, design studies and collect data about a characteristic during classroom activity.
80%
Integrated Skills:
45
Data and Probability
1. Formulate questions that can be addressed with data and collect, organize and display relevant data to answer them. Measurable Learner
Objective
The student will be able to:
Assessed
Show-Me
Goals
CLE
Code
BT Instructional Strategies/Student Activities/
Resources
Assessments (including
Performance-based)
Mastery
Min. %
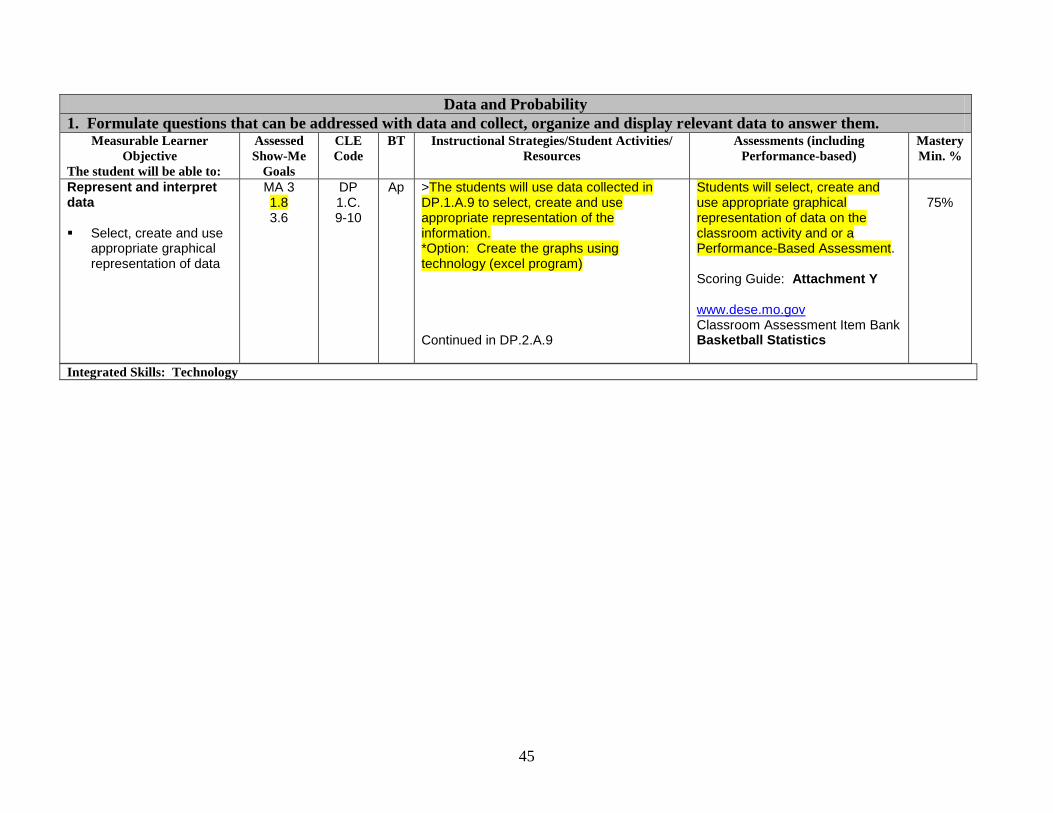
Represent and interpret data Select, create and use
appropriate graphical representation of data
MA 3 1.8 3.6
DP 1.C. 9-10
Ap
>The students will use data collected in DP.1.A.9 to select, create and use appropriate representation of the information. *Option: Create the graphs using technology (excel program) Continued in DP.2.A.9
Students will select, create and use appropriate graphical representation of data on the classroom activity and or a Performance-Based Assessment. Scoring Guide: Attachment Y www.dese.mo.gov Classroom Assessment Item Bank Basketball Statistics
75%
Integrated Skills: Technology
46
Data and Probability
2. Select and use appropriate statistical methods to analyze data Measurable Learner
Objective
The student will be able to:
Assessed
Show-Me
Goals
CLE
Code
BT Instructional Strategies/Student Activities/
Resources
Assessments (including
Performance-based)
Mastery
Min. %
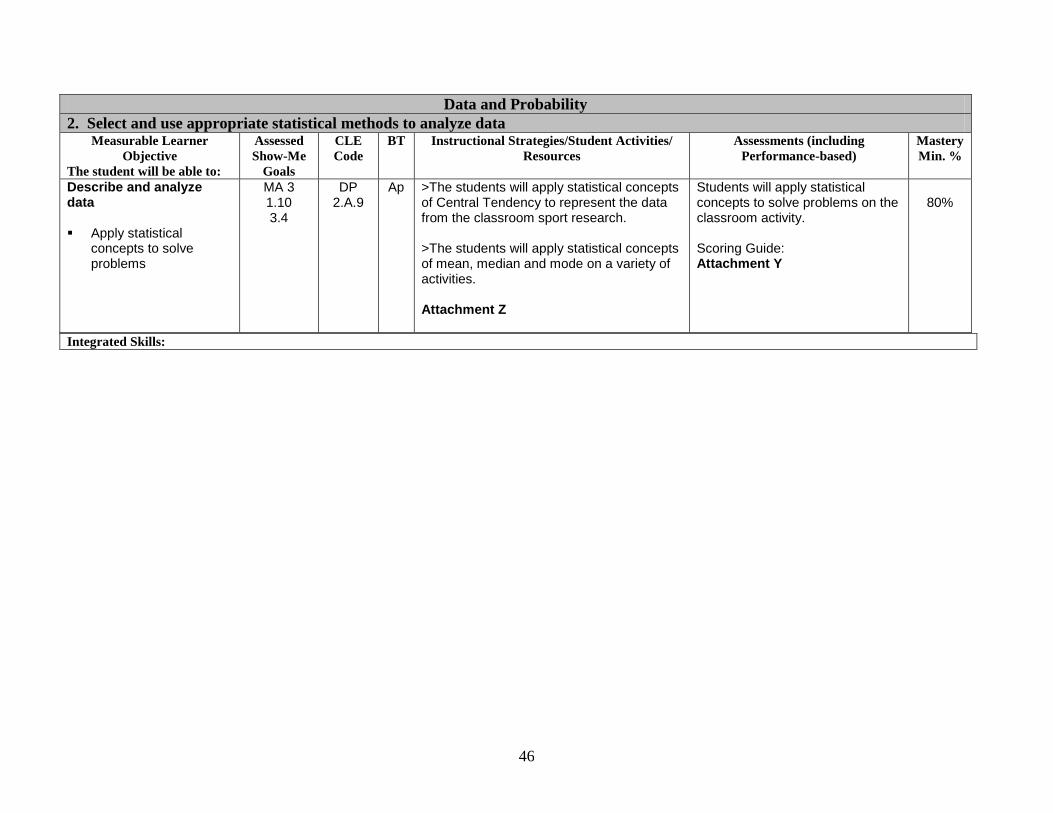
Describe and analyze data Apply statistical
concepts to solve problems
MA 3 1.10 3.4
DP 2.A.9
Ap
>The students will apply statistical concepts of Central Tendency to represent the data from the classroom sport research. >The students will apply statistical concepts of mean, median and mode on a variety of activities. Attachment Z
Students will apply statistical concepts to solve problems on the classroom activity. Scoring Guide: Attachment Y
80%
Integrated Skills:
47
Data and Probability
2. Select and use appropriate statistical methods to analyze data Measurable Learner
Objective
The student will be able to:
Assessed
Show-Me
Goals
CLE
Code
BT Instructional Strategies/Student Activities/
Resources
Assessments (including
Performance-based)
Mastery
Min. %
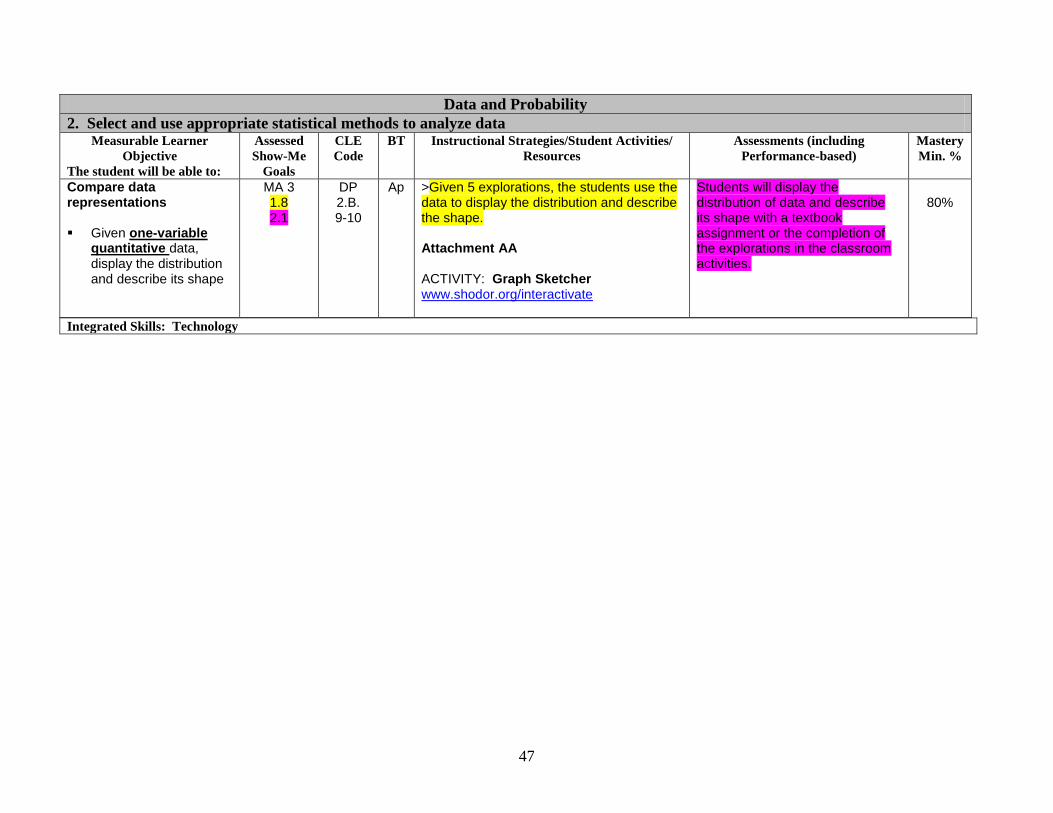
Compare data representations Given one-variable
quantitative data, display the distribution and describe its shape
MA 3 1.8 2.1
DP 2.B. 9-10
Ap
>Given 5 explorations, the students use the data to display the distribution and describe the shape. Attachment AA ACTIVITY: Graph Sketcher www.shodor.org/interactivate
Students will display the distribution of data and describe its shape with a textbook assignment or the completion of the explorations in the classroom activities.
80%
Integrated Skills: Technology
48
Data and Probability
2. Select and use appropriate statistical methods to analyze data Measurable Learner
Objective
The student will be able to:
Assessed
Show-Me
Goals
CLE
Code
BT Instructional Strategies/Student Activities/
Resources
Assessments (including
Performance-based)
Mastery
Min. %
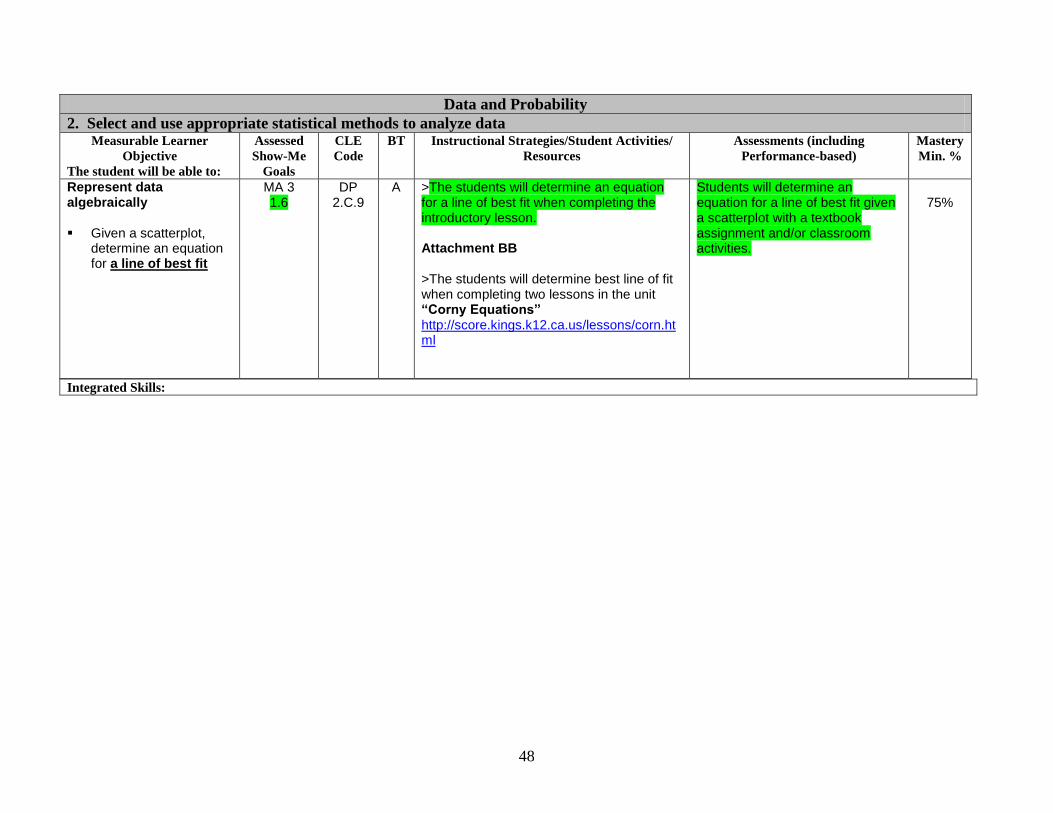
Represent data algebraically Given a scatterplot,
determine an equation for a line of best fit
MA 3 1.6
DP 2.C.9
A
>The students will determine an equation for a line of best fit when completing the introductory lesson. Attachment BB >The students will determine best line of fit when completing two lessons in the unit “Corny Equations” http://score.kings.k12.ca.us/lessons/corn.html
Students will determine an equation for a line of best fit given a scatterplot with a textbook assignment and/or classroom activities.
75%
Integrated Skills:
49
Data and Probability
3. Develop and evaluate inferences and predictions that are based on data. Measurable Learner
Objective
The student will be able to:
Assessed
Show-Me
Goals
CLE
Code
BT Instructional Strategies/Student Activities/
Resources
Assessments (including
Performance-based)
Mastery
Min. %
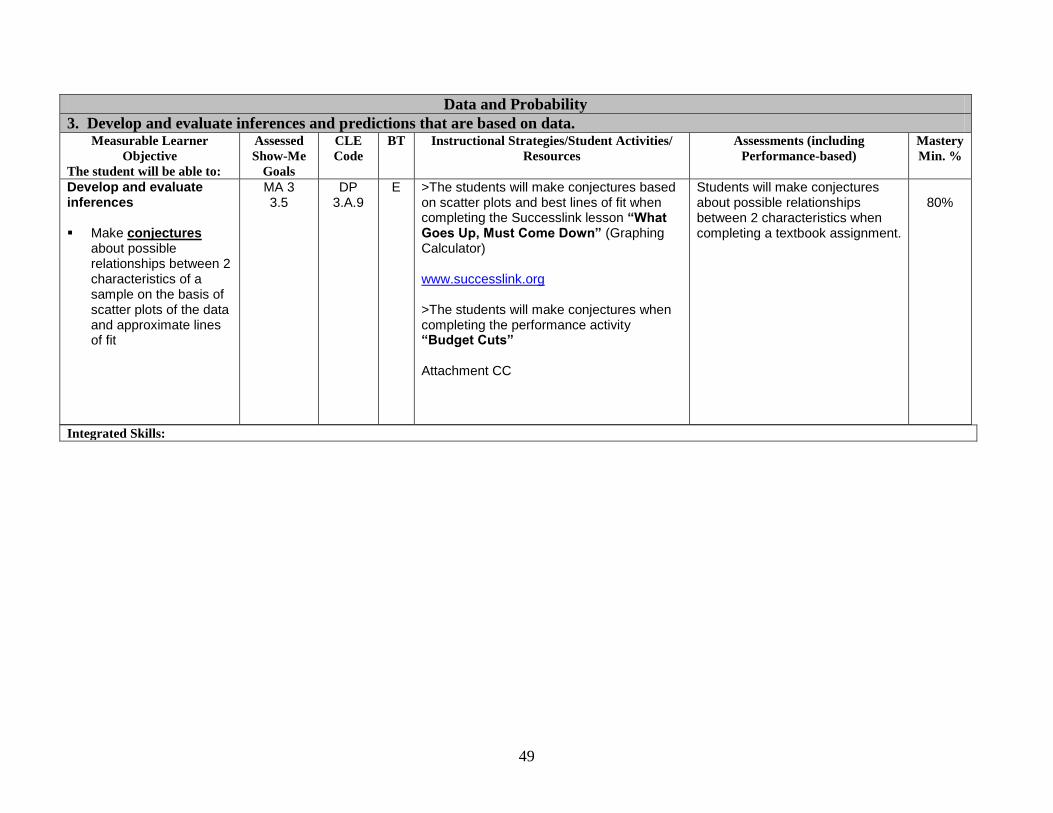
Develop and evaluate inferences Make conjectures
about possible relationships between 2 characteristics of a sample on the basis of scatter plots of the data and approximate lines of fit
MA 3 3.5
DP 3.A.9
E
>The students will make conjectures based on scatter plots and best lines of fit when completing the Successlink lesson “What Goes Up, Must Come Down” (Graphing Calculator) www.successlink.org >The students will make conjectures when completing the performance activity “Budget Cuts” Attachment CC
Students will make conjectures about possible relationships between 2 characteristics when completing a textbook assignment.
80%
Integrated Skills:
50
Data and Probability
4. Understand and apply basic concepts of probability. Measurable Learner
Objective
The student will be able to:
Assessed
Show-Me
Goals
CLE
Code
BT Instructional Strategies/Student Activities/
Resources
Assessments (including
Performance-based)
Mastery
Min. %
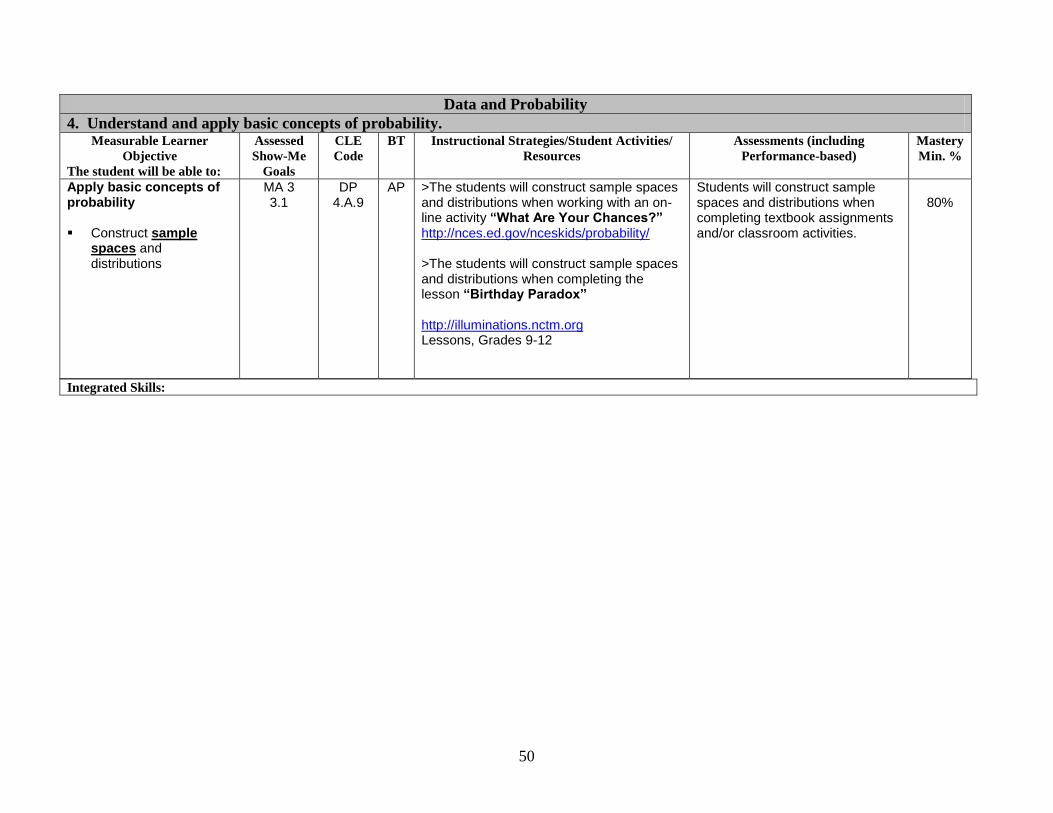
Apply basic concepts of probability Construct sample
spaces and distributions
MA 3 3.1
DP 4.A.9
AP
>The students will construct sample spaces and distributions when working with an on-line activity “What Are Your Chances?” http://nces.ed.gov/nceskids/probability/ >The students will construct sample spaces and distributions when completing the lesson “Birthday Paradox” http://illuminations.nctm.org Lessons, Grades 9-12
Students will construct sample spaces and distributions when completing textbook assignments and/or classroom activities.
80%
Integrated Skills: