Embed Size (px)
Citation preview
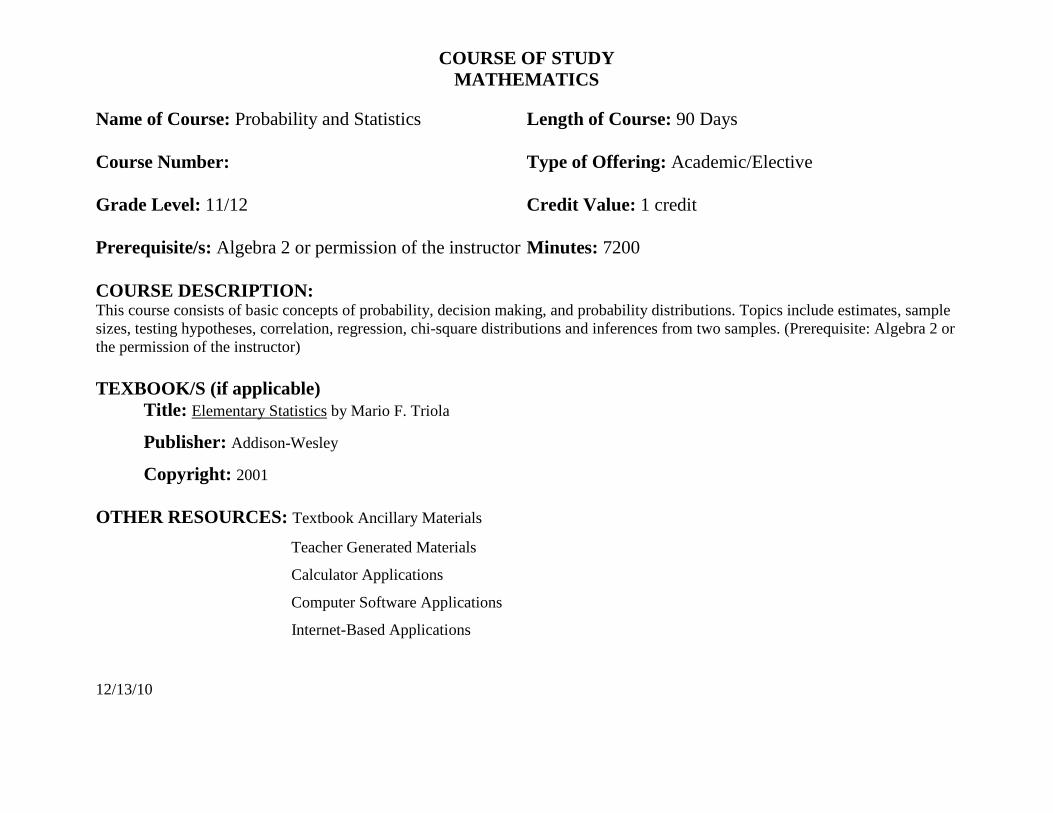
COURSE OF STUDY MATHEMATICS
Name of Course: Probability and Statistics Length of Course: 90 Days Course Number: Type of Offering: Academic/Elective Grade Level: 11/12 Credit Value: 1 credit Prerequisite/s: Algebra 2 or permission of the instructor Minutes: 7200 COURSE DESCRIPTION: This course consists of basic concepts of probability, decision making, and probability distributions. Topics include estimates, sample sizes, testing hypotheses, correlation, regression, chi-square distributions and inferences from two samples. (Prerequisite: Algebra 2 or the permission of the instructor) TEXBOOK/S (if applicable) Title: Elementary Statistics by Mario F. Triola
Publisher: Addison-Wesley
Copyright: 2001 OTHER RESOURCES: Textbook Ancillary Materials
Teacher Generated Materials
Calculator Applications
Computer Software Applications
Internet-Based Applications
12/13/10
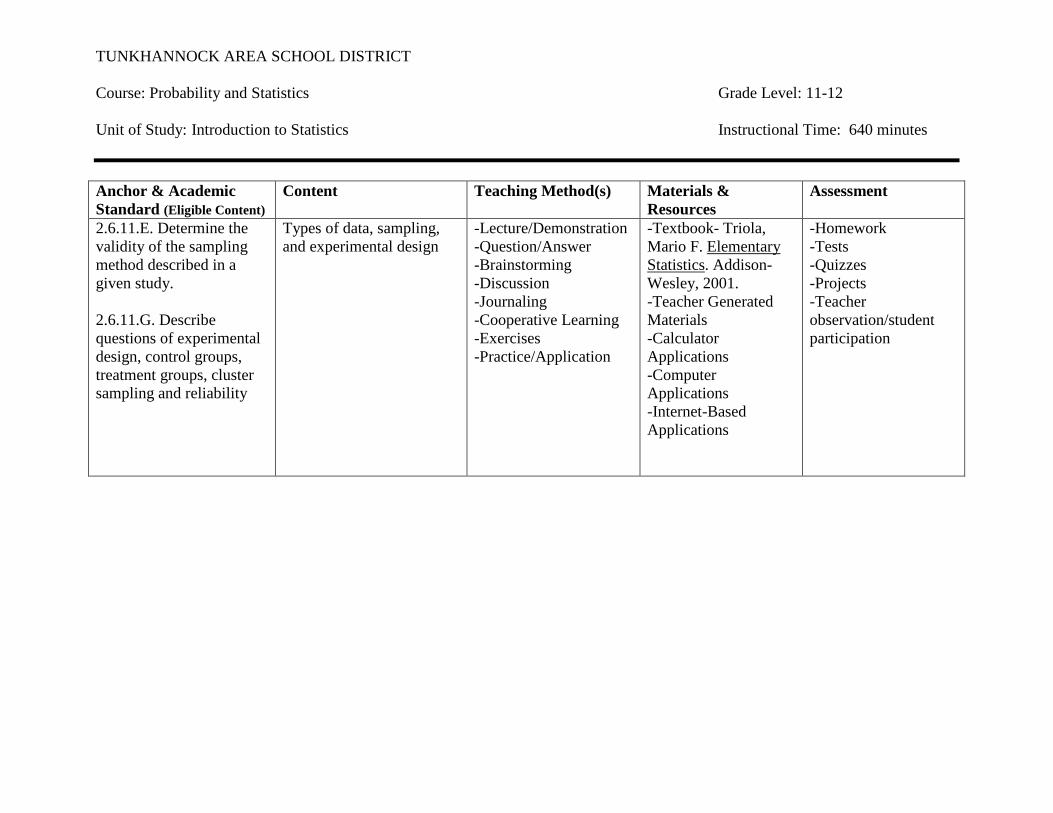
TUNKHANNOCK AREA SCHOOL DISTRICT Course: Probability and Statistics Grade Level: 11-12 Unit of Study: Introduction to Statistics Instructional Time: 640 minutes Anchor & Academic Standard (Eligible Content)
Content Teaching Method(s) Materials & Resources
Assessment
2.6.11.E. Determine the validity of the sampling method described in a given study. 2.6.11.G. Describe questions of experimental design, control groups, treatment groups, cluster sampling and reliability
Types of data, sampling, and experimental design
-Lecture/Demonstration -Question/Answer -Brainstorming -Discussion -Journaling -Cooperative Learning -Exercises -Practice/Application
-Textbook- Triola, Mario F. Elementary Statistics. Addison-Wesley, 2001. -Teacher Generated Materials -Calculator Applications -Computer Applications -Internet-Based Applications
-Homework -Tests -Quizzes -Projects -Teacher observation/student participation
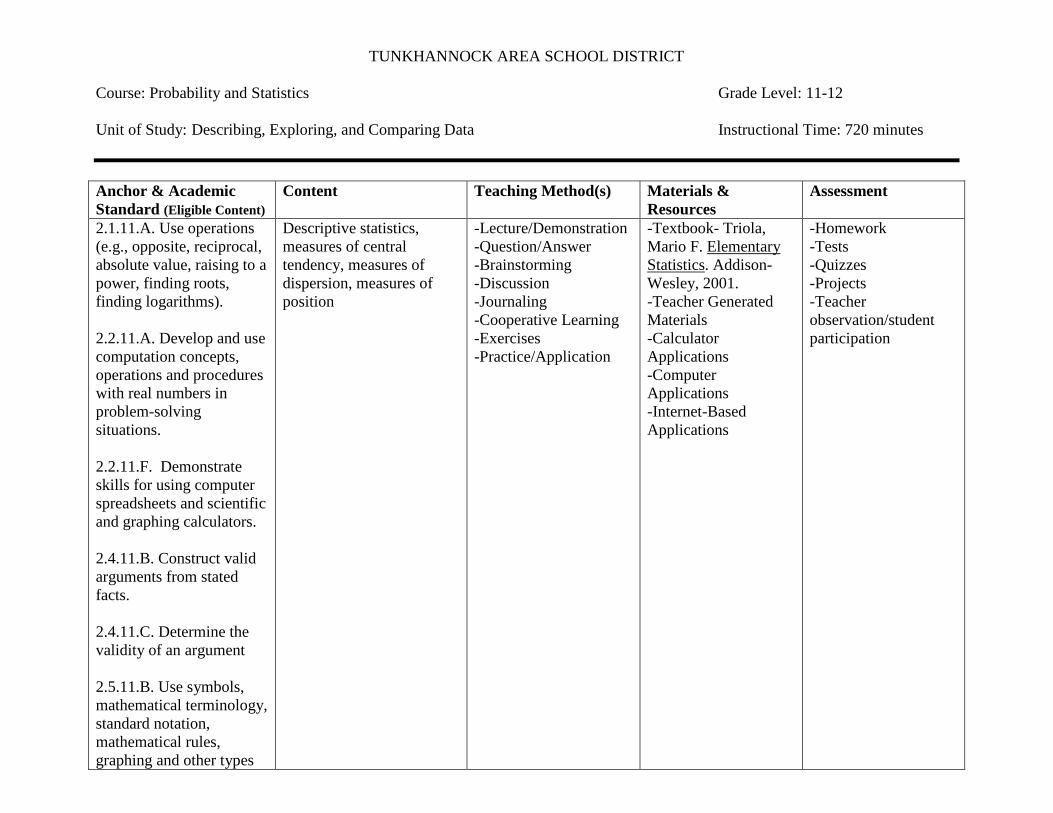
TUNKHANNOCK AREA SCHOOL DISTRICT Course: Probability and Statistics Grade Level: 11-12 Unit of Study: Describing, Exploring, and Comparing Data Instructional Time: 720 minutes Anchor & Academic Standard (Eligible Content)
Content Teaching Method(s) Materials & Resources
Assessment
2.1.11.A. Use operations (e.g., opposite, reciprocal, absolute value, raising to a power, finding roots, finding logarithms). 2.2.11.A. Develop and use computation concepts, operations and procedures with real numbers in problem-solving situations. 2.2.11.F. Demonstrate skills for using computer spreadsheets and scientific and graphing calculators. 2.4.11.B. Construct valid arguments from stated facts. 2.4.11.C. Determine the validity of an argument 2.5.11.B. Use symbols, mathematical terminology, standard notation, mathematical rules, graphing and other types
Descriptive statistics, measures of central tendency, measures of dispersion, measures of position
-Lecture/Demonstration -Question/Answer -Brainstorming -Discussion -Journaling -Cooperative Learning -Exercises -Practice/Application
-Textbook- Triola, Mario F. Elementary Statistics. Addison-Wesley, 2001. -Teacher Generated Materials -Calculator Applications -Computer Applications -Internet-Based Applications
-Homework -Tests -Quizzes -Projects -Teacher observation/student participation
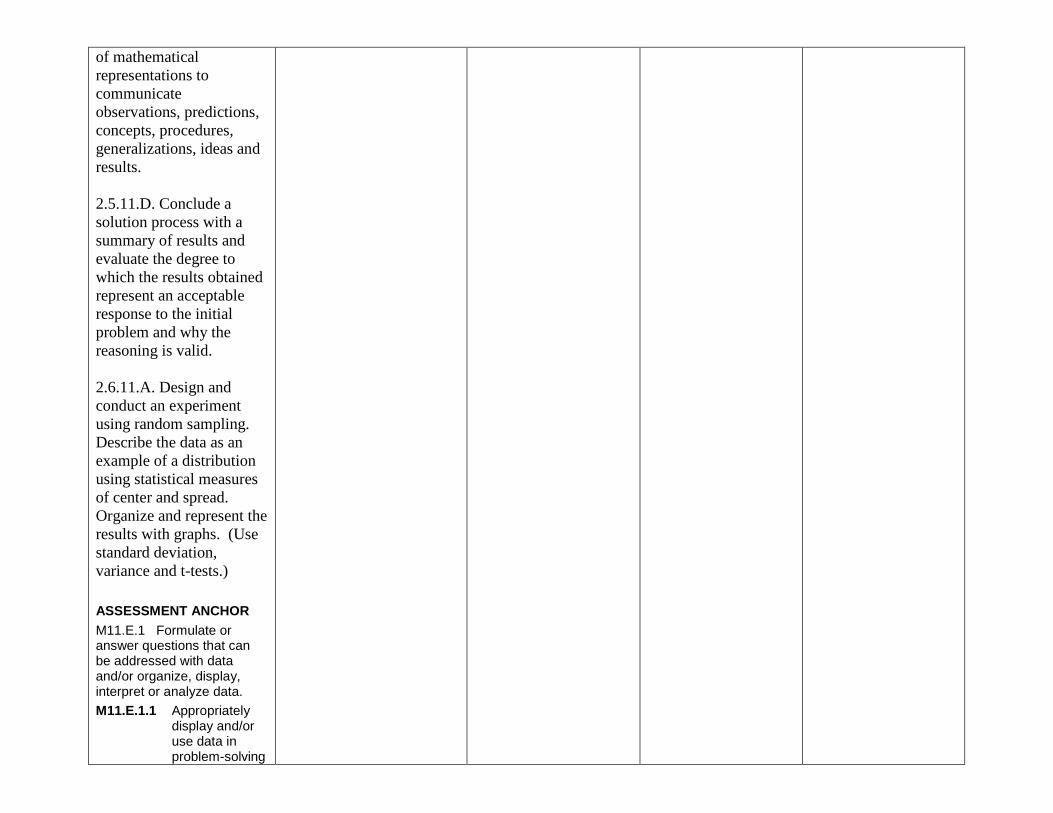
of mathematical representations to communicate observations, predictions, concepts, procedures, generalizations, ideas and results. 2.5.11.D. Conclude a solution process with a summary of results and evaluate the degree to which the results obtained represent an acceptable response to the initial problem and why the reasoning is valid. 2.6.11.A. Design and conduct an experiment using random sampling. Describe the data as an example of a distribution using statistical measures of center and spread. Organize and represent the results with graphs. (Use standard deviation, variance and t-tests.) ASSESSMENT ANCHOR M11.E.1 Formulate or answer questions that can be addressed with data and/or organize, display, interpret or analyze data. M11.E.1.1 Appropriately
display and/or use data in problem-solving
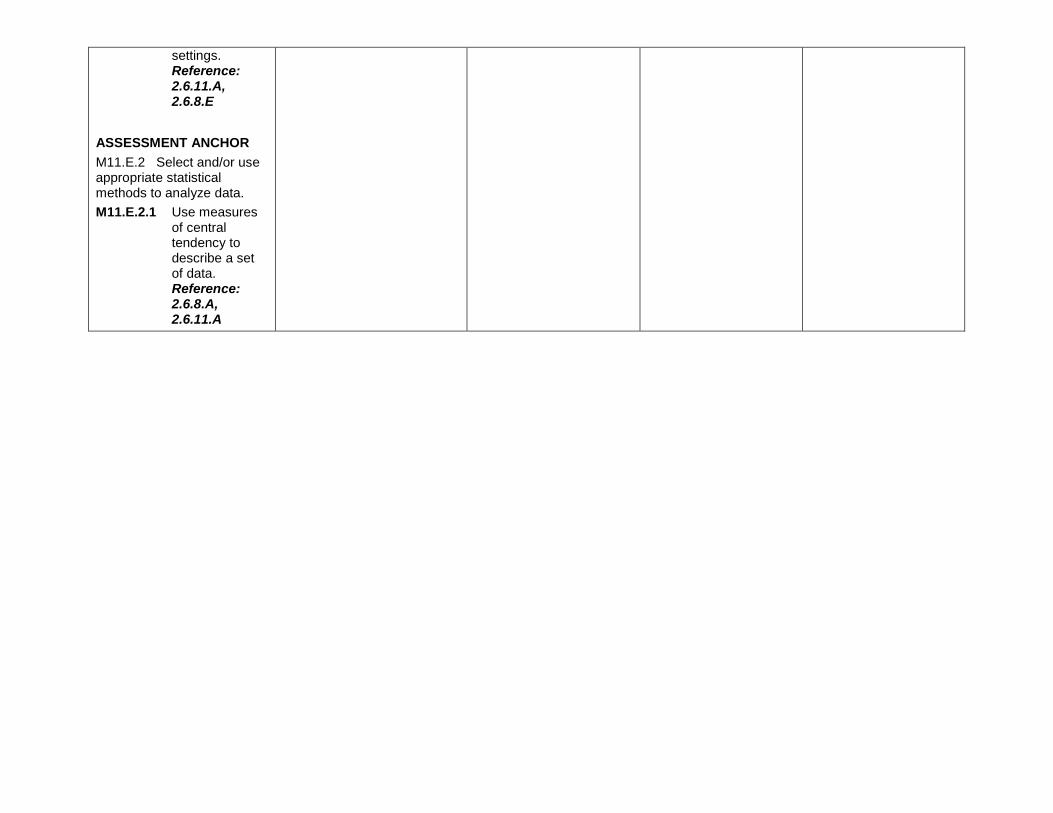
settings. Reference: 2.6.11.A, 2.6.8.E
ASSESSMENT ANCHOR M11.E.2 Select and/or use appropriate statistical methods to analyze data. M11.E.2.1 Use measures
of central tendency to describe a set of data. Reference: 2.6.8.A, 2.6.11.A
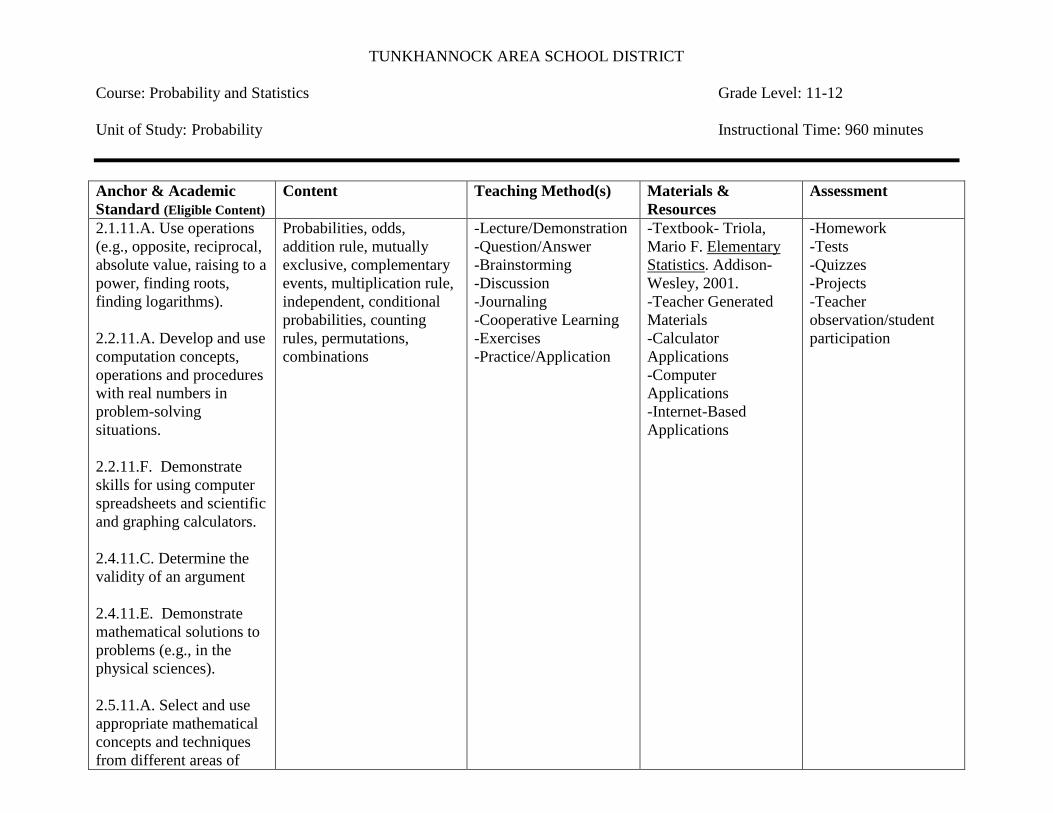
TUNKHANNOCK AREA SCHOOL DISTRICT Course: Probability and Statistics Grade Level: 11-12 Unit of Study: Probability Instructional Time: 960 minutes Anchor & Academic Standard (Eligible Content)
Content Teaching Method(s) Materials & Resources
Assessment
2.1.11.A. Use operations (e.g., opposite, reciprocal, absolute value, raising to a power, finding roots, finding logarithms). 2.2.11.A. Develop and use computation concepts, operations and procedures with real numbers in problem-solving situations. 2.2.11.F. Demonstrate skills for using computer spreadsheets and scientific and graphing calculators. 2.4.11.C. Determine the validity of an argument 2.4.11.E. Demonstrate mathematical solutions to problems (e.g., in the physical sciences). 2.5.11.A. Select and use appropriate mathematical concepts and techniques from different areas of
Probabilities, odds, addition rule, mutually exclusive, complementary events, multiplication rule, independent, conditional probabilities, counting rules, permutations, combinations
-Lecture/Demonstration -Question/Answer -Brainstorming -Discussion -Journaling -Cooperative Learning -Exercises -Practice/Application
-Textbook- Triola, Mario F. Elementary Statistics. Addison-Wesley, 2001. -Teacher Generated Materials -Calculator Applications -Computer Applications -Internet-Based Applications
-Homework -Tests -Quizzes -Projects -Teacher observation/student participation
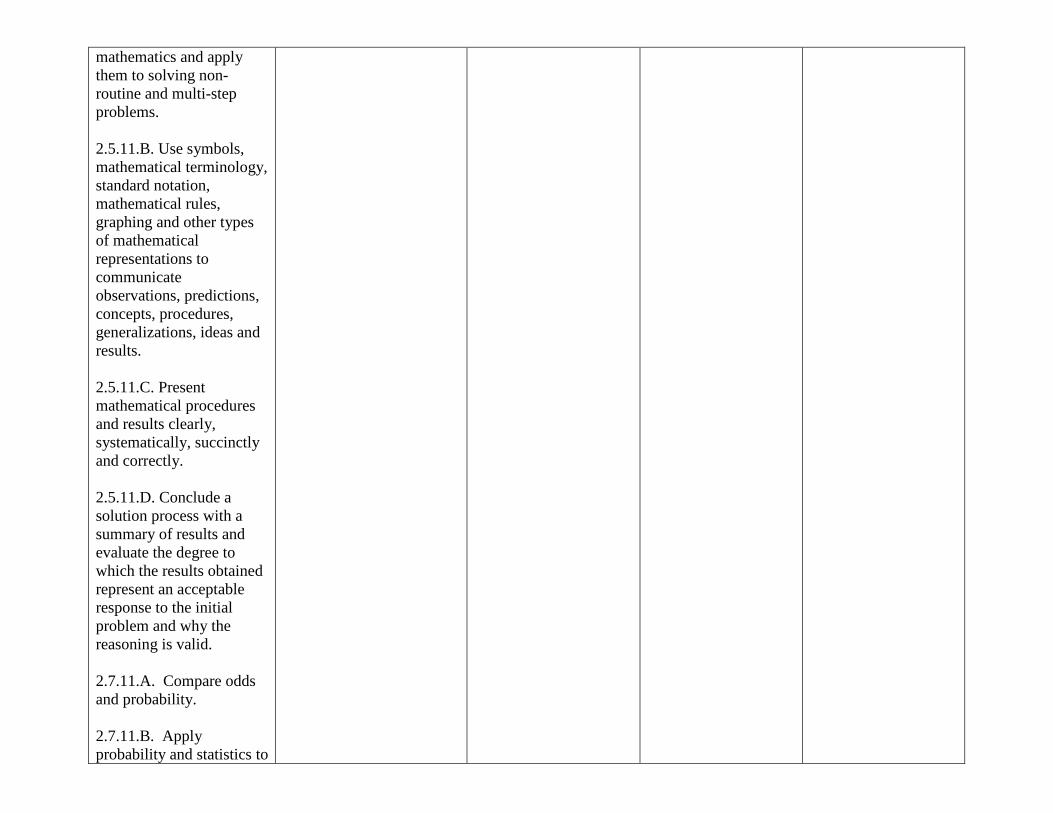
mathematics and apply them to solving non-routine and multi-step problems. 2.5.11.B. Use symbols, mathematical terminology, standard notation, mathematical rules, graphing and other types of mathematical representations to communicate observations, predictions, concepts, procedures, generalizations, ideas and results. 2.5.11.C. Present mathematical procedures and results clearly, systematically, succinctly and correctly. 2.5.11.D. Conclude a solution process with a summary of results and evaluate the degree to which the results obtained represent an acceptable response to the initial problem and why the reasoning is valid. 2.7.11.A. Compare odds and probability. 2.7.11.B. Apply probability and statistics to
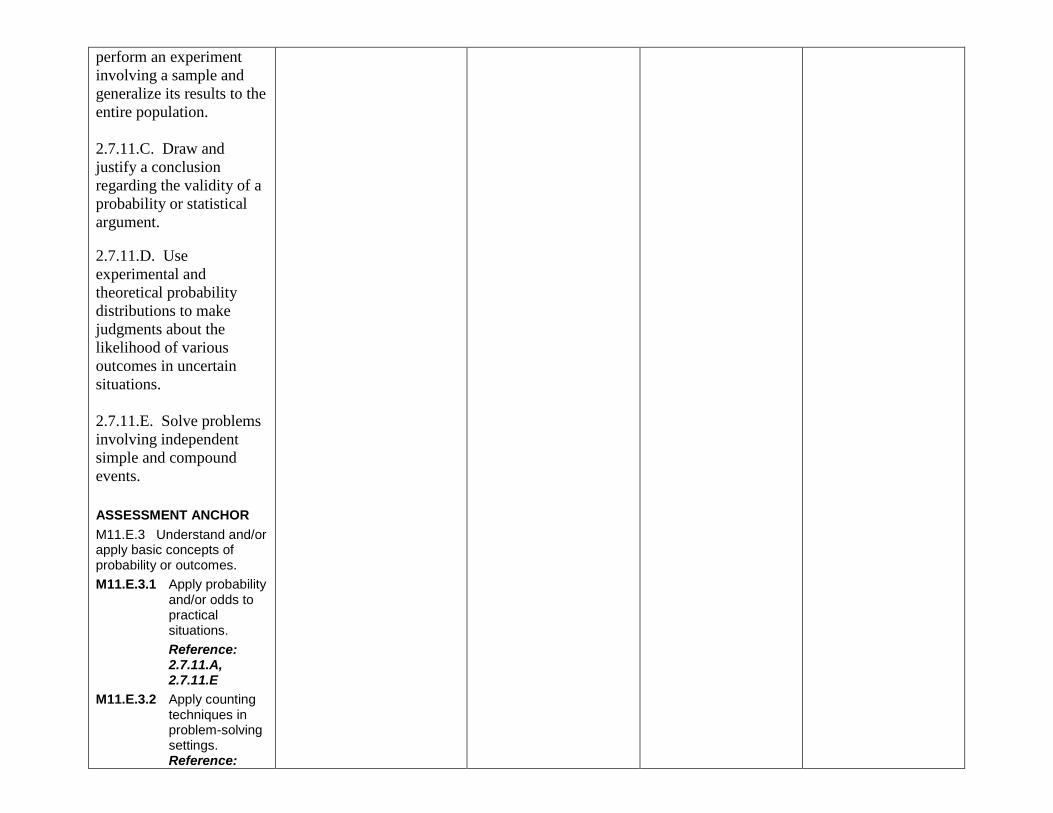
perform an experiment involving a sample and generalize its results to the entire population. 2.7.11.C. Draw and justify a conclusion regarding the validity of a probability or statistical argument. 2.7.11.D. Use experimental and theoretical probability distributions to make judgments about the likelihood of various outcomes in uncertain situations. 2.7.11.E. Solve problems involving independent simple and compound events. ASSESSMENT ANCHOR M11.E.3 Understand and/or apply basic concepts of probability or outcomes. M11.E.3.1 Apply probability
and/or odds to practical situations. Reference: 2.7.11.A, 2.7.11.E
M11.E.3.2 Apply counting techniques in problem-solving settings. Reference:
2.7.8.A
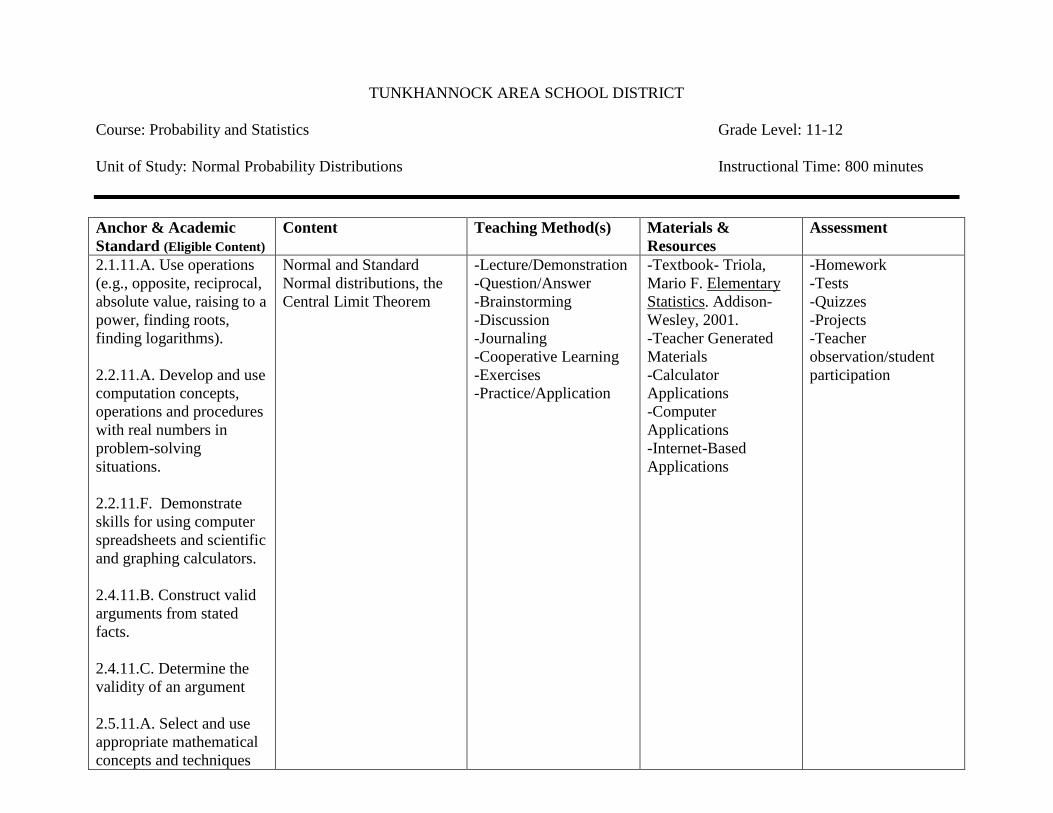
TUNKHANNOCK AREA SCHOOL DISTRICT Course: Probability and Statistics Grade Level: 11-12 Unit of Study: Normal Probability Distributions Instructional Time: 800 minutes Anchor & Academic Standard (Eligible Content)
Content Teaching Method(s) Materials & Resources
Assessment
2.1.11.A. Use operations (e.g., opposite, reciprocal, absolute value, raising to a power, finding roots, finding logarithms). 2.2.11.A. Develop and use computation concepts, operations and procedures with real numbers in problem-solving situations. 2.2.11.F. Demonstrate skills for using computer spreadsheets and scientific and graphing calculators. 2.4.11.B. Construct valid arguments from stated facts. 2.4.11.C. Determine the validity of an argument 2.5.11.A. Select and use appropriate mathematical concepts and techniques
Normal and Standard Normal distributions, the Central Limit Theorem
-Lecture/Demonstration -Question/Answer -Brainstorming -Discussion -Journaling -Cooperative Learning -Exercises -Practice/Application
-Textbook- Triola, Mario F. Elementary Statistics. Addison-Wesley, 2001. -Teacher Generated Materials -Calculator Applications -Computer Applications -Internet-Based Applications
-Homework -Tests -Quizzes -Projects -Teacher observation/student participation
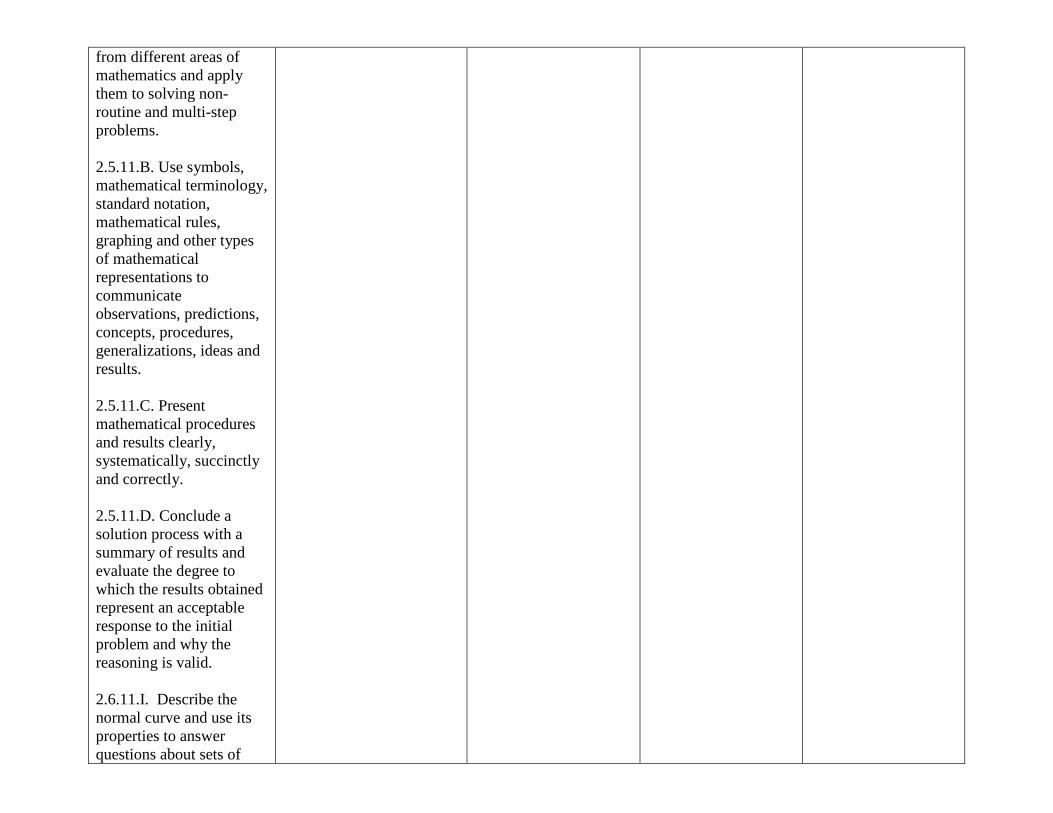
from different areas of mathematics and apply them to solving non-routine and multi-step problems. 2.5.11.B. Use symbols, mathematical terminology, standard notation, mathematical rules, graphing and other types of mathematical representations to communicate observations, predictions, concepts, procedures, generalizations, ideas and results. 2.5.11.C. Present mathematical procedures and results clearly, systematically, succinctly and correctly. 2.5.11.D. Conclude a solution process with a summary of results and evaluate the degree to which the results obtained represent an acceptable response to the initial problem and why the reasoning is valid. 2.6.11.I. Describe the normal curve and use its properties to answer questions about sets of
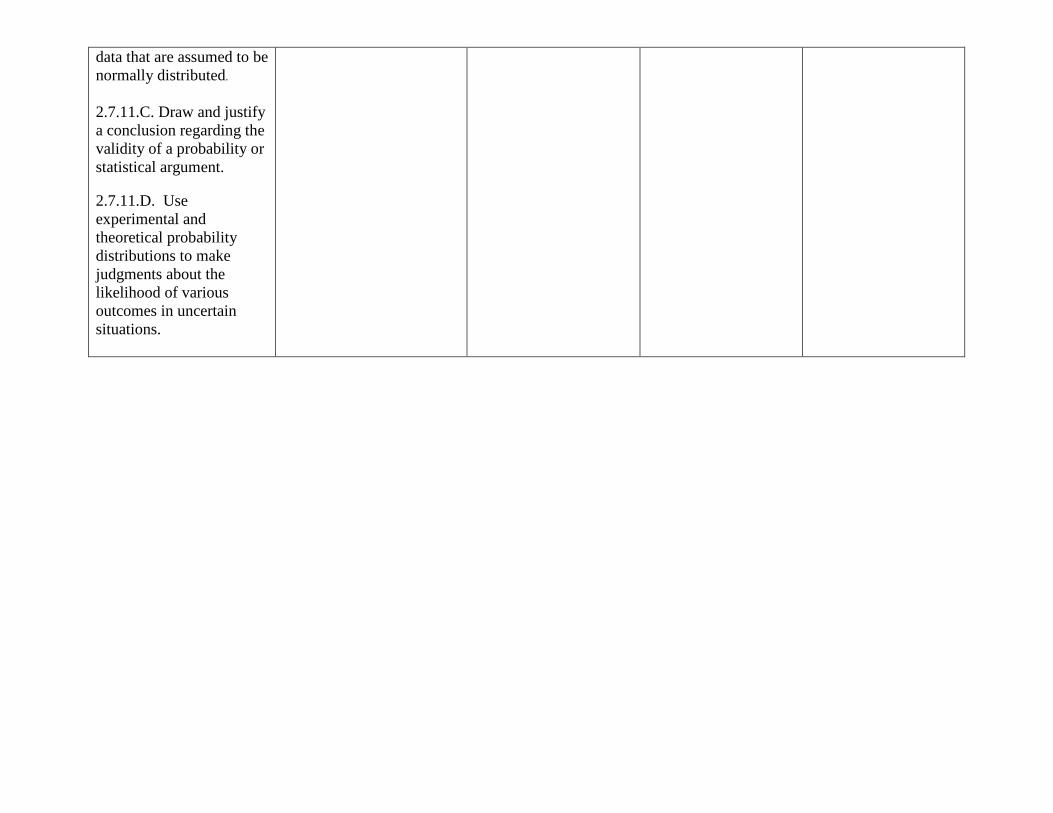
data that are assumed to be normally distributed.
2.7.11.C. Draw and justify a conclusion regarding the validity of a probability or statistical argument. 2.7.11.D. Use experimental and theoretical probability distributions to make judgments about the likelihood of various outcomes in uncertain situations.
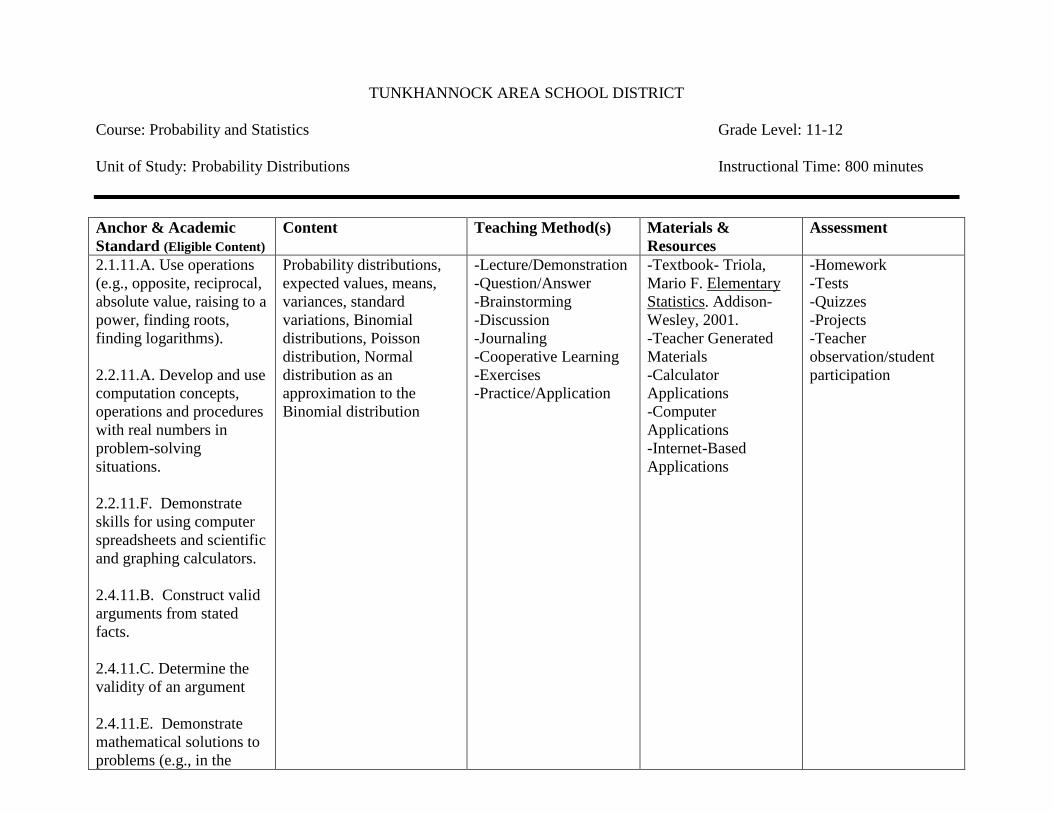
TUNKHANNOCK AREA SCHOOL DISTRICT Course: Probability and Statistics Grade Level: 11-12 Unit of Study: Probability Distributions Instructional Time: 800 minutes Anchor & Academic Standard (Eligible Content)
Content Teaching Method(s) Materials & Resources
Assessment
2.1.11.A. Use operations (e.g., opposite, reciprocal, absolute value, raising to a power, finding roots, finding logarithms). 2.2.11.A. Develop and use computation concepts, operations and procedures with real numbers in problem-solving situations. 2.2.11.F. Demonstrate skills for using computer spreadsheets and scientific and graphing calculators. 2.4.11.B. Construct valid arguments from stated facts. 2.4.11.C. Determine the validity of an argument 2.4.11.E. Demonstrate mathematical solutions to problems (e.g., in the
Probability distributions, expected values, means, variances, standard variations, Binomial distributions, Poisson distribution, Normal distribution as an approximation to the Binomial distribution
-Lecture/Demonstration -Question/Answer -Brainstorming -Discussion -Journaling -Cooperative Learning -Exercises -Practice/Application
-Textbook- Triola, Mario F. Elementary Statistics. Addison-Wesley, 2001. -Teacher Generated Materials -Calculator Applications -Computer Applications -Internet-Based Applications
-Homework -Tests -Quizzes -Projects -Teacher observation/student participation
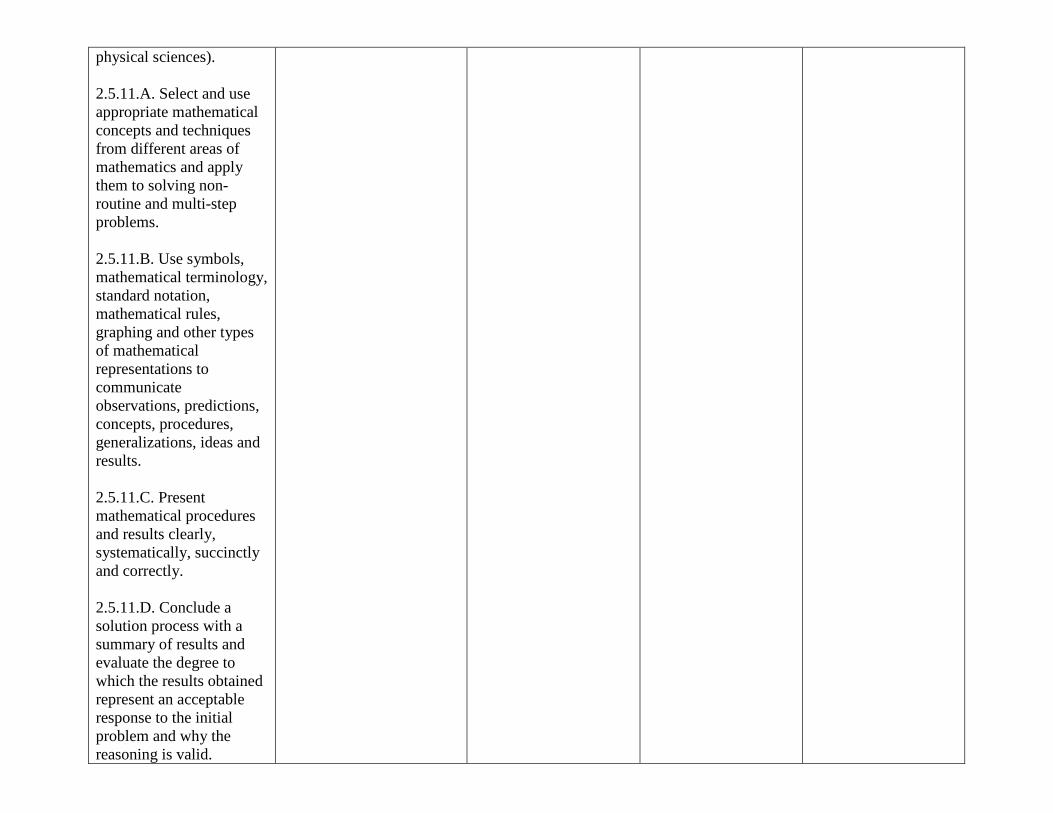
physical sciences). 2.5.11.A. Select and use appropriate mathematical concepts and techniques from different areas of mathematics and apply them to solving non-routine and multi-step problems. 2.5.11.B. Use symbols, mathematical terminology, standard notation, mathematical rules, graphing and other types of mathematical representations to communicate observations, predictions, concepts, procedures, generalizations, ideas and results. 2.5.11.C. Present mathematical procedures and results clearly, systematically, succinctly and correctly. 2.5.11.D. Conclude a solution process with a summary of results and evaluate the degree to which the results obtained represent an acceptable response to the initial problem and why the reasoning is valid.
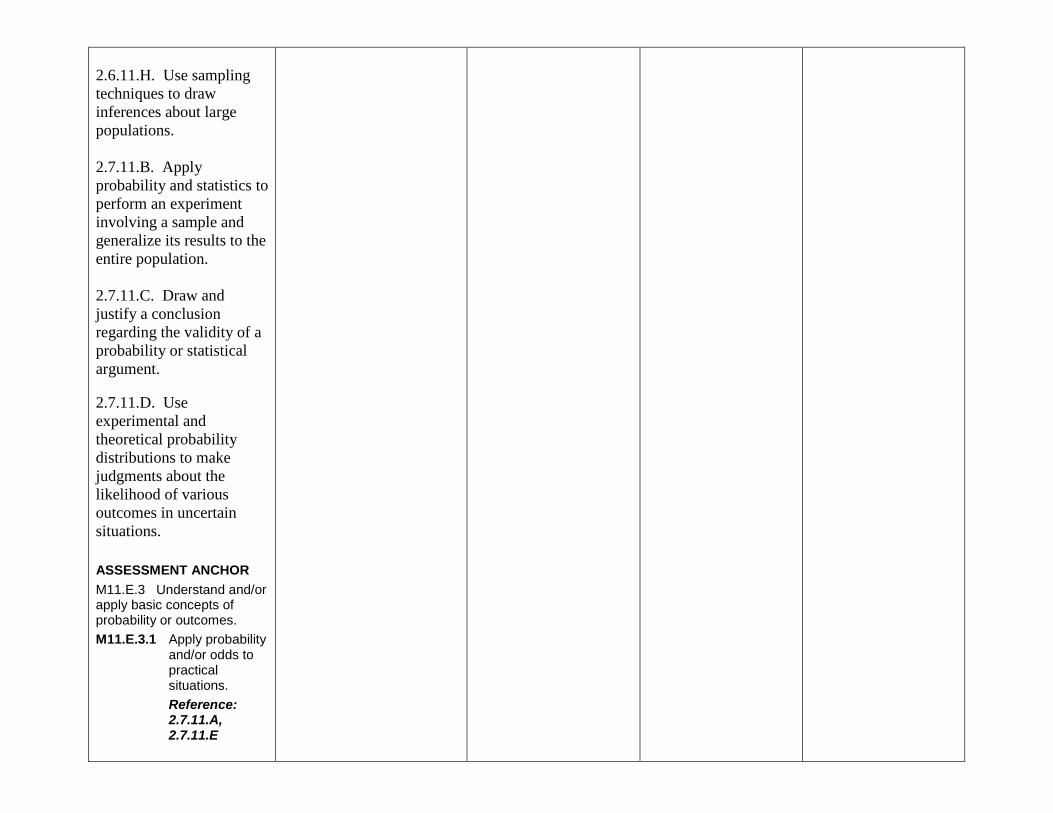
2.6.11.H. Use sampling techniques to draw inferences about large populations. 2.7.11.B. Apply probability and statistics to perform an experiment involving a sample and generalize its results to the entire population. 2.7.11.C. Draw and justify a conclusion regarding the validity of a probability or statistical argument. 2.7.11.D. Use experimental and theoretical probability distributions to make judgments about the likelihood of various outcomes in uncertain situations. ASSESSMENT ANCHOR M11.E.3 Understand and/or apply basic concepts of probability or outcomes. M11.E.3.1 Apply probability
and/or odds to practical situations. Reference: 2.7.11.A, 2.7.11.E
TUNKHANNOCK AREA SCHOOL DISTRICT
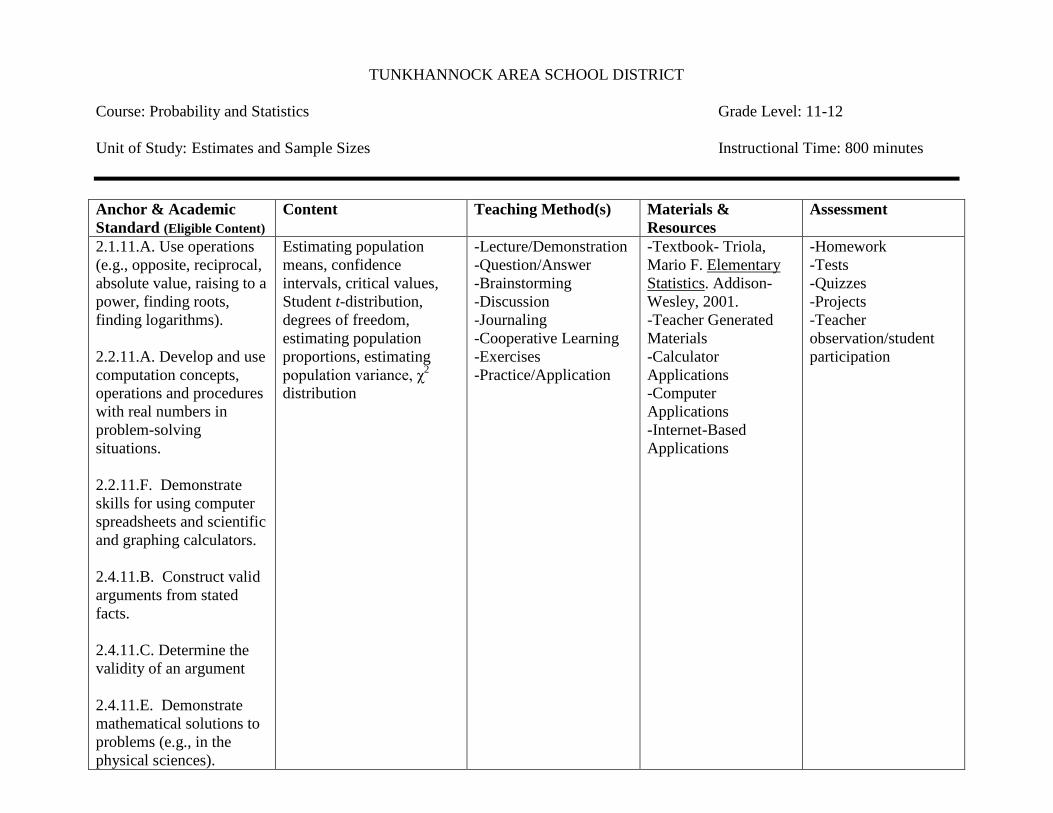
Course: Probability and Statistics Grade Level: 11-12 Unit of Study: Estimates and Sample Sizes Instructional Time: 800 minutes Anchor & Academic Standard (Eligible Content)
Content Teaching Method(s) Materials & Resources
Assessment
2.1.11.A. Use operations (e.g., opposite, reciprocal, absolute value, raising to a power, finding roots, finding logarithms). 2.2.11.A. Develop and use computation concepts, operations and procedures with real numbers in problem-solving situations. 2.2.11.F. Demonstrate skills for using computer spreadsheets and scientific and graphing calculators. 2.4.11.B. Construct valid arguments from stated facts. 2.4.11.C. Determine the validity of an argument 2.4.11.E. Demonstrate mathematical solutions to problems (e.g., in the physical sciences).
Estimating population means, confidence intervals, critical values, Student t-distribution, degrees of freedom, estimating population proportions, estimating population variance, χ2
distribution
-Lecture/Demonstration -Question/Answer -Brainstorming -Discussion -Journaling -Cooperative Learning -Exercises -Practice/Application
-Textbook- Triola, Mario F. Elementary Statistics. Addison-Wesley, 2001. -Teacher Generated Materials -Calculator Applications -Computer Applications -Internet-Based Applications
-Homework -Tests -Quizzes -Projects -Teacher observation/student participation

2.5.11.A. Select and use appropriate mathematical concepts and techniques from different areas of mathematics and apply them to solving non-routine and multi-step problems. 2.5.11.B. Use symbols, mathematical terminology, standard notation, mathematical rules, graphing and other types of mathematical representations to communicate observations, predictions, concepts, procedures, generalizations, ideas and results. 2.5.11.C. Present mathematical procedures and results clearly, systematically, succinctly and correctly. 2.5.11.D. Conclude a solution process with a summary of results and evaluate the degree to which the results obtained represent an acceptable response to the initial problem and why the reasoning is valid.
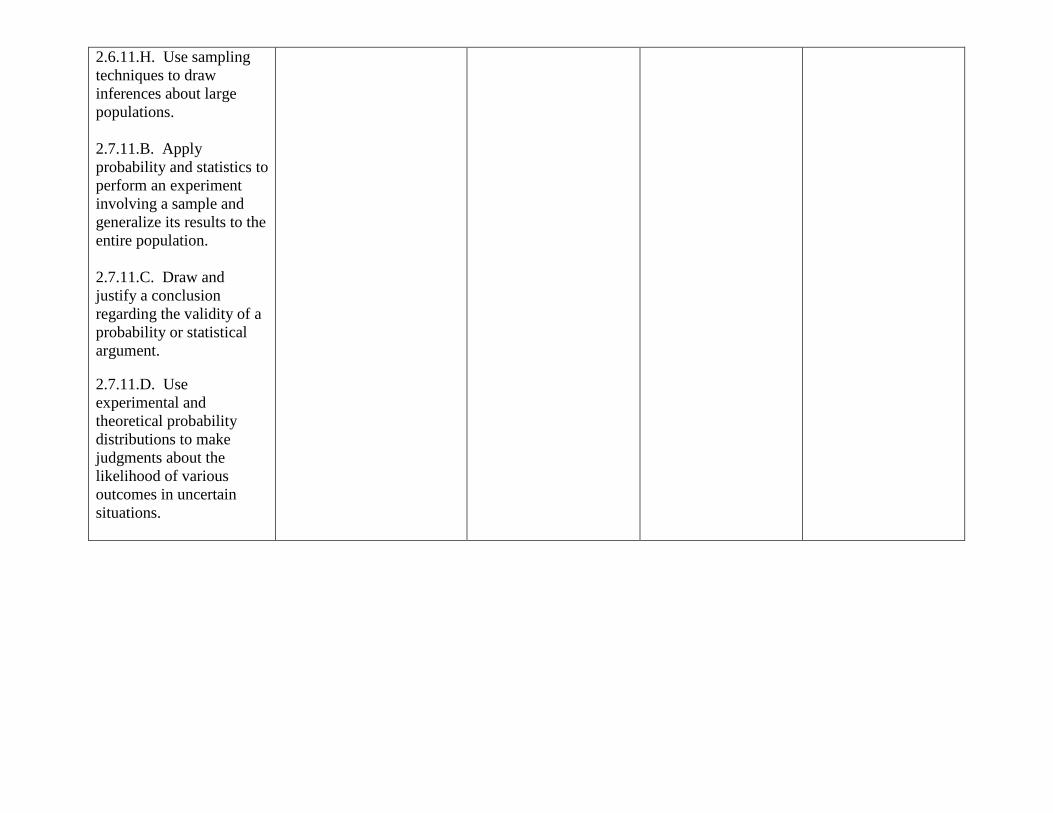
2.6.11.H. Use sampling techniques to draw inferences about large populations. 2.7.11.B. Apply probability and statistics to perform an experiment involving a sample and generalize its results to the entire population. 2.7.11.C. Draw and justify a conclusion regarding the validity of a probability or statistical argument. 2.7.11.D. Use experimental and theoretical probability distributions to make judgments about the likelihood of various outcomes in uncertain situations.
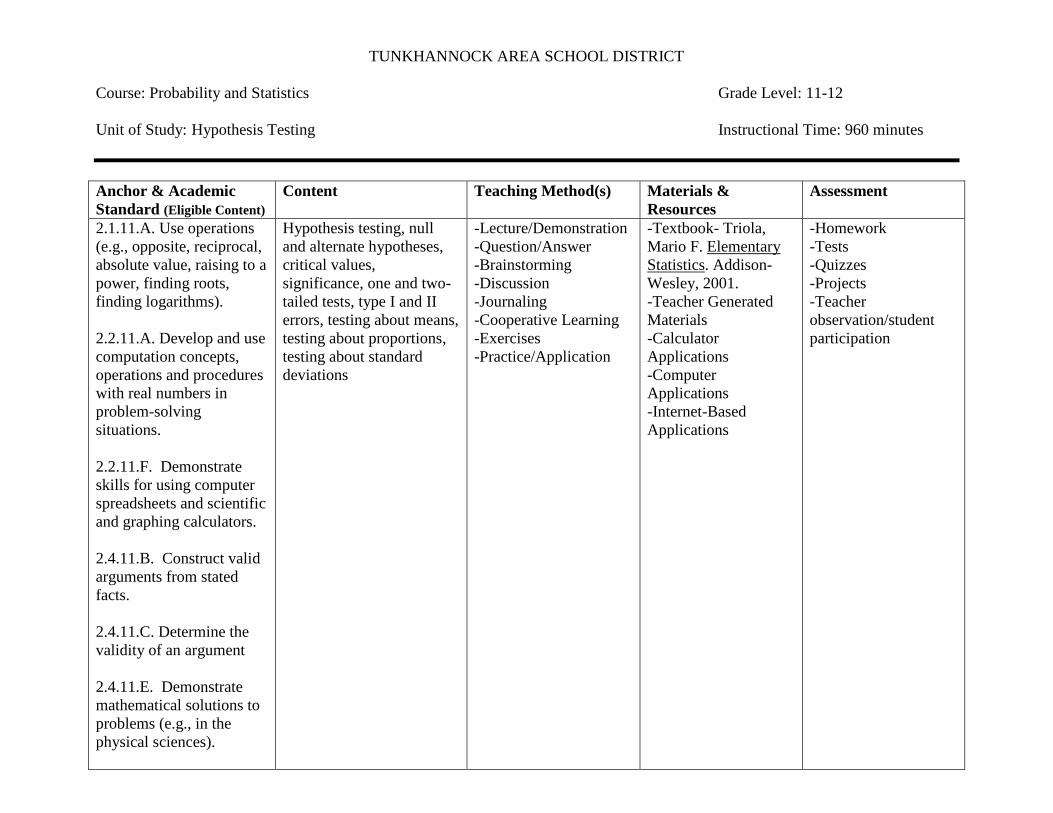
TUNKHANNOCK AREA SCHOOL DISTRICT Course: Probability and Statistics Grade Level: 11-12 Unit of Study: Hypothesis Testing Instructional Time: 960 minutes Anchor & Academic Standard (Eligible Content)
Content Teaching Method(s) Materials & Resources
Assessment
2.1.11.A. Use operations (e.g., opposite, reciprocal, absolute value, raising to a power, finding roots, finding logarithms). 2.2.11.A. Develop and use computation concepts, operations and procedures with real numbers in problem-solving situations. 2.2.11.F. Demonstrate skills for using computer spreadsheets and scientific and graphing calculators. 2.4.11.B. Construct valid arguments from stated facts. 2.4.11.C. Determine the validity of an argument 2.4.11.E. Demonstrate mathematical solutions to problems (e.g., in the physical sciences).
Hypothesis testing, null and alternate hypotheses, critical values, significance, one and two-tailed tests, type I and II errors, testing about means, testing about proportions, testing about standard deviations
-Lecture/Demonstration -Question/Answer -Brainstorming -Discussion -Journaling -Cooperative Learning -Exercises -Practice/Application
-Textbook- Triola, Mario F. Elementary Statistics. Addison-Wesley, 2001. -Teacher Generated Materials -Calculator Applications -Computer Applications -Internet-Based Applications
-Homework -Tests -Quizzes -Projects -Teacher observation/student participation
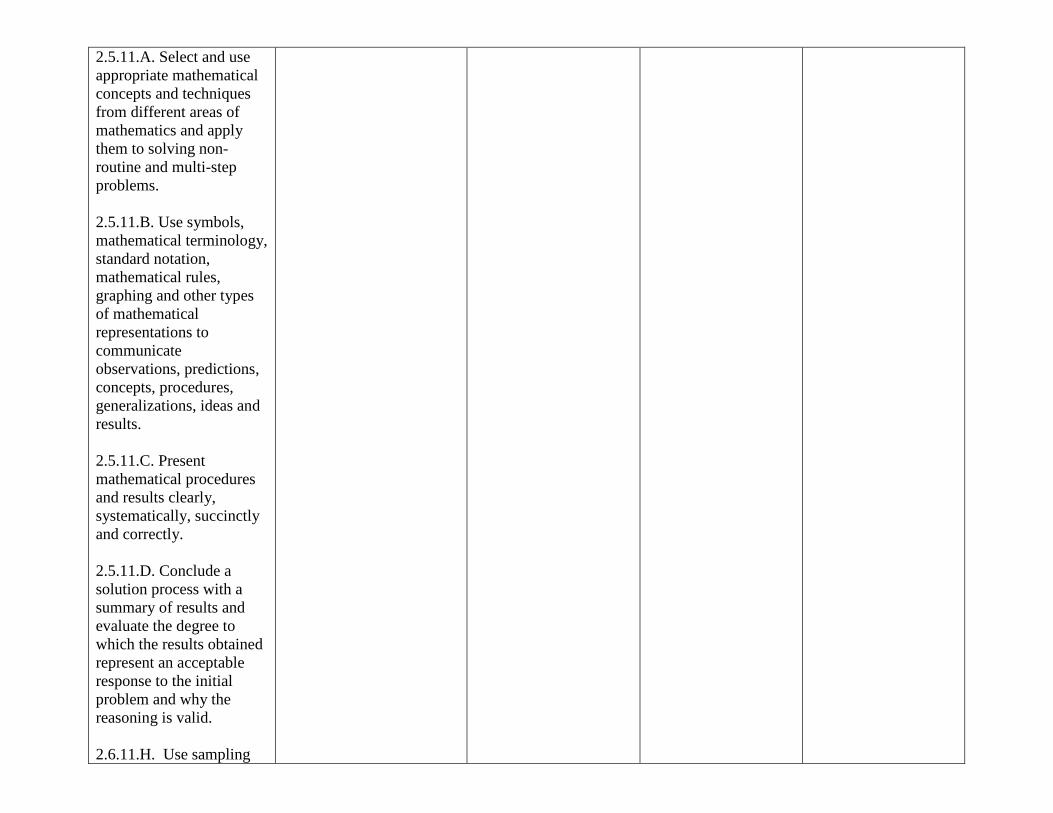
2.5.11.A. Select and use appropriate mathematical concepts and techniques from different areas of mathematics and apply them to solving non-routine and multi-step problems. 2.5.11.B. Use symbols, mathematical terminology, standard notation, mathematical rules, graphing and other types of mathematical representations to communicate observations, predictions, concepts, procedures, generalizations, ideas and results. 2.5.11.C. Present mathematical procedures and results clearly, systematically, succinctly and correctly. 2.5.11.D. Conclude a solution process with a summary of results and evaluate the degree to which the results obtained represent an acceptable response to the initial problem and why the reasoning is valid. 2.6.11.H. Use sampling
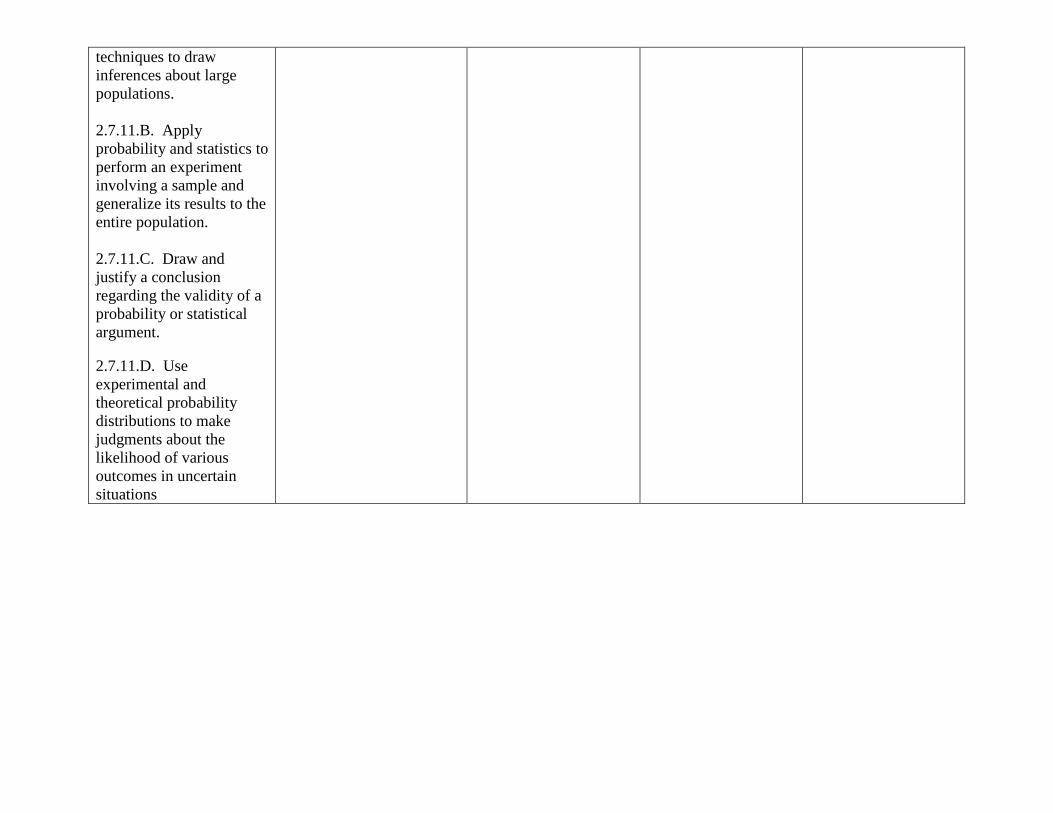
techniques to draw inferences about large populations. 2.7.11.B. Apply probability and statistics to perform an experiment involving a sample and generalize its results to the entire population. 2.7.11.C. Draw and justify a conclusion regarding the validity of a probability or statistical argument. 2.7.11.D. Use experimental and theoretical probability distributions to make judgments about the likelihood of various outcomes in uncertain situations
TUNKHANNOCK AREA SCHOOL DISTRICT
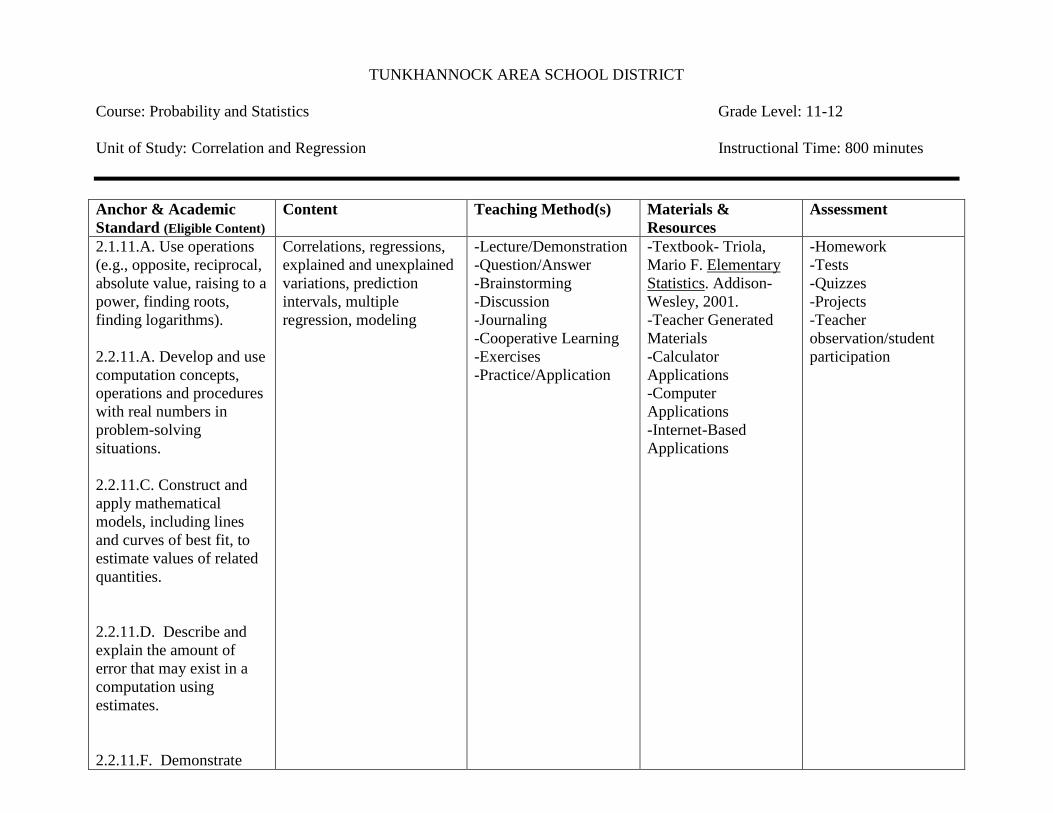
Course: Probability and Statistics Grade Level: 11-12 Unit of Study: Correlation and Regression Instructional Time: 800 minutes Anchor & Academic Standard (Eligible Content)
Content Teaching Method(s) Materials & Resources
Assessment
2.1.11.A. Use operations (e.g., opposite, reciprocal, absolute value, raising to a power, finding roots, finding logarithms). 2.2.11.A. Develop and use computation concepts, operations and procedures with real numbers in problem-solving situations. 2.2.11.C. Construct and apply mathematical models, including lines and curves of best fit, to estimate values of related quantities. 2.2.11.D. Describe and explain the amount of error that may exist in a computation using estimates. 2.2.11.F. Demonstrate
Correlations, regressions, explained and unexplained variations, prediction intervals, multiple regression, modeling
-Lecture/Demonstration -Question/Answer -Brainstorming -Discussion -Journaling -Cooperative Learning -Exercises -Practice/Application
-Textbook- Triola, Mario F. Elementary Statistics. Addison-Wesley, 2001. -Teacher Generated Materials -Calculator Applications -Computer Applications -Internet-Based Applications
-Homework -Tests -Quizzes -Projects -Teacher observation/student participation
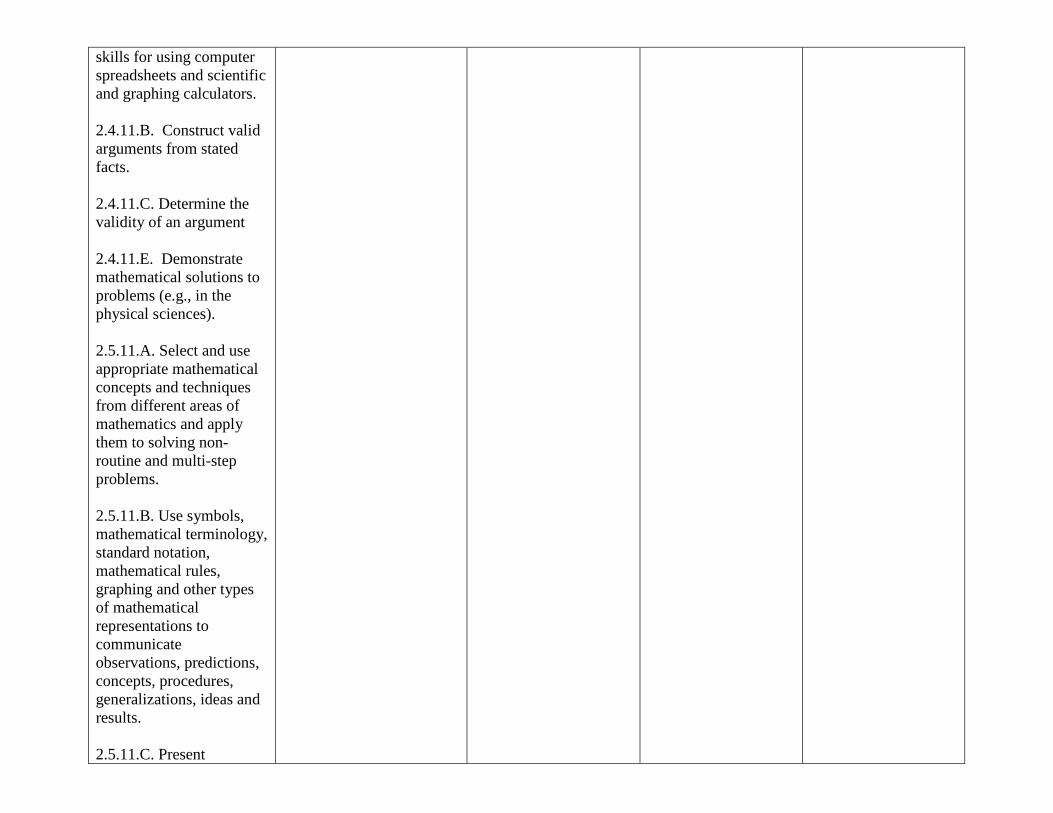
skills for using computer spreadsheets and scientific and graphing calculators. 2.4.11.B. Construct valid arguments from stated facts. 2.4.11.C. Determine the validity of an argument 2.4.11.E. Demonstrate mathematical solutions to problems (e.g., in the physical sciences). 2.5.11.A. Select and use appropriate mathematical concepts and techniques from different areas of mathematics and apply them to solving non-routine and multi-step problems. 2.5.11.B. Use symbols, mathematical terminology, standard notation, mathematical rules, graphing and other types of mathematical representations to communicate observations, predictions, concepts, procedures, generalizations, ideas and results. 2.5.11.C. Present

mathematical procedures and results clearly, systematically, succinctly and correctly. 2.5.11.D. Conclude a solution process with a summary of results and evaluate the degree to which the results obtained represent an acceptable response to the initial problem and why the reasoning is valid. 2.6.11.C. Determine the regression equation of best fit (e.g., linear, quadratic, exponential). 2.6.11.D. Make predictions using interpolation, extrapolation, regression and estimation using technology to verify them. 2.6.11.F. Determine the degree of dependence of two quantities specified by a two-way table. 2.6.11.H. Use sampling techniques to draw inferences about large populations. 2.7.11.B. Apply probability and statistics to
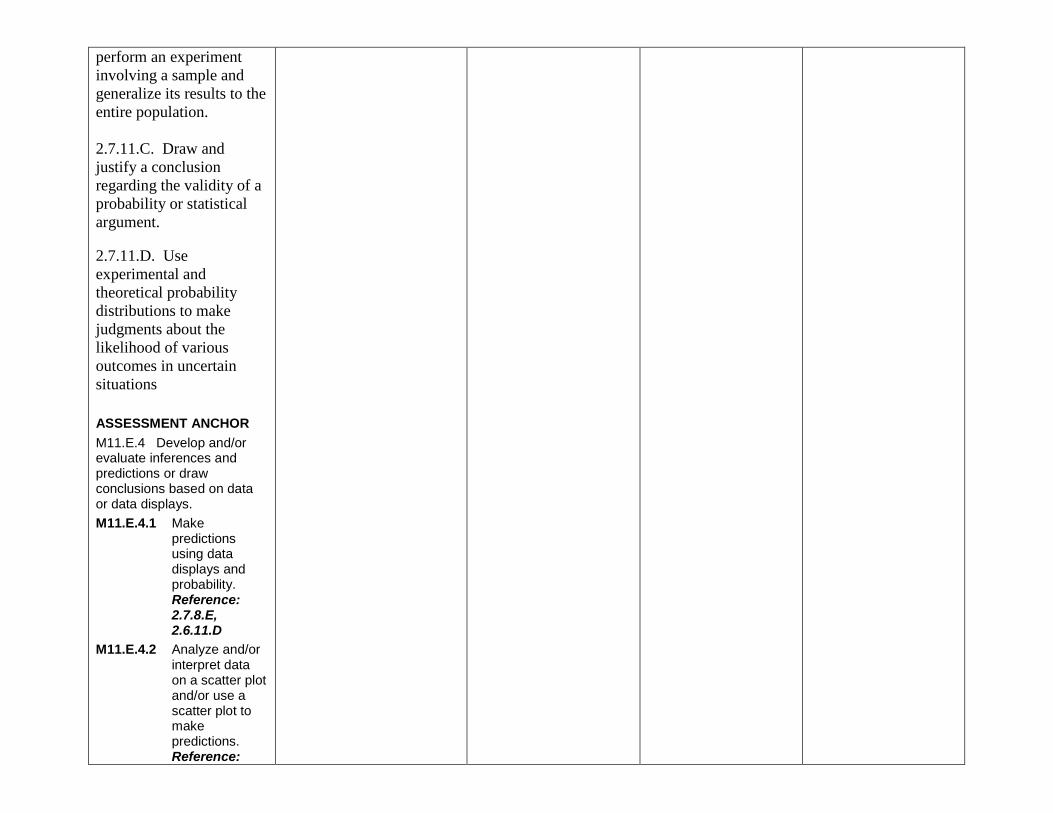
perform an experiment involving a sample and generalize its results to the entire population. 2.7.11.C. Draw and justify a conclusion regarding the validity of a probability or statistical argument. 2.7.11.D. Use experimental and theoretical probability distributions to make judgments about the likelihood of various outcomes in uncertain situations ASSESSMENT ANCHOR M11.E.4 Develop and/or evaluate inferences and predictions or draw conclusions based on data or data displays. M11.E.4.1 Make
predictions using data displays and probability. Reference: 2.7.8.E, 2.6.11.D
M11.E.4.2 Analyze and/or interpret data on a scatter plot and/or use a scatter plot to make predictions. Reference:

2.6.11.C, 2.6.11.D
TUNKHANNOCK AREA SCHOOL DISTRICT
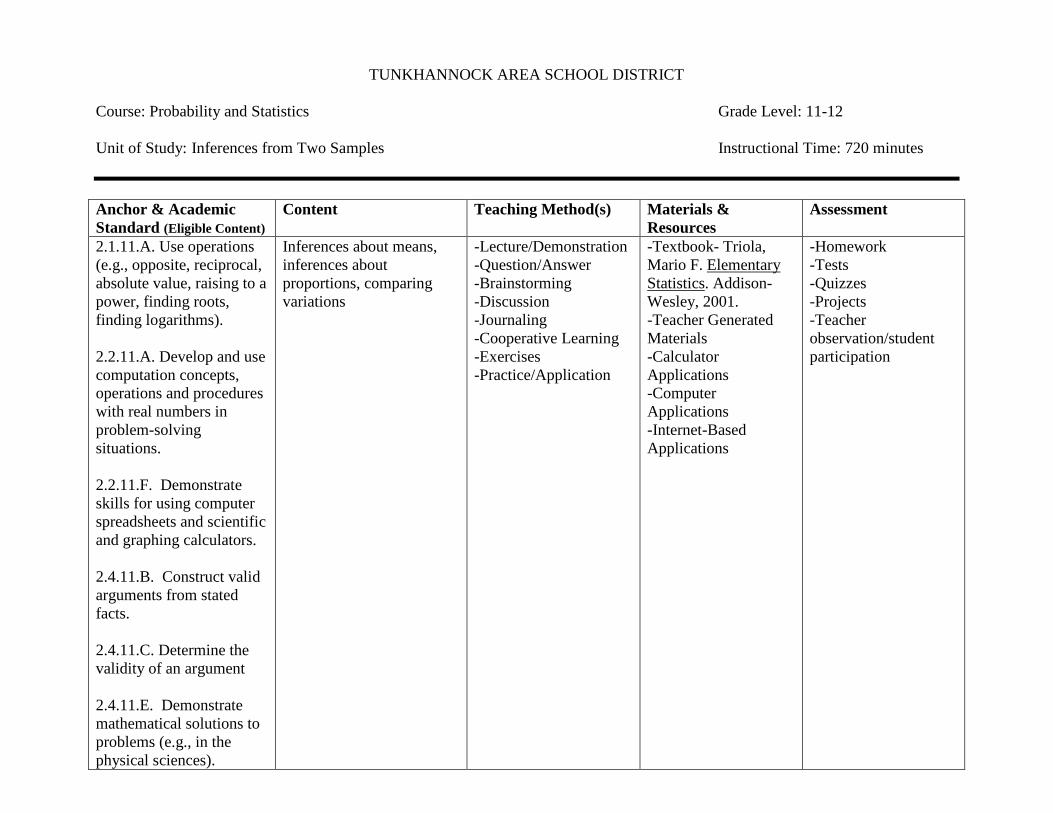
Course: Probability and Statistics Grade Level: 11-12 Unit of Study: Inferences from Two Samples Instructional Time: 720 minutes Anchor & Academic Standard (Eligible Content)
Content Teaching Method(s) Materials & Resources
Assessment
2.1.11.A. Use operations (e.g., opposite, reciprocal, absolute value, raising to a power, finding roots, finding logarithms). 2.2.11.A. Develop and use computation concepts, operations and procedures with real numbers in problem-solving situations. 2.2.11.F. Demonstrate skills for using computer spreadsheets and scientific and graphing calculators. 2.4.11.B. Construct valid arguments from stated facts. 2.4.11.C. Determine the validity of an argument 2.4.11.E. Demonstrate mathematical solutions to problems (e.g., in the physical sciences).
Inferences about means, inferences about proportions, comparing variations
-Lecture/Demonstration -Question/Answer -Brainstorming -Discussion -Journaling -Cooperative Learning -Exercises -Practice/Application
-Textbook- Triola, Mario F. Elementary Statistics. Addison-Wesley, 2001. -Teacher Generated Materials -Calculator Applications -Computer Applications -Internet-Based Applications
-Homework -Tests -Quizzes -Projects -Teacher observation/student participation
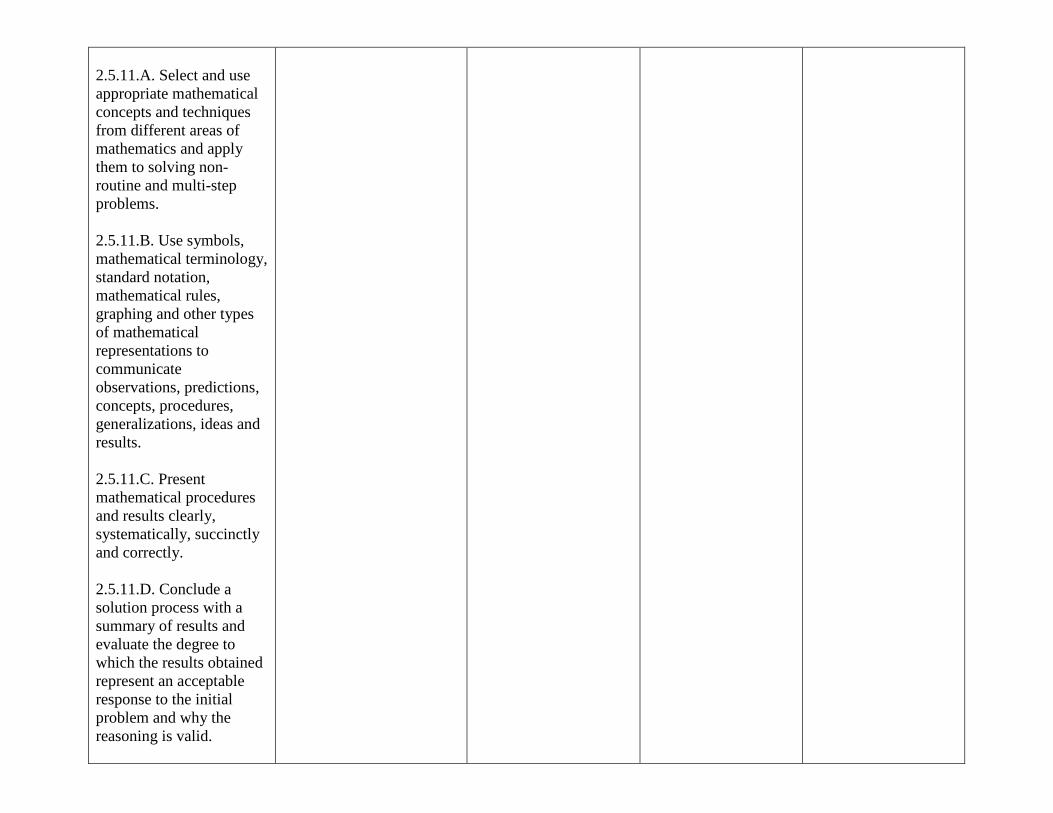
2.5.11.A. Select and use appropriate mathematical concepts and techniques from different areas of mathematics and apply them to solving non-routine and multi-step problems. 2.5.11.B. Use symbols, mathematical terminology, standard notation, mathematical rules, graphing and other types of mathematical representations to communicate observations, predictions, concepts, procedures, generalizations, ideas and results. 2.5.11.C. Present mathematical procedures and results clearly, systematically, succinctly and correctly. 2.5.11.D. Conclude a solution process with a summary of results and evaluate the degree to which the results obtained represent an acceptable response to the initial problem and why the reasoning is valid.
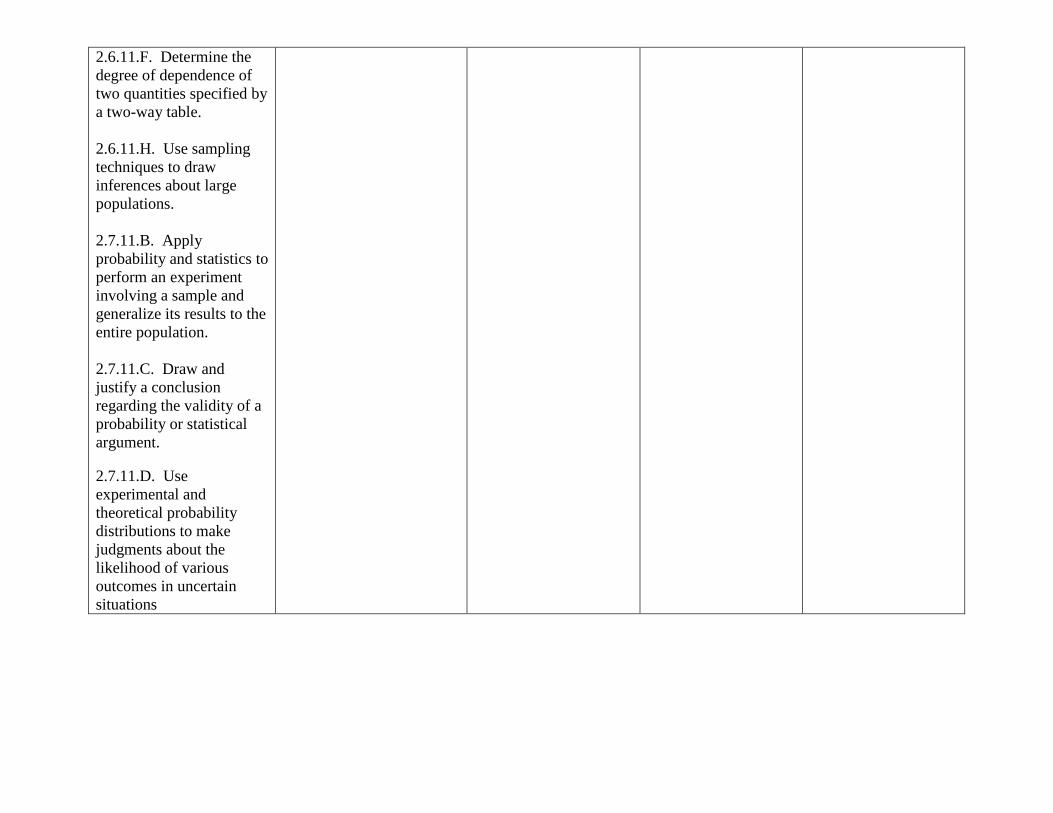
2.6.11.F. Determine the degree of dependence of two quantities specified by a two-way table. 2.6.11.H. Use sampling techniques to draw inferences about large populations. 2.7.11.B. Apply probability and statistics to perform an experiment involving a sample and generalize its results to the entire population. 2.7.11.C. Draw and justify a conclusion regarding the validity of a probability or statistical argument. 2.7.11.D. Use experimental and theoretical probability distributions to make judgments about the likelihood of various outcomes in uncertain situations