Embed Size (px)
Citation preview
COURSE: TELECOMMUNICATIONCOURSE: TELECOMMUNICATIONECONOMICSECONOMICS
PROFESSOR: WUHONGPROFESSOR: WUHONG
School of Economics and Management BUPT School of Economics and Management BUPT Economics Research CenterEconomics Research Center
(MING GUANG 504) (MING GUANG 504)
Tel:13621050170Tel:13621050170 Email: [email protected] Email: [email protected]
Chapter 4 Communication Chapter 4 Communication
MarketMarket
INDEX The Overview Of the Communication Market The Trend of the World Telecommunication
Market The Structure of the Telecommunication Market The Analysis of the Operation The Analysis of the Market Behavior The Evaluation of the Market performance
SECTION 1 The Overview Of SECTION 1 The Overview Of the Communication Marketthe Communication Market
Communication Market The classification of communication market The character of the communication market
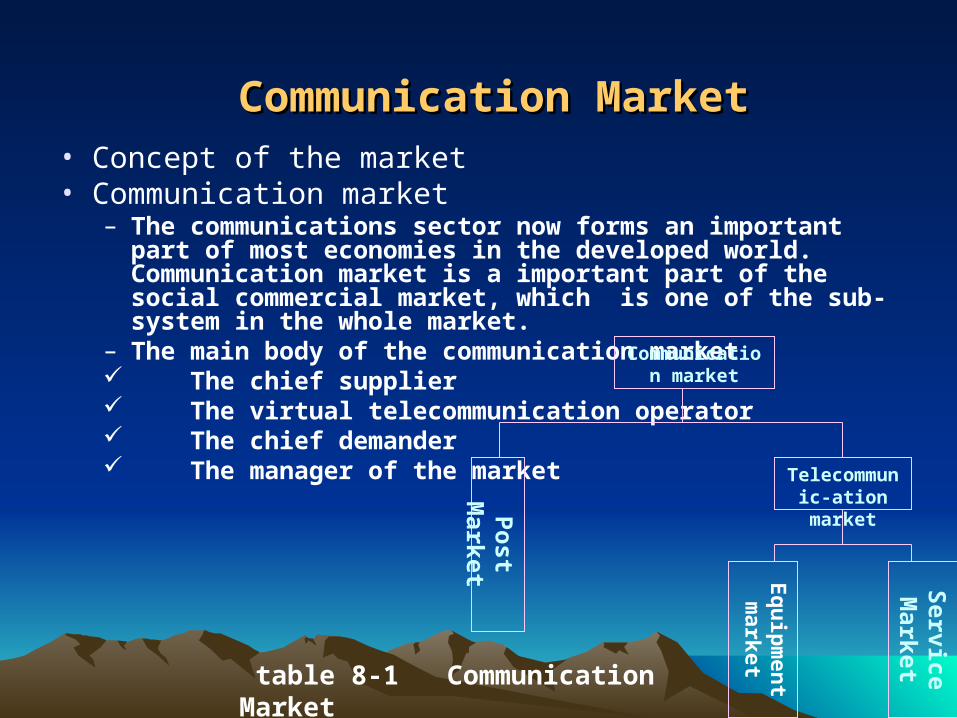
Communication MarketCommunication Market• Concept of the market• Communication market
– The communications sector now forms an important part of most economies in the developed world. Communication market is a important part of the social commercial market, which is one of the sub-system in the whole market.
– The main body of the communication market The chief supplier The virtual telecommunication operator The chief demander The manager of the market
Communication market
Post M
arket
Telecommunic-ation market
Eq
uip
men
tm
arket
Service M
arket table 8-1 Communication
Market
Mobile virtual network operatorMobile virtual network operator
• Virtual operator A service operator that does not directly or indirectly own the network it uses, but it owns some critical network elements. A virtual operator is liable for its products and services, pricing and customer service. The company leases the mobile communication network from the network provider, which is in responsible for the functioning of the network.
• Early An MVNO is a company that sells mobile phone service by making use of another
company's existing network infrastructure. An MVNO will have its own rates and calling plan features, its own billing system, and its own customer service department. It is not, however, responsible for where cell towers are placed and has no control over coverage issues in general. An MVNO will typically pay its host carrier a greatly discounted rate for the time that its users make use of the host's network, which allows it to make a profit of its own as a reseller. The host network benefits by being able to profit from otherwise unused network capacity without having to spend the marketing and customer service dollars required to increase its own subscriber base.
The classification of the The classification of the communication marketcommunication market
• According to general sense and narrow senseGeneral: communication equipment market and communication
service market Narrow: communication service market
• According to specialtyPost communication market and telecommunication marketAccording to geography areaInternational communication market and domestic communication
marketAccording to consumer
– Individual consumption market and group consumption market– Real demand market and potential demand market
SECTION2 The SECTION2 The Character of the Character of the
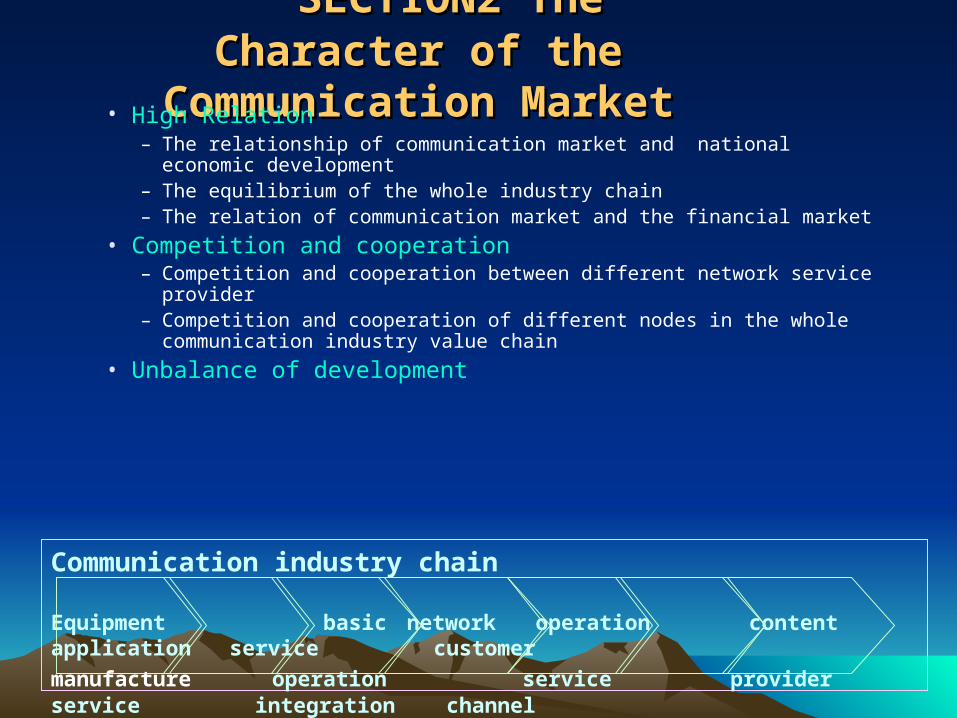
Communication MarketCommunication Market• High Relation – The relationship of communication market and national economic development– The equilibrium of the whole industry chain– The relation of communication market and the financial market
• Competition and cooperation– Competition and cooperation between different network service provider – Competition and cooperation of different nodes in the whole communication
industry value chain
• Unbalance of development
Communication industry chain
Equipment basic network operation content application service customer
manufacture operation service provider service integration channel
Telecommunication value chainTelecommunication value chain
• Value chain In order to understand that concept, let’s look at the basic
idea of a value chain. This concept was first put forward by Michael Porter, who wrote about it in his book Competitive Advantage: Creating and Sustaining Superior Performance (1985). Simply stated, a value chain is the recognition that the value of a product is not created out of nothing by a manufacturer and delivered to the end user for a price. Component vendors, distributors, retailers, and end users all contribute value.
Telecommunication value chainTelecommunication value chain
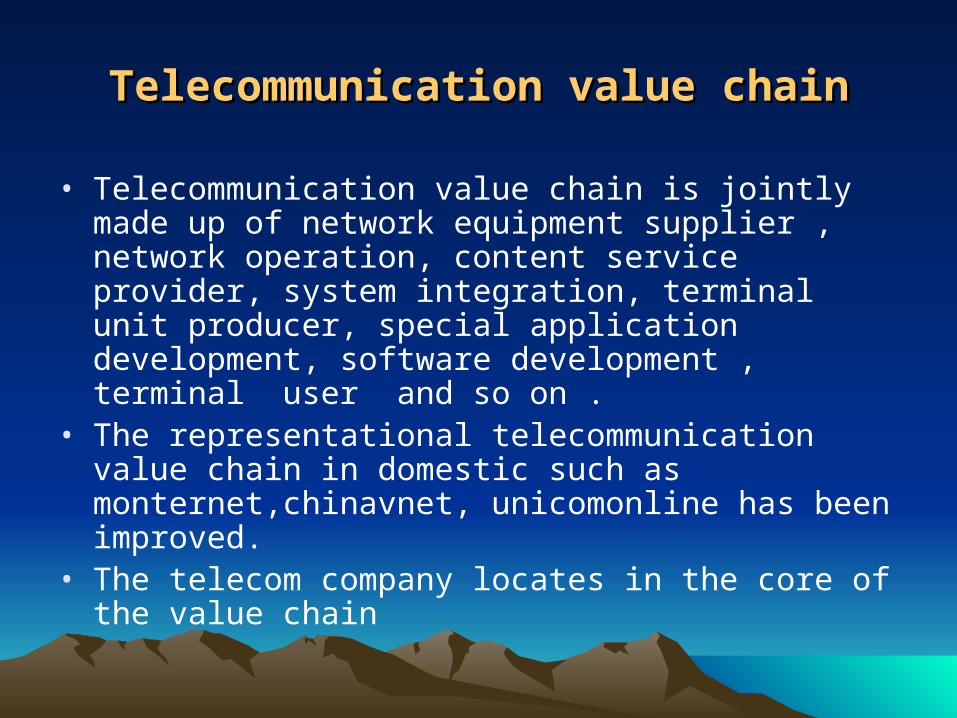
• Telecommunication value chain is jointly made up of network equipment supplier , network operation, content service provider, system integration, terminal unit producer, special application development, software development , terminal user and so on .
• The representational telecommunication value chain in domestic such as monternet,chinavnet, unicomonline has been improved.
• The telecom company locates in the core of the value chain
The development of The development of telecommunication value chaintelecommunication value chain
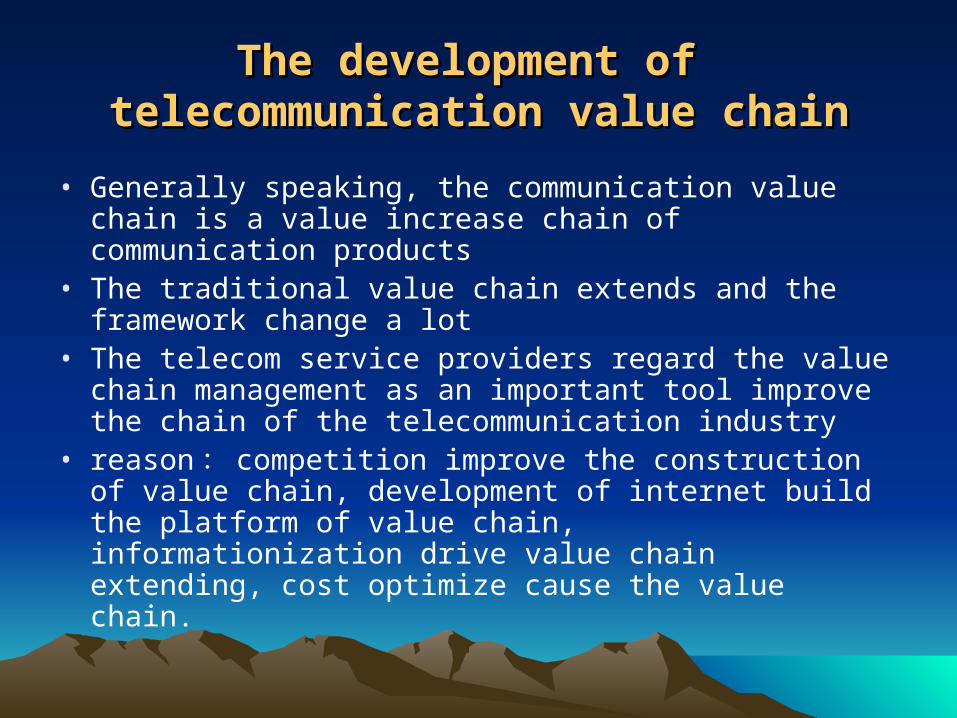
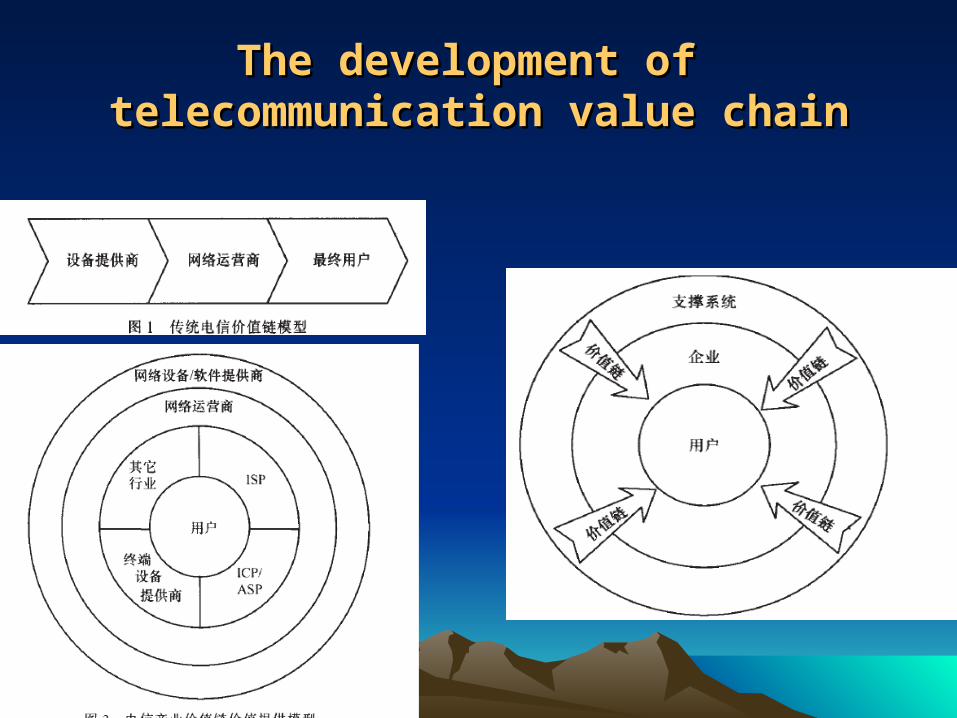
• Generally speaking, the communication value chain is a value increase chain of communication products
• The traditional value chain extends and the framework change a lot
• The telecom service providers regard the value chain management as an important tool improve the chain of the telecommunication industry
• reason : competition improve the construction of value chain, development of internet build the platform of value chain, informationization drive value chain extending, cost optimize cause the value chain.
The development of The development of telecommunication value chaintelecommunication value chain
Section 2 Telecommunication Section 2 Telecommunication development trenddevelopment trend
• Opening competition
• Transformation of property right
• Globalization trend
• Convergence trend
• Complex consumer demand
Globalization trendGlobalization trend
• Worldwide communications revenue totaled approximately £840bn in 2005 (equating to around £129 for each person on the planet), having grown at an average annual nominal rate of 5.9% since 2001.
• Communication operator has the desire for a deep understanding of the international arena ,which is driven by the ongoing globalization of communications services and business models
• More and more world operators have the growing will to develop abroad.
Convergence trendConvergence trend
Convergence is becoming a global phenomenon, but it is being manifested at different paces and in many different ways. The UK is at the vanguard of bundled services, with over one third of households taking two or more communications services from one provider. However, converged platform services like VoIP and IPTV are taking off in countries like France, Italy and Japan at a much faster rate than in the UK.
There is evidence that increasing convergence of communications services is beginning to have an impact on traditional media consumption.
Across the world, 18-24 year olds are leading the transition to convergence. More and more broadband users download television programmes and clips over the internet.
With broadband becoming more widespread, the internet has become an increasingly important source of advertising expenditure
Convergence trendConvergence trend
Convergence is a widely-used and wide-ranging phrase, and can take many forms:
Device convergence allows consumers to access many different services from the same device, even if they are delivered over different platforms (an example might be a mobile phone with an integrated FM radio).
Billing convergence means that consumers can receive many different services on the same bill and possibly deal with one customer support centre; this type of convergence also allows operators to offer bundled pricing of products, as a means to attract and retain multi-service customers (for example a combined cable TV/fixed-line bundle).
Convergence trendConvergence trend
Platform convergence is the most advanced – and fastest-growing – form of convergence. It enables consumers to access multiple products and services over a single platform, and often over one device, with a single operator relationship. Examples of this include voice over internet protocol (VoIP) telephony – both fixed and mobile –and TV over mobile devices.
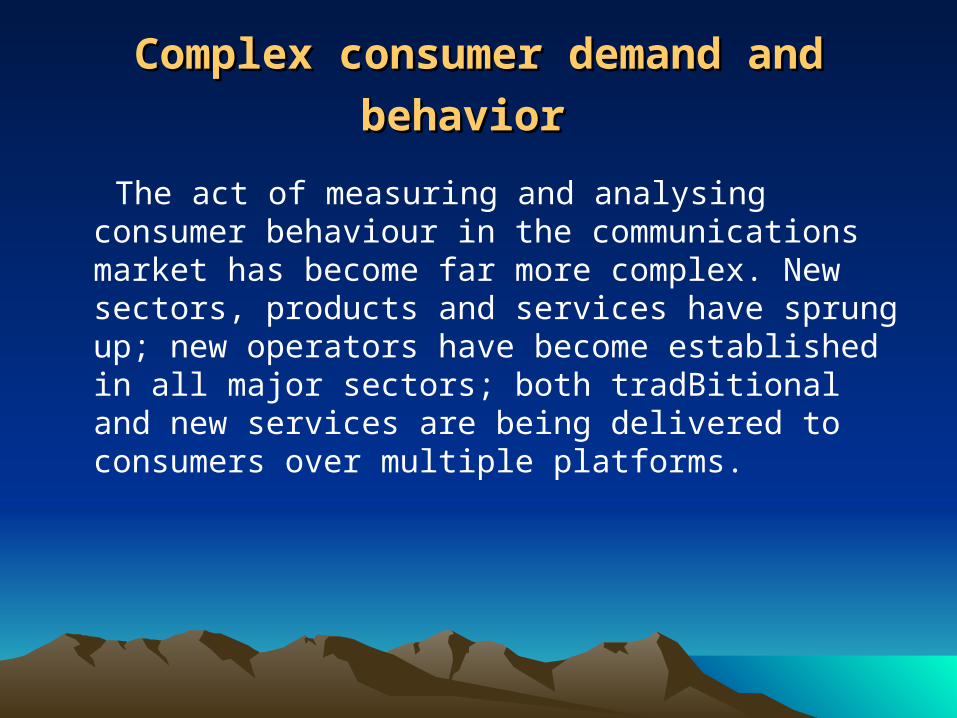
Complex consumer demand and Complex consumer demand and
behaviorbehavior The act of measuring and analysing consumer behaviour in the
communications market has become far more complex. New sectors, products and services have sprung up; new operators have become established in all major sectors; both tradBitional and new services are being delivered to consumers over multiple platforms.
Section 3 The Structure of the Section 3 The Structure of the Telecommunication Market and Telecommunication Market and
the analysis of operationthe analysis of operation
• Market structure
• Main factor deciding the market structure
• The analysis of communication market structure
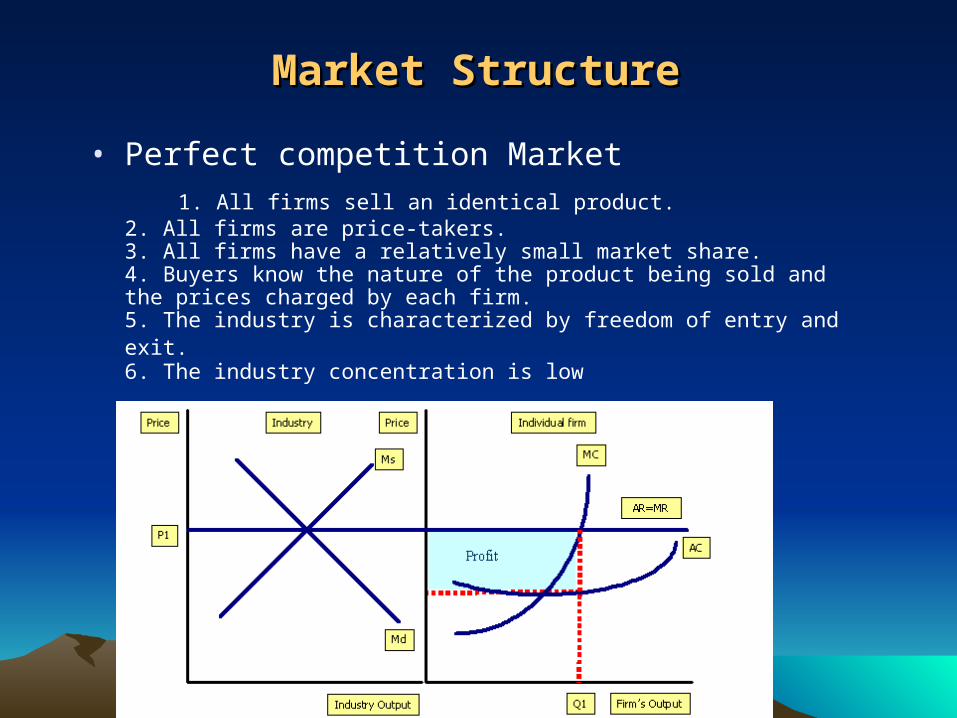
Market StructureMarket Structure • Perfect competition Market
1. All firms sell an identical product. 2. All firms are price-takers. 3. All firms have a relatively small market share. 4. Buyers know the nature of the product being sold and the prices charged by each firm. 5. The industry is characterized by freedom of entry and exit. 6. The industry concentration is low
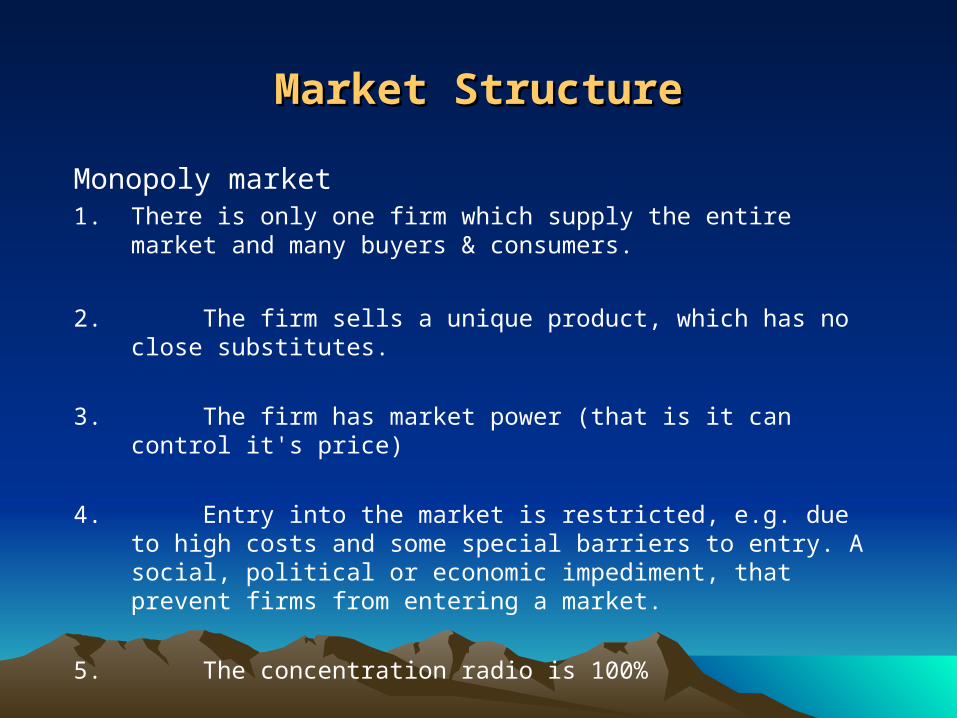
Market StructureMarket Structure
Monopoly market1. There is only one firm which supply the entire market and many
buyers & consumers.
2. The firm sells a unique product, which has no close substitutes.
3. The firm has market power (that is it can control it's price)
4. Entry into the market is restricted, e.g. due to high costs and some special barriers to entry. A social, political or economic impediment, that prevent firms from entering a market.
5. The concentration radio is 100%
Market StructureMarket Structure
Oligopoly1.There are only a few firms that make up an industry.
2.This select group of firms has control over the price and, like a monopoly, an oligopoly has high barriers to entry.
3.The products that the oligopolistic firms produce are often nearly identical and, therefore, the companies, which are competing for market share, are interdependent as a result of market forces.
4. The concentration radio is high

Market StructureMarket Structure
Monopolistic Competition Market
1.There are many firms vying for control of one market.
2.Each firm offers a different type of product, as opposed to perfect competition in which all offer the same product. Each firm, then, has a monopoly in the market of their own product.
3.Thus, the firms try to advertise their products so people buy more of their product. At the same time, monopolistic competitors do not try to compete so as to undermine other competitors.
4.There are too many other businesses in a monopolistic competition to worry about them, you simply try to get people to buy your own product as opposed to respond to others' tactics.
Market StructureMarket Structure
Conclusion : In reality, no such thing as a true perfectly competitive market exists.There are other types of market structures, however: monopoly,oligopoly, and monopolistic competition.
NOTE: What kind of market structure an industry is accounts for how companies operate within it. Unregulated monopolies with no government ties can generally do whatever they want. After all, there's no one else to offer a different sort of service or a different price. In oligopolies, there are few companies so if you were a company and you made some sort of decision, it will always be made to be a strategic tactic made to outmaneuvre your rivals. In monopolistic competition, there are too many companies and so you would just think about yourself and attract customers because what you do will not affect anyone else.
The Measurement of Market The Measurement of Market StructureStructure
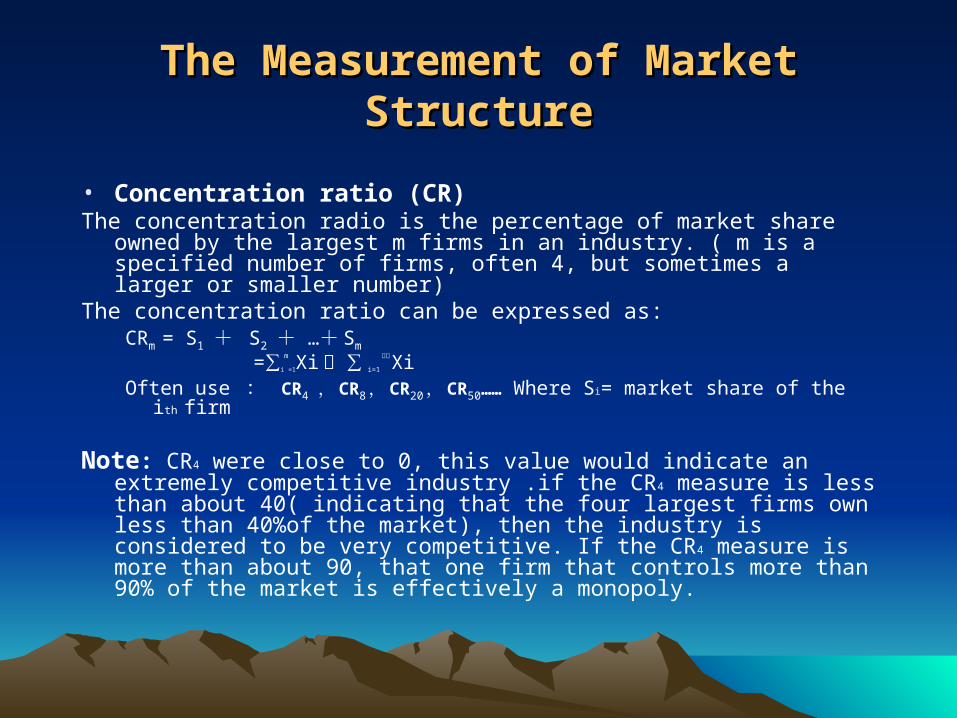
• Concentration ratio (CR)The concentration radio is the percentage of market share owned by the largest m
firms in an industry. ( m is a specified number of firms, often 4, but sometimes a larger or smaller number)
The concentration ratio can be expressed as:CRm = S1 + S2 + …+ Sm
=∑i
m
=1Xi ∑/ i=1
全部Xi
Often use : CR4 , CR8 , CR20 , CR50…… Where Si= market share of the ith firm
Note: CR4 were close to 0, this value would indicate an extremely competitive industry .if the CR4 measure is less than about 40( indicating that the four largest firms own less than 40%of the market), then the industry is considered to be very competitive. If the CR4 measure is more than about 90, that one firm that controls more than 90% of the market is effectively a monopoly.
The Measurement of Market The Measurement of Market StructureStructure
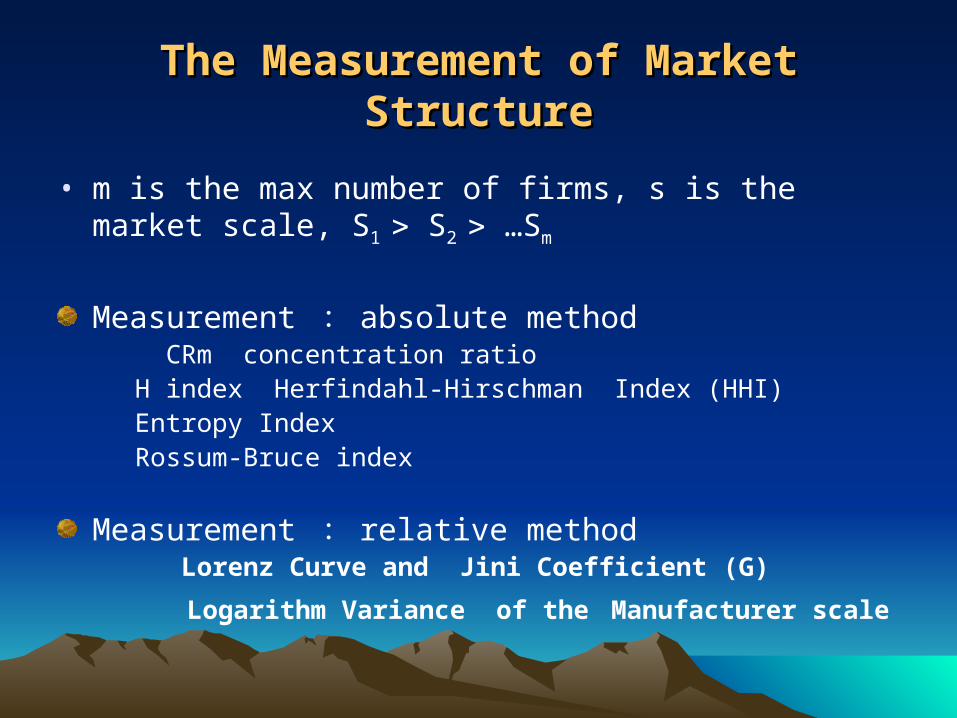
• m is the max number of firms, s is the market scale, S1 S2 …Sm
Measurement : absolute method CRm concentration ratio
H index Herfindahl-Hirschman Index (HHI) Entropy Index Rossum-Bruce index
Measurement : relative method Lorenz Curve and Jini Coefficient (G)
Logarithm Variance of the Manufacturer scale
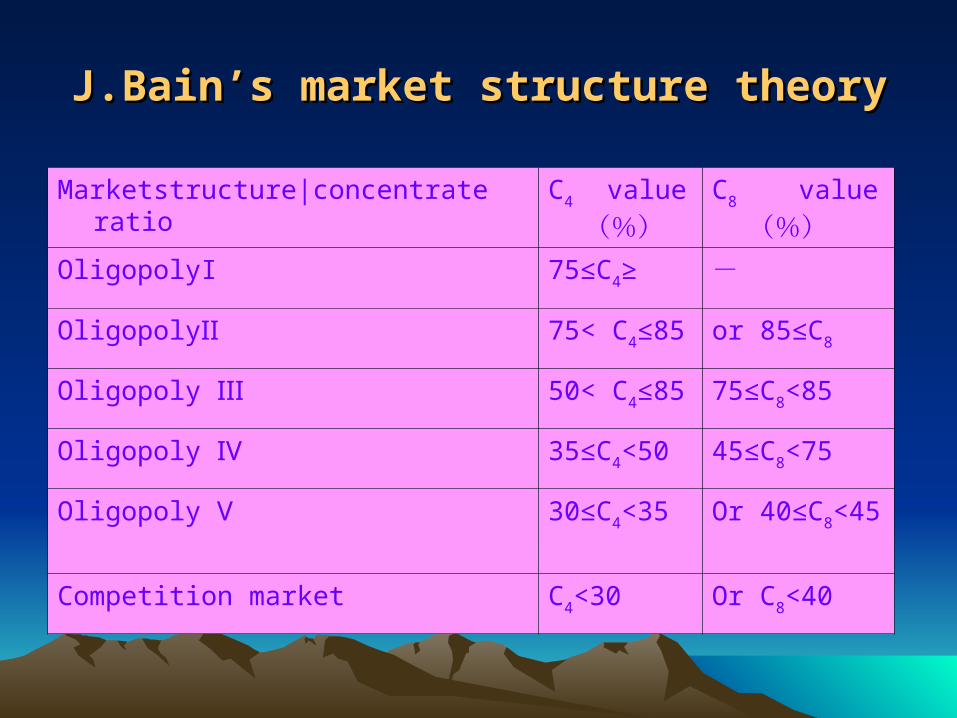
J.Bain’s market structure theoryJ.Bain’s market structure theory
Marketstructure|concentrate ratio C4 value
(%)C8 value
(%)OligopolyΙ 75≤C4≥ -
OligopolyⅡ 75< C4≤85 or 85≤C8
Oligopoly Ⅲ 50< C4≤85 75≤C8<85
Oligopoly Ⅳ 35≤C4<50 45≤C8<75
Oligopoly Ⅴ 30≤C4<35 Or 40≤C8<45
Competition market C4<30 Or C8<40
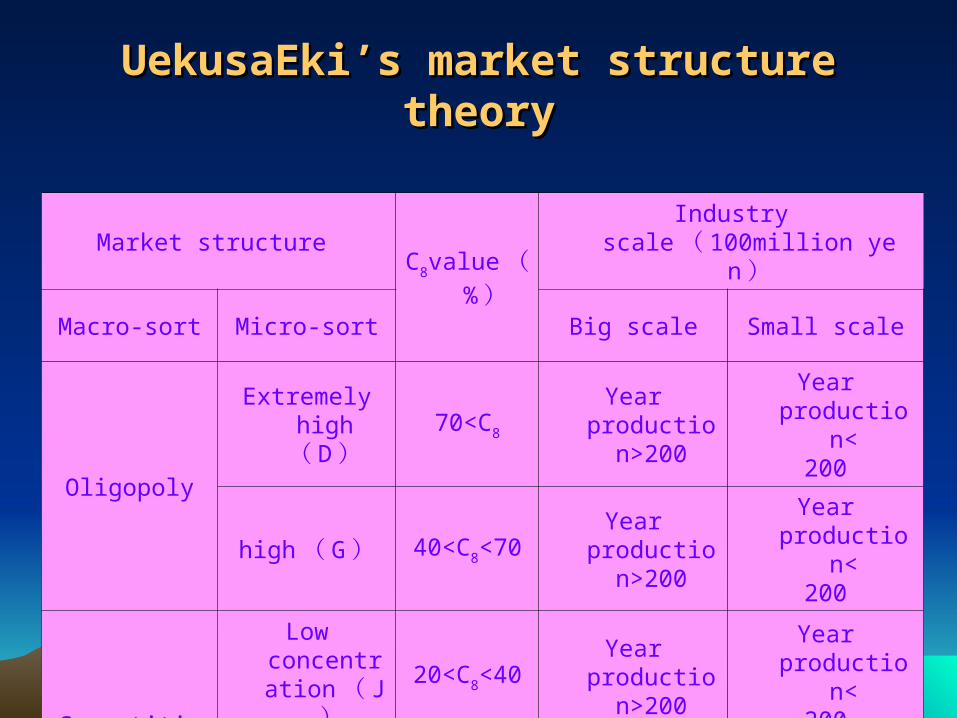
UekusaEki’s market structure UekusaEki’s market structure theorytheory
Market structure C8value (
% )
Industry scale ( 100million yen )
Macro-sort Micro-sort Big scale Small scale
Oligopoly
Extremely high ( D ) 70<C8
Year production>2
00
Year production<200
high ( G ) 40<C8<70Year
production>200
Year production<200
Competition
Low concentratio
n ( J1 )20<C8<40
Year production>2
00
Year production<200
Dispersedcompetition (
J2 )C8<20
Year production>2
00
Year production<200
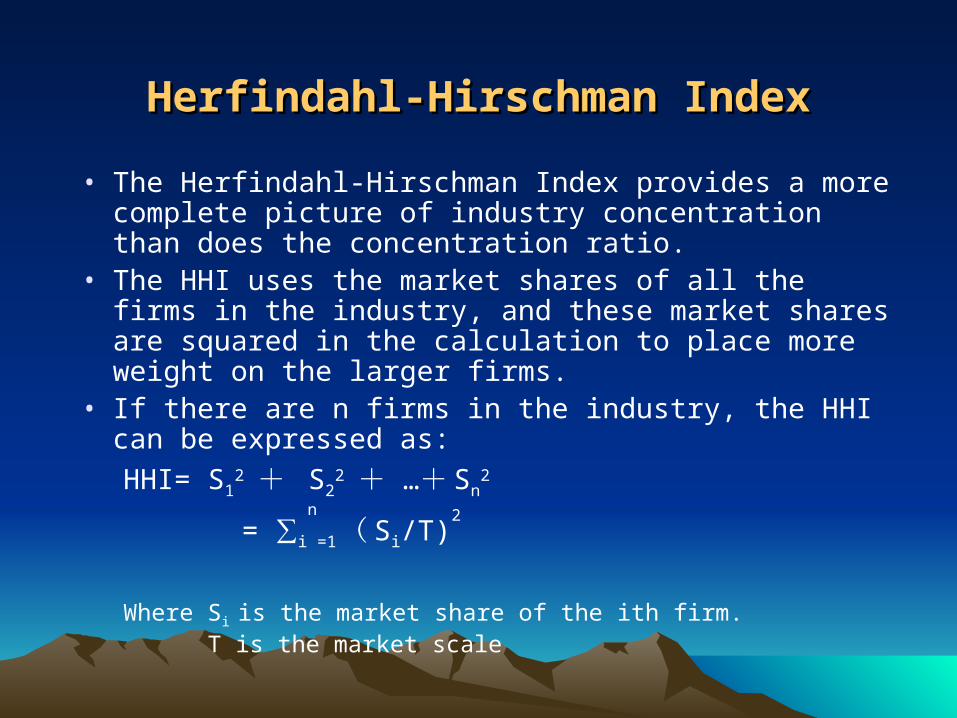
Herfindahl-Hirschman IndexHerfindahl-Hirschman Index
• The Herfindahl-Hirschman Index provides a more complete picture of industry concentration than does the concentration ratio.
• The HHI uses the market shares of all the firms in the industry, and these market shares are squared in the calculation to place more weight on the larger firms.
• If there are n firms in the industry, the HHI can be expressed as:
HHI= S12
+ S22
+ …+ Sn2
= ∑i
n
=1 ( Si/T)2
Where Si is the market share of the ith firm. T is the market scale
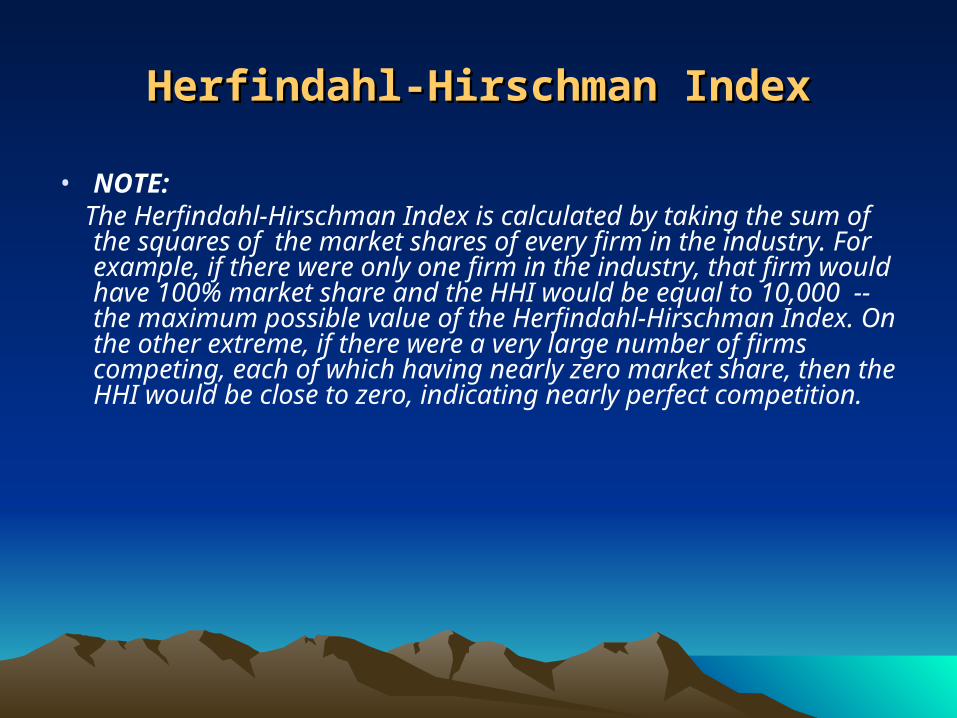
Herfindahl-Hirschman IndexHerfindahl-Hirschman Index
• NOTE: The Herfindahl-Hirschman Index is calculated by taking the sum of the
squares of the market shares of every firm in the industry. For example, if there were only one firm in the industry, that firm would have 100% market share and the HHI would be equal to 10,000 -- the maximum possible value of the Herfindahl-Hirschman Index. On the other extreme, if there were a very large number of firms competing, each of which having nearly zero market share, then the HHI would be close to zero, indicating nearly perfect competition.
The characteristic of H indexThe characteristic of H index
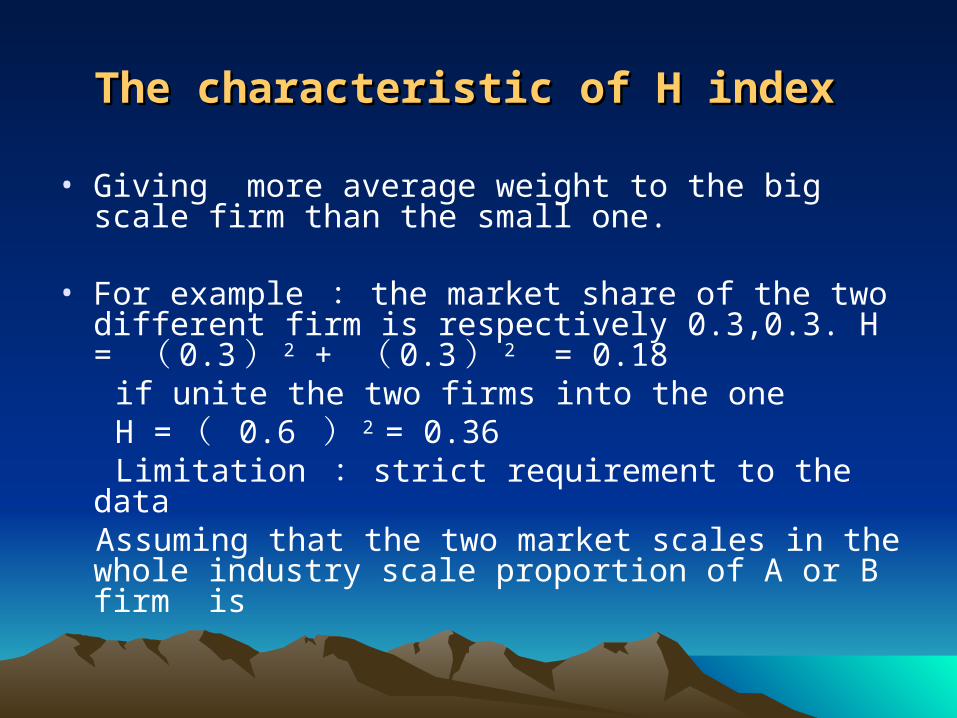
• Giving more average weight to the big scale firm than the small one.
• For example : the market share of the two different firm is respectively 0.3,0.3. H = ( 0.3 ) 2 + ( 0.3 ) 2 = 0.18
if unite the two firms into the one H = ( 0.6 ) 2 = 0.36 Limitation : strict requirement to the data Assuming that the two market scales in the whole industry scale
proportion of A or B firm is
The characteristic of H indexThe characteristic of H index
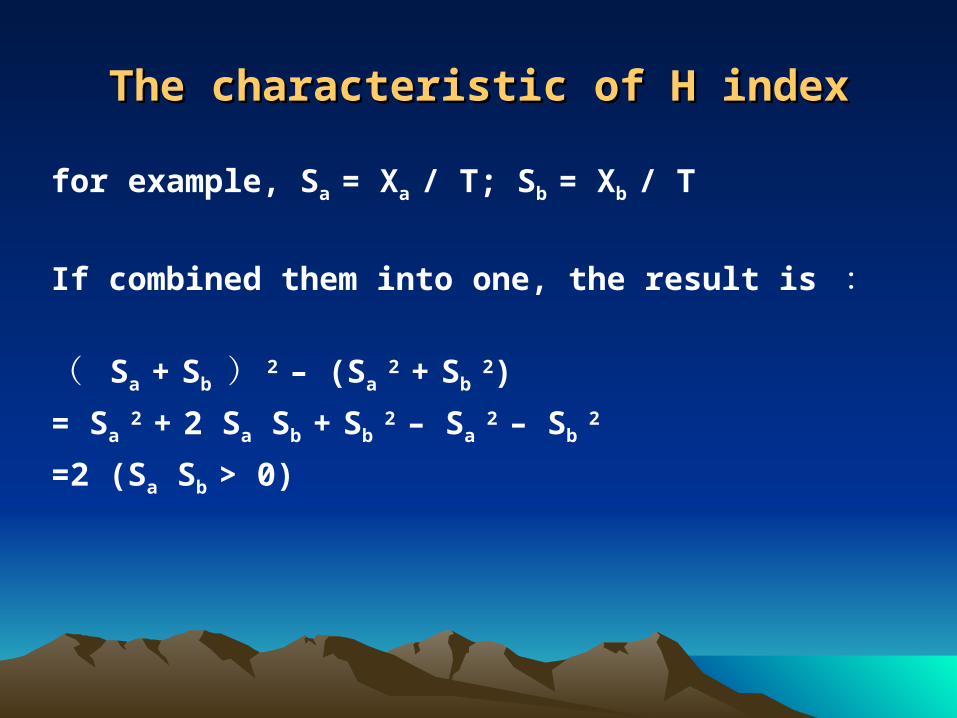
for example, Sa = Xa / T; Sb = Xb / T
If combined them into one, the result is :
( Sa + Sb ) 2 – (Sa 2
+ Sb 2)
= Sa 2
+ 2 Sa Sb + Sb 2 – Sa
2 – Sb
2
=2 (Sa Sb > 0)
The relation of concentration The relation of concentration ratio and H indexratio and H index
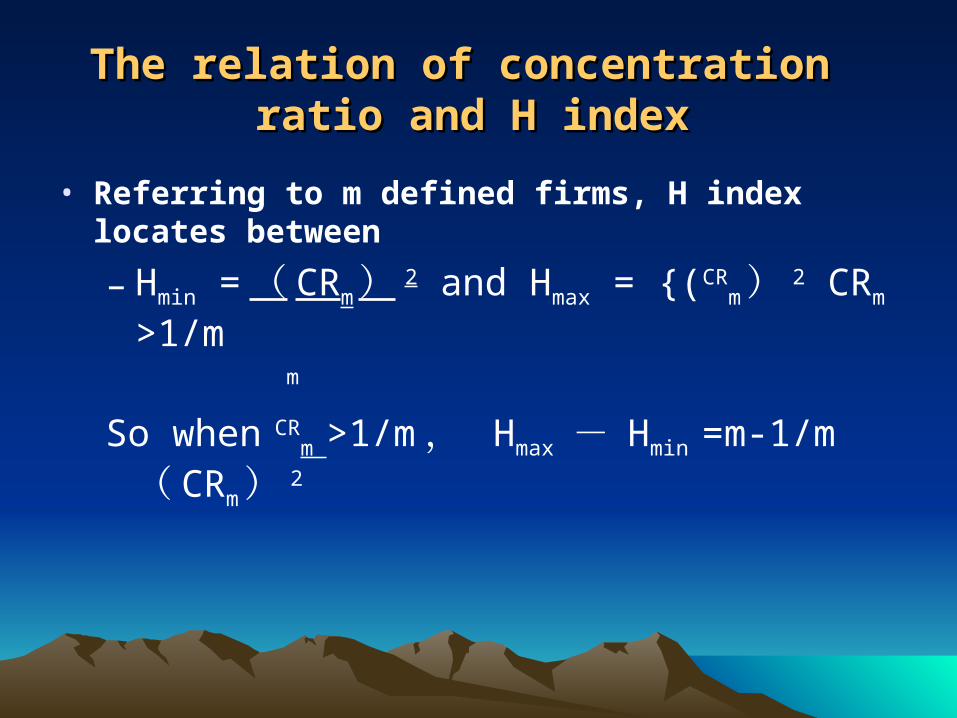
• Referring to m defined firms, H index locates between
– Hmin = ( CRm ) 2 and Hmax = {(CRm ) 2 CRm >1/m
m
So when CRm >1/m , Hmax - Hmin =m-1/m
( CRm ) 2
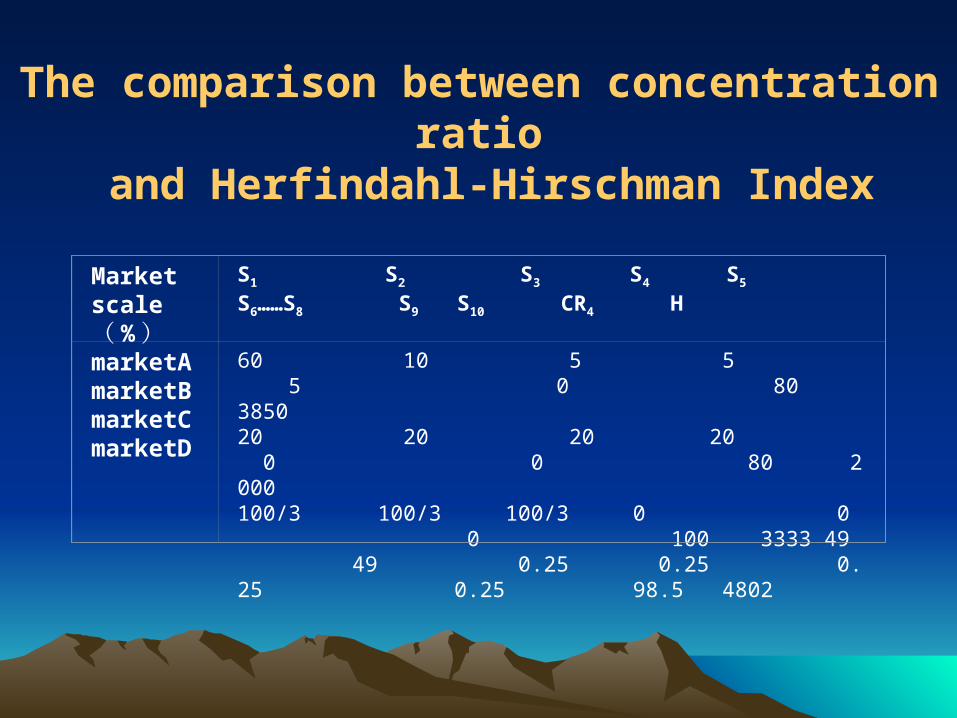
Market scale( % )
S1 S2 S3 S4 S5 S6……S8 S9 S10 CR4 H
marketAmarketBmarketCmarketD
60 10 5 5 5 0 80 385020 20 20 20 0 0 80 2000100/3 100/3 100/3 0 0 0 100 3333 49 49 0.25 0.25 0.25 0.25 98.5 4802
The comparison between concentration ratio
and Herfindahl-Hirschman Index

Entropy IndexEntropy Index
• Entropy Index, borrowing the concept of information theory, having the signification of entropy, which can be expressed as :
• Si is the market share of the ith firm
• n is the firms in the industry
1
log(1/ )n
i ii
EI S S
1
log(1/ )n
i ii
EI S S
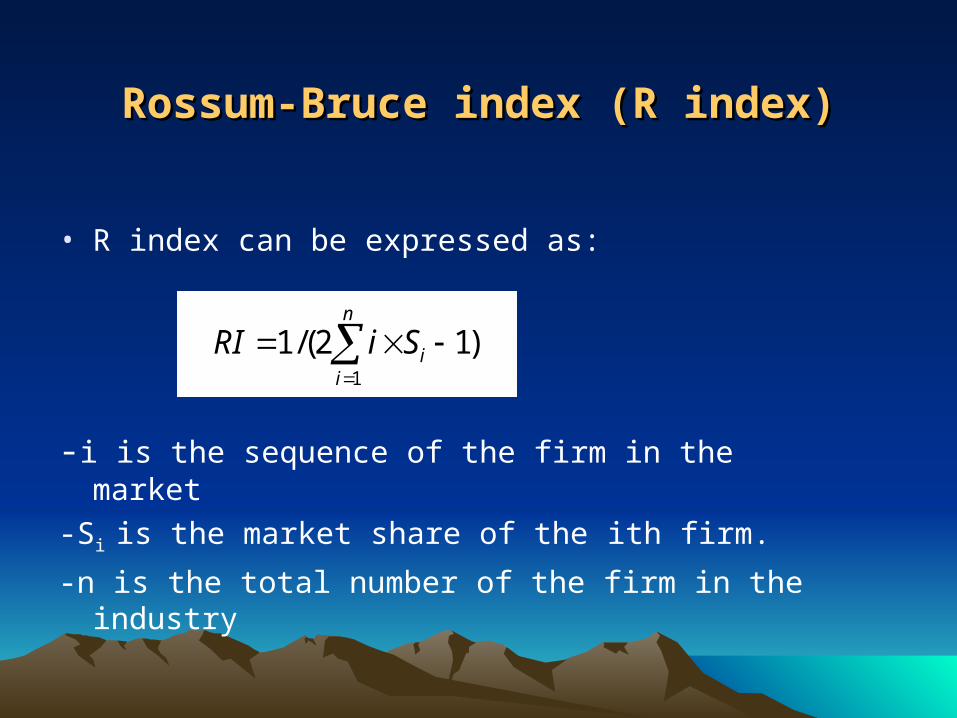
Rossum-Bruce index (R index)Rossum-Bruce index (R index)
• R index can be expressed as:
-i is the sequence of the firm in the market
-Si is the market share of the ith firm.
-n is the total number of the firm in the industry
1
1/(2 1)n
ii
RI i S
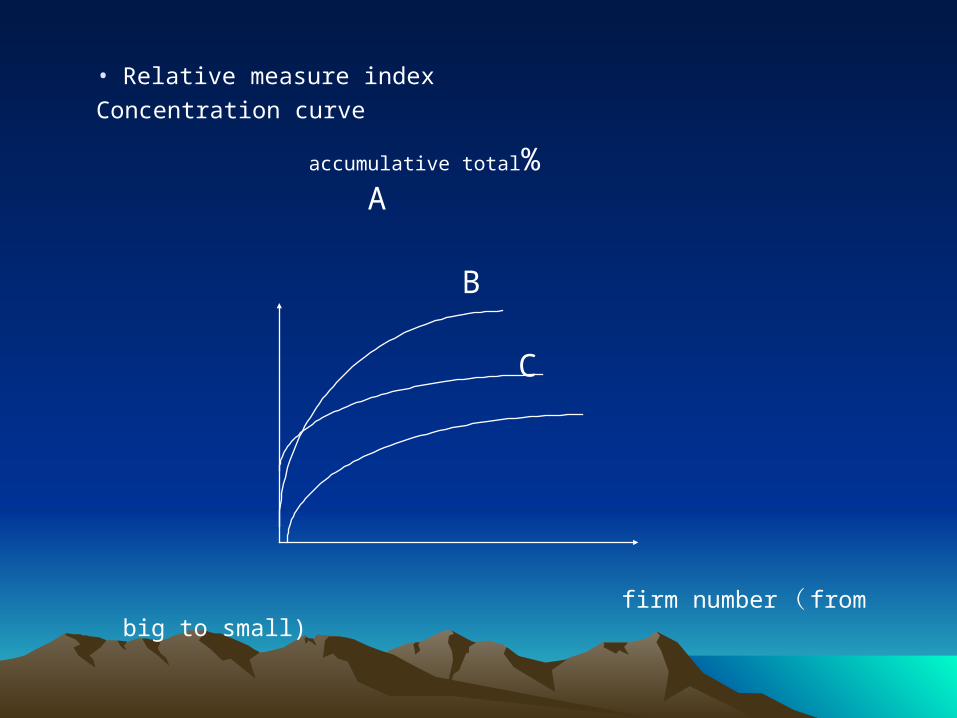
• Relative measure index
Concentration curve
accumulative total% A
B
C
firm number ( from big to small)
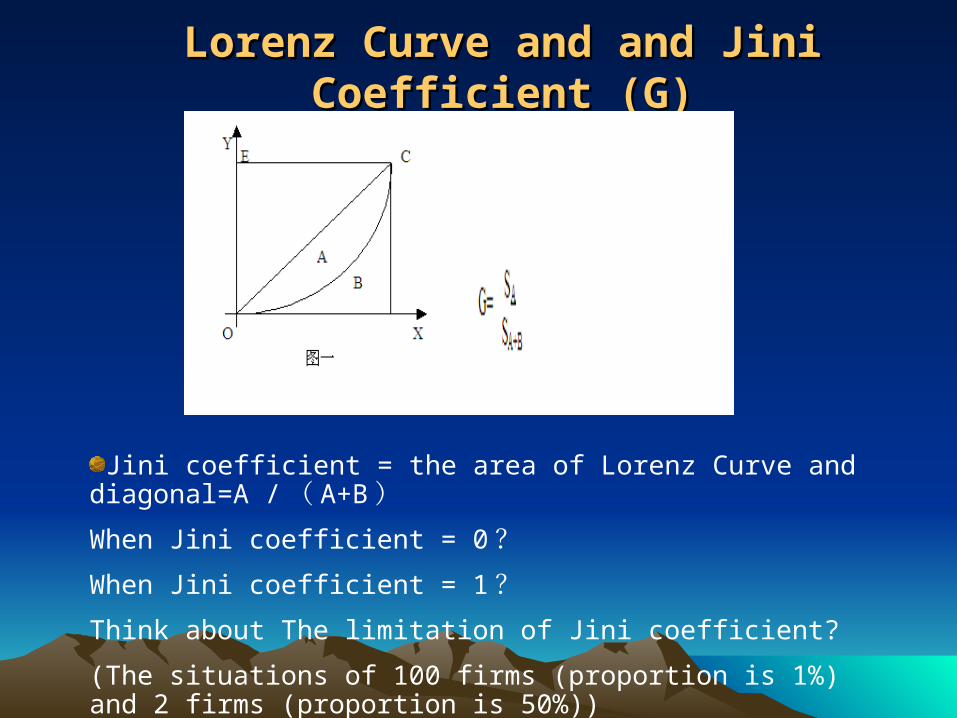
Lorenz Curve and and Jini Lorenz Curve and and Jini CoefficientCoefficient ( (G)G)
Jini coefficient = the area of Lorenz Curve and diagonal=A / ( A+B )
When Jini coefficient = 0 ?When Jini coefficient = 1 ?Think about The limitation of Jini coefficient?
(The situations of 100 firms (proportion is 1%) and 2 firms (proportion is 50%))
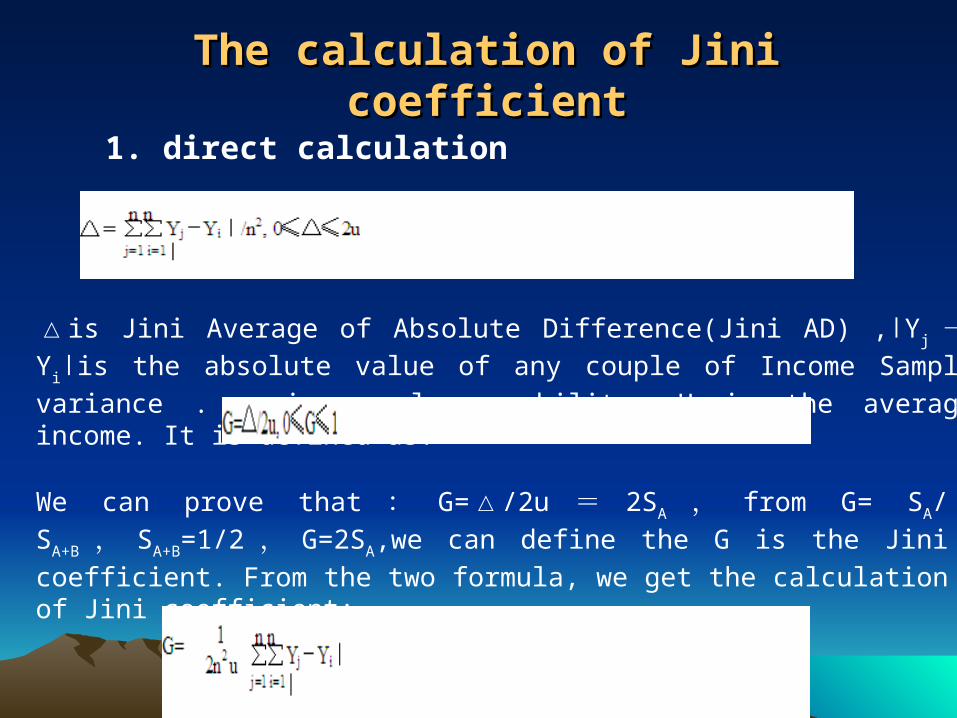
The calculation of Jini The calculation of Jini coefficientcoefficient
1. direct calculation
△ is Jini Average of Absolute Difference(Jini AD) , Y∣ j - Yi is the absolute value of ∣any couple of Income Sample variance . n is sample capability. U is the average income. It is defined as:
We can prove that : G= /2u△ = 2SA , from G= SA/ SA+B , SA+B=1/2 , G=2SA,we
can define the G is the Jini coefficient. From the two formula, we get the calculation of Jini coefficient:
The calculation of Jini The calculation of Jini coefficientcoefficient
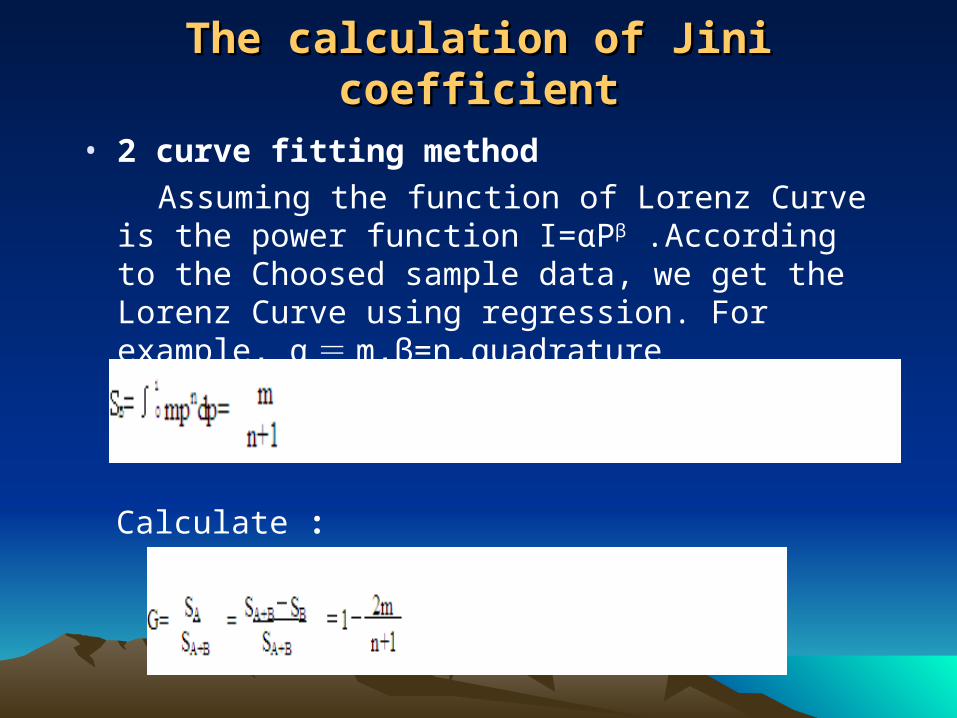
• 2 curve fitting method
Assuming the function of Lorenz Curve is the power function I=αPβ .According to the Choosed sample data, we get the Lorenz Curve using regression. For example, α =m,β=n.quadrature
Calculate :
The calculation of Jini coefficientThe calculation of Jini coefficient
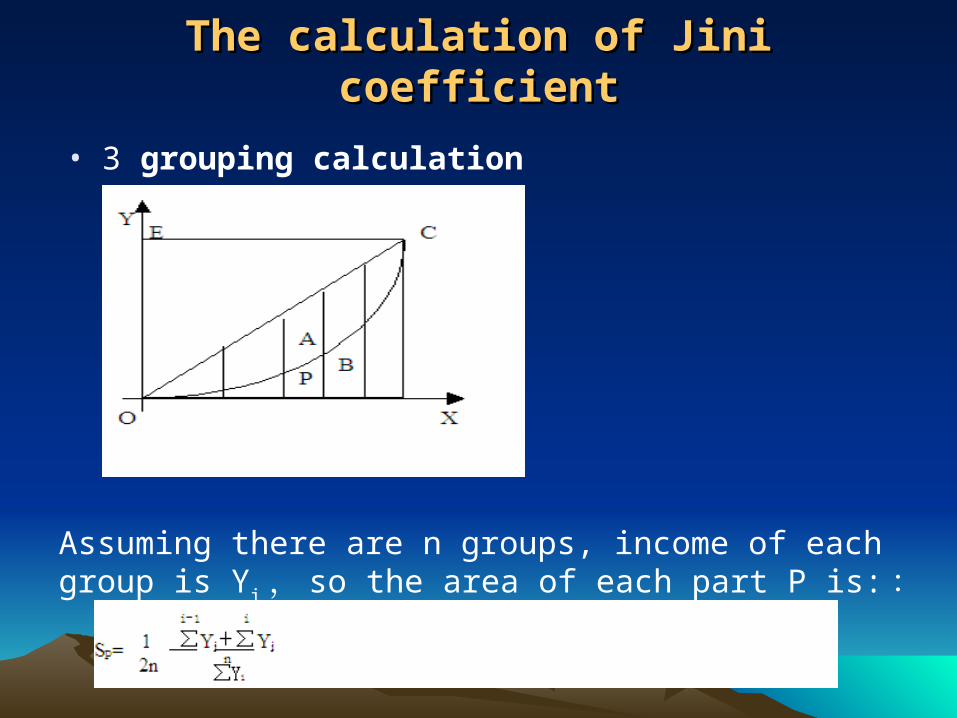
• 3 grouping calculation
Assuming there are n groups, income of each group is Yi , so the
area of each part P is: :
The calculation of Jini coefficientThe calculation of Jini coefficient
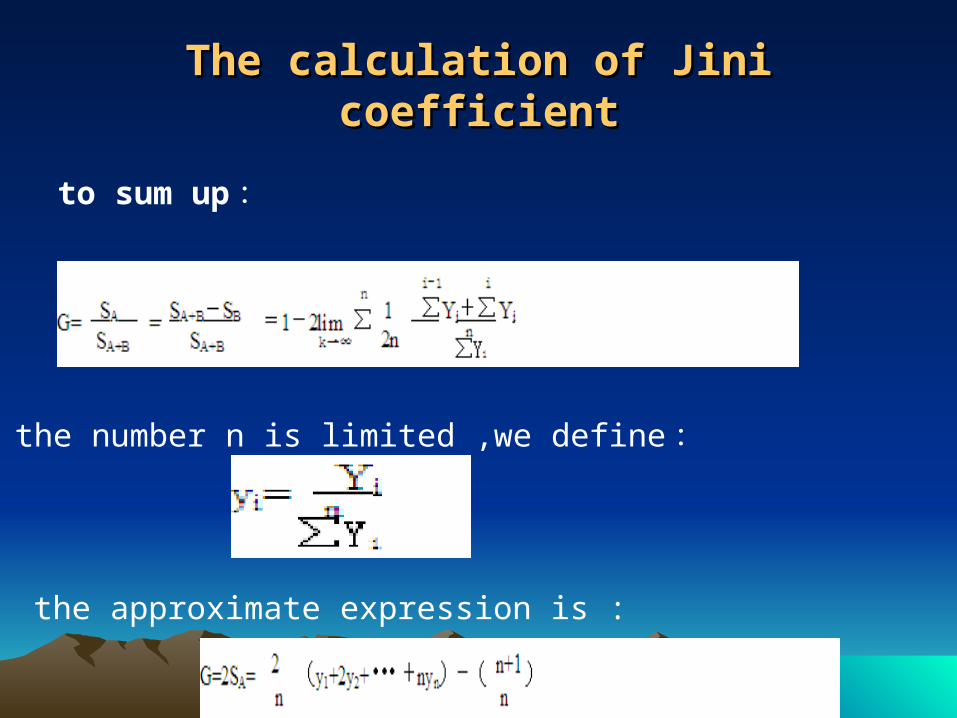
to sum up :
When the number n is limited ,we define :
the approximate expression is :
The calculation of Jini coefficientThe calculation of Jini coefficient
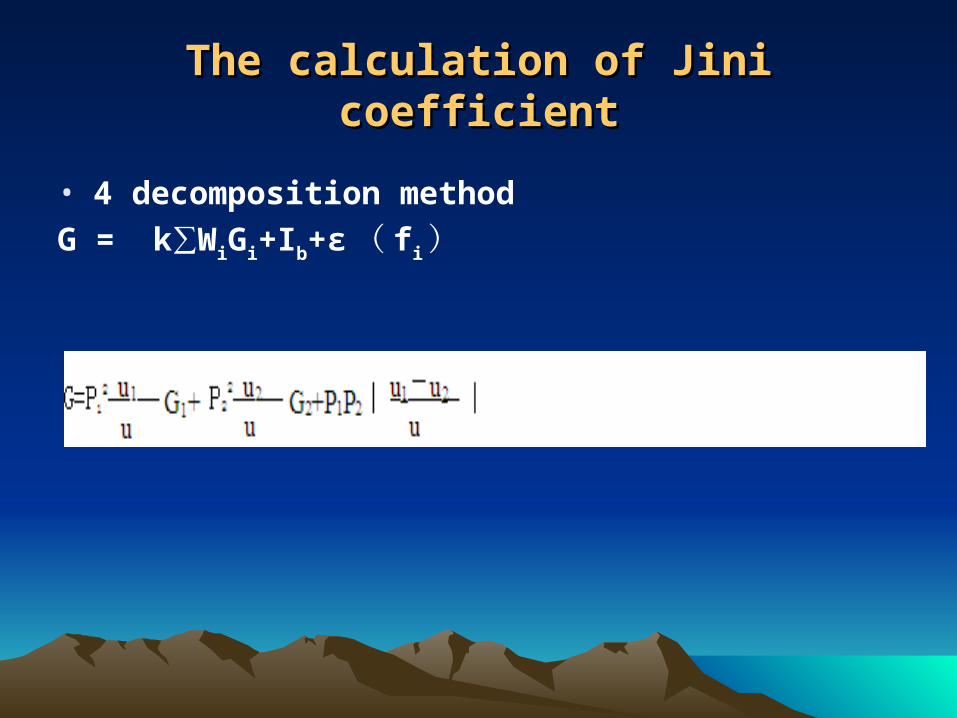
• 4 decomposition method
G = k∑WiGi+Ib+ε ( fi )
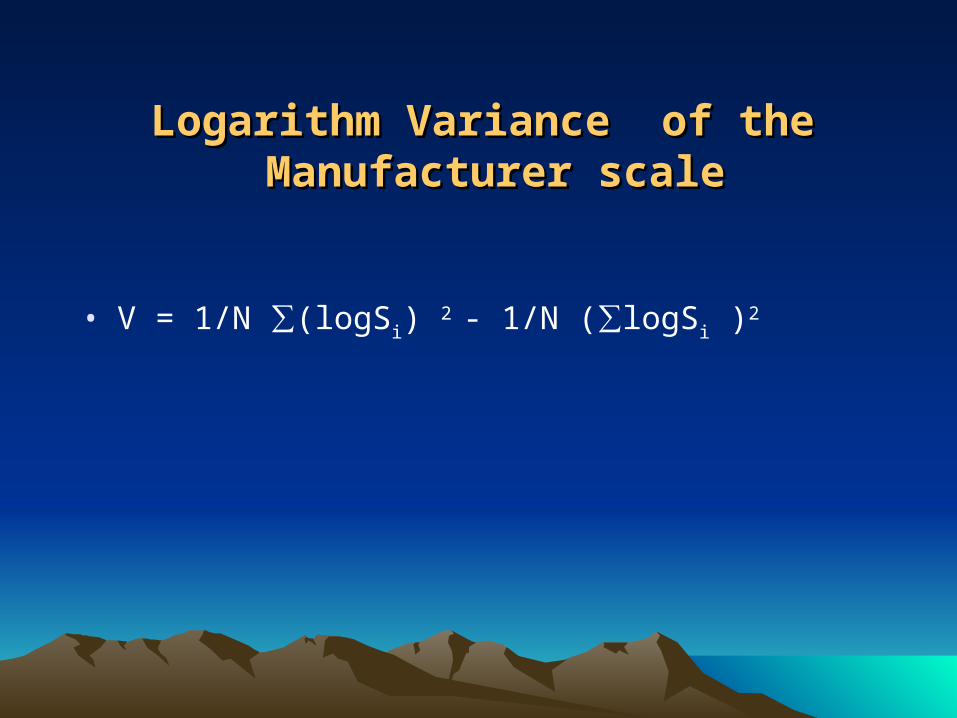
Logarithm Variance of theLogarithm Variance of the Manufacturer scale Manufacturer scale
• V = 1/N ∑(logSi) 2 - 1/N (∑logSi )
2
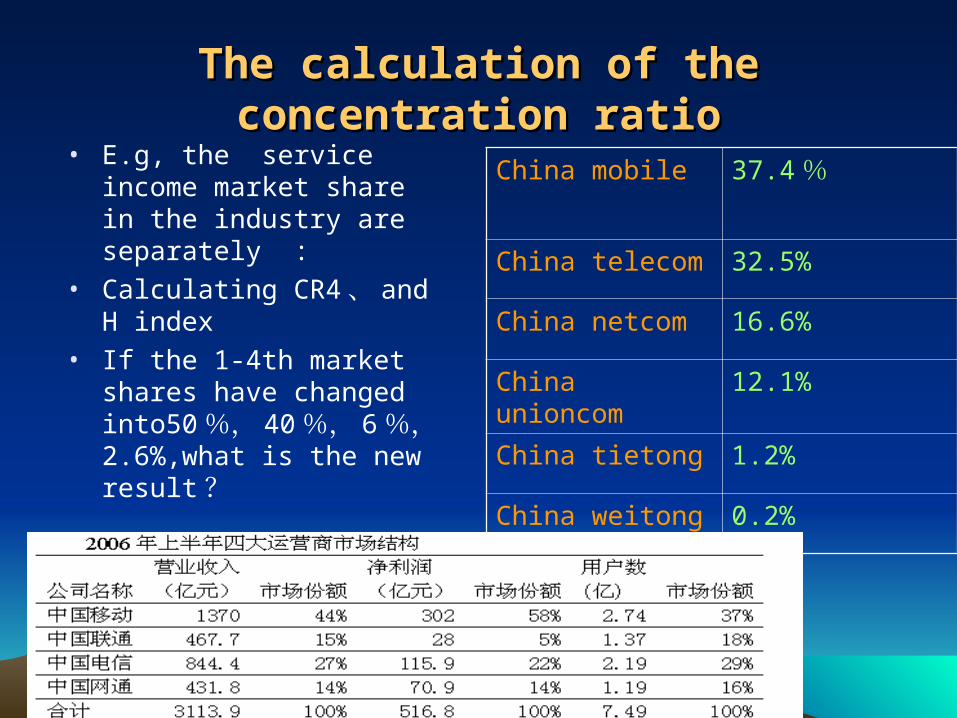
The calculation of the The calculation of the concentration ratioconcentration ratio
• E.g, the service income market share in the industry are separately :
• Calculating CR4 、 and H index
• If the 1-4th market shares have changed into50 %, 40 %, 6%, 2.6%,what is the new result ?
China mobile 37.4 %
China telecom 32.5%
China netcom 16.6%
China unioncom 12.1%
China tietong 1.2%
China weitong 0.2%
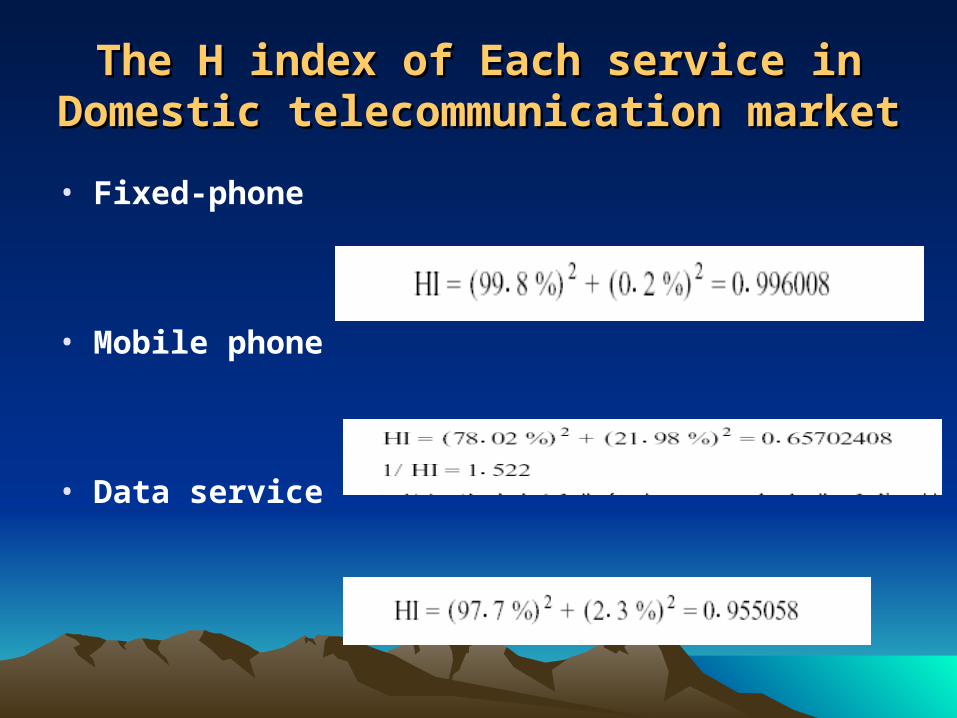
The H index of Each service in The H index of Each service in Domestic telecommunication Domestic telecommunication
marketmarket• Fixed-phone
• Mobile phone
• Data service
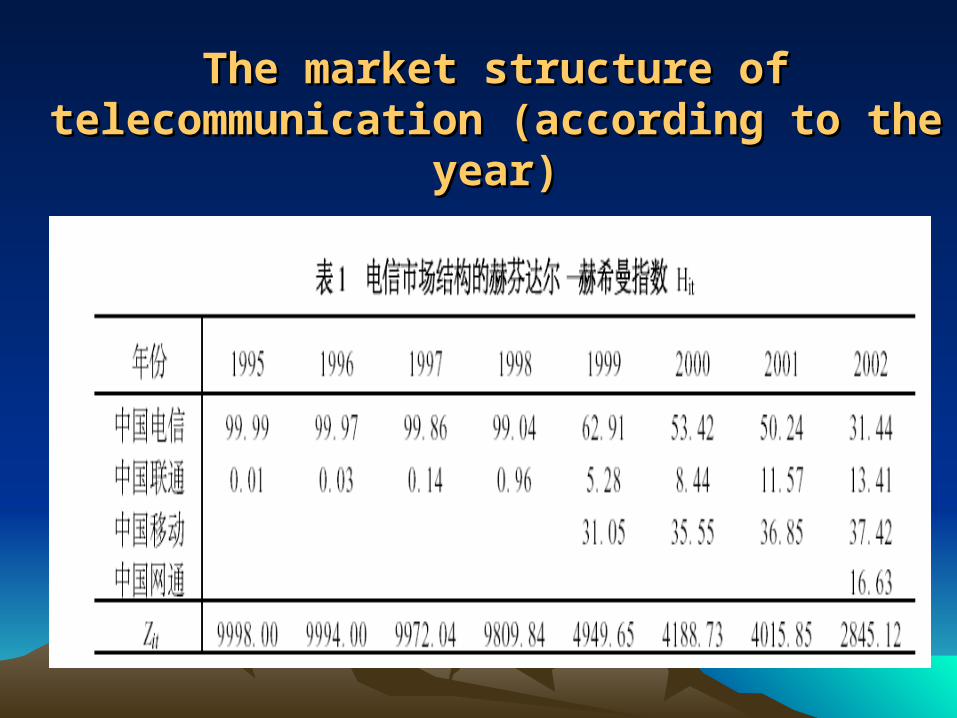
The market structure of The market structure of telecommunication (according to the telecommunication (according to the
year)year)
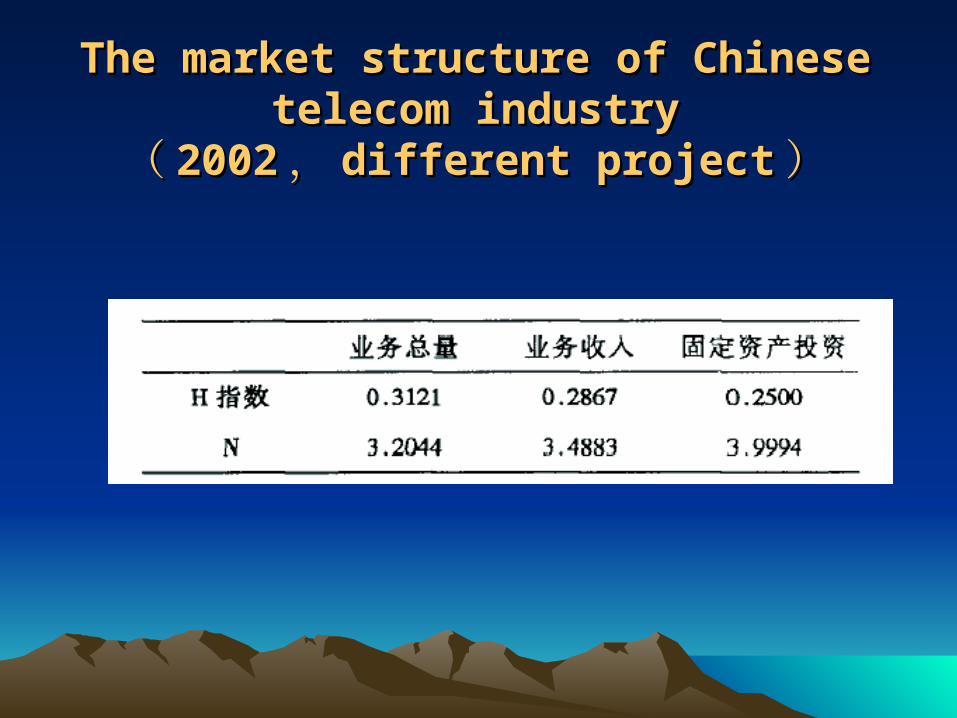
The market structure of Chinese The market structure of Chinese telecom industry telecom industry
(( 20022002 ,, different projectdifferent project ))

THAT’S ALL!
THANK YOU!!