Embed Size (px)
Citation preview

Cover Page (place holder)
Performance Measurement in Federal Libraries
Performance Measurement in Federal Libraries: A Research Study
Management of Information Management (MIM) Program University of Maryland at College Park
Juliet Anderson Swasti Bhargava
LaMont Hall Akil Hawthorne
Nadir Jusufbegovic Constance MacDonald
Virginia Phelps
Requested by Susan M. Tarr, Executive Director, Federal Library and Information Center Committee (FLICC)
and Director, Federal Library and Information Network (FedLINK)
Performance Measurement in Federal Libraries
Executive Summary Calculating Return on Investment (ROI) is the newest challenge for justifying funding in the public sector. ROI can also assist Federal librarians in successfully achieving their library’s missions and goals. Business thinking is entering the Government from the private sector where it is customary to perform ROI to justify funding departments, programs, or staff. Even for career Federal managers, there is increasing pressure to use business methodologies in managing Federal agencies. ROI in the private sector is easier to calculate because private businesses are profit-oriented, product-producing organizations. ROI is a new concept to public sector organizations. The challenge for organizations like Federal libraries and information centers is to find a way to compute ROI even though they are not revenue-producing organizations. The purpose of this paper is to assist Federal libraries in describing their value to the organizations they support through a Performance Measurement Model (PMM). An attached set of reference charts of performance measurement tools and methodologies is provided to assist each library at each stage of the performance measurement process. This PMM outlines the history of how libraries have measured their performance and justified their funding in the past and how the newer concept of ROI fits into the future model of performance measurement Historically, libraries collected statistical outputs to justify their funding. In the last 10 years, newer methods such as outcome-based evaluation have encouraged libraries to use tools such as surveys to examine their services to demonstrate the increased value provided to their customer base. ROI becomes the final component that ties all these methods together by finding ways to place dollar amounts on both services and value-added outcomes. The model presented in this study was designed by researching the methodologies and tools available for performance measurement, both written and Web-based, from special libraries, private industry, academic libraries, and library associations. The researchers also interviewed subject matter experts and visited several Federal libraries in the Washington, D.C., area to gain first-hand insight into the needs of Federal libraries in terms of performance measurement. The PMM was built upon existing performance measurement principles such as outputs, outcomes, and ROI. The model graphically links together similar threads of performance measurement principles into an organized process that leads along a logical continuum. Use of the PMM and the reference charts will increase the ability of libraries to measure success in achieving their mission and goals, and thereby facilitate the justification for continued operation and future funding. In addition to the PMM and reference charts, this paper presents a number of discoveries. Much information and many tools exist for measuring library performance; however, a “one-size-fits-all” template does not exist. Each library environment presents individual challenges, and a flexible process is needed to determine ROI. The varying size of each library and the different relationships between the library, its parent organization, and its
i
Performance Measurement in Federal Libraries
community make it impossible to define only one model as “the best.” In any circumstance, however, understanding and utilizing performance measurement can enhance a library’s value to its community, as well as lead to innovation. Although the demand exists, research indicated that only a small percentage of libraries conduct formal ROI studies. ROI is an elusive and difficult undertaking in a traditional business environment. When ROI is applied to the special library environment, there is an added level of complexity. ROI is a demanding task for Federal libraries, one which requires many cognitive cycles and an abundance of creative reasoning to apply this business practice to a non-traditional environment.
ii
Performance Measurement in Federal Libraries
TABLE OF CONTENTS
EXECUTIVE SUMMARY .......................................................................................I
SECTION 1: BACKGROUND...............................................................................1
Introduction .................................................................................................................................................. 1
Study Methodology....................................................................................................................................... 2
Goal................................................................................................................................................................ 2
Objectives ...................................................................................................................................................... 2
Deliverables................................................................................................................................................... 3
Milestones...................................................................................................................................................... 3
Scope of the Project ...................................................................................................................................... 4
Assumptions .................................................................................................................................................. 4
Limitations .................................................................................................................................................... 4
Definitions ..................................................................................................................................................... 5
Research Summary and Findings ............................................................................................................... 5
SECTION 2: REALIZING PERFORMANCE MEASUREMENT............................7
Introduction .................................................................................................................................................. 7
The Building Blocks ..................................................................................................................................... 8 Inputs ......................................................................................................................................................... 8 Services...................................................................................................................................................... 9 Outputs ...................................................................................................................................................... 9 Surveys and Questionnaires..................................................................................................................... 10 Outcomes ................................................................................................................................................. 11 Return on Investment............................................................................................................................... 13
ROI Metrics ....................................................................................................................................... 15
Benchmarks ................................................................................................................................................ 16
SECTION 3: PERFORMANCE MEASUREMENT REFERENCE CHARTS......18
Introduction ................................................................................................................................................ 18
Benchmarking Cross-Reference Chart..................................................................................................... 19
iii
Performance Measurement in Federal Libraries
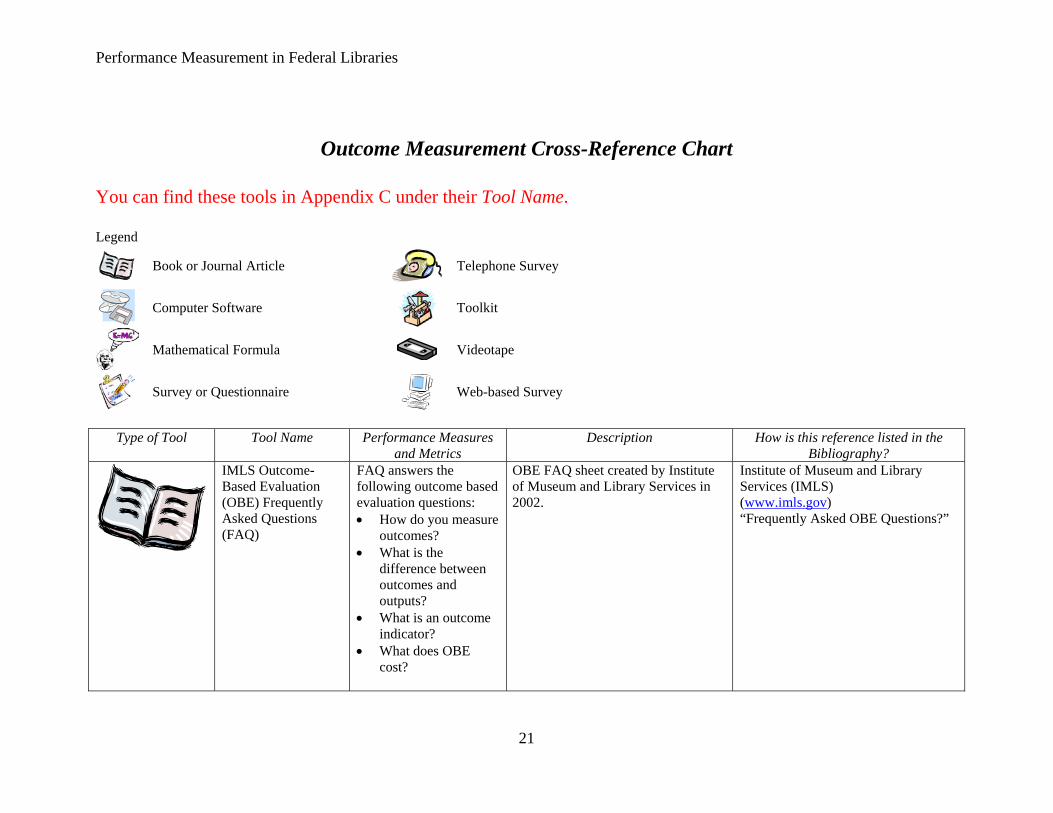
Outcome Measurement Cross-Reference Chart...................................................................................... 21
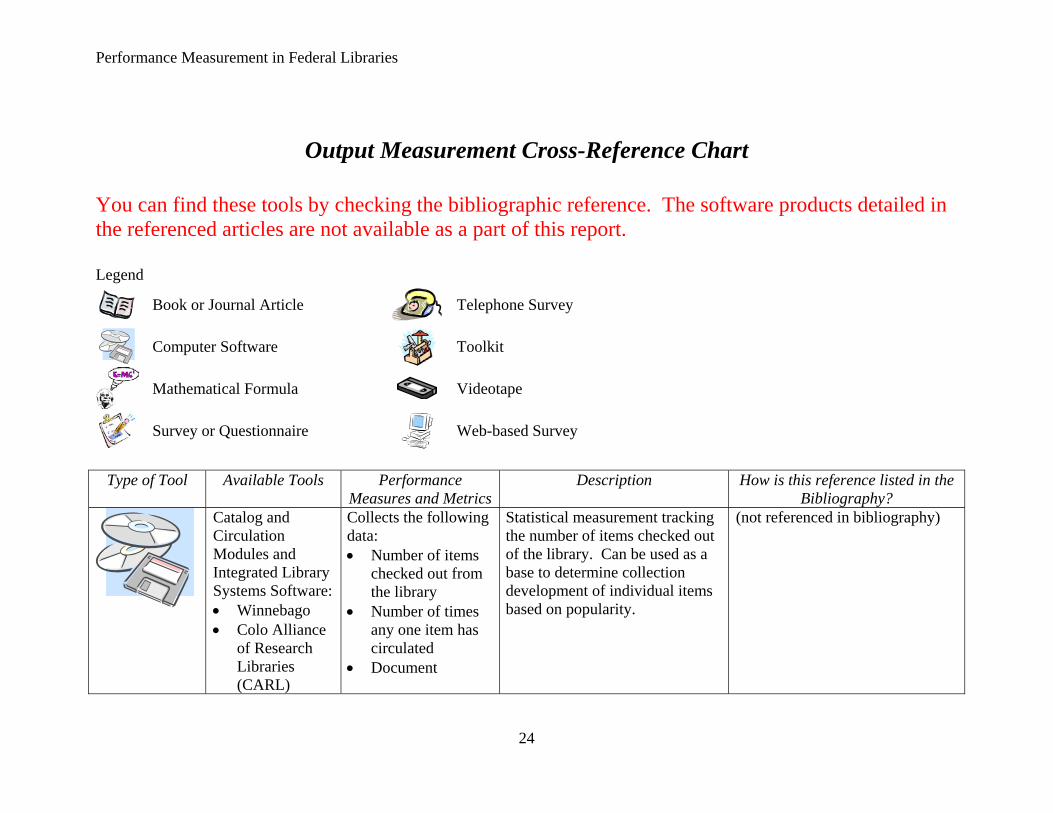
Output Measurement Cross-Reference Chart ......................................................................................... 24
Return on Investment Cross-Reference Chart ........................................................................................ 26
Survey/Questionnaire Cross-Reference Chart......................................................................................... 31
SECTION 4: CONCLUSION...............................................................................36
Limitations of Performance Measurement Model................................................................................... 36
Lessons Learned ......................................................................................................................................... 36
Further Research Opportunities ............................................................................................................... 37
BIBLIOGRAPHY ................................................................................................38
APPENDIX A: SUBJECT MATTER EXPERT INTERVIEWS.............................50
APPENDIX B: SITE VISIT SUMMARIES ...........................................................55
APPENDIX C: REFERENCE CHARTS..............................................................67
APPENDIX D: FULL-TEXT READINGS ............................................ SEPARATE
APPENDIX E: ADDITIONAL FULL-TEXT READINGS...................... SEPARATE
iv
Performance Measurement in Federal Libraries
1
Section 1: Background Introduction Performance measurement is the process of creating measurable indicators that can be tracked systematically to assess progress made in obtaining predetermined goals (GAO). These goals should be very closely linked to the mission, goals and objectives of the library’s parent organization. By allowing an assessment through a set of pre-determined metrics, performance measurement helps to prove the degree of success libraries achieve in meeting their mission and goals. The metrics provide information that can be analyzed and interpreted in reference to the organization’s mission and goals. Once libraries have these metrics, they can then refer back to them to determine how well they are performing. Historically, measurement of performance in libraries has been limited to tracking the library’s incoming resources (inputs) against the statistical outputs gained by measuring services. In more recent years, outcomes-based evaluation studies have emerged to attempt to track, statistically, the value-added service that libraries provide to their users. The final piece of performance measurement to emerge in the library field is the business concept of using Return on Investment (ROI) to justify the libraries' inputs. Many models exist for tracking output and outcome measurement, but the concept of ROI for the public sector is a recent idea. Measurement by ROI is being requested more and more by agency management, the Office of Management and Budget (OMB), and even Congress as they ask organizations in their purview to justify their existence and provide data to comply with the Government performance and Results Act. This paper addresses this most recent outlook on measurement and shows how ROI is a logical outgrowth of the measurement techniques that have come before it. Furthermore, this paper suggests how previous methods of gathering data can be used in a new Performance Measurement Model (PMM). Susan M. Tarr, Executive Director of the Federal Library and Information Center Committee (FLICC) and Director of the Federal Library and Information Network, FedLINK, through Roberta Shaffer, Coordinator of the Master of Information Management Program and Director of External Relations and Progress Development, at the University of Maryland at College Park (UMCP), enlisted a group of students to research how ROI, as a performance measurement tool, could be applied nationally to Federal libraries. This study was conducted by a research group within the UMCP, College of Information Studies. It was performed in compliance with requirements under the Master of Information Management graduate program. Graduate students within this program are trained to understand and analyze the ways in which information resources are used and to assist organizations in conducting the difficult task of realizing performance measurements within an information resource environment. The goal was to provide Federal libraries with a reference listing of the best performance measurement methodologies available, so that each library could adapt one or more models to its own needs.
Performance Measurement in Federal Libraries
2
Study Methodology To address this study, three methods of research were undertaken: research of documentation, site visitation, and interviews with subject-matter experts. First, Susan Tarr provided the team with several articles and citations for articles, Web sites, and books that discussed performance measurement. These items were retrieved and studied. Many of these materials led to additional articles of relevance to the project, and these additional materials were also reviewed for relevance (see Bibliography and Additional Reading sections). The second research method included site visits to four Federal libraries in the Washington, D. C., area, for which Ms. Tarr provided contact information. These sites were visited in an effort to understand what performance measurements were currently being used and what the libraries needed in terms of more advanced performance measurement. Discussion were held with representatives of each library and with additional individuals who had performed research in the field of performance measurement. Documentation of these site visits is available in Appendix B. Lastly, at Ms. Tarr’s recommendation, two academic, subject matter experts were consulted. These experts provided insight and recommendations to the status of the field of outcome and ROI assessment. Interviews were conducted with Roberta Shaffer and Eileen Abels of the University of Maryland. Documentation of these interviews is available in Appendix A. From these resources, a performance measurement model was created, and a reference chart of methodologies was gathered that reflected the best performance measurement models available to Federal libraries.
Goal The goal of this research study was to develop a PMM and to compose a reference chart of the best performance assessment tools available for Federal libraries.
Objectives The objectives of the study are as follows:
• Investigate local Federal libraries to obtain information on current performance measurement practices;
• Interview known experts to cull their experience and expertise; • Research literature written on these topics; • Synthesize data found in the resources;
Performance Measurement in Federal Libraries
3
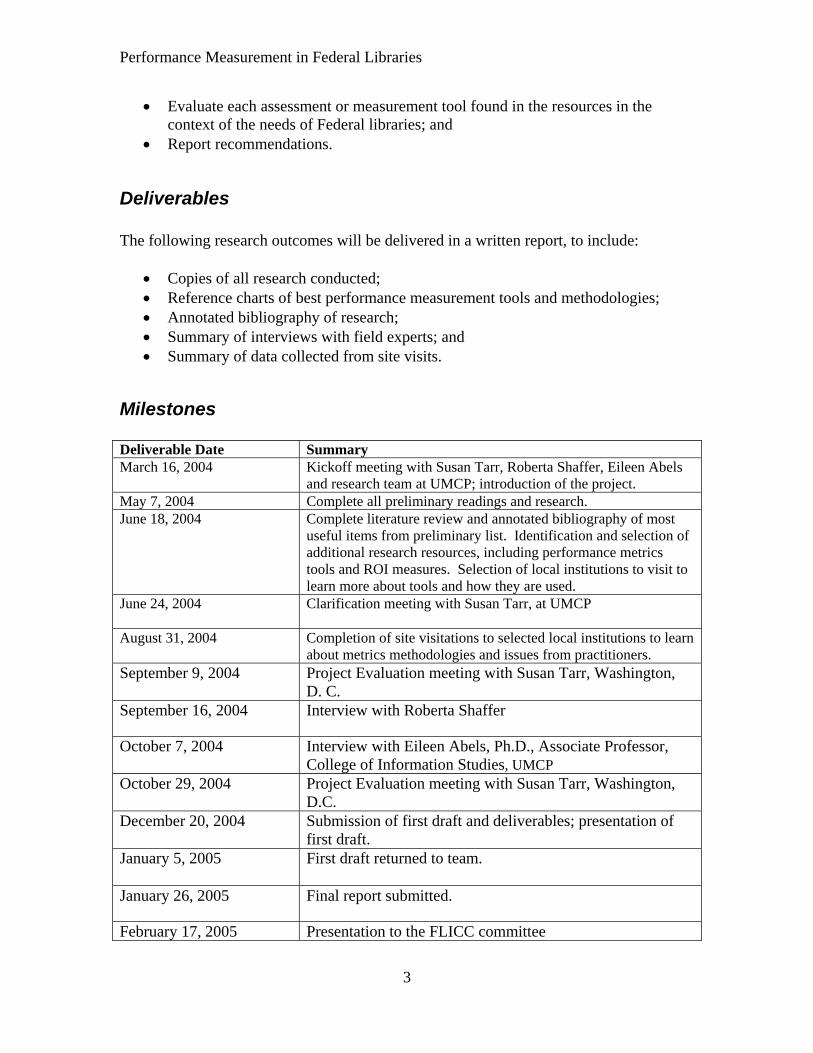
• Evaluate each assessment or measurement tool found in the resources in the context of the needs of Federal libraries; and
• Report recommendations.
Deliverables The following research outcomes will be delivered in a written report, to include:
• Copies of all research conducted; • Reference charts of best performance measurement tools and methodologies; • Annotated bibliography of research; • Summary of interviews with field experts; and • Summary of data collected from site visits.
Milestones Deliverable Date Summary March 16, 2004 Kickoff meeting with Susan Tarr, Roberta Shaffer, Eileen Abels
and research team at UMCP; introduction of the project. May 7, 2004 Complete all preliminary readings and research. June 18, 2004 Complete literature review and annotated bibliography of most
useful items from preliminary list. Identification and selection of additional research resources, including performance metrics tools and ROI measures. Selection of local institutions to visit to learn more about tools and how they are used.
June 24, 2004 Clarification meeting with Susan Tarr, at UMCP
August 31, 2004 Completion of site visitations to selected local institutions to learn about metrics methodologies and issues from practitioners.
September 9, 2004
Project Evaluation meeting with Susan Tarr, Washington, D. C.
September 16, 2004
Interview with Roberta Shaffer
October 7, 2004
Interview with Eileen Abels, Ph.D., Associate Professor, College of Information Studies, UMCP
October 29, 2004
Project Evaluation meeting with Susan Tarr, Washington, D.C.
December 20, 2004
Submission of first draft and deliverables; presentation of first draft.
January 5, 2005
First draft returned to team.
January 26, 2005
Final report submitted.
February 17, 2005 Presentation to the FLICC committee
Performance Measurement in Federal Libraries
4
Scope of the Project The scope of the research project included conducting a survey of relevant performance measurement tools used by or adaptable to Federal libraries. Although there are over 1200 Federal libraries in the portfolio, the project team visited four representative Federal libraries to gain insight into the different needs of Federal libraries of varying size and focus. Participating libraries included the National Institute of Standards and Technology (NIST) Research Library, the Environmental Protection Agency (EPA) Library, and National Institutes of Health (NIH) and Veterans Affairs (VA) libraries. In addition to looking at performance measurement practices within these libraries, the project included a significant research effort. This research effort included culling literature and Web sites and conducting interviews, with the goal of developing recommended performance measurement reference charts. These activities included gathering information from private industry, academia, and library associations. To this end, the group invested several hundred working hours, read thousands of pages of journal articles, book sections and web pages. The research presented is not intended to be exhaustive in nature, but to be a representation of the vast field of resources available.
Assumptions This paper makes the assumptions that the reader:
• Is aware of and has exact dollar figures for all their library’s inputs; • Is familiar with and accustomed to doing, at the minimum, some form of output
evaluation of their library’s services; • Has a clear understanding of the information users’ needs and goals; • Has a need to justify the existence and continued funding of his/her library and/or a
requirement to prove that the library is meeting its mission and goals; • Is intending to use the performance measurement process as part of an integrated
strategic management system; and • Is able to realize successful performance measurement by using the model developed and
reference charts provided as a result of the study.
Limitations The scope of this project proved to be massive. Extensive research was necessary into the traditional methods of performance measurement before an evaluation of the primary topic (ROI methods) could be explored. This limited the amount of time the team was able to devote to the primary topic. The limited library experience the team brought to the project also created a significant learning curve for several team members. Only three members of the team of seven had
Performance Measurement in Federal Libraries
5
experience working in the public sector, and only one member is a professional librarian. This limitation was partially overcome by additional meetings with Susan Tarr and through several team concept meetings. The end result of this limitation was only a time delay. An examination of various methods of calculating ROI repeatedly uncovered the fact that there is no “one size fits all” model for libraries to use. The varying size, budget, staff, mission, etc., of each Federal library precluded a single solution. These differences force an ideal model to be very generally described, because most specific criteria would not apply to the majority of libraries. Some services, which provide intangibles outcomes (such as user knowledge gained), are extremely difficult to measure and even more difficult to assign a dollar value for ROI. These limiting factors made it difficult to identify a “perfect” ROI model. To combat this, the team decided to provide a reference chart of tools and methodologies for libraries to adapt, if necessary, to their own environment and to provide guidelines on how to view ROI through the PMM.
Definitions Benchmarks – The comparison of one or more organizations to another and the use of a standard set of attributes in order to make qualitative observations. Inputs – The resources that flow into a library to make service possible. Intangible data – Data that assess the value of a service to the customer. Outcomes – The measurement of the results of value-added services provided by a library to meet information users’ needs and goals. Outputs – The statistical measurements that track the basic performance of a library. Tangible data – Straight statistics, without value-added weight.
Research Summary and Findings Libraries have been measuring their performance in some form for decades. Models of how to measure that performance abound, ranging from the straightforward statistical measurement to the complexity of newer outcomes-based models. These models take the form of methodologies, surveys, workbooks, and charts. No one model fits the needs of every situation. The traditional forms of accountability are based in statistical values or outputs. Using the traditional theory, a library circulates x number of materials to a population of y number of people; therefore it must be worth investing in. The traditional model shows only that the library is being used, but does not delve into the intangible, intrinsic value the library delivers to its users or into the tangible financial value of the full range of a library’s services. Outcomes-based evaluation models target the intangible, value-added services; and ROI models focus on placing a dollar amount on both the tangible statistics and those value-added services.
Performance Measurement in Federal Libraries
6
The new pressure on organizations such as libraries to justify their financing and, in some cases, their very existence, has brought the business model of ROI to the forefront. The issue that is posed to today’s libraries is: In a time of high accountability, show how the library gives back, in financial terms, more than it consumes. The complexity of applying ROI to a nonprofit organization, like a library, has several challenges. Matching financial figures to a value-based organization leaves much room for subjectivity and interpretation, and no ROI model can apply to every value-added service a library provides. Additionally, discovering one model to fit every library proved not only challenging, but, in the end, impossible. One model for all Federal libraries would require a template that could adjust for multiple variables. The size of the library collection, the size of the staff, the range of services provided, the location of the library, and the relationship of the library to its parent organization and to its users is the beginning of a long list of variables that can influence the results of any performance model.
Performance Measurement in Federal Libraries
7
Section 2: Realizing Performance Measurement
Introduction Performance measurement begins with the measuring and examining of the resource inputs versus the services a library provides to determine the output or statistical tangible data of a library. After these statistics are evaluated, measuring how valuable the library is to the community or to its customers is the next step. This outcomes-based evaluation is often done through tools, such as surveys and/or questionnaires which are given to the library’s users. Benchmarking can also be used to compare libraries to similar organizations. Finally, a dollar value is placed on both tangible and intangible information or services to quantify the costs and examine the benefits. This assignment of a dollar value to the information or services provided is the basis of an ROI calculation. Examining inputs, outputs, outcomes and ROI is an integrated step by step, logical process used to measure performance. Statistical performance measurement in libraries has been done for many years. Typically, the only justification a library needed to provide for its existence was a measure of the number of people it served and a chart showing the size of the collection. Until recently, statistics, such as the number of items circulated, the number of registered users, and the number of reference questions answered, were often enough to justify budgetary requirements and satisfy funding inquiries. With the advent of the new web-based, digital world, the traditional systems of performance measurements are no longer sufficient. Libraries are spending increasing amounts of money on these new technologies, and finding it difficult to justify the costs. Outcome-based evaluations and ROI, however, are recent developments in performance measurement that attempt to measure the value of the traditional library services as well as justifying the increased expenditures of the newer technologies. The focus has shifted from examining a library’s statistics or outputs to evaluating the contributions the library makes to its community. It is no longer enough to count the answered research questions; the library needs to examine how valuable its services are to its users or how those services directly improve the user’s education or knowledge. Measuring some outcomes, such as increased learning or knowledge gained, is among the most challenging features of ROI. Outcomes-based evaluation, through surveys and questionnaires, has begun to take precedence over output statistics. Ensuring that customers get the answers they need has become much more important than just pointing the user in the right direction. The newest trend in performance measurement is to take outcome measurement a step further and examine the ROI of the library. ROI is calculated by examining the input, outputs, and outcomes to place a dollar value on services. This ROI calculation process has been used for years in businesses and now has become the focus for some Federal agencies in order to receive funding.
Performance Measurement in Federal Libraries
8
In the model presented in this paper, the traditional way of looking at performance measurement is examined and augmented by the newer methods of outcome-based evaluation and ROI. Traditional performance measurement took the library’s inputs and compared them against the outputs based on the services the library provided. While the traditional performance measurements included only inputs, services, and outputs, the PMM outlined in this research paper adds three new elements to traditional performance measurement: surveys, outcomes, and ROI. Each aspect of this model is equally important and possesses tangible and intangible variables necessary for the determination of metrics and costs associated with any single service. The PMM provides the logical steps to move through the performance measurement process along the measurement continuum. Each step is a building block for completing the next step. Knowing the dollar value of the inputs is the critical first step. Inputs are what allow a library to provide services to its customers. Examining services provides statistics that make up a library’s outputs. Evaluating outputs leads to formulation of questions for surveys to extend a library’s knowledge of its value to the parent organization and customers. Outcome focused surveys provide baseline data to analyze outcomes. The assessment of both outputs and outcomes leads to the basis for calculating ROI. Each level of performance measurement is more accurate and more detailed than the previous level. Most Federal libraries can be thought of as a system having inputs, services, outputs, and outcomes. Inputs produce certain outputs and outcomes that can further be used to determine ROI to ensure that the organization has been successful in accomplishing its goals and in providing a valuable service to the customer and parent organization. The sections below cover the details of each building block of the PMM.
The Building Blocks The performance measurement process is not a stand-alone process composed of only one piece or component. Rather, it is an integrated process that utilizes a complete system of “building blocks” to realize the objective of total performance measurement. Each of these building blocks is crucial to the overall process. Furthermore, the model represents a sequential process that builds as it increases in complexity and further quantifies performance measurement. Each building block in the process is essential and is used to complete the next step in the model. The six building blocks of the PMM are described individually in detail below.
Inputs Inputs are the resources available to the library that contribute to the provision of services. Inputs are tangibles, such as money or financial income, facilities, equipment, staff, volunteers, technologies, infrastructure, and material resources in print or digital forms that can be measured by tracking financial statistical data. These inputs are the means to provide quality services as well as a starting point to measure the outputs and
Performance Measurement in Federal Libraries
9
outcomes that are part of the performance measurement process. Ideally, the level of input increases as the library’s direct support and alignment with the mission and goals of the parent organization is proven. For example: Assume a collection budget of $5,000. $5,000 is the input.
Services Services are the sum of the activities, assistance, and facilities provided to the user by the library. Services are a direct result of the amount of input. They include the following:
• Information Brokering – Acting as the focal point of an organization, accomplished by connecting people to other people with complementary knowledge.
• Reference / Research – Providing services that can be as simple as locating a book
or article or as complex as locating multiple references in multiple formats to answer a complex series of questions. This area includes Online reference;
• Training / Tutoring – Educating the customer on use of materials, databases, etc.,
available through the library;
• Access – Providing access to materials, equipment, and/or space, this includes hours of operation, and building facilities;
• Acquisition services – Acquisition of materials and equipment, as well as contract
negotiation;
• Web site creation and maintenance;
• Knowledge creation and publishing;
• Programs / Activities – Providing outside experts to speak on topics of interest or need to the customer; and
• Other services – Offering translation services, services to special populations and
users with special needs, etc. For example: A collection budget of $5,000 (input) will provide 250 reference books valued at $200 each. The availability of 250 reference books to customers is the service.
Outputs Outputs are the statistics that measure the services that count what a program does (Sadlon, p.5). Outputs are tangible results gained by measuring the usage of products or
Performance Measurement in Federal Libraries
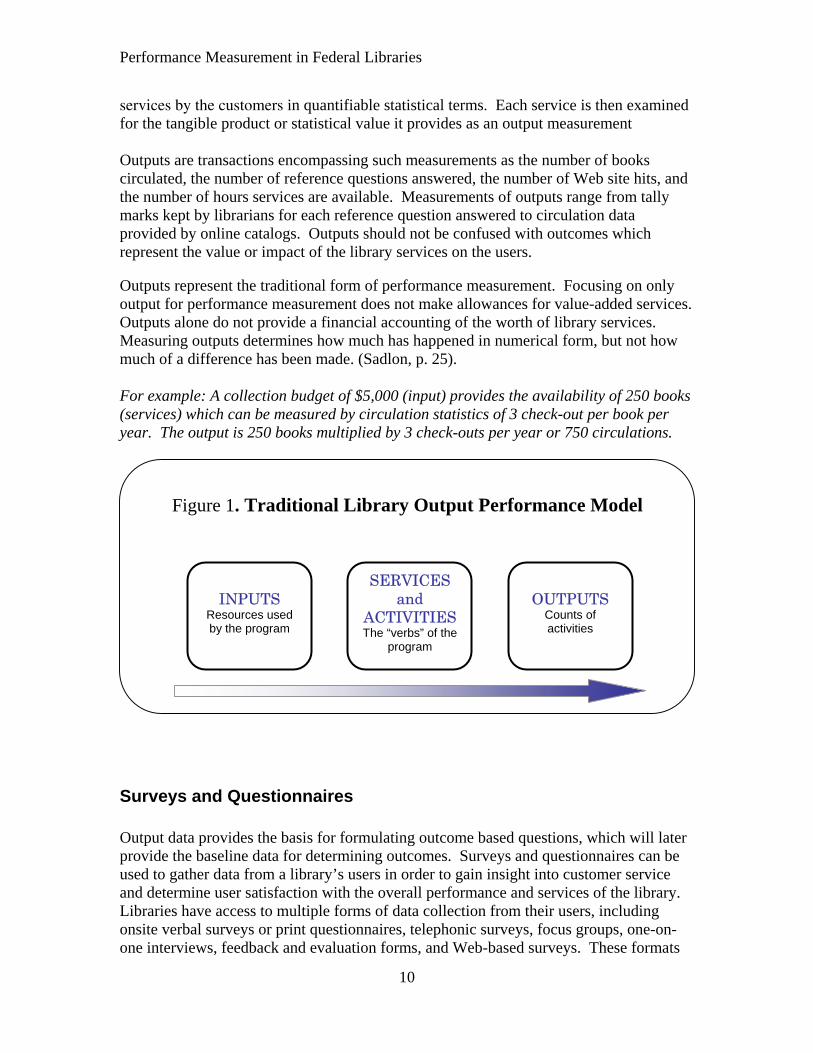
services by the customers in quantifiable statistical terms. Each service is then examined for the tangible product or statistical value it provides as an output measurement Outputs are transactions encompassing such measurements as the number of books circulated, the number of reference questions answered, the number of Web site hits, and the number of hours services are available. Measurements of outputs range from tally marks kept by librarians for each reference question answered to circulation data provided by online catalogs. Outputs should not be confused with outcomes which represent the value or impact of the library services on the users. Outputs represent the traditional form of performance measurement. Focusing on only output for performance measurement does not make allowances for value-added services. Outputs alone do not provide a financial accounting of the worth of library services. Measuring outputs determines how much has happened in numerical form, but not how much of a difference has been made. (Sadlon, p. 25). For example: A collection budget of $5,000 (input) provides the availability of 250 books (services) which can be measured by circulation statistics of 3 check-out per book per year. The output is 250 books multiplied by 3 check-outs per year or 750 circulations.
Figure 1. Traditional Library Output Performance Model
10
SERVICES and
ACTIVITIES The “verbs” of the
program
INPUTS Resources used by the program
OUTPUTS Counts of activities
Surveys and Questionnaires Output data provides the basis for formulating outcome based questions, which will later provide the baseline data for determining outcomes. Surveys and questionnaires can be used to gather data from a library’s users in order to gain insight into customer service and determine user satisfaction with the overall performance and services of the library. Libraries have access to multiple forms of data collection from their users, including onsite verbal surveys or print questionnaires, telephonic surveys, focus groups, one-on-one interviews, feedback and evaluation forms, and Web-based surveys. These formats
Performance Measurement in Federal Libraries
11
are extremely helpful in determining the accomplishments within the library. A library may use just one format for collecting data or a combination of all of the available survey tools (see Survey/Questionnaire Cross Reference Chart, p. 30). An example of the evolution of surveys is the LIBQUAL survey (ARL, p. 1-2). LIBQUAL measures the expectation of the users through their minimum, desired, and perceived level of service. This evolution from output to outcome demonstrates the direction of performance measurement as it moves into the future. Surveys have evolved to concentrate more on the impact the library has on its users, measuring more the value of services than output performance. Additional surveys include those performed by Joanne Marshall, for example: A Study of the Impact of Information on Corporate Decision Making (Marshall, Study of the Impact, p. 45). Some Federal agency libraries, such as the National Institutes of Health (NIH) and the National Institute of Standards and Technology (NIST), have developed their own user surveys (NIH, NIST). For example, the NIST Customer Survey measures the Research Library’s use of its own resources, resources obtained elsewhere, resources by subject areas, and the use of databases and journals. This survey asks customers to subjectively rate the value of library services in general and the impact of a cancellation of a journal or service. These services represent the support the Research Library provides to the success of NIST’s core mission: research. The survey is another tool in the performance measurement continuum to assist library management in drawing ROI conclusions. Surveys and questionnaires draw out from the customer their perceptions of library services as well as provide a foundation for the value the library imparts to that customer in terms of time, cost, etc. Most importantly, surveys provide the basis for outcome-based assessment. For example: A collection budget of $5,000 (input) provides the availability of 250 books (services) which can be measured by the circulation (3 check-out per book per year) of 750 (output). Examining this output of 750 circulations, librarians begin to question the value these books provide. So the librarians send out a questionnaire to the customer asking how much time the customer saved by having access to these 250 books. The questionnaire targeted the customers associated with the 750 circulations of which 50 customers responded that they received access to up-to-date, relative, time-sensitive information saving them an average of 4 hours time each.
Outcomes Outcome-based evaluation takes traditional performance measurement one step further. Outcome evaluations use metrics commonly used by most libraries and add a new component to the model. This new “outcome” component measures the effect, improvement, or change in the target client, community, or environment. The Institute of Museum and Library Services defines outcomes as the "benefits or changes for individuals or populations during or after participating in program activities, including new knowledge, increased skills, changed attitudes or values, modified behavior,
Performance Measurement in Federal Libraries
12
improved condition, or altered status” (IMLS, Frequently Asked…, p.1). Determining areas to measure for outcomes is based on the results of the surveys and questionnaires. Outcome measurement is relatively new to most nonprofit organizations like libraries. Nonprofit organizations are more familiar with evaluating performance on output measures, such as how many books are checked out, the number of people served, how much money was spent, and the amount of dollar donations received. Traditionally, these data have not taken into account the impact of the library on users. Measuring the outcomes or value the library adds to the parent organization or the customer give a new dimension to the worth of the library. Outcomes combined with outputs will lead to the basis for ROI calculations. Outcomes represent an impact on the customers using the library services and are typically intangible services that sometimes have no direct measurable cost. The value of the information to customers who are using the library and how well libraries perform at locating information of value to their customer’s research project or task are the most critical aspects of outcome-based evaluation. Other outcomes could be an increased access to information, time saved as a result of services or resources provided by the library, assistance in progress toward a customer’s goal, increased social and community connections or networking, and customer learning gains. Although it is difficult to measure or place a dollar value on the intangible outcomes, outcome-based evaluation has become extremely important for libraries and other service-oriented businesses in order to justify their budgets and their continued operation. Peggy Rudd explains that outcomes can be a powerful tool to demonstrate accountability and justify financial needs to fund providers, to build partnerships and promote community collaboration, to determine which programs and services should be expanded or replicated, and most importantly to communicate program and service benefits to the community (IMLS, Perspectives, p. 20). Outcomes can be viewed as short-, medium-, or long-term when working toward a mission or a goal. The reasons a library should conduct outcome-based evaluations are (Sadlon, p. 6-7):
• Improve programs; • Improve planning; • Increase accountability; • Assure the best use of funds; • Compare programs; and • Communicate with library community.
Outcome-based evaluation is a critical piece in the performance measurement process. Outputs statistics provide only part of the picture. The benefits of proving the library’s total worth lay in giving funders a full view of the value of the services the library provides. With this complete view, justifying funding and existence become easier.
.Outcome-based evaluation globally benefits libraries in the following ways:
• To prove library’s value to the funding organization; • To justify the budget and to request and receive further funding;
Performance Measurement in Federal Libraries
• To ensure the library is meeting its goal or mission; • To demonstrate the library’s accomplishments and contributions; and • To make sure that libraries are having a positive impact on the users.
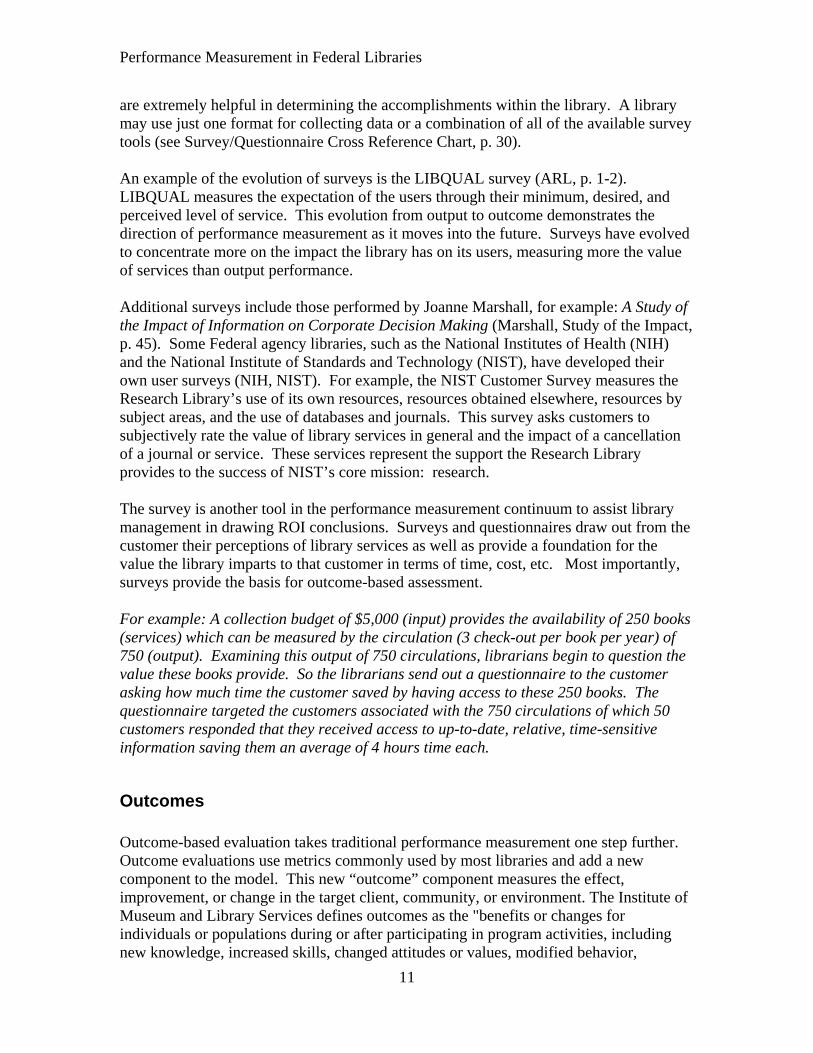
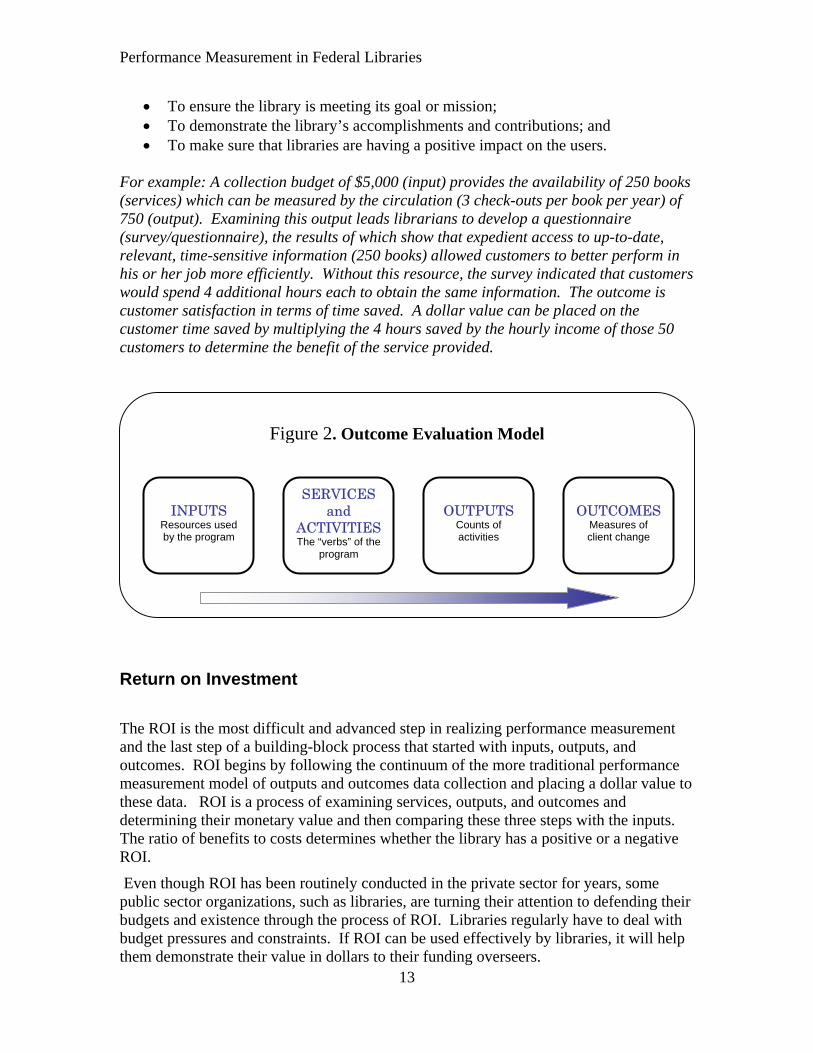
For example: A collection budget of $5,000 (input) provides the availability of 250 books (services) which can be measured by the circulation (3 check-outs per book per year) of 750 (output). Examining this output leads librarians to develop a questionnaire (survey/questionnaire), the results of which show that expedient access to up-to-date, relevant, time-sensitive information (250 books) allowed customers to better perform in his or her job more efficiently. Without this resource, the survey indicated that customers would spend 4 additional hours each to obtain the same information. The outcome is customer satisfaction in terms of time saved. A dollar value can be placed on the customer time saved by multiplying the 4 hours saved by the hourly income of those 50 customers to determine the benefit of the service provided.
Figure 2. Outcome Evaluation Model
13
SERVICES and
bs”ACTIVITIESThe “ver of the
program
INPUTS Resources used by the program
OUTPUTS Counts of activities
OUTCOMESMeasures of client change
Return on Investment
The ROI is the most difficult and advanced step in realizing performance measurement and the last step of a building-block process that started with inputs, outputs, and outcomes. ROI begins by following the continuum of the more traditional performance measurement model of outputs and outcomes data collection and placing a dollar value to these data. ROI is a process of examining services, outputs, and outcomes and determining their monetary value and then comparing these three steps with the inputs. The ratio of benefits to costs determines whether the library has a positive or a negative ROI.
Even though ROI has been routinely conducted in the private sector for years, some public sector organizations, such as libraries, are turning their attention to defending their budgets and existence through the process of ROI. Libraries regularly have to deal with budget pressures and constraints. If ROI can be used effectively by libraries, it will help them demonstrate their value in dollars to their funding overseers.
Performance Measurement in Federal Libraries
14
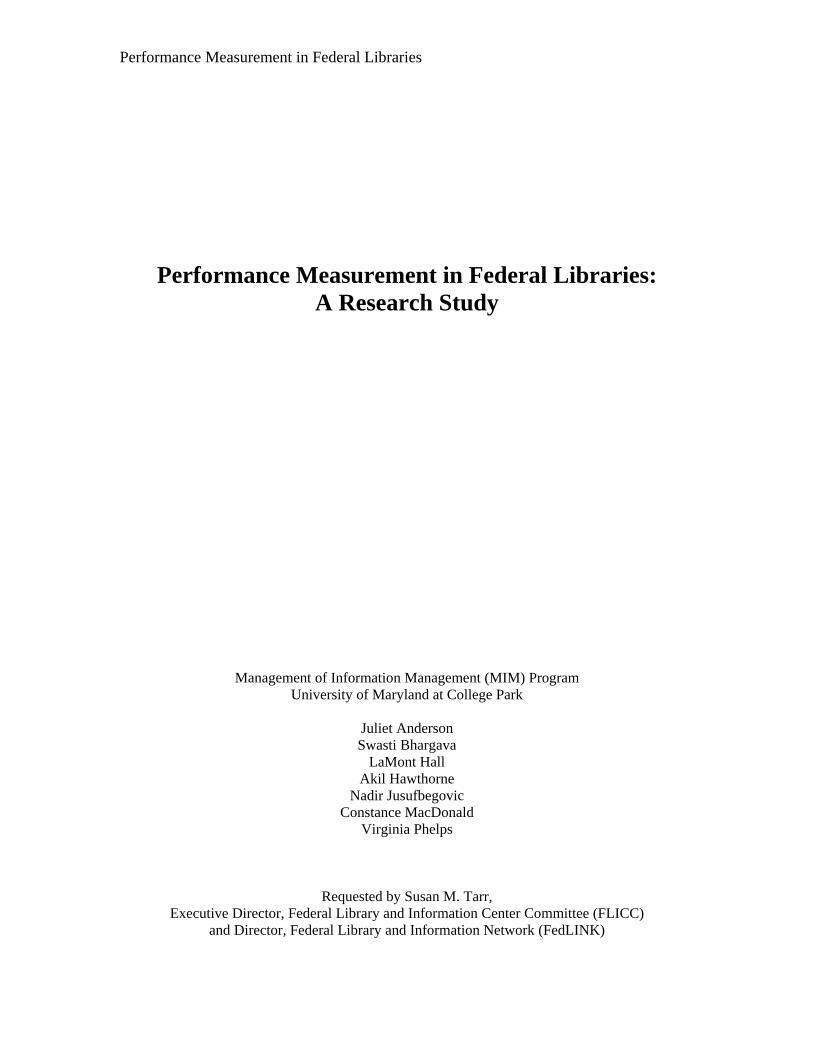
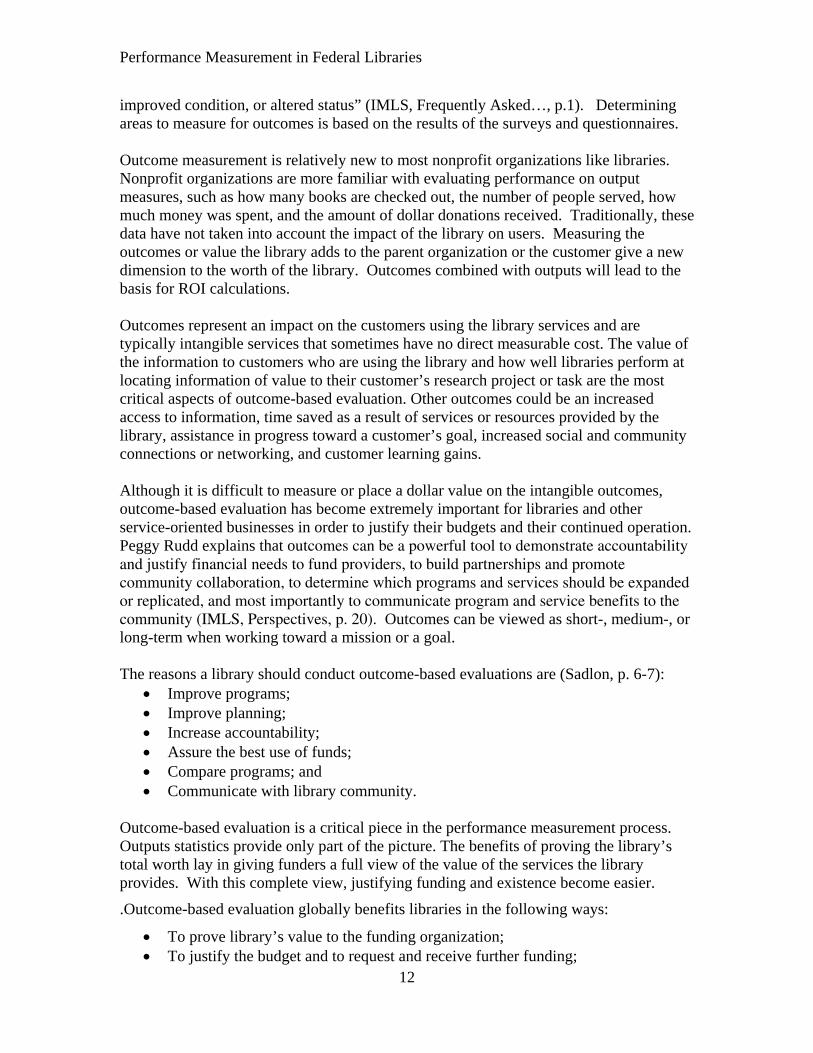
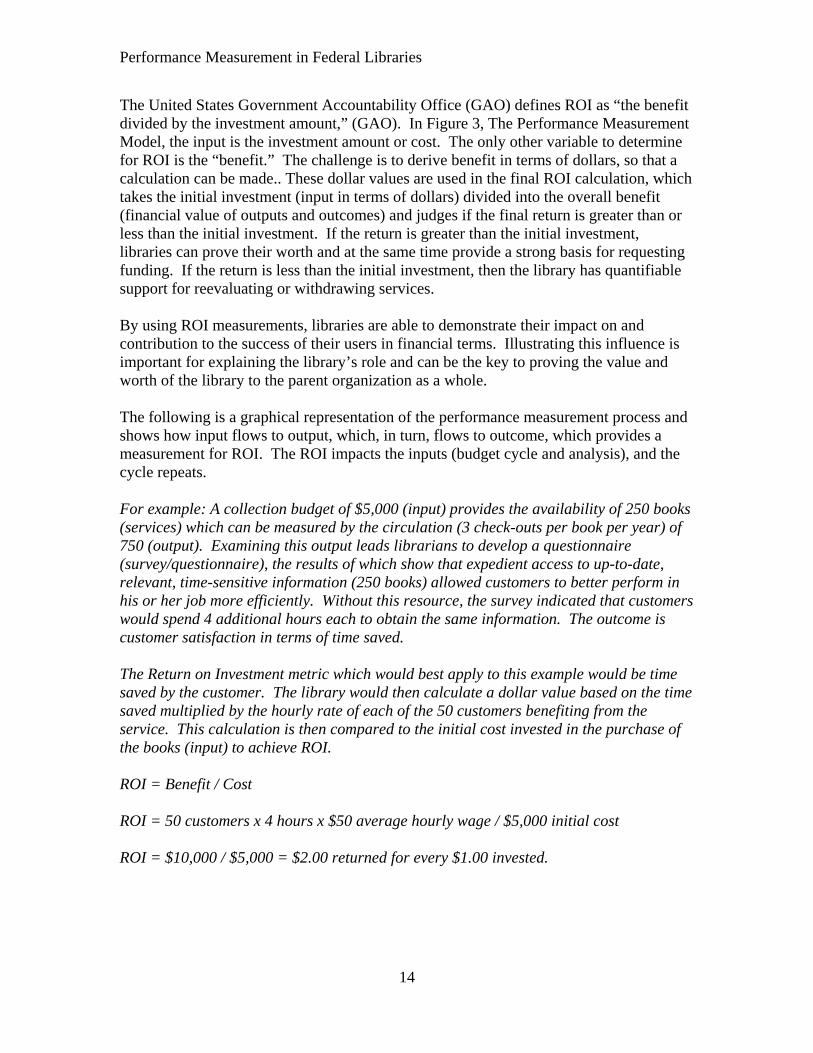
The United States Government Accountability Office (GAO) defines ROI as “the benefit divided by the investment amount,” (GAO). In Figure 3, The Performance Measurement Model, the input is the investment amount or cost. The only other variable to determine for ROI is the “benefit.” The challenge is to derive benefit in terms of dollars, so that a calculation can be made.. These dollar values are used in the final ROI calculation, which takes the initial investment (input in terms of dollars) divided into the overall benefit (financial value of outputs and outcomes) and judges if the final return is greater than or less than the initial investment. If the return is greater than the initial investment, libraries can prove their worth and at the same time provide a strong basis for requesting funding. If the return is less than the initial investment, then the library has quantifiable support for reevaluating or withdrawing services. By using ROI measurements, libraries are able to demonstrate their impact on and contribution to the success of their users in financial terms. Illustrating this influence is important for explaining the library’s role and can be the key to proving the value and worth of the library to the parent organization as a whole. The following is a graphical representation of the performance measurement process and shows how input flows to output, which, in turn, flows to outcome, which provides a measurement for ROI. The ROI impacts the inputs (budget cycle and analysis), and the cycle repeats. For example: A collection budget of $5,000 (input) provides the availability of 250 books (services) which can be measured by the circulation (3 check-outs per book per year) of 750 (output). Examining this output leads librarians to develop a questionnaire (survey/questionnaire), the results of which show that expedient access to up-to-date, relevant, time-sensitive information (250 books) allowed customers to better perform in his or her job more efficiently. Without this resource, the survey indicated that customers would spend 4 additional hours each to obtain the same information. The outcome is customer satisfaction in terms of time saved. The Return on Investment metric which would best apply to this example would be time saved by the customer. The library would then calculate a dollar value based on the time saved multiplied by the hourly rate of each of the 50 customers benefiting from the service. This calculation is then compared to the initial cost invested in the purchase of the books (input) to achieve ROI. ROI = Benefit / Cost ROI = 50 customers x 4 hours x $50 average hourly wage / $5,000 initial cost ROI = $10,000 / $5,000 = $2.00 returned for every $1.00 invested.
Performance Measurement in Federal Libraries
Figure 3: Performance Measurement Model
OUTCOMES
Investment/Cost Continuum$ $$$
OUTPUTS INPUTS ROI
Tangibles
Intangibles
Some benefits provided by the PMM are that it:
• Presents different aspects of the evaluation process, including all services and activities that may vary for different Federal libraries;
• Identifies all major categories including ROI; • Focuses on an evaluation of all intangible outcomes; • Derives the benefits in dollar amounts (ROI = BENEFITS / INVESTMENT);
and • Produces an efficient analysis on a cost-benefit ratio for any Federal library and
provides the key change indicators in ROI calculations.
ROI Metrics ROI metrics can be defined as the numerical dollar values that represent the benefits and costs that can be used in ROI calculations. ROI metrics used in justifying a library's budget can be both quantitative and qualitative. There are three basic types of ROI metrics: time saved, money saved by users, and revenue generated (Strouse). Time Saved. Time saved is a quantitative metric that takes the salary of the user and determines the cost of his/her time. If the library provides a service to this user, such as research, then the time the user saved by using the library instead of his/her own time can be calculated. If these users are employees of the same organization as the location of the library, this time saved can be converted into dollars that the library saved the parent organization.
15
Performance Measurement in Federal Libraries
16
Money Saved by Users. This metric represents the money that users save when they use the library instead of an alternative, fee-based source. For example, if an employee uses a trade journal that is available in the library, then the employee has saved the money that he/she would have had to spend to purchase this trade journal on his/her own. This trade journal could be used by multiple users if located in the library, which would multiply this savings across the organization. Revenue Generated. This metric relates to an instance when the library provides direct input to an activity that produced a profit. Part of the profit generated should be attributed to the library as a result of its input. For example, if a library provides a research service for an outside agency on a cost-reimbursement basis, then the library service receives a monetary payment. The cost of the service should be subtracted from the payment, leaving the profit. This profit is revenue generated for the parent organization. Benchmarks Benchmarking is a tool that can augment the performance measurement process, contributing to evaluating the library and information center. Benchmarking is used as a measuring device to compare one organization with other organizations and to make observations from the comparison. Benchmarks use an objective “standard set of attributes to compare multiple organizations to each other,” (Poling, p. 1). Benchmarks contribute to developing and understanding best practices. Library benchmarks commonly compare operational data or input with output (budgets, staff ratios, etc.) and qualitative data or outcomes (such as trends) in order to determine how a library measures up against other organizations with similar goals or services. This comparison enables the library to discover new ideas and services and to support its budgets to management. In particular, library benchmarks focus on attributes, such as “types of services being offered, how the function is changing, how much the library might be spending per user, or how much staff they have per customer.” (Poling, p. 1) Benchmark studies may be inclusive in subject matter, or they may focus on a particular area of interest, such as comparing services and like organizations. Benchmark studies may be conducted at any time in the ROI process, but doing so in the beginning of the effort may prove more beneficial for analysis. They can help accomplish the following (Poling):
• Identify problem areas; • Address and better understand the value of new service areas or processes (such
as implementing Web resources, etc.); • Respond to management initiatives; • Function as a guide to set up new libraries or merge a group of libraries; • Encourage creativity and innovation; and • Build beneficial partner relationships with other organizations.
Performance Measurement in Federal Libraries
17
Libraries can perform informal benchmark studies through reading articles, by using tools provided by professional associations, or through connecting with other comparable libraries, companies, or organizations. Formal benchmarks are conducted by engaging research firms and consultants, such as Outsell, Inc., and Library Benchmarking International. There are several considerations to keep in mind when contemplating the use of a benchmark study. The first is the cost in time and funds necessary to conduct a study. While this is especially true of executing the first study, it is a factor also if follow up studies are planned. Not all organizations are alike; thus, judgment should be exercised when making comparisons. For example, not all libraries collect data on their activities in the same manner, and not all libraries have the same objectives. Some experts believe that a benchmark study may limit creativity instead of promoting it, (Poling).
Performance Measurement in Federal Libraries
18
Section 3: Performance Measurement Reference Charts
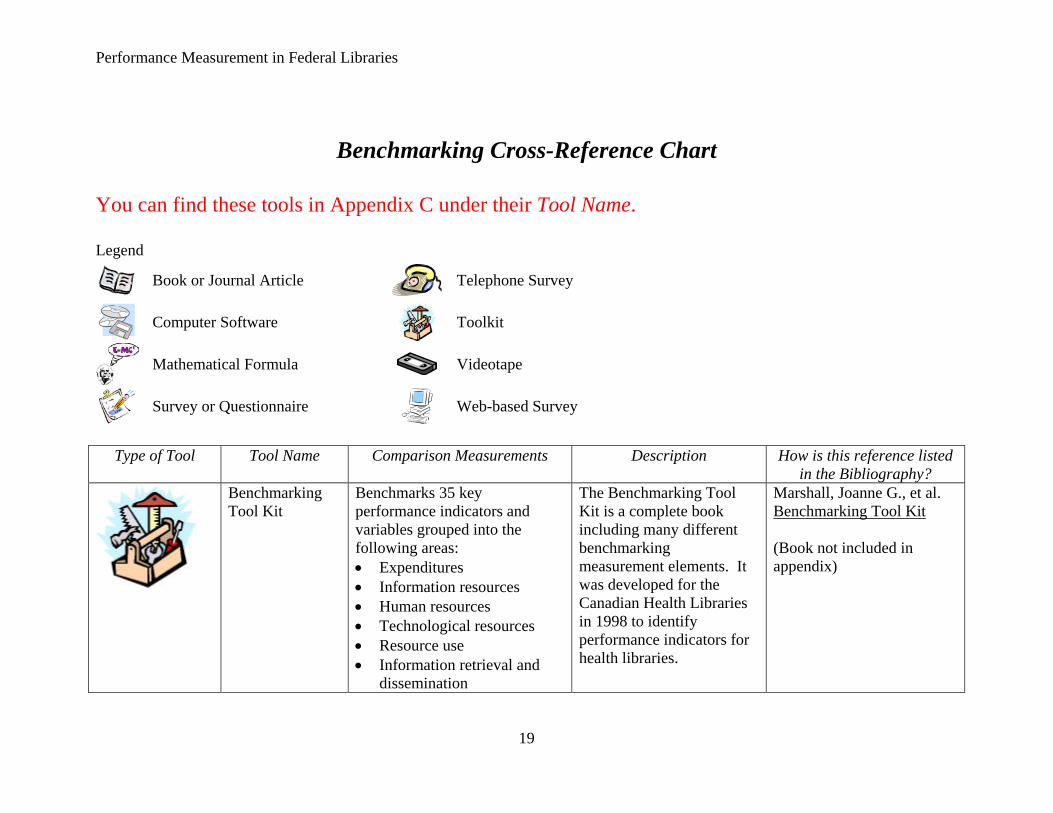
Introduction Performance measurement is the process of regularly measuring outputs and outcomes in order to track the progress toward achieving predetermined goals. The following reference charts represent the set of tools and methodologies that allows libraries to track effectively the value-added services that they provide by looking at the amount of work, progress, strengths, areas of improvement, and the impact on beneficiaries. These reference charts focus on providing tools and methodologies that individual Federal libraries can use to create the best performance measurement models for their varying needs. As a means for developing a library’s unique performance measurement, the following reference charts are presented as options from which to choose tools and methodologies. These reference charts have been built based on the assumption that Federal libraries are currently measuring outputs for their organization, and those libraries are seeking supplementary options of performance measurement. Because there is no “one size fits all” model that meets the needs of all Federal libraries, these reference charts are meant to be comprehensive lists where no one tool is recommended over another. Each Federal library will find different tools available to address its own unique needs. If a Federal library wishes to develop a survey, the first step is to reference the Survey/Questionnaire Cross-Reference Chart. Next, the library should select the survey or questionnaire that is most appropriate to their individual needs. If, for example, a Federal library is interested in tracking customer satisfaction, then they might select the University of Pennsylvania Library Service Quality and Impact Survey (a LibQUAL-based survey) to use as a base for the development of their own questionnaire. The Performance Measurement Reference Charts are divided into five sections:
I. Benchmarking II. Outcome Measurement
III. Output Measurement IV. Return On Investment V. Surveys/Questionnaires
Performance Measurement in Federal Libraries
Benchmarking Cross-Reference Chart You can find these tools in Appendix C under their Tool Name. Legend
Book or Journal Article Telephone Survey
Computer Software
Toolkit
Mathematical Formula Videotape
Survey or Questionnaire
Web-based Survey
Type of Tool Tool Name Comparison Measurements Description How is this reference listed
in the Bibliography?
Benchmarking Tool Kit
Benchmarks 35 key performance indicators and variables grouped into the following areas: • Expenditures • Information resources • Human resources • Technological resources • Resource use • Information retrieval and
dissemination
The Benchmarking Tool Kit is a complete book including many different benchmarking measurement elements. It was developed for the Canadian Health Libraries in 1998 to identify performance indicators for health libraries.
Marshall, Joanne G., et al. Benchmarking Tool Kit (Book not included in appendix)
19
Performance Measurement in Federal Libraries
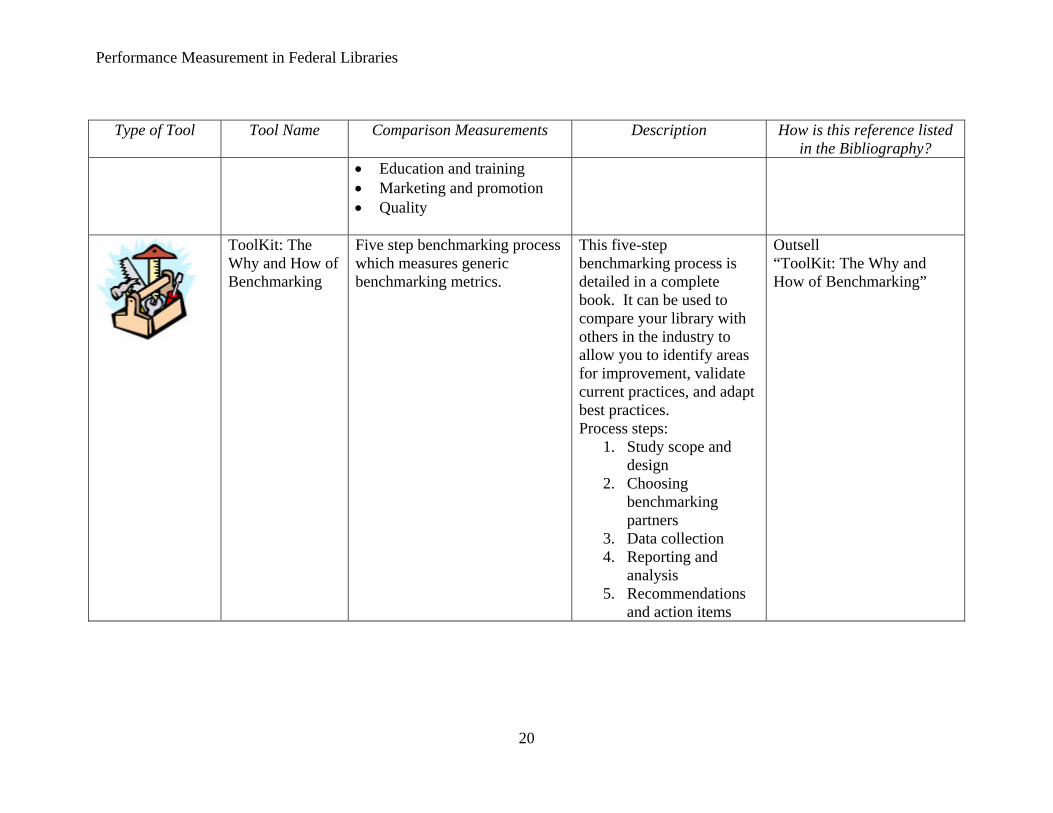
Type of Tool Tool Name Comparison Measurements Description How is this reference listed in the Bibliography?
• Education and training • Marketing and promotion • Quality
ToolKit: The Why and How of Benchmarking
Five step benchmarking process which measures generic benchmarking metrics.
This five-step benchmarking process is detailed in a complete book. It can be used to compare your library with others in the industry to allow you to identify areas for improvement, validate current practices, and adapt best practices. Process steps:
1. Study scope and design
2. Choosing benchmarking partners
3. Data collection 4. Reporting and
analysis 5. Recommendations
and action items
Outsell “ToolKit: The Why and How of Benchmarking”
20
Performance Measurement in Federal Libraries
Outcome Measurement Cross-Reference Chart You can find these tools in Appendix C under their Tool Name. Legend
Book or Journal Article Telephone Survey
Computer Software
Toolkit
Mathematical Formula Videotape
Survey or Questionnaire
Web-based Survey
Type of Tool Tool Name Performance Measures
and Metrics Description How is this reference listed in the
Bibliography?
IMLS Outcome-Based Evaluation (OBE) Frequently Asked Questions (FAQ)
FAQ answers the following outcome based evaluation questions: • How do you measure
outcomes? • What is the
difference between outcomes and outputs?
• What is an outcome indicator?
• What does OBE cost?
OBE FAQ sheet created by Institute of Museum and Library Services in 2002.
Institute of Museum and Library Services (IMLS) (www.imls.gov) “Frequently Asked OBE Questions?”
21
Performance Measurement in Federal Libraries
Type of Tool Tool Name Performance Measures and Metrics
Description How is this reference listed in the Bibliography?
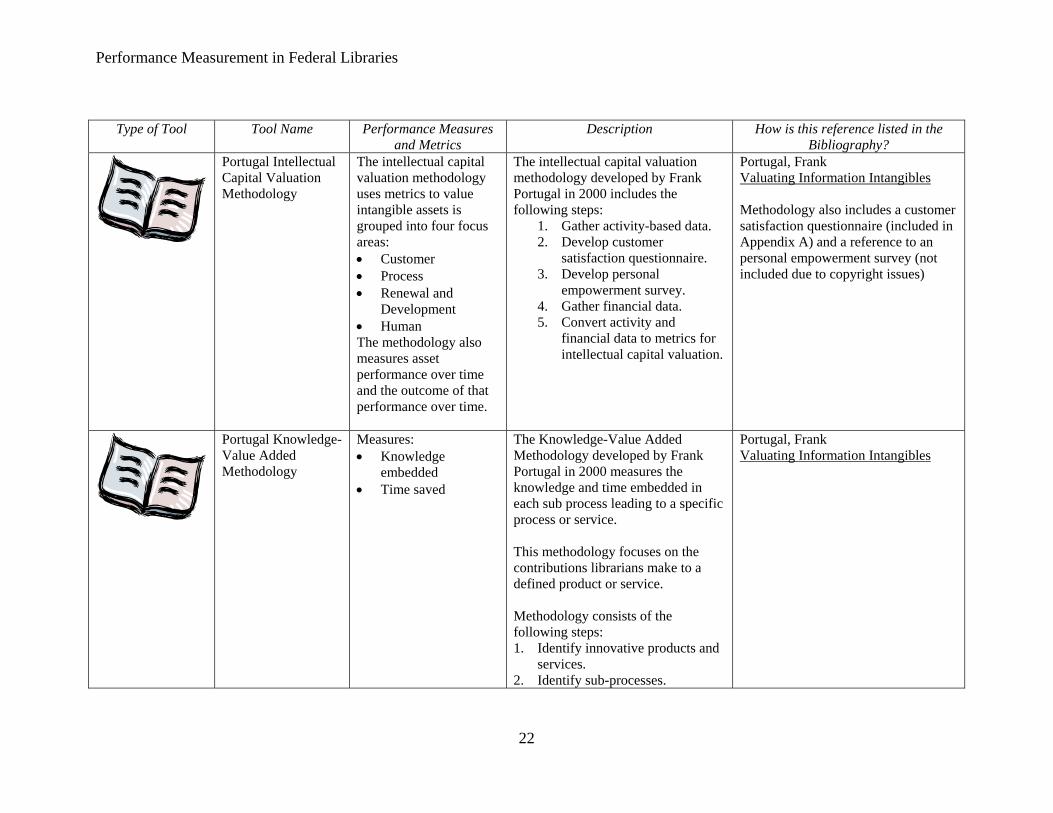
Portugal Intellectual Capital Valuation Methodology
The intellectual capital valuation methodology uses metrics to value intangible assets is grouped into four focus areas: • Customer • Process • Renewal and
Development • Human The methodology also measures asset performance over time and the outcome of that performance over time.
The intellectual capital valuation methodology developed by Frank Portugal in 2000 includes the following steps:
1. Gather activity-based data. 2. Develop customer
satisfaction questionnaire. 3. Develop personal
empowerment survey. 4. Gather financial data. 5. Convert activity and
financial data to metrics for intellectual capital valuation.
Portugal, Frank Valuating Information Intangibles Methodology also includes a customer satisfaction questionnaire (included in Appendix A) and a reference to an personal empowerment survey (not included due to copyright issues)
Portugal Knowledge-Value Added Methodology
Measures: • Knowledge
embedded • Time saved
The Knowledge-Value Added Methodology developed by Frank Portugal in 2000 measures the knowledge and time embedded in each sub process leading to a specific process or service. This methodology focuses on the contributions librarians make to a defined product or service. Methodology consists of the following steps: 1. Identify innovative products and
services. 2. Identify sub-processes.
Portugal, Frank Valuating Information Intangibles
22
Performance Measurement in Federal Libraries
Type of Tool Tool Name Performance Measures and Metrics
Description How is this reference listed in the Bibliography?
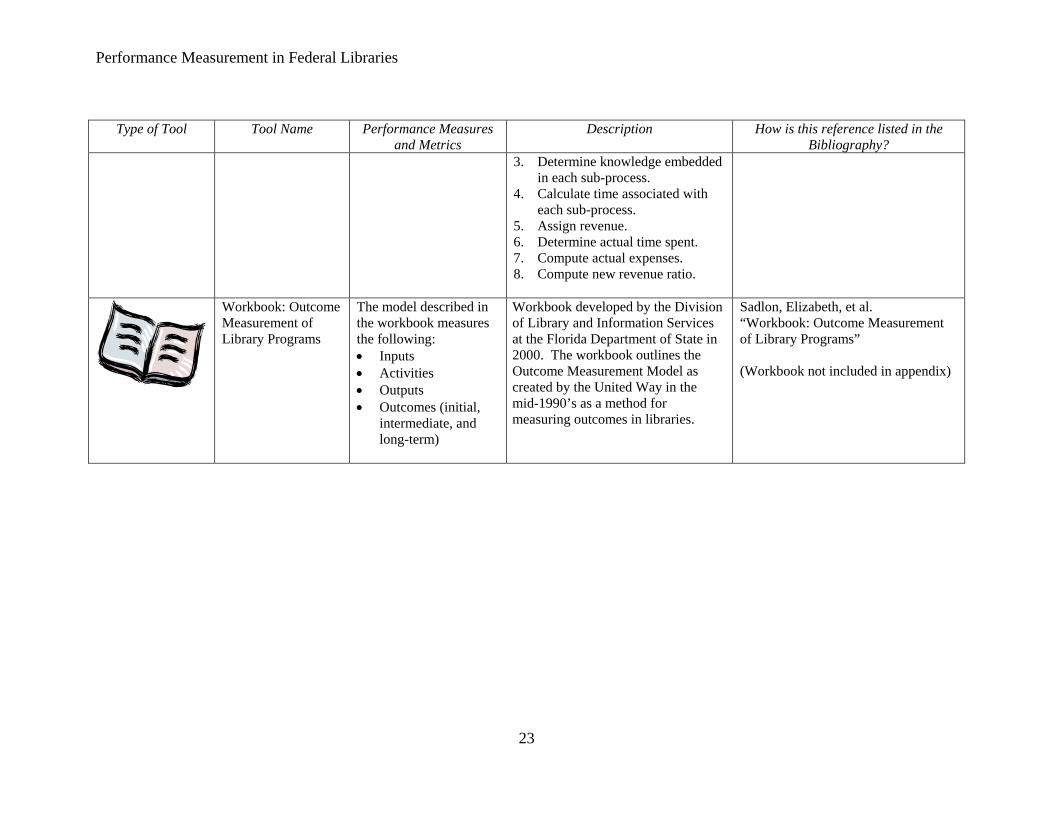
3. Determine knowledge embedded in each sub-process.
4. Calculate time associated with each sub-process.
5. Assign revenue. 6. Determine actual time spent. 7. Compute actual expenses. 8. Compute new revenue ratio.
Workbook: Outcome Measurement of Library Programs
The model described in the workbook measures the following: • Inputs • Activities • Outputs • Outcomes (initial,
intermediate, and long-term)
Workbook developed by the Division of Library and Information Services at the Florida Department of State in 2000. The workbook outlines the Outcome Measurement Model as created by the United Way in the mid-1990’s as a method for measuring outcomes in libraries.
Sadlon, Elizabeth, et al. “Workbook: Outcome Measurement of Library Programs” (Workbook not included in appendix)
23
Performance Measurement in Federal Libraries
Output Measurement Cross-Reference Chart You can find these tools by checking the bibliographic reference. The software products detailed in the referenced articles are not available as a part of this report. Legend
Book or Journal Article Telephone Survey
Computer Software
Toolkit
Mathematical Formula Videotape
Survey or Questionnaire
Web-based Survey
Type of Tool Available Tools Performance
Measures and MetricsDescription How is this reference listed in the
Bibliography?
Catalog and Circulation Modules and Integrated Library Systems Software: • Winnebago • Colo Alliance
of Research Libraries (CARL)
Collects the following data: • Number of items
checked out from the library
• Number of times any one item has circulated
• Document
Statistical measurement tracking the number of items checked out of the library. Can be used as a base to determine collection development of individual items based on popularity.
(not referenced in bibliography)
24
Performance Measurement in Federal Libraries
Type of Tool Available Tools Performance Measures and Metrics
Description How is this reference listed in the Bibliography?
• Horizon • Alexandria • Voyager • Sirsi
delivery requests • Online payment
for fines • Web-based check-
out renewal
Counting on Results Software
Collects basic output statistics: • Library visits • Circulation • In-library use • Web-hits • On-site and off-
site programs
Article describes the Counting on Results project software which enables users to enter data quickly and easily on Personal Digital Assistant (PDA) devices. Data can be shared locally and transmitted to a central remote location.
Lance, Keith C. “Counting on Results: New Tools for Outcome-Based Evaluation of Public Libraries”
Library Web Site Usage Software: • Analog 3.31 • wwwstat • http-Analyze
2.01 • WebTrends
Log Analyzer • Netintellect
4.0 • FastStats
Log analysis software does the following: • Requested website
pages • IP addresses of
computers making requests
• Date and time of requests
• Success of file transfers
• Last page visited • Search terms
leading to site
This article, written by Kathleen Bauer, discusses the listed software products for web log file statistic measurement to aid in gathering, distilling, and displaying information from log files.
Bauer, Kathleen “Who Goes There? Measuring Library Web Site Usage”
25
Performance Measurement in Federal Libraries
Return on Investment Cross-Reference Chart You can find these tools in Appendix C under their Tool Name. Legend
Book or Journal Article Telephone Survey
Computer Software
Toolkit
Mathematical Formula Videotape
Survey or Questionnaire
Web-based Survey
Type of Tool Tool Name ROI Tools and Methodologies Description How is this reference listed
in the Bibliography?
Army Value of Library Services Formula
Total Dollar Value of Library Service = Library Service Statistics multiplied by Value
This formula is a draft formula for determining the total value of library services developed by U.S. Army Libraries in 2003. The variables for this formula are defined as follows: • Library Service
Statistics are the collected data for each service category (e.g.
Army “Value of Library Services”
26
Performance Measurement in Federal Libraries
Type of Tool Tool Name ROI Tools and Methodologies Description How is this reference listed in the Bibliography?
number of books circulated, etc.)
• Value = Average Price of Items + Time + Material
Bromley ROI Case Study
Provides a real world example of an ROI calculation using: • Questionnaires • Interviews • Formulas • Analysis
ROI Case Study performed in 2002 by the library at the Bureau of National Affairs, Inc. (BNA) which provides a sample methodology for conducting ROI in a special library.
Bromley, Marilyn “Return on Investment”
Environmental Protection Agency (EPA) Regional Libraries and Centers Benefit-to-Cost Ratios
Ratio = Benefit : Cost The EPA Regional Libraries and Centers in 2004 created three methods for defining the value of services in terms of benefit-to-cost ratios. The three ratios calculate the following: • Research and
Interpretation • Distribution of
Information Resources • Integrated Analysis of
Costs and Benefits
Huffine, Richard “Business Case for Information Services: EPA’s Regional Libraries and Centers”
27
Performance Measurement in Federal Libraries
Type of Tool Tool Name ROI Tools and Methodologies Description How is this reference listed in the Bibliography?
Matthews Collection ROI Formula
ROI = Benefit / Cost
This ROI formula created by Joseph Matthews in 2001 calculates the collection ROI. The variables for this formula are defined as follows: Cost = Value of collection Benefit = Annual circulation multiplied by the value of the Machine Readable Cataloging (MARC) Record. Article also explains how to determine the value of the MARC record for your particular library.
Matthews, Joseph R. “The Value of Information: The Case of the Library Catalog”
Outsell ROI Formula
ROI = Benefits / Costs This ROI formula was derived from a 2001 briefing presented by Outsell, Inc. which focused on justifying corporate information centers. • Costs are the budget,
staff time spent, and other direct costs.
• Benefits are savings in time, savings in dollars, and outside revenues
Outsell “The Value of Libraries: Justifying Corporate Information Centers in the Year of Accountability” (page 10)
28
Performance Measurement in Federal Libraries
Type of Tool Tool Name ROI Tools and Methodologies Description How is this reference listed in the Bibliography?
Reference also includes a sample ROI statement with data and accompanying table.
Outsell ROI Questionnaire
Measures: • Time saved • Money saved
Questionnaire that asks customers to estimate dollar values for benefits received.
Outsell “The Value of Libraries: Justifying Corporate Information Centers in the Year of Accountability” (page 8)
Portugal ROI Formula
ROI = Net Income / Total Assets
Provides method to calculate ROI in terms of net income and total assets. This method can only be used to calculate assets which have an assigned dollar value. • Net income equals
revenue minus expenses and taxes
• Total assets can be the sum of inventory, equipment, personnel, facility, etc.
Portugal, Frank Valuating the Information Intangibles
29
Performance Measurement in Federal Libraries
Type of Tool Tool Name ROI Tools and Methodologies Description How is this reference listed in the Bibliography?
Strouse ROI Metrics
ROI metrics: • Time saved (Quantitative) • Money users save
(Quantitative) • Revenue generated
(Quantitative) • Library-supplied content and
services for decision-making (Qualitative)
• Level of decisions library supports (Qualitative)
• Relative value provided by information professionals in support of organization (Qualitative)
• Value of library intermediation (Qualitative)
Short article by Outsell, Inc. written in 2003 that covers ROI metrics, how to demonstrate value, collecting ROI data, and calculating ROI for special libraries.
Strouse, Roger “Demonstrating Value and Return on Investment: The Ongoing Imperative – Assessing Your Library’s Value Statement”
“Told You I’m Worth It: ROI and the Information Professional”
ROI techniques: • Strategic measures • Proactive measures • Creating value • Communicating value • Benchmarks
Distance Education Program video that focuses on techniques for ROI. (Video is available on inter-library loan to members of SLA)
Kassel, Amelia “Practical Tips to Help you Prove Your Value”
30
Performance Measurement in Federal Libraries
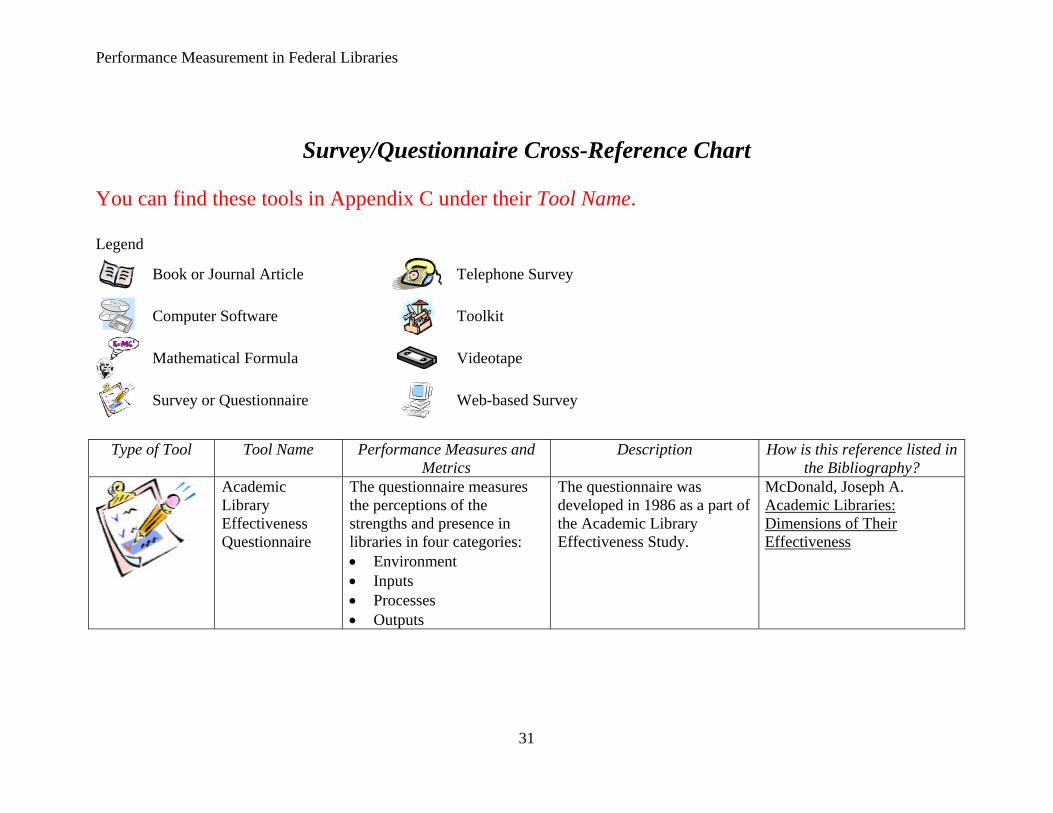
Survey/Questionnaire Cross-Reference Chart You can find these tools in Appendix C under their Tool Name. Legend
Book or Journal Article Telephone Survey
Computer Software
Toolkit
Mathematical Formula Videotape
Survey or Questionnaire
Web-based Survey
Type of Tool Tool Name Performance Measures and
Metrics Description How is this reference listed in
the Bibliography?
Academic Library Effectiveness Questionnaire
The questionnaire measures the perceptions of the strengths and presence in libraries in four categories: • Environment • Inputs • Processes • Outputs
The questionnaire was developed in 1986 as a part of the Academic Library Effectiveness Study.
McDonald, Joseph A. Academic Libraries: Dimensions of Their Effectiveness
31
Performance Measurement in Federal Libraries
Type of Tool Tool Name Performance Measures and Metrics
Description How is this reference listed in the Bibliography?
Counting on Results User Outcome Surveys
• Measures service results • Measures the impact of
services in the lives of library patrons
Six outcome measurement surveys created by the Library Research Service in 2001 and demonstrated in 45 public libraries nationwide in the following areas: • General Public Library • Local History and
Genealogy • Library as a Place • Information Literacy • Business and Career
Information • Basic Literacy
Lance, Keith C. “Counting on Results: New Tools for Outcome-Based Evaluation of Public Libraries”
IMLS Public Library Internet Survey
Measures statistical data for: • Public workstations
(users, number, and speed)
• Databases (queries, logins, and titles)
• Electronic services (e-reference transactions, public service time)
• Virtual visits • Instruction (formal and
point-of-use training)
Survey created by the Institute of Museum and Library Services in 2002 to demonstrate the ability of public libraries to collect and report network statistics.
Bertot, John C., et al. “Developing a National Data Collection Model for Public Library Network Statistics and Performance Measures”
32
Performance Measurement in Federal Libraries
Type of Tool Tool Name Performance Measures and Metrics
Description How is this reference listed in the Bibliography?
Impact of Information on Corporate Decision-Making Questionnaire
Corporate decision-making impacts: • Impact of handling
financial situations as a result of information services
• Enablement for managers or executives based on information services provided
• Avoidance of negative consequences
• Importance of information sources.
Significant corporate research project conducted in 1991-1992 by Joanne Marshall to measure the impact of information services on decision-making in financial sector. (This tool was also used in the health care sector environment and was modified accordingly. For information about this study, see references under Marshall in bibliography).
Marshall, Joanne G. “The Study of the Impact of the Special Library on Corporate Decision-Making” (numerous references exist in bibliography detailing the results of both the corporate study as well as the hospital study)
Library Electronic Resources and Services: Tell Us What You Think Survey
Measures: • Services and electronic
resources used • Satisfaction/dissatisfaction
with existing library resources and services
• Effects of services on library users lives
• Determination of key issues and needed improvements from the user’s perspective
• Recommendations for new electronic resources
Survey tool created in 2001 to help conduct a basic user assessment of the library’s electronic resources and services. This tool is intended to complement, deepen, and broaden the results obtained from simple statistics.
Bertot, John C., et al. Statistics and Performance Measures for Public Library Networked Services
33
Performance Measurement in Federal Libraries
Type of Tool Tool Name Performance Measures and Metrics
Description How is this reference listed in the Bibliography?
and services in the future
Modified SERVQUAL, Special Libraries Association (SLA) Version
Measures five dimensions of service: • Tangibles • Reliability • Responsiveness • Assurance • Empathy
This survey created by SLA in 1994 is designed to provide a basis for comparing special library performance with those of other service industries by using a modified SERVQUAL questionnaire.
White, Marilyn D. “Measuring Customer Satisfaction and Quality of Service in Special Libraries”
National Institutes of Health (NIH) Library User Study (2002)
• Customer satisfaction with library and library staff
• Value of library services and features
• Desired services not currently offered
Telephonic survey consisting of 103 questions aimed at determining the information needs of the NIH libraries' patrons in order to serve them better. The survey looks at what services library patrons use, how services are used, value of services, and suggestions for future improvements in library offerings.
NIH Library User Study
NIST Library Customer Survey (In-House Instrument)
Measures: • Print resources • Information resources • Database usage • Journal usage • Electronic resources • Value and impact of
library usage
National Institute of Standards and Technology (NIST) in-house survey of customer usage, satisfaction, and benefits for various research library resources.
National Institute of Standards and Technology (NIST) Library Customer Survey
34
Performance Measurement in Federal Libraries
Type of Tool Tool Name Performance Measures and Metrics
Description How is this reference listed in the Bibliography?
University of Pennsylvania Library Service Quality and Impact Survey
Customer satisfaction in five categories: • Assurance • Empathy • Access to collections • Library as a place • Tangibles
LIBQUAL-based survey containing 30 questions to measure three dimensions of level of service: minimum, desired, and perceived. (the original LIBQUAL survey consists of 43 questions)
University of Pennsylvania Library “Library Service Quality and Impact Survey”
35
Performance Measurement in Federal Libraries
Section 4: Conclusion As performance measurement in Federal libraries has become increasingly important for demonstrating a library’s worth and value, almost all historical methods of gathering data have proven to be essential for maintaining a library’s existence. From older methods of gathering information about inputs and outputs to newer, more advanced metrics in outcome evaluation and ROI, a Federal library must use each method as a series of building blocks to progress toward a realization of successful performance measurement. Tracking tangible, statistical data no longer suffices as justification for funding. Libraries must measure the tangible data along with the intangible (harder to quantify) data in order to meet their specific missions and goals, thereby proving, quantifiably, all funding needs. Each Federal library has special and unique needs which are not global to all Federal libraries. No “one size fits all” performance measurement tool exists for all Federal libraries. Having individual needs prevents one tool from being developed as all-encompassing for ROI and justification for continuing operation. Libraries should choose the performance measurement tools that best fit their needs from the reference charts provided as an important step for assessing progress toward goals and objectives. More importantly, Federal libraries should follow the progression of the PMM as it moves a library from inputs and outputs metrics through the outcomes, and ROI stages of performance measurement. This process may contribute to ultimate survival for a Federal library or information center.
Limitations of Performance Measurement Model As with all models, the PMM does not apply to every situation or to all special circumstances. This model is a general graphical depiction of a logical process that libraries can use as a guide or template to document performance measurement. Not all programs, services, or activities of a Federal library can be measured using the general model. For example, customer goodwill is a very difficult intangible outcome to measure. Customer goodwill is an important intangible asset of any good library; however, measuring this asset using the PMM would be difficult. It is true, however, that, even though an exact ROI or cost-benefit ratio cannot be provided, stepping through the process and clearly identifying “customer goodwill” as an asset will greatly enhance the perception of the library to stakeholders and funding sources.
Lessons Learned Subject Matter. The subject matter was completely new to the entire team with the exception of one team member who is a professional librarian. Thus, the learning curve for the majority of the team was steep and challenging.
36
Performance Measurement in Federal Libraries
Scope. The scope of the project was demanding. The thousands of pages of research on a new subject area were overwhelming during the initial stages of the project. Return on Investment. ROI is an elusive and difficult undertaking under the best of circumstances in a traditional business environment. When ROI is applied to the Federal library environment, there is an added level of complexity. It is not a well-documented and traditionally accepted concept. Rather, it is a new and extremely demanding undertaking, one which requires many cognitive cycles and an abundance of creative reasoning to apply this business practice to a non-traditional environment, such as Federal libraries.
Further Research Opportunities This research study is only the initial investigation of an extremely broad subject area. ROI and performance measurement will continue to be the focus of studies and discussions for years to come. The results of this study and the PMM lend themselves to several possible areas of further research. First, the PMM could be further refined and adapted to meet the specific needs of some of the broad categories of Federal libraries, such as the medical libraries. It could be adapted and then tested in an actual Federal library using the principles outlined here. A second area for further research could be to implement this basic framework into an interactive CD that could be distributed to the Federal libraries as a quick reference tool. Finally, this research could be used as a basis to take any one of the individual reference chart categories, such as outcome measurements, and conduct further research to develop a specialized toolkit that could become a ready-made template for Federal libraries
37
Performance Measurement in Federal Libraries
Bibliography
38
Performance Measurement in Federal Libraries
Copies of these documents are located in Appendix D, unless otherwise noted. Adams, Mignon & Beck, Jeffrey (1995). User Surveys in College Libraries. Chicago: Association of College and Research Libraries. Provides a wide variety of surveys for different types of libraries (on-line, in-college), based on the college needs and requirements. Title Page, Table of Contents and Introduction/Executive Summary only. AFLIS:Air Force Library Information System, . Library Annual Reports. 2003 ed. : AFLIS, 2003. An outline of the 2003 Air Force Library Annual Reports. American Library Association. Library Technology Reports (2002). pp.17-21, 36-51. URL available at: www.techsource.ala.org, accessed 11/10/04. This article offers practical guidance to determine the scope of a library’s electronic collection and measuring how these resources are used. It discusses subjects such as: characterizing electronic content investments, measuring access, using vendor-supplied statistics, and library-collected use statistics. It also provides technical examples and discusses the integrated library system (ILS), its functions, and reporting capabilities. Electronic functions include: online catalog searching, Web-based renewals, placing holds and recalls, user’s library records, online payments, interlibrary loan requests, and document delivery requests. Reporting capabilities include: documenting use pattern shifts, remote use, electronic material access, electronic material acquisition, collection reports, and OPAC search statistics. ARL:Associaation of Research Libraries, . ARL LibQual Questionnaire. : Association of Research Libraries, 2002. Survey identifying levels of services expectation by an academic library’s customers. Army,. Value of Library Services. : United States Army. This is a worksheet that shows an example of calculating the value of library services for the United States Army. It shows the actual services measured along with the values of the various library service statistics that would be used. Using the library service statistics along with a dollar value the total value of library services is calculated. Basch, N. Bernard. (1990). The President’s Task Force on the Value of the Information Professional: Updates, Highlights, and Conclusion. Special Libraries Association, 81(2), pages 97-101. An examination of the corporate information center and how it can compete in today’s competitive environment. An update to the 1987 document. Bauer, Kathleen (2000). Who Goes There? Measuring Library Web Site Usage. ONLINE Feature Article, URL available at: www.onlinemag.net/OL2000/bauer1.html, Accessed 09/21/04.
39
Performance Measurement in Federal Libraries
The author discusses web server log files, and emphasizes the continuing and growing importance of library web sites as vital service points and investments of funds and staff time. Therefore, besides analysis of web usage, other investigation means should be considered, such as questionnaires and cookies. On the more negative side, web usage analysis can be viewed as a potentially flawed measure of usage, just as when a book is loaned from a library, the library does not know why it was selected or if the book was read. Bertot, John Carlo, Charle McClure & Denise Davis, (2002). Developing a National Data Collection Model for Public Library Network Statistics and Performance Measures: Final Report. Journal. This report is a summary of the findings, issues, and conclusions of a project sponsored by Institute of Museum and Library Services (IMLS). The report outlines the degree to which public libraries, state library agencies, and consortia were able to collect and report network statistics data. Through field studies conducted as part of the study the researchers were able to draw conclusions and make recommendations for improving reporting on network data statistics. Bertot, John Carlo, Charles McClure & J. Ryan, (2001). Statistics and Performance Measures for Public Library Networked Services. : American Library Association. This is a manual which offers public librarians, State Library agencies, and policy makers a beginning set of network statistics and performance measures to measure network-based services and resources. The manual also serves as a guide to ensure that public libraries engage in standard measurement activities, instruct staff, reeducate public library governing boards, and assist librarians. Title Page, Table of Contents and Introduction/Executive Summary only. Biblarz, Dora, Stephen Bosch, & Chris Sugnet eds. (2001). Guide to Library User Needs Assessment for Integrated Information Resource Management and Collection Development. Lanham, MD: Scarecrow Press. This books explains types of data, techniques and methodologies and practices for the library user and his/her needs. Title Page, Table of Contents and Introduction/Executive Summary only. Bromley, Marilyn, (2002). Return on Investment. The Bureau of National Affairs, Inc. Quantum Case Study 3.04.02, Leadership Series: Measurement. The best article that I have found that actually describes a successful real-world ROI study of a real organization. The article covers the ROI process that was used at the Bureau of National Affairs, from start to finish. Canadian Health Libraries Association, Benchmarking Tool Kit. July 1998 ed. Toronto: CHLA/ABSC, 1998. This tool kit is broken down in to several steps to aid potential users in its use. Components included in the toolkit are: a library services questionnaire, library profile information, information on variables needed in indicator formulas and how to gather this
40
Performance Measurement in Federal Libraries
information. Also included are calculations of performance indicators, as well as suggestions for working with results and benchmarking partners. Title Page, Table of Contents and Introduction/Executive Summary only. Carrigan, Dennis (1992). Improving Return on Investment: A Proposal for Allocating the Book Budget. Journal of Academic Librarianship, 18(5), pages 291-298. This article discusses measuring the circulation of books as a method to demonstrate return on investment in order to purchase more materials (books) for libraries. Cook, Colleen & Bruce Thompson. (2001). Psychometric Properties of Scores from the Web-Based LibQUAL Study of Perceptions of Library Service Quality. Library Trends, 49(4), pages 585-604. This article discusses the LibQUAL score structure, score reliability, score correlation and scale standardized norms. The author argues that a measure of library quality based solely on collections has become obsolete. This led the Association of Research Libraries to institute its “New Measures” initiatives, which was the LibQUAL study. The LibQUAL study helped in identifying areas of potential improvement at a given library, and identifying similar libraries with more favorable profiles whose behavior might then be modeled. Cook, Colleen, Fred Heath & Bruce Thompson, (2002). Score Norms for Improving Library Service Quality: A LibQUAL Study. Libraries and the Academy, 2(1), pages 13-26. Based on data from 20,416 LibQUAL+ respondents from forty-three universities, the authors developed norm tables to allow librarians to interpret LibQUAL+ scores with respect to typical profiles at other universities. Norms were developed for both "perceived" service scores and "gap" scores (e.g., "perceived" performance minus "minimally acceptable" performance). Cook, Colleen, et. al. (2001). The Search for New Measures: The ARL ‘LibQUAL Project – A Preliminary Report. Portal: Libraries and the Academy, 1, pages 103-112. The author discusses the pilot project launched by Association of Research Libraries to assess service quality among research libraries. The pilot project proposed, derived from SERVQUAL (for SERVice QUALity), addresses user assessments of service delivery. The author argues that by measuring the relationship between service delivery and user satisfaction, librarians hope to control costs by directing resources to those service quality issues identified by users as most important and in most need of attention. The author also discusses the methodology used for the project. Cook, Colleen & Heath, Fred M. (2001). Users’ Perceptions of Library Service Quality: a LibQUAL Qualitative Study. Library Trends, 49(4), pages 548-584. Describes how LibQual seeks to measure the gap between expected service and perceived services. Includes interviews with users of research libraries that use LibQUAL and how the data from these interviews will be included in future LibQUAL surveys.
41
Performance Measurement in Federal Libraries
Covey, Denise Troll. (2002) Usage Studies of Electronic Resources, Usage and Usability Assessment: Library Practices and Concerns. URL available at: www.clir.org/pubs/reports/pub105/section3.html, Accessed 09/21/04. The author discusses Transaction Log Analysis (TLA), a method to study unobtrusively interactions between online information systems and the people who use them. This provides an effective way to detect discrepancies between what users say they do and what they actually do when they use an online system or Web site, the OPAC and ILS, licensed electronic resources, digital collections, etc. Also, TLA is a good way to test out items such as whether placement or configuration of library computers affects user behavior. Dinerman, Gloria. (2002). If You Don’t Know, Ask : the art and craft of survey development and analysis. Information Outlook, 6(7), pages 6-10. This article outlines what to include in building an effective survey and how to phrase questions. The process includes selecting a theme, constructing questions, selecting an analyzing database, pre-testing the survey, conducting the survey, entering completed data into database, tallying the responses, interpreting the results, and writing conclusions. Henczel, Sue. (2002). Benchmarking, Measuring and Comparing for Continuous Improvement. Information Outlook, 6(7), pages 12-18. This article discusses benchmarking in general. The author provides definitions and types of benchmarking and the historical development of benchmarking to bring us to today. A long list of the benefits of benchmarking is included as well as some of the pitfalls and problems. The author also describes some of the stages required in developing a benchmarking process and how to choose what areas to measure. Tips for successful benchmarking and current trends and projects (with a page devoted to special libraries) sum up the article. Herget, Josef. "The Cost of (Non-)Quality: Why it Matters for Information Providers." FID News Bulletin. May 1995: 156-159. This article focuses on the myth that “quality costs money.” The article proves quantitatively that addressing quality concerns saves far more money that it costs an organization. Hernon, Peter, (1996). Numbers, Numbers, and More Numbers. Journal of Academic Librarianship, 22(4), pages This short article underlines that the evaluation of library services involves at least 4 measurement concepts: extensiveness, effectiveness, efficiency, and quality (satisfaction). It states that these 4 measurement concepts present performance measures as possible indicators. Holt, Glen E. & Donald Elliott, (2003). Measuring Outcomes: Applying Cost-Benefit Analysis to Middle-Sized and Smaller Public Libraries. Library Trends, 51(3), pages 424-440.
42
Performance Measurement in Federal Libraries
This reading looks at a cost-benefit methodology which was developed and applied to five large public library systems. The first cost-benefit analysis (CBA) done by the researchers the methodology was tested on the operations of the St. Louis Public Library. This first CBA proved very successful and showed the robustness and sensitivity of using CBA in the library setting. With success in larger libraries, the researchers have now decided to apply the methodology to middle-sized and smaller libraries. The remainder of the reading outlines the changes to the methodology from the first CBA in large libraries in St. Louis to the second CBA which will involve mid-sized and smaller public libraries. Huffine, Richard. Business Case for Information Services: EPA's Regional Libraries and Centers. EPA 260-R-04001 ed. Washington: United States Enviornmental Protection Agency, Office of Environmental Information, 2004. This article explores the extent and nature of the library services at the EPA using ROI and cost-benefit ratios. Institute of Museum and Library Services. "Frequently Asked OBE Questions." IMLS: All About Grants and Awards: Current Grantee Resources. Institute of Museum and Library Services. 07 Nov. 2004. URL available at: <www.imls.gov/grants/current/crnt_outcomes.htm>. This reading focuses on outcome-based evaluations. It answers some general questions on outcome-based evaluation, as well as provides examples The document is arranged in a similar format to that of a frequently asked question document, which makes it easy to find specific info on outcome-based evaluation. Institute of Museum and Library Services. Perspectives on Outcome Based Evaluation for Libraries and Museums. URL available at: http://wwwimls.gov/pubs/pdf/pubobe.pdfThis article covers the history, background, rationale, and importance of Outcome Based Evaluations. It does a great job of explaining and differentiating between output and outcome assessments and evaluations. Furthermore, the article contrasts and compares effectiveness versus efficiency, and how these two terms relate to outcome assessments is clearly demonstrated. Kassel, Amelia (2002). Practical Tips to Help You Prove Your Value. Marketing Library Service, 16(4). URL available at: http://www.infotoday.com/mls/may02/kassel.htm, accessed 10/01/04. This article contains the basic components of determining ROI and marketing the library organization. It refers to Factiva, SLA, and Outsell resources, and it offers additional reading sources. Subjects include demonstrating ROI, understanding corporate culture, performing as an information professional, considering change of job titles and names for promotional purposes, developing new competencies, skills, and services, saving costs, and taking proactive measures.
43
Performance Measurement in Federal Libraries
**The video: “Told you I’m worth it: ROI and the Information Professional” is for sale or available from interlibrary loan for SLA members; see www.sla.org/content/learn/learnwhere/products/videoreg.cfm. King, David N. (1987). The Contribution of Hospital Library Information Services to Clinical Care: A Study in Eight Hospitals. Bulletin of the Medical Library Association, 75(4), pages 291-301. This is a study of health professionals in 8 hospitals in Chicago, how they use their medical library, and how useful the library is to them in their work. A questionnaire was used to survey participants and focused on 5 areas: Quality of information, Cognitive value of information, General impact of information on the quality of patient care, Impact of information on case management, and Performance of library (personnel) in providing information. Participants were assessed by the frequency in which they used the library services. Study showed that decisions were improved as a result of using the library. King, Donald W., et. al. (2003). Library Economic Metrics: Examples of the Comparison of Electronic and Print Journal Collections and Collection Services. Library Trends, 51(3), pages 376-400. This article goes step-by-step through how to conduct a cost/benefit analysis or ROI for collections and Electronic Print Journals. Lance, Keith Curry, et al. (2001). Counting on Results: New Tools for Outcome-Based Evaluation of Public Libraries. Library Research Service, pages i-ix, Appendix G and H. The Counting on Resutls Project demonstated the potential utility of new tools for outcome based evaluations of public library services. The project developed these tools and demonstrated their use by 45 public libraries representing 20 states and all 4 major regions of the United States. Lev, Baruch. "Sharpening the Intangibles Edge." Harvard Business Review June 2004: 109-116. This article outlines the importance of a business’s intangibles (skilled work force, patents and know-how, software, strong customer relationships, etc) and purports that these intangibles are often overlooked, undervalued and mispriced. The author offers a way to track how intangibles such as R&D can be matched to ROI. Madziak, Anne Marie & Gwen Wheeler. "The Library's Contribution to Your Community: A Resource Manual for Libraries to Document their Social and Economic Benefits to the Local Community:Case Study in the Markdale Public Library ." Southern Ontario Library Service. 30 Aug. 2000. URL available at: <www.library.on.ca/consulting/casestudies/markdale.htm>. This case study explores how Markdale Public Library (Canada) was able to document the library’s contributions to the quality of life in its community, measuring its value as a public service and proving its worthiness for being funded.
44
Performance Measurement in Federal Libraries
Marshall, Joanne Gard, (2000). Determining Our Worth, Communicating Our Value. Library Journal, 125(19), pages 28-30. This article discusses measurement of value and worth as evaluative techniques for outcomes of a librarian’s impact instead of just for self-preservation. The article also provides a list of intangibles that investors value most in companies. These include: strategy execution, management credibility, quality of strategy, degree of innovation, ability to attract talented people, market share, management experience, quality of executive compensation, quality of major processes, research leadership, and customer satisfaction. Marshall, Joanne G. (1992). Impact of the Hospital Library on Clinical Decision Making: The Rochester Study. Bulletin of the Medical Library Association, 80(2), pages 169-178. This article is a study of health professionals in the Rochester, NY area. This study is similar to the King study done in Chicago. Some additional questions were added to the survey for this study regarding specific changes in patient care, avoidance of adverse events (hospital stay, surgery, etc.), and the importance of the library among all other information sources used by participants. Both studies confirmed that the information provided by hospital libraries impacts clinical decision-making. Marshall, Joanne, (1993). The Impact of Information Services on Decision Making: Some Lessons from the Financial and Health Care Sectors. Information Policy Briefings, pages 195-211. This is a summary of both the medical library and corporate library studies performed by Joanne Marshall. A copy of the questionnaire from the corporate library study as it is available in its entirety is included. Marshall, Joanne Gard, (2003). Influencing our Professional Practice by Putting our Knowledge to Work. Information Outlook, 7(1), pages 40-45. This article discusses the importance of redefining the research statement of the Special Libraries Association to one facilitating evidence-based practice. Marshall, Joanne, (1992). A Study of the Impact of the Special Library on Corporate Decision-Making. Washington, D.C.: Special Libraries Association. This was similar to the hospital studies performed by King and Marshall, but it was used to determine how the use of corporate libraries impacted decision-making. This took place in Toronto, Canada. Some changes were made to the Rochester hospital survey, but it was virtually the same. The results of the study demonstrated: Importance of changes made in corporate decisions, Value of financial transactions, Specific aspects of decision making, Avoidance of negative outcomes, and Value of the information provided by the library as compared to other sources. This publication contains the full questionnaire. Matarazzo, J.M., et al. (1987). President’s Task Force on the Value of the Information Professional. Washington, D.C.: Special Libraries Association.
45
Performance Measurement in Federal Libraries
This study was performed to determine the value of information and the information professional. It was prompted by a decision made by the federal government in 1986 to revoke the ruling that required hospitals to maintain a medical library in order to qualify for funding. This study focused on time and its monetary equivalent, savings, gains, or avoiding liability, and the worth of qualitative anecdotal evidence. Cost/benefit analyses were performed for several corporations and results of surveys demonstrated time was saved and there was an increase in job proficiency. Document contains the full questionnaire used in the study. Mathews, Joseph R. (2001). The Value of Information: The Case of the Library Catalog. Technical Services Quarterly, 19, pp. 1-16. This article gives very clear examples of how to conduct ROI analysis for Collections, Bibliographic Records, MARC Records, Enhanced MARC Records, and Online Collections. The article also gives some valuable benchmarks. McClure, Charles R. & Betsy Reifsnyder, (1984). Performance Measures for Corporate Information Centers. Special Libraries, 75, pages 193-204. This article stresses the measurement of output over input as used in past performance measures. It uses library performance measures as a comparison to develop corporate information centers measurements. Libraries measure community penetration, user services, resource management, and administration and finance. As a proposal, corporate information centers should consider: corporate awareness of library services, clients as a percentage of jurisdiction of population, reference transactions per capita, reference fill rate, and timeliness of information delivery. McClure, Charles R. (1994). User-Based Data Collection Techniques and Strategies for Evaluating Networked Information Services. Library Trends, pages 591-608. The argument here is that “The rapid development of networked information resources and services has not been matched with ongoing assessments of how well these resources and services meet users needs.” The article’s purpose is to provide an overview of the importance of user-based evaluations of networked information services, review a number of data collection techniques that provide a user perspective when assessing networked information services, and offer practical suggestions and guidelines for using such techniques, McDonald, Joseph A. and Lynda Basney Micikas. Academic Libraries: Dimensions of Their Effectiveness. CT: Westport, 1994. This book discusses the importance and value of measuring library effectiveness. The author establishes criteria for measuring library effectiveness and includes questionnaires and sample characteristics in the appendicies. Title Page, Table of Contents and Introduction/Executive Summary only. Miller, Rush & Schmidt, Sherrie. E-Metrics: Measures for Electronic Resources. Keynote, 4th Northumbria International Conference on Performance Measurement in Libraries and Information Services.
46
Performance Measurement in Federal Libraries
This paper focuses on giving an explanation of the e-Metrics project which is aimed at finding better ways to measure and keep track of electronic resources and services. National Information Standards Organization (NISO), (1997). Library Statistics: An American National Standard Developed by the National Information Standards Organization. Bethesda, MD: U.S. National Information Standards Organization Press This document provides definitions of terms that may be useful for reporting basic library statistics at the national level. The standard addresses what needs to be collected by areas such as reporting unit and target population, human resources, collection resources, physical facilities, finances, and service and activity measures. Basic data categories that apply to the various library types are also identified. National Institute of Health, (NIH) "2002 NIH Library User Study." (2002). This is a copy of the 2002 NIH Library User Study survey. It shows the questions used and then also shows the use of the tables to display the results of the responses to each question on the survey. National Institute of Standards and Technology, (NIST) . "NIST Library Customer Survey." . This is a survey that has the questions used by the National Institute of Standards and Technology. The survey is broken down according to various forms of information resources that a library customer may make use of. Some included sections covered by the survey are library print and electronic resources, use of information resources obtained elsewhere versus those obtained through NIST, use of databases, value of information resources from the NIST library, impact of journal cancellations. Niteki, Danuta A. & Hernon, Peter (2000). Measuring Service Quality at Yale University’s Libraries. Journal of Academic Librarianship, pages 259-273. The Yale research project outlined in this article took the basic SERVQUAL survey instrument (which is based on the gaps model of service quality) and eliminated two of the five dimensions (assurance and empathy) which were replaced with two addition dimensions of importance for libraries. The additional dimensions were derived from library staff and current users. Online Computer Library Center Inc. (OCLC), "Libraries: How they Stack Up." (2003). A series of graphically-represented statistics comparing libraries to their chief competitors in all functional areas. Outsell. "ToolKit: The Why and How of Benchmarking." Outsell: Information Briefing July 2002: . This briefing from Outsell, Inc. addresses a five step process for Benchmarking: Scoping and Design, Choosing Benchmarking Partners, Data Collection, Reporting and Analysis, and Recommendations and Action Items. Also addressed are the internal teaming and research responsibilities, described as the foundation of benchmarking.
47
Performance Measurement in Federal Libraries
Outsell. "Value of Libraries: Justifying Corporate Information Centers in the Year of Accountability." Outsell: Information Briefing April 2001: . This article addresses the basics of how a library can be prepared for and survive being called on to demonstrate their value. Specifically, the article addresses the importance of understanding organizational goals, getting your staff and stakeholders on board, how to tell your story, how to collect data, how to calculate ROI, how to anaylize user feedback, and when to use benchmarking to prove your point. Poling, Nikki, (2002). Ahead of Behind the Curve. Information Outlook, 6(7), pp. 22-26. This article contains three interviews with special librarians to discuss the importance of benchmarking and to see where organizations stand in defining and implementing the benchmarking process. The author interviewed Roger Strouse with Outsell, Inc., David Shumaker of MITRE Corporation, and Annette Gohlke of Library Benchmarking International. The author asked such questions as: “How would you define benchmarking?”, “Is benchmarking a dying topic?”, “Where would someone begin the benchmarking process if they had never done it before?”, and “Can you identify any problems with benchmarking?” Portugal, Frank H. (2000). Valuating Information Intangibles: Measuring the Bottom Line Contribution of Librarians and Information Professionals. Washington, DC: Special Libraries Association. Frank Portugal's book Valuating Information Intangibles discusses the indirect valuation of information resources. He has four different methodologies: 1. Return on investment and cost benefit analysis. Focuses on benefits to the organization overall, rather than to the individual, often isolated, user, 2.Knowledge value added. Estimates the amount of embedded knowledge residing in or accruing to new products and services, then compares time investment to rank sub-processes in terms of their costs, 3. Intranet team forums track the flow of information into new products and services by monitoring discussions and individual information streams, loci and topics using specialized software. The value of new products and services can be compared to the costs and the usage of the information which produced them, and 4.Intellectual capital valuation. Measures growth in and benefit of intellectual assets by monitoring five different perspectives: customer; process; development; human; and financial. Title Page, Table of Contents and Introduction/Executive Summary only. Sadlon, Elizabeth. Workbook: Outcome Measurement of Library Programs (Tallahassee: State Library of Florida) URL available at http://dlis.dos.state.fl.us/bld/research_office/evaluation.htlm. This reference provides step-by-step instructions and examples on how to conduct an Outcome Measurement in large or small libraries. The reference starts by alleviating concerns and ends with outcome-based examples. Steffen, Nicolle. "Time to Tell the Whole Story Outcome-Based Evaluation and the Counting on Results Project." Public Libraries July/August 2002: .
48
Performance Measurement in Federal Libraries
This article discusses outcome-based evaluation and the challenges faced by librarians in collecting outcome data. It explains how through the Counting on Results Project a set of standardized questionnaires for collecting library use outcomes was developed. Strouse, Roger. (2003). Demonstrating Value and Return on Investment: The Ongoing Imperative- Assessing Your Library’s Value Statement. Information Outlook, pages 79-86. This article covers the current status of value measurement, suggested ROI metrics, collecting ROI data, benchmarking for corporate libraries, ROI as a marketing tool, and ROI implication for special libraries. Talbot, Dawn E., Gerald R. Lowell & Kerry Martin, (1998). From the Users’ Perspective---The UCSK Libraries User Survey Project. Journal of Academic Librarianship, pages 357-365. This article covers how the University of California, San Diego conducted its first ever comprehensive user survey in 1996. It covers the user-driven survey methodology, its successes and failures, and conclusions about the survey process. Ulrich, Dave, and Norm Smallwood. "Capitalizing on Capabilities." Harvard Business Review June 2004: 119-127. This article looks at organizational capabilities in businesses, and shows how leaders can evaluate them and build the ones needed to create intangible value. University of Pennsylvania Library, . Library Service and Quality Impact Study. 2002 ed. Philadelphia: University of Pennsylvania, 2002. A diagram of an adapted LIBQUAL questionnaire and corresponding results. White, Marilyn Domas, Eileen G. Abels & Danuta Nitecki, (1994). Final Report: Measuring Customer Satisfaction and Quality of Service in Special Libraries. This report presents a description of how existing quality measurement instruments, SERVQUAL (Performance-Minus-Expectations Approach) and SERVPERF (Performance-Based Approach), were studied, surveyed, tested, adapted, and validated for special library use. The report offers interested parties additional avenues to explore (including seven pages of formal References). Whitehall, Tom (1995). Value in Library and Information Management: A Review Library Management, 16(4), pages 3-11. This article discusses the application of cost benefit analysis to libraries for justification and in making decisions about the allocation of available funds. The article also contains questions about how to put a dollar amount to the value of information and value of service given.
49
Performance Measurement in Federal Libraries
Appendix A: Subject Matter Expert Interviews
50
Performance Measurement in Federal Libraries
MIM GROUP INTERVIEW WITH
ROBERTA I. SHAFFER, J.D., M.Ln., DIRECTOR OF EXTERNAL RELATIONS
AND PROGRAM DEVELOPMENT, COLLEGE OF INFORMATION STUDIES,
UNIVERSITY OF MARYLAND, COLLEGE PARK
RETURN ON INVESTMENT (ROI)
FOR LAW AND OTHER SPECIAL LIBRARIES
September 16, 2004
The MIM Group met with and interviewed Roberta I. Shaffer on September 16, 2004, regarding library assessment and ROI. Ms. Shaffer provided insight from her experience in private sector law firms. She described the manner in which a law firm works and invoices its clients through billable hours. Law librarians bill their time by determining their unique contribution to client service. Many law firms in the mid-1990s used Barrister and Elite software tools (commercially-off-the-shelf billing systems) to determine ROI for the law library and library staff. Ms. Shaffer provided the following contacts and references to gain additional information on ROI for libraries:
• Washington, DC Law Librarian Austin Doherty • JoAnne Marshall, University of North Carolina • Frank Portugal, SLA and ROI expert
Group members individually volunteered to gather information from the contacts noted above. The MIM Group thanked Ms. Shaffer for sharing her experience and expertise in this subject.
51
Performance Measurement in Federal Libraries
MIM GROUP INTERVIEW WITH
EILEEN G. ABELS, Ph.D., ASSOCIATE PROFESSOR,
COLLEGE OF INFORMATION STUDIES, UNIVERSITY OF MARYLAND,
COLLEGE PARK
PRESENTING VALUE AND ROI IN FEDERAL SPECIAL LIBRARIES
October 7, 2004
The MIM Group met with Eileen G. Abels, Ph.D., on October 7, 2004, to interview her regarding library assessment and Return on Investment (ROI). Dr. Abels indicated there are plenty of sources to gather information about library assessments for special libraries. Methodologies have been set, but often not followed. Some methodologies may not be completely compatible for every special library. For example, NIST is not a typical special library because its function is more academic and critical to NIST’s mission than other special libraries. Dr. Abels cited the Frank Portugal book in which the author describes how to calculate ROI in a library. Dr. Abels noted that the Portugal approach is complex and costly. She believes that it is not feasible to perform a true ROI for special libraries. Dr. Abels stated that a more reasonable approach is to adapt the Balanced Scorecard method and that some health librarians have utilized this approach. Surprisingly, many librarians do not know the mission of their parent organizations. Therefore, they do not know how to position their library’s value. Dr. Abels recommended the book, Making Sense of Intellectual Capital – Designing a Method for the Valuation of Intangibles, by Daniel Andriessen (Elsevier Butterworth Heineman, 2004). ROI utilized by BNA (Bureau of National Affairs) was discussed. ROI is determined as follows: Measurable Indicators – Outcome Evaluation – Metrics = Value (match to budget). Dr. Abels discussed her work with Paul Kantor and Tefko Saracevic (Rutgers University, School of Communication, Information and Library Studies) on a study on library value. In another study conducted for the Medical Library Association, one Medical School Library indicated that 100 percent of the medical students use the Medical Library. They compared students to graduation rates, ranking of students, successful recruiting (because
52
Performance Measurement in Federal Libraries
of the library), best doctors, etc. The study found a link between usage and value. For example, if 100 percent of a certain group of users have used a particular library service, and this service is linked to successful achievement of a goal, then the service can be linked to the success. This provides value to the user group. Dr. Abels cited the Jose Marie Griffith/King study that provided measures based on the hypothetical use of how much time and money would a user spend to find information. In Dr. Abels’ opinion, the measures are flawed; the Griffith/King study did find value, but reliability of the value is questionable. An observation came from the group that one needs a good output measurement first in order to perform an evaluation to achieve ROI. Dr. Abels will provide to the group a MLA report with a user matrix that discusses goals and services. A member of the group discussed three elements in ROI measurement: time saved, money saved, revenue generated. A study by Joanne Marshall was cited. Medline access/search was compared to reduced number of days in hospital. Mention was made regarding patents and lawsuits as examples of value. A librarian may provide information that will lead to a patent or prevent an organization from investing in product development if a patent already exists. A librarian may provide information that contributes to winning a court case. Dr. Abels presented an excellent example of value from a Department of Transportation study. She interviewed department lawyers and asked, “What is the value of the library to you?” An excellent answer: “I WON a court case!” However, it was pointed out that the library in itself did not win the case; it was a contributor to success. Carrying from that point, it is not particularly easy to determine to what percentage (metric) the library contributed, because the contribution cannot be isolated. Dr. Abels brought a few MLA articles for the group to read and include in its study. A group member mentioned that she had visited the NIST Research Library in Gaithersburg. This library appears to “do all the right things” -- conduct surveys, perform benchmarks, join in partnerships with business units, etc. Despite good ROI performance, using ROI for the purpose of budget justification still remains subjective. Management overseeing the library cut the budget last year and will cut it again this year. In response, Dr. Abels cited an example from the American Bankers Association Library. The library was successful and made money; however, new management arbitrarily closed the library. Metrics were discussed as they relate to the following subject areas:
• Science/Technology – Patent analysis provides either dollars or dollars saved; • Law – Library research can help win the case; • News – Libraries can provide credit to publications in articles. Deborah Barreau,
University of Maryland graduate, now on the faculty of UNC, won a SLA
53
Performance Measurement in Federal Libraries
research grant to study the role of libraries in news organizations. Currently, there is no policy on citing library/librarian credit in news articles in most news organizations.
Which libraries are “doing the right things” to achieve ROI? NIST and NIH were mentioned. The interview ended with the following discussion and citations:
• Database measurement: Who used it? For how long? • Good example of costs metrics with overhead effects: Welch Library at Johns
Hopkins University. • Two good articles by Tom Whitehall. • RIO is a bridge too far – An observation presented by a group member. • Work performed by Lisl Zach. • Kantor study on book use. What is the true cost? Are all libraries measuring the
same thing(s) to determine cost? • Costs are not standardized. Dr. Abels has written an article on this subject and
will provide a copy to the group. The group thanked Dr. Abels for her time and for sharing her experience and expertise. We will follow up with suggested readings.
54
Performance Measurement in Federal Libraries
Appendix B: Site Visit Summaries
55
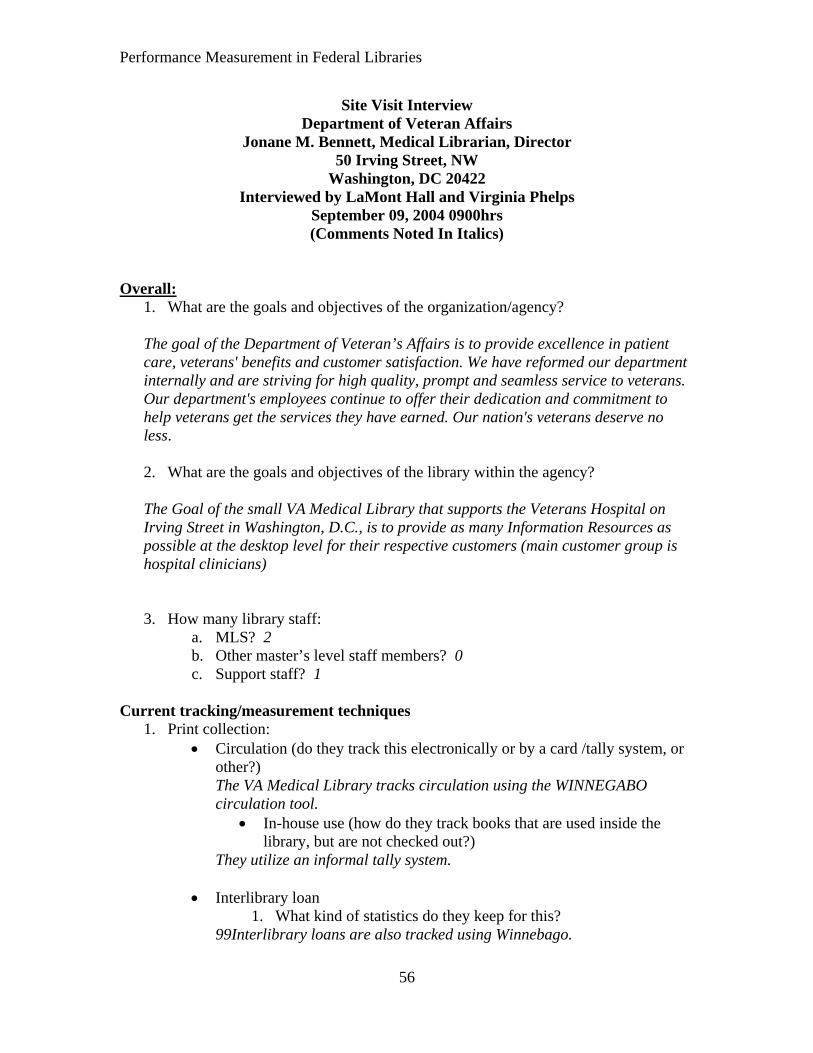
Performance Measurement in Federal Libraries
Site Visit Interview Department of Veteran Affairs
Jonane M. Bennett, Medical Librarian, Director 50 Irving Street, NW
Washington, DC 20422 Interviewed by LaMont Hall and Virginia Phelps
September 09, 2004 0900hrs (Comments Noted In Italics)
Overall:
1. What are the goals and objectives of the organization/agency? The goal of the Department of Veteran’s Affairs is to provide excellence in patient care, veterans' benefits and customer satisfaction. We have reformed our department internally and are striving for high quality, prompt and seamless service to veterans. Our department's employees continue to offer their dedication and commitment to help veterans get the services they have earned. Our nation's veterans deserve no less. 2. What are the goals and objectives of the library within the agency? The Goal of the small VA Medical Library that supports the Veterans Hospital on Irving Street in Washington, D.C., is to provide as many Information Resources as possible at the desktop level for their respective customers (main customer group is hospital clinicians)
3. How many library staff: a. MLS? 2 b. Other master’s level staff members? 0 c. Support staff? 1
Current tracking/measurement techniques
1. Print collection: • Circulation (do they track this electronically or by a card /tally system, or
other?) The VA Medical Library tracks circulation using the WINNEGABO circulation tool.
• In-house use (how do they track books that are used inside the library, but are not checked out?)
They utilize an informal tally system.
• Interlibrary loan 1. What kind of statistics do they keep for this?
99Interlibrary loans are also tracked using Winnebago.
56
Performance Measurement in Federal Libraries
2. Both for what they loan out and what they order in from other libraries
2. Electronic resources
• Internet 1. Do they track hits to their webpage? 2. Have they conducted usability studies?
3. How do they determine/manage information on the webpage?
• Intranet 1. Do they track hits?
They do not presently track Intranet usage via log analysis. However, they do try and track online database usage. Obtaining access to logs from server owners has been a challenge, especially due to the firewall system that the VA library must employ to protect patient records and comply with privacy issues.
2. Do they poll staff?
They utilize an in-house advisory council which meets on a regular basis to discuss quality of service, online database access, journal subscriptions etc.
3. In-house usability studies?
The VA Medical Library conducts a yearly needs assessment, including a questionnaire (provided).
• Online databases
1. Do they track hits?
They get limited vendor statistics for online database usage. Again, very difficult to track due to firewall restrictions. 2. Do they have cost per hit stats?
Not at this time.
57
Performance Measurement in Federal Libraries
3. Services • Reference questions
1. Do they have cost per question stats?
2. Do they measure reference questions by simple tallying,
weight/difficulty of questions, length of time to answer questions?
3. Have they conducted any surveys from users (internal or external)
on any of the above?
4. Do they keep statistics/ measurements of anything not listed above?
They compile an Annual report (provided)-- straight statistics They also assess user needs for training/programs and online tutorials. Furthermore they track statistics on numbers of people that signed up, numbers of people who complete training. However, they do not presently measure the impact or depth of influence that the training and tutorials provide to the customer base.
OBSERVATIONS: They do not have to worry about budgeting, because their library must be maintained for
hospital accreditation by the "joint commission"
They make extensive use of the online community chat (VALNET- VA Library Network) to share problems/solutions
58
Performance Measurement in Federal Libraries
Site Visit Interview Summary EPA Library
Richard Huffine EPA West Building
Constitution Avenue and 14th Street, NW Interviewed by Akil Hawthorne & Nadir Jusufbegovic
Overall: 1. What are the goals and objectives of the organization/agency? The goal and objective of the agency is to protect human health and the environment. 2. What are the goals and objectives of the library within the agency? The goal of the library is to support the information and research needs of scientist, engineers, researchers, policy analysts, lawyers and all those who are working to achieve the mission of the EPA to protect human health and the environment. 3. How many library staff: MLS, other master’s level, Support staff? The library has 100-200 staff members spread across different areas. The staff has at least 1 masters and many have 2 masters’ degrees. They also have contractors that work throughout their library as well. Although contractors are overseen by EPA management staff they are in a sense separated as they have their own way of doing things and that is not really controlled by EPA managers unless there is a problem or goals/objectives that are not being met. Current tracking/measurement techniques Do they track? And if so, what methods do they use? As far as what we were told the EPA library that we visited currently tracks the following:
• Interlibrary loan • E-mails sent/received • Reference referral • Research
Although these were the only things mentioned we are pretty sure that they track more than just these things.
It is important to note that tracking is done on an individual basis by each of the twenty eight EPA libraries. Have they conducted any surveys from users (internal or external) on any of the above? Do they keep statistics/measurements of anything not listed above?
59
Performance Measurement in Federal Libraries
The representative that we met with explained that they do conduct surveys. However, he did not elaborate on what kind of surveys they do and specifically what they measure. He also did not elaborate on any other statistics that they may keep. Other comments/observations/topics covered In addition to these things some other things that should be highlighted from our visit are:
• Mr. Hufine felt it important to recognize the difference between ROI for the library vs. ROI for the librarian
• Also Mr. Huffine feels that there needs to be clear distinction between Outcome assessment and Output assessment. For outcome assessment the impact is what matters whereas for Output assessment it is just looking at how much is returned (ex.# of books checked out).
60
Performance Measurement in Federal Libraries
Site Visit Interview Barbara Silcox
National Institute of Standards and Technology (NIST) Research Library Gaithersburg, Maryland
Interviewed by Connie MacDonald September 24, 2004
(Comments Noted In Italics) Overall: 1. What are the goals and objectives of the organization/agency?
NIST’s mission is “to develop and promote measurement, standards, and technology to enhance productivity, facilitate trade, and improve the quality of life.” *
2. What are the goals and objectives of the library within the agency?
The NIST Research Library supports researchers in the NIST laboratory programs at the Gaithersburg, Maryland location.
3. How many library staff: • MLS? 8 • other master’s level? 1 • Support staff? 0
Current tracking/measurement techniques 1. Print collection:
• Circulation (do they track this electronically or by a card /tally system, or other?) The NIST Library tracks circulation use through the on-line catalog statistics.
• In-house use (how do they track books that are used inside the library, but are not checked out?)
The librarians ask customers not to re-shelve. The staff scans the used materials two times a day.
• Interlibrary loan
1.what kind of statistics do they keep for this? 2.Both for what they loan out and 3.what they order in from other libraries
NIST uses the Inter-Library Management System (Iliad) for loaning out and ordering in. This also includes document delivery.
61
Performance Measurement in Federal Libraries
2. Electronic resources • Internet
1.Do they track hits to their webpage? 2.Have they conducted usability studies? 3.How do they determine/manage information on the webpage?
Electronic services at NIST Library began in the mid-1990’s. They do try to track Internet use through log analysis; however, obtaining access of logs from server owners has been a challenge. The Internet, for external customers, does not receive as many hits as the intranet and has limited information, compared to the intranet which supports NIST researchers.
In the American Customer Satisfaction Index E-Government Satisfaction Index of September 21, 2004, conducted by Larry Freed of ForeSee Results, the NIST Internet site, “The National Institute of Standards Technology site, www.nist.gov, shows a strong score of 78 for the second quarter in a row”. This information was presented in the “Portals: Upward Trend Since First Measurement.”
Freed, Larry (September 21, 2004). American Customer Satisfaction Index E-Government Satisfaction Index. www.ForeSeeResults.com
• Intranet 1.do they track hits? 2.Do they poll staff? 3.In-house usability studies?
In 2001, NIST Library redesigned its Virtual Library and installed a content management system (Empower Content Management System). There is one web manager and one content approver. All the staff owns some piece of the content as content owners. The subject is usually tied to the content owners’ association with various internal research organizations/functions as part of the Library Advisory Board. Once again, it is a challenge to perform log analysis as the content resides on various servers.
• Online databases
1.do they track hits? 2.Do they have cost per hit stats?
This is an area that NIST Library staff plans to measure beginning in 2005. The online databases are getting costly and they need to justify use. This is a heavily used resource areas in general.
3. Services
• reference questions 1.do they have cost per question stats? 2. Do they measure reference questions by simple tallying,
weight/difficulty of questions, length of time to answer questions?
62
Performance Measurement in Federal Libraries
Yes. NIST Library staff keeps a tally of: Who is in the library Who is on the phone requesting service Which divisions are using the Library Who/what are the complaints What are the trends in service requests.
Staff members have found that most complaints are related to access problems on
publisher’s online sites.
Have they conducted any surveys from users (internal or external) on any of the above? NIST conducted a comprehensive customer survey and benchmark study in 2001* (which we received in our handouts). The staff conducts small surveys to critical questions and concerns on an ad hoc basis. Do they keep statistics/ measurements of anything not listed above? The staff measures its own effectiveness and values by analyzing:
• Staff members’ professional partnership with their assigned NIST organization, i.e. customer relationships;
• Marketing plans developed by staff members in areas linked to divisional responsibilities;
• Professional development of training dollars and continuing education. Other comments/observations/topics covered #1) Library Advisory Board (LAB) subject experts advise the Library staff on which resources to subscribe to or purchase. Use analysis indicates that many critical, “have to have” journals or online services have not been used as much as predicted. Therefore, the staff intends to discuss this matter in detail with the LAB. #2) The NIST Library recently conducted an extensive customer survey and benchmark study*. Based upon these studies, the Library obviously is a valued component of NIST’s success and the organization’s ability to meet its strategic goals. The Library staff have developed relationships and a process to “learn and listen” to its customers’ needs. Its staff measures and links personal professional goals to the Library’s and NIST’s strategic goals. They appear to be doing all the right things. However, despite these successes, the library’s funding was cut 10% in 2004, and it will be cut again by 10% in 2005. There are complex political, organizational, and social factors that appear to impact the budget and funding of the NIST Library. Many of these are out of the control of the Library’s leadership. ROI would be very helpful in making the Library’s case for funding, but ROI is not the only factor to be considered for the NIST Library to continue funding support.
63
Performance Measurement in Federal Libraries
* Silcox, Barbara P., and Deutsh, Paula (October 2003). From Data to Outcomes: Assessment Activities at the NIST Research Library. www.sla.org/informationoutlook.com
64
Performance Measurement in Federal Libraries
Site Visit Interview Summary NIH Library
Suzanne F. Grefsheim Director Building 10 MSC 1150
Bethesda, MD 20892-1150 Interviewed by Swasti Bhargava & Juliet Anderson
September 8th, 2004 11am Overall: 1. What are the goals and objectives of the organization/agency? The mission of the National Institutes of Health is science in pursuit of fundamental knowledge about the nature and behavior of living systems and the application of that knowledge to extend healthy life and reduce the burdens of illness and disability.
The mission of Health Services Research Library is to support the information and research needs of HHS staff by providing convenient, state-of-the-art access to specialized collections in health care, public health, substance abuse, and mental health while maintaining a commitment to quality, timeliness, and reliability. 2. What are the goals and objectives of the library within the agency? The goals and objectives of the library are to continue with the on-going plan stated in the mission and to provide more customized, integrated support to their customers. The library has a strategic plan that is in line with the organizations mission, goals, and objectives. 3. How many library staff: MLS, other master’s level, Support staff? How many library staff: MLS, other master’s level, Support staff? There are 58 full staff members working in the NIH library and approximately 20 contractors. The increase of automated processes will be replacing the contractors as their function is mainly clerical in nature. Current tracking/measurement techniques 1. Do they track? And if so, what methods do they use? The library is currently tracking the following:
- Use indicators of information services and resources provided in the library.
- Use indicators of information services provided electronically or delivered outside the library
- Use of electronic resources - Print collection organization and management indicators - Use of translation services
65
Performance Measurement in Federal Libraries
Additionally, the NIH library regularly conducts a customer satisfaction survey over the phone to 400 randomly selected users. The survey lasts about 30 minutes and the response rate is extremely high. They tried using focus groups for this survey and just handing out a printed or electronic copy, but all were less successful than phone surveys.
The library has placed a value on each unit of information. Each unit of information is tallied throughout the year and compared against the annual budget. In FY92, a unit of information cost $16.49, in FY02, a unit of information cost $0.91. This drop in price is due to the addition of large numbers of electronic resources to replace paper. The library has been able to claim a
100% cost recovery in its service since 2002 and has an overall satisfaction rate of 97% from its customers. Return on Investment for this library is well supported. Have they conducted any surveys from users (internal or external) on any of the above? Do they keep statistics/measurements of anything not listed above?
The customer satisfaction survey is prepared, evaluated, and conducted in-house. A user study (survey) has been conducted which has provided anecdotal evidence and testimonials proving that time has been saved. This survey will be expanded by an outside source in the future to provide more information. The future survey will be compared against the previous user survey (which will provide a baseline for comparison and to chart improvements). The library has a Performance Management Plan (Balanced Score Card). In Future: They are planning to conduct usability studies, SWOT analysis, CMS with Microsoft and Outsell. As of now they do not have a need to put a dollar value on intangibles, but they do plan to conduct studies to find out the difference in productivity and knowledge between users who have used their service and those users who have not.
66
Performance Measurement in Federal Libraries
Appendix C: Reference Charts
67
Performance Measurement in Federal Libraries
Appendix D: Full-Text Readings
68
Performance Measurement in Federal Libraries
Appendix E: Additional Full-Text Readings
69