Embed Size (px)
Citation preview

REGISTRATION NUMBER: 2014/042417/08 PRESIDENT: Sipho M Pityana VICE PRESIDENT: Martin Kingston CEO: Cas Coovadia NEDLAC CONVENOR: Kaizer Moyane DIRECTORS: Angela Russell, Bongi Kunene, Busisiwe Mavuso, Christopher Campbell, Deidre Penfold, John Dludlu, John Purchase, Roger Baxter, Stavros Nicolaou, Zoleka Lisa
NATIONAL OFFICE 61 Katherine Street, Sandton, 2196
P.O. Box 652807, Benmore, 2010 www.busa.org.za +27 11 784 8000
PARLIAMENTARY OFFICE
9 Church Square, 1st Floor Graaffs Trust Building, Cape Town, CBD
COVID-19: Cargo movement update Date: 29 January 2021
About this update
This cargo movement update contains a combined overview of air, sea, and road freight to and from South
Africa in the last week. The report is the 23rd update.
Weekly snapshot
Table 1 - Port volumes and air cargo flows, week-on-week
Flows Current1 Previous2
Growth Import Export Total Import Export Total
Port Volumes (TEUs) 26 657 32 436 59 093 28 928 34 930 63 858 ↓7%
Air Cargo (tons) 3 986 2 492 6 479 3 268 2 335 5 603 ↑16%
Monthly snapshot Figure 1 - Monthly3 cargo flows, year-on-year
Key Notes
• An average of ~8,442 TEUs was handled a day over the last week, ↓7% from last week.
• Weekly international air cargo is ↑16% and currently at ~77% compared to the same time in 2020.
• Weekly domestic air cargo is ↓13% and currently at ~96% compared to the same time in 2020.
• December merchandise trade with BELN countries: imports ↓7.5%; exports ↑%↓7.8%.
1 ‘Current’ means the last 7 days’ (a week’s) worth of available data. 2 ‘Previous’ means the preceding 8-14 days’ (a week’s) worth of available data. 3 ‘Monthly’ means the last full month’s worth of available data compared to the same month in 2019 (fully up-to-date for air cargo and TEUs; the rest of the data compares Dec 2020 with Dec 2019).
99%
101%
107%
56%
73%
68%
74%
0% 20% 40% 60% 80% 100% 120%
Containers (TEUs)
Dry bulk (MT)
Liquid bulk (MT)
Breakbulk (MT)
Vehicles (Units)
International Air Cargo
Domestic Air Cargo
2
• In cumulative terms for goods, South Africa registered a trade surplus of R270.6 billion for the year.
• The "World Container Index" is ↓1.7% to $5,251.81 per 40' with further financial reprieve in sight.
• Globally, FDI shrank by ↓42% in 2020. Services trade for Q3 2020 came in at ↓24% y-o-y.
Ports Update
This section provides an overview of the flow of containerised cargo to South Africa's commercial ports.
Container flow overview
The following two tables indicate the container flows reported for the last seven days, and the container
flows projected for the next seven days.
Table 2 - Container Ports - 7-day flow reported for 23 to 29 January 4
7-day flow forecast (23.01.2021 - 30.01.2021)
TERMINAL NO. OF CONTAINERS TO DISCHARGE (IMPORT)
NO. OF CONTAINERS TO LOAD (EXPORT)
DURBAN CONTAINER TERMINAL PIER 1: 4 432 4 766
DURBAN CONTAINER TERMINAL PIER 2: 12 449 12 741
CAPE TOWN CONTAINER TERMINAL: 5 973 9 611
NGQURA CONTAINER TERMINAL: 3 632 5 318
PORT ELIZABETH CONTAINER TERMINAL: 171 0
TOTAL: 26 657 32 436
Source: Transnet, 2021. Updated 29/01/2021
Table 3 - Container Ports - 7-day flow forecasted for 30 January to 5 February5
7-day flow forecast (30.01.2021 - 05.02.2021)
TERMINAL NO. OF CONTAINERS TO DISCHARGE (IMPORT)
NO. OF CONTAINERS TO LOAD (EXPORT)
DURBAN CONTAINER TERMINAL PIER 1: 6 539 4 637
DURBAN CONTAINER TERMINAL PIER 2: 4 155 8 900
CAPE TOWN CONTAINER TERMINAL: 5 506 7 680
NGQURA CONTAINER TERMINAL: 4 092 4 419
PORT ELIZABETH CONTAINER TERMINAL: 170 573
TOTAL: 20 462 26 209
Source: Transnet, 2021. Updated 29/01/2021
An average of ~8,442 TEUs was handled per day for the last week (23 - 29 Jan, Table 2), with a decreased
average of around ~6,667 TEUs (↓21%) expected to be handled for the next week (30 - 5 Feb, Table 3).
Despite the industry running into the deciduous fruit export season, these projected figures are meagre,
with stack occupancy hovering around ~60% in Cape Town. In Durban, Pier 2 was at 81% yard capacity earlier
in the week, which is way over the 70% maximum for good productivity, especially given the shortage of
available straddle carriers. In general terms, our domestic maritime industry did not have a good week (see
below). The outlook for the next week remains bleak.
4 It remains important to note that a fair percentage (approximately 27% according to the most recent TNPA figures for November) of containers are neither to be imported nor exported, but rather consist of empties and transhipments. Due to container imbalances, this proportion is fluctuating more than usual. 5 As noted in footnote 1.
3
The following figure displays the rolling monthly average flows of total containerised cargo movement for
our commercial ports since the start of the nation-wide lockdown.
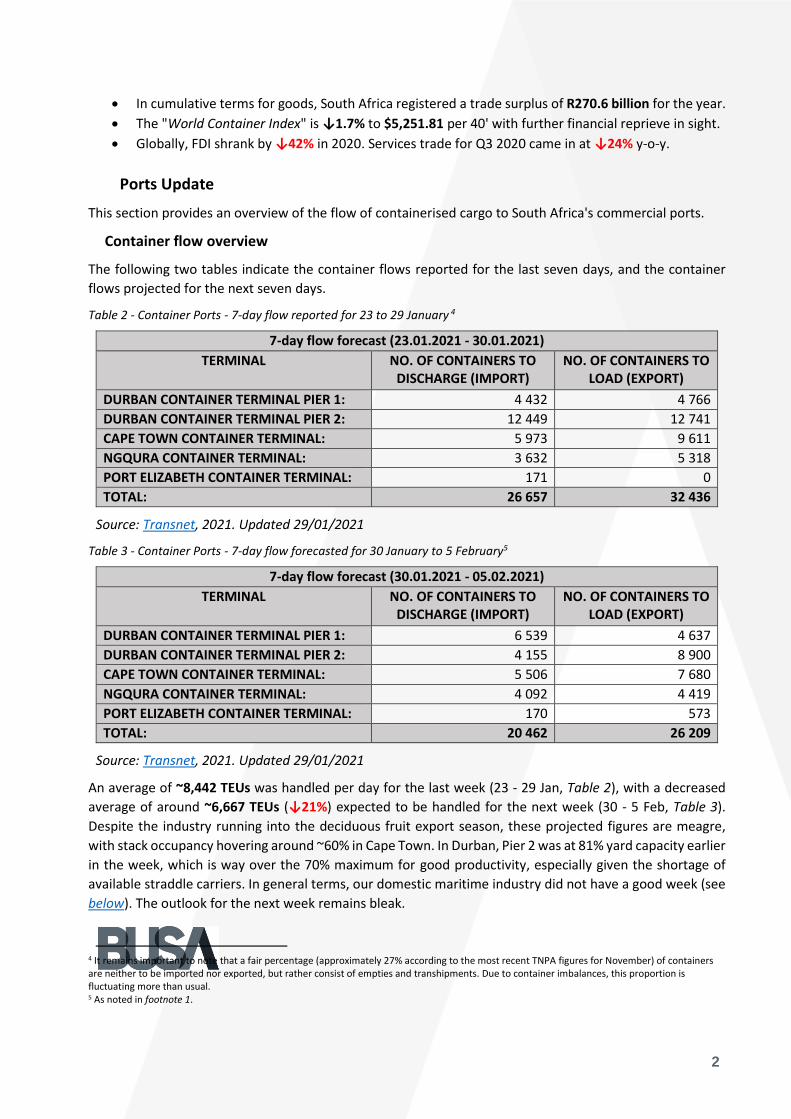
Figure 2 - Monthly flow reported for total cargo movement (TEUs: April to Present; month-on-month)
Source: Calculated using data from the Transnet updates, 2021. Updated 29/01/2021
The figure shows that the longer-term average trend has picked up somewhat through the course of the
year. Nonetheless, as mentioned last week, the total containerised volumes reported by TNPA amounted to
90% of 2019 levels. The industry can only hope that the slight upturn from December will continue through
into the new year. However, with the container imbalance and endless congestion experienced, especially
in the East – coupled with our domestic economic woes – uncertainty remains. Recent reports do however
suggest that the availability of empty containers in China is improving.
The figures below show the weekly container flows for the previous seven days and projections for the next
seven days.
0
20
40
60
80
100
120
140
April May June July August September October November December January
Tho
usa
nd
s
Monthly flow of cargo
DURBAN CONTAINER TERMINAL PIER 1 DURBAN CONTAINER TERMINAL PIER 2
CAPE TOWN CONTAINER TERMINAL NGQURA CONTAINER TERMINAL
PORT ELIZABETH CONTAINER TERMINAL Trendline
4
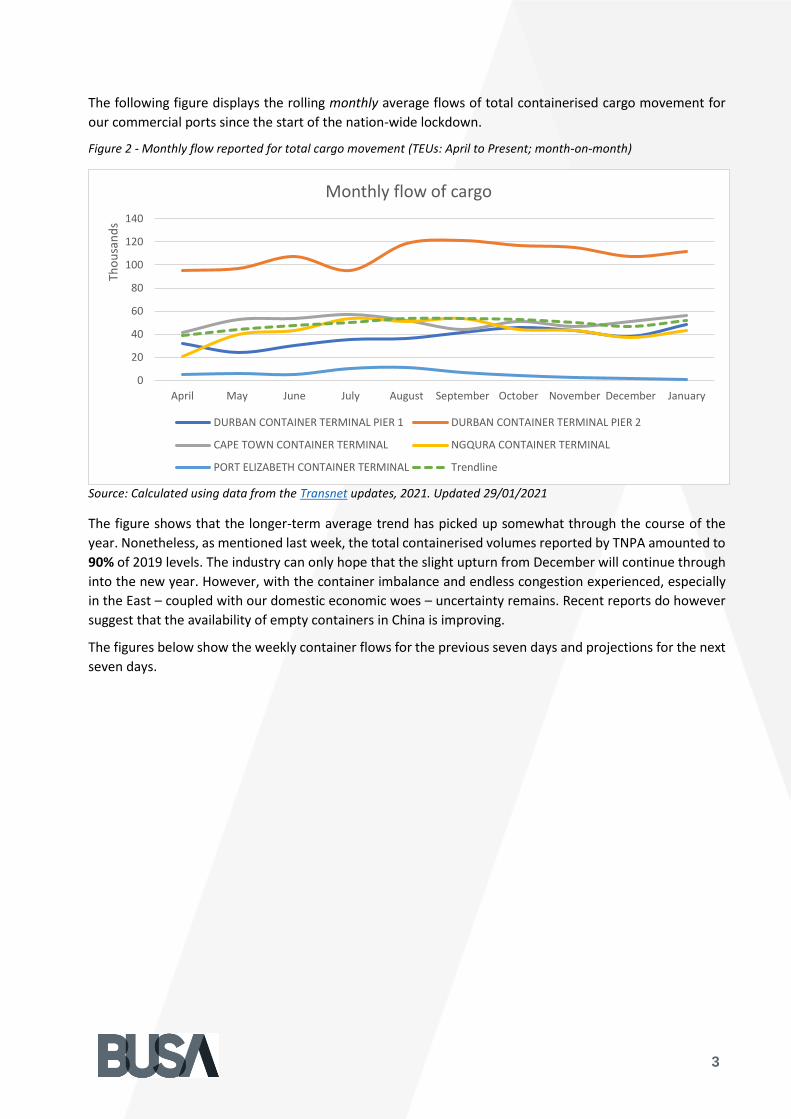
Figure 3 - 7-day flow reported for total cargo movement (23 to 29 January; per port; day-on-day)
Source: Calculated using data from the Transnet updates, 2021. Updated 29/01/2021
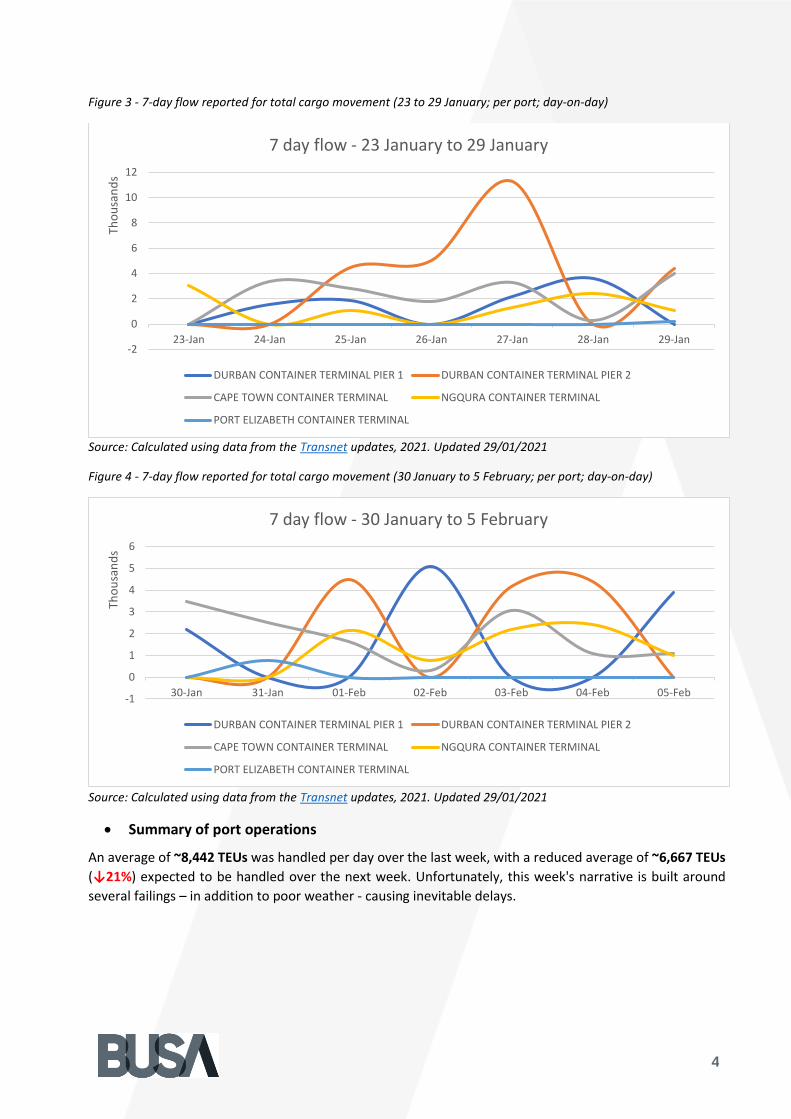
Figure 4 - 7-day flow reported for total cargo movement (30 January to 5 February; per port; day-on-day)
Source: Calculated using data from the Transnet updates, 2021. Updated 29/01/2021
• Summary of port operations
An average of ~8,442 TEUs was handled per day over the last week, with a reduced average of ~6,667 TEUs
(↓21%) expected to be handled over the next week. Unfortunately, this week's narrative is built around
several failings – in addition to poor weather - causing inevitable delays.
-2
0
2
4
6
8
10
12
23-Jan 24-Jan 25-Jan 26-Jan 27-Jan 28-Jan 29-Jan
Tho
usa
nd
s
7 day flow - 23 January to 29 January
DURBAN CONTAINER TERMINAL PIER 1 DURBAN CONTAINER TERMINAL PIER 2
CAPE TOWN CONTAINER TERMINAL NGQURA CONTAINER TERMINAL
PORT ELIZABETH CONTAINER TERMINAL
-1
0
1
2
3
4
5
6
30-Jan 31-Jan 01-Feb 02-Feb 03-Feb 04-Feb 05-Feb
Tho
usa
nd
s
7 day flow - 30 January to 5 February
DURBAN CONTAINER TERMINAL PIER 1 DURBAN CONTAINER TERMINAL PIER 2
CAPE TOWN CONTAINER TERMINAL NGQURA CONTAINER TERMINAL
PORT ELIZABETH CONTAINER TERMINAL

5
Throughout the week, Durban Container Terminal (DCT) struggled to maintain a reliable service as Navis
went down nationally for over three hours on Sunday. The reason offered was that Durban metro power
went down – with the back-up generator, inconceivably, not coming on due to not being adequately
serviced. Additionally, power outages on Sunday impacted rail and vessel operations. This occurrence is the
second of its kind for the year, with a similar incident in January where Navis went down nationally. However,
on that occasion, the power to the servers based at Queens Warehouse building in Durban went down with
the essential air conditioning provided by the back-up generators not functioning correctly, which was due
to another maintenance shortfall, the responsibility of TNPA.
Further challenges were experienced at DCT Pier I where a gantry crane dropped a container putting it out
of commission. Consequently, vessels on berth are being serviced by two gantry cranes only. In total, 13
hours were lost due to the weather and the Navis issue. On the other hand, at DCT Pier II, there is a serious
shortage of available straddle carriers – currently at about two-thirds of optimal levels. Heavy rain over the
weekend also caused electrical issues on older machines. These constant stoppages, coupled with the truck
booking system's intermittent and unreliable functioning, resulted in Harbour Carriers having no way of
planning or operating efficiently.
Although port efficiency at DCT picked up later in the week, a total of 95 hours of weather-induced delays
have so far been experienced in January. Some stakeholders have referred to it as the worst delays
experienced for a considerable period.
Earlier in the week in Cape Town, the weather played its part as usual, with strong winds sweeping the
harbour. Further delays were caused because of the Navis downtime, with the terminal losing 15 hours.
Consequently, three vessels bypassed Cape Town, one to Luanda, one to Walvis Bay and one to Port
Elizabeth which does not bode well for CTCT. Operational problems were not due to staffing problems (7
gangs were working), but rather due to equipment breakdown. The dire state is further confirmed by only
17 of 27 RTGs being reported operational at the PLF. Later in the week, Cape Town CT lost more than 17
hours due to wind. Accordingly, only 101 TEUs were handled in one 24-hour period, with only 23 truck calls,
and five vessels stuck at anchor. To highlight the delays experienced by vessels, the 'Kota Langsar' arrived
Durban on the 1st of January and today has berthed in Cape Town after 27 days on the coast so far.
Furthermore, the fruit industry has voiced its concerns with the peak season for fruit exports rapidly
approaching. To combat the current operational pitfalls, several workable solutions were put forward:
• A suggestion from several port users and the Western Cape Economic Development and Tourism
department (DEDAT) was that Transnet (TPT CPT) should utilise an inland facility (e.g., Belcon) and
establish a project for the upcoming 6-weeks peak period. This TPT facility is utilised for accepting
reefer containers (trucks) when there are wind delays. These containers are plugged in at Belcon,
and then railed into the terminal when they can be handled. This gives the port an additional option
to expand its stack capacity & operations and enhance landside productivity during wind delays.
• When the port is windbound, equipment will operate at the inland facility (where the wind is not a
factor) and ease truck congestion at the terminal. Reefer containers are plugged in until the wind
subsides. However, it should be noted that Belcon has limited plug-in points, around 90, whereas a
single vessel can load 1000 reefers during high season.
• The reefers are then transported via rail (TFR rail capacity already in place) directly to the vessel. All
available STS cranes should be in full operation to load ships efficiently when containers are

6
dispatched directly to vessels. With this initiative, productivity on the landside is improved, with the
waterside productivity also receiving the urgent attention required.
Consequently, a change in value proposition was proposed. TPT CPT should utilise any inland facility of their
choice to facilitate the operation of a plan B of operation during wind delays to service the industry and
ensure productive terminal operations. The reason is that a variety of stakeholders are affected by the
terminal not having a fall-back operational plan during wind delays. Exporters and other stakeholders
(clearing forwarding agents/transporters/ City of Cape Town due to congestion in and around the port) and
shipping lines (bypassing Cape Town and not service the fruit and other industries) are affected. Therefore,
TPT CPT should utilise and absorb the cost of such a plan B in terminal operations. There is some hope that
an alternative arrangement can be created to alleviate some of the industry's current pressures at this critical
time. There are concerns that exporters may be expected to pay the additional costs incurred, whereas they,
quite justifiably, believe that the terminal operator should cover such cost.
Cartage Contractors, importers and their clearing agents have been experiencing problems with certain
shipping lines. Diamond Shipping and CMA/CGM were reportedly demanding that empty import turn-ins go
to DCT where there is an empty buffer stack. Still, in the terminal's current state of disarray, this is not
workable. On the Transnet Freight Rail front, TFR reported that the Northern Cape line was flooded at
Lohatla and is closed as is the Swazi line currently also due to flooding. On a more positive note, the situation
at Belcon has slightly improved but remains constrained because the track as to be shared with PRASA. In
summary, the calamities at our commercial ports highlighted that COVID-19 and its accompanying restrictive
regulations are not the only challenges currently affecting the industry.
Air Update
a. International air cargo
The following table depicts the inbound and outbound air cargo flows to and from ORTIA for the week
starting 18 January. For comparative purposes, the average air freight cargo (inbound and outbound)
handled at ORTIA in January 2020 was about 640 733 kg per day6.
Table 4 - International inbound and outbound cargo from OR Tambo
Flows 18-Jan 19-Jan 20-Jan 21-Jan 22-Jan 23-Jan 24-Jan
Volume inbound 618 470 198 684 219 099 353 845 385 455 240 308 774 614
Volume outbound 220 481 241 991 162 623 215 547 255 751 226 003 422 315
Total handled per day 838 951 440 675 381 722 569 392 641 206 466 311 1 196 929
Updated: 26/01/2021
Despite the ongoing and inexplicable refusal to allow freighters to operate as essential services during
curfew hours, international air cargo volumes rebounded significantly compared to the depressed figures
reported last week. As such, the daily average volume of air cargo handled at ORTIA over the seven days
starting 18 January amounted to 398 639 kg inbound and 249 244 kg outbound. In total, that results in an
average of 556 376 kg per day, which is approximately ~75% compared to the two months before the
lockdown period (compared to ~80% last week). The international load factor is presently floating around
~33.1% arriving and ~41.6% departing. With these low figures, the freighter ban is further accentuated. It
6 Note, when including statistics from South Africa’s other two international airports, Cape Town International and King Shaka (Durban) International airports, the total figure rises to 793 825 kg per day.
7
has unfortunately become evident that the aviation industry's plea to allow freighters to operate as essential
services during curfew hours has not been successful. There has been no logical or intelligible response to
these pleas, so it would seem that bureaucratic inertia has taken hold. The sector can only reiterate its
appeal.
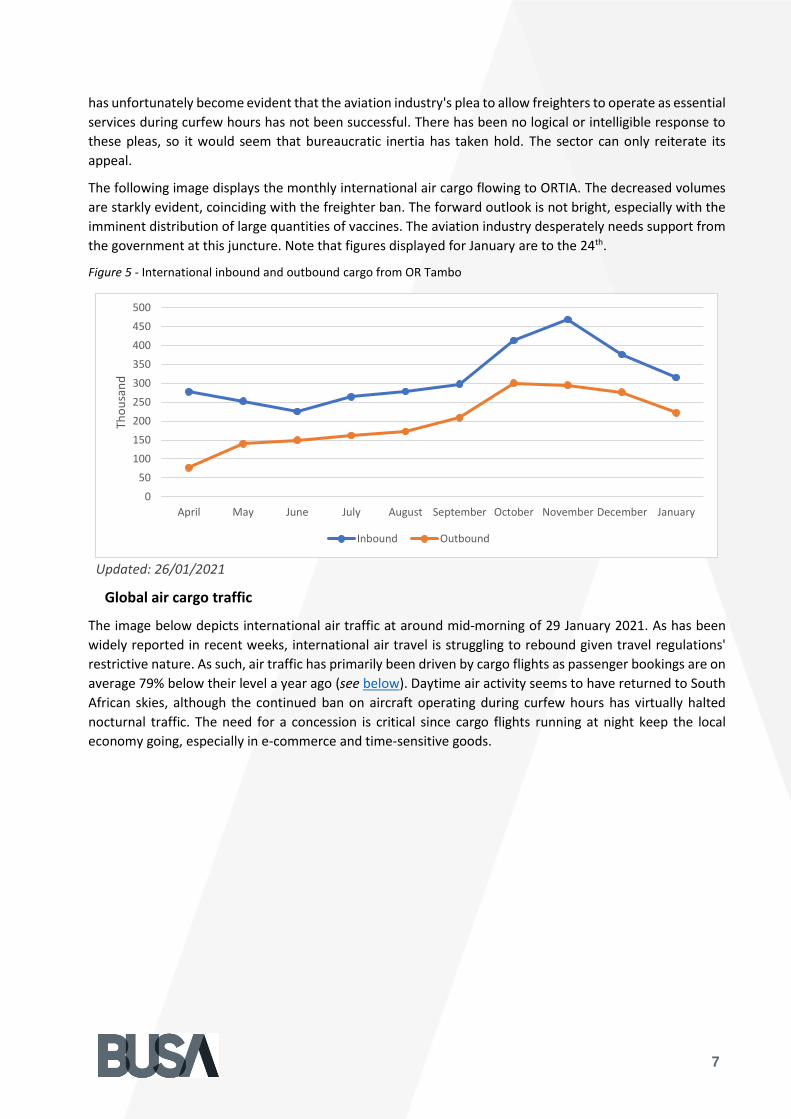
The following image displays the monthly international air cargo flowing to ORTIA. The decreased volumes
are starkly evident, coinciding with the freighter ban. The forward outlook is not bright, especially with the
imminent distribution of large quantities of vaccines. The aviation industry desperately needs support from
the government at this juncture. Note that figures displayed for January are to the 24th.
Figure 5 - International inbound and outbound cargo from OR Tambo
Updated: 26/01/2021
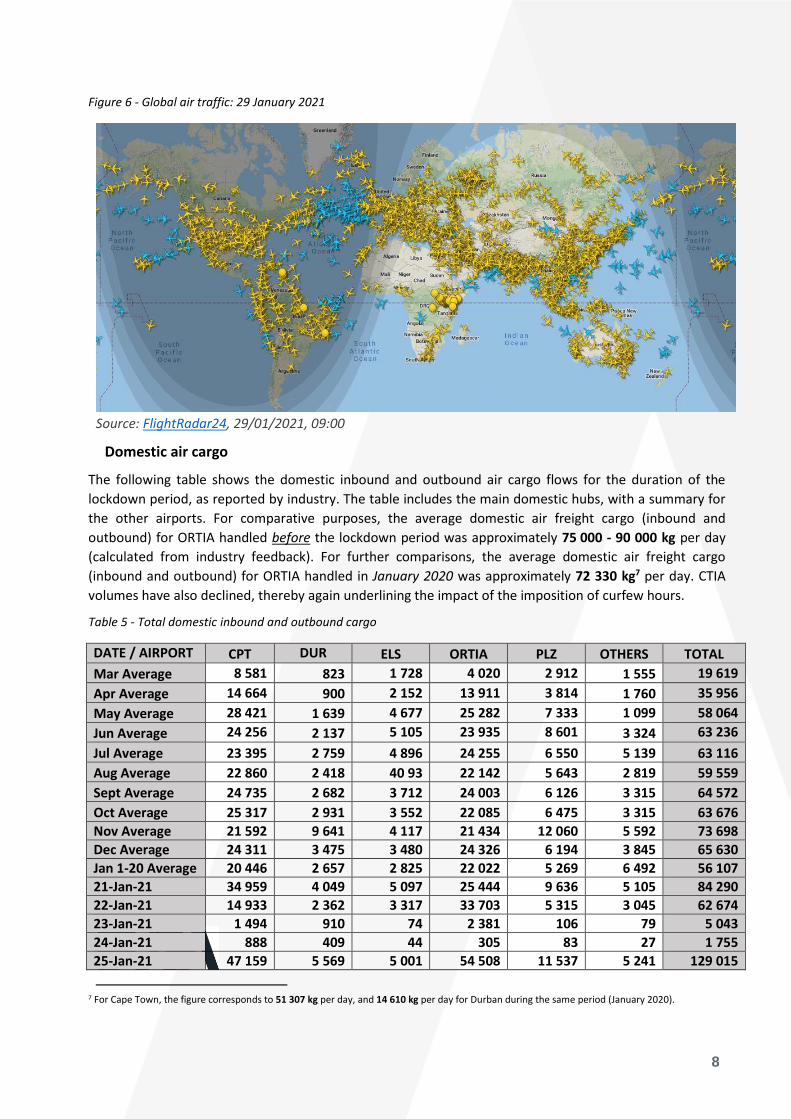
Global air cargo traffic
The image below depicts international air traffic at around mid-morning of 29 January 2021. As has been
widely reported in recent weeks, international air travel is struggling to rebound given travel regulations'
restrictive nature. As such, air traffic has primarily been driven by cargo flights as passenger bookings are on
average 79% below their level a year ago (see below). Daytime air activity seems to have returned to South
African skies, although the continued ban on aircraft operating during curfew hours has virtually halted
nocturnal traffic. The need for a concession is critical since cargo flights running at night keep the local
economy going, especially in e-commerce and time-sensitive goods.
0
50
100
150
200
250
300
350
400
450
500
April May June July August September October November December January
Tho
usa
nd
Inbound Outbound
8
Figure 6 - Global air traffic: 29 January 2021
Source: FlightRadar24, 29/01/2021, 09:00
Domestic air cargo
The following table shows the domestic inbound and outbound air cargo flows for the duration of the
lockdown period, as reported by industry. The table includes the main domestic hubs, with a summary for
the other airports. For comparative purposes, the average domestic air freight cargo (inbound and
outbound) for ORTIA handled before the lockdown period was approximately 75 000 - 90 000 kg per day
(calculated from industry feedback). For further comparisons, the average domestic air freight cargo
(inbound and outbound) for ORTIA handled in January 2020 was approximately 72 330 kg7 per day. CTIA
volumes have also declined, thereby again underlining the impact of the imposition of curfew hours.
Table 5 - Total domestic inbound and outbound cargo
DATE / AIRPORT CPT DUR ELS ORTIA PLZ OTHERS TOTAL
Mar Average 8 581 823 1 728 4 020 2 912 1 555 19 619
Apr Average 14 664 900 2 152 13 911 3 814 1 760 35 956
May Average 28 421 1 639 4 677 25 282 7 333 1 099 58 064
Jun Average 24 256 2 137 5 105 23 935 8 601 3 324 63 236
Jul Average 23 395 2 759 4 896 24 255 6 550 5 139 63 116
Aug Average 22 860 2 418 40 93 22 142 5 643 2 819 59 559
Sept Average 24 735 2 682 3 712 24 003 6 126 3 315 64 572
Oct Average 25 317 2 931 3 552 22 085 6 475 3 315 63 676
Nov Average 21 592 9 641 4 117 21 434 12 060 5 592 73 698
Dec Average 24 311 3 475 3 480 24 326 6 194 3 845 65 630
Jan 1-20 Average 20 446 2 657 2 825 22 022 5 269 6 492 56 107
21-Jan-21 34 959 4 049 5 097 25 444 9 636 5 105 84 290
22-Jan-21 14 933 2 362 3 317 33 703 5 315 3 045 62 674
23-Jan-21 1 494 910 74 2 381 106 79 5 043
24-Jan-21 888 409 44 305 83 27 1 755
25-Jan-21 47 159 5 569 5 001 54 508 11 537 5 241 129 015
7 For Cape Town, the figure corresponds to 51 307 kg per day, and 14 610 kg per day for Durban during the same period (January 2020).
9
26-Jan-21 38 297 6 023 5 545 42 854 10 678 5 761 109 158
Grand Total 546 647 72 469 75 586 599 627 142 727 149 092 1 514 066
Updated: 29/01/2021
The average domestic air cargo moved during the lockdown period has amounted to ~58 233 kg per day
(↓13% compared to last week), which constitutes approximately ~96%, compared to the previous year
(~109% last week). The domestic load factor is currently hovering around ~63.3% arriving and ~59.2%
departing. Although the volumes are 'near normal' levels, the commercial reality does not conform to the
industry role players' modus operandi that generally depends on its ability to operate at night. As we have
repeatedly stated, there is little evidence to confirm that these operations had, or could have, any effect on
the virus's transmission. Once again, the authorities are urged to reconsider the vital sustaining role of air
cargo and ancillary service providers as essential services.
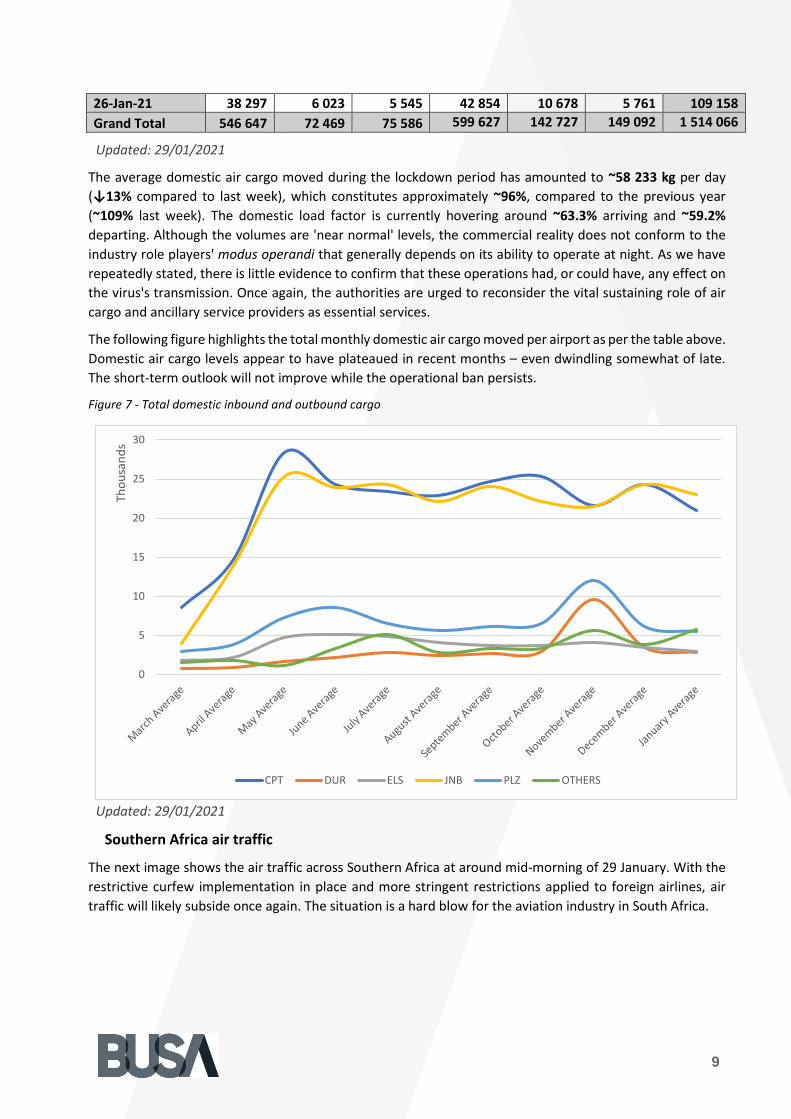
The following figure highlights the total monthly domestic air cargo moved per airport as per the table above.
Domestic air cargo levels appear to have plateaued in recent months – even dwindling somewhat of late.
The short-term outlook will not improve while the operational ban persists.
Figure 7 - Total domestic inbound and outbound cargo
Updated: 29/01/2021
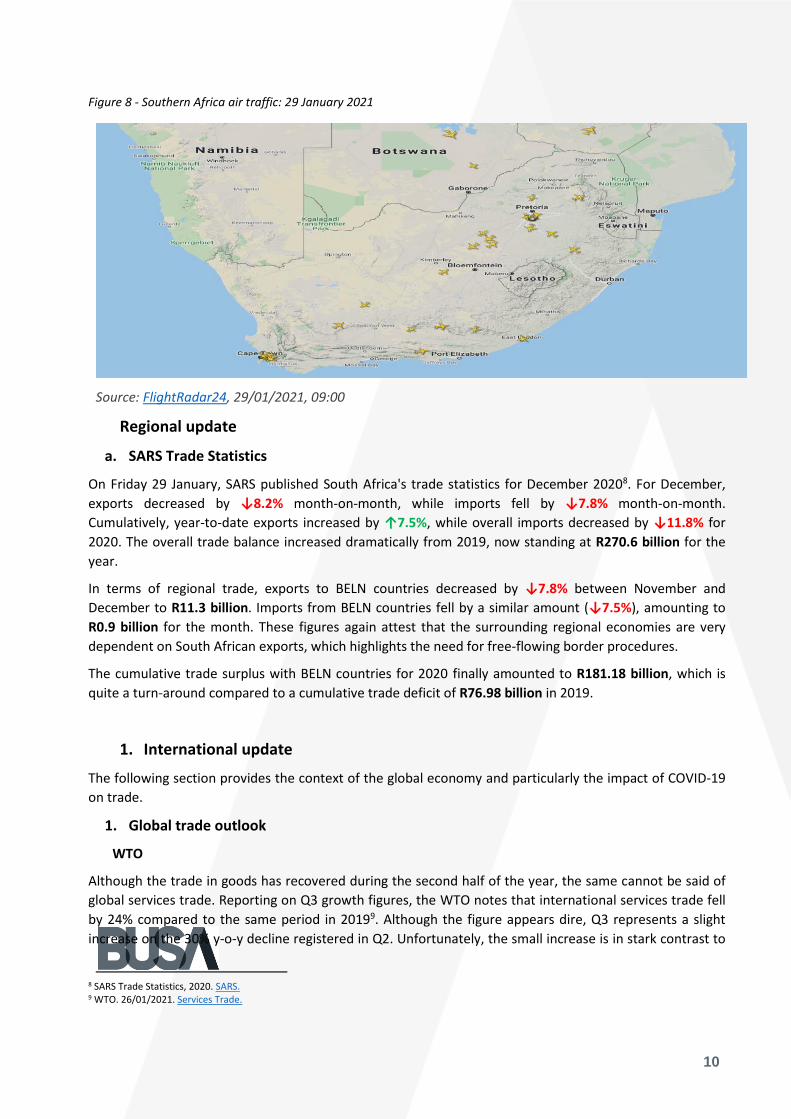
Southern Africa air traffic
The next image shows the air traffic across Southern Africa at around mid-morning of 29 January. With the
restrictive curfew implementation in place and more stringent restrictions applied to foreign airlines, air
traffic will likely subside once again. The situation is a hard blow for the aviation industry in South Africa.
0
5
10
15
20
25
30
Tho
usa
nd
s
CPT DUR ELS JNB PLZ OTHERS
10
Figure 8 - Southern Africa air traffic: 29 January 2021
Source: FlightRadar24, 29/01/2021, 09:00
Regional update
a. SARS Trade Statistics
On Friday 29 January, SARS published South Africa's trade statistics for December 20208. For December,
exports decreased by ↓8.2% month-on-month, while imports fell by ↓7.8% month-on-month.
Cumulatively, year-to-date exports increased by ↑7.5%, while overall imports decreased by ↓11.8% for
2020. The overall trade balance increased dramatically from 2019, now standing at R270.6 billion for the
year.
In terms of regional trade, exports to BELN countries decreased by ↓7.8% between November and
December to R11.3 billion. Imports from BELN countries fell by a similar amount (↓7.5%), amounting to
R0.9 billion for the month. These figures again attest that the surrounding regional economies are very
dependent on South African exports, which highlights the need for free-flowing border procedures.
The cumulative trade surplus with BELN countries for 2020 finally amounted to R181.18 billion, which is
quite a turn-around compared to a cumulative trade deficit of R76.98 billion in 2019.
1. International update
The following section provides the context of the global economy and particularly the impact of COVID-19
on trade.
1. Global trade outlook
WTO
Although the trade in goods has recovered during the second half of the year, the same cannot be said of
global services trade. Reporting on Q3 growth figures, the WTO notes that international services trade fell
by 24% compared to the same period in 20199. Although the figure appears dire, Q3 represents a slight
increase on the 30% y-o-y decline registered in Q2. Unfortunately, the small increase is in stark contrast to
8 SARS Trade Statistics, 2020. SARS. 9 WTO. 26/01/2021. Services Trade.
11
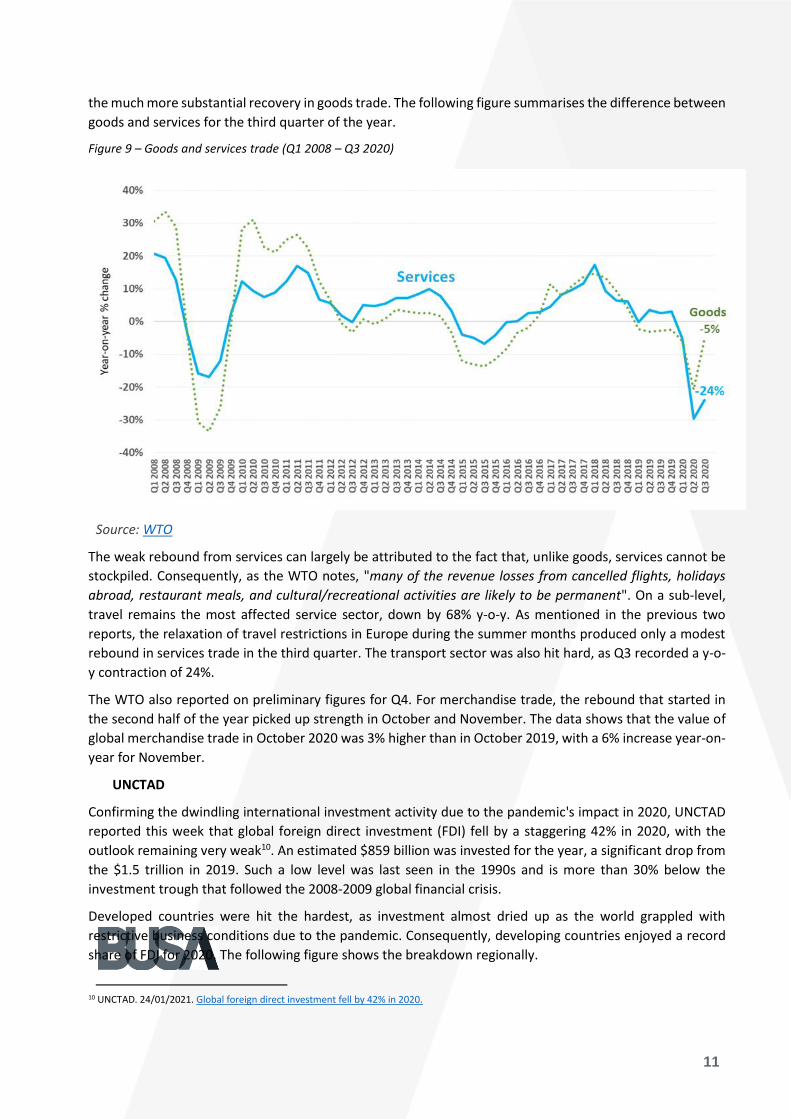
the much more substantial recovery in goods trade. The following figure summarises the difference between
goods and services for the third quarter of the year.
Figure 9 – Goods and services trade (Q1 2008 – Q3 2020)
Source: WTO
The weak rebound from services can largely be attributed to the fact that, unlike goods, services cannot be
stockpiled. Consequently, as the WTO notes, "many of the revenue losses from cancelled flights, holidays
abroad, restaurant meals, and cultural/recreational activities are likely to be permanent". On a sub-level,
travel remains the most affected service sector, down by 68% y-o-y. As mentioned in the previous two
reports, the relaxation of travel restrictions in Europe during the summer months produced only a modest
rebound in services trade in the third quarter. The transport sector was also hit hard, as Q3 recorded a y-o-
y contraction of 24%.
The WTO also reported on preliminary figures for Q4. For merchandise trade, the rebound that started in
the second half of the year picked up strength in October and November. The data shows that the value of
global merchandise trade in October 2020 was 3% higher than in October 2019, with a 6% increase year-on-
year for November.
UNCTAD
Confirming the dwindling international investment activity due to the pandemic's impact in 2020, UNCTAD
reported this week that global foreign direct investment (FDI) fell by a staggering 42% in 2020, with the
outlook remaining very weak10. An estimated $859 billion was invested for the year, a significant drop from
the $1.5 trillion in 2019. Such a low level was last seen in the 1990s and is more than 30% below the
investment trough that followed the 2008-2009 global financial crisis.
Developed countries were hit the hardest, as investment almost dried up as the world grappled with
restrictive business conditions due to the pandemic. Consequently, developing countries enjoyed a record
share of FDI for 2020. The following figure shows the breakdown regionally.
10 UNCTAD. 24/01/2021. Global foreign direct investment fell by 42% in 2020.

12
Figure 10 – FDI inflows by region, 2019 and 2020 (billions of US$)
Source: UNCTAD
As mentioned above, the developing world (and indeed Africa) still received significant FDI compared to
2019. Nonetheless, the outlook for 2021 remains especially weak, given the fact that the pandemic is still
hampering investment activity, with several MNCs likely to sit on their large cash reserves for now11.
UNCTAD's report does, however, show a better outlook for technology and healthcare. However, this can
largely be expected given the state of the global economy at this juncture. As such, UNCTAD expects any
increases in global FDI flows in 2021 to "come not from new investment in productive assets but from cross-
border M&As, especially in technology and healthcare – two industries affected differently by the pandemic."
UNCTAD notes that South African investors plan to acquire stakes in healthcare providers across Africa and
Asia in a similar vein and closer to home. As is often the case with a global crisis, FDI projects are shelved
until the international waters clear.
2. Global container industry
Global freight rates have been on a constant surge in recent weeks, primarily due to the worldwide shortage
of containers. However, it appears that the deficit shows signs of easing, according to the "Container
Availability Index" developed by Hamburg, Germany-based Container xChange12. The index – which tracks
containers used to transport 90% of the global trade in goods – should stay around 0.35 to 0.38 through
Chinese Lunar New Year in mid-February13. An index reading of 0.5 denotes a balanced market, with anything
below that mark indicating demand is outstripping supply. Alarmingly, the index had reached levels ranging
as low as 0.06 to 0.13 in December. The line graph below shows the current uptick.
11 Harvard Business Review. 2020. Why are companies sitting on so much cash 12 xChange. 2021. xChange. 13 Murray, 25/01/2020. Bloomberg.
13
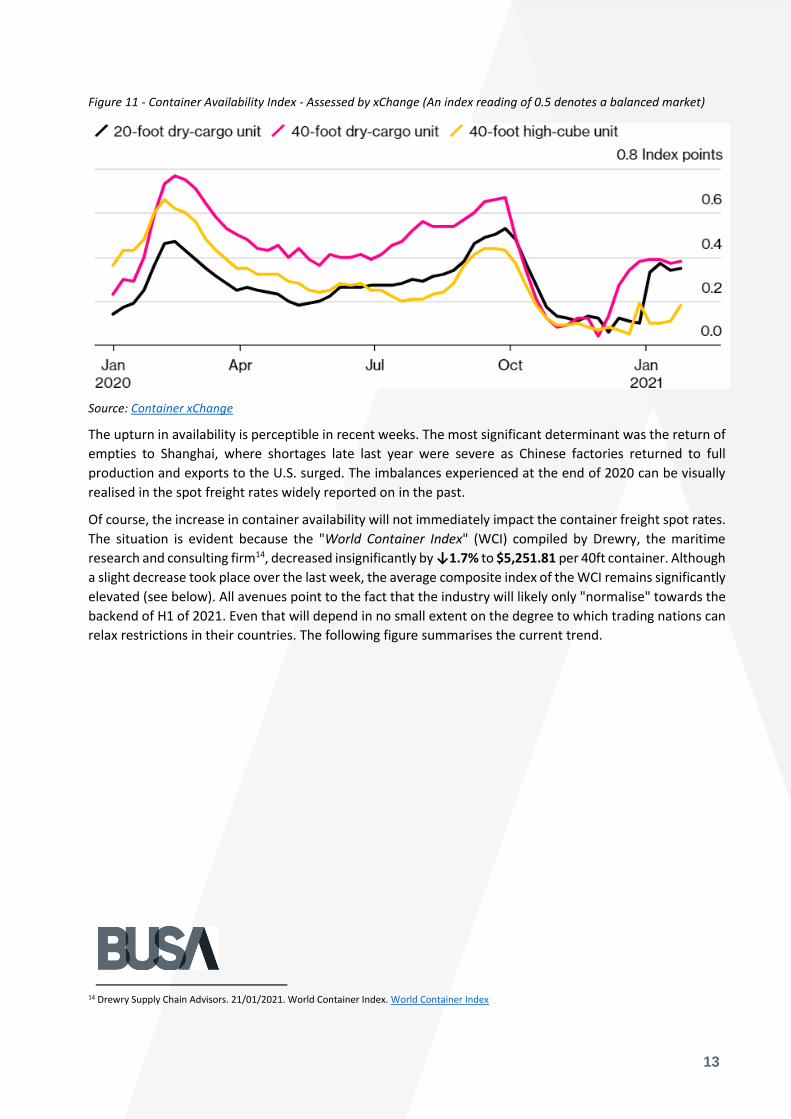
Figure 11 - Container Availability Index - Assessed by xChange (An index reading of 0.5 denotes a balanced market)
Source: Container xChange
The upturn in availability is perceptible in recent weeks. The most significant determinant was the return of
empties to Shanghai, where shortages late last year were severe as Chinese factories returned to full
production and exports to the U.S. surged. The imbalances experienced at the end of 2020 can be visually
realised in the spot freight rates widely reported on in the past.
Of course, the increase in container availability will not immediately impact the container freight spot rates.
The situation is evident because the "World Container Index" (WCI) compiled by Drewry, the maritime
research and consulting firm14, decreased insignificantly by ↓1.7% to $5,251.81 per 40ft container. Although
a slight decrease took place over the last week, the average composite index of the WCI remains significantly
elevated (see below). All avenues point to the fact that the industry will likely only "normalise" towards the
backend of H1 of 2021. Even that will depend in no small extent on the degree to which trading nations can
relax restrictions in their countries. The following figure summarises the current trend.
14 Drewry Supply Chain Advisors. 21/01/2021. World Container Index. World Container Index
14
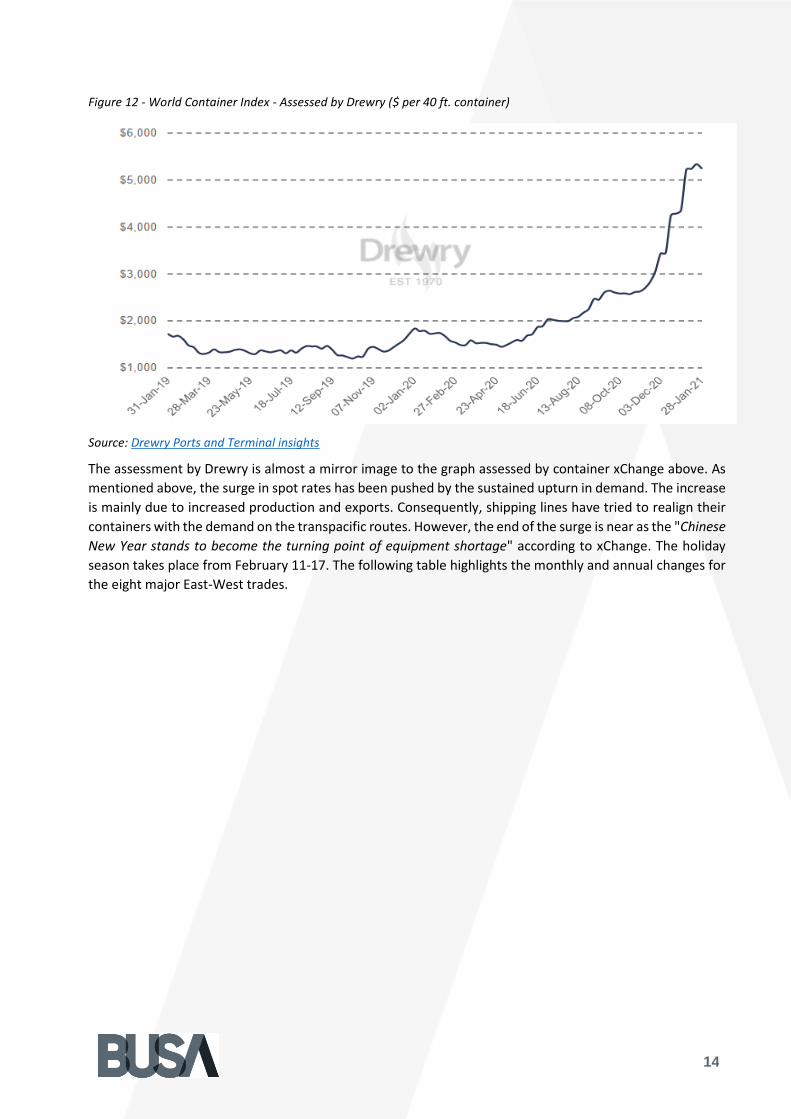
Figure 12 - World Container Index - Assessed by Drewry ($ per 40 ft. container)
Source: Drewry Ports and Terminal insights
The assessment by Drewry is almost a mirror image to the graph assessed by container xChange above. As
mentioned above, the surge in spot rates has been pushed by the sustained upturn in demand. The increase
is mainly due to increased production and exports. Consequently, shipping lines have tried to realign their
containers with the demand on the transpacific routes. However, the end of the surge is near as the "Chinese
New Year stands to become the turning point of equipment shortage" according to xChange. The holiday
season takes place from February 11-17. The following table highlights the monthly and annual changes for
the eight major East-West trades.
15
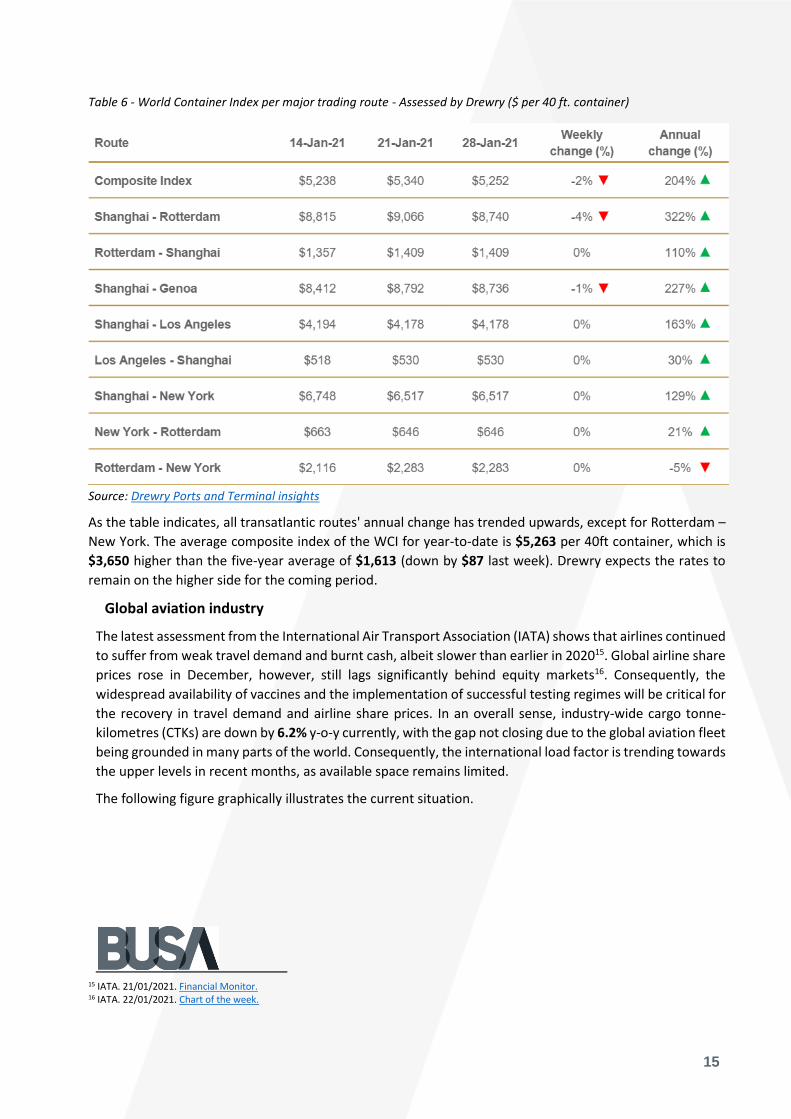
Table 6 - World Container Index per major trading route - Assessed by Drewry ($ per 40 ft. container)
Source: Drewry Ports and Terminal insights
As the table indicates, all transatlantic routes' annual change has trended upwards, except for Rotterdam –
New York. The average composite index of the WCI for year-to-date is $5,263 per 40ft container, which is
$3,650 higher than the five-year average of $1,613 (down by $87 last week). Drewry expects the rates to
remain on the higher side for the coming period.
Global aviation industry
The latest assessment from the International Air Transport Association (IATA) shows that airlines continued
to suffer from weak travel demand and burnt cash, albeit slower than earlier in 202015. Global airline share
prices rose in December, however, still lags significantly behind equity markets16. Consequently, the
widespread availability of vaccines and the implementation of successful testing regimes will be critical for
the recovery in travel demand and airline share prices. In an overall sense, industry-wide cargo tonne-
kilometres (CTKs) are down by 6.2% y-o-y currently, with the gap not closing due to the global aviation fleet
being grounded in many parts of the world. Consequently, the international load factor is trending towards
the upper levels in recent months, as available space remains limited.
The following figure graphically illustrates the current situation.
15 IATA. 21/01/2021. Financial Monitor. 16 IATA. 22/01/2021. Chart of the week.

16
Figure 13 – International cargo load factors (percentage of available CTKs)
Source: IATA Economics
As the figure indicates, the load factor is significantly up in all regions – even at an all-time industry high for
November of 65.5% – as the supply simply cannot handle the demand. In simple economic terms, reduced
supply with increased demand means that the price goes up. Indeed, after already rising in October, air cargo
rates have continued to rise in November and are now around 70% higher than last year at a global level17.
Although the global aviation industry welcomes the increased demand, IATA notes that the near-term
outlook remains challenging. Despite the hope generated by the rollout of COVID-19 vaccines (which has
boosted global financial markets performance), passenger bookings have not shared the market sentiment
yet. Bookings at the start of 2021 point to another problematic quarter, as they are on average 79% below
their level a year ago18. Until the passenger levels pick up, the supply of cargo will not significantly increase,
despite the excess demand generated by particularly the need to ship vaccines. Concurrently, it does not
seem that the stricter travel regulation currently the norm in the Northern hemisphere will abate soon. For
South Africa, given the ongoing freighter ban during curfew hours, any recovery remains a very distant
prospect, despite any short-term increase in volumes generated by the vaccine distribution project.
Conclusion
This update — the 23rd of its kind — contains a consolidated overview of the South African supply chain and
the current state of trade internationally. Since the previous version, new cases of COVID-19 have
fortunately subsided somewhat, averaging approximately 8,142 per day (down from 11,975 during the last
week). It appears that the second wave of infections may have passed. Nonetheless, continued vigilance is
required, especially in the wake of the ensuing vaccine rollout process and the genuine prospect of a third
17 ATA. 07/01/2021. Air Cargo Market Analysis. 18 IATA. 15/01/2021. Chart of the Week. IATA
17
wave in mid-year. Elsewhere, several countries are continuing with their aggressive vaccination rollouts. At
the time of writing, 1.11%19 of the world's population have now been vaccinated. In terms of the total
number of cases, South Africa remains in 15th position globally, with the total number of cases recorded now
amounting to 1,437,79820 at the time of writing.
This week's average stands at ~8,442 TEUs handled per day for the ocean modality, with a decreased average
of around ~6,667 TEUs (↓7%) expected to be handled over the next week. As outlined above, various
obstacles and unnecessary incidents caused operational delays across our commercial ports during the
week, adding to the negative sentiment current felt in the industry. Overall optimism has waned in recent
weeks, as the year's change has not brought about any meaningful change in fortunes for our maritime
economy.
The daily average volume of air cargo handled at ORTIA over the seven days starting 18 January amounted
to 398 639 kg inbound and 249 244 kg outbound. In total, that results in an average of 556 376 kg per day,
which is approximately ~75% compared to the two months before the lockdown period (compared to ~80%
last week). For the domestic industry, average air cargo moved continues to be relatively low, hovering
around ~58 406 kg moved per day since the start of lockdown, which constitutes approximately ~96% of the
volume moved compared to pre-lockdown. The aviation industry is deeply disappointed with the ongoing
ban restricting aircraft and accompanying services to operate as essential services during the curfew hours.
Internationally, the WTO reported that global services trade fell by ↓24% this week compared to the same
period in 2019. These reported numbers contrast to international merchandise trade, which made a
substantial rebound during the same period. On a subsector level, tourism and transport services were the
most significantly affected across this period. Further depressing news concerns the fact that FDI in 2020
shrank by a massive ↓42% y-o-y. Moreover, the outlook for 2021 does not look much better.
On the international container front, it appears that recent container shortages and imbalances, together
with accompanying port congestion, show some signs of easing. Consequently, it is expected that the record
surge of global freight spot rates will also reverse itself, even though the index remains very bloated at
$5,251.81 per 40ft, which is ↓1.7% on last week. Despite a short-term reprieve in container availability,
several reliable sources expect that the industry will likely only "normalise" towards June/July of this year.
Normalisation includes both the availability of containers, the level of demand, and the accompanying
freight rates.
In terms of the global aviation industry, the latest surplus demand is likely to continue as travel restrictions
persist and passenger booking remain desperately low. With the industry load factor registering an all-time
November high of 65.5%, belly-hold cargo urgently needs to alleviate some strain on the rest of the cargo
industry. For South Africa, the story is very similar. The ongoing freighter ban during curfew hours continues
to pressurise the sector, despite any demand increase due to the vaccine rollout strategy.
As we reported last week, the greater trading community (and indeed the rest of South Africa) will now turn
significant attention to the imminent distribution of COVID-19 vaccines. For the National Department of
Health's optimistic plan to vaccinate two-thirds of the population by the end of 2021, a collaborative
partnership between all stakeholders within the broader supply chain is needed now more than ever. There
have been a few positive signs for the industry this week, including allocating a dedicated tariff heading to
COVID 19 vaccines, and grant VAT rebate approval for the vaccine. The specific HS code will now make it a
lot easier to monitor the distribution thereof and gauge the local manufacturing capacity once we arrive at
that juncture.
19 Our World in Data, Coronavirus (Covid-19) Vaccinations. Our World in Data 20 John Hopkins, Coronavirus Resource Centre. Coronavirus JJHU


![[Sxsw] Amcham](https://img.pdfslide.net/doc/110x75/547f55f3b4af9fbe788b46ba/sxsw-amcham.jpg)