Embed Size (px)
Citation preview

Covid-19 hospital mortalityA comparison of first and second waves across England Wales and Northern Ireland, updated to March 2021 with most recent HES data, including analysis of covid-19 cases recorded as a secondary diagnosis
ContextWhilst the UK vaccination programme is set to vastly reduce the prevalence of covid-19 over the next 12 months, there is no magic bullet for the treatment of those with the disease. Monitoring mortality rates for those in hospital with the disease, particularly if new variants cause rises in hospital admissions, will continue to be important.
Covid-19 is excluded from standard risk adjusted mortality models, so CHKS has developed a method for comparing in-hospital mortality rates specifically for patients with confirmed covid-19. The model allows hospitals to compare their actual deaths with an expected figure given the case mix (age and sex) of their own covid-19 cases. Full details of the approach are set out in a separate paper.
The model’s coefficients changed between the first and second waves. This paper includes coefficients for data updated to the end of March 2021, including consideration of covid-19 cases recorded as a secondary diagnosis.
Summary
1. The second wave had a greater impact than the first, both in terms of numbers of cases and hospital deaths (Chart 1). However, despite the higher numbers, the risk of death per patient reduced from the first wave (Table 1, Table 2).
2. The risk profile of patients was relatively constant throughout the second wave (Chart 2). We have therefore aggregated all second wave patients with a primary diagnosis of covid-19 into our latest full second wave model.
3. We found significant evidence of variation between hospital provider performance in the second wave though not in the first (Chart 3).
4. Patients recorded with a secondary diagnosis of covid-19 (Chart 4) differ substantially from those with covid-19 as a primary diagnosis. This is clear from age and sex profiles (Chart 6). In addition, those who have covid-19 as a secondary diagnosis have a significantly lower risk profile than those whose admission was primarily due to covid-19 (Chart 8). Because these two cohorts are so clearly different, they should not be aggregated together using the same risk coefficients. They should be analysed taking account of both primary and secondary condition as is done in our wider RAMI model of hospital mortality. However, because that is not yet possible, we have calculated specific coefficients for use with our covid-19 mortality model which work satisfactorily with patients with a secondary diagnosis (see appendix).
Next steps• We will continue to work with the NHS to
understand performance differences and enable comparisons between organisations, particularly the variation between providers in the second wave.
• We will examine whether a secondary diagnosis of covid-19 should be added to the existing list of 99 secondary conditions within RAMI. If so, we will include the respective secondary risk uplift in the RAMI model.
• We will continue to monitor the public health situation over coming months given vaccination progress and its impact on covid-19 hospital spells and mortality. Our aim is that in due course, RAMI should once again include all hospital cases, including those with a primary diagnosis of covid-19.
Covid-19 hospital mortality | A comparison of first and second waves across England Wales and Northern Ireland Part of Capita PLC01

IntroductionOur initial report1 found that younger patients were at significantly reduced risk of death during the second wave than they were in the first. We defined first wave as March to May 2020. The second wave was originally October to December 2020.
However, there were many more cases and deaths in January to March 2021. This paper updates our evaluation of the second wave to include the latest cases. In addition, this paper examines the risk profile of an additional cohort of patients with covid-19 recorded as a secondary diagnosis.
1. More hospital cases and deaths in the second wave than in the firstHospital spells in English, Welsh, and Northern Ireland hospitals (with a primary diagnosis of confirmed covid-19) are shown below along with numbers of deaths (Chart1). The second wave was longer and more severe in absolute volume terms (cases and deaths) than the first.
Chart 1: Number of spells and deaths with primary diagnosis of covid-19 by month
1 Initial report: https://capitahealthcaredecisions.com/module/uploads/2021/04/Covid-19-hospital-mortality_v4.pdf
Covid-19 hospital mortality | A comparison of first and second waves across England Wales and Northern Ireland Part of Capita PLC02

The same information is summarised by wave2 below (Table 1). As treatment improved, the mortality risk (deaths per spell) reduced significantly. See out first report3 for further information about how this risk reduced more in younger patients than in the elderly.
Wave Spells Deaths Deaths per spell %
First (Mar – May 2020) 60,976 19,384 31.8%
Second (Oct 2020 – Mar 2021) 177,257 37,834 21.3%
Table 1: Number of spells and deaths with primary diagnosis of covid-19 by wave
Table 2: Model coefficients with primary diagnosis of covid-19
2 We define a wave as a continuous period with more than 1,000 deaths per month3 Our first report can be found at: https://capitahealthcaredecisions.com/module/uploads/2021/04/Covid-19-hospital-mortality_v4.pdf
A first wave patient was at significantly greater risk of death than someone admitted during the second wave. Consequently, we have developed two distinct models. The coefficients for both models are shown below (Table 2).
Period Males Females Notes
Risk (R) Shape (P) Risk (R) Shape (P)
Mar-May 2020 40% 3.5 30% 3.3 First wave
Oct 2020 - Mar 2021 27% 4.2 21% 3.8 Second wave
Covid-19 hospital mortality | A comparison of first and second waves across England Wales and Northern Ireland Part of Capita PLC03

2. Initial and final phases of second wave comparedIn the same way, the second wave may have different risks between its beginning and end. If so, we should split the second wave into two phases.
To test whether we should do this we have applied the second wave model separately to patients from the beginning (Oct – Dec) and the end (Jan - Mar) of the second wave. See the charts below (Chart 2). They demonstrate that both cohorts (blue lines) fit well within the second wave model (orange, with confidence limits indicated by grey lines).
Oct-Dec 2020:
Jan-Mar 2021:
Males
Males
Females
Females
Chart 2: First and second halves of second wave compared (primary diagnosis of Covid-19)
Conclusion on primary second wave casesEarly and late second wave cases fit within the same model and can safely be aggregated.
Covid-19 hospital mortality | A comparison of first and second waves across England Wales and Northern Ireland Part of Capita PLC04

3. Comparative performance between hospitalsResults comparing performance of hospitals across England, Wales and Northern Ireland are shown separately for first and second waves below (Chart 3).
In the first wave there was little significant variation in trust performance: All trusts were within or very close to the confidence limits (grey lines). This result was confirmed by a recently published GIRFT study4.
In the second wave, we found greater evidence of significant differences. Within England, Wales and Northern Ireland, some trusts performed significantly better than expected whilst others performed significantly worse. There is no immediately obvious geographical pattern, and we do not yet fully understand the reasons for the significant variation in the second wave.
First wave Mar-May 2020
Second wave Oct 2020 - Mar 2021
Chart 3: Trust performance in first and second waves (primary diagnosis of covid-19, both sexes)
4 Variability in COVID-19 in-hospital mortality rates between national health service trusts and regions in England: A national observational study for the Getting It Right First Time Programme https://www.sciencedirect.com/science/article/pii/S2589537021001395
Covid-19 hospital mortality | A comparison of first and second waves across England Wales and Northern Ireland Part of Capita PLC05

4. Covid-19 diagnosis in secondary positionTo date, we have only included patients with a primary diagnosis of confirmed covid-19 (U071) in our model.
The nature of secondary cases
However, as the chart below (Chart 4) shows, there are some cases which are not admitted with a primary diagnosis of covid-19 but who tested positive for the virus (grey). These cases are coded with U071 in a secondary position but were admitted with a wide range of normally expected non-elective conditions in the primary position such as pneumonia (organism unspecified), fractured femur, septicaemia, and urinary problems. Whilst most of these are elderly admissions, there is also a significant cohort associated with pregnancy in younger females.
Chart 4: Spells with covid-19 diagnosis in primary or secondary position
Diagnosis Primary Secondary
Covid-19 hospital mortality | A comparison of first and second waves across England Wales and Northern Ireland Part of Capita PLC06

In total (March 2020 – Mar 2021) there were 248,553 cases with a covid-19 primary diagnosis. An additional 151,628 cases had covid-19 as a secondary diagnosis.
The proportion of cases with secondary covid-19 appears to increase from first to second waves. This is likely to be due to a combination of factors:
• Firstly, increased frequency of testing all patients for the presence of the virus – virus testing kits were a scarce resource in the first wave, so were sparingly applied.
• Secondly, the prevalence of the virus in the population changed significantly over time, from nil before the first wave, an unknown level of prevalence during the first wave, then to a peak of an estimated 1 in 50 (2%) of the populations of England, Wales, and Northern Ireland in December-January. See evidence from ONS below (Chart 5). Note that population prevalence surveys did come into effect until the end of the first wave, and because of differences in survey arrangements, the availability of the estimates varies between countries.
Chart 5: Covid-19 population prevalence estimates (source: ONS coronavirus infection survey)
England Wales Northern Ireland
Covid-19 hospital mortality | A comparison of first and second waves across England Wales and Northern Ireland Part of Capita PLC07
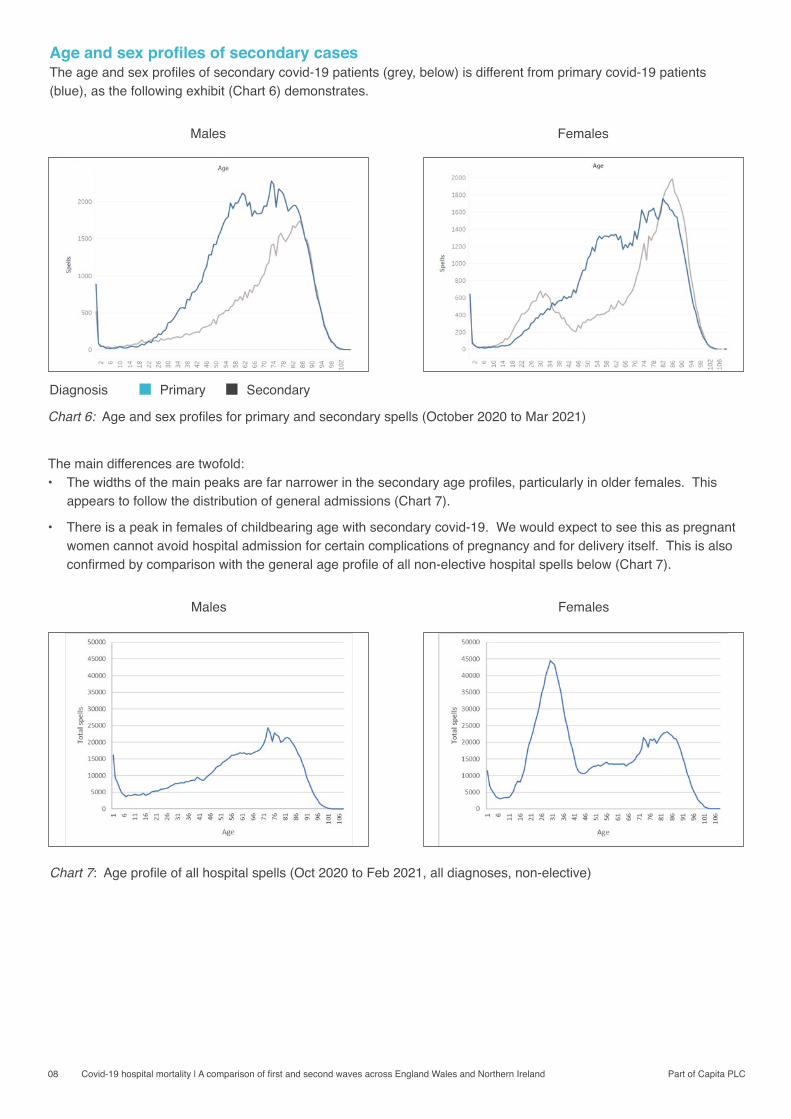
Age and sex profiles of secondary casesThe age and sex profiles of secondary covid-19 patients (grey, below) is different from primary covid-19 patients (blue), as the following exhibit (Chart 6) demonstrates.
Males
Males
Females
Females
Chart 6: Age and sex profiles for primary and secondary spells (October 2020 to Mar 2021)
The main differences are twofold:• The widths of the main peaks are far narrower in the secondary age profiles, particularly in older females. This
appears to follow the distribution of general admissions (Chart 7).
• There is a peak in females of childbearing age with secondary covid-19. We would expect to see this as pregnant women cannot avoid hospital admission for certain complications of pregnancy and for delivery itself. This is also confirmed by comparison with the general age profile of all non-elective hospital spells below (Chart 7).
Chart 7: Age profile of all hospital spells (Oct 2020 to Feb 2021, all diagnoses, non-elective)
Diagnosis Primary Secondary
Covid-19 hospital mortality | A comparison of first and second waves across England Wales and Northern Ireland Part of Capita PLC08

Risk profiles of secondary casesThe risk profile of secondary cases also differs significantly from that of primary cases. The analysis below (Chart 8) is based on the full second wave model for primary cases admitted between October 2020 and March 2021.
Whilst primary cases fit our model very well (Chart 8, top), secondary cases (Chart 8, bottom) fall significantly beneath the model’s confidence limits (grey lines) from age 74 for males and from age 78 for females.
This demonstrates that primary cases and secondary cases have significantly different risk profiles. The two cohorts should therefore not be treated in the same way.
Primary diagnosis:
Secondary diagnosis:
Males
Males
Females
Females
Chart 8: Mortality comparison between primary and secondary diagnosis of covid-19 (primary model, second wave)
Covid-19 hospital mortality | A comparison of first and second waves across England Wales and Northern Ireland Part of Capita PLC09

Conclusion on dealing with secondary casesDespite high volumes in the second wave, there are very clear differences between primary cases and secondary cases:
• Primary cases were admitted suffering seri-ous symptoms from the disease. Secondary cases are different because were admitted for other reasons such as elderly conditions and conditions associated with pregnancy as normally expected, but also tested positive for Covid-19.
• Age and sex profiles for primary and second-ary cases are entirely different.
• Risk profiles for primary and secondary cases are significantly different: They do not fit the same model.
We therefore believe that primary and second-ary cases should be treated separately for the purposes of mortality analysis.
Covid-19 hospital mortality | A comparison of first and second waves across England Wales and Northern Ireland Part of Capita PLC10

AppendixModel coefficients for secondary covid-19 (if required)New coefficients calculated for cases with a secondary diagnosis of covid-19 are shown below (Table A1)
Secondary cases Males Females Notes
Period Risk (R) Shape (P) Risk (R) Shape (P)
Mar-May 2020 31% 2.7 21% 2.6 First wave
Oct 2020 - Mar 2021 20% 3.4 16% 2.5 Second wave
Table A1: Model coefficients for cases with diagnosis of covid-19 in secondary position
But does the model work as well for secondary cases as it does for primary? It does. For each secondary cohort the new secondary model is a good fit, as shown below (Chart A1).
First wave
Second wave
Males
Males
Females
Females
Chart A1: Model fit for cases with diagnosis of covid-19 in secondary position
Covid-19 hospital mortality | A comparison of first and second waves across England Wales and Northern Ireland Part of Capita PLC11

CHKS LimitedViables Business Park 1A Jays Cl Basingstoke RG22 4BS www.chks.co.uk
For more detail on any of the information contained in this report please contact us at [email protected]