Embed Size (px)
Citation preview

CPA Congress 2014
Andrew Barr MLADeputy Chief Minister
Treasurer Minister for Economic Development
Minister for Tourism & EventsMinister for Housing
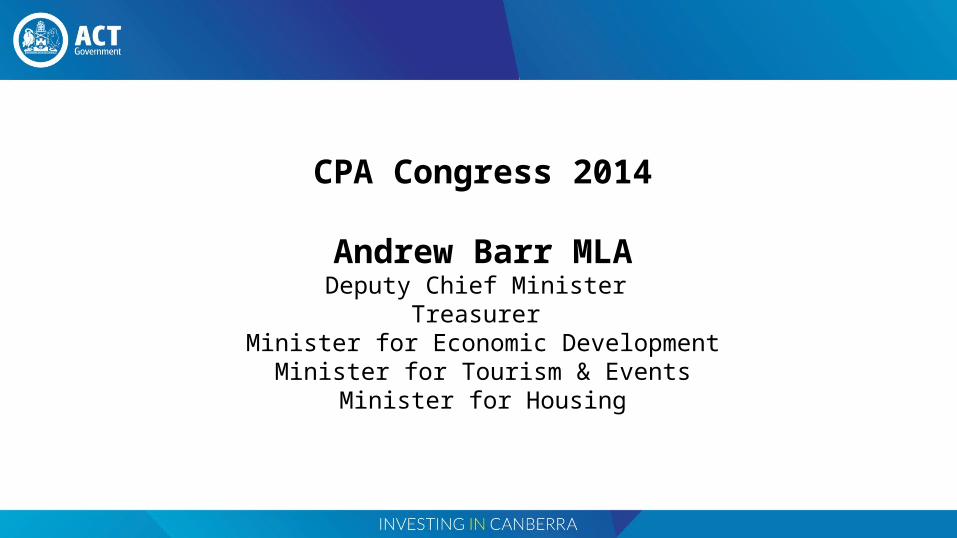
Growth, Diversification and Jobs
Competitive strengths and priorities
• ACT exported $1.27 billion of services in 2013 calendar year.
• ACT has 1.6% of Australia’s population, but 2.3% of its service exports.
• ACT’s service exports have averaged 7.3% annual growth over the last decade.
• Exports include:
• $624 million in travel exports (incl. Business- and education-related travel)
• $299 million in government goods and services
• $265 million in business services (incl. R&D services)
Competitive strengths and priorities• Defence and security
• Department of Defence spends $1 billion p.a. directly in ACT and procures further $15 billion p.a. throughout Australia, generally by Canberra-based decision makers.
• Digital economy and e-government
• World class innovators and digital infrastructure along with major institutions such as NICTA and ANU. Approx. 25% of government expenditure on R&D in this arena occurs in Canberra.
• Health and Sports Science
• World-class health system servicing a population of 800,000. Home to AIS, John Curtin School of Medical Research and University of Canberra Sports Hub.
Competitive strengths and priorities• Innovation and higher education
• More than 35,000 university students, including more than 10,000 international students across five university campuses.
• Space, satellite and spatial sciences
• Trailblazing observatories and facilities such as the Advanced Instrumentation and Technology Centre and Canberra Deep Space Communication Complex including the largest antenna in the Southern Hemisphere.
• Tourism infrastructure
• High yielding business travel market, above national average occupancy rates, high average takings and a strategic approach to growing regional tourism growth.
CBR Innovation Network and Invest Canberra
• Supporting ACT trade and investment activities in Singapore, Hong Kong, China and USA.
• Generated 100 leads in first year with around 20 currently being case managed.
• Linking businesses and entrepreneurs to accelerate innovation and growth to maximise wealth creation
• Independent not-for-profit company with ANU, CSIRO, NICTA, UC and UNSW (Canberra) as foundation members and financial contributors.
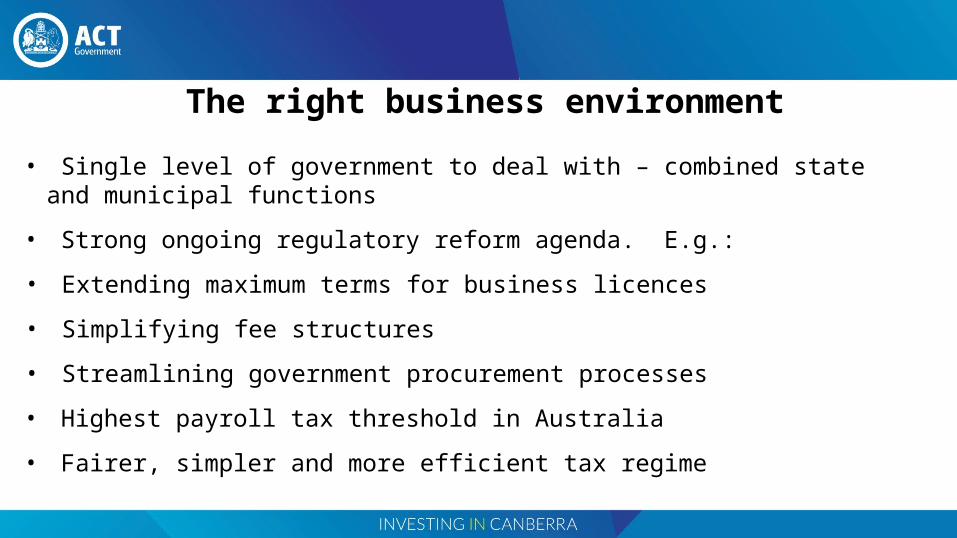
The right business environment
• Single level of government to deal with – combined state and municipal functions
• Strong ongoing regulatory reform agenda. E.g.:
• Extending maximum terms for business licences
• Simplifying fee structures
• Streamlining government procurement processes
• Highest payroll tax threshold in Australia
• Fairer, simpler and more efficient tax regime
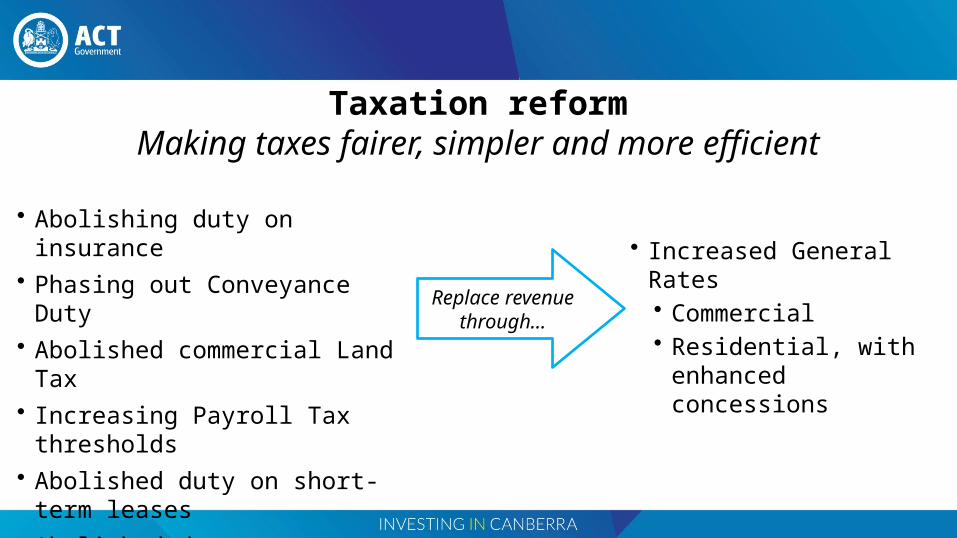
Taxation reformMaking taxes fairer, simpler and more efficient
• Abolishing duty on insurance• Phasing out Conveyance Duty• Abolished commercial Land Tax• Increasing Payroll Tax thresholds• Abolished duty on short-term
leases• Abolished duty on transfer of sub-
leases
Replace revenue through…
• Increased General Rates • Commercial• Residential, with
enhanced concessions
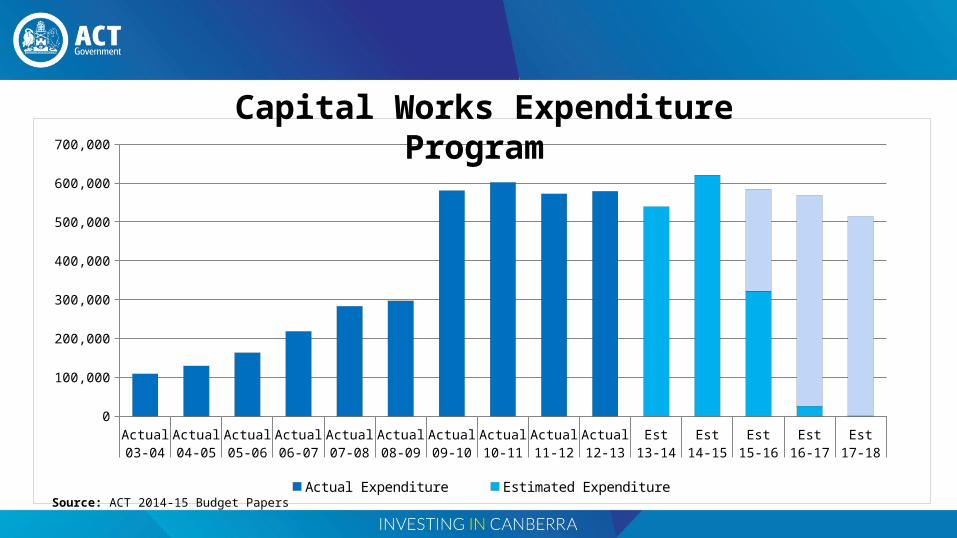
Actual Actual Actual Actual Actual Actual Actual Actual Actual Actual Est Est Est Est Est03-04 04-05 05-06 06-07 07-08 08-09 09-10 10-11 11-12 12-13 13-14 14-15 15-16 16-17 17-18
0
100,000
200,000
300,000
400,000
500,000
600,000
700,000
Actual Expenditure Estimated Expenditure Capital Provision
Capital Works Expenditure Program
Source: ACT 2014-15 Budget Papers
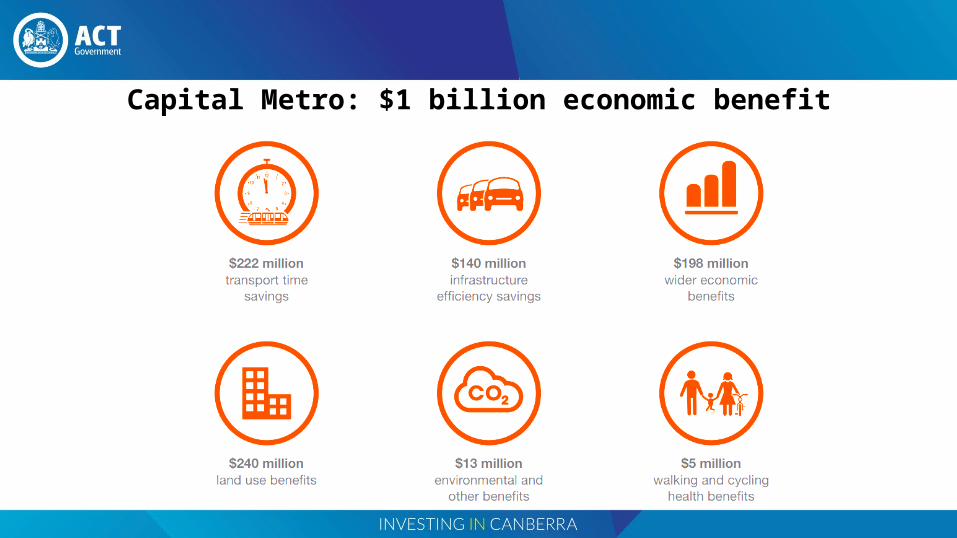
Capital Metro: $1 billion economic benefit
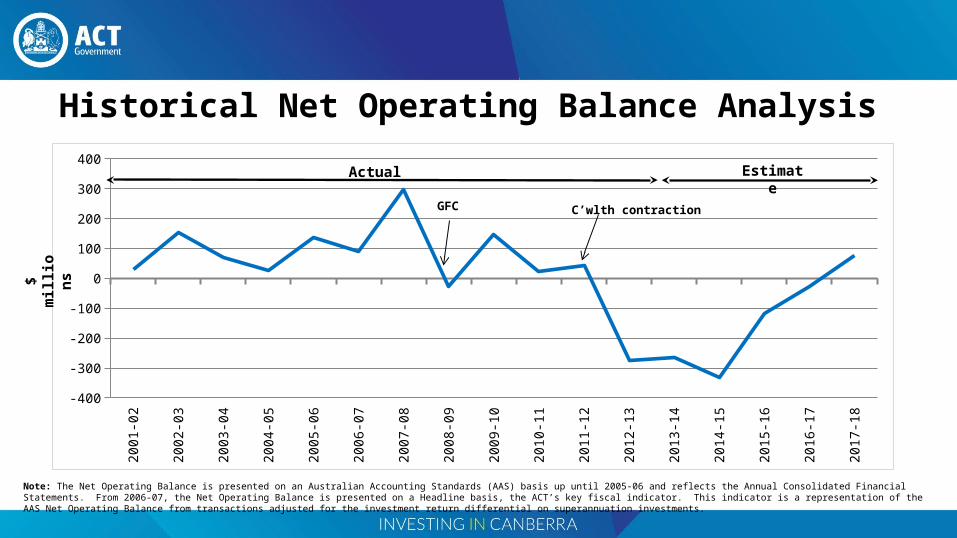
Note: The Net Operating Balance is presented on an Australian Accounting Standards (AAS) basis up until 2005 06 and reflects the Annual Consolidated Financial Statements. From 2006-07, the Net Operating Balance is presented on a Headline ‑basis, the ACT’s key fiscal indicator. This indicator is a representation of the AAS Net Operating Balance from transactions adjusted for the investment return differential on superannuation investments.
Historical Net Operating Balance Analysis20
01-0
2
2002
-03
2003
-04
2004
-05
2005
-06
2006
-07
2007
-08
2008
-09
2009
-10
2010
-11
2011
-12
2012
-13
2013
-14
2014
-15
2015
-16
2016
-17
2017
-18
-400
-300
-200
-100
0
100
200
300
400Actual Estimate
$ m
illio
ns
C’wlth contractionGFC

Where our money goes…


![UNCLASSIFIED - Education€¦ · Minister for Education and Early Childhood Development, I am responding to your correspondence on behalf of Chief Minister /Gordon Ramsay MLA] Education](https://img.pdfslide.net/doc/110x75/5f02f9807e708231d406ed44/unclassified-education-minister-for-education-and-early-childhood-development.jpg)