Embed Size (px)
Citation preview
Clinical Development
RAD001 (Everolimus)
CRAD001HDE13 / NCT01551212
A 12 month, multi-center, open-label, randomized, controlled study to evaluate efficacy/safety and evolution
of renal function of everolimus in co-exposure with tacrolimus in de novo liver transplant recipients
The Hephaistos Study
Statistical Analysis Plan (SAP)
Author:
Document type: SAP Documentation
Document status: Final 1.0
Release date: 06NOV2017
Number of pages: 24
Property of Novartis For business use only
May not be used, divulged, published or otherwise disclosed without the consent of Novartis
Novartis For business use only Page 2 SAP, Final version 1.0 CRAD001HDE13
Signature Page
CRAD001HDE13
_________________________ ____________ (Clinical Trial Leader) Signature Date
_________________________ ____________ (Trial Statistican) Signature Date
_________________________ ____________ (CRO Statistican) Signature Date
Document History – Changes compared to previous final version of SAP Date Time
point Reason for update Outcome for update Section and
title impacted (Current)
06NOV2017 Pior to DB lock
- N/A - First version NA
Novartis For business use only Page 3 SAP, Final version 1.0 CRAD001HDE13
Table of contents Table of contents ................................................................................................................. 3
List of abbreviations ............................................................................................................ 5
1 Introduction ......................................................................................................................... 6
1.1 Study design ............................................................................................................ 6
1.2 Study objectives and endpoints ............................................................................... 7
2 Statistical methods ............................................................................................................... 7
2.1 Data analysis general information ........................................................................... 9
2.1.1 General definitions ................................................................................ 10
2.2 Analysis sets ............................................................................................................ 7
2.2.1 Subgroup of interest ................................................................................ 7
2.3 Patient disposition, demographics and other baseline characteristics ................... 10
2.3.1 Patient disposition ................................................................................. 10
2.4 Treatments (study treatment, rescue medication, concomitant therapies, compliance)............................................................................................................ 11
2.4.1 Study treatment / compliance ................................................................ 11
2.4.2 Prior, concomitant and post therapies ................................................... 11
2.5 Analysis of the primary objective .......................................................................... 11
2.5.1 Primary endpoint ................................................................................... 11
2.5.2 Statistical hypothesis, model, and method of analysis .......................... 12
2.5.3 Handling of missing values/censoring/discontinuations ....................... 12
2.5.4 Supportive analyses ............................................................................... 12
2.6 Analysis of the key secondary objective ............................................................... 13
2.6.1 Key secondary endpoint ........................................................................ 13
2.6.2 Statistical hypothesis, model, and method of analysis .......................... 13
2.6.3 Handling of missing values/censoring/discontinuations ....................... 13
2.7 Analysis of secondary efficacy objective(s) .......................................................... 13
2.7.1 Secondary endpoints ............................................................................. 13
2.7.2 Statistical hypothesis, model, and method of analysis .......................... 14
2.7.3 Handling of missing values/censoring/discontinuations ....................... 14
2.8 Safety analyses....................................................................................................... 14
2.8.1 Adverse events (AEs) ............................................................................ 14
2.8.2 Deaths .................................................................................................... 15
2.8.3 Laboratory data ..................................................................................... 15
2.8.4 Other safety data ................................................................................... 16
2.9 Pharmacokinetic endpoints .................................................................................... 16

Novartis For business use only Page 4 SAP, Final version 1.0 CRAD001HDE13
2.10 PD and PK/PD analyses ........................................................................................ 16
2.11 Patient-reported outcomes ..................................................................................... 16
2.12 Biomarkers ............................................................................................................. 16
2.13 Other Exploratory analyses.................................................................................... 17
2.14 Interim analysis ...................................................................................................... 17
3 Sample size calculation ..................................................................................................... 17
4 Change to protocol specified analyses .............................................................................. 17
5 Appendix ........................................................................................................................... 17
5.1 Imputation rules ..................................................................................................... 19
5.1.1 Study drug ............................................................................................. 19
5.1.2 AE date imputation ............................................................................... 19
5.1.3 Concomitant medication date imputation ............................................. 19
5.2 AEs coding/grading ............................................................................................... 20
5.3 Laboratory parameters derivations ........................................................................ 20
5.4 Statistical models ................................................................................................... 20
5.4.1 Primary analysis .................................................................................... 20
5.4.2 Key secondary analysis ......................................................................... 20
5.5 Rule of exclusion criteria of analysis sets.............................................................. 24
6 Reference ........................................................................................................................... 24

Novartis For business use only Page 5 SAP, Final version 1.0 CRAD001HDE13
List of abbreviations AE Adverse event ALT Alanine Transaminase ANCOVA Analysis of Covariance AST Aspartate Transaminase BPAR Biopsy Proven Acute Rejection CKD-EPI Chronic Kidney Disease – Epidemiology Collaboration CMV Cytomegalovirus CRO Contract Research Organizsation DSMB Data Safety Monitoring Board DOR Drop-Out Rate FAS Full Analysis Set eGFR Estimated Glomerular Filtration Rate EVR Everolimus gamma GT Gamma Glutamyltransferase GFR Glomerular Filtration Rate HCC Hepatocellular Carcinoma HCV Hepatitis C Virus LCMS Liquid Chromatography coupled with Mass Spectrometry LTx Liver Transplantation LOCF Last Observation Carried Forward MDRD-4 Modification of Diet in Renal Disease, 4-variable version MedDRA Medical Dictionary for Drug Regulatory Affairs MELD Model of End Stage Liver Disease MMRM Mixed Model for Repeated Measures PCP Pneumocystis Carinii Pneumonia PPS Per-Protocol Set RAP Report and Analysis Process RNA Ribonucleic Acid SAE Serious Adverse Event SAP Statistical Analysis Plan SOC System Organ Class TAC Tacrilimus TFLs Tables, Figures, Listings ULN Uper Limit Normal Range VAP Vaöidation Analysis Plan WHO World Health Organization
Novartis For business use only Page 6 SAP, Final version 1.0 CRAD001HDE13
1 Introduction This Statistical Analysis Plan (SAP) describes the implementation of the statistical analysis planned in the protocol.
1.1 Study design This study was designed to provide data on efficacy and safety of a post-transplantation regimen in liver allograft patients consisting of reduced tacrolimus in the presence of everolimus.
This is a 12-month, multi-center, open-label, randomized, controlled study to evaluate efficacy and safety and evolution of renal function of everolimus (EVR) in co-exposure with tacrolimus (TAC) in de novo liver transplant recipients.
The trial tests the null hypothesis that there was no difference in renal function, estimated by eGFR according to the MDRD-4 formula, at 12 months after randomization between the everolimus-based tacrolimus-minimization regimen and the tacrolimus-based control regimen versus the alternative hypothesis that the difference is 7.0 ml/min/1.73m2. A sample size of 105 in each group has 80% power to detect a difference in means of 7.0 ml/min/1.73m2 assuming that the common standard deviation was 18.0 ml/min/1.73m2 with a 5% two-sided significance level. (One will decide in favor of H1 when the difference in means would be 5.1 ml/min/1.73m2 or greater in favor of the everolimus-based group.) To adjust the sample size for a common drop-out rate (DOR) of 20% (using the fomula Nadj=N/(1-DOR)²), 165 patients need to be randomized per group. Sample sizes were estimated using NQuery (Version 6.1) procedure “Two-group t-test for equal means (equal n’s)”.
At Baseline (Visit 2) between 7 and 21 days post LTx patients were assigned to one of the following two treatment groups in a ratio of 1:1.
EVR/TAC group (ARM I): Everolimus (C0-h: 3-8 ng/mL*) + tacrolimus (C0-h: < 5 ng/mL*)
TAC group (ARM II): Tacrolimus (C0-h: 6-10 ng/ml*)
*Trough levels as per local practice, e.g. liquid chromatography coupled with mass spectrometry (LCMS). Values derived from enzyme based assays were corrected (as described in the manufacturer’s instructions).
No interim analysis was planned and performed.
An independent Data Safety Monitoring Board (DSMB) was instituted before study start. The DSMB reviewed safety-related issues in a meeting and were entitled to make recommendations for changes in study conduct. Details on the function of the DSMB and the frequency of the DSMB meetings was laid out in a separate DSMB Charter.
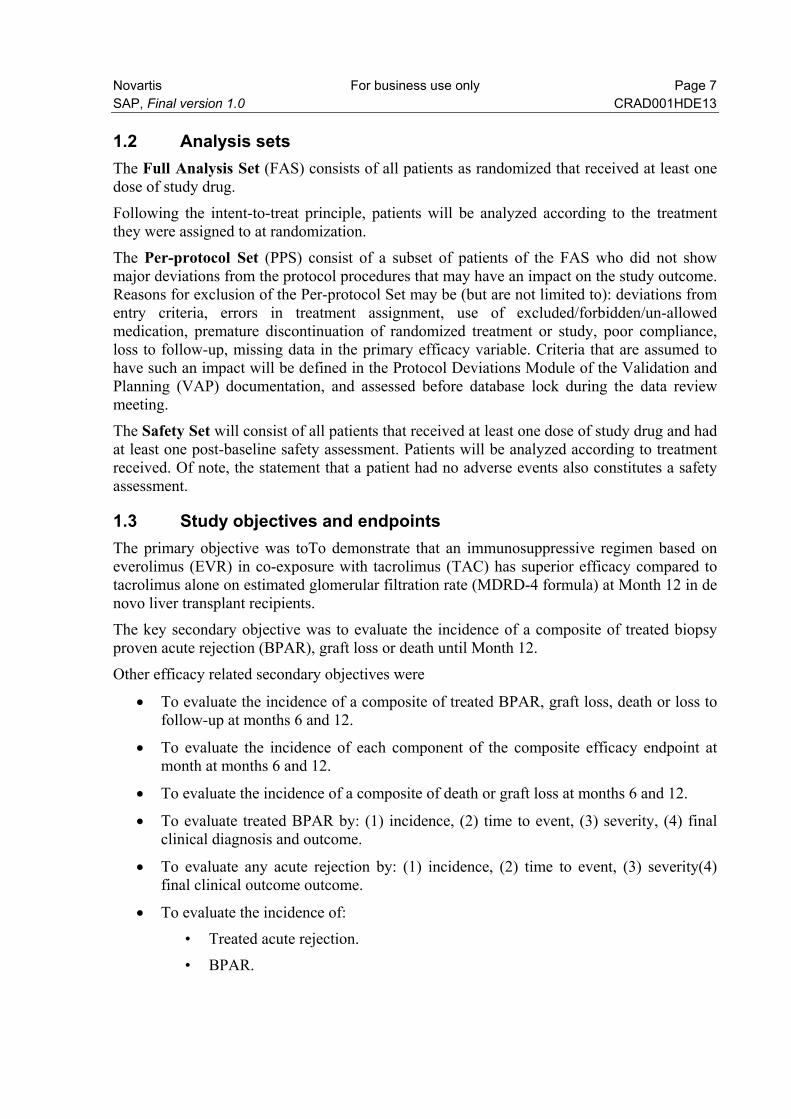
Novartis For business use only Page 7 SAP, Final version 1.0 CRAD001HDE13 1.2 Analysis sets The Full Analysis Set (FAS) consists of all patients as randomized that received at least one dose of study drug.
Following the intent-to-treat principle, patients will be analyzed according to the treatment they were assigned to at randomization.
The Per-protocol Set (PPS) consist of a subset of patients of the FAS who did not show major deviations from the protocol procedures that may have an impact on the study outcome. Reasons for exclusion of the Per-protocol Set may be (but are not limited to): deviations from entry criteria, errors in treatment assignment, use of excluded/forbidden/un-allowed medication, premature discontinuation of randomized treatment or study, poor compliance, loss to follow-up, missing data in the primary efficacy variable. Criteria that are assumed to have such an impact will be defined in the Protocol Deviations Module of the Validation and Planning (VAP) documentation, and assessed before database lock during the data review meeting.
The Safety Set will consist of all patients that received at least one dose of study drug and had at least one post-baseline safety assessment. Patients will be analyzed according to treatment received. Of note, the statement that a patient had no adverse events also constitutes a safety assessment.
1.3 Study objectives and endpoints The primary objective was toTo demonstrate that an immunosuppressive regimen based on everolimus (EVR) in co-exposure with tacrolimus (TAC) has superior efficacy compared to tacrolimus alone on estimated glomerular filtration rate (MDRD-4 formula) at Month 12 in de novo liver transplant recipients.
The key secondary objective was to evaluate the incidence of a composite of treated biopsy proven acute rejection (BPAR), graft loss or death until Month 12.
Other efficacy related secondary objectives were
To evaluate the incidence of a composite of treated BPAR, graft loss, death or loss to follow-up at months 6 and 12.
To evaluate the incidence of each component of the composite efficacy endpoint at month at months 6 and 12.
To evaluate the incidence of a composite of death or graft loss at months 6 and 12.
To evaluate treated BPAR by: (1) incidence, (2) time to event, (3) severity, (4) final clinical diagnosis and outcome.
To evaluate any acute rejection by: (1) incidence, (2) time to event, (3) severity(4) final clinical outcome outcome.
To evaluate the incidence of:
• Treated acute rejection.
• BPAR.
Novartis For business use only Page 8 SAP, Final version 1.0 CRAD001HDE13
• Treated BPAR
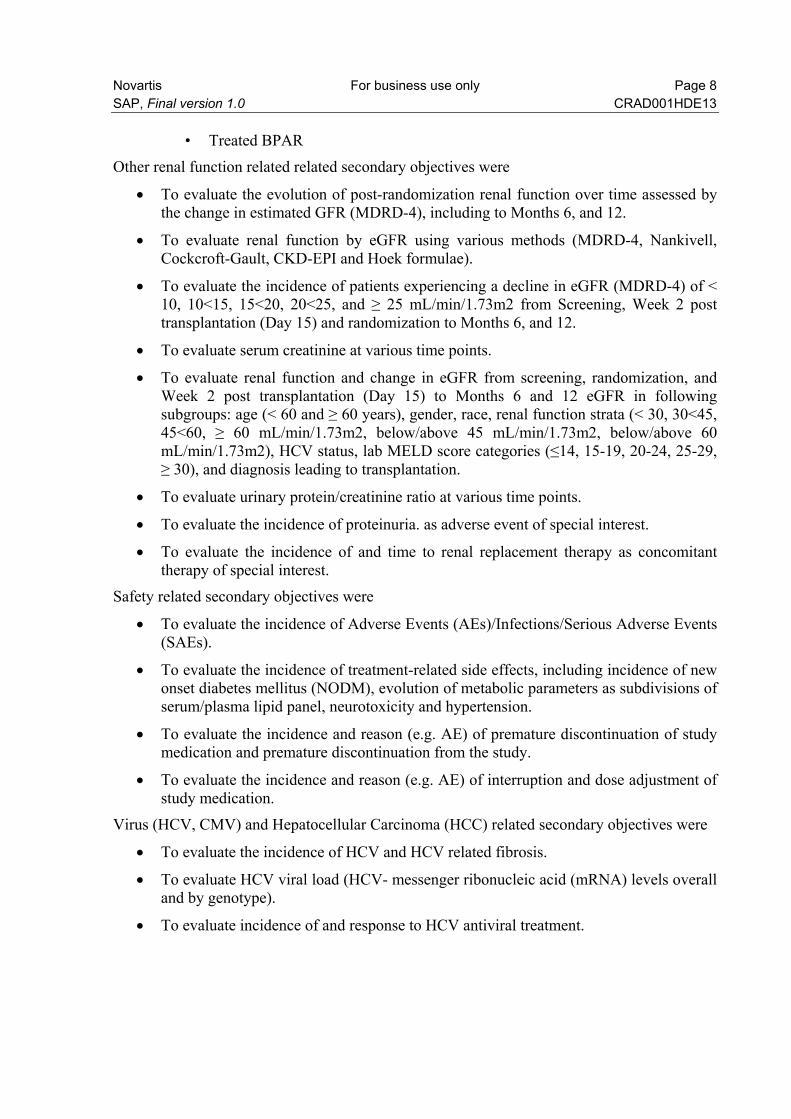
Other renal function related related secondary objectives were
To evaluate the evolution of post-randomization renal function over time assessed by the change in estimated GFR (MDRD-4), including to Months 6, and 12.
To evaluate renal function by eGFR using various methods (MDRD-4, Nankivell, Cockcroft-Gault, CKD-EPI and Hoek formulae).
To evaluate the incidence of patients experiencing a decline in eGFR (MDRD-4) of < 10, 10<15, 15<20, 20<25, and ≥ 25 mL/min/1.73m2 from Screening, Week 2 post transplantation (Day 15) and randomization to Months 6, and 12.
To evaluate serum creatinine at various time points.
To evaluate renal function and change in eGFR from screening, randomization, and Week 2 post transplantation (Day 15) to Months 6 and 12 eGFR in following subgroups: age (< 60 and ≥ 60 years), gender, race, renal function strata (< 30, 30<45, 45<60, ≥ 60 mL/min/1.73m2, below/above 45 mL/min/1.73m2, below/above 60 mL/min/1.73m2), HCV status, lab MELD score categories (≤14, 15-19, 20-24, 25-29, ≥ 30), and diagnosis leading to transplantation.
To evaluate urinary protein/creatinine ratio at various time points.
To evaluate the incidence of proteinuria. as adverse event of special interest.
To evaluate the incidence of and time to renal replacement therapy as concomitant therapy of special interest.
Safety related secondary objectives were
To evaluate the incidence of Adverse Events (AEs)/Infections/Serious Adverse Events (SAEs).
To evaluate the incidence of treatment-related side effects, including incidence of new onset diabetes mellitus (NODM), evolution of metabolic parameters as subdivisions of serum/plasma lipid panel, neurotoxicity and hypertension.
To evaluate the incidence and reason (e.g. AE) of premature discontinuation of study medication and premature discontinuation from the study.
To evaluate the incidence and reason (e.g. AE) of interruption and dose adjustment of study medication.
Virus (HCV, CMV) and Hepatocellular Carcinoma (HCC) related secondary objectives were
To evaluate the incidence of HCV and HCV related fibrosis.
To evaluate HCV viral load (HCV- messenger ribonucleic acid (mRNA) levels overall and by genotype).
To evaluate incidence of and response to HCV antiviral treatment.
Novartis For business use only Page 9 SAP, Final version 1.0 CRAD001HDE13
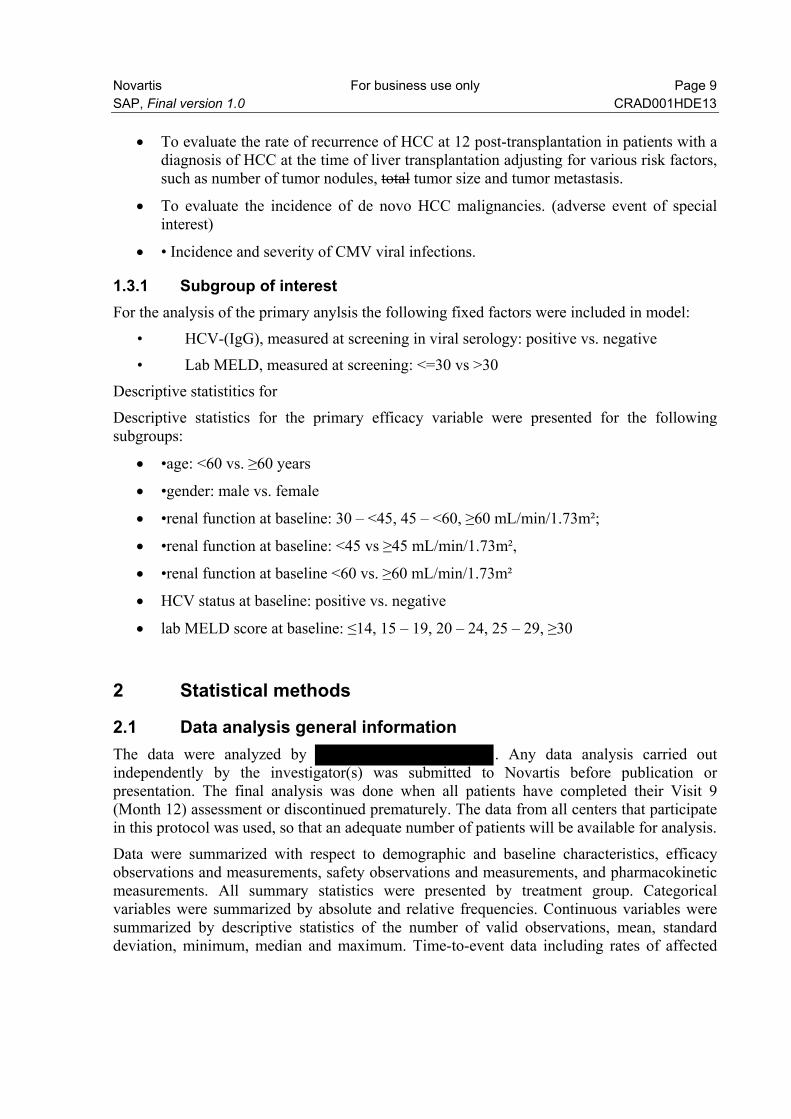
To evaluate the rate of recurrence of HCC at 12 post-transplantation in patients with a diagnosis of HCC at the time of liver transplantation adjusting for various risk factors, such as number of tumor nodules, total tumor size and tumor metastasis.
To evaluate the incidence of de novo HCC malignancies. (adverse event of special interest)
• Incidence and severity of CMV viral infections.
1.3.1 Subgroup of interest For the analysis of the primary anylsis the following fixed factors were included in model:
• HCV-(IgG), measured at screening in viral serology: positive vs. negative
• Lab MELD, measured at screening: <=30 vs >30
Descriptive statistitics for
Descriptive statistics for the primary efficacy variable were presented for the following subgroups:
•age: <60 vs. ≥60 years
•gender: male vs. female
•renal function at baseline: 30 – <45, 45 – <60, ≥60 mL/min/1.73m²;
•renal function at baseline: <45 vs ≥45 mL/min/1.73m²,
•renal function at baseline <60 vs. ≥60 mL/min/1.73m²
HCV status at baseline: positive vs. negative
lab MELD score at baseline: ≤14, 15 – 19, 20 – 24, 25 – 29, ≥30
2 Statistical methods
2.1 Data analysis general information The data were analyzed by . Any data analysis carried out independently by the investigator(s) was submitted to Novartis before publication or presentation. The final analysis was done when all patients have completed their Visit 9 (Month 12) assessment or discontinued prematurely. The data from all centers that participate in this protocol was used, so that an adequate number of patients will be available for analysis.
Data were summarized with respect to demographic and baseline characteristics, efficacy observations and measurements, safety observations and measurements, and pharmacokinetic measurements. All summary statistics were presented by treatment group. Categorical variables were summarized by absolute and relative frequencies. Continuous variables were summarized by descriptive statistics of the number of valid observations, mean, standard deviation, minimum, median and maximum. Time-to-event data including rates of affected
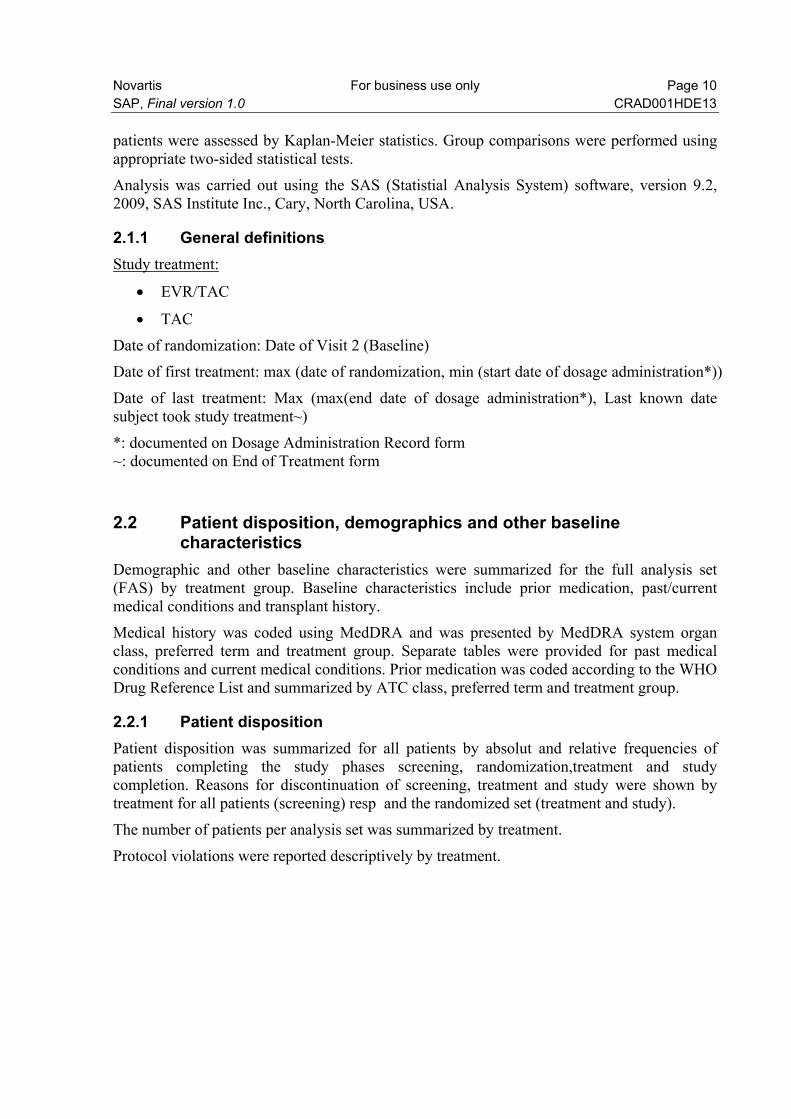
Novartis For business use only Page 10 SAP, Final version 1.0 CRAD001HDE13 patients were assessed by Kaplan-Meier statistics. Group comparisons were performed using appropriate two-sided statistical tests.
Analysis was carried out using the SAS (Statistial Analysis System) software, version 9.2, 2009, SAS Institute Inc., Cary, North Carolina, USA.
2.1.1 General definitions Study treatment:
EVR/TAC
TAC
Date of randomization: Date of Visit 2 (Baseline)
Date of first treatment: max (date of randomization, min (start date of dosage administration*))
Date of last treatment: Max (max(end date of dosage administration*), Last known date subject took study treatment~)
*: documented on Dosage Administration Record form ~: documented on End of Treatment form
2.2 Patient disposition, demographics and other baseline characteristics
Demographic and other baseline characteristics were summarized for the full analysis set (FAS) by treatment group. Baseline characteristics include prior medication, past/current medical conditions and transplant history.
Medical history was coded using MedDRA and was presented by MedDRA system organ class, preferred term and treatment group. Separate tables were provided for past medical conditions and current medical conditions. Prior medication was coded according to the WHO Drug Reference List and summarized by ATC class, preferred term and treatment group.
2.2.1 Patient disposition Patient disposition was summarized for all patients by absolut and relative frequencies of patients completing the study phases screening, randomization,treatment and study completion. Reasons for discontinuation of screening, treatment and study were shown by treatment for all patients (screening) resp and the randomized set (treatment and study).
The number of patients per analysis set was summarized by treatment.
Protocol violations were reported descriptively by treatment.
Novartis For business use only Page 11 SAP, Final version 1.0 CRAD001HDE13 2.3 Treatments (study treatment, rescue medication, concomitant
therapies, compliance)
2.3.1 Study treatment / compliance Duration (days) of drug exposure to each individual component of the immunosuppressive treatment regimen was summarized using descriptive statistics. Duration of drug exposure was calculated as the difference between the last and first day of drug application +1. Dosage averages were calculated including and excluding zero doses for periods of temporary interruption of treatment regardless of whether this was due to safety reasons or patients’ non-compliance. Daily dose levels were summarized descriptively. Frequencies of the number of patients with any dose reduction (including temporary dose interruption) as well as the number of dose reductions by reason were given. These analyses were performed by treatment group for the safety set.
Frequency tables displaying cumulative frequencies of ‘crude rates’ will be presented for the number of patients with trough levels below/within/above the defined therapeutic windows drug and by visit.
2.3.2 Prior, concomitant and post therapies Prior and concomitant medications and non-drug therapies were coded according to WHO-DRL. Concomitant medications taken through the study were summarized by preferred term, ATC class and treatment group for the safety set. Prior medication are defined as medication, which started 1 or more days before randomization. Concomitant medication are mediation, which were treated on at least one in the time interval randomization and last day of study treatement
Corticosteroids will be displayed using prednisone equivalent body weighted adjusted doses. Analysis of the primary objective
2.3.3 Primary endpoint The primary objective of the trial was to demonstrate that an immunosuppressive regimen based on everolimus (EVR) in co-exposure with tacrolimus (TAC) has superior efficacy compared to tacrolimus alone on estimated glomerular filtration rate (MDRD-4 formula) at 12 months after transplantation in de novo liver transplant recipients.
The primary efficacy variable of this trial is the renal function at Month 12 after baseline assessed by estimated GFR based on recalculated values according to the MDRD-4 formula:
eGFR [mL/min/1.73m2] = eGFR= 186.3 * C-1.154 * A-0.203 * G * R,
where C is the serum concentration of creatinine [mg/dL], A is age (years), G=0.742 when gender is female, therwise G=1, R=1.21 when race is black, otherwise R=1.
Novartis For business use only Page 12 SAP, Final version 1.0 CRAD001HDE13 2.3.4 Statistical hypothesis, model, and method of analysis The trial tests the null hypothesis that the treatment difference (investigational minus control) in mean eGFR at Month 12 after baseline is zero versus the alternative hypothesis that the treatment difference was different from zero. The hypotheses was tested with an analysis of covariance (ANCOVA) with treatment , center, HCV-Class (positive, negative) and lab MELD (<=30 vs >30) as factors, and eGFR at Visit 2 (Baseline) as covariate. Raw as well as adjusted means (= LS-means, LS: least square means) were presented for the treatment contrast together with a two-sided p value and the appropriate confidence interval, respectively. The significance level was 5% (two-sided). There are no multiplicity issues to be addressed since only the hypothesis of superior efficacy of the investigational vs. the control regimen was tested confirmatoritly.
The Full Analysis Set was used for the primary analysis. Patients will be analyzed in their randomized group.
2.3.5 Handling of missing values/censoring/discontinuations Missing values in eGFR will be imputed with the last valid observed value from that patient (LOCF). Under the assumption that the eGFR will remain fairly stable in the control group but will probably improve in the investigational group, this strategy corresponds to a conservative estimate of the treatment effect.
As sensitivity analyses a multiple imputation (Molenberghs & Kenward 2007; White, Royston & Wood 2010) will be performed. The specification for the multiple imputation procedure are presented in appendix 5.5.2.
2.3.6 Supportive analyses For sensitivity, the following analyses will be performed:
The primary analysis will be repeated with the Per-protocol Set using the same ANCOVA model as described above.
As a further supportive analysis, a Mixed Model for Repeated Measures (MMRM) will be fitted using treatment group, visit (as a categorical time variable) and subject as categorical variables (Molenberghs & Kenward 2007). Assuming that the time profile is not the same in the two treatment groups, a full visit-by-treatment interaction will be used. Baseline and the baseline-by-time interaction will be included in the model. An unstructured covariance matrix will be used.
The estimated adjusted treatment effect as well as the treatment contrast will be presented for the Month 12 visit together with appropriate two-sided 95% confidence intervals. The model will be fitted for the FAS.
Because there are less than 20 % study discontinuations in the study no multiple imputation of missing values (Molenberghs & Kenward 2007; White, Royston & Wood 2010) was performed as an alternative to account for missing values.
The course of eGFR was summarized descriptively by visit and treatment group for the FAS. Absolute and percent changes from baseline to each post-baseline measure were calculated by
Novartis For business use only Page 13 SAP, Final version 1.0 CRAD001HDE13 treatment group for each study visit as post-baseline minus baseline value. Between-group as well as within-group comparisons will be performed exploratory using suitable parametric (t-test/paired t-test).
2.4 Analysis of the key secondary objective
2.4.1 Key secondary endpoint The key secondary endpoint was the composite of treated biopsy proven acute rejection (BPAR), graft loss or death at Month 12.
2.4.2 Statistical hypothesis, model, and method of analysis The incidence of the composite of treated biopsy proven acute rejection (BPAR), graft loss or death until Month 12 was estimated using the Kaplan-Meier method.
The number of events as well as the number of censored observations will be presented. Kaplan-Meier estimates will be presented by quarter up to Month 12. Percentiles (25%, median, 75%) of the event time distribution will be presented together with their two-sided 95% confidence interval. The two groups were compared using the log-rank test. Kaplan-Meier curve was displayed graphically.
2.4.3 Handling of missing values/censoring/discontinuations If no event occurred until Month 12 or End of Study the observation period will be censored at Month 12 (day 360 or at end of study)
2.5 Analysis of secondary efficacy objective(s)
2.5.1 Secondary endpoints The following secondary efficacy variables were analyzed in an explorative manner for the full analysis set (FAS):
efficacy-related endpoints, such as acute rejection, treated biopsy proven acute rejection (BPAR), graft loss, death and loss to follow-up (as composites or individual endpoints)
endpoints related to renal function: eGFR using various methods (Nankivell, Cockcroft-Gault, CKD EPI and Hoek formulae
Efficacy-related objectives The following endpoints until Month 12 were analyzed:
acute rejection,
treated acute rejection,
BPAR,
treated BPAR,
graft loss,
Novartis For business use only Page 14 SAP, Final version 1.0 CRAD001HDE13
death
composite of treated biopsy proven acute rejection (BPAR), graft loss or death.
composite of treated BPAR, graft loss, death or loss to follow-up
composite of graft loss or death.
Renal function-related objectives Renal function as assessed by eGFR calculated according to the CKD-EPI, Cockcroft-Gault, Nankivell, and Hoek formulas were the futher renal function-related secondary paramerter. Further parameter was the proteinuria.
2.5.2 Statistical hypothesis, model, and method of analysis Efficacy-related objectives The incidence of efficacy-related endpoints was estimated using the Kaplan-Meier method. The number of events as well as the number of censored observations was presented. Kaplan-Meier estimates were presented by quarter up to Month 12. Percentiles (25%, median, 75%) of the event time distribution were presented together with their two-sided 95% confidence interval. The two groups will be compared using the log-rank test. Kaplan-Meier curves were displayed graphically
The number of max. severity by patient was reported by frequency tables.
Renal function-related objectives Renal function were analyzed using the ANCOVA model specified for the primary analysis. Raw as well as adjusted means were presented for the treatment contrast together with its confidence interval and two-sided exploratory p values separately for each time point.
Additionally to the analysis at Month 12, an analysis at Month 6 (included eGFR calculated by MDRD-4 formula) was performed.
The incidence of proteinuria was analyzed using frequency tables by treatment group as adverse of special interest.
2.5.3 Handling of missing values/censoring/discontinuations Missing values will be dealt with in the ANCOVA analysis by LOCF-method.
2.6 Safety analyses The assessment of safety was based mainly on the frequency of adverse events and on the number of laboratory values that fall outside of pre-determined ranges. Other safety data were considered as appropriate.
2.6.1 Adverse events (AEs) Treatment emergent events are defined as all adverse events started at baseline or later.
Treatment emergent adverse events were summarized by presenting, for each treatment group, the number and percentage of patients having any adverse event, having an adverse event in

Novartis For business use only Page 15 SAP, Final version 1.0 CRAD001HDE13 each body system and having each individual adverse event. Any other information collected (e.g. severity or relatedness to study medication) were listed as appropriate.
Data collected by AE CRFs and by Infection CRFs were coded using MedDRA. The number of AE/patients with AE was summarized by MedDRA system organ class and preferred term. Additionally, AE will be summarized
by maximum severity,
for AE with suspected drug relation,
for serious AE (SAE), and
for AE leading to permanent discontinuation of study drug.
In addition to being analyzed together with AE data, the incidence of bacterial, viral and fungal infections will be tabulated separately for all infections
by maximum severity,
for infections with suspected drug relation,
for serious infections and
for infections leading to premature discontinuation of study drug.
Infections were defined as adverse events as adverse events in primary system organ class “Infections and infestations”.
2.6.1.1 Adverse events of special interest / grouping of AEs Adverse of special interst were
New onset of diabetes mellitus,
de novo HCC malignancies,
HCV- and HCV-related fibrosis
Proteinuria
CMV viral infections
For the subgroup of patients with HbA1c baseline range of 5.7 to 6.4%, the onset of diabetes will be calculated additional.
2.6.2 Deaths Adverse events leading to death will be listed by treatment group.
2.6.3 Laboratory data Abnormalities according notable criteria (see Appendix 2 of the study prototocol) were identified. The proportions of patients with clinically notable abnormalities according to the notable criteria were summarized. Descriptive statistics of absolute values as well as change from baseline of all laboratory variables were presented by visit and treatment group. A by-
Novartis For business use only Page 16 SAP, Final version 1.0 CRAD001HDE13 patient listing of all clinically notable abnormal laboratory data was generated. Only assessments obtained up to 28 days after the discontinuation of study medication will be considered “on-treatment” and analyzed with relationship to immunosuppressive therapy.
2.6.4 Other safety data
2.6.4.1 ECG and cardiac imaging data Not applicable
2.6.4.2 Vital signs Vital signs were recorded at every study visit, and included
• Radial pulse rate (bpm)
• Systolic blood pressure (mmHg)
• Diastolic blood pressure (mmHg)
• Weight (kg)
• BMI (kg/m2)
Abnormalities according notable criteria (see Appendix 2 of the study protocol) were identified. The proportions of patients with clinically notable abnormalities according to the notable criteria were summarized. Descriptive statistics of absolute values as well as change from baseline of all vital signs variables were presented by visit and treatment group. Only assessments obtained up to 28 days after the discontinuation of study medication was considered “on-treatment” and analyzed with relationship to immunosuppressive therapy.
2.7 Pharmacokinetic endpoints Everolimus C0-h whole blood levels were summarized by visit using descriptive statistics. Tacrolimus C0-h whole blood levels were summarized by visit and treatment group using descriptive statistics.
Trough levels of everolimus and tacrolimus, respectively, were summarized descriptively by visit. The number of patients with deviations from the therapeutic window (see Section 4 of the protocol) were counted and tabulated separately by visit and in total.
2.8 PD and PK/PD analyses Not applicable
2.9 Patient-reported outcomes Not applicable
2.10 Biomarkers HCV viral load (HCV-ribonucleic acid (RNA) levels overall and by genotype) was summarized descriptively by visit and treatment group.
Novartis For business use only Page 17 SAP, Final version 1.0 CRAD001HDE13
2.11 Other Exploratory analyses Not applicable
2.12 Interim analysis An external and independent Data Safety Monitoring Board (DSMB) was instituted before study start. The DSMB reviewed safety-related issues in a meeting and was entitled to make recommendations for changes in study conduct.
3 Sample size calculation The trial tests the null hypothesis that there was no difference in renal function, estimated by eGFR according to the MDRD-4 formula, at 12 months after randomization between the everolimus-based tacrolimus-minimization regimen and the tacrolimus-based control regimen versus the alternative hypothesis that the difference is 7.0 ml/min/1.73m2. A sample size of 105 in each group will have 80% power to detect a difference in means of 7.0 ml/min/1.73m2 assuming that the common standard deviation was 18.0 ml/min/1.73m2 with a 5% two-sided significance level. (One will decide in favor of H1 when the difference in means would be 5.1 ml/min/1.73m2 or greater in favor of the everolimus-based group.) To adjust the sample size for a common drop-out rate (DOR) of 20% (using the fomula Nadj=N/(1-DOR)²), 165 patients need to be randomized per group. Sample sizes were estimated using NQuery (Version 6.1) procedure “Two-group t-test for equal means (equal n’s)”.
Power for the analysis of secondary variables was not investigated.
4 Change to protocol specified analyses The study protocol was amended 5 times, the original protocol and all amendments are provided in Appendix 16.1.1. Previous sections of this report describe the study conduct as amended. The key features of each amendment are given below:
Amendment 1 (20-Jan2012), before generation of CRF and inclusion of first, introduced the following changes:
Assesment schedule: Laboratory and GFR were shifted from Screening visit to baseline visit
Additional assessment in Screening visit: Menopausal status and in all women of childbearing potential a pregnancy test
Amendment 2 (26-Sep-2012), 15 patient had been randomized to the study. The major changes that were made to the protocol were as follows:
Measurement of the Tacrolimus C-0h levels can now be performed as per local practice.
Inclusion criteria – randomization 2 was rephrased for a clearer understanding.
Novartis For business use only Page 18 SAP, Final version 1.0 CRAD001HDE13 Inclusion criteria – randomization 3: AST and ALT levels were raised to ≤5 times ULN,
evaluation of gamma GT was deleted due to the fact that it does not reflect a prognostically important mark.
For a better understanding, exclusion criteria – randomization 2 was separated in 4 independent criteria. Platelet, neutrophil and white blood cell count was reduced to 50,000/mm3, 1,000/mm3 and 2,000/mm3 respectively
Former inclusion criteria – randomization 2 (now 6): Calculation mistake of concentration of hypertriglyceridemia was corrected.
Graft loss was added as reason for premature patient withdrawal.
Dispensing of study drug and instruction for use of study drug are described in more detail to avoid misuse.
According to the adaptation of in- and exclusion criteria, the permission of study drug adjustment and interruption in case of inability of tolerance of the protocol-specific dosing scheme is described in more detail.
PCP prophylaxis and treatment of oral candida will be performed according to local practice.
It was added, that pregnancy outcomes must be collected for the female partners of any males who took study drug in this study
These amendments were not considered to have affected the interpretation of study results as they were minor. Amendment 3 (14-JUN2013): 57 patients had been randomized to the study: Five sub-studies which will be conducted in selected centers were added to the protocol. In addition some editorial changes were performed. Amendment 4 (19-NOV-2014): 186 patients had been randomized to the study: The protocol had been refined to clarify the mandatory usage of corticosteroids in this study. Additionally, Inclusion Criterion 3/Exclusion Criterion 11 had been adjusted to include total abstinence as acceptable contraception method. Amendment 5 (19-AUG-2015): 259 patients had been randomized to the study: The purpose of this amendment was to adapt one exclusion criteria (Excl.Crit.N°5) to better align with given clinical praxis and patients’ condition post liver transplantation. Therefore Exclusion Criterion 5 (at randomization) had been adjusted to allow inclusion of patients with hemoglobin < 6.0 g/dL (transfusion of erythrocytes concentrate during or after transplantation are allowed according to investigator discretion). Changes in statistical methods in compoarison to the protocol: The Virus (HCV, CMV) and Hepatocellular Carcinoma (HCC) related secondary objective “• To evaluate rates of progression of HCV related allograft fibrosis are deleted. Reason is, that the in case from HCV the biopsies were not performed adequately.

Novartis For business use only Page 19 SAP, Final version 1.0 CRAD001HDE13 The incidence of proteinuria of 0.5 – <1.0 g/day, 1.0 – <3.0 g/day and ≥3.0 g/day could not analysed, because in urine analysis protein is measures in g/l und not in g/day. Therefore, proteinuria could be only documented as adverse event. Therefore proteinuria is defined as further adverse event of special interest. CNV viral infection were defined as further adverse event of special interest. Treatment emergent events were defined as all adverse started at baseline or later.
5 Appendix
5.1 Imputation rules
5.1.1 Study drug According to Novartis-Germany guidelines missing values in dates will be imputed by a simple way:
Missind day replacement by 15
Missing month replacement by 7
Everolimus and Tacrolimus are studymedication. After treatment discontinuation this treatment are documented as “Immunosuppressive Medications”. For the anlsysis of Everolimus and Tacrolimus this treatment have to shifted from “Immunosuppressive Medications” to Study medication. If WHO-DD-preferred-name are EVEROLIMUS or TACROLIMUS, TACROLIMUS MONOHYDRATE in “Immunosuppressive Medications”, the record will be shifted to to “Study medication”. If the end-date of the medication is later than the last visit (e.g. Month 12) or the medication is “contuing after study”, the end-date will be set to date of last visit. This adaption is necessary to calculate the treatment duration and the mean dose over thestudy for everolimus and tacrolimus.
Duration of exposure will be calculated until end of study. That means , that the period after end of treatment will also included.
5.1.2 AE date imputation According to Novartis-Germany guidelines missing values in dates will be imputed by a simple way:
Missind day replacement by 15
Missing month replacement by 7
5.1.3 Concomitant medication date imputation According to Novartis-Germany guidelines missing values in dates will be imputed by a simple way:
Missing day replacement by 15
Novartis For business use only Page 20 SAP, Final version 1.0 CRAD001HDE13
Missing month replacement by 7
In the analysis of Immunosuppressive Medications, the medication tacrolimus and everolimus will be excluded.
5.2 Analysis of the primary objective Missing values in eGFR will be imputed with the last valid observed value from that patient (LOCF). That means the eGFR values will be carried forward in case of missing. For that procedure the visits will be ordered by date of visit. If the treatment are discontinued, the visit 9a (End-oftreatment visit) will be performed. This additional visit will also be ordered after te last performed visit under treatment.
According to this procedure, the last present eGFR values until Month 12 is used as primary endpoint for all patients. Please note, that in case of treatment discontinuations, the last value is not under treatment.
5.3 AEs coding/grading Adverse events were anaysed by MedDRA, version 20.0.
5.4 Laboratory parameters derivations The values from the local values are documented in digfferent units per parameter. The values were converted to standard units. The statistical analysis will be done by the converted values.
5.5 Statistical models
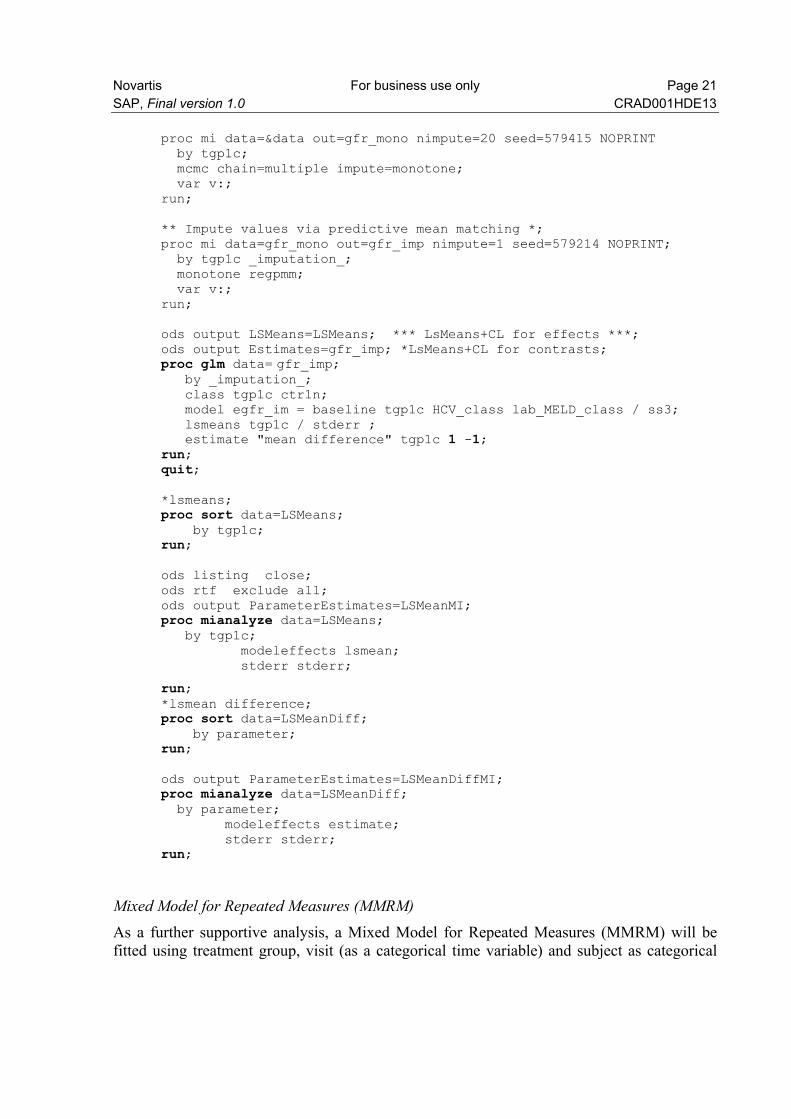
5.5.1 Primary analysis The primary analysis is an analysis of covariance (ANCOVA) with treatment , center, HCV-Class (positive, negative) and lab MELD (<=30 vs >30) as factors, and eGFR at Visit 2 (Baseline) as covariate:
ods output LSMeans=LSMeans; *** LsMeans+CL for effects ***; ods output Estimates=Estimates; *Estimates+CL for contrasts; proc glm data= &data; class tgp1c ctr1n; model egfr = baseline tgp1c HCV_class lab_MELD_class / ss3; lsmeans tgp1c / stderr ; estimate "mean difference" tgp1c 1 -1; run; quit;
HCV-Claasification: If in screening or baseline one HCV serology assessement (HCV or HCV-IgG) in recipient is positive, the patient is classified as positive, otherwise as negative
5.5.2 Key secondary analysis Multiple imputation (Molenberghs & Kenward 2007; White, Royston & Wood 2010) Alternative to LOCF, additionally as sensitivity analyses a multiple imputation (Molenberghs & Kenward 2007; White, Royston & Wood 2010) is planned:
* Impute values via MCMC to obtain a monotone missing pattern*;
Novartis For business use only Page 21 SAP, Final version 1.0 CRAD001HDE13
proc mi data=&data out=gfr_mono nimpute=20 seed=579415 NOPRINT by tgp1c; mcmc chain=multiple impute=monotone; var v:; run; ** Impute values via predictive mean matching *; proc mi data=gfr_mono out=gfr_imp nimpute=1 seed=579214 NOPRINT; by tgp1c _imputation_; monotone regpmm; var v:; run; ods output LSMeans=LSMeans; *** LsMeans+CL for effects ***; ods output Estimates=gfr_imp; *LsMeans+CL for contrasts; proc glm data= gfr_imp; by _imputation_; class tgp1c ctr1n; model egfr_im = baseline tgp1c HCV_class lab_MELD_class / ss3; lsmeans tgp1c / stderr ; estimate "mean difference" tgp1c 1 -1; run; quit; *lsmeans; proc sort data=LSMeans; by tgp1c; run; ods listing close; ods rtf exclude all; ods output ParameterEstimates=LSMeanMI; proc mianalyze data=LSMeans; by tgp1c; modeleffects lsmean; stderr stderr;
run; *lsmean difference; proc sort data=LSMeanDiff; by parameter; run; ods output ParameterEstimates=LSMeanDiffMI; proc mianalyze data=LSMeanDiff; by parameter; modeleffects estimate; stderr stderr; run;
Mixed Model for Repeated Measures (MMRM) As a further supportive analysis, a Mixed Model for Repeated Measures (MMRM) will be fitted using treatment group, visit (as a categorical time variable) and subject as categorical
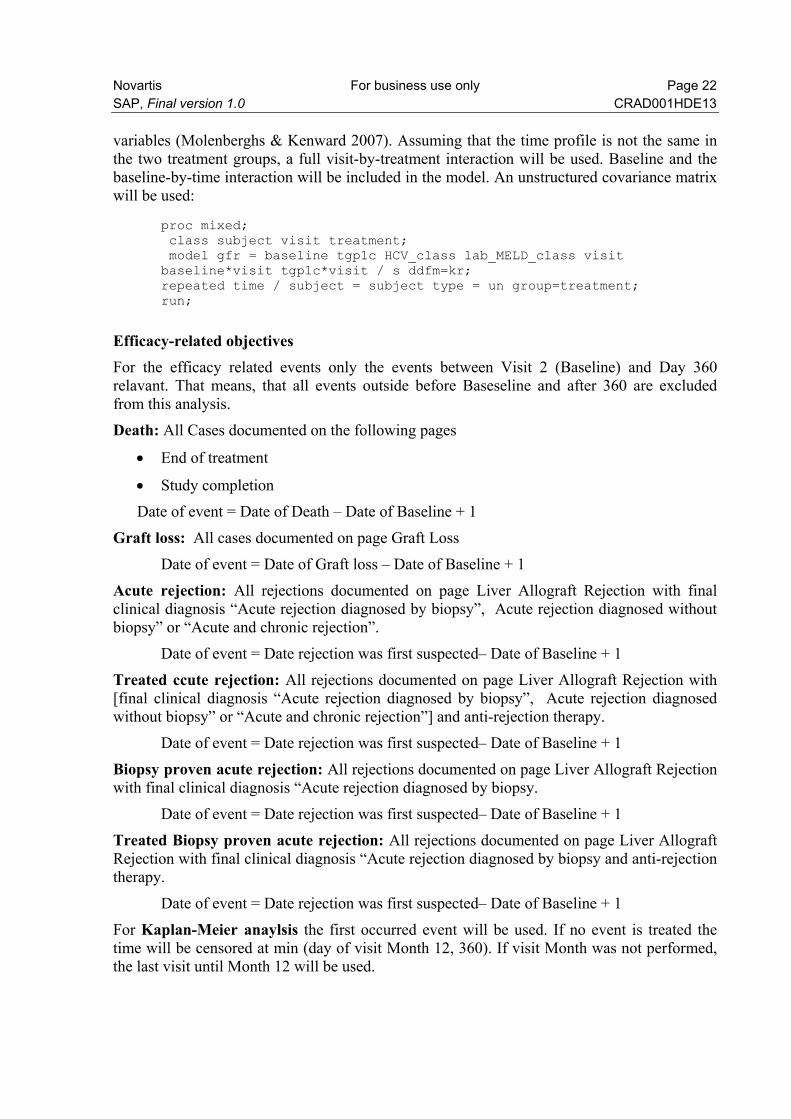
Novartis For business use only Page 22 SAP, Final version 1.0 CRAD001HDE13 variables (Molenberghs & Kenward 2007). Assuming that the time profile is not the same in the two treatment groups, a full visit-by-treatment interaction will be used. Baseline and the baseline-by-time interaction will be included in the model. An unstructured covariance matrix will be used:
proc mixed; class subject visit treatment; model gfr = baseline tgp1c HCV_class lab_MELD_class visit baseline*visit tgp1c*visit / s ddfm=kr; repeated time / subject = subject type = un group=treatment; run;
Efficacy-related objectives For the efficacy related events only the events between Visit 2 (Baseline) and Day 360 relavant. That means, that all events outside before Baseseline and after 360 are excluded from this analysis.
Death: All Cases documented on the following pages
End of treatment
Study completion
Date of event = Date of Death – Date of Baseline + 1
Graft loss: All cases documented on page Graft Loss
Date of event = Date of Graft loss – Date of Baseline + 1
Acute rejection: All rejections documented on page Liver Allograft Rejection with final clinical diagnosis “Acute rejection diagnosed by biopsy”, Acute rejection diagnosed without biopsy” or “Acute and chronic rejection”.
Date of event = Date rejection was first suspected– Date of Baseline + 1
Treated ccute rejection: All rejections documented on page Liver Allograft Rejection with [final clinical diagnosis “Acute rejection diagnosed by biopsy”, Acute rejection diagnosed without biopsy” or “Acute and chronic rejection”] and anti-rejection therapy.
Date of event = Date rejection was first suspected– Date of Baseline + 1
Biopsy proven acute rejection: All rejections documented on page Liver Allograft Rejection with final clinical diagnosis “Acute rejection diagnosed by biopsy.
Date of event = Date rejection was first suspected– Date of Baseline + 1
Treated Biopsy proven acute rejection: All rejections documented on page Liver Allograft Rejection with final clinical diagnosis “Acute rejection diagnosed by biopsy and anti-rejection therapy.
Date of event = Date rejection was first suspected– Date of Baseline + 1
For Kaplan-Meier anaylsis the first occurred event will be used. If no event is treated the time will be censored at min (day of visit Month 12, 360). If visit Month was not performed, the last visit until Month 12 will be used.
Novartis For business use only Page 23 SAP, Final version 1.0 CRAD001HDE13
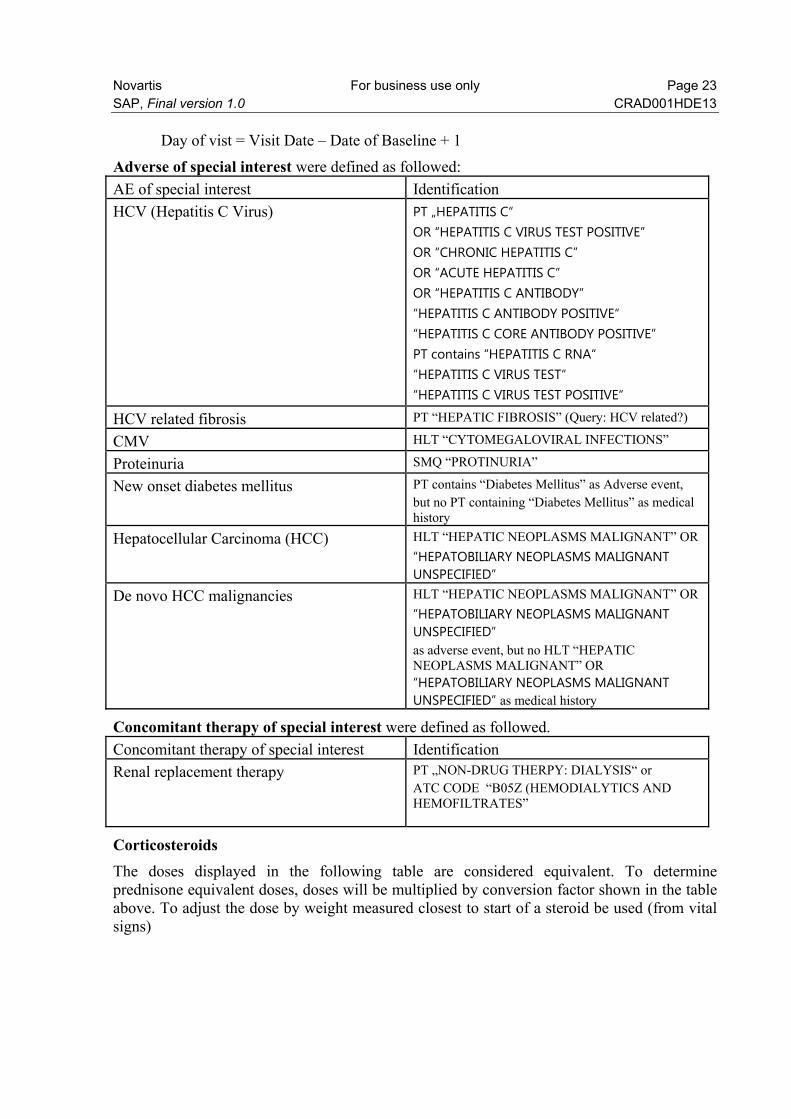
Day of vist = Visit Date – Date of Baseline + 1
Adverse of special interest were defined as followed:
AE of special interest Identification
HCV (Hepatitis C Virus) PT „HEPATITIS C“ OR “HEPATITIS C VIRUS TEST POSITIVE” OR “CHRONIC HEPATITIS C” OR “ACUTE HEPATITIS C” OR “HEPATITIS C ANTIBODY” “HEPATITIS C ANTIBODY POSITIVE“ “HEPATITIS C CORE ANTIBODY POSITIVE” PT contains “HEPATITIS C RNA“ “HEPATITIS C VIRUS TEST“ “HEPATITIS C VIRUS TEST POSITIVE“
HCV related fibrosis PT “HEPATIC FIBROSIS” (Query: HCV related?)
CMV HLT “CYTOMEGALOVIRAL INFECTIONS”
Proteinuria SMQ “PROTINURIA”
New onset diabetes mellitus PT contains “Diabetes Mellitus” as Adverse event, but no PT containing “Diabetes Mellitus” as medical history
Hepatocellular Carcinoma (HCC) HLT “HEPATIC NEOPLASMS MALIGNANT” OR
“HEPATOBILIARY NEOPLASMS MALIGNANT UNSPECIFIED”
De novo HCC malignancies HLT “HEPATIC NEOPLASMS MALIGNANT” OR
“HEPATOBILIARY NEOPLASMS MALIGNANT UNSPECIFIED” as adverse event, but no HLT “HEPATIC NEOPLASMS MALIGNANT” OR “HEPATOBILIARY NEOPLASMS MALIGNANT UNSPECIFIED” as medical history
Concomitant therapy of special interest were defined as followed.
Concomitant therapy of special interest Identification
Renal replacement therapy PT „NON-DRUG THERPY: DIALYSIS“ or ATC CODE “B05Z (HEMODIALYTICS AND HEMOFILTRATES”
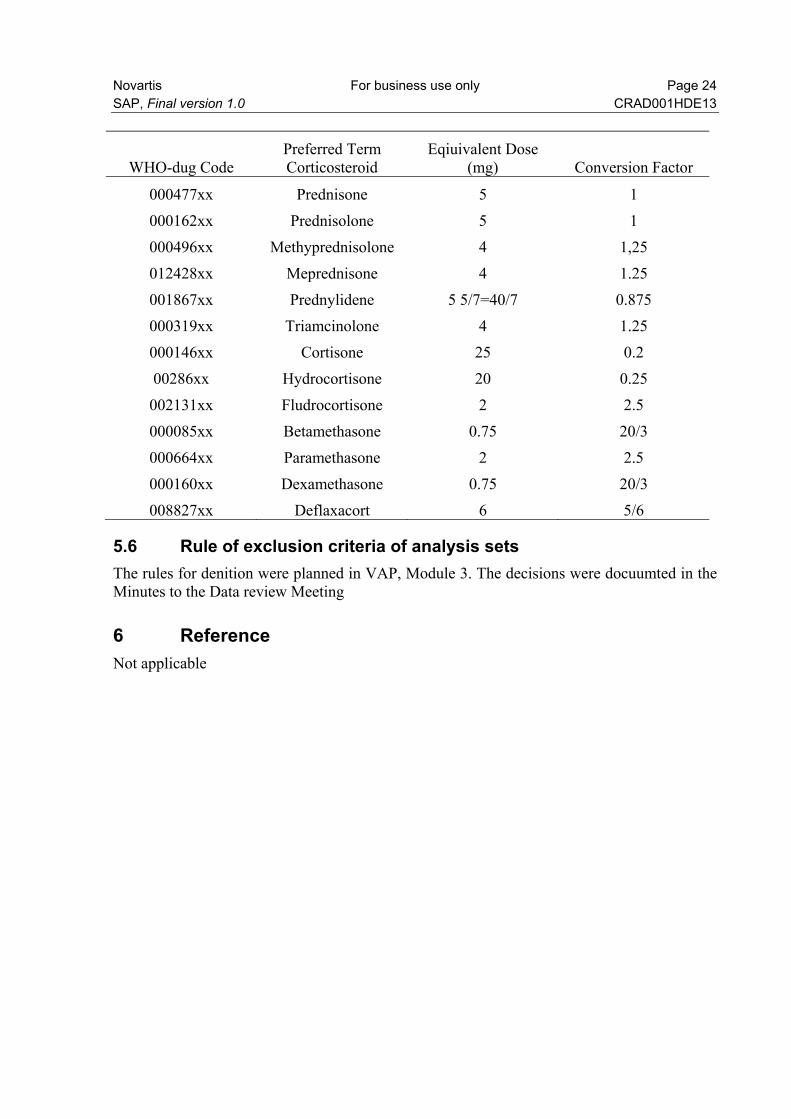
Corticosteroids The doses displayed in the following table are considered equivalent. To determine prednisone equivalent doses, doses will be multiplied by conversion factor shown in the table above. To adjust the dose by weight measured closest to start of a steroid be used (from vital signs)
Novartis For business use only Page 24 SAP, Final version 1.0 CRAD001HDE13
WHO-dug Code Preferred Term Corticosteroid
Eqiuivalent Dose (mg) Conversion Factor
000477xx Prednisone 5 1
000162xx Prednisolone 5 1
000496xx Methyprednisolone 4 1,25
012428xx Meprednisone 4 1.25
001867xx Prednylidene 5 5/7=40/7 0.875
000319xx Triamcinolone 4 1.25
000146xx Cortisone 25 0.2
00286xx Hydrocortisone 20 0.25
002131xx Fludrocortisone 2 2.5
000085xx Betamethasone 0.75 20/3
000664xx Paramethasone 2 2.5
000160xx Dexamethasone 0.75 20/3
008827xx Deflaxacort 6 5/6
5.6 Rule of exclusion criteria of analysis sets The rules for denition were planned in VAP, Module 3. The decisions were docuumted in the Minutes to the Data review Meeting
6 Reference Not applicable


![Personal Statement FINAL10[1]](https://img.pdfslide.net/doc/110x75/577cc2121a28aba711941f86/personal-statement-final101.jpg)