Embed Size (px)
Citation preview

#CrazyAboutRugby

A I R N E W ZE A L A N D A N N UA L F I N A N C I A L R E S U LT S 2 0 1 9
A I R N E W ZE A L A N D G R O U P
1*This document, in conjunction with the Air New Zealand Annual Shareholder Review 2019, constitutes the 2019 Annual Report to shareholders of Air New Zealand Limited.
DIRECTORS’ STATEMENT
The directors of Air New Zealand Limited are pleased to present to shareholders the Annual Report* and financial statements for Air New Zealand and its controlled entities (together the “Group”) for the year to 30 June 2019.
The directors are responsible for presenting financial statements in accordance with New Zealand law and generally accepted accounting practice, which give a true and fair view of the financial position of the Group as at 30 June 2019 and the results of the Group’s operations and cash flows for the year ended on that date.
The directors consider the financial statements of the Group have been prepared using accounting policies which have been consistently applied and supported by reasonable judgements and estimates and that all relevant financial reporting and accounting standards have been followed.
The directors believe that proper accounting records have been kept in accordance with the requirements of the Financial Markets Conduct Act 2013.
The directors consider that they have taken adequate steps to safeguard the assets of the Group, and to prevent and detect fraud and other irregularities. Internal control procedures are also considered to be sufficient to provide a reasonable assurance as to the integrity and reliability of the financial statements.
This Annual Report is signed on behalf of the Board by:
Tony Carter Jan DawsonChairman Deputy Chairman
22 August 2019
ContentsStatement of Financial Performance 2
Statement of Comprehensive Income 3
Statement of Changes In Equity 4
Statement of Financial Position 5
Statement of Cash Flows 6
Statement of Accounting Policies 7
Notes to the Financial Statements
1. Revenue Recognition and Segmental Information 9
2. Expenses 10
3. Taxation 10
4. Earnings Per Share 11
5. Cash and Cash Equivalents 12
6. Trade and Other Receivables 12
7. Inventories 13
8. Other Assets 13
9. Property, Plant and Equipment 14
10. Intangible Assets 16
11. Investments in Other Entities 17
12. Revenue in Advance 18
13. Interest-Bearing Liabilities 18
14. Provisions 19
15. Other Liabilities 20
16. Distributions to Owners 21
17. Share Capital 21
18. Reserves 25
19. Operating Leases 25
20. Capital Commitments 26
21. Contingent Liabilities 26
22. Financial Risk Management 26
23. Offsetting Financial Assets and Financial Liabilities 36
24. Related Parties 37
25. Impact of New Accounting Standards 38
Independent Auditor’s Report 41
Five Year Statistical Review 46
Corporate Governance Statement 50
Directors’ Profiles 63
Interests Register 65
Directors’ Interests in Air New Zealand Securities 66
Indemnities and Insurance 66
Employee Remuneration 67
Subsidiary and Joint Venture Companies 71
Other Disclosures 72
Securities Statistics 73
Operating Fleet Statistics 74
General Information 75
Shareholder Directory 76
The accompanying accounting policies and notes form part of these financial statements.2
A I R N E W ZE A L A N D A N N UA L F I N A N C I A L R E S U LT S 2 0 1 9
NOTES
2019
$M
2018
$M
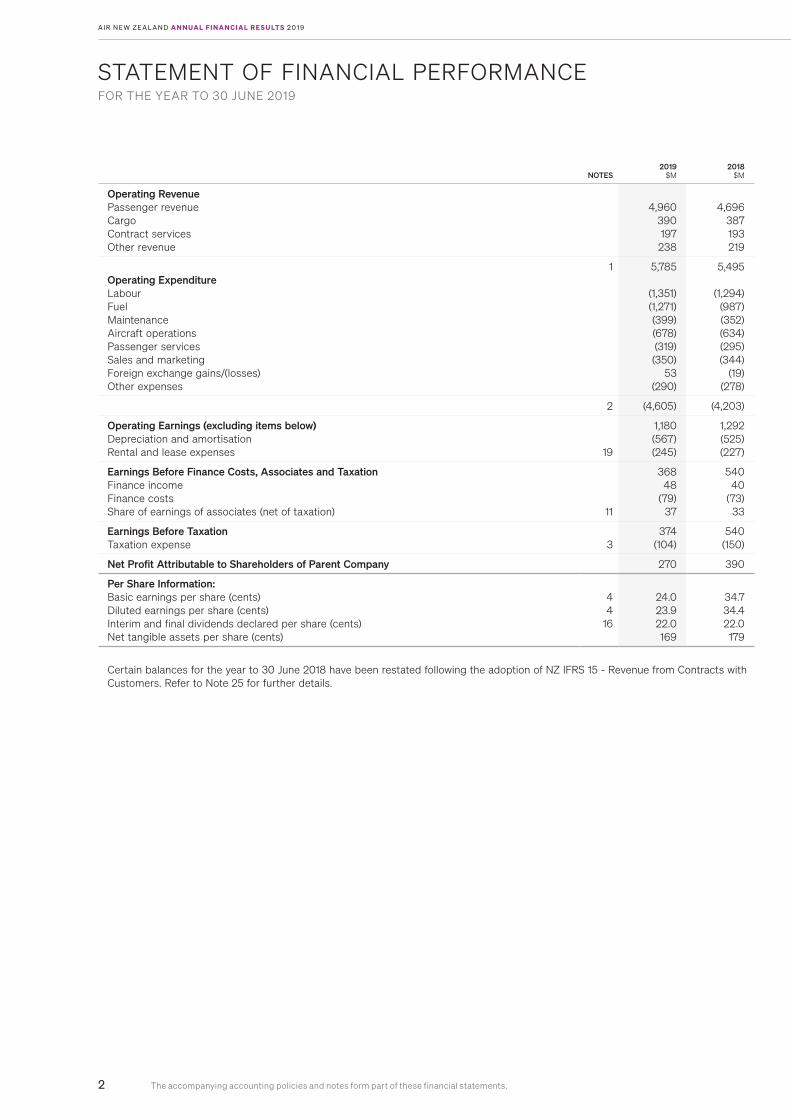
Operating RevenuePassenger revenueCargoContract servicesOther revenue
4,960 390 197
238
4,696 387 193 219
Operating ExpenditureLabourFuelMaintenanceAircraft operationsPassenger servicesSales and marketingForeign exchange gains/(losses)Other expenses
1 5,785
(1,351) (1,271) (399) (678) (319)
(350) 53
(290)
5,495
(1,294) (987) (352) (634) (295) (344)
(19) (278)
2 (4,605) (4,203)
Operating Earnings (excluding items below)Depreciation and amortisationRental and lease expenses 19
1,180 (567) (245)
1,292 (525) (227)
Earnings Before Finance Costs, Associates and TaxationFinance incomeFinance costsShare of earnings of associates (net of taxation) 11
368 48 (79) 37
540 40 (73) 33
Earnings Before TaxationTaxation expense 3
374 (104)
540 (150)
Net Profit Attributable to Shareholders of Parent Company 270 390
Per Share Information:Basic earnings per share (cents)Diluted earnings per share (cents)Interim and final dividends declared per share (cents)Net tangible assets per share (cents)
44
16
24.0 23.9 22.0 169
34.7 34.4 22.0 179
Certain balances for the year to 30 June 2018 have been restated following the adoption of NZ IFRS 15 - Revenue from Contracts with Customers. Refer to Note 25 for further details.
STATEMENT OF FINANCIAL PERFORMANCEFOR THE YEAR TO 30 JUNE 2019
The accompanying accounting policies and notes form part of these financial statements. 3
A I R N E W ZE A L A N D G R O U P
STATEMENT OF COMPREHENSIVE INCOMEFOR THE YEAR TO 30 JUNE 2019
NOTE
2019
$M
2018
$M
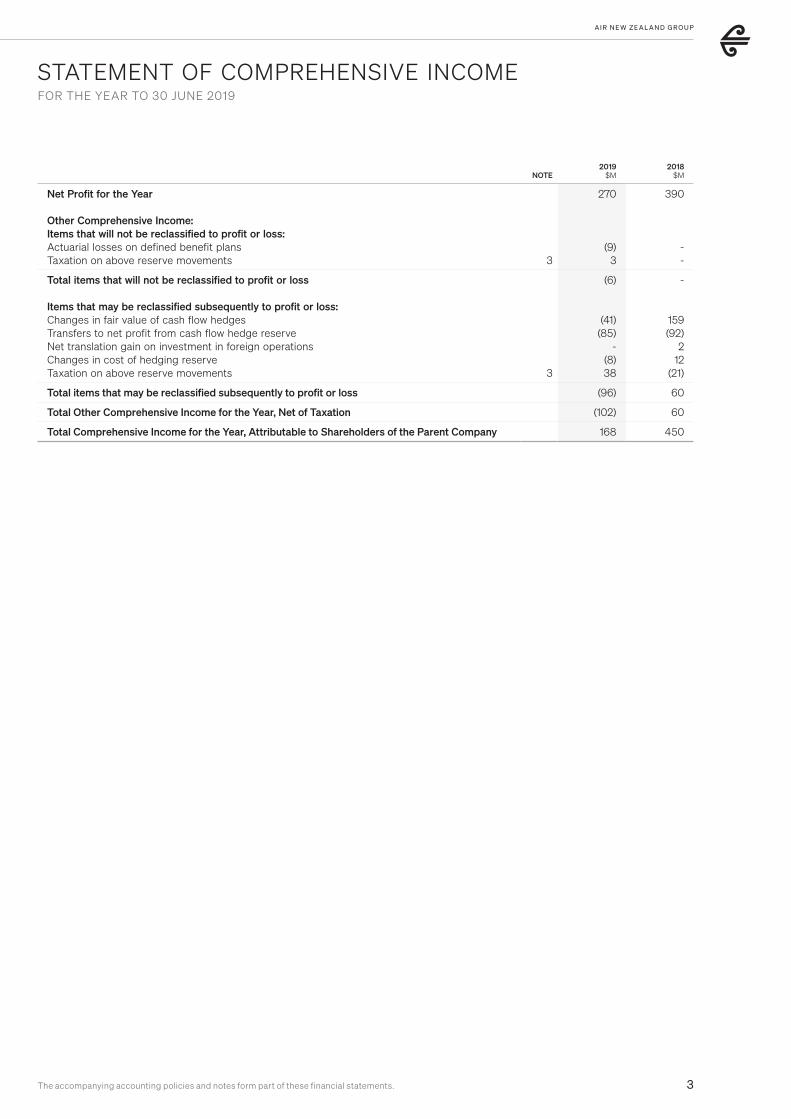
Net Profit for the Year
Other Comprehensive Income:Items that will not be reclassified to profit or loss:Actuarial losses on defined benefit plansTaxation on above reserve movements 3
270
(9) 3
390
- -
Total items that will not be reclassified to profit or loss
Items that may be reclassified subsequently to profit or loss: Changes in fair value of cash flow hedges Transfers to net profit from cash flow hedge reserve Net translation gain on investment in foreign operations Changes in cost of hedging reserve Taxation on above reserve movements 3
(6)
(41) (85)
- (8)
38
-
159 (92)
2 12
(21)
Total items that may be reclassified subsequently to profit or loss (96) 60
Total Other Comprehensive Income for the Year, Net of Taxation (102) 60
Total Comprehensive Income for the Year, Attributable to Shareholders of the Parent Company 168 450
The accompanying accounting policies and notes form part of these financial statements.4
A I R N E W ZE A L A N D A N N UA L F I N A N C I A L R E S U LT S 2 0 1 9
STATEMENT OF CHANGES IN EQUITYFOR THE YEAR TO 30 JUNE 2019
NOTES
SHARE CAPITAL
$M
HEDGE RESERVES
$M
FOREIGN CURRENCY
TRANSLATION RESERVE
$M
GENERAL RESERVES
$M
TOTAL EQUITY
$M
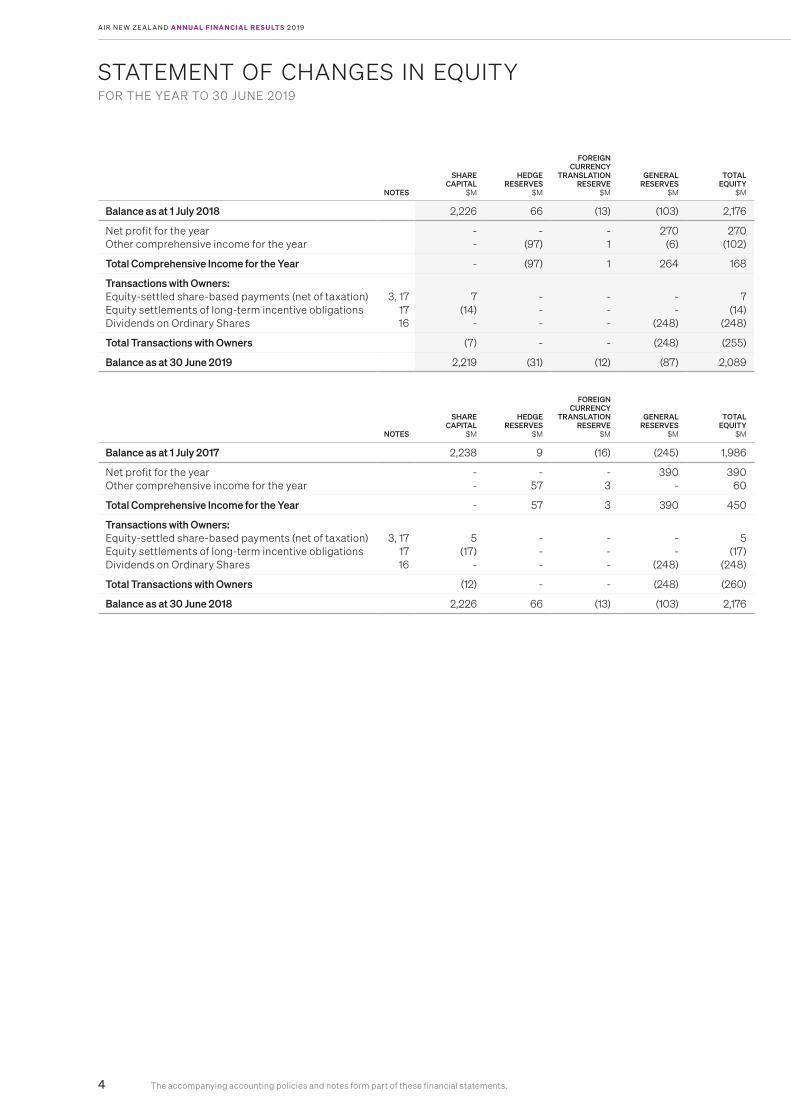
Balance as at 1 July 2018 2,226 66 (13) (103) 2,176
Net profit for the yearOther comprehensive income for the year
--
-(97)
-1
270 (6)
270 (102)
Total Comprehensive Income for the Year - (97) 1 264 168
Transactions with Owners:Equity-settled share-based payments (net of taxation)Equity settlements of long-term incentive obligationsDividends on Ordinary Shares
3, 171716
7 (14)
-
- - -
- - -
- -
(248)
7 (14)
(248)
Total Transactions with Owners (7) - - (248) (255)
Balance as at 30 June 2019 2,219 (31) (12) (87) 2,089
NOTES
SHARE CAPITAL
$M
HEDGE RESERVES
$M
FOREIGN CURRENCY
TRANSLATION RESERVE
$M
GENERAL RESERVES
$M
TOTAL EQUITY
$M
Balance as at 1 July 2017 2,238 9 (16) (245) 1,986
Net profit for the yearOther comprehensive income for the year
--
-57
-3
390 -
390 60
Total Comprehensive Income for the Year - 57 3 390 450
Transactions with Owners:Equity-settled share-based payments (net of taxation)Equity settlements of long-term incentive obligationsDividends on Ordinary Shares
3, 171716
5 (17)
-
- - -
- - -
- -
(248)
5 (17)
(248)
Total Transactions with Owners (12) - - (248) (260)
Balance as at 30 June 2018 2,226 66 (13) (103) 2,176

The accompanying accounting policies and notes form part of these financial statements. 5
A I R N E W ZE A L A N D G R O U P
NOTES
2019
$M
2018
$M
Current Assets Bank and short-term depositsTrade and other receivablesInventoriesDerivative financial assetsIncome taxationOther assets
567
22
8
1,055 564
81 48
- 56
1,343
576 75
187 4
68
Total Current Assets 1,804 2,253
Non-Current Assets Trade and other receivablesProperty, plant and equipmentIntangible assetsInvestments in other entitiesDerivative financial assets Other assets
69
1011
228
64 5,268
186 149
- 285
77 5,035
170 118
2 191
Total Non-Current Assets 5,952 5,593
Total Assets 7,756 7,846
Current LiabilitiesTrade and other payablesRevenue in advanceInterest-bearing liabilitiesDerivative financial liabilitiesProvisionsIncome taxationOther liabilities
12132214
15
585 1,372
307 32
105 25
240
562 1,322
431 1
117 -
263
Total Current Liabilities 2,666 2,696
Non-Current Liabilities Revenue in advanceInterest-bearing liabilitiesProvisionsOther liabilitiesDeferred taxation
121314153
200 2,290
165 42
304
185 2,303
151 27
308
Total Non-Current Liabilities 3,001 2,974
Total Liabilities 5,667 5,670
Net Assets 2,089 2,176
Equity Share capitalReserves
1718
2,219(130)
2,226(50)
Total Equity 2,089 2,176
Tony Carter Jan Dawson Chairman Deputy Chairman
For and on behalf of the Board, 22 August 2019
STATEMENT OF FINANCIAL POSITIONAS AT 30 JUNE 2019
The accompanying accounting policies and notes form part of these financial statements.6
A I R N E W ZE A L A N D A N N UA L F I N A N C I A L R E S U LT S 2 0 1 9
NOTES
2019
$M
2018
$M
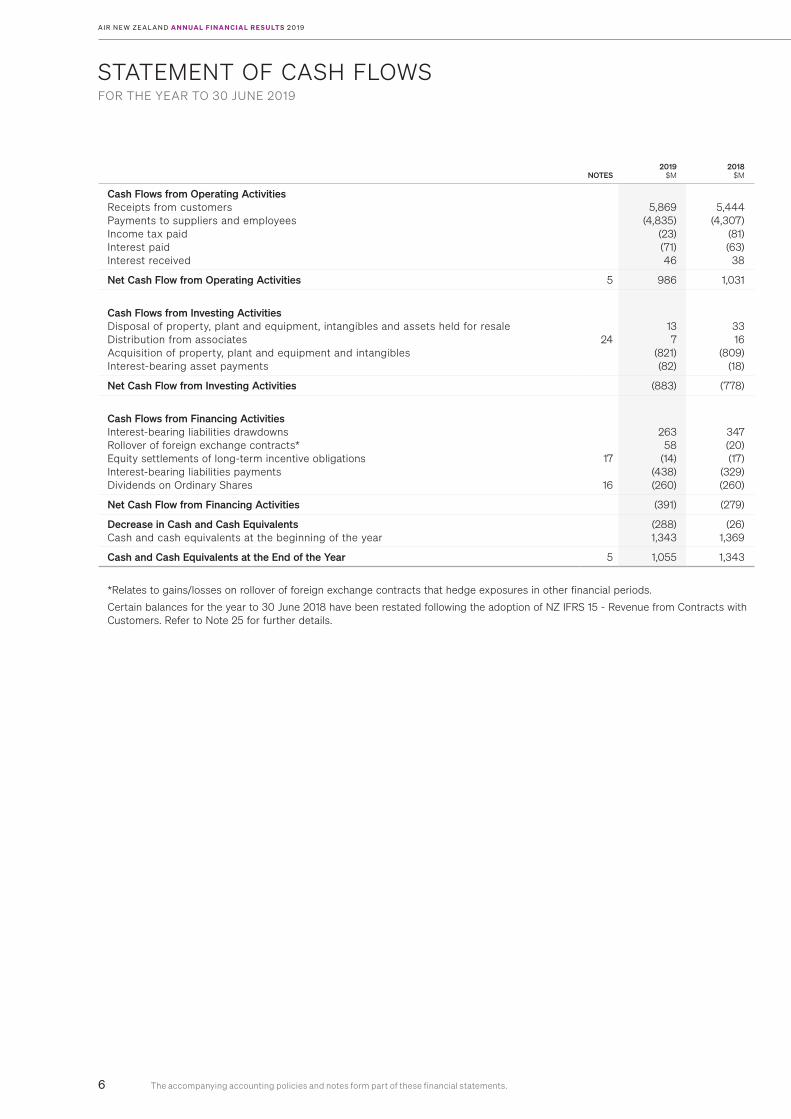
Cash Flows from Operating ActivitiesReceipts from customersPayments to suppliers and employeesIncome tax paidInterest paidInterest received
5,869 (4,835)
(23) (71) 46
5,444 (4,307)
(81) (63) 38
Net Cash Flow from Operating Activities 5 986 1,031
Cash Flows from Investing ActivitiesDisposal of property, plant and equipment, intangibles and assets held for resaleDistribution from associates Acquisition of property, plant and equipment and intangibles Interest-bearing asset payments
24 13
7 (821) (82)
33 16
(809) (18)
Net Cash Flow from Investing Activities (883) (778)
Cash Flows from Financing Activities Interest-bearing liabilities drawdownsRollover of foreign exchange contracts*Equity settlements of long-term incentive obligationsInterest-bearing liabilities paymentsDividends on Ordinary Shares
17
16
263 58 (14)
(438) (260)
347 (20) (17)
(329) (260)
Net Cash Flow from Financing Activities (391) (279)
Decrease in Cash and Cash EquivalentsCash and cash equivalents at the beginning of the year
(288)1,343
(26)1,369
Cash and Cash Equivalents at the End of the Year 5 1,055 1,343
*Relates to gains/losses on rollover of foreign exchange contracts that hedge exposures in other financial periods.
Certain balances for the year to 30 June 2018 have been restated following the adoption of NZ IFRS 15 - Revenue from Contracts with Customers. Refer to Note 25 for further details.
STATEMENT OF CASH FLOWSFOR THE YEAR TO 30 JUNE 2019

7
STATEMENT OF ACCOUNTING POLICIESFOR THE YEAR TO 30 JUNE 2019
A I R N E W ZE A L A N D G R O U P
Reporting entityThe financial statements presented are those of the consolidated Air New Zealand Group (the Group), including Air New Zealand Limited and its subsidiaries, joint ventures and associates.
Air New Zealand’s primary business is the transportation of passengers and cargo on scheduled airline services.
Statutory baseThe parent company, Air New Zealand Limited, is a profit-oriented entity, domiciled in New Zealand, registered under the Companies Act 1993 and listed on the New Zealand and Australian Stock Exchanges. Air New Zealand Limited is a FMC Reporting Entity under the Financial Markets Conduct Act 2013 and the Financial Reporting Act 2013.
Basis of preparationAir New Zealand prepares its financial statements in accordance with New Zealand Generally Accepted Accounting Practice (“NZ GAAP”). NZ GAAP consists of New Zealand equivalents to International Financial Reporting Standards (“NZ IFRS”) and other applicable financial reporting standards as appropriate to profit-oriented entities. These financial statements comply with NZ IFRS and International Financial Reporting Standards (“IFRS”).
The financial statements were approved by the Board of Directors on 22 August 2019.
Basis of measurementThe financial statements have been prepared on the historical cost basis with the exception of certain items as identified in specific accounting policies and are presented in New Zealand Dollars which is the Group’s functional currency.
Use of accounting estimates and judgementsThe preparation of financial statements requires the use of certain critical accounting estimates. It also requires the directors to exercise their judgement in the process of applying the Group’s accounting policies. Estimates and associated assumptions are based on historical experience and other factors, as appropriate to the particular circumstances. The Group reviews the estimates and assumptions on an ongoing basis.
Areas involving a higher degree of judgement or complexity, or areas where assumptions and estimates are significant to the financial statements are disclosed within the specific accounting policy or note as shown below:
Area of estimate or judgement Note Revenue in advance Note 1 Revenue recognition and segmental information
Aircraft lease return provisions Note 14 Provisions
Estimated impairment of non-financial assets ‘Impairment’ accounting policy
Note 9 Property, plant and equipment
Residual values and useful lives of aircraft related assets Note 9 Property, plant and equipment
Taxation Note 3 Taxation
Significant estimates are designated by an symbol in the notes to the financial statements.
Significant accounting policiesAccounting policies are disclosed within each of the applicable notes to the financial statements and are designated by a symbol.
The principal accounting policies applied in the preparation of these financial statements have been consistently applied to all periods presented, except as detailed below.
The Group has adopted NZ IFRS 15 - Revenue from Contracts with Customers with a date of initial application of 1 July 2018. Comparative information has been restated to reflect the new standard, and reclassified to achieve consistency in disclosure with the current period. The nature and effect of these changes are explained in detail in Note 25. In addition the Group adopted the requirements of NZ IFRS 9 (2014) - Financial Instruments with effect from 1 July 2018. The Group had previously adopted NZ IFRS 9 (2013) - Hedge Accounting with effect from 1 July 2014. The standard had no impact on the financial statements.
The following NZ IFRSs and Interpretations, which have been issued but are not yet effective, have been identified as those that may impact Air New Zealand in the period of their initial application, and have not yet been adopted by the Group.
NZ IFRS 16 - Leases has not been adopted early. This standard will fundamentally change the accounting treatment of leases by lessees. The current dual accounting model for lessees, which distinguishes between on balance sheet finance leases and off balance sheet operating leases, will no longer apply. Instead, there will be a single, on balance sheet accounting model for all leases which is similar to current finance lease accounting. Lessor accounting remains similar to current practice. This standard became effective on 1 July 2019 and will have a significant impact on the financial statements. Further details of the impact of the standard, including transitional adjustments arising on adoption, are included in Note 25.

8
STATEMENT OF ACCOUNTING POLICIES (CONTINUED)FOR THE YEAR TO 30 JUNE 2019
A I R N E W ZE A L A N D A N N UA L F I N A N C I A L R E S U LT S 2 0 1 9
NZ IFRS 17 - Insurance Contracts has not been adopted early. It provides consistent principles for all aspects of accounting for insurance contracts. This standard, which becomes effective for annual periods commencing on or after 1 January 2021, will not have a significant impact on the financial statements.
NZ IFRIC 23 - Uncertainty over Income Tax Treatments has not been adopted early. It clarifies how to apply the recognition and measurement requirements in NZ IAS 12 - Taxation when there is uncertainty over income tax treatments. This Interpretation, which becomes effective for annual periods commencing on or after 1 January 2019, is not expected to have a significant impact on the financial statements.
Where necessary, comparative information has been reclassified to achieve consistency in disclosure with the current period. An amount of $(6) million has been reclassified within the Statement of Financial Performance from ‘Other revenue’ to ‘Cargo’ for the year ended 30 June 2018 to better align with the nature of the underlying transactions.
The significant accounting policies which are pervasive throughout the financial statements are set out below. Other significant accounting policies which are specific to certain transactions or balances are set out within the particular note to which they relate.
Basis of consolidationThe consolidated financial statements include those of Air New Zealand Limited and its subsidiaries, accounted for using the acquisition method, and the results of its associates and joint ventures, accounted for using the equity method.
All material intercompany transactions, balances and unrealised gains on transactions between group companies are eliminated on consolidation. Unrealised losses are also eliminated unless the transaction provides evidence of an impairment of the asset transferred. Unrealised gains on transactions between the Group, joint ventures and its associates are eliminated to the extent of the Group’s interest in the joint ventures and associates.
Where a business combination is achieved in stages, previously held equity interests in the acquiree are remeasured to fair value at the acquisition date and any corresponding gain or loss is recognised in the Statement of Financial Performance.
Foreign currency translationFunctional currencyItems included in the financial statements of each of the Group’s entities are measured using the currency of the primary economic environment in which the entity operates (the “functional currency”).
Transactions and balancesForeign currency transactions are converted into the relevant functional currency using exchange rates approximating those at transaction date. Monetary assets and liabilities denominated in foreign currencies at balance date are translated at the exchange rate at that date. Non-monetary assets and liabilities that are measured in terms of historical cost in a foreign currency are translated using the exchange rate at the date of the transaction. Foreign exchange gains or losses are recognised in the Statement of Financial Performance, except when deferred in equity as qualifying cash flow hedges and qualifying net investment hedges.
Group companies
The results and financial position of all group entities that have a functional currency different from the presentation currency are translated into the presentation currency as follows:
(a) assets and liabilities are translated at the closing rate at the reporting date;
(b) income and expenses are translated at exchange rates approximating those at transaction date; and
(c) all resulting exchange differences are recognised as a separate component of equity and in Other Comprehensive Income (within Foreign Currency Translation Reserve).
On consolidation, exchange differences arising from the translation of the net investment in foreign entities, and of borrowings and other currency instruments designated as hedges of such investments, are taken to equity.
ImpairmentNon-financial assets are reviewed at each reporting date to determine whether there are any indicators that the carrying amount may not be recoverable. If any such indicators exist, the asset’s recoverable amount is estimated. The recoverable amount is the higher of an asset’s fair value less costs to sell and value in use. In assessing value in use, the estimated future cash flows are discounted to their present value using a discount rate that reflects current market assessments of the time value of money and the risks specific to the asset. An impairment loss is recognised in the Statement of Financial Performance for the amount by which the asset’s carrying amount exceeds its recoverable amount. For the purposes of assessing impairment, assets are grouped at the lowest level for which there are separately identifiable cash flows (cash-generating units).
Financial assets carried at amortised cost are assessed each reporting date for impairment. If there is objective evidence of impairment, the difference between the asset’s carrying amount and the present value of estimated future cash flows, discounted at the financial asset’s original effective interest rate, where appropriate, is recognised in the Statement of Financial Performance.
9
NOTES TO THE FINANCIAL STATEMENTSFOR THE YEAR TO 30 JUNE 2019
A I R N E W ZE A L A N D G R O U P
1. Revenue Recognition and Segmental Information
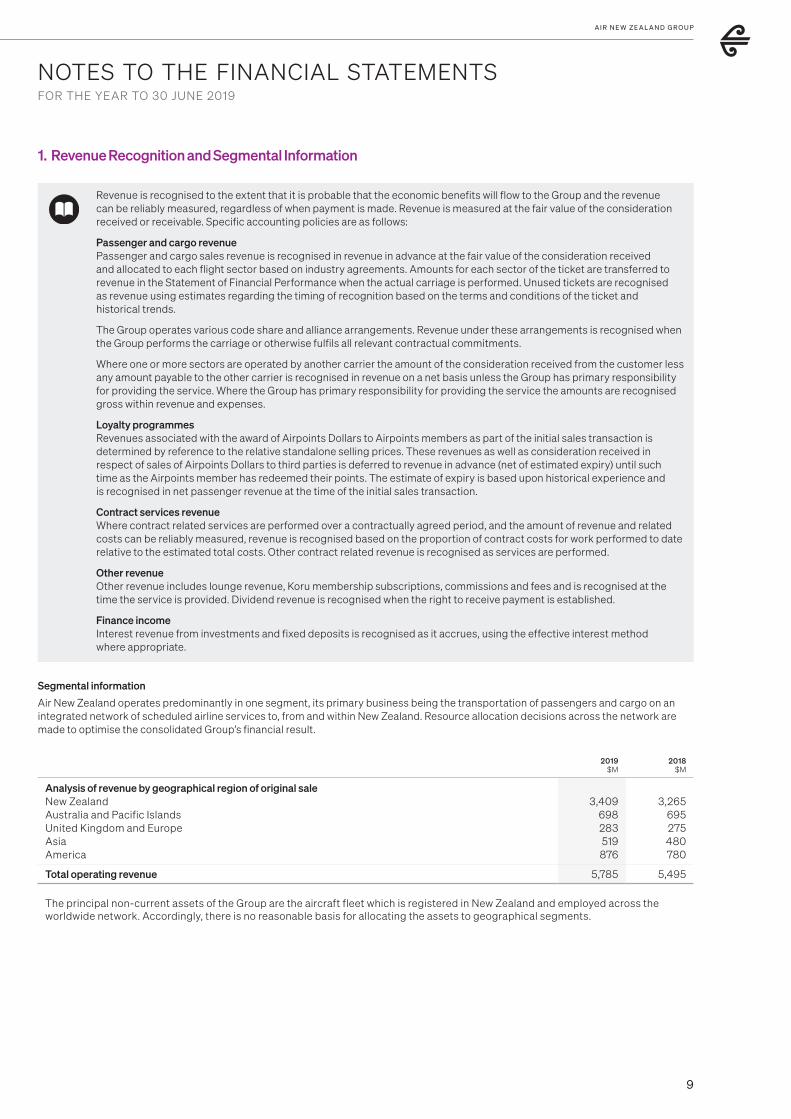
Revenue is recognised to the extent that it is probable that the economic benefits will flow to the Group and the revenue can be reliably measured, regardless of when payment is made. Revenue is measured at the fair value of the consideration received or receivable. Specific accounting policies are as follows:
Passenger and cargo revenuePassenger and cargo sales revenue is recognised in revenue in advance at the fair value of the consideration received and allocated to each flight sector based on industry agreements. Amounts for each sector of the ticket are transferred to revenue in the Statement of Financial Performance when the actual carriage is performed. Unused tickets are recognised as revenue using estimates regarding the timing of recognition based on the terms and conditions of the ticket and historical trends.
The Group operates various code share and alliance arrangements. Revenue under these arrangements is recognised when the Group performs the carriage or otherwise fulfils all relevant contractual commitments.
Where one or more sectors are operated by another carrier the amount of the consideration received from the customer less any amount payable to the other carrier is recognised in revenue on a net basis unless the Group has primary responsibility for providing the service. Where the Group has primary responsibility for providing the service the amounts are recognised gross within revenue and expenses.
Loyalty programmesRevenues associated with the award of Airpoints Dollars to Airpoints members as part of the initial sales transaction is determined by reference to the relative standalone selling prices. These revenues as well as consideration received in respect of sales of Airpoints Dollars to third parties is deferred to revenue in advance (net of estimated expiry) until such time as the Airpoints member has redeemed their points. The estimate of expiry is based upon historical experience and is recognised in net passenger revenue at the time of the initial sales transaction.
Contract services revenueWhere contract related services are performed over a contractually agreed period, and the amount of revenue and related costs can be reliably measured, revenue is recognised based on the proportion of contract costs for work performed to date relative to the estimated total costs. Other contract related revenue is recognised as services are performed.
Other revenueOther revenue includes lounge revenue, Koru membership subscriptions, commissions and fees and is recognised at the time the service is provided. Dividend revenue is recognised when the right to receive payment is established.
Finance incomeInterest revenue from investments and fixed deposits is recognised as it accrues, using the effective interest method where appropriate.
Segmental information
Air New Zealand operates predominantly in one segment, its primary business being the transportation of passengers and cargo on an integrated network of scheduled airline services to, from and within New Zealand. Resource allocation decisions across the network are made to optimise the consolidated Group’s financial result.
2019$M
2018$M
Analysis of revenue by geographical region of original saleNew ZealandAustralia and Pacific IslandsUnited Kingdom and EuropeAsiaAmerica
3,409 698 283 519 876
3,265 695 275 480 780
Total operating revenue 5,785 5,495
The principal non-current assets of the Group are the aircraft fleet which is registered in New Zealand and employed across the worldwide network. Accordingly, there is no reasonable basis for allocating the assets to geographical segments.
10
NOTES TO THE FINANCIAL STATEMENTS (CONTINUED)FOR THE YEAR TO 30 JUNE 2019
A I R N E W ZE A L A N D A N N UA L F I N A N C I A L R E S U LT S 2 0 1 9
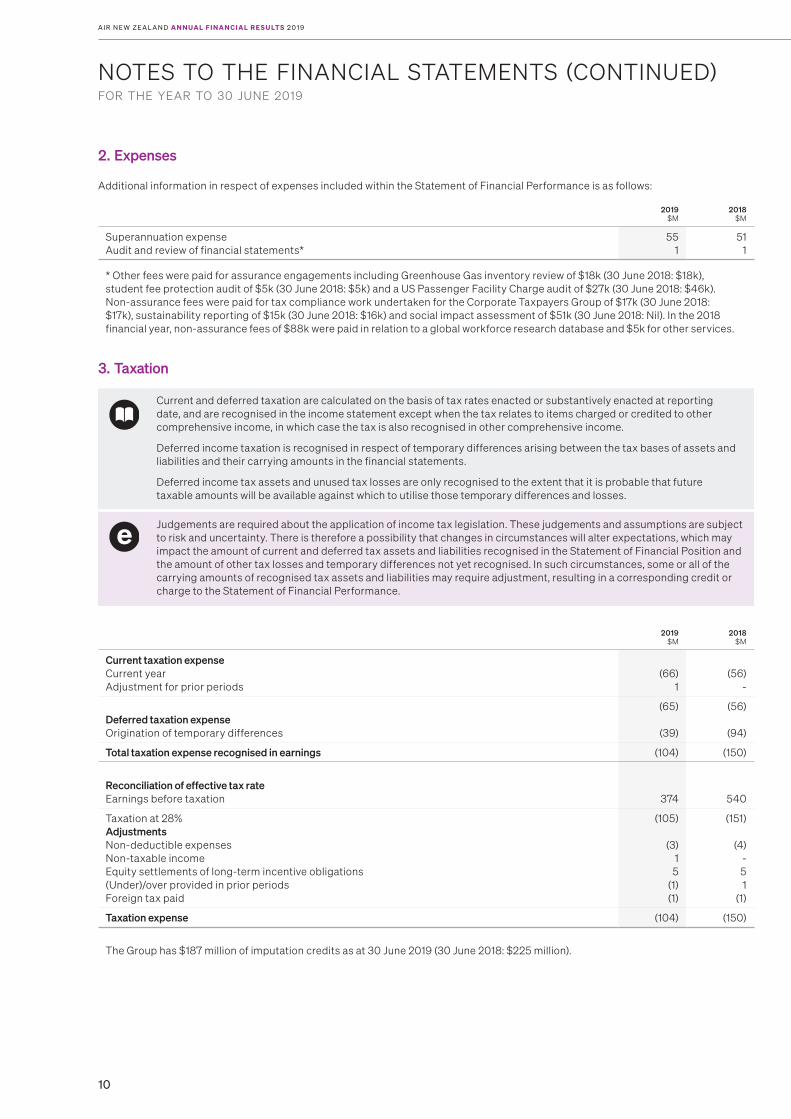
2. Expenses
Additional information in respect of expenses included within the Statement of Financial Performance is as follows:
2019$M
2018$M
Superannuation expense Audit and review of financial statements*
55 1
51 1
* Other fees were paid for assurance engagements including Greenhouse Gas inventory review of $18k (30 June 2018: $18k), student fee protection audit of $5k (30 June 2018: $5k) and a US Passenger Facility Charge audit of $27k (30 June 2018: $46k). Non-assurance fees were paid for tax compliance work undertaken for the Corporate Taxpayers Group of $17k (30 June 2018: $17k), sustainability reporting of $15k (30 June 2018: $16k) and social impact assessment of $51k (30 June 2018: Nil). In the 2018 financial year, non-assurance fees of $88k were paid in relation to a global workforce research database and $5k for other services.
3. Taxation
Current and deferred taxation are calculated on the basis of tax rates enacted or substantively enacted at reporting date, and are recognised in the income statement except when the tax relates to items charged or credited to other comprehensive income, in which case the tax is also recognised in other comprehensive income.
Deferred income taxation is recognised in respect of temporary differences arising between the tax bases of assets and liabilities and their carrying amounts in the financial statements.
Deferred income tax assets and unused tax losses are only recognised to the extent that it is probable that future taxable amounts will be available against which to utilise those temporary differences and losses.
Judgements are required about the application of income tax legislation. These judgements and assumptions are subject to risk and uncertainty. There is therefore a possibility that changes in circumstances will alter expectations, which may impact the amount of current and deferred tax assets and liabilities recognised in the Statement of Financial Position and the amount of other tax losses and temporary differences not yet recognised. In such circumstances, some or all of the carrying amounts of recognised tax assets and liabilities may require adjustment, resulting in a corresponding credit or charge to the Statement of Financial Performance.
2019$M
2018$M
Current taxation expense Current yearAdjustment for prior periods
(66) 1
(56) -
Deferred taxation expense Origination of temporary differences
(65)
(39)
(56)
(94)
Total taxation expense recognised in earnings (104) (150)
Reconciliation of effective tax rate Earnings before taxation 374 540
Taxation at 28% Adjustments Non-deductible expensesNon-taxable incomeEquity settlements of long-term incentive obligations (Under)/over provided in prior periodsForeign tax paid
(105)
(3) 1 5(1) (1)
(151)
(4) -5 1
(1)
Taxation expense (104) (150)
The Group has $187 million of imputation credits as at 30 June 2019 (30 June 2018: $225 million).
11
NOTES TO THE FINANCIAL STATEMENTS (CONTINUED)FOR THE YEAR TO AND AS AT 30 JUNE 2019
A I R N E W ZE A L A N D G R O U P
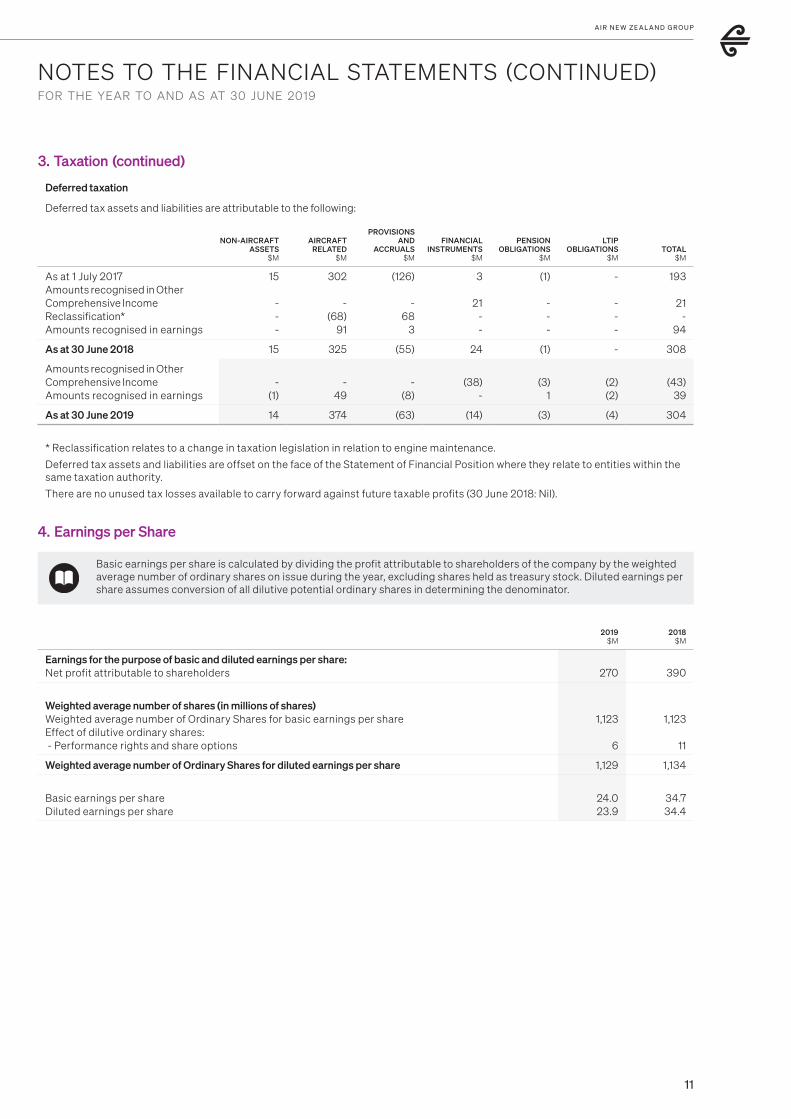
3. Taxation (continued)
Deferred taxation
Deferred tax assets and liabilities are attributable to the following:
NON-AIRCRAFTASSETS
$M
AIRCRAFTRELATED
$M
PROVISIONSAND
ACCRUALS$M
FINANCIAL INSTRUMENTS
$M
PENSIONOBLIGATIONS
$M
LTIPOBLIGATIONS
$MTOTAL
$M
As at 1 July 2017 Amounts recognised in Other Comprehensive IncomeReclassification*Amounts recognised in earnings
15 - --
302 -
(68)91
(126) -
683
3
21 - -
(1)
-- -
-
---
193
21 -
94
As at 30 June 2018 15 325 (55) 24 (1) - 308
Amounts recognised in Other Comprehensive IncomeAmounts recognised in earnings
-(1)
-
49
-
(8) (38)
-
(3)
1(2)(2)
(43)39
As at 30 June 2019 14 374 (63) (14) (3) (4) 304
* Reclassification relates to a change in taxation legislation in relation to engine maintenance.
Deferred tax assets and liabilities are offset on the face of the Statement of Financial Position where they relate to entities within the same taxation authority.
There are no unused tax losses available to carry forward against future taxable profits (30 June 2018: Nil).
4. Earnings per Share
Basic earnings per share is calculated by dividing the profit attributable to shareholders of the company by the weighted average number of ordinary shares on issue during the year, excluding shares held as treasury stock. Diluted earnings per share assumes conversion of all dilutive potential ordinary shares in determining the denominator.
2019$M
2018$M
Earnings for the purpose of basic and diluted earnings per share:Net profit attributable to shareholders 270 390
Weighted average number of shares (in millions of shares) Weighted average number of Ordinary Shares for basic earnings per share Effect of dilutive ordinary shares: - Performance rights and share options
1,123
6
1,123
11
Weighted average number of Ordinary Shares for diluted earnings per share 1,129 1,134
Basic earnings per share Diluted earnings per share
24.0 23.9
34.7 34.4
12
NOTES TO THE FINANCIAL STATEMENTS (CONTINUED)FOR THE YEAR TO AND AS AT 30 JUNE 2019
A I R N E W ZE A L A N D A N N UA L F I N A N C I A L R E S U LT S 2 0 1 9
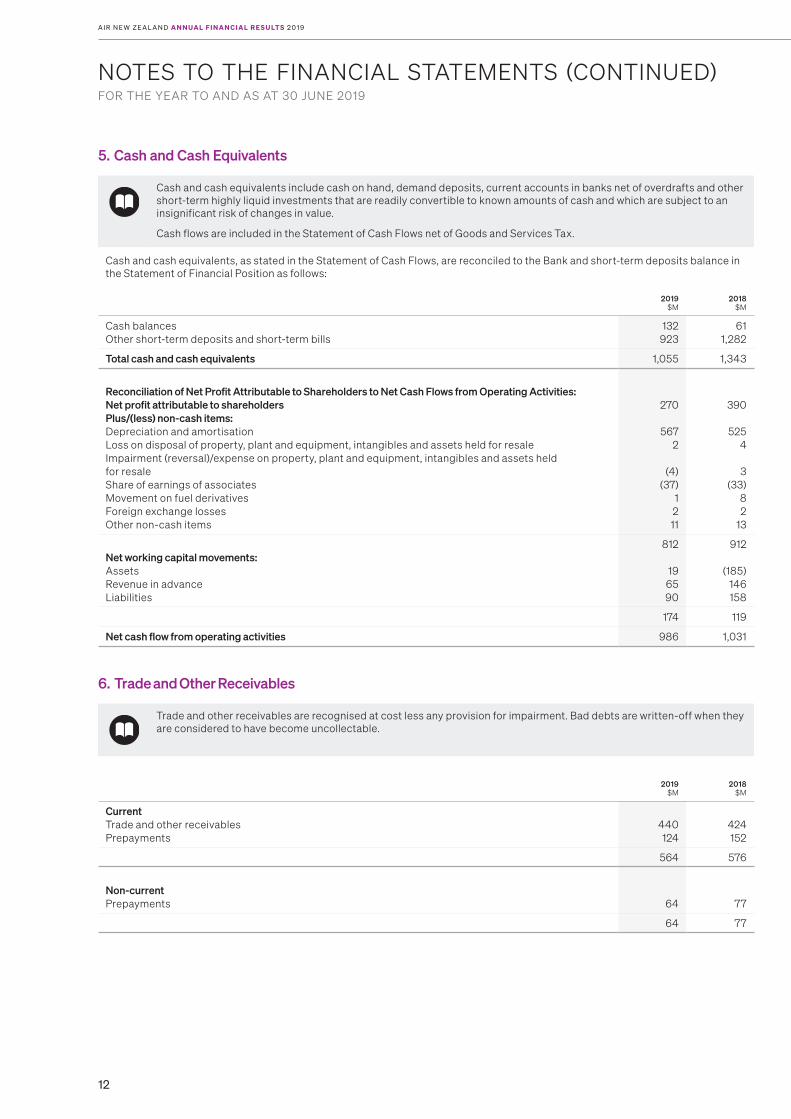
5. Cash and Cash Equivalents
Cash and cash equivalents include cash on hand, demand deposits, current accounts in banks net of overdrafts and other short-term highly liquid investments that are readily convertible to known amounts of cash and which are subject to an insignificant risk of changes in value.
Cash flows are included in the Statement of Cash Flows net of Goods and Services Tax.
Cash and cash equivalents, as stated in the Statement of Cash Flows, are reconciled to the Bank and short-term deposits balance in the Statement of Financial Position as follows:
2019$M
2018$M
Cash balances Other short-term deposits and short-term bills
132 923
61 1,282
Total cash and cash equivalents 1,055 1,343
Reconciliation of Net Profit Attributable to Shareholders to Net Cash Flows from Operating Activities: Net profit attributable to shareholders Plus/(less) non-cash items: Depreciation and amortisation Loss on disposal of property, plant and equipment, intangibles and assets held for resale Impairment (reversal)/expense on property, plant and equipment, intangibles and assets held for resale Share of earnings of associates Movement on fuel derivativesForeign exchange losses Other non-cash items
270
567 2
(4) (37)
1 2 11
390
525 4 3
(33) 8 2
13
Net working capital movements: Assets Revenue in advance Liabilities
812
19 65 90
912
(185) 146 158
174 119
Net cash flow from operating activities 986 1,031
6. Trade and Other Receivables
Trade and other receivables are recognised at cost less any provision for impairment. Bad debts are written-off when they are considered to have become uncollectable.
2019$M
2018$M
CurrentTrade and other receivables Prepayments
440 124
424 152
564 576
Non-current Prepayments 64 77
64 77

13
NOTES TO THE FINANCIAL STATEMENTS (CONTINUED)AS AT 30 JUNE 2019
A I R N E W ZE A L A N D G R O U P
7. Inventories
Inventories are measured at the lower of cost and net realisable value. Cost is determined using the first-in, first-out (FIFO) cost method. Net realisable value is the estimated selling price in the ordinary course of business, less applicable variable selling expenses.
2019$M
2018$M
Engineering expendables Consumable stores
65 16
59 16
81 75
Held at cost Held initially at cost Less provision for inventory obsolescence
68
68 (55)
63
68 (56)
Held at net realisable value 13 12
81 75
8. Other Assets
Amounts owing from related partiesAmounts owing from related parties are recognised at cost less any provision for impairment.
Contract work in progressContract work in progress is stated at cost plus the profit recognised to date, using the cost input method, less any amounts invoiced to customers. Cost includes all expenses directly related to specific contracts and an allocation of direct production overhead expenses incurred. Amounts are invoiced as work progresses in accordance with contractual terms, either at periodic intervals or upon achievement of contractual milestones.
Interest-bearing assets
Interest-bearing assets are measured at amortised cost using the effective interest method, less any impairment.
Assets held for resaleNon-current assets are classified as held for resale if their carrying amount will be recovered through a sale transaction rather than through continuing use. The sale must be highly probable and the asset available for immediate sale in its present condition. Non-current assets held for resale are measured at the lower of the asset’s previous carrying amount and its fair value less costs to sell.
2019$M
2018$M
Current Amounts owing from associates Contract work in progress Interest-bearing assets Assets held for resale Other assets
1
35 - 1
19
1
45 7 1
14
56 68
Non-current Interest-bearing assets Assets held for resale Other assets
264 1
20
175 1
15
285 191
The carrying value of the assets held for resale reflects the lower of their previous carrying value at the date of transfer or external market assessments of the fair value, less costs to sell. Spares related to exited fleets are being marketed for sale and it is expected that proceeds will be received over the next two years.
Interest-bearing assets include fixed rate Term Deposits and floating rate Certificate of Deposits that have been provided as security over credit card obligations incurred by Air New Zealand. A minimum notification period of twelve months is required to be given prior to the security deposits being released. These deposits are subject to potential offsetting under master netting arrangements. In addition, the Group holds a Euro fixed rate deposit that matures in September 2030 held as part of an aircraft financing arrangement. Fixed interest rates in the year to 30 June 2019 were between 2.72 percent and 3.10 percent (30 June 2018: 2.38 percent to 2.91 percent). The fair value of interest-bearing assets as at 30 June 2019 was $287 million (30 June 2018: $182 million).
14
NOTES TO THE FINANCIAL STATEMENTS (CONTINUED)AS AT 30 JUNE 2019
A I R N E W ZE A L A N D A N N UA L F I N A N C I A L R E S U LT S 2 0 1 9
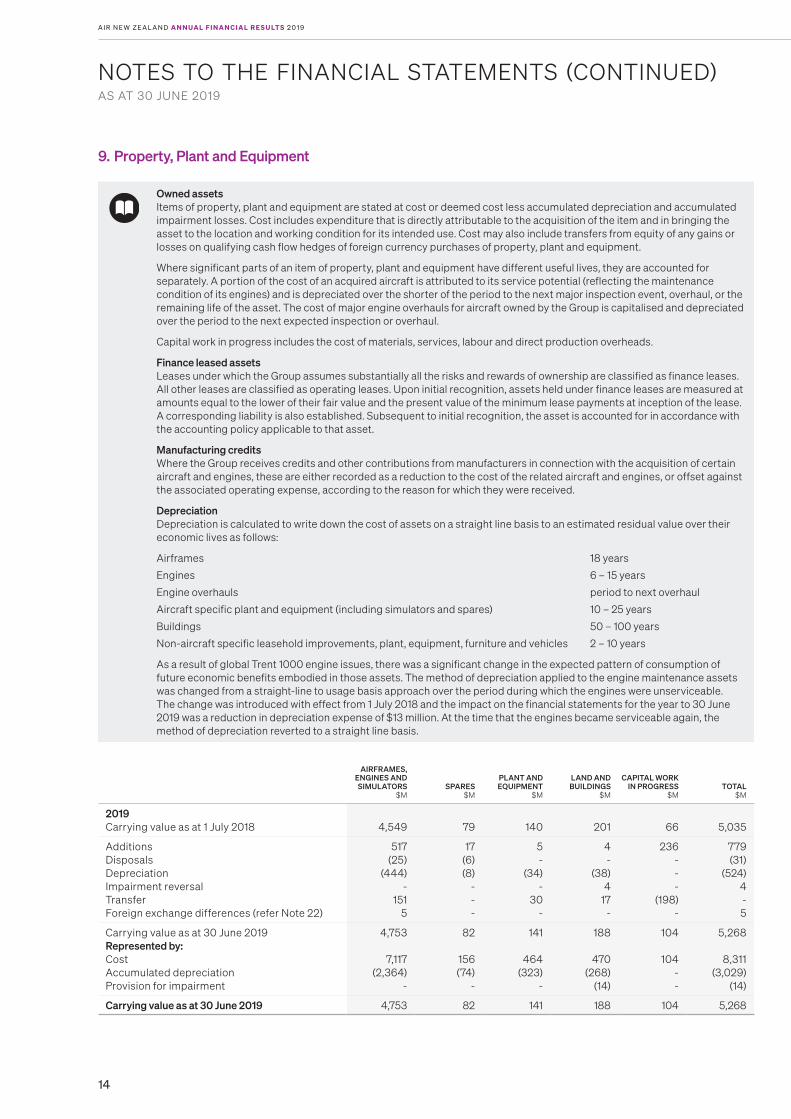
9. Property, Plant and Equipment
Owned assetsItems of property, plant and equipment are stated at cost or deemed cost less accumulated depreciation and accumulated impairment losses. Cost includes expenditure that is directly attributable to the acquisition of the item and in bringing the asset to the location and working condition for its intended use. Cost may also include transfers from equity of any gains or losses on qualifying cash flow hedges of foreign currency purchases of property, plant and equipment.
Where significant parts of an item of property, plant and equipment have different useful lives, they are accounted for separately. A portion of the cost of an acquired aircraft is attributed to its service potential (reflecting the maintenance condition of its engines) and is depreciated over the shorter of the period to the next major inspection event, overhaul, or the remaining life of the asset. The cost of major engine overhauls for aircraft owned by the Group is capitalised and depreciated over the period to the next expected inspection or overhaul.
Capital work in progress includes the cost of materials, services, labour and direct production overheads.
Finance leased assetsLeases under which the Group assumes substantially all the risks and rewards of ownership are classified as finance leases. All other leases are classified as operating leases. Upon initial recognition, assets held under finance leases are measured at amounts equal to the lower of their fair value and the present value of the minimum lease payments at inception of the lease. A corresponding liability is also established. Subsequent to initial recognition, the asset is accounted for in accordance with the accounting policy applicable to that asset.
Manufacturing creditsWhere the Group receives credits and other contributions from manufacturers in connection with the acquisition of certain aircraft and engines, these are either recorded as a reduction to the cost of the related aircraft and engines, or offset against the associated operating expense, according to the reason for which they were received.
Depreciation Depreciation is calculated to write down the cost of assets on a straight line basis to an estimated residual value over their economic lives as follows:
Airframes 18 years
Engines 6 – 15 years
Engine overhauls period to next overhaul
Aircraft specific plant and equipment (including simulators and spares) 10 – 25 years
Buildings 50 – 100 years
Non-aircraft specific leasehold improvements, plant, equipment, furniture and vehicles 2 – 10 years
As a result of global Trent 1000 engine issues, there was a significant change in the expected pattern of consumption of future economic benefits embodied in those assets. The method of depreciation applied to the engine maintenance assets was changed from a straight-line to usage basis approach over the period during which the engines were unserviceable. The change was introduced with effect from 1 July 2018 and the impact on the financial statements for the year to 30 June 2019 was a reduction in depreciation expense of $13 million. At the time that the engines became serviceable again, the method of depreciation reverted to a straight line basis.
AIRFRAMES, ENGINES AND SIMULATORS
$MSPARES
$M
PLANT AND EQUIPMENT
$M
LAND AND BUILDINGS
$M
CAPITAL WORK IN PROGRESS
$MTOTAL
$M
2019 Carrying value as at 1 July 2018 4,549
79 140 201 66 5,035
Additions Disposals Depreciation Impairment reversal TransferForeign exchange differences (refer Note 22)
517 (25)
(444) -
151 5
17 (6) (8)
- - -
5 -
(34) -
30 -
4 -
(38) 4
17 -
236 - - -
(198) -
779 (31)
(524) 4 - 5
Carrying value as at 30 June 2019 Represented by: Cost Accumulated depreciation Provision for impairment
4,753
7,117 (2,364)
-
82
156 (74)
-
141
464 (323)
-
188
470 (268)
(14)
104
104 - -
5,268
8,311 (3,029)
(14)
Carrying value as at 30 June 2019 4,753 82 141 188 104 5,268
15
NOTES TO THE FINANCIAL STATEMENTS (CONTINUED)AS AT 30 JUNE 2019
A I R N E W ZE A L A N D G R O U P
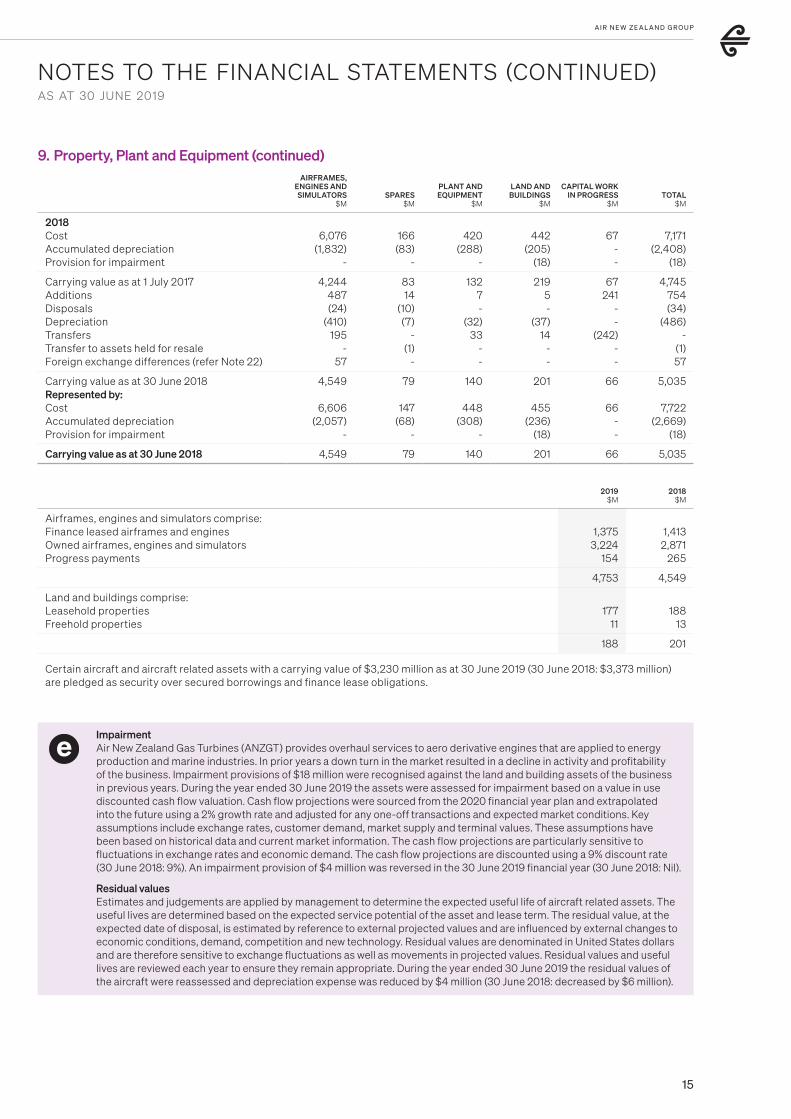
9. Property, Plant and Equipment (continued)AIRFRAMES,
ENGINES AND SIMULATORS
$MSPARES
$M
PLANT AND EQUIPMENT
$M
LAND AND BUILDINGS
$M
CAPITAL WORK IN PROGRESS
$MTOTAL
$M
2018 Cost Accumulated depreciation Provision for impairment
6,076 (1,832)
-
166 (83)
-
420 (288)
-
442
(205) (18)
67 - -
7,171 (2,408)
(18)
Carrying value as at 1 July 2017Additions DisposalsDepreciationTransfers Transfer to assets held for resaleForeign exchange differences (refer Note 22)
4,244 487 (24)
(410) 195
- 57
83 14
(10) (7)
- (1) -
132 7 -
(32) 33
- -
219 5 -
(37) 14
- -
67 241
- -
(242) - -
4,745 754 (34)
(486) -
(1) 57
Carrying value as at 30 June 2018 Represented by: Cost Accumulated depreciation Provision for impairment
4,549
6,606 (2,057)
-
79
147 (68)
-
140
448 (308)
-
201
455 (236)
(18)
66
66 - -
5,035
7,722 (2,669)
(18)
Carrying value as at 30 June 2018 4,549 79 140 201 66 5,035
2019$M
2018$M
Airframes, engines and simulators comprise: Finance leased airframes and engines Owned airframes, engines and simulators Progress payments
1,375 3,224
154
1,413 2,871
265
4,753 4,549
Land and buildings comprise: Leasehold properties Freehold properties
177 11
188 13
188 201
Certain aircraft and aircraft related assets with a carrying value of $3,230 million as at 30 June 2019 (30 June 2018: $3,373 million) are pledged as security over secured borrowings and finance lease obligations.
ImpairmentAir New Zealand Gas Turbines (ANZGT) provides overhaul services to aero derivative engines that are applied to energy production and marine industries. In prior years a down turn in the market resulted in a decline in activity and profitability of the business. Impairment provisions of $18 million were recognised against the land and building assets of the business in previous years. During the year ended 30 June 2019 the assets were assessed for impairment based on a value in use discounted cash flow valuation. Cash flow projections were sourced from the 2020 financial year plan and extrapolated into the future using a 2% growth rate and adjusted for any one-off transactions and expected market conditions. Key assumptions include exchange rates, customer demand, market supply and terminal values. These assumptions have been based on historical data and current market information. The cash flow projections are particularly sensitive to fluctuations in exchange rates and economic demand. The cash flow projections are discounted using a 9% discount rate (30 June 2018: 9%). An impairment provision of $4 million was reversed in the 30 June 2019 financial year (30 June 2018: Nil).
Residual valuesEstimates and judgements are applied by management to determine the expected useful life of aircraft related assets. The useful lives are determined based on the expected service potential of the asset and lease term. The residual value, at the expected date of disposal, is estimated by reference to external projected values and are influenced by external changes to economic conditions, demand, competition and new technology. Residual values are denominated in United States dollars and are therefore sensitive to exchange fluctuations as well as movements in projected values. Residual values and useful lives are reviewed each year to ensure they remain appropriate. During the year ended 30 June 2019 the residual values of the aircraft were reassessed and depreciation expense was reduced by $4 million (30 June 2018: decreased by $6 million).
16
NOTES TO THE FINANCIAL STATEMENTS (CONTINUED)AS AT 30 JUNE 2019
A I R N E W ZE A L A N D A N N UA L F I N A N C I A L R E S U LT S 2 0 1 9
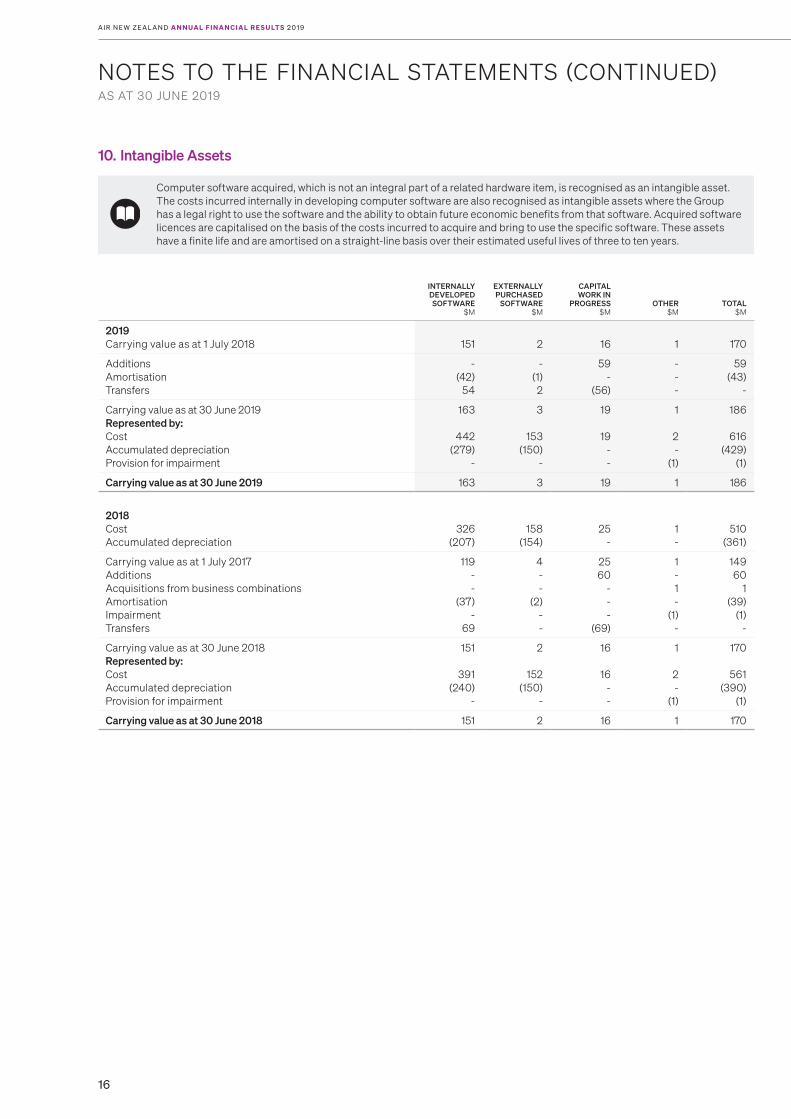
10. Intangible Assets
Computer software acquired, which is not an integral part of a related hardware item, is recognised as an intangible asset. The costs incurred internally in developing computer software are also recognised as intangible assets where the Group has a legal right to use the software and the ability to obtain future economic benefits from that software. Acquired software licences are capitalised on the basis of the costs incurred to acquire and bring to use the specific software. These assets have a finite life and are amortised on a straight-line basis over their estimated useful lives of three to ten years.
INTERNALLY DEVELOPED SOFTWARE
$M
EXTERNALLY PURCHASED
SOFTWARE$M
CAPITAL WORK IN
PROGRESS$M
OTHER$M
TOTAL$M
2019 Carrying value as at 1 July 2018
151 2
16 1
170
Additions AmortisationTransfers
- (42) 54
- (1) 2
59 -
(56)
- - -
59 (43)
-
Carrying value as at 30 June 2019 Represented by: Cost Accumulated depreciationProvision for impairment
163
442 (279)
-
3
153 (150)
-
19
19 - -
1
2 -
(1)
186
616 (429)
(1)
Carrying value as at 30 June 2019 163 3 19 1 186
2018 Cost Accumulated depreciation
326 (207)
158 (154)
25 -
1 -
510 (361)
Carrying value as at 1 July 2017 AdditionsAcquisitions from business combinations AmortisationImpairment Transfers
119 - -
(37) -
69
4 - -
(2) - -
25 60
- - -
(69)
1 - 1 -
(1) -
149 60
1 (39)
(1) -
Carrying value as at 30 June 2018 Represented by: Cost Accumulated depreciationProvision for impairment
151
391 (240)
-
2
152 (150)
-
16
16 - -
1
2 -
(1)
170
561 (390)
(1)
Carrying value as at 30 June 2018 151 2 16 1 170
17
NOTES TO THE FINANCIAL STATEMENTS (CONTINUED)FOR THE YEAR TO AND AS AT 30 JUNE 2019
A I R N E W ZE A L A N D G R O U P
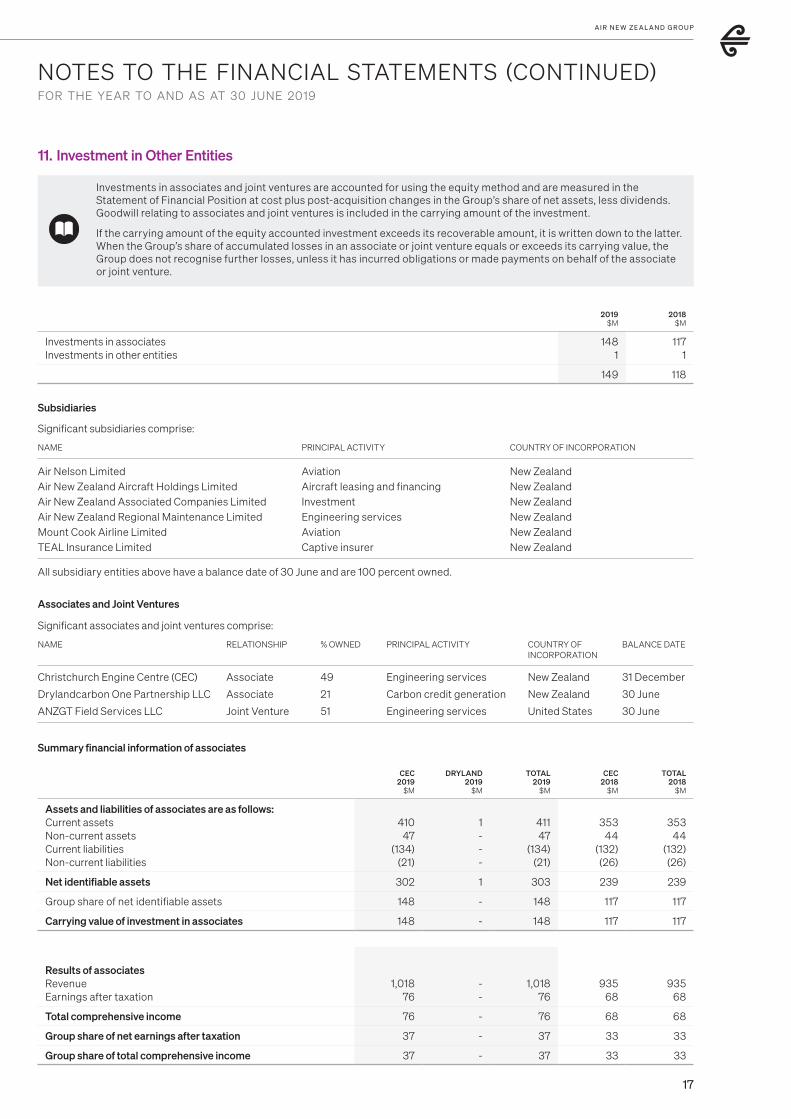
11. Investment in Other Entities
2019$M
2018$M
Investments in associates Investments in other entities
148 1
117 1
149 118
Subsidiaries
Significant subsidiaries comprise:
NAME PRINCIPAL ACTIVITY COUNTRY OF INCORPORATION
Air Nelson Limited Aviation New Zealand
Air New Zealand Aircraft Holdings Limited Aircraft leasing and financing New Zealand
Air New Zealand Associated Companies Limited Investment New Zealand
Air New Zealand Regional Maintenance Limited Engineering services New Zealand
Mount Cook Airline Limited Aviation New Zealand
TEAL Insurance Limited Captive insurer New Zealand
All subsidiary entities above have a balance date of 30 June and are 100 percent owned.
Associates and Joint Ventures
Significant associates and joint ventures comprise:
NAME RELATIONSHIP % OWNED PRINCIPAL ACTIVITY COUNTRY OF BALANCE DATE INCORPORATION
Christchurch Engine Centre (CEC) Associate 49 Engineering services New Zealand 31 December
Drylandcarbon One Partnership LLC Associate 21 Carbon credit generation New Zealand 30 June
ANZGT Field Services LLC Joint Venture 51 Engineering services United States 30 June
Investments in associates and joint ventures are accounted for using the equity method and are measured in the Statement of Financial Position at cost plus post-acquisition changes in the Group’s share of net assets, less dividends. Goodwill relating to associates and joint ventures is included in the carrying amount of the investment.
If the carrying amount of the equity accounted investment exceeds its recoverable amount, it is written down to the latter. When the Group’s share of accumulated losses in an associate or joint venture equals or exceeds its carrying value, the Group does not recognise further losses, unless it has incurred obligations or made payments on behalf of the associate or joint venture.
Summary financial information of associates
CEC2019
$M
DRYLAND2019
$M
TOTAL2019
$M
CEC2018
$M
TOTAL2018
$M
Assets and liabilities of associates are as follows: Current assets Non-current assets Current liabilities Non-current liabilities
410
47 (134)
(21)
1 - - -
411 47
(134) (21)
353
44 (132) (26)
353
44 (132) (26)
Net identifiable assets 302 1 303 239 239
Group share of net identifiable assets 148 - 148 117 117
Carrying value of investment in associates 148 - 148 117 117
Results of associates Revenue Earnings after taxation
1,018 76
--
1,018 76
935 68
935 68
Total comprehensive income 76 - 76 68 68
Group share of net earnings after taxation 37 - 37 33 33
Group share of total comprehensive income 37 - 37 33 33
18
NOTES TO THE FINANCIAL STATEMENTS (CONTINUED)AS AT 30 JUNE 2019
A I R N E W ZE A L A N D A N N UA L F I N A N C I A L R E S U LT S 2 0 1 9
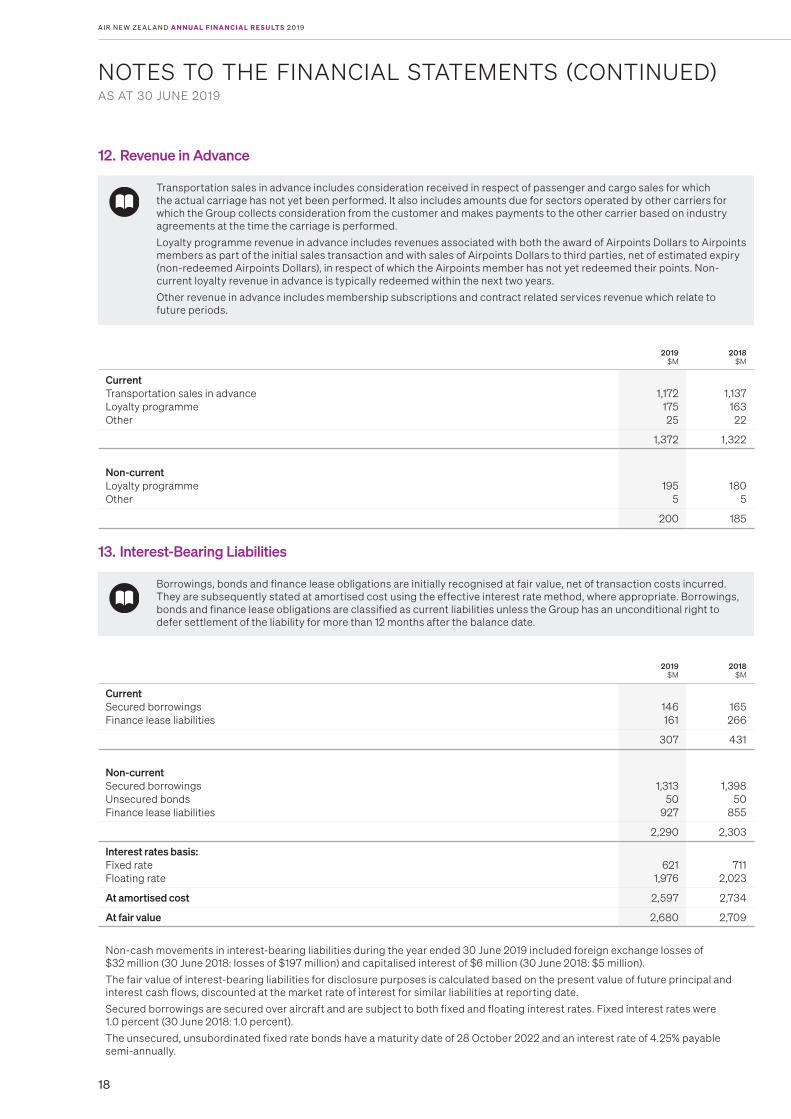
12. Revenue in Advance
Transportation sales in advance includes consideration received in respect of passenger and cargo sales for which the actual carriage has not yet been performed. It also includes amounts due for sectors operated by other carriers for which the Group collects consideration from the customer and makes payments to the other carrier based on industry agreements at the time the carriage is performed.
Loyalty programme revenue in advance includes revenues associated with both the award of Airpoints Dollars to Airpoints members as part of the initial sales transaction and with sales of Airpoints Dollars to third parties, net of estimated expiry (non-redeemed Airpoints Dollars), in respect of which the Airpoints member has not yet redeemed their points. Non-current loyalty revenue in advance is typically redeemed within the next two years.
Other revenue in advance includes membership subscriptions and contract related services revenue which relate to future periods.
2019$M
2018$M
CurrentTransportation sales in advanceLoyalty programmeOther
1,172 175 25
1,137 163 22
1,372 1,322
Non-current Loyalty programme Other
195 5
180 5
200 185
13. Interest-Bearing Liabilities
Borrowings, bonds and finance lease obligations are initially recognised at fair value, net of transaction costs incurred. They are subsequently stated at amortised cost using the effective interest rate method, where appropriate. Borrowings, bonds and finance lease obligations are classified as current liabilities unless the Group has an unconditional right to defer settlement of the liability for more than 12 months after the balance date.
2019$M
2018$M
Current Secured borrowings Finance lease liabilities
146 161
165 266
307 431
Non-current Secured borrowings Unsecured bonds Finance lease liabilities
1,313 50
927
1,398 50
855
2,290 2,303
Interest rates basis: Fixed rate Floating rate
621 1,976
711 2,023
At amortised cost 2,597 2,734
At fair value 2,680 2,709
Non-cash movements in interest-bearing liabilities during the year ended 30 June 2019 included foreign exchange losses of $32 million (30 June 2018: losses of $197 million) and capitalised interest of $6 million (30 June 2018: $5 million).
The fair value of interest-bearing liabilities for disclosure purposes is calculated based on the present value of future principal and interest cash flows, discounted at the market rate of interest for similar liabilities at reporting date.
Secured borrowings are secured over aircraft and are subject to both fixed and floating interest rates. Fixed interest rates were 1.0 percent (30 June 2018: 1.0 percent).
The unsecured, unsubordinated fixed rate bonds have a maturity date of 28 October 2022 and an interest rate of 4.25% payable semi-annually.

19
NOTES TO THE FINANCIAL STATEMENTS (CONTINUED)AS AT 30 JUNE 2019
A I R N E W ZE A L A N D G R O U P
13. Interest-Bearing Liabilities (continued)
Finance lease liabilities
Payments made under finance leases are apportioned between the finance expense and the reduction of the outstanding liability. The finance expense is allocated to each period during the lease term so as to produce a constant periodic rate of interest on the remaining balance of the liability.
2019$M
2018$M
Repayable as follows: Not later than 1 year Later than 1 year and not later than 5 years Later than 5 years
181 642 377
291 657 278
Less future finance costs
1,200 (112)
1,226 (105)
Present value of future rentals 1,088 1,121
Repayable as follows: Not later than 1 year Later than 1 year and not later than 5 years Later than 5 years
161 594 333
266 596 259
1,088 1,121
Finance lease liabilities are secured over aircraft and are subject to both fixed and floating interest rates. Fixed interest rates ranged from 0.7 percent to 3.1 percent (30 June 2018: 0.7 percent to 3.4 percent). Purchase options are available on expiry or, if applicable under the lease agreement, on early termination of the finance leases.
14. Provisions
A provision is recognised when the Group has a present legal or constructive obligation as a result of a past event, it is probable that an outflow of economic benefits will be required to settle the obligation, and the provision can be reliably measured.
AIRCRAFT LEASE
RETURN COSTS$M
RESTRUCTURING$M
OTHER$M
TOTAL$M
Balance as at 1 July 2018 Amount provided Amount utilised and released Foreign exchange differences
265 95
(92) 1
1 2
(3) -
2 -
(1) -
268 97
(96) 1
Balance as at 30 June 2019 269 - 1 270
Represented by: Current Non-current
104 165
- -
1 -
105 165
Balance as at 30 June 2019 269 - 1 270

20
NOTES TO THE FINANCIAL STATEMENTS (CONTINUED)AS AT 30 JUNE 2019
A I R N E W ZE A L A N D A N N UA L F I N A N C I A L R E S U LT S 2 0 1 9
14. Provisions (continued)
Nature and purpose of provisions
Aircraft lease return costsWhere a commitment exists to maintain aircraft held under operating lease arrangements, a provision is made during the lease term for the lease return obligations specified within those lease agreements. The provision is calculated taking into account a number of variables and assumptions including the number of future hours or cycles expected to be operated, the expected cost of maintenance and the lifespan of limited life parts. It is based upon historical experience, manufacturers’ advice and, where appropriate, contractual obligations in determining the present value of the estimated future costs of major airframe inspections and engine overhauls by making appropriate charges to the Statement of Financial Performance, calculated by reference to the number of hours or cycles operated during the year. The provision is expected to be utilised at the next inspection or overhaul.
RestructuringRestructuring provisions are recognised when the Group is demonstrably committed, without realistic possibility of withdrawal, to a formal detailed plan to terminate employment before the normal retirement date. Costs relating to ongoing activities are not provided for.
OtherOther provisions include insurance provisions. Insurance provisions are expected to be utilised within 12 months and are based on historical claim experience.
15. Other Liabilities
Employee entitlementsLiabilities in respect of employee entitlements are recognised in exchange for services rendered during the accounting period, but which have not yet been compensated as at reporting date. These include annual leave, long service leave, retirement leave and accrued compensation.
Defined pensionAir New Zealand’s net obligation in respect of defined benefit pension plans is calculated by an independent actuary, by estimating the amount of future benefit that employees have earned in the current and prior periods, discounting that amount and deducting the fair value of the plan’s assets. The discount rate reflects the yield on government bonds that have maturity dates approximating the terms of Air New Zealand’s obligations.
When the calculation results in an asset, the value of the asset is limited to the present value of economic benefits available in the form of any future refunds from the plan or reductions in future contributions from the plan.
2019$M
2018$M
Current Employee entitlements Amounts owing to associates Other liabilities (including defined benefit liabilities)
220
- 20
236 22
5
240 263
Non-current Employee entitlements Other liabilities
14 28
12 15
42 27
The Group operates two defined benefit plans for qualifying employees in New Zealand and overseas. A net liability was recognised of $13 million (30 June 2018: $1 million). The New Zealand plan is now closed to new members. The plans provide a benefit on retirement or resignation based upon the employee’s length of membership and final average salary. Each year an actuarial calculation is undertaken using the Projected Unit Credit Method to calculate the present value of the defined benefit obligation and the related current service cost. The current service cost recognised through earnings was $3 million (30 June 2018: $2 million).

21
NOTES TO THE FINANCIAL STATEMENTS (CONTINUED)AS AT 30 JUNE 2019
A I R N E W ZE A L A N D G R O U P
16. Distributions to Owners
2019$M
2018$M
Distributions recognised Final dividend on Ordinary Shares Interim dividend on Ordinary Shares
124 124
124 124
248 248
Distributions paid Final dividend on Ordinary Shares Interim dividend on Ordinary Shares
130 130
130 130
260 260
On 21 August 2019, the Board of Directors declared a final dividend for the 2019 financial year of 11.0 cents per Ordinary Share, payable on 18 September 2019 to registered shareholders at 6 September 2019. The total dividend payable will be $124 million. Imputation credits will be attached and supplementary dividends paid to non-resident shareholders. The dividend has not been recognised in the June 2019 financial statements.
A 2019 interim dividend of 11.0 cents per Ordinary Share was paid on 27 March 2019 (2018 interim dividend: 11.0 cents per Ordinary Share paid on 16 March 2018). Imputation credits were attached and supplementary dividends paid to non-resident shareholders.
A final dividend in respect of the 2018 financial year of 11.0 cents per Ordinary Share was paid on 19 September 2018 (2017 financial year: 11.0 cents per Ordinary Share was paid on 18 September 2017). Imputation credits were attached and supplementary dividends paid to non-resident shareholders.
17. Share Capital
Ordinary shares are classified as equity. Incremental costs directly attributable to the issue of new shares, rights or options are shown in equity as a deduction, net of taxation, from the proceeds.
When shares are acquired by a member of the Group, the amount of consideration paid is recognised directly in equity. Acquired shares are classified as treasury stock and presented as a deduction from share capital. When treasury stock is subsequently sold or reissued pursuant to equity compensation plans, the cost of treasury stock is reversed and the realised gain or loss on sale or reissue, net of any directly attributable incremental transaction costs, is recognised within Share Capital.
Where the Group funds the on-market purchase of shares to settle obligations under long-term incentive plans the total cost of the purchase (including transaction costs) is deducted from Share Capital.
2019$M
2018$M
Share capital comprises: Authorised, issued and fully paid in capital Equity-settled share-based payments (net of taxation)
2,206 13
2,216 10
2,219 2,226
Balance at the beginning of the year Equity settlements of long-term incentive obligations* Equity-settled share-based paymentsTaxation on share capital reserve
2,226 (14)
5 2
2,238 (17)
5 -
Balance at the end of the year 2,219 2,226
* During the year ended 30 June 2019 the Group funded the purchase on-market of 4,463,819 shares (30 June 2018: 4,932,709). The shares were used to settle obligations under employee share-based compensation plans.
Number of Ordinary Shares authorised, fully paid and on issue Balance at the beginning of the year
2019
1,122,844,227
2018
1,122,844,227
Balance at the end of the year** 1,122,844,227 1,122,844,227
** Includes treasury stock of 34,183 shares (30 June 2018: 34,183 shares).

22
NOTES TO THE FINANCIAL STATEMENTS (CONTINUED)AS AT 30 JUNE 2019
A I R N E W ZE A L A N D A N N UA L F I N A N C I A L R E S U LT S 2 0 1 9
17. Share Capital (continued)
Kiwi ShareOne fully paid special rights convertible share (the Kiwi Share) is held by the Crown. While the Kiwi Share does not carry any general Voting Rights, the consent of the Crown as holder is required for certain prescribed actions of the Company as specified in the Constitution.
Non-New Zealand nationals are restricted from holding or having an interest in 10 percent or more of voting shares unless the prior written consent of the Kiwi Shareholder is obtained. In addition, any person that owns or operates an airline business is restricted from holding any shares in the Company without the Kiwi Shareholder’s prior written consent.
Voting rightsOn a show of hands or by a vote of voices, each holder of Ordinary Shares has one vote. On a poll, each holder of Ordinary Shares has one vote for each fully paid share.
All Ordinary Shares carry equal rights to dividends and equal distribution rights on wind up.
Application of treasury stock method
Share repurchaseThe Group utilises treasury stock acquired under a buy-back programme to fulfil obligations under employee share-based compensation plans. No treasury stock was utilised in the 2019 financial year (30 June 2018: Nil). Total treasury stock held as at 30 June 2019 is 34,090 shares (30 June 2018: 34,090 shares).
Staff Share SchemeUnallocated shares of the Air New Zealand Staff Share Schemes are accounted for under the Treasury Stock method, and deducted from Ordinary Share capital on consolidation. The number of unallocated shares as at 30 June 2019 was 93 (30 June 2018: 93).
Equity-Settled Share-Based Payments
The fair value (at grant date) of share rights and options granted to employees is recognised as an expense, within the Statement of Financial Performance, over the vesting period of the rights and options, with a corresponding entry to ‘Share Capital’. The amount recognised as an expense is adjusted at each reporting date to reflect the extent to which the vesting period has expired and management’s best estimate of the number of rights and share options that will ultimately vest.
Share rights and options over ordinary sharesPerformance share rights have been offered to a number of senior executives on attainment of predetermined performance objectives, and restricted share rights have been offered to the CEO subject to remaining in employment over the vesting period. Prior to the 2015 financial year, share options were granted to a number of senior executives on attainment of predetermined performance objectives.
The total expense recognised in the year ended 30 June 2019 in respect of equity-settled share-based payment transactions was $5 million (30 June 2018: $5 million).
PERFORMANCESHARE
RIGHTS2019
LONG-TERMINCENTIVE
PLAN2019
CEO RESTRICTED
SHARE RIGHTS 2019
PERFORMANCESHARE
RIGHTS2018
LONG-TERMINCENTIVE
PLAN2018
CEO RESTRICTED
SHARE RIGHTS2018
Number outstandingOutstanding at beginning of the yearGranted during yearExercised during yearForfeited during year
12,236,381 4,287,459
(3,824,080) (828,279)
415,735
- (415,735)
-
510,808 242,643
(380,636) (97,057)
13,807,858 3,096,055 (4,257,053)
(410,479)
900,764
- (485,029)
-
659,715 216,954
(365,861) -
Outstanding at the end of the year* 11,871,481 - 275,758 12,236,381 415,735 510,808
Exercisable as at end of the year
Weighted average exercise price:- exercisable as at the end of the year ($)- exercised during the year ($)
Weighted average: - Share price at the date options exercised ($)- Remaining period of options to
contractual maturity (years) Fair value of rights granted in year ($M)Unamortised grant date fair value ($M)
-
- -
- -
6.4 6.5
-
- 1.23
3.27 -
- -
-
- -
-
-
0.7 0.3
-
- -
- -
5.3 6.1
415,735
1.23 1.23
3.41
0.2
- -
-
- -
-
-
0.7 0.5
* The People Remuneration and Diversity Committee of the Board will adjust share-based arrangement terms, if necessary, to ensure that the impact of share issues, share offers or share structure changes is value neutral as between participants and shareholders.

23
NOTES TO THE FINANCIAL STATEMENTS (CONTINUED)AS AT 30 JUNE 2019
A I R N E W ZE A L A N D G R O U P
17. Share Capital (continued)
Key inputs and assumptionsThe general principles underlying the Black Scholes pricing model have been used to value these rights and options using a Monte Carlo simulation approach, with the exception of the CEO Restricted Share Rights Plan for which a simplified approach was applied given the exercise price was fixed at issue date. The key inputs for rights and options granted in the relevant year were as follows:
Performance share rights
WEIGHTED AVERAGE
SHARE PRICE (CENTS)
EXPECTED VOLATILITY OF
SHARE PRICE (%)
EXPECTED VOLATILITY OF
PERFORMANCE BENCHMARK
INDEX (%)
CORRELATION OF VOLATILITY
INDICES
CONTRACTUAL LIFE
(YEARS)
RISK FREE RATE
(%)
EXPECTED DIVIDEND
YIELD(%)
2019 319 25 11 0.51 3.5 1.70 6.62018 348 30 13 0.53 3.5 2.02 5.82017 200 30 15 0.53 3.5 1.95 9.02016 239 28 13 0.40 3.5 2.53 7.12015 205 26 14 0.34 3.5 4.00 5.3
CEO Restricted Share Rights Plan
WEIGHTED AVERAGE
SHARE PRICE (CENTS) EQUITY BETA
MARKET RISK PREMIUM
(%)COST OF EQUITY
(%)
CONTRACTUAL LIFE
(YEARS)
RISK FREE RATE
(%)
EXPECTED DIVIDEND
YIELD(%)
2019 Tranche 12019 Tranche 2
322 322
1.051.05
7.50 7.50
9.19.1
1.3 2.3
1.641.65
4.5 4.8
2018 Tranche 12018 Tranche 2
348 348
1.101.10
7.50 7.50
9.69.6
1.3 2.3
1.841.94
5.9 5.4
2017 Tranche 12017 Tranche 2
194194
1.301.30
7.50 7.50
11.1 11.1
1.3 2.3
1.901.90
6.7 7.2
2016 239 1.25 7.50 11.1 2.3 2.50 6.3
Options
WEIGHTED AVERAGE
SHARE PRICE
(CENTS)
EXPECTED VOLATILITY OF
SHARE PRICE (%)
EXPECTED VOLATILITY OF
PERFORMANCE BENCHMARK
INDEX (%)
CORRELATION OF VOLATILITY
INDICES
CONTRACTUAL LIFE
(YEARS)
RISK FREE RATE
(%)
EXPECTED DIVIDEND
YIELD(%)
DISCOUNT TO REFLECT
NEGOTIABILITY RESTRICTIONS
(%)
Long-Term Incentive Plan1
2014 139 27 15 0.25 5.0 4.40 5.8 25
1 Volatility and correlation estimates were derived using historical data over past 3-5 years; Risk free rate was based on the 5 year zero coupon bond yield.
24
NOTES TO THE FINANCIAL STATEMENTS (CONTINUED)AS AT 30 JUNE 2019
A I R N E W ZE A L A N D A N N UA L F I N A N C I A L R E S U LT S 2 0 1 9
17. Share Capital (continued)
SHARE RIGHTS SCHEMES
(a) Performance Share RightsThe Group has undertaken a stock settled share rights scheme. Performance share rights for a specified value are granted at no cost to the holder. For each performance share right that vests, one share will be issued. The number granted is determined by an independent valuation of the fair value at the date of issue. Vesting of performance share rights is subject to the holder remaining an employee and vesting conditions relating to the Air New Zealand share price being achieved. If vesting is not achieved on the third anniversary of the issue date, 50 percent of performance rights will lapse. For the remaining 50 percent, there will be a further 6 month opportunity for the performance rights to vest. If they have not vested at the end of this period they will lapse.
In order to vest, the Air New Zealand share price adjusted for distributions made over the period must outperform a comparison index over a period of three years (or up to a maximum of three and a half years) after the issue date. The index is made up of 50:50 of the NZX All Gross Index and the Bloomberg World Airline Total Return Index (adjusted for dividends).
(b) CEO Restricted Share Rights PlanThe Group has undertaken a stock settled share rights scheme. Restricted share rights for a specified value are granted at no cost to the holder. For each restricted share right that vests, one share will be issued. The number granted is determined by an independent valuation of the fair value at the date of issue. Vesting of restricted share rights is subject to the holder remaining an employee. The outstanding restricted share rights vest on 31 December 2019.
OPTIONS
The Group previously undertook a stock settled share appreciation rights scheme whereby shares are issued equating to the delta between the market price and the exercise price. The exercise price has been modelled as a stochastic variable, using the volatility, correlation, dividend yield and risk free rate assumptions provided. The volatility and correlation estimates were derived from measuring these parameters using historical data. The risk free rate was based on the zero coupon bond yield implied from short to medium term yields for government bonds. The expected life used in calculating the value of options was determined by analysis of the attrition rates and early exercise behaviour of staff in long-term incentive programmes in similar large corporates.
(a) Long-Term Incentive Plan (LTIP)The options were able to be exercised at any time between three and five years after the date of issue (subject to compliance with insider trading restrictions and the rules of the scheme). All options under the plan have been exercised. The exercise price was set three years after issue, and was based on Air New Zealand’s share price at the issue date increased or decreased by the percentage movement in a specified index over the three years, and decreased by any distributions made over the same period. The specified index comprised the total shareholder return for the NZX All Gross Index and the Bloomberg World Airline Total Return Index (adjusted for dividends) in 50:50 proportions.
25
NOTES TO THE FINANCIAL STATEMENTS (CONTINUED)FOR THE YEAR TO AND AS AT 30 JUNE 2019
A I R N E W ZE A L A N D G R O U P
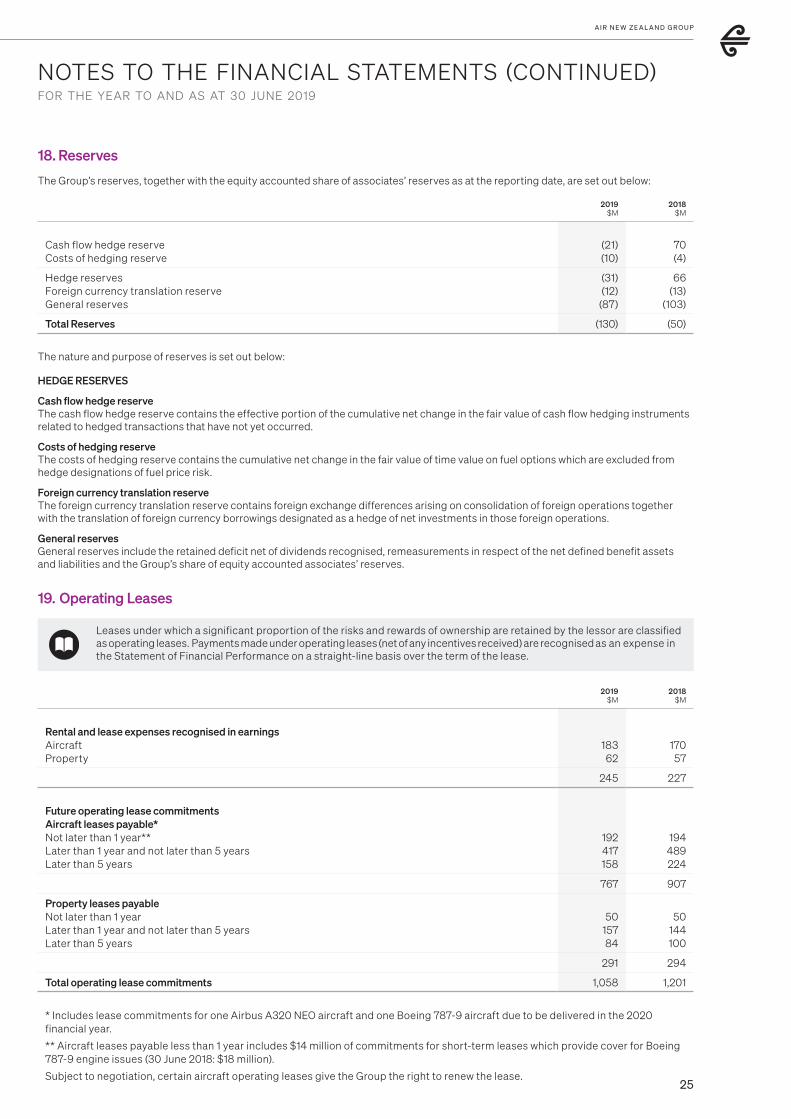
18. Reserves
The Group’s reserves, together with the equity accounted share of associates’ reserves as at the reporting date, are set out below:
2019$M
2018$M
Cash flow hedge reserveCosts of hedging reserve
(21) (10)
70 (4)
Hedge reservesForeign currency translation reserveGeneral reserves
(31) (12)
(87)
66 (13)
(103)
Total Reserves (130) (50)
The nature and purpose of reserves is set out below:
HEDGE RESERVES
Cash flow hedge reserveThe cash flow hedge reserve contains the effective portion of the cumulative net change in the fair value of cash flow hedging instruments related to hedged transactions that have not yet occurred.
Costs of hedging reserveThe costs of hedging reserve contains the cumulative net change in the fair value of time value on fuel options which are excluded from hedge designations of fuel price risk.
Foreign currency translation reserveThe foreign currency translation reserve contains foreign exchange differences arising on consolidation of foreign operations together with the translation of foreign currency borrowings designated as a hedge of net investments in those foreign operations.
General reservesGeneral reserves include the retained deficit net of dividends recognised, remeasurements in respect of the net defined benefit assets and liabilities and the Group’s share of equity accounted associates’ reserves.
19. Operating Leases
Leases under which a significant proportion of the risks and rewards of ownership are retained by the lessor are classified as operating leases. Payments made under operating leases (net of any incentives received) are recognised as an expense in the Statement of Financial Performance on a straight-line basis over the term of the lease.
2019$M
2018$M
Rental and lease expenses recognised in earningsAircraftProperty
183
62
170 57
245 227
Future operating lease commitments Aircraft leases payable* Not later than 1 year** Later than 1 year and not later than 5 years Later than 5 years
192 417 158
194
489 224
767 907
Property leases payable Not later than 1 year Later than 1 year and not later than 5 years Later than 5 years
50 157 84
50 144 100
291 294
Total operating lease commitments 1,058 1,201
* Includes lease commitments for one Airbus A320 NEO aircraft and one Boeing 787-9 aircraft due to be delivered in the 2020 financial year.
** Aircraft leases payable less than 1 year includes $14 million of commitments for short-term leases which provide cover for Boeing 787-9 engine issues (30 June 2018: $18 million).
Subject to negotiation, certain aircraft operating leases give the Group the right to renew the lease.

26
NOTES TO THE FINANCIAL STATEMENTS (CONTINUED)AS AT 30 JUNE 2019
A I R N E W ZE A L A N D A N N UA L F I N A N C I A L R E S U LT S 2 0 1 9
20. Capital Commitments
Commitments shown are for those asset purchases authorised and contracted for as at reporting date but not provided for in the financial statements, converted at the year end exchange rate.
2019$M
2018$M
Aircraft and engines Other property, plant and equipment and intangible assets
1,056 52
1,526 4
1,108 1,530
Commitments as at reporting date include nine Airbus A321 NEOs and two Airbus A320 NEOs (delivery from 2020 to 2024 financial years) and seven ATR72-600s (delivery from 2020 to 2021 financial years).
On 27 May 2019 the Group entered into letters of intent to acquire eight Boeing 787-10 aircraft (powered by GE Aviation’s GEnx-1B engines) and two spare engines. The aircraft will be delivered during the financial years 2023 to 2028. The list price of the aircraft and spare engines is US$2.8 billion. The prices eventually payable will be affected by prevailing exchange rates, a price escalation to reflect inflation, and will be adjusted by a confidential discount. The purchases are subject to shareholder approval at the Annual Shareholder Meeting on 25 September 2019.
21. Contingent Liabilities
Contingent liabilities are subject to uncertainty or cannot be reliably measured and are not provided for. Disclosures as to the nature of any contingent liabilities are set out below. Judgements and estimates are applied to determine the probability that an outflow of resources will be required to settle an obligation. These are made based on a review of the facts and circumstances surrounding the event and advice from both internal and external parties.
2019$M
2018$M
Letters of credit and performance bonds 31 32
All significant legal disputes involving probable loss that can be reliably estimated have been provided for in the financial statements. There are no contingent liabilities for which it is practicable to estimate the financial effect.
The Group has a partnership agreement with Pratt and Whitney in relation to the Christchurch Engine Centre (CEC) (Note 11). By the nature of the agreement, joint and several liability exists between the two parties. Total liabilities of the CEC are $155 million (30 June 2018: $158 million).
22. Financial Risk ManagementThe Group is subject to credit, foreign currency, interest rate and fuel price risks. These risks are managed with various financial instruments, using a set of policies approved by the Board of Directors. Compliance with these policies is reviewed and reported monthly to the Board and is included as part of the internal audit programme. Group policy is not to enter, issue or hold financial instruments for speculative purposes.
CREDIT RISK
Credit risk is the potential loss from a transaction in the event of default by a counterparty during the term of the transaction or on settlement of the transaction. The Group incurs credit risk in respect of trade receivable transactions and other financial instruments in the normal course of business. The maximum exposure to credit risk is represented by the carrying value of financial assets.
The Group places cash, short-term deposits and derivative financial instruments with good credit quality counterparties, having a minimum Standard and Poors’ credit rating of A- or minimum Moody’s credit rating of A3. Limits are placed on the exposure to any one financial institution.
Credit evaluations are performed on all customers requiring direct credit. The Group is not exposed to any concentrations of credit risk within receivables, other assets and derivatives. The Group does not require collateral or other security to support financial instruments with credit risk. A significant proportion of receivables are settled through the International Air Transport Association (IATA) clearing mechanism which undertakes its own credit review of members. Over 92% of trade and other receivables are current, with less than 2% falling due after more than 90 days.
27
NOTES TO THE FINANCIAL STATEMENTS (CONTINUED)AS AT 30 JUNE 2019
A I R N E W ZE A L A N D G R O U P
22. Financial Risk Management (continued)
MARKET RISK
FOREIGN CURRENCY RISKForeign currency risk is the risk of loss to the Group arising from adverse fluctuations in exchange rates.
The Group has exposure to foreign exchange risk as a result of transactions denominated in foreign currencies, arising from normal trading activities, foreign currency borrowings and foreign currency capital commitments, purchases and sales. The documented risk management approach (as approved by the Board of Directors) is to manage both forecast foreign currency operating revenues and expenditure and foreign currency denominated balance sheet items. Hedges of foreign currency capital transactions are only undertaken if there is a large volume of forecast capital transactions over a short period of time.
The Group enters into foreign exchange contracts to manage the economic exposure arising due to fluctuations in foreign exchange rates affecting both highly probable forecast operating cash flows and foreign currency denominated liabilities. Any exposure to gains or losses on these contracts is offset by a related loss or gain on the item being hedged.
Forecast operating transactionsForeign currency operating cash inflows are primarily denominated in Australian Dollars, European Community Euro, Japanese Yen, Chinese Renminbi, United Kingdom Pounds and United States Dollars. Foreign currency operating cash outflows are primarily denominated in United States Dollars. The Group’s treasury risk management policy is to hedge between 47% and 87% (30 June 2018: 60% to 90%) of forecast net operating cash flows for the first 6 months, with progressive reductions in percentages hedged over the next 6 to 12 months. Forward points are excluded from the hedge designation in respect of operating revenue and expenditure transactions and are marked to market through earnings. The underlying forecast revenue and expenditure transactions in respect of foreign currency cash flow hedges in place at reporting date, are expected to occur over the next 12 months.
Japanese Yen and Euro denominated interest-bearing liabilities are designated as the hedging instrument in qualifying cash flow hedges of highly probable forecast Japanese Yen and Euro revenues, respectively.
Balance sheet exposuresCertain United States Dollar denominated interest-bearing liabilities are designated as the hedging instrument in fair value hedges of underlying United States Dollar aircraft values. A further proportion of United States Dollar denominated interest-bearing liabilities remains unhedged to provide an offset to foreign currency movements within depreciation expense, resulting from revisions made to aircraft residual values during the year.
The Group has investments in foreign operations, whose net assets are exposed to foreign currency translation risk. Currency exposure arising on the net assets of certain Group foreign operations is managed primarily through borrowings denominated in the relevant foreign currencies.
Where changes in the fair value of a derivative provide an offset to the underlying hedged item as it impacts earnings, hedge accounting is not applied. Foreign currency translation gains or losses on lease return provisions and the remaining non-hedge accounted United States Dollar, Japanese Yen and Euro denominated interest-bearing liabilities are recognised in the Statement of Financial Performance within ‘Foreign exchange gains/(losses)’. Marked to market gains or losses on non-hedge accounted foreign currency derivatives provide an offset to these foreign exchange movements, and are also recognised within ‘Foreign exchange gains/(losses)’.
With the exception of foreign currency denominated working capital balances, which together are immaterial to foreign currency fluctuations, the Group’s exposure to foreign exchange risk arising on items recognised in the Statement of Financial Position at reporting date is summarised below. This risk is translation risk before hedging activities, which is then managed through a number of different hedging strategies in which the items identified below may be designated either as the hedged item or the hedging instrument depending on the most efficient and cost effective strategy.
Derivative financial instruments are excluded from this table as they are specifically used to manage risk and do not create an initial exposure. The impact of derivative financial instruments in terms of managing identified risks is detailed over the following pages.
Forecast foreign currency revenue and expenditure transactions occur in the future and are not included below. The effect of foreign currency risk arising on forecast transactions and how this is managed is detailed over the following pages.
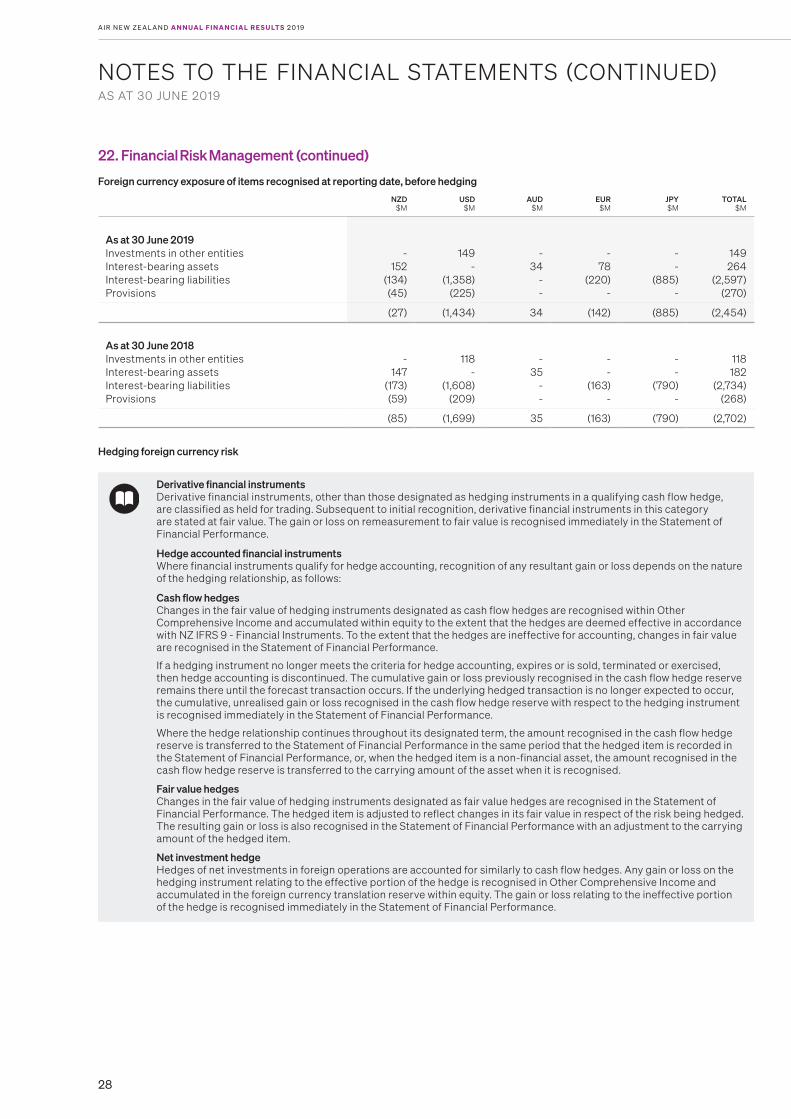
28
NOTES TO THE FINANCIAL STATEMENTS (CONTINUED)AS AT 30 JUNE 2019
A I R N E W ZE A L A N D A N N UA L F I N A N C I A L R E S U LT S 2 0 1 9
22. Financial Risk Management (continued)
Foreign currency exposure of items recognised at reporting date, before hedging
NZD$M
USD$M
AUD$M
EUR$M
JPY$M
TOTAL$M
As at 30 June 2019 Investments in other entities Interest-bearing assets Interest-bearing liabilities Provisions
- 152
(134) (45)
149 -
(1,358) (225)
- 34
- -
- 78
(220) -
- -
(885) -
149 264
(2,597) (270)
(27) (1,434) 34 (142) (885) (2,454)
As at 30 June 2018 Investments in other entities Interest-bearing assets Interest-bearing liabilities Provisions
- 147
(173) (59)
118 -
(1,608) (209)
- 35
- -
- -
(163) -
- -
(790) -
118 182
(2,734) (268)
(85) (1,699) 35 (163) (790) (2,702)
Hedging foreign currency risk
Derivative financial instrumentsDerivative financial instruments, other than those designated as hedging instruments in a qualifying cash flow hedge, are classified as held for trading. Subsequent to initial recognition, derivative financial instruments in this category are stated at fair value. The gain or loss on remeasurement to fair value is recognised immediately in the Statement of Financial Performance.
Hedge accounted financial instrumentsWhere financial instruments qualify for hedge accounting, recognition of any resultant gain or loss depends on the nature of the hedging relationship, as follows:
Cash flow hedgesChanges in the fair value of hedging instruments designated as cash flow hedges are recognised within Other Comprehensive Income and accumulated within equity to the extent that the hedges are deemed effective in accordance with NZ IFRS 9 - Financial Instruments. To the extent that the hedges are ineffective for accounting, changes in fair value are recognised in the Statement of Financial Performance.
If a hedging instrument no longer meets the criteria for hedge accounting, expires or is sold, terminated or exercised, then hedge accounting is discontinued. The cumulative gain or loss previously recognised in the cash flow hedge reserve remains there until the forecast transaction occurs. If the underlying hedged transaction is no longer expected to occur, the cumulative, unrealised gain or loss recognised in the cash flow hedge reserve with respect to the hedging instrument is recognised immediately in the Statement of Financial Performance.
Where the hedge relationship continues throughout its designated term, the amount recognised in the cash flow hedge reserve is transferred to the Statement of Financial Performance in the same period that the hedged item is recorded in the Statement of Financial Performance, or, when the hedged item is a non-financial asset, the amount recognised in the cash flow hedge reserve is transferred to the carrying amount of the asset when it is recognised.
Fair value hedges Changes in the fair value of hedging instruments designated as fair value hedges are recognised in the Statement of Financial Performance. The hedged item is adjusted to reflect changes in its fair value in respect of the risk being hedged. The resulting gain or loss is also recognised in the Statement of Financial Performance with an adjustment to the carrying amount of the hedged item.
Net investment hedgeHedges of net investments in foreign operations are accounted for similarly to cash flow hedges. Any gain or loss on the hedging instrument relating to the effective portion of the hedge is recognised in Other Comprehensive Income and accumulated in the foreign currency translation reserve within equity. The gain or loss relating to the ineffective portion of the hedge is recognised immediately in the Statement of Financial Performance.
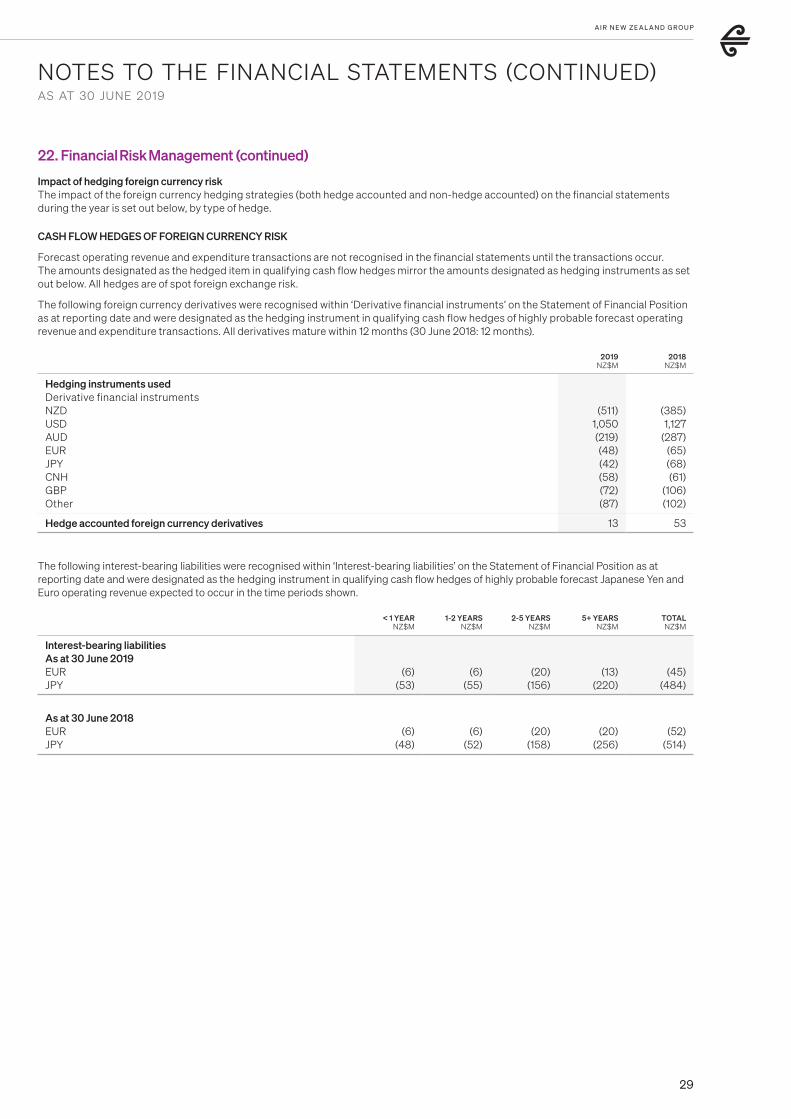
29
NOTES TO THE FINANCIAL STATEMENTS (CONTINUED)AS AT 30 JUNE 2019
A I R N E W ZE A L A N D G R O U P
22. Financial Risk Management (continued)
Impact of hedging foreign currency riskThe impact of the foreign currency hedging strategies (both hedge accounted and non-hedge accounted) on the financial statements during the year is set out below, by type of hedge.
CASH FLOW HEDGES OF FOREIGN CURRENCY RISK
Forecast operating revenue and expenditure transactions are not recognised in the financial statements until the transactions occur. The amounts designated as the hedged item in qualifying cash flow hedges mirror the amounts designated as hedging instruments as set out below. All hedges are of spot foreign exchange risk.
The following foreign currency derivatives were recognised within ‘Derivative financial instruments’ on the Statement of Financial Position as at reporting date and were designated as the hedging instrument in qualifying cash flow hedges of highly probable forecast operating revenue and expenditure transactions. All derivatives mature within 12 months (30 June 2018: 12 months).
2019NZ$M
2018NZ$M
Hedging instruments used Derivative financial instruments NZD USD AUD EUR JPYCNH GBP Other
(511) 1,050
(219) (48) (42) (58) (72) (87)
(385) 1,127 (287)
(65) (68) (61)
(106) (102)
Hedge accounted foreign currency derivatives 13 53
The following interest-bearing liabilities were recognised within ‘Interest-bearing liabilities’ on the Statement of Financial Position as at reporting date and were designated as the hedging instrument in qualifying cash flow hedges of highly probable forecast Japanese Yen and Euro operating revenue expected to occur in the time periods shown.
< 1 YEARNZ$M
1-2 YEARSNZ$M
2-5 YEARSNZ$M
5+ YEARSNZ$M
TOTALNZ$M
Interest-bearing liabilities As at 30 June 2019 EUR JPY
(6) (53)
(6) (55)
(20) (156)
(13) (220)
(45) (484)
As at 30 June 2018EURJPY
(6) (48)
(6) (52)
(20) (158)
(20) (256)
(52) (514)
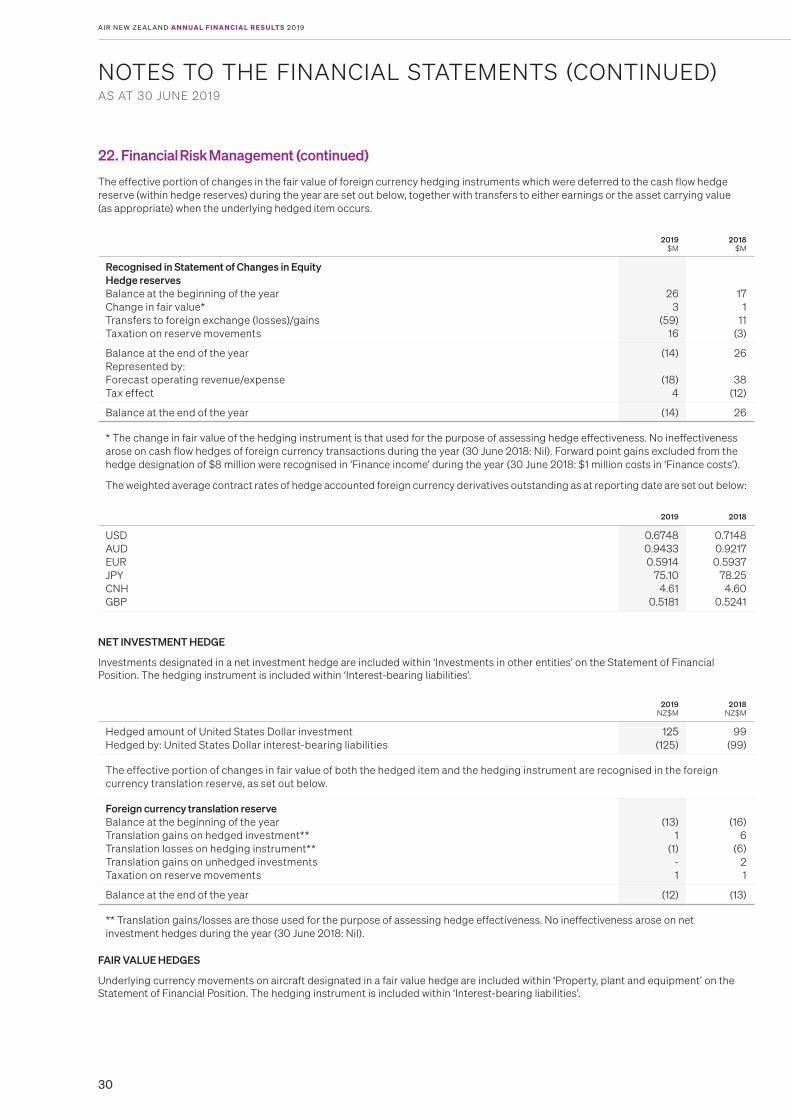
30
NOTES TO THE FINANCIAL STATEMENTS (CONTINUED)AS AT 30 JUNE 2019
A I R N E W ZE A L A N D A N N UA L F I N A N C I A L R E S U LT S 2 0 1 9
22. Financial Risk Management (continued)
The effective portion of changes in the fair value of foreign currency hedging instruments which were deferred to the cash flow hedge reserve (within hedge reserves) during the year are set out below, together with transfers to either earnings or the asset carrying value (as appropriate) when the underlying hedged item occurs.
2019$M
2018$M
Recognised in Statement of Changes in Equity Hedge reserves Balance at the beginning of the year Change in fair value* Transfers to foreign exchange (losses)/gains Taxation on reserve movements
26 3
(59) 16
17 1
11 (3)
Balance at the end of the year Represented by: Forecast operating revenue/expense Tax effect
(14)
(18) 4
26
38 (12)
Balance at the end of the year (14) 26
* The change in fair value of the hedging instrument is that used for the purpose of assessing hedge effectiveness. No ineffectiveness arose on cash flow hedges of foreign currency transactions during the year (30 June 2018: Nil). Forward point gains excluded from the hedge designation of $8 million were recognised in ‘Finance income’ during the year (30 June 2018: $1 million costs in ‘Finance costs’).
The weighted average contract rates of hedge accounted foreign currency derivatives outstanding as at reporting date are set out below:
2019 2018
USDAUDEURJPYCNHGBP
0.67480.94330.5914
75.104.61
0.5181
0.71480.92170.5937
78.254.60
0.5241
NET INVESTMENT HEDGE
Investments designated in a net investment hedge are included within ‘Investments in other entities’ on the Statement of Financial Position. The hedging instrument is included within ‘Interest-bearing liabilities’.
2019NZ$M
2018NZ$M
Hedged amount of United States Dollar investment Hedged by: United States Dollar interest-bearing liabilities
125 (125)
99 (99)
The effective portion of changes in fair value of both the hedged item and the hedging instrument are recognised in the foreign currency translation reserve, as set out below.
Foreign currency translation reserve Balance at the beginning of the year Translation gains on hedged investment** Translation losses on hedging instrument** Translation gains on unhedged investments Taxation on reserve movements
(13) 1
(1) - 1
(16) 6
(6) 2 1
Balance at the end of the year (12) (13)
** Translation gains/losses are those used for the purpose of assessing hedge effectiveness. No ineffectiveness arose on net investment hedges during the year (30 June 2018: Nil).
FAIR VALUE HEDGES
Underlying currency movements on aircraft designated in a fair value hedge are included within ‘Property, plant and equipment’ on the Statement of Financial Position. The hedging instrument is included within ‘Interest-bearing liabilities’.
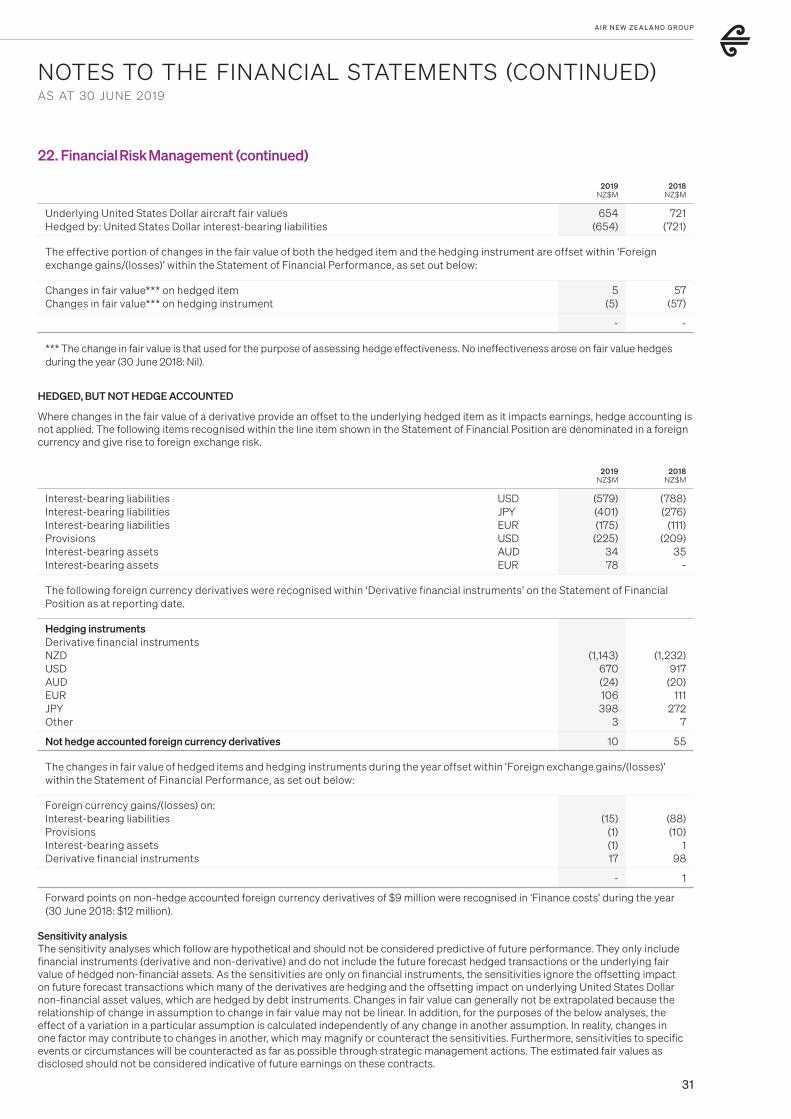
31
NOTES TO THE FINANCIAL STATEMENTS (CONTINUED)AS AT 30 JUNE 2019
A I R N E W ZE A L A N D G R O U P
22. Financial Risk Management (continued)
2019NZ$M
2018NZ$M
Underlying United States Dollar aircraft fair valuesHedged by: United States Dollar interest-bearing liabilities
654 (654)
721 (721)
The effective portion of changes in the fair value of both the hedged item and the hedging instrument are offset within ‘Foreign exchange gains/(losses)’ within the Statement of Financial Performance, as set out below:
Changes in fair value*** on hedged item Changes in fair value*** on hedging instrument
5 (5)
57 (57)
- -
*** The change in fair value is that used for the purpose of assessing hedge effectiveness. No ineffectiveness arose on fair value hedges during the year (30 June 2018: Nil).
HEDGED, BUT NOT HEDGE ACCOUNTED
Where changes in the fair value of a derivative provide an offset to the underlying hedged item as it impacts earnings, hedge accounting is not applied. The following items recognised within the line item shown in the Statement of Financial Position are denominated in a foreign currency and give rise to foreign exchange risk.
2019NZ$M
2018NZ$M
Interest-bearing liabilitiesInterest-bearing liabilitiesInterest-bearing liabilitiesProvisionsInterest-bearing assetsInterest-bearing assets
USD JPYEURUSD AUDEUR
(579) (401) (175)
(225) 34 78
(788) (276)
(111) (209)
35 -
The following foreign currency derivatives were recognised within ‘Derivative financial instruments’ on the Statement of Financial Position as at reporting date.
Hedging instruments Derivative financial instruments NZD USD AUDEURJPY Other
(1,143) 670 (24) 106 398
3
(1,232) 917 (20)
111 272
7
Not hedge accounted foreign currency derivatives 10 55
The changes in fair value of hedged items and hedging instruments during the year offset within ‘Foreign exchange gains/(losses)’ within the Statement of Financial Performance, as set out below:
Foreign currency gains/(losses) on: Interest-bearing liabilities Provisions Interest-bearing assets Derivative financial instruments
(15) (1) (1) 17
(88) (10)
1 98
- 1
Forward points on non-hedge accounted foreign currency derivatives of $9 million were recognised in ‘Finance costs’ during the year (30 June 2018: $12 million).
Sensitivity analysisThe sensitivity analyses which follow are hypothetical and should not be considered predictive of future performance. They only include financial instruments (derivative and non-derivative) and do not include the future forecast hedged transactions or the underlying fair value of hedged non-financial assets. As the sensitivities are only on financial instruments, the sensitivities ignore the offsetting impact on future forecast transactions which many of the derivatives are hedging and the offsetting impact on underlying United States Dollar non-financial asset values, which are hedged by debt instruments. Changes in fair value can generally not be extrapolated because the relationship of change in assumption to change in fair value may not be linear. In addition, for the purposes of the below analyses, the effect of a variation in a particular assumption is calculated independently of any change in another assumption. In reality, changes in one factor may contribute to changes in another, which may magnify or counteract the sensitivities. Furthermore, sensitivities to specific events or circumstances will be counteracted as far as possible through strategic management actions. The estimated fair values as disclosed should not be considered indicative of future earnings on these contracts.
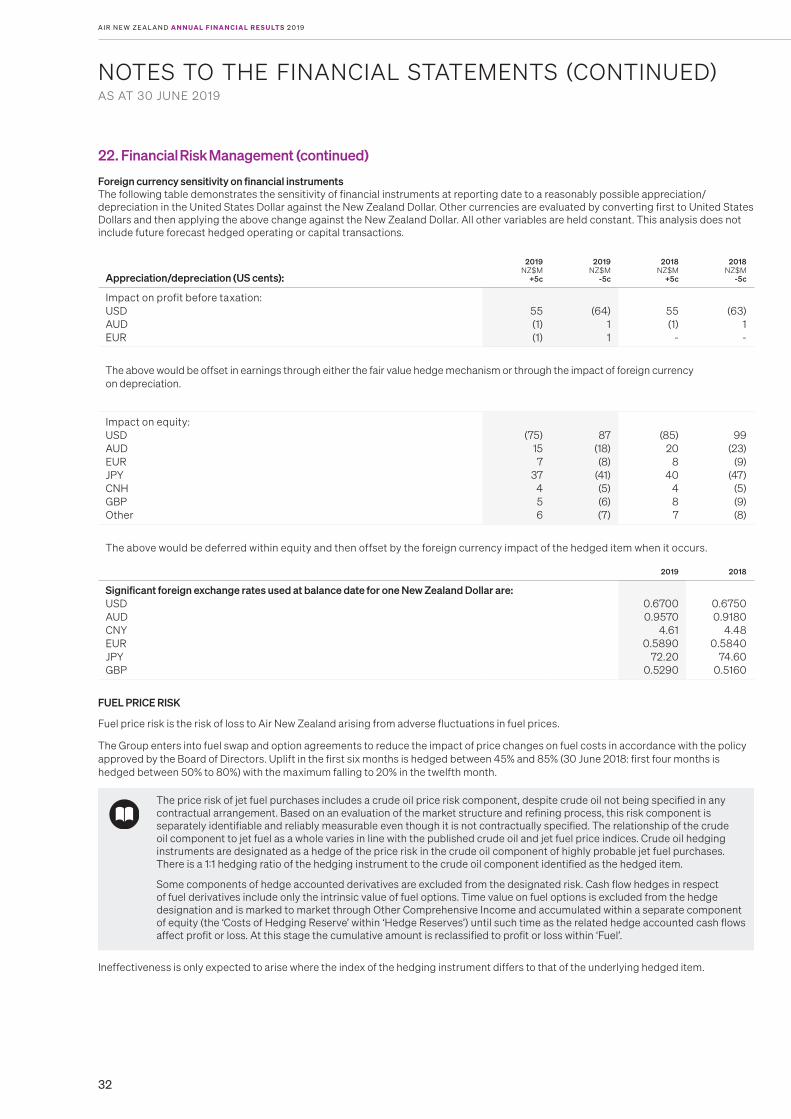
32
NOTES TO THE FINANCIAL STATEMENTS (CONTINUED)AS AT 30 JUNE 2019
A I R N E W ZE A L A N D A N N UA L F I N A N C I A L R E S U LT S 2 0 1 9
22. Financial Risk Management (continued)
Foreign currency sensitivity on financial instrumentsThe following table demonstrates the sensitivity of financial instruments at reporting date to a reasonably possible appreciation/depreciation in the United States Dollar against the New Zealand Dollar. Other currencies are evaluated by converting first to United States Dollars and then applying the above change against the New Zealand Dollar. All other variables are held constant. This analysis does not include future forecast hedged operating or capital transactions.
Appreciation/depreciation (US cents):
2019NZ$M
+5c
2019NZ$M
-5c
2018NZ$M
+5c
2018NZ$M
-5c
Impact on profit before taxation: USDAUDEUR
55 (1)(1)
(64) 1 1
55 (1)
-
(63) 1-
The above would be offset in earnings through either the fair value hedge mechanism or through the impact of foreign currency on depreciation.
Impact on equity: USD AUD EUR JPYCNH GBP Other
(75) 15 7
37 4 5 6
87 (18) (8)
(41) (5) (6) (7)
(85) 20
8 40
4 8 7
99 (23)
(9) (47)
(5) (9) (8)
The above would be deferred within equity and then offset by the foreign currency impact of the hedged item when it occurs.
2019 2018
Significant foreign exchange rates used at balance date for one New Zealand Dollar are:USDAUDCNYEURJPYGBP
0.67000.9570
4.610.5890
72.200.5290
0.67500.9180
4.480.5840
74.600.5160
FUEL PRICE RISK
Fuel price risk is the risk of loss to Air New Zealand arising from adverse fluctuations in fuel prices.
The price risk of jet fuel purchases includes a crude oil price risk component, despite crude oil not being specified in any contractual arrangement. Based on an evaluation of the market structure and refining process, this risk component is separately identifiable and reliably measurable even though it is not contractually specified. The relationship of the crude oil component to jet fuel as a whole varies in line with the published crude oil and jet fuel price indices. Crude oil hedging instruments are designated as a hedge of the price risk in the crude oil component of highly probable jet fuel purchases. There is a 1:1 hedging ratio of the hedging instrument to the crude oil component identified as the hedged item.
Some components of hedge accounted derivatives are excluded from the designated risk. Cash flow hedges in respect of fuel derivatives include only the intrinsic value of fuel options. Time value on fuel options is excluded from the hedge designation and is marked to market through Other Comprehensive Income and accumulated within a separate component of equity (the ‘Costs of Hedging Reserve’ within ‘Hedge Reserves’) until such time as the related hedge accounted cash flows affect profit or loss. At this stage the cumulative amount is reclassified to profit or loss within ‘Fuel’.
Ineffectiveness is only expected to arise where the index of the hedging instrument differs to that of the underlying hedged item.
The Group enters into fuel swap and option agreements to reduce the impact of price changes on fuel costs in accordance with the policy approved by the Board of Directors. Uplift in the first six months is hedged between 45% and 85% (30 June 2018: first four months is hedged between 50% to 80%) with the maximum falling to 20% in the twelfth month.
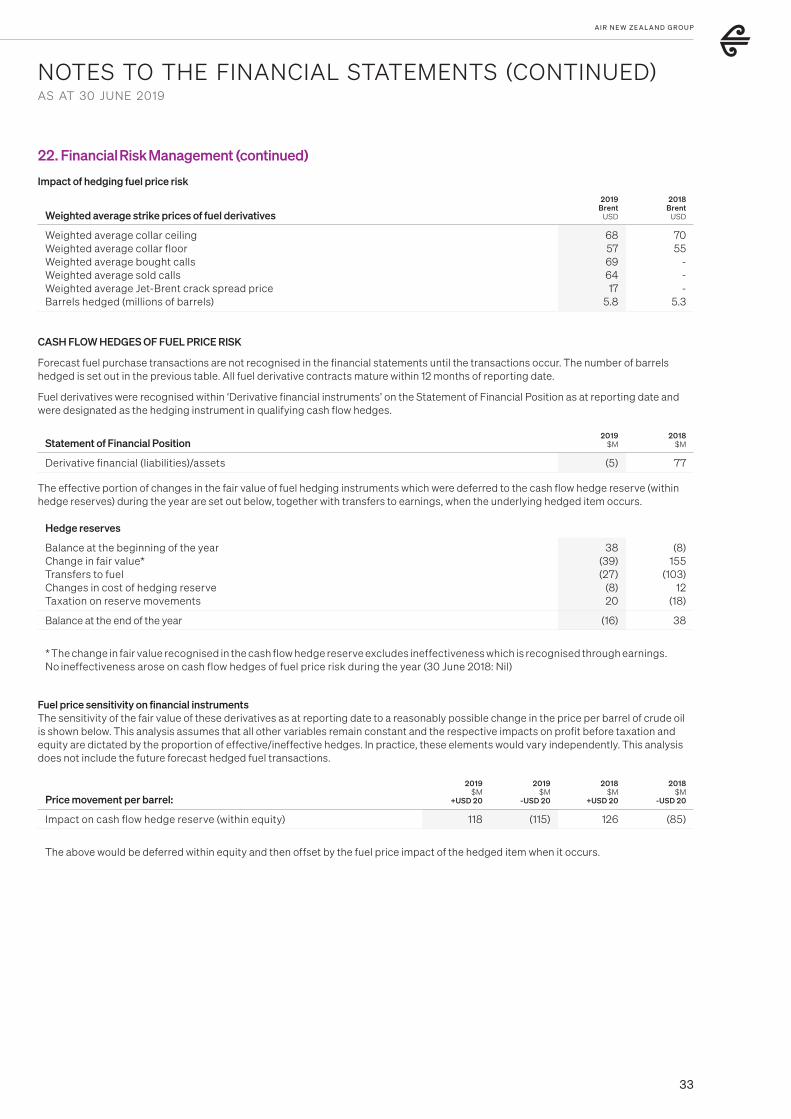
33
NOTES TO THE FINANCIAL STATEMENTS (CONTINUED)AS AT 30 JUNE 2019
A I R N E W ZE A L A N D G R O U P
22. Financial Risk Management (continued)
Impact of hedging fuel price risk
Weighted average strike prices of fuel derivatives
2019Brent
USD
2018Brent
USD
Weighted average collar ceiling Weighted average collar floor Weighted average bought calls Weighted average sold calls Weighted average Jet-Brent crack spread price Barrels hedged (millions of barrels)
68 57 69 64 17
5.8
70 55
- - -
5.3
CASH FLOW HEDGES OF FUEL PRICE RISK
Forecast fuel purchase transactions are not recognised in the financial statements until the transactions occur. The number of barrels hedged is set out in the previous table. All fuel derivative contracts mature within 12 months of reporting date.
Fuel derivatives were recognised within ‘Derivative financial instruments’ on the Statement of Financial Position as at reporting date and were designated as the hedging instrument in qualifying cash flow hedges.
Statement of Financial Position 2019
$M2018
$M
Derivative financial (liabilities)/assets (5) 77
The effective portion of changes in the fair value of fuel hedging instruments which were deferred to the cash flow hedge reserve (within hedge reserves) during the year are set out below, together with transfers to earnings, when the underlying hedged item occurs.
Hedge reserves
Balance at the beginning of the year Change in fair value* Transfers to fuel Changes in cost of hedging reserve Taxation on reserve movements
38 (39) (27)
(8) 20
(8) 155
(103) 12
(18)
Balance at the end of the year (16) 38
* The change in fair value recognised in the cash flow hedge reserve excludes ineffectiveness which is recognised through earnings. No ineffectiveness arose on cash flow hedges of fuel price risk during the year (30 June 2018: Nil)
Fuel price sensitivity on financial instrumentsThe sensitivity of the fair value of these derivatives as at reporting date to a reasonably possible change in the price per barrel of crude oil is shown below. This analysis assumes that all other variables remain constant and the respective impacts on profit before taxation and equity are dictated by the proportion of effective/ineffective hedges. In practice, these elements would vary independently. This analysis does not include the future forecast hedged fuel transactions.
Price movement per barrel:
2019$M
+USD 20
2019$M
-USD 20
2018$M
+USD 20
2018$M
-USD 20
Impact on cash flow hedge reserve (within equity) 118 (115) 126 (85)
The above would be deferred within equity and then offset by the fuel price impact of the hedged item when it occurs.

34
NOTES TO THE FINANCIAL STATEMENTS (CONTINUED)AS AT 30 JUNE 2019
A I R N E W ZE A L A N D A N N UA L F I N A N C I A L R E S U LT S 2 0 1 9
22. Financial Risk Management (continued)
INTEREST RATE RISK
Interest rate risk is the risk of loss to the Group arising from adverse fluctuations in interest rates.
The Group has exposure to interest rate risk as a result of the long-term borrowing activities which are used to fund ongoing activities. It is the Group’s policy to ensure the interest rate exposure is maintained to minimise the impact of changes in interest rates on its net floating rate long-term borrowings. The Group’s policy is to fix between 70% to 90% (30 June 2018: 70% to 100%) of its exposure to interest rates, including fixed interest operating leases, in the next 12 months. Interest rate swaps are used to achieve an appropriate mix of fixed and floating rate exposure if the volume of fixed rate loans or fixed rate operating leases is insufficient.
Impact of hedging interest rate risk
2019 2018
Interest rate derivatives Volume (USD M) Weighted average contract rate (%) Weighted average contract maturities (years)
260 2.3 0.8
150 1.7 1.4
CASH FLOW HEDGES OF INTEREST RATE RISK
The impact of changes in floating interest rates is recognised in the financial statements when the transactions occur. The volume of the floating rate interest-bearing liabilities hedged, together with contract rates and maturities are set out above.
Interest rate derivatives were recognised within ‘Derivative financial instruments’ on the Statement of Financial Position as at reporting date and were designated as the hedging instrument in qualifying cash flow hedges.
2019 $M
2018 $M
Statement of Financial Position Derivative financial (liabilities)/assets (2) 3
The effective portion of changes in the fair value of interest rate hedging instruments which were deferred to the cash flow hedge reserve (within hedge reserves) during the year are set out below, together with transfers to earnings, when the underlying hedged item occurred.
Hedge reservesBalance at the beginning of the yearChange in fair value*Transfers to finance costsTaxation on reserve movements
2 (5)
1 1
- 3 -
(1)
Balance at the end of the year (1) 2
*The change in fair value recognised in the cash flow hedge reserve is the effective portion. No ineffectiveness arose on cash flow hedges of interest rates during the year (30 June 2018: Nil).
Interest rate sensitivity on financial instrumentsEarnings are sensitive to changes in interest rates on the floating rate element of borrowings and finance lease obligations and the fair value of interest rate swaps. Their sensitivity to a reasonably possible change in interest rates with all other variables held constant, is set out over the page. This analysis assumes that the amount and mix of fixed and floating rate debt, including finance lease obligations, remains unchanged from that in place at reporting date, and that the change in interest rates is effective from the beginning of the year. In reality, the fixed/floating rate mix will fluctuate over the year and interest rates will change continually.
Interest rate change:
2019$M
+50 bp*
2019$M
-50 bp*
2018$M
+50 bp*
2018$M
-50 bp*
Impact on profit before taxationImpact on cash flow hedge reserve (within equity)
(10) (2)
10 2
(10) (1)
10 1
*bp = basis points
The impact on equity as shown above would be offset by the hedged floating interest rate exposure as it occurs.

35
NOTES TO THE FINANCIAL STATEMENTS (CONTINUED)AS AT 30 JUNE 2019
A I R N E W ZE A L A N D G R O U P
22. Financial Risk Management (continued)
Liquidity riskLiquidity risk is the risk that the Group will be unable to meet its obligations as they fall due. The Group manages the risk by targeting a minimum liquidity level, ensuring long-term commitments are managed with respect to forecast available cash inflow and managing maturity profiles. The Group holds significant cash reserves to enable it to meet its liabilities as they fall due and to sustain operations in the event of unanticipated external factors or events.
The following table sets out the contractual, undiscounted cash flows for non-derivative financial liabilities and derivative financial instruments:
STATEMENT OF FINANCIAL
POSITION$M
CONTRACTUAL CASH FLOWS
$M< 1 YEAR
$M1-2 YEARS
$M2-5 YEARS
$M5+ YEARS
$M
As at 30 June 2019 Trade and other payables Secured borrowings Unsecured bonds Finance lease obligations
585 1,459
50 1,088
585 1,602
57 1,200
585 178
2 181
- 178
2 182
- 586
53 460
- 660
- 377
Total non-derivative financial liabilities 3,182 3,444 946 362 1,099 1,037
Foreign exchange derivatives– Inflow– Outflow
2,338 (2,312)
2,338 (2,312)
- -
- -
- -
Fuel derivativesInterest rate derivatives
23 (5) (2)
26 (10) (2)
26 (10)
-
- -
(2)
- - -
- - -
Total derivative financial instruments 16 14 16 (2) - -
STATEMENT OF FINANCIAL
POSITION$M
CONTRACTUAL CASH FLOWS
$M< 1 YEAR
$M1-2 YEARS
$M2-5 YEARS
$M5+ YEARS
$M
As at 30 June 2018 Trade and other payables Secured borrowings Unsecured bonds Finance lease obligationsAmounts owing to associates
562 1,563
50 1,121
22
562 1,720
60 1,226
22
562 196
2 291 22
- 169
2 168
-
- 554
56 489
-
- 801
- 278
-
Total non-derivative financial liabilities 3,318 3,590 1,073 339 1,099 1,079
Foreign exchange derivatives– Inflow– Outflow
2,635 (2,527)
2,635 (2,527)
- -
- -
- -
Fuel derivativesInterest rate derivatives
108 77
3
108 64
5
108 64
2
- - 2
- - 1
- - -
Total derivative financial instruments 188 177 174 2 1 -
FAIR VALUE ESTIMATION
All financial instruments for which fair value is recognised or disclosed are categorised within the fair value hierarchy as described below. All financial instruments are either carried at fair value or amounts approximating fair value, with the exception of interest-bearing liabilities, for which the fair value is disclosed in Note 13 Interest-bearing liabilities. This equates to “Level 2” of the fair value hierarchy defined within NZ IFRS 13 - Fair Value Measurement. The fair value of derivative financial instruments is based on published market prices for similar assets or liabilities or market observable inputs to valuation at balance date (“Level 2” of the fair value hierarchy). The fair value of foreign currency forward contracts is determined using forward exchange rates at reporting date. The fair value of fuel swap and option agreements is determined using forward fuel prices at reporting date. The fair value of interest rate swaps is determined using forward interest rates as at reporting date.
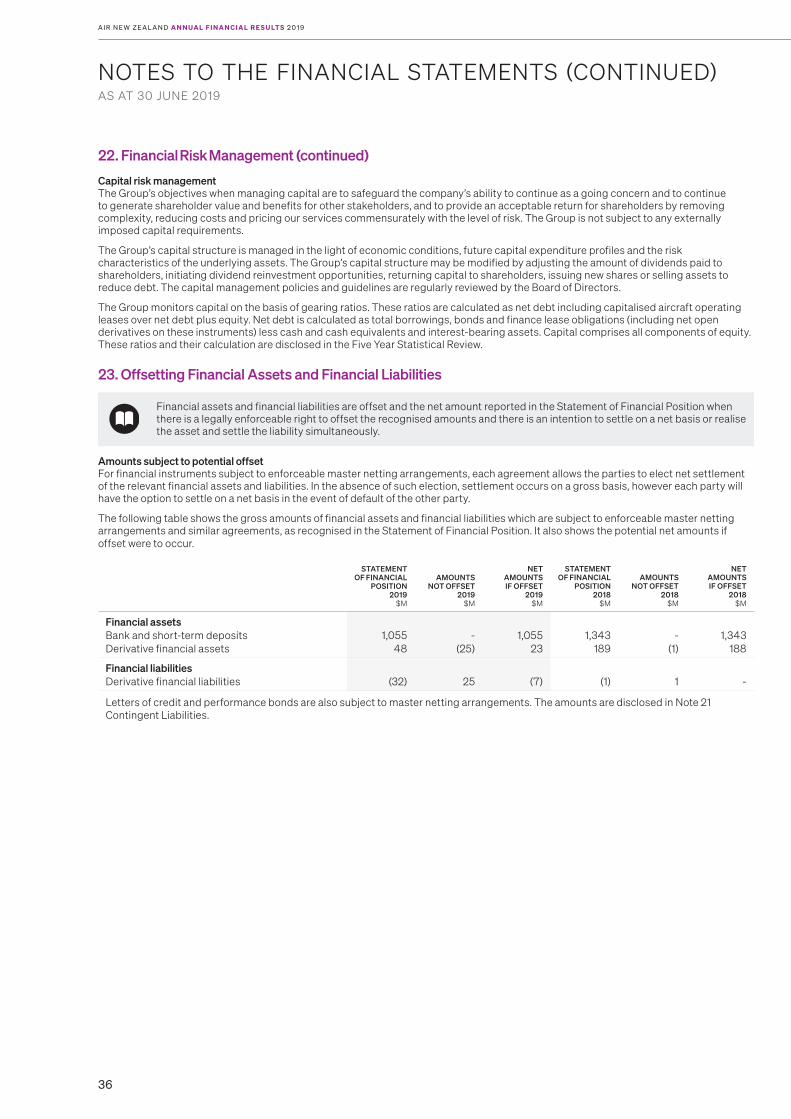
36
NOTES TO THE FINANCIAL STATEMENTS (CONTINUED)AS AT 30 JUNE 2019
A I R N E W ZE A L A N D A N N UA L F I N A N C I A L R E S U LT S 2 0 1 9
22. Financial Risk Management (continued)
Capital risk managementThe Group’s objectives when managing capital are to safeguard the company’s ability to continue as a going concern and to continue to generate shareholder value and benefits for other stakeholders, and to provide an acceptable return for shareholders by removing complexity, reducing costs and pricing our services commensurately with the level of risk. The Group is not subject to any externally imposed capital requirements.
The Group’s capital structure is managed in the light of economic conditions, future capital expenditure profiles and the risk characteristics of the underlying assets. The Group’s capital structure may be modified by adjusting the amount of dividends paid to shareholders, initiating dividend reinvestment opportunities, returning capital to shareholders, issuing new shares or selling assets to reduce debt. The capital management policies and guidelines are regularly reviewed by the Board of Directors.
The Group monitors capital on the basis of gearing ratios. These ratios are calculated as net debt including capitalised aircraft operating leases over net debt plus equity. Net debt is calculated as total borrowings, bonds and finance lease obligations (including net open derivatives on these instruments) less cash and cash equivalents and interest-bearing assets. Capital comprises all components of equity. These ratios and their calculation are disclosed in the Five Year Statistical Review.
23. Offsetting Financial Assets and Financial Liabilities
Financial assets and financial liabilities are offset and the net amount reported in the Statement of Financial Position when there is a legally enforceable right to offset the recognised amounts and there is an intention to settle on a net basis or realise the asset and settle the liability simultaneously.
Amounts subject to potential offsetFor financial instruments subject to enforceable master netting arrangements, each agreement allows the parties to elect net settlement of the relevant financial assets and liabilities. In the absence of such election, settlement occurs on a gross basis, however each party will have the option to settle on a net basis in the event of default of the other party.
The following table shows the gross amounts of financial assets and financial liabilities which are subject to enforceable master netting arrangements and similar agreements, as recognised in the Statement of Financial Position. It also shows the potential net amounts if offset were to occur.
STATEMENT OF FINANCIAL
POSITION2019
$M
AMOUNTS NOT OFFSET
2019$M
NET AMOUNTS IF OFFSET
2019$M
STATEMENT OF FINANCIAL
POSITION2018
$M
AMOUNTS NOT OFFSET
2018$M
NET AMOUNTS IF OFFSET
2018$M
Financial assets Bank and short-term deposits Derivative financial assets
1,055 48
- (25)
1,055 23
1,343 189
- (1)
1,343 188
Financial liabilities Derivative financial liabilities (32) 25 (7) (1) 1 -
Letters of credit and performance bonds are also subject to master netting arrangements. The amounts are disclosed in Note 21 Contingent Liabilities.
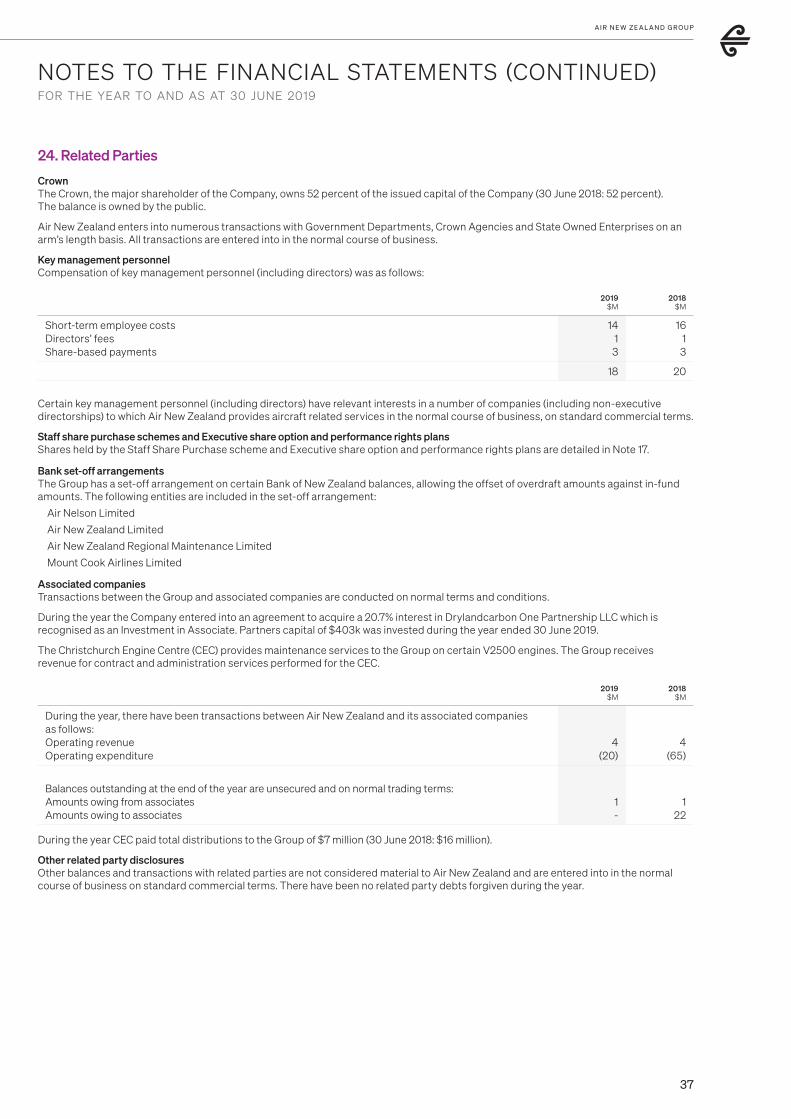
37
NOTES TO THE FINANCIAL STATEMENTS (CONTINUED)FOR THE YEAR TO AND AS AT 30 JUNE 2019
A I R N E W ZE A L A N D G R O U P
24. Related Parties
CrownThe Crown, the major shareholder of the Company, owns 52 percent of the issued capital of the Company (30 June 2018: 52 percent). The balance is owned by the public.
Air New Zealand enters into numerous transactions with Government Departments, Crown Agencies and State Owned Enterprises on an arm’s length basis. All transactions are entered into in the normal course of business.
Key management personnelCompensation of key management personnel (including directors) was as follows:
2019$M
2018$M
Short-term employee costs Directors’ fees Share-based payments
14 1 3
16 1 3
18 20
Certain key management personnel (including directors) have relevant interests in a number of companies (including non-executive directorships) to which Air New Zealand provides aircraft related services in the normal course of business, on standard commercial terms.
Staff share purchase schemes and Executive share option and performance rights plansShares held by the Staff Share Purchase scheme and Executive share option and performance rights plans are detailed in Note 17.
Bank set-off arrangementsThe Group has a set-off arrangement on certain Bank of New Zealand balances, allowing the offset of overdraft amounts against in-fund amounts. The following entities are included in the set-off arrangement:
Air Nelson Limited
Air New Zealand Limited
Air New Zealand Regional Maintenance Limited
Mount Cook Airlines Limited
Associated companiesTransactions between the Group and associated companies are conducted on normal terms and conditions.
During the year the Company entered into an agreement to acquire a 20.7% interest in Drylandcarbon One Partnership LLC which is recognised as an Investment in Associate. Partners capital of $403k was invested during the year ended 30 June 2019.
The Christchurch Engine Centre (CEC) provides maintenance services to the Group on certain V2500 engines. The Group receives revenue for contract and administration services performed for the CEC.
2019$M
2018$M
During the year, there have been transactions between Air New Zealand and its associated companies as follows:Operating revenue Operating expenditure
4
(20)
4
(65)
Balances outstanding at the end of the year are unsecured and on normal trading terms: Amounts owing from associates Amounts owing to associates
1 -
1 22
During the year CEC paid total distributions to the Group of $7 million (30 June 2018: $16 million).
Other related party disclosuresOther balances and transactions with related parties are not considered material to Air New Zealand and are entered into in the normal course of business on standard commercial terms. There have been no related party debts forgiven during the year.
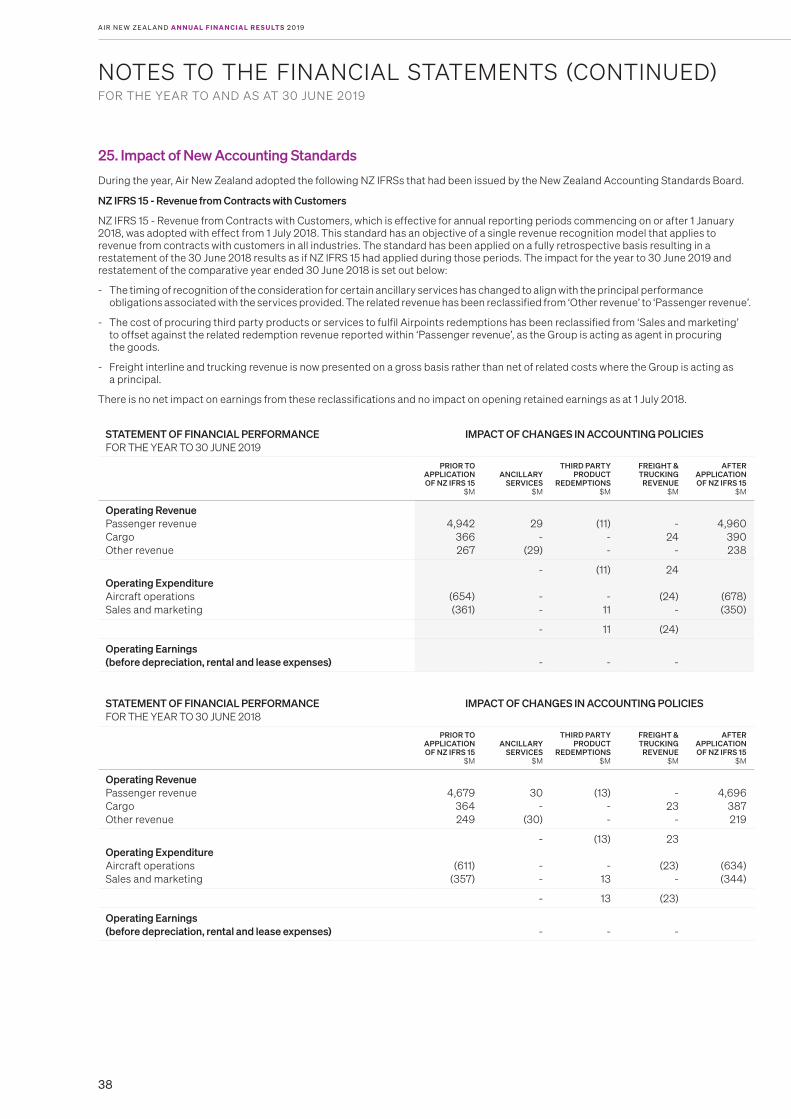
38
NOTES TO THE FINANCIAL STATEMENTS (CONTINUED)FOR THE YEAR TO AND AS AT 30 JUNE 2019
A I R N E W ZE A L A N D A N N UA L F I N A N C I A L R E S U LT S 2 0 1 9
25. Impact of New Accounting Standards
During the year, Air New Zealand adopted the following NZ IFRSs that had been issued by the New Zealand Accounting Standards Board.
NZ IFRS 15 - Revenue from Contracts with Customers
NZ IFRS 15 - Revenue from Contracts with Customers, which is effective for annual reporting periods commencing on or after 1 January 2018, was adopted with effect from 1 July 2018. This standard has an objective of a single revenue recognition model that applies to revenue from contracts with customers in all industries. The standard has been applied on a fully retrospective basis resulting in a restatement of the 30 June 2018 results as if NZ IFRS 15 had applied during those periods. The impact for the year to 30 June 2019 and restatement of the comparative year ended 30 June 2018 is set out below:
- The timing of recognition of the consideration for certain ancillary services has changed to align with the principal performance obligations associated with the services provided. The related revenue has been reclassified from ‘Other revenue’ to ‘Passenger revenue’.
- The cost of procuring third party products or services to fulfil Airpoints redemptions has been reclassified from ‘Sales and marketing’ to offset against the related redemption revenue reported within ‘Passenger revenue’, as the Group is acting as agent in procuring the goods.
- Freight interline and trucking revenue is now presented on a gross basis rather than net of related costs where the Group is acting as a principal.
There is no net impact on earnings from these reclassifications and no impact on opening retained earnings as at 1 July 2018.
STATEMENT OF FINANCIAL PERFORMANCE FOR THE YEAR TO 30 JUNE 2019
IMPACT OF CHANGES IN ACCOUNTING POLICIES
PRIOR TOAPPLICATIONOF NZ IFRS 15
$M
ANCILLARY SERVICES
$M
THIRD PARTYPRODUCT
REDEMPTIONS$M
FREIGHT &TRUCKING
REVENUE$M
AFTERAPPLICATIONOF NZ IFRS 15
$M
Operating Revenue Passenger revenue Cargo Other revenue
4,942
366 267
29
- (29)
(11)
- -
-
24 -
4,960
390 238
Operating Expenditure Aircraft operations Sales and marketing
(654) (361)
-
- -
(11)
- 11
24
(24) -
(678) (350)
- 11 (24)
Operating Earnings (before depreciation, rental and lease expenses)
- - -
STATEMENT OF FINANCIAL PERFORMANCE FOR THE YEAR TO 30 JUNE 2018
IMPACT OF CHANGES IN ACCOUNTING POLICIES
PRIOR TOAPPLICATIONOF NZ IFRS 15
$M
ANCILLARY SERVICES
$M
THIRD PARTYPRODUCT
REDEMPTIONS$M
FREIGHT &TRUCKING
REVENUE$M
AFTERAPPLICATIONOF NZ IFRS 15
$M
Operating Revenue Passenger revenue Cargo Other revenue
4,679
364 249
30
- (30)
(13)
- -
-
23 -
4,696
387 219
Operating Expenditure Aircraft operations Sales and marketing
(611) (357)
-
- -
(13)
- 13
23
(23) -
(634) (344)
- 13 (23)
Operating Earnings (before depreciation, rental and lease expenses)
- - -

39
NOTES TO THE FINANCIAL STATEMENTS (CONTINUED)FOR THE YEAR TO AND AS AT 30 JUNE 2019
A I R N E W ZE A L A N D G R O U P
25. Impact of New Accounting Standards (continued)
STATEMENT OF CASH FLOWS FOR THE YEAR TO 30 JUNE 2019
IMPACT OF CHANGES IN ACCOUNTING POLICIES
PRIOR TOAPPLICATIONOF NZ IFRS 15
$M
THIRD PARTYPRODUCT
REDEMPTIONS$M
FREIGHT &TRUCKING
REVENUE$M
AFTERAPPLICATIONOF NZ IFRS 15
$M
Cash Flows from Operating Activities Receipts from customer Payments to suppliers and employees
5,856
(4,822)
(11)
11
24 (24)
5,869 (4,835)
Net Cash Flow from Operating Activities - -
NZ IFRS - 16 Leases
NZ IFRS 16 - Leases becomes effective for annual reporting periods commencing on or after 1 January 2019 and will be adopted by the Group with effect from 1 July 2019. This standard will significantly change the accounting treatment of leases by lessees. The current dual accounting model for lessees which distinguishes between on-balance sheet finance leases and off-balance sheet operating leases, will no longer apply. Instead, there will be a single, on-balance sheet accounting model for all leases which is similar to current finance lease accounting. Lessor accounting remains similar to current practice.
This standard will have a significant impact on the financial statements, for which the key changes are set out below:
- recognition of a right of use asset and lease liability for operating leases, adjusted for any unamortised payments in advance or incentives at that date, on the Statement of Financial Position;
- recognition of depreciation and interest expense instead of operating lease rental expense in the Statement of Financial Performance;
- classification of the principal portion of lease payments as ‘Financing activities’ within the Statement of Cash Flows with the interest portion continuing to be presented within ‘Operating activities’; and
- additional foreign exchange exposure in respect of the retranslation of the additional United States Dollar (USD) denominated aircraft operating lease liabilities recognised in the Statement of Financial Position.
In accordance with the transition provisions of NZ IFRS 16, comparatives will not be restated, with the cumulative effect being recognised in opening retained earnings at the date of initial application of 1 July 2019. Right of use assets will be measured at 1 July 2019 at an amount equal to the lease liability. As permitted by NZ IFRS 16, initial direct costs have been excluded from the measurement of the right of use asset at the date of initial application and lease terms, where the lease contains options to extend or terminate the lease, have been re-determined with the benefit of hindsight.
STATEMENT OF CASH FLOWS FOR THE YEAR TO 30 JUNE 2018
IMPACT OF CHANGES IN ACCOUNTING POLICIES
PRIOR TOAPPLICATIONOF NZ IFRS 15
$M
THIRD PARTYPRODUCT
REDEMPTIONS$M
FREIGHT &TRUCKING
REVENUE$M
AFTERAPPLICATIONOF NZ IFRS 15
$M
Cash Flows from Operating Activities Receipts from customer Payments to suppliers and employees
5,434 (4,297)
(13)
13
23 (23)
5,444 (4,307)
Net Cash Flow from Operating Activities - -
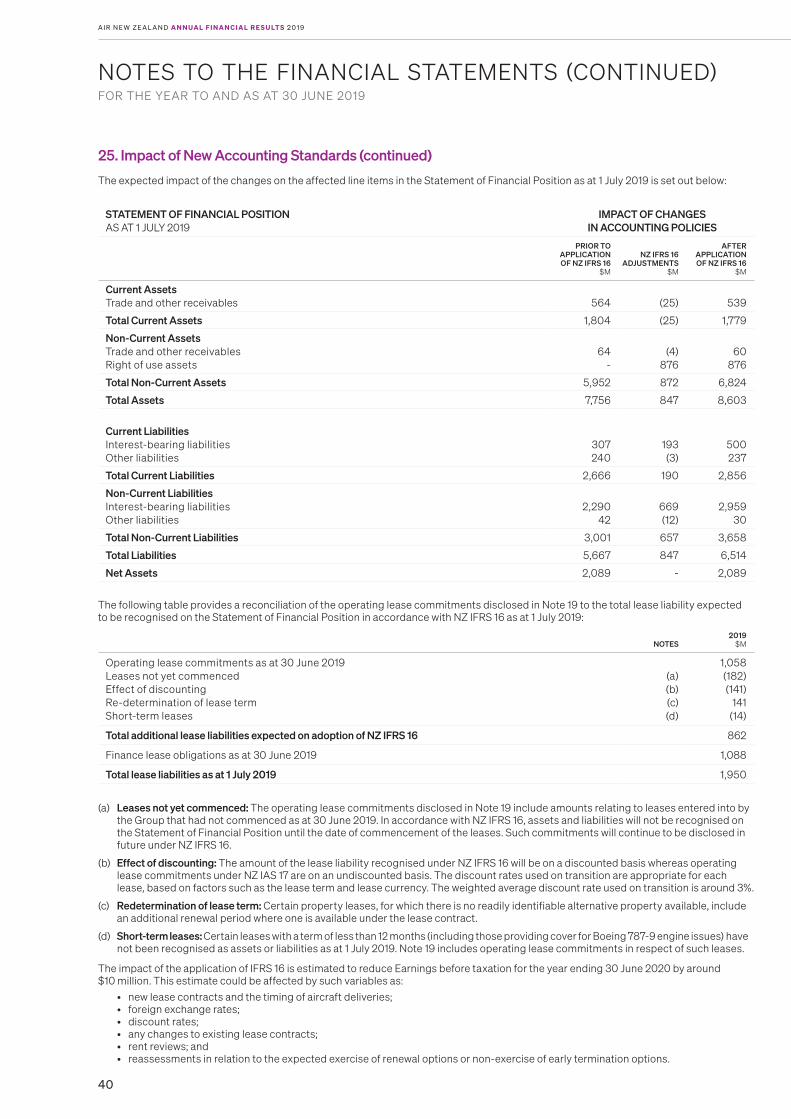
40
NOTES TO THE FINANCIAL STATEMENTS (CONTINUED)FOR THE YEAR TO AND AS AT 30 JUNE 2019
A I R N E W ZE A L A N D A N N UA L F I N A N C I A L R E S U LT S 2 0 1 9
25. Impact of New Accounting Standards (continued)
The expected impact of the changes on the affected line items in the Statement of Financial Position as at 1 July 2019 is set out below:
STATEMENT OF FINANCIAL POSITION AS AT 1 JULY 2019
IMPACT OF CHANGES IN ACCOUNTING POLICIES
PRIOR TOAPPLICATIONOF NZ IFRS 16
$M
NZ IFRS 16ADJUSTMENTS
$M
AFTERAPPLICATIONOF NZ IFRS 16
$M
Current Assets Trade and other receivables
564
(25)
539
Total Current Assets 1,804 (25) 1,779
Non-Current Assets Trade and other receivables Right of use assets
64 -
(4) 876
60 876
Total Non-Current Assets 5,952 872 6,824
Total Assets 7,756 847 8,603
Current Liabilities Interest-bearing liabilities Other liabilities
307 240
193 (3)
500 237
Total Current Liabilities 2,666 190 2,856
Non-Current Liabilities Interest-bearing liabilities Other liabilities
2,290 42
669 (12)
2,959 30
Total Non-Current Liabilities 3,001 657 3,658
Total Liabilities 5,667 847 6,514
Net Assets 2,089 - 2,089
The following table provides a reconciliation of the operating lease commitments disclosed in Note 19 to the total lease liability expected to be recognised on the Statement of Financial Position in accordance with NZ IFRS 16 as at 1 July 2019:
NOTES2019
$M
Operating lease commitments as at 30 June 2019Leases not yet commencedEffect of discountingRe-determination of lease termShort-term leases
(a)(b)(c)(d)
1,058(182)(141)
141(14)
Total additional lease liabilities expected on adoption of NZ IFRS 16 862
Finance lease obligations as at 30 June 2019 1,088
Total lease liabilities as at 1 July 2019 1,950
(a) Leases not yet commenced: The operating lease commitments disclosed in Note 19 include amounts relating to leases entered into by the Group that had not commenced as at 30 June 2019. In accordance with NZ IFRS 16, assets and liabilities will not be recognised on the Statement of Financial Position until the date of commencement of the leases. Such commitments will continue to be disclosed in future under NZ IFRS 16.
(b) Effect of discounting: The amount of the lease liability recognised under NZ IFRS 16 will be on a discounted basis whereas operating lease commitments under NZ IAS 17 are on an undiscounted basis. The discount rates used on transition are appropriate for each lease, based on factors such as the lease term and lease currency. The weighted average discount rate used on transition is around 3%.
(c) Redetermination of lease term: Certain property leases, for which there is no readily identifiable alternative property available, include an additional renewal period where one is available under the lease contract.
(d) Short-term leases: Certain leases with a term of less than 12 months (including those providing cover for Boeing 787-9 engine issues) have not been recognised as assets or liabilities as at 1 July 2019. Note 19 includes operating lease commitments in respect of such leases.
The impact of the application of IFRS 16 is estimated to reduce Earnings before taxation for the year ending 30 June 2020 by around $10 million. This estimate could be affected by such variables as:
• new lease contracts and the timing of aircraft deliveries;• foreign exchange rates;• discount rates;• any changes to existing lease contracts;• rent reviews; and• reassessments in relation to the expected exercise of renewal options or non-exercise of early termination options.

INDEPENDENT AUDITOR’S REPORT
To the Shareholders of Air New Zealand Limited
Auditor-General The Auditor-General is the auditor of Air New Zealand Limited and its subsidiaries (the Group). The Auditor-General has appointed me, Peter Gulliver, using the staff and resources of Deloitte Limited, to carry out the audit of the consolidated financial statements of the Group on his behalf.
Opinion We have audited the consolidated financial statements of the Group on pages 2 to 40, that comprise the Statement of Financial Position as at 30 June 2019, the Statement of Financial Performance, Statement of Comprehensive Income, Statement of Changes in Equity and Statement of Cash Flows for the year ended on that date and the notes to the financial statements that include accounting policies and other explanatory information.
In our opinion the consolidated financial statements present fairly, in all material respects the financial position of the Group as at 30 June 2019, and its financial performance and its cash flows for the year then ended in accordance with New Zealand Equivalents to International Financial Reporting Standards and International Financial Reporting Standards.
Our audit was completed on 22 August 2019. This is the date at which our opinion is expressed.
The basis for our opinion is explained below. In addition, we outline the responsibilities of the Board of Directors and our responsibilities relating to the consolidated financial statements, we comment on other information, and we explain our independence.
Basis for opinion We conducted our audit in accordance with the Auditor-General’s Auditing Standards, which incorporate the Professional and Ethical Standards and the International Standards on Auditing (New Zealand) issued by the New Zealand Auditing and Assurance Standards Board. Our responsibilities under those standards are further described in the Responsibilities of the auditor for the audit of the consolidated financial statements section of our report.
We have fulfilled our responsibilities in accordance with the Auditor-General’s Auditing Standards.
We believe that the audit evidence we have obtained is sufficient and appropriate to provide a basis for our opinion.
Audit materiality We consider materiality primarily in terms of the magnitude of misstatement in the consolidated financial statements of the Group that in our judgement would make it probable that the economic decisions of a reasonably knowledgeable person would be changed or influenced (the ‘quantitative’ materiality). In addition, we also assess whether other matters that come to our attention during the audit would in our judgement change or influence the decisions of such a person (the ‘qualitative’ materiality). We use materiality both in planning the scope of our audit work and in evaluating the results of our work.
We determined materiality for the consolidated financial statements as a whole to be $25m which was determined with reference to a number of factors and taking into account the cyclical nature of the airline industry. $25m represents 6.7% of profit before tax, 1.2% of total equity and 0.4% of operating revenue.
Key audit matters Key audit matters are those matters that, in our professional judgement, were of most significance in our audit of the consolidated financial statements for the current period. These matters were addressed in the context of our audit of the consolidated financial statements as a whole, and in forming our opinion thereon, and we do not provide a separate opinion on these matters.
41
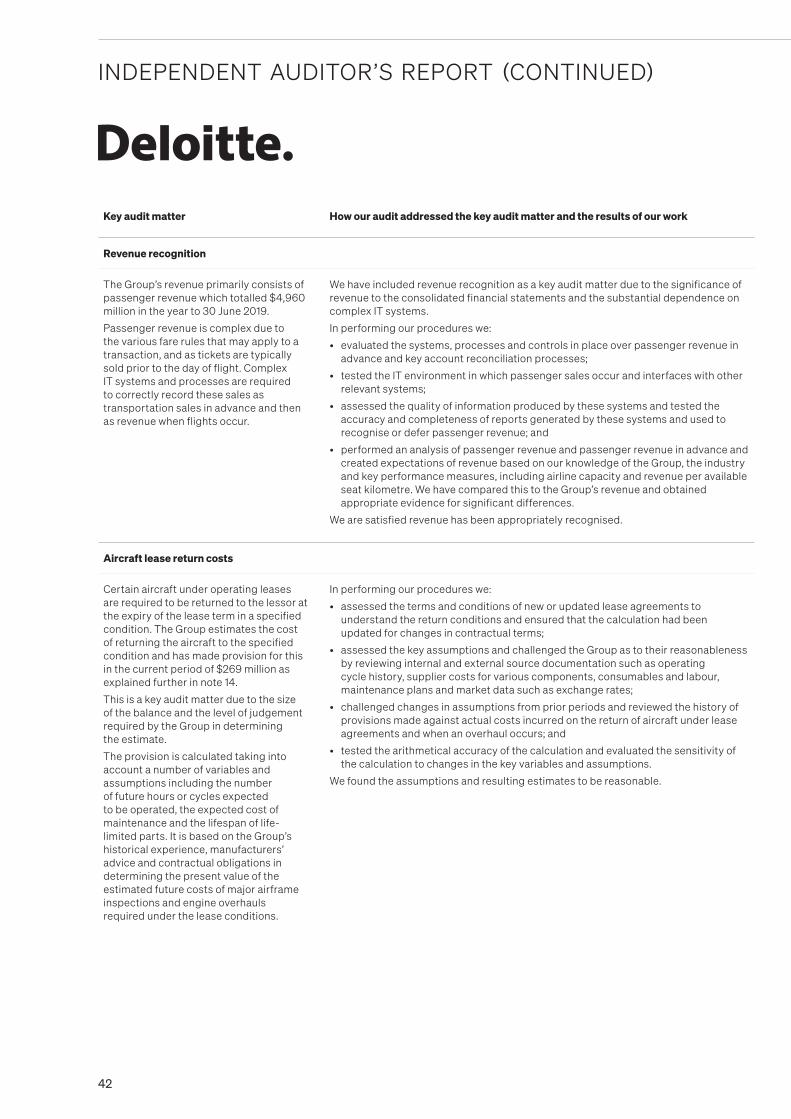
INDEPENDENT AUDITOR’S REPORT (CONTINUED)
Key audit matter How our audit addressed the key audit matter and the results of our work
Revenue recognition
The Group’s revenue primarily consists of passenger revenue which totalled $4,960 million in the year to 30 June 2019.
Passenger revenue is complex due to the various fare rules that may apply to a transaction, and as tickets are typically sold prior to the day of flight. Complex IT systems and processes are required to correctly record these sales as transportation sales in advance and then as revenue when flights occur.
We have included revenue recognition as a key audit matter due to the significance of revenue to the consolidated financial statements and the substantial dependence on complex IT systems.
In performing our procedures we:
• evaluated the systems, processes and controls in place over passenger revenue in advance and key account reconciliation processes;
• tested the IT environment in which passenger sales occur and interfaces with other relevant systems;
• assessed the quality of information produced by these systems and tested the accuracy and completeness of reports generated by these systems and used to recognise or defer passenger revenue; and
• performed an analysis of passenger revenue and passenger revenue in advance and created expectations of revenue based on our knowledge of the Group, the industry and key performance measures, including airline capacity and revenue per available seat kilometre. We have compared this to the Group’s revenue and obtained appropriate evidence for significant differences.
We are satisfied revenue has been appropriately recognised.
Aircraft lease return costs
Certain aircraft under operating leases are required to be returned to the lessor at the expiry of the lease term in a specified condition. The Group estimates the cost of returning the aircraft to the specified condition and has made provision for this in the current period of $269 million as explained further in note 14.
This is a key audit matter due to the size of the balance and the level of judgement required by the Group in determining the estimate.
The provision is calculated taking into account a number of variables and assumptions including the number of future hours or cycles expected to be operated, the expected cost of maintenance and the lifespan of life-limited parts. It is based on the Group’s historical experience, manufacturers’ advice and contractual obligations in determining the present value of the estimated future costs of major airframe inspections and engine overhauls required under the lease conditions.
In performing our procedures we:
• assessed the terms and conditions of new or updated lease agreements to understand the return conditions and ensured that the calculation had been updated for changes in contractual terms;
• assessed the key assumptions and challenged the Group as to their reasonableness by reviewing internal and external source documentation such as operating cycle history, supplier costs for various components, consumables and labour, maintenance plans and market data such as exchange rates;
• challenged changes in assumptions from prior periods and reviewed the history of provisions made against actual costs incurred on the return of aircraft under lease agreements and when an overhaul occurs; and
• tested the arithmetical accuracy of the calculation and evaluated the sensitivity of the calculation to changes in the key variables and assumptions.
We found the assumptions and resulting estimates to be reasonable.
42

43
INDEPENDENT AUDITOR’S REPORT (CONTINUED)
Key audit matter How our audit addressed the key audit matter and the results of our work
Aircraft – residual values and useful lives
Group aircraft and related assets total $4,753 million at 30 June 2019 as outlined in note 9.
The useful lives and residual values of aircraft may be influenced by external changes to economic conditions, demand, competition and new technology. The Group considers these changes when reassessing the useful lives and residual values of aircraft to determine the appropriate depreciation rates. Residual values are denominated in US$ and are sensitive to exchange rate fluctuations as well as projected values.
This is a key audit matter due to the level of judgement required by the Group in determining fleet lives and residual values which impacts carrying values and the depreciation charge.
In performing our procedures we:
• challenged the Group’s assumptions underpinning the calculation of residual values by making a comparison to external information such as third party sales prices, industry data and period end exchange rates;
• updated our assessment of the historical accuracy of assumptions around residual values when aircraft are disposed of;
• evaluated the controls in place over the calculation of depreciation, in particular around the initial input of, or changes to, residual values and useful life information; and
• undertook analytical procedures to test the depreciation calculation.
We consider the Group’s assessment of the residual values and useful lives of aircraft for use in calculating depreciation to be reasonable.
44
Responsibilities of the Board of Directors for the consolidated financial statements
The Board of Directors is responsible on behalf of the Group for preparing consolidated financial statements that are fairly presented in accordance with New Zealand Equivalents to International Financial Reporting Standards and International Financial Reporting Standards.
The Board of Directors is responsible on behalf of the Group for such internal control as it determines is necessary to enable it to prepare consolidated financial statements that are free from material misstatement, whether due to fraud or error.
In preparing the consolidated financial statements, the Board of Directors is responsible on behalf of the Group for assessing the Group’s ability to continue as a going concern. The Board of Directors is also responsible for disclosing, as applicable, matters related to going concern and using the going concern basis of accounting unless there is an intention to liquidate the Group or to cease operations, or there is no realistic alternative but to do so.
The Board of Director’s responsibilities arise from the Financial Markets Conduct Act 2013.
Responsibilities of the auditor for the audit of the consolidated financial statements
Our objectives are to obtain reasonable assurance about whether the consolidated financial statements as a whole, are free from material misstatement, whether due to fraud or error, and to issue an auditor’s report that includes our opinion.
Reasonable assurance is a high level of assurance, but is not a guarantee that an audit carried out in accordance with the Auditor-General’s Auditing Standards will always detect a material misstatement when it exists. Misstatements are differences or omissions of amounts or disclosures, and can arise from fraud or error. Misstatements are considered material if, individually or in the aggregate, they could reasonably be expected to influence the decisions of shareholders taken on the basis of these consolidated financial statements.
We did not evaluate the security and controls over the electronic publication of the consolidated financial statements.
As part of an audit in accordance with the Auditor-General’s Auditing Standards, we exercise professional judgement and maintain professional scepticism throughout the audit. Also:
• We identify and assess the risks of material misstatement of the consolidated financial statements, whether due to fraud or error, design and perform audit procedures responsive to those risks, and obtain audit evidence that is sufficient and appropriate to provide a basis for our opinion. The risk of not detecting a material misstatement resulting from fraud is higher than for one resulting from error, as fraud may involve collusion, forgery, intentional omissions, misrepresentations, or the override of internal control.
• We obtain an understanding of internal control relevant to the audit in order to design audit procedures that are appropriate in the circumstances, but not for the purpose of expressing an opinion on the effectiveness of the Group’s internal control.
• We evaluate the appropriateness of accounting policies used and the reasonableness of accounting estimates and related disclosures made by the Board of Directors.
• We conclude on the appropriateness of the use of the going concern basis of accounting by the Board of Directors and, based on the audit evidence obtained, whether a material uncertainty exists related to events or conditions that may cast significant doubt on the Group’s ability to continue as a going concern. If we conclude that a material uncertainty exists, we are required to draw attention in our auditor’s report to the related disclosures in the consolidated financial statements or, if such disclosures are inadequate, to modify our opinion. Our conclusions are based on the audit evidence obtained up to the date of our auditor’s report. However, future events or conditions may cause the Group to cease to continue as a going concern.
• We evaluate the overall presentation, structure and content of the consolidated financial statements, including the disclosures, and whether the consolidated financial statements represent the underlying transactions and events in a manner that achieves fair presentation.
• We obtain sufficient appropriate audit evidence regarding the financial information of the entities or business activities within the Group to express an opinion on the consolidated financial statements. We are responsible for the direction, supervision and performance of the Group audit. We remain solely responsible for our audit opinion.
INDEPENDENT AUDITOR’S REPORT (CONTINUED)
45
Responsibilities of the auditor for the audit of the consolidated financial statements (continued)
We communicate with the Board of Directors regarding, among other matters, the planned scope and timing of the audit and significant audit findings, including any significant deficiencies in internal control that we identify during our audit.
We also provide the directors with a statement that we have complied with relevant ethical requirements regarding independence, and communicate with them all relationships and other matters that may reasonably be thought to bear on our independence, and where applicable, related safeguards.
From the matters communicated with the Board of Directors, we determine those matters that were of most significance in the audit of the consolidated financial statements of the current period and are therefore the key audit matters. We describe these matters in our auditor’s report unless law or regulation precludes public disclosure about the matter or when, in extremely rare circumstances, we determine that a matter should not be communicated in our report because the adverse consequences of doing so would reasonably be expected to outweigh the public interest benefits of such communication.
Our responsibility arises from section 15 of the Public Audit Act 2001.
Other information The Board of Directors is responsible on behalf of the Group for all other information. The other information includes the Annual Shareholder Review and the information included with the consolidated financial statements and audit report in the Annual Financial Results. Our opinion on the consolidated financial statements does not cover the other information and we do not express any form of audit opinion or assurance conclusion thereon.
In connection with our audit of the consolidated financial statements, our responsibility is to read the other information. In doing so, we consider whether the other information is materially inconsistent with the consolidated financial statements or our knowledge obtained in the audit, or otherwise appears to be materially misstated. If, based on our work, we conclude that there is a material misstatement of this other information, we are required to report that fact. We have nothing to report in this regard.
Independence We are independent of the Group in accordance with the independence requirements of the Auditor-General’s Auditing Standards which incorporate the independence requirements of Professional and Ethical Standard 1 (Revised): Code of Ethics for Assurance Practitioners issued by the New Zealand Auditing and Assurance Standards Board and we have fulfilled our other ethical responsibilities in accordance with these requirements.
In addition to the audit we have carried out engagements in the areas of review of the interim financial statements and other assurance and non-assurance services, which are compatible with those independence requirements. In addition to these engagements, principals and employees of our firm deal with the Group on normal terms within the ordinary course of trading activities of the Group. These engagements and trading activities have not impaired our independence as auditor of the Group. Other than the audit and these engagements and trading activities, we have no relationship with, or interests in the Group.
Peter Gulliver for Deloitte Limited
On behalf of the Auditor-General Auckland, New Zealand
INDEPENDENT AUDITOR’S REPORT (CONTINUED)
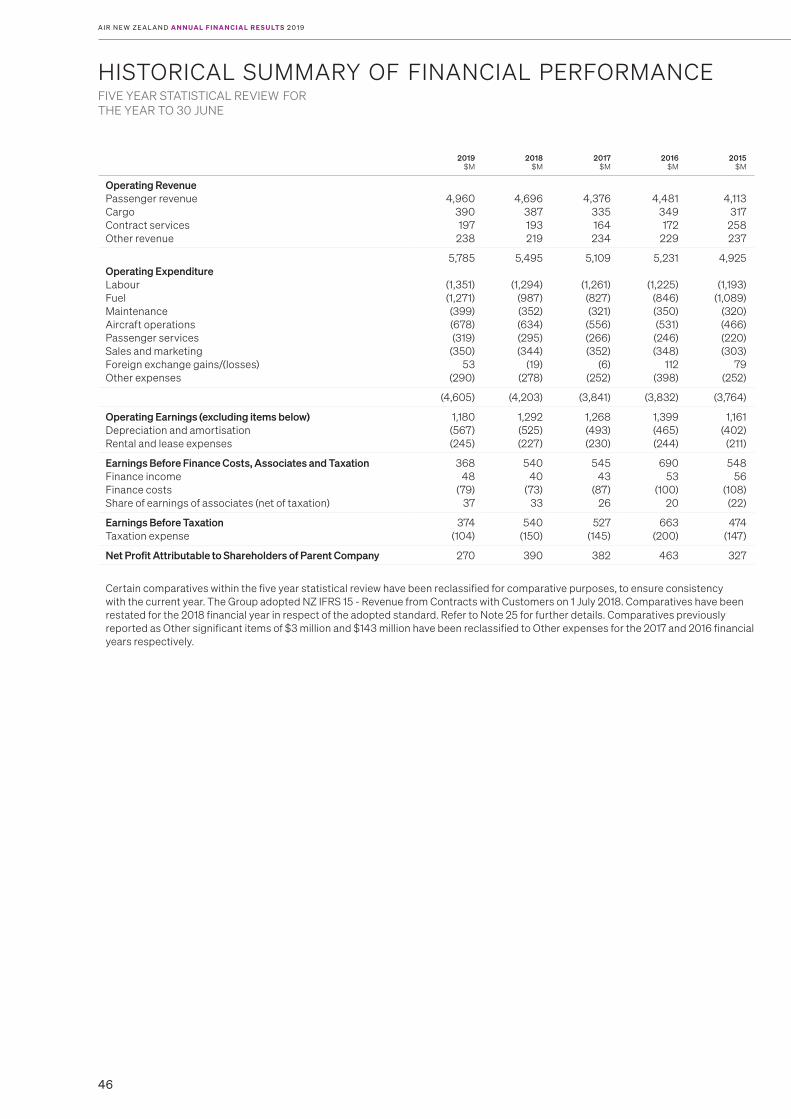
A I R N E W ZE A L A N D A N N UA L F I N A N C I A L R E S U LT S 2 0 1 9
46
2019$M
2018$M
2017$M
2016$M
2015$M
Operating Revenue Passenger revenue Cargo Contract services Other revenue
4,960 390 197
238
4,696 387 193 219
4,376 335 164 234
4,481 349 172
229
4,113
317 258 237
Operating Expenditure Labour Fuel Maintenance Aircraft operations Passenger services Sales and marketing Foreign exchange gains/(losses) Other expenses
5,785
(1,351) (1,271) (399) (678) (319)
(350) 53
(290)
5,495
(1,294) (987) (352) (634) (295) (344)
(19) (278)
5,109
(1,261) (827) (321)
(556) (266) (352)
(6) (252)
5,231
(1,225) (846) (350) (531) (246) (348)
112 (398)
4,925
(1,193) (1,089)
(320) (466) (220) (303)
79 (252)
(4,605) (4,203) (3,841) (3,832) (3,764)
Operating Earnings (excluding items below) Depreciation and amortisation Rental and lease expenses
1,180 (567) (245)
1,292 (525) (227)
1,268 (493) (230)
1,399 (465) (244)
1,161 (402)
(211)
Earnings Before Finance Costs, Associates and Taxation Finance income Finance costsShare of earnings of associates (net of taxation)
368 48
(79) 37
540 40
(73) 33
54543
(87) 26
690 53
(100) 20
54856
(108) (22)
Earnings Before TaxationTaxation expense
374 (104)
540 (150)
527 (145)
663 (200)
474 (147)
Net Profit Attributable to Shareholders of Parent Company 270 390 382 463 327
Certain comparatives within the five year statistical review have been reclassified for comparative purposes, to ensure consistency with the current year. The Group adopted NZ IFRS 15 - Revenue from Contracts with Customers on 1 July 2018. Comparatives have been restated for the 2018 financial year in respect of the adopted standard. Refer to Note 25 for further details. Comparatives previously reported as Other significant items of $3 million and $143 million have been reclassified to Other expenses for the 2017 and 2016 financial years respectively.
HISTORICAL SUMMARY OF FINANCIAL PERFORMANCE FIVE YEAR STATISTICAL REVIEW FOR THE YEAR TO 30 JUNE

A I R N E W ZE A L A N D G R O U P
47
2019$M
2018$M
2017$M
2016$M
2015$M
Current AssetsBank and short-term depositsOther current assets
1,055
749
1,343
910
1,369
518
1,594
745 1,321
661
Total Current Assets 1,804 2,253 1,887 2,339 1,982
Non-Current AssetsProperty, plant and equipmentOther non-current assets
5,268 684
5,035 558
4,745 539
4,485 427
4,061 732
Total Non-Current Assets 5,952 5,593 5,284 4,912 4,793
Total Assets 7,756 7,846 7,171 7,251 6,775
Current LiabilitiesDebt1
Other current liabilities 307
2,359 431
2,265 317
2,088 464
2,007 253
1,875
Total Current Liabilities 2,666 2,696 2,405 2,471 2,128
Non-Current LiabilitiesDebt1
Other non-current liabilities 2,290
711 2,303
671 2,197
583 2,103
569 2,069
613
Total Non-Current Liabilities 3,001 2,974 2,780 2,672 2,682
Total Liabilities 5,667 5,670 5,185 5,143 4,810
Net Assets 2,089 2,176 1,986 2,108 1,965
Total Equity 2,089 2,176 1,986 2,108 1,965
1. Debt is comprised of secured borrowings, bonds and finance lease liabilities.
HISTORICAL SUMMARY OF FINANCIAL POSITION FIVE YEAR STATISTICAL REVIEW AS AT 30 JUNE
2019$M
2018$M
2017$M
2016$M
2015$M
Cash flow from operating activities Cash flow from investing activities Cash flow from financing activities
986 (883) (391)
1,031 (778) (279)
904(616) (513)
1,074 (797)
(4)
1,100 (1,066)
53
(Decrease)/increase in cash holding (288) (26) (225) 273 87
Total cash and cash equivalents 1,055 1,343 1,369 1,594 1,321
Certain comparatives within the five year statistical review have been reclassified for comparative purposes, to ensure consistency with the current year.
HISTORICAL SUMMARY OF CASH FLOWS FIVE YEAR STATISTICAL REVIEW FOR THE YEAR TO 30 JUNE
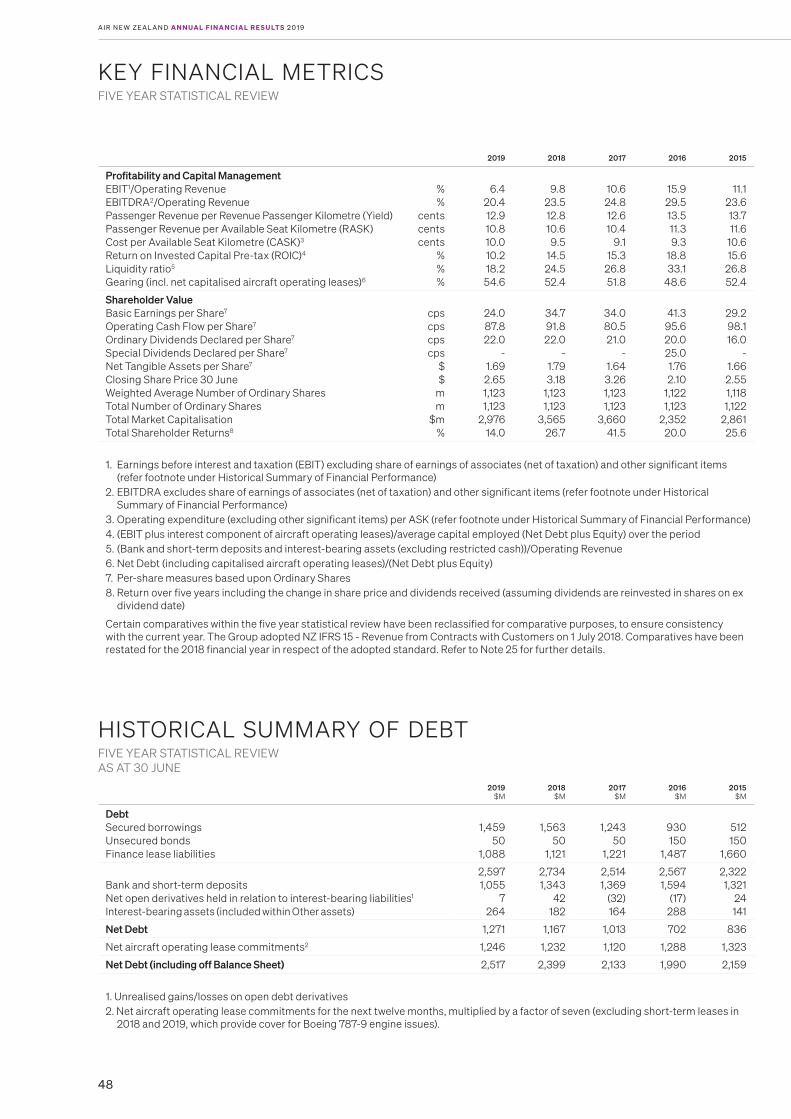
A I R N E W ZE A L A N D A N N UA L F I N A N C I A L R E S U LT S 2 0 1 9
48
2019 2018 2017 2016 2015
Profitability and Capital Management EBIT1/Operating RevenueEBITDRA2/Operating RevenuePassenger Revenue per Revenue Passenger Kilometre (Yield)Passenger Revenue per Available Seat Kilometre (RASK)
Cost per Available Seat Kilometre (CASK)3
Return on Invested Capital Pre-tax (ROIC)4
Liquidity ratio5
Gearing (incl. net capitalised aircraft operating leases)6
%%
centscentscents
%%%
6.4 20.4 12.9 10.8 10.0 10.2 18.2 54.6
9.8 23.5 12.8 10.6 9.5
14.5 24.5 52.4
10.6 24.8 12.6 10.4
9.1 15.3
26.8 51.8
15.9 29.5 13.5 11.3 9.3
18.8 33.1
48.6
11.1 23.6
13.7 11.6
10.6 15.6
26.8 52.4
Shareholder Value Basic Earnings per Share7
Operating Cash Flow per Share7
Ordinary Dividends Declared per Share7
Special Dividends Declared per Share7
Net Tangible Assets per Share7
Closing Share Price 30 JuneWeighted Average Number of Ordinary SharesTotal Number of Ordinary SharesTotal Market CapitalisationTotal Shareholder Returns8
cpscpscpscps
$$
mm
$m%
24.0 87.8 22.0
- 1.69 2.65 1,123 1,123
2,976 14.0
34.7 91.8 22.0
- 1.79 3.18
1,123 1,123
3,565 26.7
34.0 80.5
21.0 -
1.64 3.26 1,123 1,123
3,660 41.5
41.3 95.6 20.025.0 1.76 2.10
1,122 1,123
2,352 20.0
29.2 98.1 16.0
- 1.66 2.55 1,118 1,122
2,861 25.6
1. Earnings before interest and taxation (EBIT) excluding share of earnings of associates (net of taxation) and other significant items (refer footnote under Historical Summary of Financial Performance)
2. EBITDRA excludes share of earnings of associates (net of taxation) and other significant items (refer footnote under Historical Summary of Financial Performance)
3. Operating expenditure (excluding other significant items) per ASK (refer footnote under Historical Summary of Financial Performance)4. (EBIT plus interest component of aircraft operating leases)/average capital employed (Net Debt plus Equity) over the period5. (Bank and short-term deposits and interest-bearing assets (excluding restricted cash))/Operating Revenue6. Net Debt (including capitalised aircraft operating leases)/(Net Debt plus Equity)7. Per-share measures based upon Ordinary Shares8. Return over five years including the change in share price and dividends received (assuming dividends are reinvested in shares on ex
dividend date)
Certain comparatives within the five year statistical review have been reclassified for comparative purposes, to ensure consistency with the current year. The Group adopted NZ IFRS 15 - Revenue from Contracts with Customers on 1 July 2018. Comparatives have been restated for the 2018 financial year in respect of the adopted standard. Refer to Note 25 for further details.
KEY FINANCIAL METRICSFIVE YEAR STATISTICAL REVIEW
2019$M
2018$M
2017$M
2016$M
2015$M
DebtSecured borrowingsUnsecured bondsFinance lease liabilities
1,459 50
1,088
1,563 50
1,121
1,243 50
1,221
930 150
1,487
512 150
1,660
Bank and short-term depositsNet open derivatives held in relation to interest-bearing liabilities1
Interest-bearing assets (included within Other assets)
2,597 1,055
7 264
2,734 1,343
42 182
2,514 1,369
(32) 164
2,567 1,594
(17) 288
2,322 1,321
24 141
Net Debt 1,271 1,167 1,013 702 836
Net aircraft operating lease commitments2 1,246 1,232 1,120 1,288 1,323
Net Debt (including off Balance Sheet) 2,517 2,399 2,133 1,990 2,159
1. Unrealised gains/losses on open debt derivatives2. Net aircraft operating lease commitments for the next twelve months, multiplied by a factor of seven (excluding short-term leases in
2018 and 2019, which provide cover for Boeing 787-9 engine issues).
HISTORICAL SUMMARY OF DEBTFIVE YEAR STATISTICAL REVIEW AS AT 30 JUNE

A I R N E W ZE A L A N D G R O U P
49
2019 2018 2017 2016 2015
Passengers Carried (000)Domestic 11,513 11,089 10,379 9,725 9,246
InternationalAustralia and Pacific IslandsAsiaAmerica and Europe
4,044 914
1,267
3,798 837
1,242
3,561 814
1,198
3,507 791
1,138
3,388 642
1,021
Total 6,225 5,877 5,573 5,436 5,051
Total Group 17,738 16,966 15,952 15,161 14,297
Available Seat Kilometres (M)Domestic 7,104 6,905 6,597 6,065 5,592
InternationalAustralia and Pacific IslandsAsiaAmerica and Europe
13,640 9,699
15,586
12,963 9,169
15,237
12,039 8,918
14,615
11,438 8,349
13,832
10,888 7,022
12,099
Total 38,925 37,369 35,572 33,619 30,009
Total Group 46,029 44,274 42,169 39,684 35,601
Revenue Passenger Kilometres (M)Domestic 5,957 5,719 5,311 4,887 4,561
InternationalAustralia and Pacific IslandsAsiaAmerica and Europe
11,195 8,140
13,281
10,584 7,467
12,892
9,784 7,270
12,449
9,532 7,070 11,734
9,184 5,784
10,405
Total 32,616 30,943 29,503 28,336 25,373
Total Group 38,573 36,662 34,814 33,223 29,934
Passenger Load Factor (%)Domestic 83.9 82.8 80.5 80.6 81.6
InternationalAustralia and Pacific IslandsAsiaAmerica and Europe
82.1 83.9 85.2
81.6 81.4
84.6
81.3 81.5
85.2
83.3 84.7 84.8
84.4 82.4 86.0
Total 83.8 83.4 83.8 84.3 84.6
Total Group 83.8 82.8 82.6 83.7 84.1
GROUP EMPLOYEE NUMBERS (Full Time Equivalents) 11,793 11,074 10,890 10,527 10,196
New Zealand, Australia and Pacific Islands represent short-haul operations. Asia, America and Europe represent long-haul operations.
KEY OPERATING STATISTICSFIVE YEAR STATISTICAL REVIEW FOR THE YEAR TO 30 JUNE
A I R N E W ZE A L A N D A N N UA L F I N A N C I A L R E S U LT S 2 0 1 9
50
The Board of Air New Zealand considers strong corporate governance to be a critical component of the overall performance of the Company, and a contributor to superior performance and achieving best outcomes for its shareholders, customers, employees and the wider community. Consistent with this philosophy, policies and processes are in place to establish, shape and maintain appropriate governance standards and behaviours throughout the Company.
The Board has had regard to a number of corporate governance statements, including the Institute of Directors’ Code of Practice and the New Zealand Corporate Governance Forum’s Guidelines. While Air New Zealand no longer has a requirement to report against the ASX’s Corporate Governance Principles and Recommendations, these continue to inform the Board’s approach to governance. The NZX Listing Rules require the Company to report against the NZX Corporate Governance Code.
Air New Zealand transitioned to the new NZX Listing Rules on 1 July 2019.
This Corporate Governance Statement follows the structure of the NZX Corporate Governance Code and addresses its Recommendations. The Board considers its governance practices to be consistent with the Code’s Principles.
This Corporate Governance Statement was approved by the Board on 21 August 2019 and is current as at that date.
Code of Ethical Behaviour
“Directors should set high standards of ethical behaviour, model this behaviour and hold management accountable for these standards being followed throughout the organisation.”
Air New Zealand is committed to the highest standards of social and environmental responsibility and ethical conduct. This is good for our customers, our shareholders, our wider community and our Company. The Board acknowledges it (as a whole), and each director individually, has a role to play in guiding and modelling the high ethical standards that we want to pervade the whole organisation. It is recognised that codification of ethical principles, whether in a Code of Conduct, policies or elsewhere, is only a baseline, and tools like the brand values, strategic pillars, and leadership behaviours help to create an ingrained ethical culture.
Code of Conduct
Air New Zealand has a well-established Code of Conduct, as a statement of our guiding principles of ethical and legal conduct. The Code of Conduct applies to everyone working at or for Air New Zealand – directors, executives, employees, contractors and agents.
The Code of Conduct forms part of the induction process for all new employees, and is available online. Employees must provide acknowledgement that they have read and understood the content both when joining and on an annual basis.
The Code of Conduct is high-level in nature, and provides clear guidance, supported by practical examples, across a range of ethical and legal matters, including:
• Health, safety and well-being
• People, diversity and inclusion
• Airline security and business disruption management
• Gifts and entertainment
• External communications
• Use of business resources
• Personal information and privacy
• Sustainability and sponsorship
• Conflicts of interest
• Inducements and bribes
• Continuous disclosure
• Insider trading
Mechanisms are provided for the safe reporting of breaches of the Code or other policies or laws, and the consequences of non-compliance are made explicit.
Related Documents
The Code of Conduct is supplemented by a number of other documents, including the Board Charter and specific policies on key matters. Collectively, these documents address all the matters specified in the NZX Corporate Governance Code.
In addition to the high-level guidance in the Code of Conduct, specific policies provide a further layer of management, particularly in more technical areas. For example, Air New Zealand has a Securities Trading Policy which identifies behaviours that are illegal, unacceptable or risky in relation to dealings in Air New Zealand’s securities by directors, employees or their associated persons. Without taking away ultimate responsibility of the individuals for their trading activities, the policy provides a framework that reduces the potential for insider trading. Training is provided to staff on this policy, and no material policy breaches have been reported during the 2019 reporting period.
The ethical approach adopted within the Group is complemented by a Supplier Code of Conduct, outlining the minimum standards and expectations applicable to all suppliers of goods and services to Air New Zealand. The Supplier Code addresses labour and human rights, health and safety, environmental sustainability, ethical business, security, information security, risk management and commercial sustainability.
Initiatives and metrics on a range of sustainability matters relating to social, environmental and economic factors are reported in Air New Zealand’s Sustainability Report.
CORPORATE GOVERNANCE STATEMENT
A I R N E W ZE A L A N D G R O U P
51
Air New Zealand makes these documents, and other significant governance documents tabulated below, available on its website.
Constitution/Charters Policies
• Constitution
• Board Charter
• Audit Committee Charter
• Funding Committee Charter
• Health, Safety and Security Committee Charter
• People Remuneration and Diversity Committee Charter
• Anti-bribery and corruption policy
• Audit independence policy
• Continuous disclosure policy
• Distribution policy
• Equality, diversity and inclusion policy
• Risk management policy
• Securities trading policy
Codes of Conduct Other Documents
• Employee Code of Conduct
• Supplier Code of Conduct
• Sustainability Report
• Palm oil position statement
• Slavery and human trafficking statement
Board Composition and Performance
“To ensure an effective Board, there should be a balance of independence, skills, knowledge, experience and perspectives.”
Responsibilities of the Board
The Board has responsibility for taking appropriate steps to protect and enhance the value of the assets of Air New Zealand in the best interests of the Company and its shareholders.
The Board has adopted a formal Board Charter detailing its authority, responsibilities, membership and operation which is published on Air New Zealand’s website.
Management Delegation
The business and affairs of Air New Zealand are managed under the direction of the Board. The Board is responsible for guiding the corporate strategy and direction of Air New Zealand and has overall responsibility for decision making. The Board delegates to the Chief Executive Officer responsibility for implementing the Board’s strategy and for managing the operations of Air New Zealand. The Chief Executive Officer in turn sub-delegates authority to the Chief Financial Officer, the Executive management team and senior management. These delegated authorisation levels are subject to Board approval, internal and external audit.
Chairman
Tony Carter has been Chairman of Air New Zealand since 27 September 2013. Jan Dawson was appointed Deputy Chairman on 27 September 2013. The Chairman’s role includes ensuring the Board is well informed and effective, acting as the link between the Board and the Chief Executive Officer and ensuring effective communication with shareholders.
The Board Charter makes explicit that the Chairman and the Chief Executive Officer roles are separate.
Tony Carter will be resigning as Chairman after the 2019 Annual Shareholder Meeting. Dame Therese Walsh has been elected by the Board to succeed him.
Company Secretary
The General Counsel and Company Secretary is accountable directly to the Board, through the Chairman, on all matters to do with the proper functioning of the Board.
Director Independence
The Board has identified criteria in its Charter, against which it evaluates the independence of directors. These are designed to ensure directors are not unduly influenced in their decisions and activities by any personal, family or business interests.
All directors have been determined to be Independent Directors under these criteria, and for the purposes of the NZX Listing Rules. Directors are required to inform the Board of all relevant information which may affect their independence and the Board reconfirms the independence status of its members annually.
CORPORATE GOVERNANCE STATEMENT (CONTINUED)
Board Cadence7 physical Board meetings
5 teleconference meetings
15 committee meetings
1 offshore market visit
1 local visit
6 strategy/deep dive sessions
Recent Focus Areas• Sustainability/carbon pricing
• Operations review
• Strategic alliances and routes
• Widebody fleet
• Electric fleet
• Regional strategy
• Fuel price/continuity of supply
• Delegated Financial Authority
• NZX Listing Rule review
• Constitutional amendments
• Group Risk Profile refresh

A I R N E W ZE A L A N D A N N UA L F I N A N C I A L R E S U LT S 2 0 1 9
52
Board Structure, Skills and Composition
The role of the Board in the governance of Air New Zealand requires its members to bring a range of skills and experience to the table, to be able to challenge, support, monitor, mentor, guide and inspire management, and to ensure Air New Zealand is and continues to be a business that its owners, customers, employees and the wider public, can be proud of.
The skills and experience represented on the Board are summarised in the diagram below:
Executive Leadership Financial Tourism
Engineering/Safety Digital/Technology Governance
International Business Government & Stakeholder Customer Experience
Details of each director’s experience, independence, and interests are published on the Air New Zealand website.
Strategic Competencies
The Board has reviewed and restated the competencies and attributes it considers appropriate to support the Company’s strategic direction, and assessed the extent to which these exist across the current membership. The Board evaluation process, undertaken with an external consultant, assisted in this exercise. The competencies form an important part of the criteria used in the review and development of existing directors, and in the recruitment of new directors. As the Company itself develops, the specific strategic competencies will change and be addressed as the Board refreshes itself, and some gap between the identified strategic competencies and a snapshot of current capability is usually to be expected.
The Board works to ensure these competencies are adequately addressed in its membership, and notes it is generally not necessary or practical for every director to individually demonstrate these: competency depth may be as relevant as breadth.
The specific qualifications, skills and experience of current directors are separately discussed in the biographies of each director.
Diversity and Inclusion
The Board is resolutely committed to fostering a diverse and inclusive culture throughout the Group. It recognises the fresh perspectives and innovation that a diverse workforce brings and the importance of reflecting the diversity of our customers which ultimately leads to stronger connections and business performance. Diversity and Inclusion sits within the roles and responsibilities set out in the Charter for the Board’s People, Remuneration and Diversity Committee.
Air New Zealand is making strong progress in delivering the four Diversity and Inclusion priorities outlined in its Diversity & Inclusion Strategy to 2020 being:
• Attract and recruit diverse talent.
• Develop our diverse workforce.
• Create a culture where everybody thrives.
• Future-proof our business (retention and transition).
Attract and Recruit Diverse Talent
As at 30 June 2019, 14.8% of our leadership roles were held by Māori and Pasifika. We aim to increase this to 20% by 2022. Our Māori and Pasifika strategy includes partnering with the organisation Indigenous Growth to deliver “Mangopare”, a robust Māori and Pasifika leadership development programme which commenced in July 2019 with 16 participants. Our partnership with Champions of Change’s TupuToa internship programme will continue for a further three years, promoting and encouraging young Māori and Pasifika into corporate careers.
We continue to focus on improving inclusion and accessibility for people with disabilities, and on creating more opportunities for youth. In May 2019 we developed a strategic partnership with Queenstown Resort College (QRC) at its Paihia campus to foster study and career pathways for youth across regional New Zealand through a range of programmes and scholarships, as well as work experience with us. The first QRC intern began in July 2019. This aligns with the youth and tourism initiatives within our social and economic sustainability pillars.
Develop our Diverse Workforce
Gender equality and greater female representation on the Senior Leadership Team (SLT) remains a key priority. At 30 June 2019, female representation was at 44%, tracking well towards our updated target of 50% female representation in the SLT by 2020. Recent appointments include a female Senior Fleet Manager within Pilots and a female Chief Digital Officer.
We continue to address the underrepresentation of women in male dominated professions through the following groups:
• Women in Digital – This network supports ‘Shadowtech’, providing leadership shadowing and work experience for female digital students in partnership with the Manukau Institute of Technology.
• Women in Engineering – A network focused on promoting engineering careers to female youth. The network hosted a familiarisation visit for female students in June to acknowledge International Women in Engineering day, followed by a panel to provide opportunity for students to hear from female engineers, engineering managers and senior leaders in our business.
• Women Inspiring the Next Generation of Female Pilots (WINGS) network – Focused on attraction, inclusion and leadership for female pilots and aspiring pilots.
Working relationships have been established with the Careers and Transition Education Association, Women in Government network and the New Zealand Defence Force.
CORPORATE GOVERNANCE STATEMENT (CONTINUED)
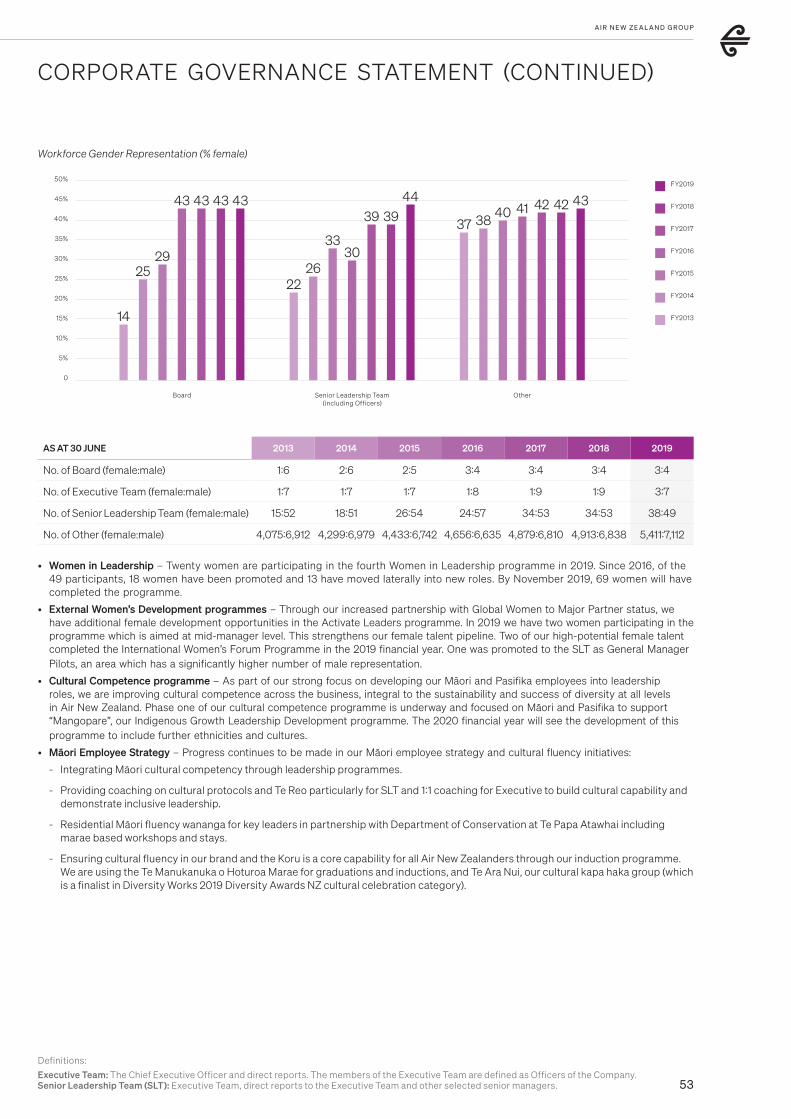
A I R N E W ZE A L A N D G R O U P
53
Board
50%
45%
40%
35%
30%
25%
20%
15%
10%
5%
0
OtherSenior Leadership Team(including Officers)
Workforce Gender Representation (% female)
FY2016
FY2015
FY2014
FY2013
FY2017
2226
3330
14
2529
37 3840 41 42
3943 FY201842
39
FY2019
43 43 4343 44
AS AT 30 JUNE 2013 2014 2015 2016 2017 2018 2019
No. of Board (female:male) 1:6 2:6 2:5 3:4 3:4 3:4 3:4
No. of Executive Team (female:male) 1:7 1:7 1:7 1:8 1:9 1:9 3:7
No. of Senior Leadership Team (female:male) 15:52 18:51 26:54 24:57 34:53 34:53 38:49
No. of Other (female:male) 4,075:6,912 4,299:6,979 4,433:6,742 4,656:6,635 4,879:6,810 4,913:6,838 5,411:7,112
• Women in Leadership – Twenty women are participating in the fourth Women in Leadership programme in 2019. Since 2016, of the 49 participants, 18 women have been promoted and 13 have moved laterally into new roles. By November 2019, 69 women will have completed the programme.
• External Women’s Development programmes – Through our increased partnership with Global Women to Major Partner status, we have additional female development opportunities in the Activate Leaders programme. In 2019 we have two women participating in the programme which is aimed at mid-manager level. This strengthens our female talent pipeline. Two of our high-potential female talent completed the International Women’s Forum Programme in the 2019 financial year. One was promoted to the SLT as General Manager Pilots, an area which has a significantly higher number of male representation.
• Cultural Competence programme – As part of our strong focus on developing our Māori and Pasifika employees into leadership roles, we are improving cultural competence across the business, integral to the sustainability and success of diversity at all levels in Air New Zealand. Phase one of our cultural competence programme is underway and focused on Māori and Pasifika to support “Mangopare”, our Indigenous Growth Leadership Development programme. The 2020 financial year will see the development of this programme to include further ethnicities and cultures.
• Māori Employee Strategy – Progress continues to be made in our Māori employee strategy and cultural fluency initiatives:
- Integrating Māori cultural competency through leadership programmes.
- Providing coaching on cultural protocols and Te Reo particularly for SLT and 1:1 coaching for Executive to build cultural capability and demonstrate inclusive leadership.
- Residential Māori fluency wananga for key leaders in partnership with Department of Conservation at Te Papa Atawhai including marae based workshops and stays.
- Ensuring cultural fluency in our brand and the Koru is a core capability for all Air New Zealanders through our induction programme. We are using the Te Manukanuka o Hoturoa Marae for graduations and inductions, and Te Ara Nui, our cultural kapa haka group (which is a finalist in Diversity Works 2019 Diversity Awards NZ cultural celebration category).
Definitions:
Executive Team: The Chief Executive Officer and direct reports. The members of the Executive Team are defined as Officers of the Company.Senior Leadership Team (SLT): Executive Team, direct reports to the Executive Team and other selected senior managers.
CORPORATE GOVERNANCE STATEMENT (CONTINUED)
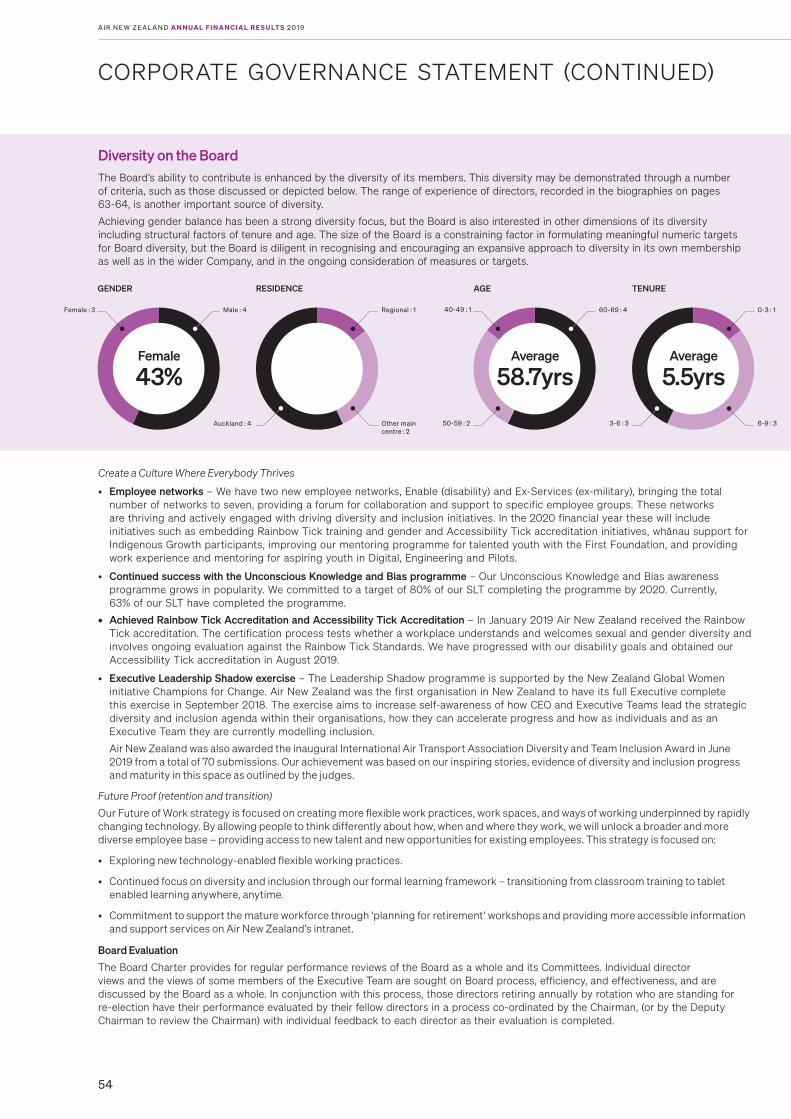
A I R N E W ZE A L A N D A N N UA L F I N A N C I A L R E S U LT S 2 0 1 9
54
Create a Culture Where Everybody Thrives
• Employee networks – We have two new employee networks, Enable (disability) and Ex-Services (ex-military), bringing the total number of networks to seven, providing a forum for collaboration and support to specific employee groups. These networks are thriving and actively engaged with driving diversity and inclusion initiatives. In the 2020 financial year these will include initiatives such as embedding Rainbow Tick training and gender and Accessibility Tick accreditation initiatives, whānau support for Indigenous Growth participants, improving our mentoring programme for talented youth with the First Foundation, and providing work experience and mentoring for aspiring youth in Digital, Engineering and Pilots.
• Continued success with the Unconscious Knowledge and Bias programme – Our Unconscious Knowledge and Bias awareness programme grows in popularity. We committed to a target of 80% of our SLT completing the programme by 2020. Currently, 63% of our SLT have completed the programme.
• Achieved Rainbow Tick Accreditation and Accessibility Tick Accreditation – In January 2019 Air New Zealand received the Rainbow Tick accreditation. The certification process tests whether a workplace understands and welcomes sexual and gender diversity and involves ongoing evaluation against the Rainbow Tick Standards. We have progressed with our disability goals and obtained our Accessibility Tick accreditation in August 2019.
• Executive Leadership Shadow exercise – The Leadership Shadow programme is supported by the New Zealand Global Women initiative Champions for Change. Air New Zealand was the first organisation in New Zealand to have its full Executive complete this exercise in September 2018. The exercise aims to increase self-awareness of how CEO and Executive Teams lead the strategic diversity and inclusion agenda within their organisations, how they can accelerate progress and how as individuals and as an Executive Team they are currently modelling inclusion.
Air New Zealand was also awarded the inaugural International Air Transport Association Diversity and Team Inclusion Award in June 2019 from a total of 70 submissions. Our achievement was based on our inspiring stories, evidence of diversity and inclusion progress and maturity in this space as outlined by the judges.
Future Proof (retention and transition)
Our Future of Work strategy is focused on creating more flexible work practices, work spaces, and ways of working underpinned by rapidly changing technology. By allowing people to think differently about how, when and where they work, we will unlock a broader and more diverse employee base – providing access to new talent and new opportunities for existing employees. This strategy is focused on:
• Exploring new technology-enabled flexible working practices.
• Continued focus on diversity and inclusion through our formal learning framework – transitioning from classroom training to tablet enabled learning anywhere, anytime.
• Commitment to support the mature workforce through ‘planning for retirement’ workshops and providing more accessible information and support services on Air New Zealand’s intranet.
Board Evaluation
The Board Charter provides for regular performance reviews of the Board as a whole and its Committees. Individual director views and the views of some members of the Executive Team are sought on Board process, efficiency, and effectiveness, and are discussed by the Board as a whole. In conjunction with this process, those directors retiring annually by rotation who are standing for re-election have their performance evaluated by their fellow directors in a process co-ordinated by the Chairman, (or by the Deputy Chairman to review the Chairman) with individual feedback to each director as their evaluation is completed.
CORPORATE GOVERNANCE STATEMENT (CONTINUED)
Diversity on the BoardThe Board’s ability to contribute is enhanced by the diversity of its members. This diversity may be demonstrated through a number of criteria, such as those discussed or depicted below. The range of experience of directors, recorded in the biographies on pages 63-64, is another important source of diversity.
Achieving gender balance has been a strong diversity focus, but the Board is also interested in other dimensions of its diversity including structural factors of tenure and age. The size of the Board is a constraining factor in formulating meaningful numeric targets for Board diversity, but the Board is diligent in recognising and encouraging an expansive approach to diversity in its own membership as well as in the wider Company, and in the ongoing consideration of measures or targets.
Male : 4
GENDER
Female
43%
Female : 3 60-69 : 4
AGE
Average
58.7yrs
40-49 : 1
50-59 : 2
TENURE
3-6 : 3
Average
5.5yrs
0-3 : 1
6-9 : 3
RESIDENCE
Auckland : 4
Regional : 1
Other main centre : 2
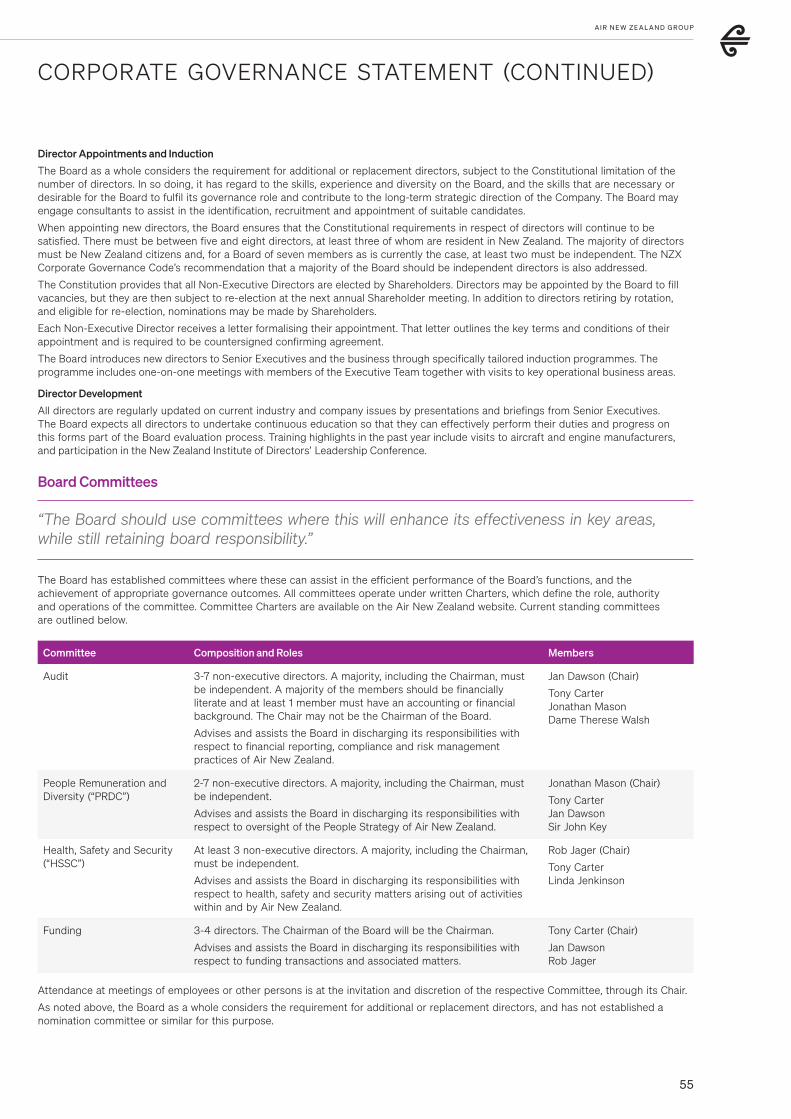
A I R N E W ZE A L A N D G R O U P
55
Director Appointments and Induction
The Board as a whole considers the requirement for additional or replacement directors, subject to the Constitutional limitation of the number of directors. In so doing, it has regard to the skills, experience and diversity on the Board, and the skills that are necessary or desirable for the Board to fulfil its governance role and contribute to the long-term strategic direction of the Company. The Board may engage consultants to assist in the identification, recruitment and appointment of suitable candidates.
When appointing new directors, the Board ensures that the Constitutional requirements in respect of directors will continue to be satisfied. There must be between five and eight directors, at least three of whom are resident in New Zealand. The majority of directors must be New Zealand citizens and, for a Board of seven members as is currently the case, at least two must be independent. The NZX Corporate Governance Code’s recommendation that a majority of the Board should be independent directors is also addressed.
The Constitution provides that all Non-Executive Directors are elected by Shareholders. Directors may be appointed by the Board to fill vacancies, but they are then subject to re-election at the next annual Shareholder meeting. In addition to directors retiring by rotation, and eligible for re-election, nominations may be made by Shareholders.
Each Non-Executive Director receives a letter formalising their appointment. That letter outlines the key terms and conditions of their appointment and is required to be countersigned confirming agreement.
The Board introduces new directors to Senior Executives and the business through specifically tailored induction programmes. The programme includes one-on-one meetings with members of the Executive Team together with visits to key operational business areas.
Director Development
All directors are regularly updated on current industry and company issues by presentations and briefings from Senior Executives. The Board expects all directors to undertake continuous education so that they can effectively perform their duties and progress on this forms part of the Board evaluation process. Training highlights in the past year include visits to aircraft and engine manufacturers, and participation in the New Zealand Institute of Directors’ Leadership Conference.
Board Committees
“The Board should use committees where this will enhance its effectiveness in key areas, while still retaining board responsibility.”
The Board has established committees where these can assist in the efficient performance of the Board’s functions, and the achievement of appropriate governance outcomes. All committees operate under written Charters, which define the role, authority and operations of the committee. Committee Charters are available on the Air New Zealand website. Current standing committees are outlined below.
Committee Composition and Roles Members
Audit 3-7 non-executive directors. A majority, including the Chairman, must be independent. A majority of the members should be financially literate and at least 1 member must have an accounting or financial background. The Chair may not be the Chairman of the Board.
Advises and assists the Board in discharging its responsibilities with respect to financial reporting, compliance and risk management practices of Air New Zealand.
Jan Dawson (Chair)
Tony Carter Jonathan Mason Dame Therese Walsh
People Remuneration and Diversity (“PRDC”)
2-7 non-executive directors. A majority, including the Chairman, must be independent.
Advises and assists the Board in discharging its responsibilities with respect to oversight of the People Strategy of Air New Zealand.
Jonathan Mason (Chair)
Tony Carter Jan Dawson Sir John Key
Health, Safety and Security (“HSSC”)
At least 3 non-executive directors. A majority, including the Chairman, must be independent.
Advises and assists the Board in discharging its responsibilities with respect to health, safety and security matters arising out of activities within and by Air New Zealand.
Rob Jager (Chair)
Tony Carter Linda Jenkinson
Funding 3-4 directors. The Chairman of the Board will be the Chairman.
Advises and assists the Board in discharging its responsibilities with respect to funding transactions and associated matters.
Tony Carter (Chair)
Jan Dawson Rob Jager
Attendance at meetings of employees or other persons is at the invitation and discretion of the respective Committee, through its Chair.
As noted above, the Board as a whole considers the requirement for additional or replacement directors, and has not established a nomination committee or similar for this purpose.
CORPORATE GOVERNANCE STATEMENT (CONTINUED)
0-3 : 1
6-9 : 3
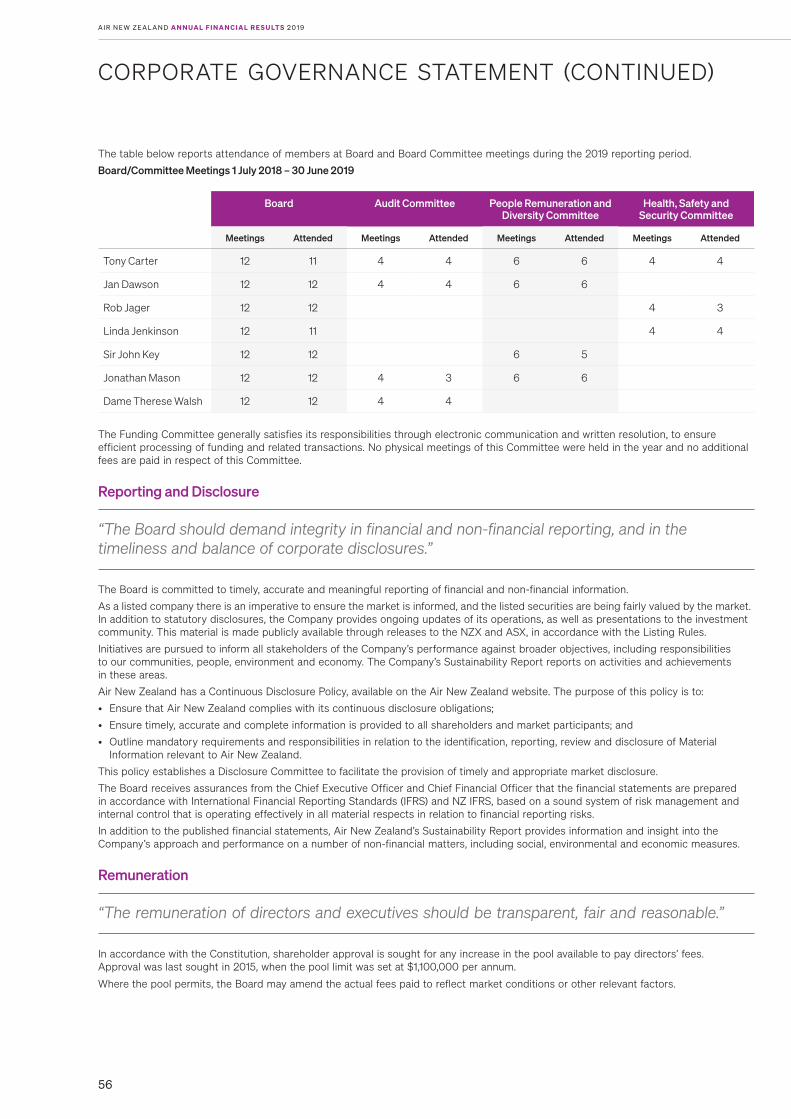
A I R N E W ZE A L A N D A N N UA L F I N A N C I A L R E S U LT S 2 0 1 9
56
The table below reports attendance of members at Board and Board Committee meetings during the 2019 reporting period.
Board/Committee Meetings 1 July 2018 – 30 June 2019
Board Audit Committee People Remuneration and Diversity Committee
Health, Safety and Security Committee
Meetings Attended Meetings Attended Meetings Attended Meetings Attended
Tony Carter 12 11 4 4 6 6 4 4
Jan Dawson 12 12 4 4 6 6
Rob Jager 12 12 4 3
Linda Jenkinson 12 11 4 4
Sir John Key 12 12 6 5
Jonathan Mason 12 12 4 3 6 6
Dame Therese Walsh 12 12 4 4
The Funding Committee generally satisfies its responsibilities through electronic communication and written resolution, to ensure efficient processing of funding and related transactions. No physical meetings of this Committee were held in the year and no additional fees are paid in respect of this Committee.
Reporting and Disclosure
“The Board should demand integrity in financial and non-financial reporting, and in the timeliness and balance of corporate disclosures.”
The Board is committed to timely, accurate and meaningful reporting of financial and non-financial information.
As a listed company there is an imperative to ensure the market is informed, and the listed securities are being fairly valued by the market. In addition to statutory disclosures, the Company provides ongoing updates of its operations, as well as presentations to the investment community. This material is made publicly available through releases to the NZX and ASX, in accordance with the Listing Rules.
Initiatives are pursued to inform all stakeholders of the Company’s performance against broader objectives, including responsibilities to our communities, people, environment and economy. The Company’s Sustainability Report reports on activities and achievements in these areas.
Air New Zealand has a Continuous Disclosure Policy, available on the Air New Zealand website. The purpose of this policy is to:
• Ensure that Air New Zealand complies with its continuous disclosure obligations;
• Ensure timely, accurate and complete information is provided to all shareholders and market participants; and
• Outline mandatory requirements and responsibilities in relation to the identification, reporting, review and disclosure of Material Information relevant to Air New Zealand.
This policy establishes a Disclosure Committee to facilitate the provision of timely and appropriate market disclosure.
The Board receives assurances from the Chief Executive Officer and Chief Financial Officer that the financial statements are prepared in accordance with International Financial Reporting Standards (IFRS) and NZ IFRS, based on a sound system of risk management and internal control that is operating effectively in all material respects in relation to financial reporting risks.
In addition to the published financial statements, Air New Zealand’s Sustainability Report provides information and insight into the Company’s approach and performance on a number of non-financial matters, including social, environmental and economic measures.
Remuneration
“The remuneration of directors and executives should be transparent, fair and reasonable.”
In accordance with the Constitution, shareholder approval is sought for any increase in the pool available to pay directors’ fees. Approval was last sought in 2015, when the pool limit was set at $1,100,000 per annum.
Where the pool permits, the Board may amend the actual fees paid to reflect market conditions or other relevant factors.
CORPORATE GOVERNANCE STATEMENT (CONTINUED)
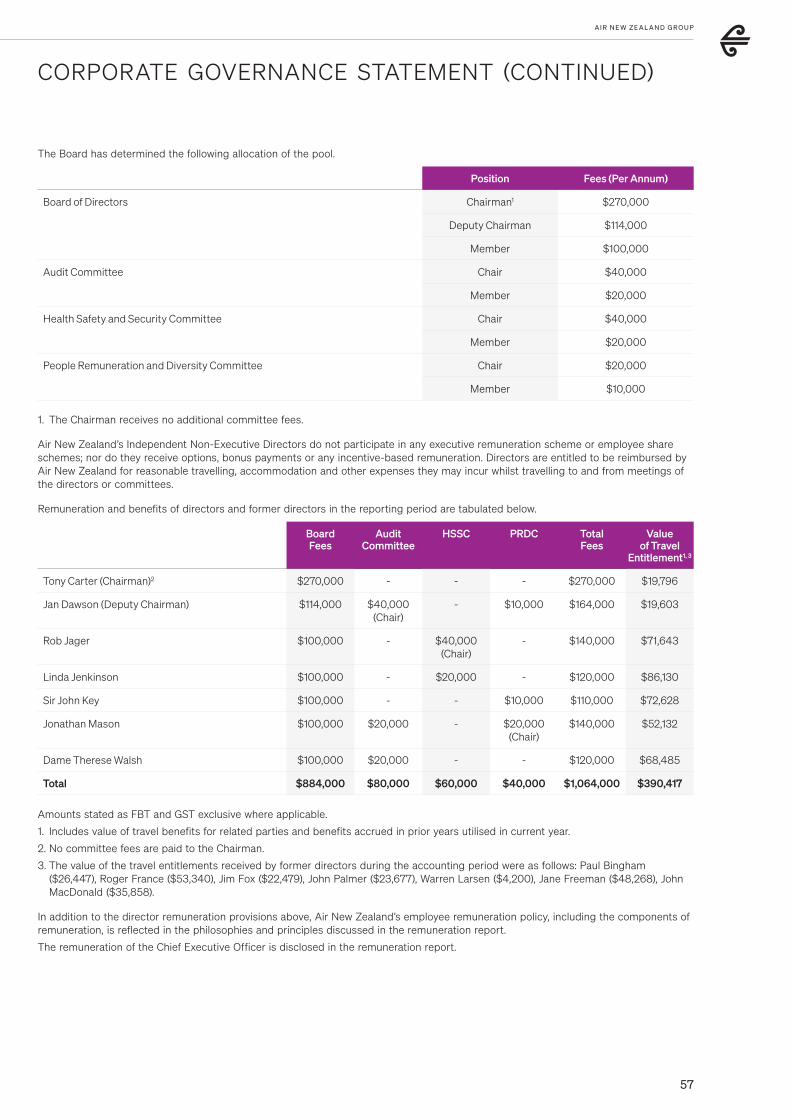
A I R N E W ZE A L A N D G R O U P
57
The Board has determined the following allocation of the pool.
Position Fees (Per Annum)
Board of Directors Chairman1 $270,000
Deputy Chairman $114,000
Member $100,000
Audit Committee Chair $40,000
Member $20,000
Health Safety and Security Committee Chair $40,000
Member $20,000
People Remuneration and Diversity Committee Chair $20,000
Member $10,000
1. The Chairman receives no additional committee fees.
Air New Zealand’s Independent Non-Executive Directors do not participate in any executive remuneration scheme or employee share schemes; nor do they receive options, bonus payments or any incentive-based remuneration. Directors are entitled to be reimbursed by Air New Zealand for reasonable travelling, accommodation and other expenses they may incur whilst travelling to and from meetings of the directors or committees.
Remuneration and benefits of directors and former directors in the reporting period are tabulated below.
Board Fees
Audit Committee
HSSC PRDC Total Fees
Value of Travel
Entitlement1, 3
Tony Carter (Chairman)2 $270,000 - - - $270,000 $19,796
Jan Dawson (Deputy Chairman) $114,000 $40,000(Chair)
- $10,000 $164,000 $19,603
Rob Jager $100,000 - $40,000 (Chair)
- $140,000 $71,643
Linda Jenkinson $100,000 - $20,000 - $120,000 $86,130
Sir John Key $100,000 - - $10,000 $110,000 $72,628
Jonathan Mason $100,000 $20,000 - $20,000 (Chair)
$140,000 $52,132
Dame Therese Walsh $100,000 $20,000 - - $120,000 $68,485
Total $884,000 $80,000 $60,000 $40,000 $1,064,000 $390,417
Amounts stated as FBT and GST exclusive where applicable.
1. Includes value of travel benefits for related parties and benefits accrued in prior years utilised in current year.
2. No committee fees are paid to the Chairman.
3. The value of the travel entitlements received by former directors during the accounting period were as follows: Paul Bingham ($26,447), Roger France ($53,340), Jim Fox ($22,479), John Palmer ($23,677), Warren Larsen ($4,200), Jane Freeman ($48,268), John MacDonald ($35,858).
In addition to the director remuneration provisions above, Air New Zealand’s employee remuneration policy, including the components of remuneration, is reflected in the philosophies and principles discussed in the remuneration report.
The remuneration of the Chief Executive Officer is disclosed in the remuneration report.
CORPORATE GOVERNANCE STATEMENT (CONTINUED)
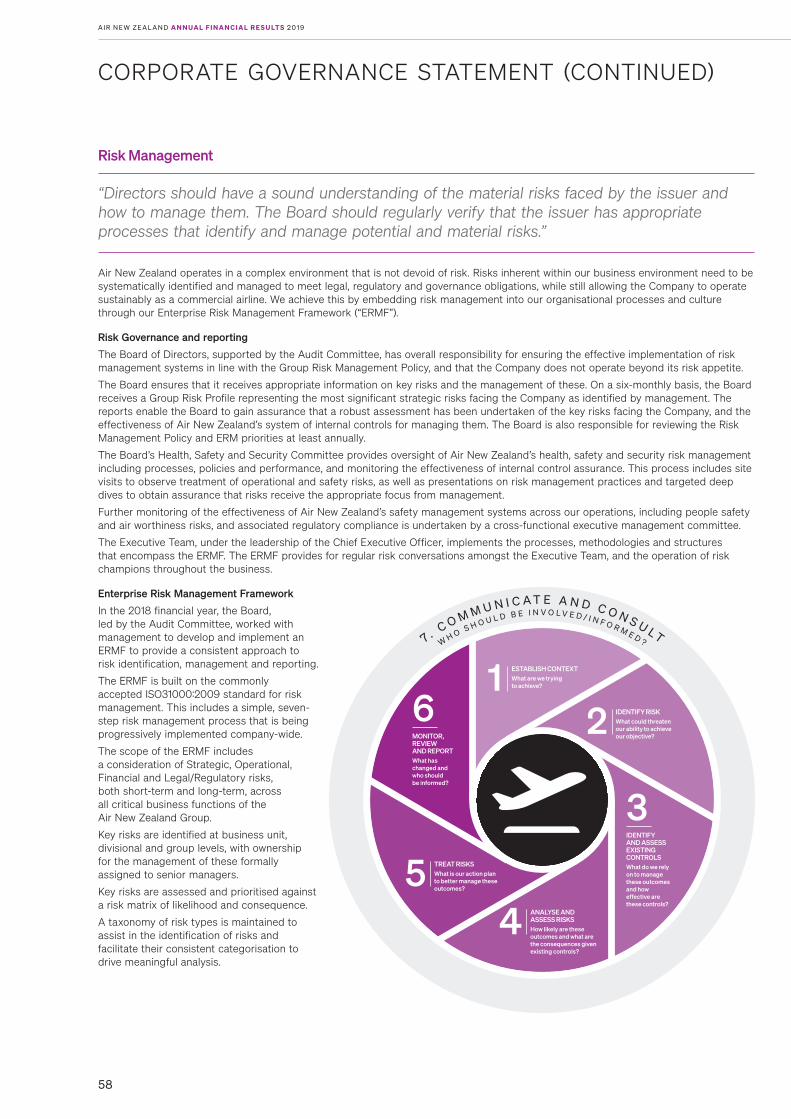
A I R N E W ZE A L A N D A N N UA L F I N A N C I A L R E S U LT S 2 0 1 9
58
CORPORATE GOVERNANCE STATEMENT (CONTINUED)
Risk Management
“Directors should have a sound understanding of the material risks faced by the issuer and how to manage them. The Board should regularly verify that the issuer has appropriate processes that identify and manage potential and material risks.”
Air New Zealand operates in a complex environment that is not devoid of risk. Risks inherent within our business environment need to be systematically identified and managed to meet legal, regulatory and governance obligations, while still allowing the Company to operate sustainably as a commercial airline. We achieve this by embedding risk management into our organisational processes and culture through our Enterprise Risk Management Framework (“ERMF”).
Risk Governance and reporting
The Board of Directors, supported by the Audit Committee, has overall responsibility for ensuring the effective implementation of risk management systems in line with the Group Risk Management Policy, and that the Company does not operate beyond its risk appetite.
The Board ensures that it receives appropriate information on key risks and the management of these. On a six-monthly basis, the Board receives a Group Risk Profile representing the most significant strategic risks facing the Company as identified by management. The reports enable the Board to gain assurance that a robust assessment has been undertaken of the key risks facing the Company, and the effectiveness of Air New Zealand’s system of internal controls for managing them. The Board is also responsible for reviewing the Risk Management Policy and ERM priorities at least annually.
The Board’s Health, Safety and Security Committee provides oversight of Air New Zealand’s health, safety and security risk management including processes, policies and performance, and monitoring the effectiveness of internal control assurance. This process includes site visits to observe treatment of operational and safety risks, as well as presentations on risk management practices and targeted deep dives to obtain assurance that risks receive the appropriate focus from management.
Further monitoring of the effectiveness of Air New Zealand’s safety management systems across our operations, including people safety and air worthiness risks, and associated regulatory compliance is undertaken by a cross-functional executive management committee.
The Executive Team, under the leadership of the Chief Executive Officer, implements the processes, methodologies and structures that encompass the ERMF. The ERMF provides for regular risk conversations amongst the Executive Team, and the operation of risk champions throughout the business.
Enterprise Risk Management Framework
In the 2018 financial year, the Board, led by the Audit Committee, worked with management to develop and implement an ERMF to provide a consistent approach to risk identification, management and reporting.
The ERMF is built on the commonly accepted ISO31000:2009 standard for risk management. This includes a simple, seven-step risk management process that is being progressively implemented company-wide.
The scope of the ERMF includes a consideration of Strategic, Operational, Financial and Legal/Regulatory risks, both short-term and long-term, across all critical business functions of the Air New Zealand Group.
Key risks are identified at business unit, divisional and group levels, with ownership for the management of these formally assigned to senior managers.
Key risks are assessed and prioritised against a risk matrix of likelihood and consequence.
A taxonomy of risk types is maintained to assist in the identification of risks and facilitate their consistent categorisation to drive meaningful analysis.
ESTABLISH CONTEXTWhat are we trying to achieve?1
IDENTIFY RISKWhat could threaten our ability to achieve our objective?
2
ANALYSE AND ASSESS RISKSHow likely are these outcomes and what are the consequences given existing controls?
4
TREAT RISKSWhat is our action plan to better manage these outcomes?
5
MONITOR, REVIEW AND REPORTWhat has changed and who should be informed?
6
IDENTIFY AND ASSESS EXISTING CONTROLSWhat do we rely on to manage these outcomes and how effective are these controls?
3
7 . C O M M U N I C A T E A N D C O N S U L TW
H O S H O U L D B E I N V O L V E D / I N F O R M E D ?
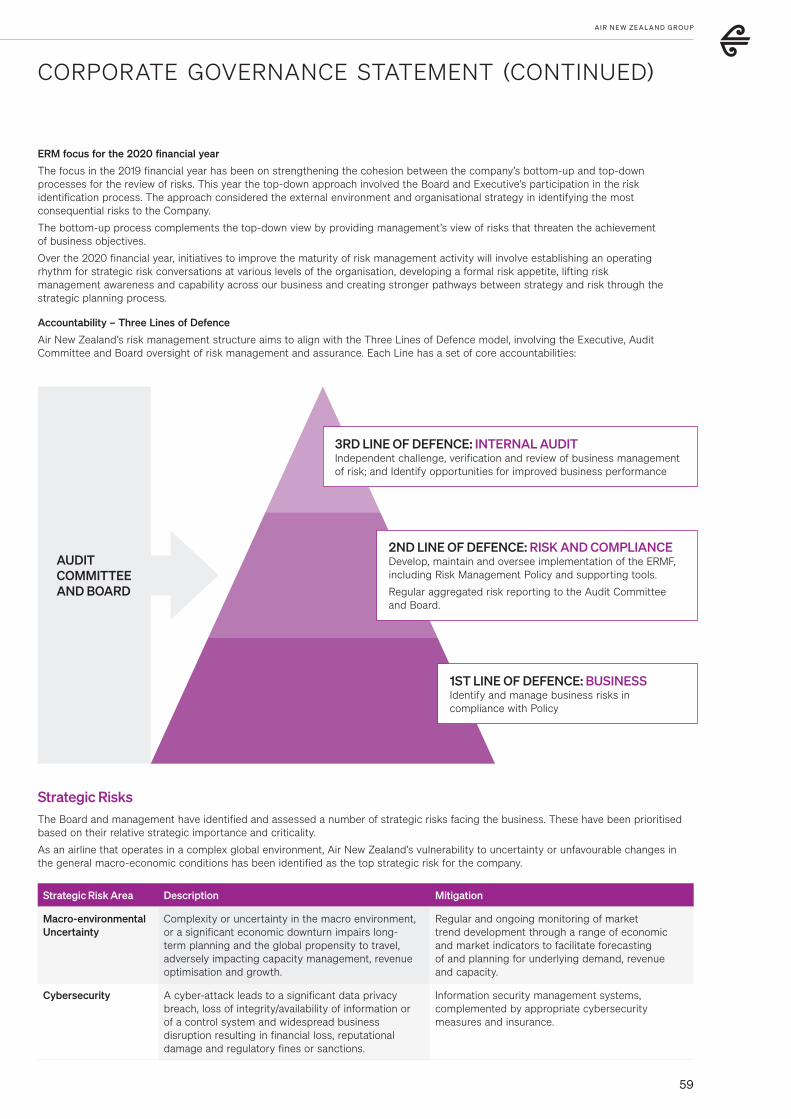
A I R N E W ZE A L A N D G R O U P
59
CORPORATE GOVERNANCE STATEMENT (CONTINUED)
ERM focus for the 2020 financial year
The focus in the 2019 financial year has been on strengthening the cohesion between the company’s bottom-up and top-down processes for the review of risks. This year the top-down approach involved the Board and Executive’s participation in the risk identification process. The approach considered the external environment and organisational strategy in identifying the most consequential risks to the Company.
The bottom-up process complements the top-down view by providing management’s view of risks that threaten the achievement of business objectives.
Over the 2020 financial year, initiatives to improve the maturity of risk management activity will involve establishing an operating rhythm for strategic risk conversations at various levels of the organisation, developing a formal risk appetite, lifting risk management awareness and capability across our business and creating stronger pathways between strategy and risk through the strategic planning process.
Accountability – Three Lines of Defence
Air New Zealand’s risk management structure aims to align with the Three Lines of Defence model, involving the Executive, Audit Committee and Board oversight of risk management and assurance. Each Line has a set of core accountabilities:
AUDIT COMMITTEE AND BOARD
3RD LINE OF DEFENCE: INTERNAL AUDITIndependent challenge, verification and review of business management of risk; and Identify opportunities for improved business performance
2ND LINE OF DEFENCE: RISK AND COMPLIANCE Develop, maintain and oversee implementation of the ERMF, including Risk Management Policy and supporting tools.
Regular aggregated risk reporting to the Audit Committee and Board.
1ST LINE OF DEFENCE: BUSINESSIdentify and manage business risks in compliance with Policy
Strategic RisksThe Board and management have identified and assessed a number of strategic risks facing the business. These have been prioritised based on their relative strategic importance and criticality.
As an airline that operates in a complex global environment, Air New Zealand’s vulnerability to uncertainty or unfavourable changes in the general macro-economic conditions has been identified as the top strategic risk for the company.
Strategic Risk Area Description Mitigation
Macro-environmental Uncertainty
Complexity or uncertainty in the macro environment, or a significant economic downturn impairs long-term planning and the global propensity to travel, adversely impacting capacity management, revenue optimisation and growth.
Regular and ongoing monitoring of market trend development through a range of economic and market indicators to facilitate forecasting of and planning for underlying demand, revenue and capacity.
Cybersecurity A cyber-attack leads to a significant data privacy breach, loss of integrity/availability of information or of a control system and widespread business disruption resulting in financial loss, reputational damage and regulatory fines or sanctions.
Information security management systems, complemented by appropriate cybersecurity measures and insurance.
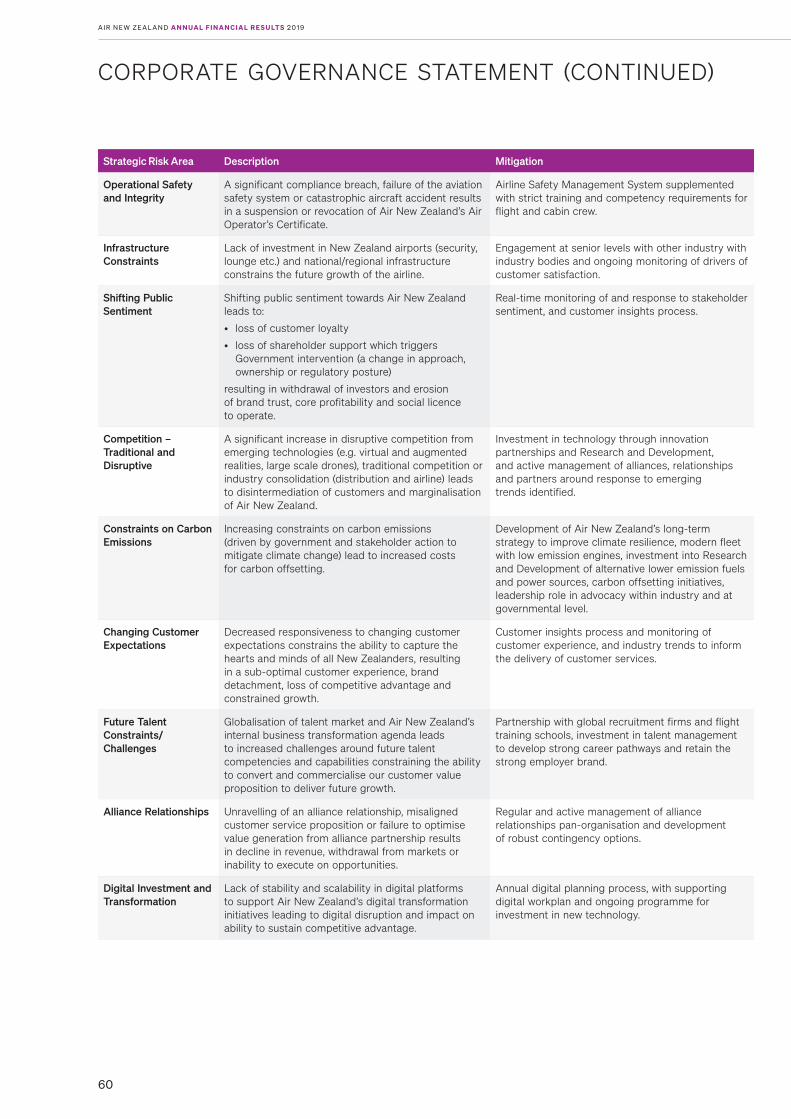
A I R N E W ZE A L A N D A N N UA L F I N A N C I A L R E S U LT S 2 0 1 9
60
Strategic Risk Area Description Mitigation
Operational Safety and Integrity
A significant compliance breach, failure of the aviation safety system or catastrophic aircraft accident results in a suspension or revocation of Air New Zealand’s Air Operator’s Certificate.
Airline Safety Management System supplemented with strict training and competency requirements for flight and cabin crew.
Infrastructure Constraints
Lack of investment in New Zealand airports (security, lounge etc.) and national/regional infrastructure constrains the future growth of the airline.
Engagement at senior levels with other industry with industry bodies and ongoing monitoring of drivers of customer satisfaction.
Shifting Public Sentiment
Shifting public sentiment towards Air New Zealand leads to:
• loss of customer loyalty
• loss of shareholder support which triggers Government intervention (a change in approach, ownership or regulatory posture)
resulting in withdrawal of investors and erosion of brand trust, core profitability and social licence to operate.
Real-time monitoring of and response to stakeholder sentiment, and customer insights process.
Competition – Traditional and Disruptive
A significant increase in disruptive competition from emerging technologies (e.g. virtual and augmented realities, large scale drones), traditional competition or industry consolidation (distribution and airline) leads to disintermediation of customers and marginalisation of Air New Zealand.
Investment in technology through innovation partnerships and Research and Development, and active management of alliances, relationships and partners around response to emerging trends identified.
Constraints on Carbon Emissions
Increasing constraints on carbon emissions (driven by government and stakeholder action to mitigate climate change) lead to increased costs for carbon offsetting.
Development of Air New Zealand’s long-term strategy to improve climate resilience, modern fleet with low emission engines, investment into Research and Development of alternative lower emission fuels and power sources, carbon offsetting initiatives, leadership role in advocacy within industry and at governmental level.
Changing Customer Expectations
Decreased responsiveness to changing customer expectations constrains the ability to capture the hearts and minds of all New Zealanders, resulting in a sub-optimal customer experience, brand detachment, loss of competitive advantage and constrained growth.
Customer insights process and monitoring of customer experience, and industry trends to inform the delivery of customer services.
Future Talent Constraints/Challenges
Globalisation of talent market and Air New Zealand’s internal business transformation agenda leads to increased challenges around future talent competencies and capabilities constraining the ability to convert and commercialise our customer value proposition to deliver future growth.
Partnership with global recruitment firms and flight training schools, investment in talent management to develop strong career pathways and retain the strong employer brand.
Alliance Relationships Unravelling of an alliance relationship, misaligned customer service proposition or failure to optimise value generation from alliance partnership results in decline in revenue, withdrawal from markets or inability to execute on opportunities.
Regular and active management of alliance relationships pan-organisation and development of robust contingency options.
Digital Investment and Transformation
Lack of stability and scalability in digital platforms to support Air New Zealand’s digital transformation initiatives leading to digital disruption and impact on ability to sustain competitive advantage.
Annual digital planning process, with supporting digital workplan and ongoing programme for investment in new technology.
CORPORATE GOVERNANCE STATEMENT (CONTINUED)
A I R N E W ZE A L A N D G R O U P
61
Climate Change
Air New Zealand recognises a range of climate-related risks. In the short-term, as reflected in the Strategic Risks above, there are potential constraints, whether economic, legislative, social or other, on carbon emissions. Within the current technological framework, some level of such emissions is unavoidable, and the Company’s risk management approach recognises these constraints.
Over a longer timeframe, additional types of climate-related risk are recognised. These currently fall outside the 11 strategic risks discussed above, but Air New Zealand is capturing, evaluating and addressing these risks. For example, a changing climate is bringing about a range of physical impacts such as extreme weather, changing sea levels, higher temperatures and atmospheric disturbance. These physical effects can lead to operational impacts, including access to facilities, changed travel patterns or limitations on routes. Customer propensity to travel may be materially reduced, impacting on revenue or fleet utilisation. Although the physical effects themselves cannot be reasonably managed by Air New Zealand, the impacts can be mitigated through such means as enhanced technology, or operational changes including scheduling or route selection. Long-term strategic planning regarding infrastructure and engagement with infrastructure providers, including airports, will also assist in the ongoing provision of services.
As society, both in New Zealand and globally, increasingly grapples with the effects of climate change, industry sectors and companies will come under greater scrutiny as to their sustainability credentials and strategic response to climate change, and there may be official and unofficial sanctions on those which are failing, or are perceived to be failing, to address the challenges.
Air New Zealand manages climate-related risks within its ERMF, while recognising their specific features including time frames. Through the development of a long-term climate change strategy, the Company will consider the modelling and measurement of various climate related scenarios, and is monitoring peer organisations so as to achieve appropriate consistency in approach and disclosure.
In August 2019 Air New Zealand became one of the first New Zealand companies to sign up as a Task Force on Climate-related Financial Disclosures (TCFD) Supporter, joining over 800 other organisations globally committed to implementing and improving climate-related disclosure. The Company will be reporting against the TCFD Recommendations from the 2020 financial year.
Auditors
“The Board should ensure the quality and independence of the external audit process.”
External Audit
As a Public Entity, Air New Zealand is subject to the Public Audit Act 2001. The Auditor-General is the auditor, but may appoint an independent auditor to conduct the audit process. Deloitte has been appointed in this respect.
The Audit Committee liaises with the Auditor-General on the appointment and re-appointment of the external auditors, to ensure the independence of the external auditor is maintained, and to approve the performance of any non-audit services in accordance with the Audit Independence Policy.
Air New Zealand requires the external auditor to rotate its lead audit partner at least every five years, with suitable succession planning to ensure consistency.
On a regular basis the Audit Committee meets with the external auditor to discuss any matters that either party believes should be discussed confidentially. The Chair of the Audit Committee will call a meeting of that Committee if so requested by the external auditor.
The appointed external auditor, Deloitte, has historically attended the Annual Shareholders’ Meeting, and the lead audit partner is available to answer relevant questions from shareholders at that meeting.
Internal Audit
Internal Auditing is an independent and objective assurance and consulting activity that is guided by a philosophy of adding value to improve the operations of Air New Zealand. The Company’s Head of Internal Audit reports functionally to the Audit Committee and administratively to the Chief Financial Officer. The internal auditors’ responsibilities are defined by the Audit Committee as part of their oversight role, and the Head of Internal Audit has unfettered access to the Audit Committee or its Chair.
CORPORATE GOVERNANCE STATEMENT (CONTINUED)
A I R N E W ZE A L A N D A N N UA L F I N A N C I A L R E S U LT S 2 0 1 9
62
Shareholder Rights and Relations
“The Board should respect the rights of shareholders and foster constructive relationships with shareholders that encourage them to engage with the issuer.”
The Board recognises the rights of shareholders and is committed to engaging with them positively on significant matters.
Air New Zealand’s shareholder relations programme is designed to ensure effective, two-way communication between shareholders and Air New Zealand. Relevant information is provided to the investment community as quickly and efficiently as possible as part of Air New Zealand’s compliance with continuous disclosure obligations.
In addition to providing disclosures to the market, Air New Zealand engages with shareholders in a number of ways including:
• Investor Centre Website
Air New Zealand maintains a dedicated investor website at airnewzealand.co.nz/investor-centre. This website is an important part of Air New Zealand’s communication with shareholders. It contains financial information, current and historical annual reports and presentations, current share price information, dividend history, notices of shareholder meetings, frequently asked questions and other relevant information pertaining to Air New Zealand. The website is freely accessible to the public and is updated regularly.
• Electronic Communications
Air New Zealand provides an Investor Relations email address which provides shareholders a mechanism by which they can communicate electronically with Air New Zealand on any matters relating to their investment or other dealings with the Company. All shareholder-related enquiries are provided with a response within a reasonable timeframe.
• Hybrid Annual Shareholder Meetings
Beginning in 2016, Air New Zealand has offered shareholders the ability to attend the Annual Shareholders’ Meeting in either a physical or digital capacity. For shareholders who are unable to travel, the online option of participating in the Annual Shareholders’ Meeting allows all shareholders the ability to engage with the Board of Directors and Executive. In 2018, Air New Zealand had approximately 110 online participants who asked 5 questions using the virtual tool. Resolutions at shareholder meetings are by way of a poll, where each shareholder has one vote per share. Air New Zealand encourages shareholders to ask questions in advance of the meeting, to encourage further engagement with the Company and provide management with a view of the concerns of the Company’s shareholders.
• Investor Day Briefings
On a periodic basis, Air New Zealand holds investor briefings to provide an update on the Company’s strategy and financial framework, as well as provide shareholders with an in-depth discussion on a particular topic and access to senior management. To ensure all shareholders and prospective investors have the opportunity to view the content of Investor Day briefing, Air New Zealand also provides webcast access and transcripts of the event on the Air New Zealand website.
• Webcasting Interim and Annual Results Presentations
Air New Zealand webcasts its earnings announcements on a semi-annual basis to provide investors with timely information pertaining to the business, strategy and financial performance. A replay of the webcast and a transcript of the event are made available on the Air New Zealand website.
• Regular disclosures on company performance
Air New Zealand makes regular disclosures relating to the company’s performance. On a monthly basis an investor update containing operating statistics for the month (traffic and capacity figures, passenger numbers and load factors), as well as details on any significant investor news and events is released to the market and posted on the investor centre website. On a quarterly basis, Air New Zealand also discloses its fuel hedge position for the coming financial period.
In accordance with the Companies Act, Constitution and Listing Rules, Air New Zealand refers any significant matters to shareholders for approval at a shareholder meeting.
Air New Zealand posts any Notices of Shareholder Meetings on its website as soon as these are available. The general practice is to make these available not less than four weeks prior to the shareholder meeting.
Differences in Practice to NZX Code The Board has not established protocols setting out procedures to be followed in the event of a takeover offer. This is because the Board considers receipt of a takeover offer to be an extremely unlikely event in light of the Crown’s majority shareholding in the Company and the other shareholding restrictions that apply to Air New Zealand. In addition, Air New Zealand would have adequate time to implement such protocols and procedures, and communicate those to shareholders, should circumstances change. Accordingly, and having regard to the supporting commentary in the NZX Corporate Governance Code, the Board considers that it is reasonable and appropriate for Air New Zealand not to follow Recommendation 3.6 of the Code at this time. Notwithstanding this, the Board agrees with the principles behind this recommendation, being good communication with shareholders and independent directors leading matters that require appropriate independence.
CORPORATE GOVERNANCE STATEMENT (CONTINUED)
A I R N E W ZE A L A N D G R O U P
63
The following directors held office as at 30 June 2019:
Antony (Tony) Carter BE (Hons), ME, MPhil
Chairman
Independent Non-Executive Director – Appointed 1 December 2010
Mr Carter is Chairman of Fisher & Paykel Healthcare Limited, a director of Fletcher Building Limited, ANZ Bank New Zealand Limited and Vector Limited.
He attended the University of Canterbury where he studied chemical engineering, graduating with a Bachelor in Engineering with honours and a Masters in Engineering in 1980. He then went on to study at Loughborough University of Technology in the United Kingdom and graduated in 1982 with a Master of Philosophy degree.
Mr Carter worked for his family company, Carter Group Limited, in Christchurch until 1986 when he purchased a Mitre 10 hardware store, also eventually serving as a director of Mitre 10 New Zealand Limited and becoming Chairman of Mitre 10 New Zealand Limited in 1993.
In 1994 Mr Carter was appointed General Manager and Chief Executive designate of Foodstuffs (South Island) Limited. In 1995 he was appointed Chief Executive of Foodstuffs (South Island) Limited and in 2001, was appointed Managing Director of Foodstuffs (Auckland) Limited and Managing Director of Foodstuffs (New Zealand) Limited until he retired in December 2010. The Foodstuffs Group is New Zealand’s largest retail organisation.
Mr Carter will be resigning as Chairman after the 2019 Annual Shareholder Meeting.
Janice (Jan) Dawson CNZM, BCom, FCA
Deputy Chairman
Independent Non-Executive Director – Appointed 1 April 2011
Ms Dawson is Chairman of Westpac New Zealand Limited and a director of AIG Insurance New Zealand Limited, Meridian Energy Limited and World Sailing. Ms Dawson is a member of the University of Auckland Council and the Capital Investment Committee of the Ministry of Health.
Ms Dawson was a partner of KPMG for 30 years, specialising in audit and risk advisory, and the Chair and Chief Executive of KPMG New Zealand from 2006 until 2011.
Ms Dawson holds a Bachelor of Commerce from the University of Auckland. She is a Fellow of the New Zealand Institute of Chartered Accountants, a Fellow of the Institute of Directors in New Zealand, a Paul Harris Fellow and a North Shore Business Hall of Fame Laureate (2010). Ms Dawson was named Chartered Accountant of the Year in 2011 by the New Zealand Institute of Chartered Accountants.
Robert (Rob) Jager ONZM, BE (Hons), MBA
Independent Non-Executive Director – Appointed 1 April 2013
Mr Jager was appointed as Vice President of Shell Australia’s Prelude Floating LNG and wider East Browse assets offshore of Western Australia in November 2018. Mr Jager was formerly Chairman of the Shell Companies in New Zealand and General Manager, Shell Todd Oil Services.
Mr Jager spent a career spanning more than 40 years within Shell, joining the group in New Zealand in 1978 as an engineering cadet and working for Shell in a variety of engineering, project, operational, business, management, and governance roles in New Zealand and overseas. He completed his Bachelor of Engineering degree in 1983 with 1st Class Honours and later gained an MBA with Distinction.
Mr Jager chaired the independent taskforce on Workplace Health and Safety for the New Zealand Government, which has been instrumental in encouraging fundamental changes to New Zealand’s approach to workplace health and safety. Mr Jager also chaired the Petroleum Exploration and Production Association NZ as well as the Business Leaders Health and Safety Forum. Mr Jager was a Director for National Science Challenge – Sustainable Seas – Project and an advisor to a major conservation project working towards the ecological restoration of New Zealand’s iconic Mount Taranaki.
In 2013, Mr Jager received the Energy Executive of the Year Award at the New Zealand Deloitte Energy Excellence Awards for his “standout performance in the New Zealand energy sector”. He was elected a fellow of the Institute of Professional Engineers in 2015 for his contribution to the advancement of engineering practice and leadership in the profession and was recognised with a Safeguard Life-time Achievement Award in 2017. Mr Jager was awarded Officer of New Zealand Order of Merit (ONZM) in the 2018 New Zealand Honours’ for his services to Business and Health and Safety.
Mr Jager has been Chairman of the Air New Zealand Health, Safety and Security Committee since September 2014.
Linda Jenkinson MBA, BBS
Independent Non-Executive Director – Appointed 1 June 2014
Ms Jenkinson is a proven global entrepreneur who has started three multi-national companies, one of which listed on the NASDAQ. Most recently she was the co-founder of John Paul, a global concierge services and digital solutions company that services some of the world’s leading customer facing businesses.
Ms Jenkinson is currently a director of Guild Group Holdings, Chair of Guild Super and a director of the Eclipz Group (ECX) in Australia, a director of Harbour Asset Management. In the non-profit space she is chair of Unicef New Zealand and a trustee and secretary of the Massey University Foundation in the United States. Ms Jenkinson is the Founder of LevelUp, working with high-growth companies which includes Jaxsta, where she is a director of the global music data platform. Previously Ms Jenkinson was a partner at A.T. Kearney in their Global Financial Services Practice and was a leader in A.T. Kearney’s Global Sourcing Practice.
Ms Jenkinson holds a Master of Business Administration from The Wharton School, University of Pennsylvania and a Bachelor of Business Studies from Massey University. In 2016, Ms Jenkinson was named a World Class New Zealander by Kea and was named as one of the most influential women in the Bay Area for 2014 by the San Francisco Business Times. In 2014 Ms Jenkinson was a recipient of Massey University’s Sir Geoffrey Peren Award, which recognises a graduate who has reached the highest level of achievement or who has been of significant service to the university, community or nation.
DIRECTORS’ PROFILES
A I R N E W ZE A L A N D A N N UA L F I N A N C I A L R E S U LT S 2 0 1 9
64
DIRECTORS’ PROFILES (CONTINUED)
Rt Hon Sir John Key GNZM, AC
Independent Non-Executive Director – Appointed 1 September 2017
Sir John was Prime Minister of New Zealand from 2008 to 2016. He successfully led the country through the aftermath of the global financial crisis and a series of devastating earthquakes in New Zealand’s second-biggest city, Christchurch. Among his portfolios, Sir John was Minister for Tourism. In this role he promoted New Zealand offshore and oversaw substantial growth in New Zealand’s tourism industry. He retains a strong interest in the best that our country has to offer both local and international tourists.
Sir John is well respected in international affairs. He chaired the International Democrat Union from 2014 for just over 3 years and chaired the United Nations Security Council in 2016. Sir John, who was knighted in the 2017 Queen’s Birthday Honours, has also been appointed an Honorary Companion of the Order of Australia.
Sir John’s current business activities include a role advising a $200 billion United States corporation on its investments in China as well as an advisory role with a New York fund manager. Sir John is the Chairman of ANZ Bank New Zealand Limited, a non-executive director of ANZ Banking Group Limited Australia, and NYSE-listed cyber security company, Palo Alto Networks, Inc. He also sits on the BP International Advisory Board. Sir John still undertakes a number of public speaking engagements and is an Ambassador for philanthropic Japanese billionaire Dr Haruhisa Handa through ISPS Handa and other agencies.
Sir John worked in investment banking for 20 years primarily for Bankers Trust in New Zealand and Merrill Lynch in Singapore, London and Sydney. His positions included heading Merrill Lynch’s global foreign exchange business along with responsibility for European derivative trading and E-Commerce. He was a member of the Foreign Exchange Committee of the Federal Reserve Bank of New York (1999-2001).
Jonathan Mason BA, MA, MBA
Independent Non-Executive Director – Appointed 1 March 2014
Mr Mason has more than 30 years’ experience in the financial sector, with an emphasis on emerging markets.
Prior to joining Air New Zealand’s Board in March 2014, he was Fonterra Co-operative Group’s Chief Financial Officer.
He joined Fonterra in 2009 from US-based chemicals company Cabot Corporation where he was Executive Vice-President and Chief Financial Officer. Prior to this he was employed as the Chief Financial Officer at forest products company Carter Holt Harvey Limited and also served in senior financial management positions at US based International Paper Company.
Mr Mason has had governance experience with organisations in both New Zealand and the US. His current directorships include Vector Limited, Westpac New Zealand Limited and Zespri Group Limited. Mr. Mason also serves as an Adjunct Professor of Management at the University of Auckland, specialising in international finance.
Dame Therese Walsh DNZM, BCA, FCA
Independent Non-Executive Director – Appointed 1 May 2016 Chairman-elect
Dame Therese is currently Chairman of TVNZ Limited, a director of ASB Bank Limited, Contact Energy Limited, and Antarctica NZ, and Pro Chancellor at Victoria University.
Previously she was the Head of New Zealand for ICC Cricket World Cup 2015 Limited, and the Chief Operating Officer for Rugby New Zealand 2011 Limited. She has also been a director of NZX Limited, NZ Cricket and Save the Children NZ, Chief Financial Officer at the New Zealand Rugby Union and part of the team that worked on the winning bid to host RWC 2011. Prior to this she was an auditor with KPMG.
Dame Therese is a Fellow of the New Zealand Institute of Chartered Accountants and a commerce graduate from Victoria University. In 2013, she was named the inaugural supreme winner of the Women of Influence Awards and was awarded a Sir Peter Blake Trust Leadership Award in 2014. She became a Dame Companion of the New Zealand Order of Merit in June 2015.
Dame Therese will succeed Mr Carter as Chairman of Air New Zealand following the 2019 Annual Shareholder Meeting.
A I R N E W ZE A L A N D G R O U P
65
INTERESTS REGISTER
No disclosures were made of interests in transactions under s140(1) of the Companies Act 1993.
Directors have made general disclosures of interests in accordance with s140(2) of the Companies Act. Current interests, and those which ceased during the year, are tabulated below. New disclosures advised since 1 July 2018 are italicised.
Tony Carter ANZ Bank New Zealand LimitedBlues LLP – ceased 1 February 2019Capital Training LimitedDatacom Group LimitedFisher & Paykel Healthcare Corporation LimitedFletcher Building LimitedFonterra Independent Director Selection PanelFoodstuffs Auckland Protection TrustMaurice Carter Charitable TrustVector Limited
DirectorChairmanAdvisory Board MemberDirectorChairmanDirectorMemberTrusteeTrusteeDirector
Jan Dawson AIG Insurance New Zealand LimitedBeca Group Limited – resigned 31 March 2019Jan Dawson LimitedMeridian Energy LimitedMinistry of Health Capital Investment CommitteeUniversity of Auckland CouncilWestpac New Zealand LimitedWorld Sailing
DirectorDirectorDirectorDirectorMemberMemberChairmanDirector
Rob Jager Maui Development Limited – resigned 31 October 2018Petroleum Exploration & Production Associate New Zealand (PEPANZ) – resigned 31 October 2018Shell Energy Asia Limited – resigned 31 October 2018Shell Exploration NZ Limited – resigned 31 October 2018Shell Investments NZ Limited – resigned 31 October 2018Shell New Zealand (2011) Limited – resigned 31 October 2018Sustainable Seas National Science Challenge – resigned 31 October 2018
DirectorDirector
ChairmanChairmanChairmanChairmanDirector
Linda Jenkinson Eclipx Group LimitedGold Cross Products & Services Pty LtdGuild Group Holdings LimitedGuild Insurance LimitedGuild Link Pty LtdGuild Superannuation Services LimitedGuild Trustee Services LimitedHarbour Asset Management LimitedJaxsta LimitedLes Concierges (Canada) – resignation advised 27 March 2019Les Concierges (US) – resignation advised 27 March 2019Massey University FoundationMassey University US FoundationRefunme LimitedRewardChain LimitedTe Auaha LimitedUNICEF NZValueRoad Limited
DirectorChairDirectorDirectorDirectorDirectorDirectorDirectorDirectorDirectorDirectorTrusteeDirector and SecretaryDirector and ShareholderShareholderDirectorChairShareholder
Sir John Key ANZ Bank New Zealand LimitedAustralia & New Zealand Banking Group Limited (Australia)BP International Advisory BoardCaxton (Hedge Fund)Comcast CorporationHanda FoundationMTK Capital LimitedPalo Alto Neworks, Inc.Thirty Eight JK Limited
ChairmanDirectorMemberConsultant/Advisory Board MemberConsultantConsultantDirectorDirectorDirector

A I R N E W ZE A L A N D A N N UA L F I N A N C I A L R E S U LT S 2 0 1 9
66
INTERESTS REGISTER (CONTINUED)
Jonathan Mason Beloit College (USA) Board of TrusteesDilworth School for BoysNew Zealand Assets Management LimitedUniversity of Auckland Endowment FundVector LimitedWestpac New Zealand LimitedWorld Wide Fund for Nature New ZealandZespri Group Limited
TrusteeTrusteeDirectorTrusteeDirectorDirectorTrusteeDirector
Dame Therese Walsh Antarctica NZASB Bank LimitedContact Energy LimitedMBIE Major Events Investment Panel – resignation advised 31 December 2018On Being Bold LimitedTelevision New Zealand LimitedTherese Walsh Consulting LimitedVictoria UniversityWellington Homeless Women’s TrustWellington Regional Stadium Trust
DirectorDirectorDirectorMember
DirectorChairmanDirectorPro-ChancellorAmbassadorTrustee
There have been no interest register entries in respect of use of company information by directors.
DIRECTORS’ INTERESTS IN AIR NEW ZEALAND SECURITIESDirectors had relevant interests in shares as at 30 June 2019 as below:
Interest Shares
Tony Carter Beneficial1 207,1892
Jan Dawson Beneficial 20,000
Rob Jager Beneficial 24,500
Linda Jenkinson Beneficial 22,000
Sir John Key Beneficial 20,000
Jonathan Mason Beneficial 29,000
Dame Therese Walsh Beneficial 85,000
1. Held by Loughborough Investments Limited, an associated person of Tony Carter.
2. Tony Carter also has a beneficial interest (through Loughborough Investments Limited) in 30,000 Bonds.
During the year, directors advised the following dealings that they (or associated persons) had in shares of the company:
Transaction Date Number Consideration
Dame Therese Walsh Purchase Purchase
17 October 2018 1 April 2019
20,00020,000
$56,600$51,600
INDEMNITIES AND INSURANCEPursuant to section 162 of the Companies Act 1993 and the Constitution, Air New Zealand has entered into deeds of access, insurance and indemnity with the directors of the Group to indemnify them to the maximum extent permitted by law, against all liabilities which they may incur in the performance of their duties as directors of any company within the Group. Insurance cover extends to directors and officers for the expenses of defending legal proceedings and the cost of damages incurred. Specifically excluded are proven criminal liability and fines and penalties other than those pecuniary penalties which are legally insurable. In accordance with commercial practice, the insurance contract prohibits further disclosure of the terms of the policy. All directors who voted in favour of authorising the insurance certified that in their opinion, the cost of the insurance is fair to the Company.
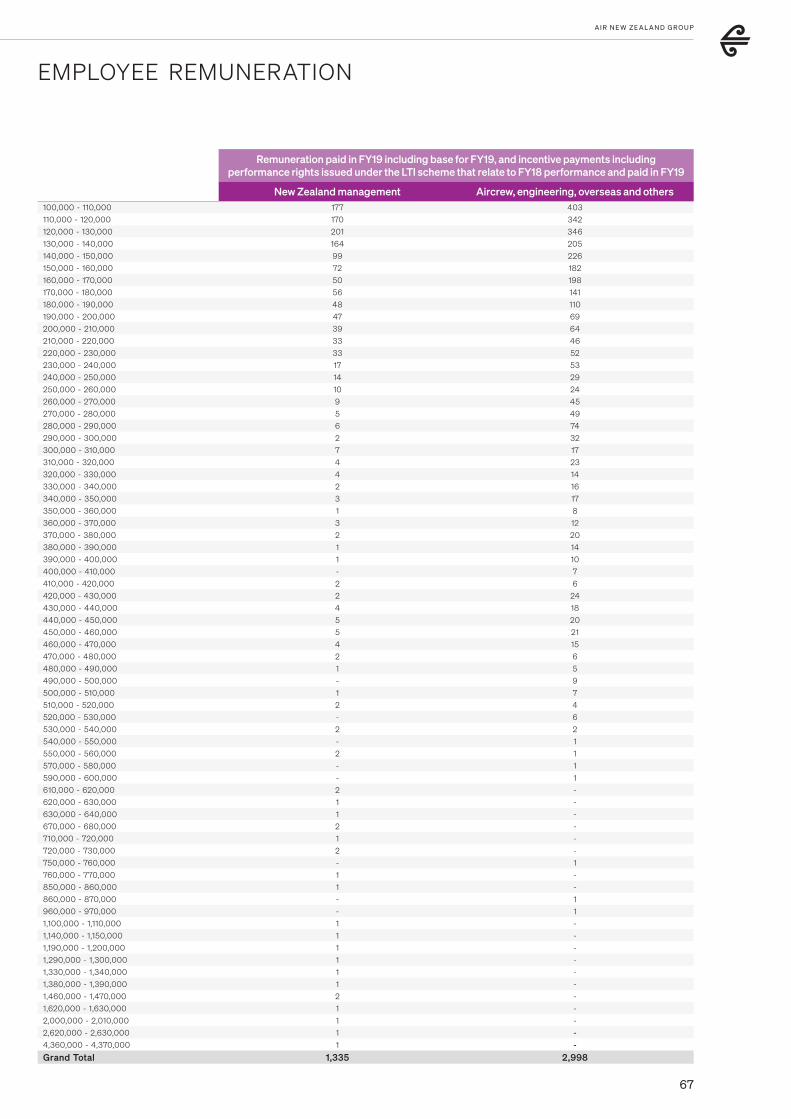
A I R N E W ZE A L A N D G R O U P
67
EMPLOYEE REMUNERATION
Remuneration paid in FY19 including base for FY19, and incentive payments including performance rights issued under the LTI scheme that relate to FY18 performance and paid in FY19
New Zealand management Aircrew, engineering, overseas and others100,000 - 110,000 177 403
110,000 - 120,000 170 342
120,000 - 130,000 201 346
130,000 - 140,000 164 205
140,000 - 150,000 99 226
150,000 - 160,000 72 182
160,000 - 170,000 50 198
170,000 - 180,000 56 141
180,000 - 190,000 48 110
190,000 - 200,000 47 69
200,000 - 210,000 39 64
210,000 - 220,000 33 46
220,000 - 230,000 33 52
230,000 - 240,000 17 53
240,000 - 250,000 14 29
250,000 - 260,000 10 24
260,000 - 270,000 9 45
270,000 - 280,000 5 49
280,000 - 290,000 6 74
290,000 - 300,000 2 32
300,000 - 310,000 7 17
310,000 - 320,000 4 23
320,000 - 330,000 4 14
330,000 - 340,000 2 16
340,000 - 350,000 3 17
350,000 - 360,000 1 8
360,000 - 370,000 3 12
370,000 - 380,000 2 20
380,000 - 390,000 1 14
390,000 - 400,000 1 10
400,000 - 410,000 - 7
410,000 - 420,000 2 6
420,000 - 430,000 2 24
430,000 - 440,000 4 18
440,000 - 450,000 5 20
450,000 - 460,000 5 21
460,000 - 470,000 4 15
470,000 - 480,000 2 6
480,000 - 490,000 1 5
490,000 - 500,000 - 9
500,000 - 510,000 1 7
510,000 - 520,000 2 4
520,000 - 530,000 - 6
530,000 - 540,000 2 2
540,000 - 550,000 - 1
550,000 - 560,000 2 1
570,000 - 580,000 - 1
590,000 - 600,000 - 1
610,000 - 620,000 2 -
620,000 - 630,000 1 -
630,000 - 640,000 1 -
670,000 - 680,000 2 -
710,000 - 720,000 1 -
720,000 - 730,000 2 -
750,000 - 760,000 - 1
760,000 - 770,000 1 -
850,000 - 860,000 1 -
860,000 - 870,000 - 1
960,000 - 970,000 - 1
1,100,000 - 1,110,000 1 -
1,140,000 - 1,150,000 1 -
1,190,000 - 1,200,000 1 -
1,290,000 - 1,300,000 1 -
1,330,000 - 1,340,000 1 -
1,380,000 - 1,390,000 1 -
1,460,000 - 1,470,000 2 -
1,620,000 - 1,630,000 1 -
2,000,000 - 2,010,000 1 -
2,620,000 - 2,630,000 1 -
4,360,000 - 4,370,000 1 -
Grand Total 1,335 2,998

A I R N E W ZE A L A N D A N N UA L F I N A N C I A L R E S U LT S 2 0 1 9
68
EMPLOYEE REMUNERATION (CONTINUED)
Remuneration philosophyIn order to attract and retain talented individuals, Air New Zealand’s performance and reward strategy is aligned with both the recruitment philosophy – to source talented people, and the Company’s capability development agenda – to develop future leaders and provide succession pipelines into key roles. The key objectives of the strategy are attracting high performing individuals, providing rich developmental opportunities and recognising achievement through targeted performance and reward initiatives.
Air New Zealand’s remuneration strategy is underpinned by a pay for performance philosophy and uses annual performance incentives to create opportunities for everyone to achieve market competitive remuneration levels and in the case of superior performance, total remuneration in excess of market.
Executive remunerationThe CEO and Executive remuneration packages are made up of three components:
• Fixed remuneration;• Annual performance incentive; and• Long-term incentive.
Air New Zealand’s People Remuneration and Diversity Committee is kept appraised of relevant market information and best practice, obtaining advice from external advisors when necessary. Remuneration levels are reviewed annually for market competitiveness and alignment with strategic and performance priorities.
Fixed remunerationAir New Zealand’s philosophy is to set fixed remuneration at 90 percent of the market median for Executives who are fully competent in their role.
Short-term performance incentivesThe annual performance incentive component for the CEO and Executive is delivered through the Air New Zealand Short-Term Incentive Scheme (STI). The measures used in determining the quantum of the STI are set annually. Targets relate to both Company financial performance and individual targets. For the CEO the STI is set at 55% of annual fixed salary at target (Achieving) performance and the weighting is based 60% on Company financial performance and 40% on individual performance against specific targets. For all other employees the weighting is 50% Company financial performance and 50% individual performance. Participation in the plan is by annual invitation at the discretion of the company.
Company Component
At the start of the 2019 financial year the Board set the financial target for the Company for incentive payments which was set at 13% Return on Invested Capital (ROIC) on an NZ IFRS 16 - Leases compliant basis.
The Company must achieve 10% ROIC before any company component is paid out. The maximum company component is 200%, achieved when the Company reaches and exceeds 19% ROIC.
The Board has discretion to eliminate significant positive or negative one-off adjustments to ROIC.
Individual Component
In the 2019 financial year 25% of the individual component was paid out based on the achievement of Customer Satisfaction and On Time Performance measures.
The main factors for the assessment of the remainder of the individual performance for the 2019 financial year were:
Performance Description Performance Measures
Business performance • Delivery of business plan• Brand profile and trust
Strategy development and delivery • Progress against key strategic initiatives and plan as set by the Board• Key external relationships
Leadership • Customer experience• Health and safety performance
People and culture • Employee engagement• Compliance with regulatory environment
Payments for the individual component are made according to an overall performance rating taking into account the employee’s performance across the range of individual measures and demonstration of Air New Zealand’s leadership behaviours.
Performance Rating Individual STI Percentage
Unsatisfactory 0%
Developing 60%
Achieving 100%
High 130%
Outstanding 200%
Long-term performance incentivesAir New Zealand’s long-term incentive plan arrangements are designed to align the interests of the CEO and Executives with those of our shareholders and to incentivise participants in the plan to enhance long-term shareholder value. In the 2019 financial year the plan available to Executives was the Air New Zealand Long-Term Incentive Performance Rights Plan (LTIP). Participation in any year is by annual invitation at the discretion of the Board.
In addition, the CEO has access to the Air New Zealand CEO Restricted Share Rights Plan (CRSRP). The CRSRP was established as a further incentive in recognition of the commercial importance of retaining the services of the CEO for an extended period.

A I R N E W ZE A L A N D G R O U P
69
EMPLOYEE REMUNERATION (CONTINUED)
Long-Term Incentive Plan (LTIP)
There are two main elements to the LTIP:
Performance RightsLTIP participants are eligible to receive a grant of performance rights. Any grant of performance rights is at the discretion of the People Remuneration and Diversity Committee of the Board of Directors but, in the normal course of events, is expected to equate to a value of 55% of fixed remuneration for the CEO, and between 20% and 40% of fixed remuneration for Executives depending on their seniority. The number of performance rights to be allocated will be determined by an independent valuation of the performance rights carried out each year at the time of issue.
In three years’ time, if the Air New Zealand share price has outperformed the performance hurdle, a proportion of the performance rights will convert to shares. The performance hurdle comprises of an index made up of the NZSX All Gross Index and the Bloomberg World Airline Total Return Index in equal proportions.
The proportion of performance rights that convert to shares will depend on to what extent the Air New Zealand share price has outperformed the index. In particular:
Performance against index Percent of Rights Vesting
<100% nil
100% 50%
101% – 119% Additional 2.5% vesting per 1% increment
120% 100% (maximum)
If vesting is not achieved on the third anniversary of the issue date, 50 percent of performance rights will lapse. For the remaining 50 percent there will be a further 6 month opportunity for the performance rights to vest.
Unless Air New Zealand’s share price outperforms the index as outlined above, no value will accrue to the participating Executive.
Mandatory ShareholdingParticipants are required to commit to investing a specified amount to purchase shares in the Company. The amount is set at a value of 55% of fixed remuneration for the CEO, and between 20% and 40% of fixed remuneration for Executives depending on their seniority.
Until participants have attained this target, any shares issued to them from vested performance rights must be retained as part of the mandatory shareholding. This holding must be maintained while continuing to participate in the LTIP.
CEO Restricted Share Rights Plan (CRSRP)
The CRSRP scheme commenced in the 2016 financial year. Each year, at the absolute discretion of the Board, and on condition of the CEO achieving the performance hurdles set for the previous financial year, restricted share rights can be issued to the CEO based on 50% of the CEO’s fixed remuneration.
Share rights issued under this scheme are not earned nor do they vest unless the CEO remains employed by Air New Zealand at vesting milestones across the period from 2017 to 2021. If this condition is met a proportion of the rights will immediately vest to the CEO on this date. Given his announced resignation the CEO will not be granted any further CRSRPs, the already awarded CRSRPs will vest or forfeit according to the plan rules.
Chief Executive Officer Remuneration
CEO Transition
On 19 June 2019, the CEO gave the Board 12 months notice as required by his employment contract. The Board has agreed the remuneration payable to the CEO under the contract including the term of service, the payment in lieu of service and the related proration of STI and LTI.
CEO Target Remuneration Summary
Financial Year
Salary $
Benefits1 $
STI2 $
LTIP3 $
CRSRP4 $
Summary $
2019 1,600,000 150,846 880,000 880,000 775,000 4,285,846
2018 1,550,000 166,171 852,500 852,500 755,000 4,176,171
Based on remuneration components outlined earlier, CEO target remuneration is as follows:
1. Benefits include actual superannuation (KoruSaver scheme) and travel in the 2019 financial year. The CEO is a member of Air New Zealand’s group superannuation scheme, KoruSaver. As a member of the scheme the CEO is eligible to contribute and receive a matching Company contribution up to 4% of gross taxable earnings (including STI). The CEO and eligible beneficiaries are entitled to a number of trips for personal purposes at no cost to the individual. The dollar value represents the actual benefit received in each financial year, as no target is available for benefits.
2. STI target entitlement is 55% of Salary.
3. The Long-Term Incentive Plan remains at risk. Target LTIP represents 55% of the rights granted. In three years’ time, if the Air New Zealand share price has outperformed the performance hurdle, a proportion of the performance rights will convert to shares. The performance hurdle comprises of an index made up of the NZSX All Gross Index and the Bloomberg World Airline Total Return Index in equal proportions. Should Air New Zealand’s share price not perform better than a comparison index the granted share rights will lapse. As a good leaver the CEO will retain the Performance Right’s awarded in the 2017, 2018 and 2019 programmes.
4. The annual restricted share rights are split into two tranches with different vesting dates. Share rights only vest if the CEO remains employed by the company on the date for vesting. Therefore, the second tranche of the CRSRPs awarded in September 2018 (FY19) will not vest given the CEO’s announced resignation.
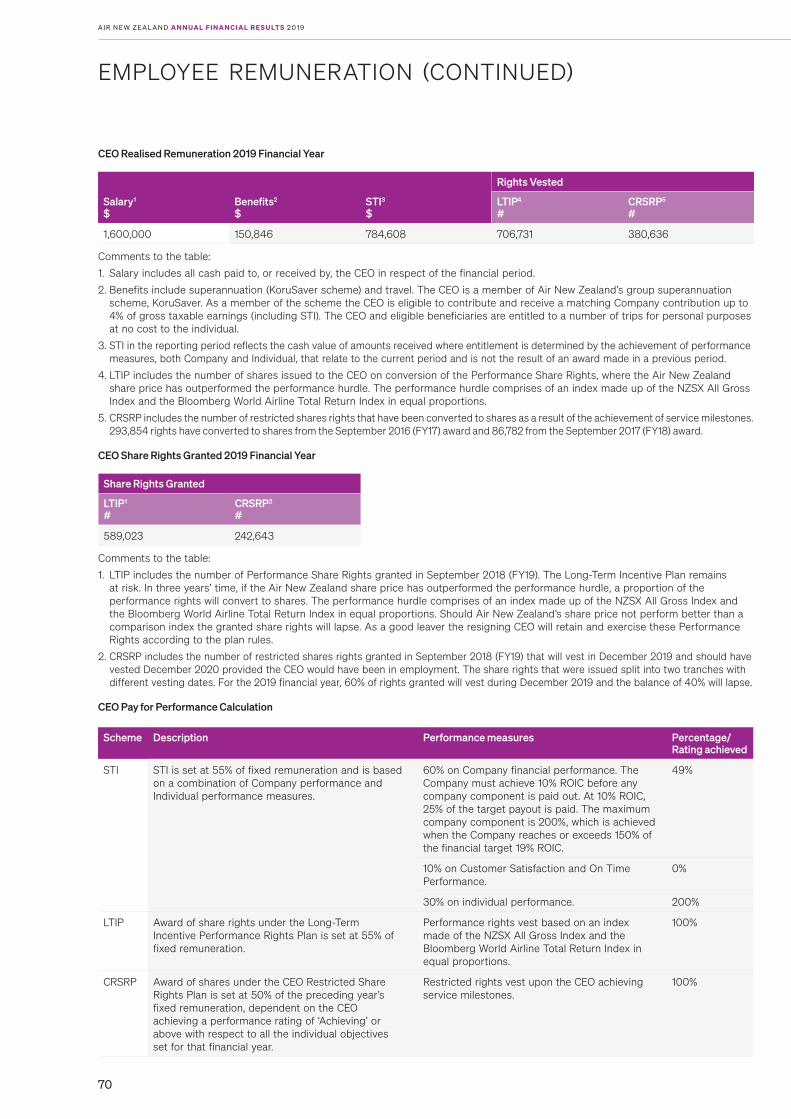
A I R N E W ZE A L A N D A N N UA L F I N A N C I A L R E S U LT S 2 0 1 9
70
EMPLOYEE REMUNERATION (CONTINUED)
CEO Realised Remuneration 2019 Financial Year
Rights Vested
Salary1 $
Benefits2 $
STI3 $
LTIP4
#CRSRP5
#
1,600,000 150,846 784,608 706,731 380,636
Comments to the table:
1. Salary includes all cash paid to, or received by, the CEO in respect of the financial period.
2. Benefits include superannuation (KoruSaver scheme) and travel. The CEO is a member of Air New Zealand’s group superannuation scheme, KoruSaver. As a member of the scheme the CEO is eligible to contribute and receive a matching Company contribution up to 4% of gross taxable earnings (including STI). The CEO and eligible beneficiaries are entitled to a number of trips for personal purposes at no cost to the individual.
3. STI in the reporting period reflects the cash value of amounts received where entitlement is determined by the achievement of performance measures, both Company and Individual, that relate to the current period and is not the result of an award made in a previous period.
4. LTIP includes the number of shares issued to the CEO on conversion of the Performance Share Rights, where the Air New Zealand share price has outperformed the performance hurdle. The performance hurdle comprises of an index made up of the NZSX All Gross Index and the Bloomberg World Airline Total Return Index in equal proportions.
5. CRSRP includes the number of restricted shares rights that have been converted to shares as a result of the achievement of service milestones. 293,854 rights have converted to shares from the September 2016 (FY17) award and 86,782 from the September 2017 (FY18) award.
CEO Share Rights Granted 2019 Financial Year
Share Rights Granted
LTIP1
#CRSRP2
#
589,023 242,643
Comments to the table:
1. LTIP includes the number of Performance Share Rights granted in September 2018 (FY19). The Long-Term Incentive Plan remains at risk. In three years’ time, if the Air New Zealand share price has outperformed the performance hurdle, a proportion of the performance rights will convert to shares. The performance hurdle comprises of an index made up of the NZSX All Gross Index and the Bloomberg World Airline Total Return Index in equal proportions. Should Air New Zealand’s share price not perform better than a comparison index the granted share rights will lapse. As a good leaver the resigning CEO will retain and exercise these Performance Rights according to the plan rules.
2. CRSRP includes the number of restricted shares rights granted in September 2018 (FY19) that will vest in December 2019 and should have vested December 2020 provided the CEO would have been in employment. The share rights that were issued split into two tranches with different vesting dates. For the 2019 financial year, 60% of rights granted will vest during December 2019 and the balance of 40% will lapse.
CEO Pay for Performance Calculation
Scheme Description Performance measures Percentage/Rating achieved
STI STI is set at 55% of fixed remuneration and is based on a combination of Company performance and Individual performance measures.
60% on Company financial performance. The Company must achieve 10% ROIC before any company component is paid out. At 10% ROIC, 25% of the target payout is paid. The maximum company component is 200%, which is achieved when the Company reaches or exceeds 150% of the financial target 19% ROIC.
49%
10% on Customer Satisfaction and On Time Performance.
0%
30% on individual performance. 200%
LTIP Award of share rights under the Long-Term Incentive Performance Rights Plan is set at 55% of fixed remuneration.
Performance rights vest based on an index made of the NZSX All Gross Index and the Bloomberg World Airline Total Return Index in equal proportions.
100%
CRSRP Award of shares under the CEO Restricted Share Rights Plan is set at 50% of the preceding year’s fixed remuneration, dependent on the CEO achieving a performance rating of ‘Achieving’ or above with respect to all the individual objectives set for that financial year.
Restricted rights vest upon the CEO achieving service milestones.
100%

A I R N E W ZE A L A N D G R O U P
71
SUBSIDIARY AND JOINT VENTURE COMPANIES
The following people were directors of Air New Zealand’s subsidiary and joint venture companies in the financial year to 30 June 2019. Those who resigned during the year are signified by (R). These companies are New Zealand incorporated companies except where otherwise indicated.
No director of any subsidiary received beneficially any director’s fees or other benefits except as an employee.
11Ants Analytics Group Limited Glen BondJeremy O’BrienMark Street (R)
ADP (New Zealand) Limited Jennifer PageChloe Surridge Brian WilsonKaren Clayton (R)Sarah Williamson (R)
Air Nelson Limited Glen BondKelvin DuffJohn WhittakerMichael Williams
Air New Zealand Aircraft Holdings Limited
Stephan DeschampsJeffrey McDowall Jennifer PageKaren Clayton (R)
Air New Zealand Associated Companies Limited
Stephan DeschampsJeffrey McDowallJennifer PageKaren Clayton (R)
Air New Zealand Associated Companies (Australia) Limited
Jeffrey McDowallJennifer PageKaren Clayton (R)Hugh Roberts (R)
Air New Zealand Express Limited Jeffrey McDowall Jennifer PageKaren Clayton (R)Hugh Roberts (R)
Air New Zealand Regional Maintenance Limited
Vivian De BeusCarrie HurihanganuiShehan SinnadurayAdam McMillan (R)Bruce Parton (R)
Air New Zealand Travel Business Limited
Jeffrey McDowall Jennifer PageKaren Clayton (R)Hugh Roberts (R)
ANNZES Engines Christchurch Limited Jeffrey McDowall Jennifer PageKaren Clayton (R)Hugh Roberts (R)
Ansett Australia & Air New Zealand Engineering Services Limited
Jeffrey McDowall Jennifer PageKaren Clayton (R)Hugh Roberts (R)
Eagle Airways Limited Glen Bond Jennifer PageMichael Williams Karen Clayton (R)
Mount Cook Airline Limited Glen BondKelvin DuffJohn WhittakerMichael Williams
TEAL Insurance Limited Michelle RedingtonHannah Ringland
Air New Zealand (Australia) Pty Limited (incorporated in Australia)
Jennifer PageKathryn RobertsonKaren Clayton (R)Hugh Roberts (R)
ANZGT Field Services LLC (Joint Venture, incorporated in Del., USA)
Greg BobrowJohn CallesenTrevor HughesTodd Witwer Adam McMillan (R)

A I R N E W ZE A L A N D A N N UA L F I N A N C I A L R E S U LT S 2 0 1 9
72
OTHER DISCLOSURES
DonationsThe Air New Zealand Group has made donations totalling $22,490 in the financial year to 30 June 2019. No donations were made to any political party. It is Air New Zealand’s policy not to make donations, in cash or in kind, or to provide free of charge travel to political parties.
Substantial product holdersThe following information is provided in compliance with Section 293 of the Financial Markets Conduct Act 2013 and is stated as at 30 June 2019. The total number of listed Ordinary shares of Air New Zealand Limited at that date was 1,122,844,227.
Substantial Product Holder Quoted voting products in the Company in which a relevant interest is held
Her Majesty the Queen in Right of New Zealand 588,887,282* ordinary shares
In 1989, the Crown issued a Notice that arises through its holding of special rights Convertible Share, the “Kiwi Share” and the power of the Kiwi Shareholder under the Constitution. Full details of the rights pertaining to these shares are set out in the Company’s Constitution. The Kiwi Share does not confer any right on its holder to vote at a shareholders’ meeting unless the Kiwi Share has been converted into an Ordinary Share by its holder. The Kiwi Share is not listed on any stock exchange.
*Relevant interests held as follows: As reported in its most recent Substantial Security Holder notice dated 6 July 2015, held by Her Majesty the Queen in Right of New Zealand acting by and through her Minister of Finance (582,854,593 Ordinary shares) and New Zealand Superannuation Fund (6,032,689 Ordinary shares) being property of Her Majesty the Queen in Right of New Zealand and managed by the Guardians of New Zealand Superannuation.

A I R N E W ZE A L A N D G R O U P
73
SECURITIES STATISTICS
Top Twenty Shareholders – as at 1 August 2019
Investor Name Number of Ordinary Shares % of Ordinary Shares
Her Majesty The Queen In Right Of New Zealand acting by and through her Minister of Finance
582,854,593 51.91
HSBC Nominees (New Zealand) Limited 92,810,194 8.27
JPMORGAN Chase Bank 87,529,251 7.80
HSBC Nominees (New Zealand) Limited 69,952,115 6.23
Citibank Nominees (NZ) Ltd 54,885,953 4.89
Accident Compensation Corporation 18,367,852 1.64
Citicorp Nominees Pty Limited 13,665,343 1.22
HSBC Custody Nominees (Australia) Limited 7,381,911 0.66
New Zealand Depository Nominee Limited 6,893,875 0.61
New Zealand Superannuation Fund Nominees Limited 5,354,437 0.48
Cogent Nominees Limited 5,171,245 0.46
J P Morgan Nominees Australia Pty Limited 4,938,746 0.44
National Nominees Limited 4,840,835 0.43
BNP Paribas Nominees NZ Limited 4,352,825 0.39
Premier Nominees Limited 4,328,858 0.39
TEA Custodians Limited 3,935,080 0.35
FNZ Custodians Limited 3,620,268 0.32
Christopher Luxon 3,380,636 0.30
National Nominees New Zealand Limited 2,579,521 0.23
Garth Barfoot 2,250,000 0.20
Total 979,093,538 87.20
Shareholder Statistics – as at 1 August 2019
Size of Holding Investors % Investors Shares % Issued
1-1,000 15,055 54.57 6,166,016 0.55
1,001-5,000 8,019 29.07 20,247,401 1.80
5,001-10,000 2,267 8.22 17,431,143 1.55
10,001-100,000 2,110 7.65 54,949,909 4.90
100,001 and Over 134 0.49 1,024,049,758 91.20
Total 27,585 100.00 1,122,844,227 100.00
Bondholder Statistics – as at 1 August 2019
Size of Holding Holders % Holders Bonds % Issued
1-1,000 - - - -
1,001-5,000 40 6.57 200,000 0.40
5,001-10,000 145 23.81 1,423,000 2.85
10,001-100,000 397 65.19 13,037,000 26.07
100,001 and Over 27 4.43 35,340,000 70.68
Total 609 100.00 50,000,000 100.00
Current on-market share buybacksThere is no current share buyback in the market.

A I R N E W ZE A L A N D A N N UA L F I N A N C I A L R E S U LT S 2 0 1 9
74
OPERATING FLEET STATISTICS
As at 30 June 2019*
Boeing 777-300ER
Number: 7Average Age: 7.2 yearsMaximum Passengers: 342Cruising Speed: 910 km/hrAverage Daily Utilisation: 14:10 hrs
Boeing 777-200ER
Number: 8Average Age: 13.2 yearsMaximum Passengers: 312Cruising Speed: 910 km/hrAverage Daily Utilisation: 11:36 hrs
Boeing 787-9 Dreamliner
Number: 13Average Age: 3.1 yearsMaximum Passengers: 302 or 275Cruising Speed: 910 km/hrAverage Daily Utilisation: 12:26 hrs
Airbus A320/321NEO
Number: 8Average Age A321: 0.5 years
A320: 0.3 yearsMaximum Passengers: A321: 214
A320: 165Cruising Speed: 850 km/hrAverage Daily Utilisation: A321: 8:59 hrs
A320: 9:38 hrs
Airbus A320CEO
Number: 25Average Age: 15 years short-haul, or
5.4 years domesticMaximum Passengers: 168 short-haul, or
171 domesticCruising Speed: 850 km/hrAverage Daily Utilisation: 9:23 hrs short-haul, or
8:11 hrs domestic
ATR 72-500 / ATR 72-600
Number: 29Average Age: 6.8 years Maximum Passengers: 68Cruising Speed: 518 km/hrAverage Daily Utilisation: 6:50 hrs
Bombardier Q300
Number: 23Average Age: 12.4 yearsMaximum Passengers: 50Cruising Speed: 520 km/hrAverage Daily Utilisation: 6:28 hrs
*The fleet statistics do not include short-term leased capacity to cover Boeing 787-9 engine issues.
A I R N E W ZE A L A N D G R O U P
75
GENERAL INFORMATION
Stock exchange listingsAir New Zealand’s Ordinary Shares have been listed on the NZX Main Board (ticker code AIR) since 24 October 1989. It also has bonds listed on the NZX Debt Market (ticker code AIR020).
Air New Zealand’s Ordinary Shares are listed on ASX (ticker code AIZ) as a Foreign Exempt Listing. The Foreign Exempt Listing means that Air New Zealand is expected to comply primarily with the Listing Rules of the NZX Main Board (being the rules of its home exchange) and is exempt from complying with most of ASX’s Listing Rules.
NZX has introduced new NZX Listing Rules which took effect from 1 January 2019 (the “New Rules”). In accordance with NZX’s transitional arrangements, Air New Zealand operated under the old NZX Listing Rules for the entire financial year to 30 June 2019, and transitioned to the New Rules with effect from 1 July 2019.
Neither NZX nor ASX has taken any disciplinary action against the Company during the financial year ended 30 June 2019. In particular there was no exercise of powers by NZX under old NZX Listing Rule 5.4.2 (equivalent to New Rule 9.9.3, relating to powers to cancel, suspend or censure an issuer) with respect to Air New Zealand during the reporting period.
On 20 July 2017, Air New Zealand launched a sponsored Level 1 American Depositary Receipt (ADR) programme. Air New Zealand’s American Depositary Shares, each representing five Ordinary Air New Zealand shares and evidenced by ADRs, are traded over-the-counter in the United States (ticker code ANZLY).
Place of incorporation
New Zealand
In New Zealand, the Company’s Ordinary Shares are listed with a “non-standard” (NS) designation. This is due to particular provisions of the Company’s Constitution, including the rights attaching to the Kiwi Share1 held by the Crown and requirements regulating ownership and transfer of Ordinary Shares.
New Zealand Exchange
Waivers:
The following waivers from the NZX Listing Rules were granted to the Company or relied upon by the Company during the financial year ended 30 June 2019:
1. A waiver from old NZX Listing Rule 8.1.7 (equivalent to New Rule 6.5.2) to allow Air New Zealand to amend the terms of the Long-Term Incentive Plan and Chief Executive Officer Option Incentive Plan to provide that instead of purchasing/issuing a share for each option exercised, Air New Zealand would only purchase/issue a number of shares with a value (based on current market prices) equal to the delta between the aggregate of the market share price and the exercise price of the options exercised.
The decision by NZXMS of 31 August 2012 noted that the amendment will not affect the economic position of either the participant or Air New Zealand and will reduce the dilutionary effect on shareholders of the exercise of options.
2. Air New Zealand and the Crown (acting through the Ministry of Business, Innovation and Employment) have agreed terms under which Air New Zealand will provide government agencies with discounted fares. This agreement is likely to be a “Material Transaction” under old NZX Listing Rule 9.2.2(e). Given the Crown is a 51.91% shareholder of Air New Zealand, Air New Zealand sought (and was provided with) a waiver from old NZX Listing Rule 9.2.1 (equivalent to New Rule 5.2.1(a)) to enter into the transaction without the requirement to obtain shareholder approval. This waiver was granted subject to two independent directors of the board certifying that: (i) the agreement has been negotiated on arm’s length commercial terms; (ii) entry into the agreement is in the best interests of all shareholders (other than the Crown); and (iii) the Crown, as the majority shareholder in Air New Zealand, has not influenced the board of directors of Air New Zealand, to enter into the agreement. Two independent directors must confirm those same matters listed above, in any extension or renewal of the agreement.
Compliance with Listing Rules:
For the purposes of ASX Listing Rule 1.15.3, Air New Zealand Limited confirms the Company continues to comply with the NZX Listing Rules.
1. In 1989, the Crown issued a Notice that arises through its holding of special rights Convertible Share, the “Kiwi Share” and the power of the Kiwi Shareholder under the Constitution. Full details of the rights pertaining to these shares are set out in the Company’s Constitution. The Kiwi Share does not confer any right on its holder to vote at a shareholder’s meeting unless the Kiwi Share has been converted into an Ordinary Share by its holder. The Kiwi Share is not listed on any stock exchange.

A I R N E W ZE A L A N D A N N UA L F I N A N C I A L R E S U LT S 2 0 1 9
76
SHAREHOLDER DIRECTORY
New ZealandLink Market Services Limited
Level 11, Deloitte Centre
80 Queen Street, Auckland 1010
PO Box 91976, Auckland 1142
New Zealand
Investor Enquiries:
Phone: (64 9) 375 5998
Fax: (64 9) 375 5990
Email: [email protected]
AustraliaLink Market Services Limited
Level 12, 680 George Street
Sydney 2000, Australia
Locked Bag A14, Sydney South
NSW 1235, Australia
Investor Enquiries:
Phone: (61) 1300 554 474
Fax: (61 2) 9287 0303
Investor RelationsInvestor Relations Office
Private Bag 92007, Auckland 1142
New Zealand
Phone: 0800 22 22 18 (New Zealand)
(64 9) 336 2607 (Overseas)
Fax: (64 9) 336 2664
Email: [email protected]
Website: airnzinvestor.com
Annual MeetingDate: 25 September 2019
Time: 2:00 pm
Venue: Hunua Rooms, Aotea Centre
50 Mayoral Drive
Auckland
Current Credit RatingMoody’s rate Air New Zealand Baa2
AuditorDeloitte Limited (on behalf of the Auditor-General)
Deloitte Centre
80 Queen Street, Auckland Central
PO Box 115033, Shortland Street
Auckland 1140, New Zealand
Registered Office
New ZealandAir New Zealand Limited
Air New Zealand House
185 Fanshawe Street
Auckland 1010
Postal: Private Bag 92007
Auckland 1142, New Zealand
Phone: (64 9) 336 2400
Fax: (64 9) 336 2401
NZBN 9429040402543
Australia
Level 12
7 Macquarie Place
Sydney
Postal: GPO 3923, Sydney
NSW 2000, Australia
Phone: (61 2) 8235 9999
Fax: (61 2) 8235 9946
ABN 70 000 312 685
Board of DirectorsTony Carter – Chairman
Jan Dawson – Deputy Chairman
Rob Jager
Linda Jenkinson
Sir John Key
Jonathan Mason
Dame Therese Walsh
Chief Executive OfficerChristopher Luxon
Chief Financial Officer
Jeff McDowall
General Counsel and Company SecretaryJennifer Page

A I R N E W ZE A L A N D G R O U P


![Chap3 Airline Economics[2] - George Mason University2].pdf · • Airline networks create complications for analysis of market demand and supply – Not all A‐B passengers will](https://img.pdfslide.net/doc/110x75/5e28d55e19622b7d056664c7/chap3-airline-economics2-george-mason-university-2pdf-a-airline-networks.jpg)