Embed Size (px)
Citation preview

1

2
Create Maximum Optimization and
Efficiency for Your Measurement and
Automation Applications
Introduction to NI LabVIEW and Fundamentals
in Data Acquisition with NI-DAQ
Pham Quoc Hung
Field Systems Engineer
Tel: 0932529288
Email: [email protected]
http://vietnam.ni.com

3
What You’ll See Today
• Overview of National Instruments
• Virtual Instrumentation and Graphical System Design
• LabVIEW graphical programming fundamentals
• Ease of Data Acqusition (DAQ) with NI
• Application Areas
• Web-based Remote Monitoring
• Next Steps
4
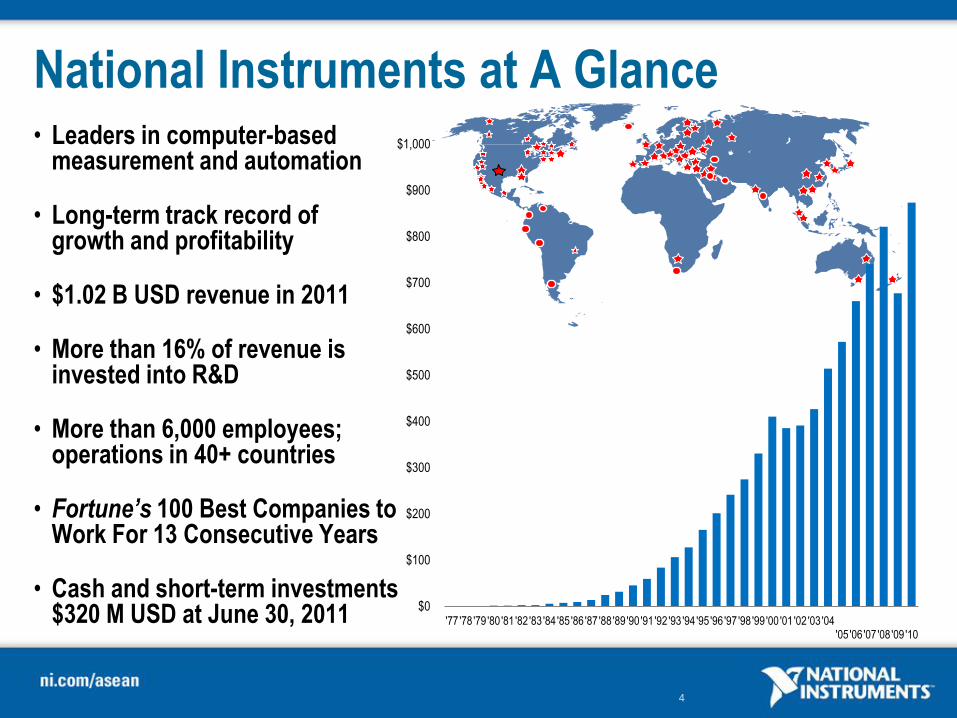
National Instruments at A Glance • Leaders in computer-based
measurement and automation
• Long-term track record of growth and profitability
• $1.02 B USD revenue in 2011
• More than 16% of revenue is invested into R&D
• More than 6,000 employees; operations in 40+ countries
• Fortune’s 100 Best Companies to Work For 13 Consecutive Years
• Cash and short-term investments $320 M USD at June 30, 2011
$0
$100
$200
$300
$400
$500
$600
$700
$800
$900
$1,000
'77 '78 '79 '80 '81 '82 '83 '84 '85 '86 '87 '88 '89 '90 '91 '92 '93 '94 '95 '96 '97 '98 '99 '00 '01 '02 '03 '04 '05
'06
'07
'08
'09
'10

5
6
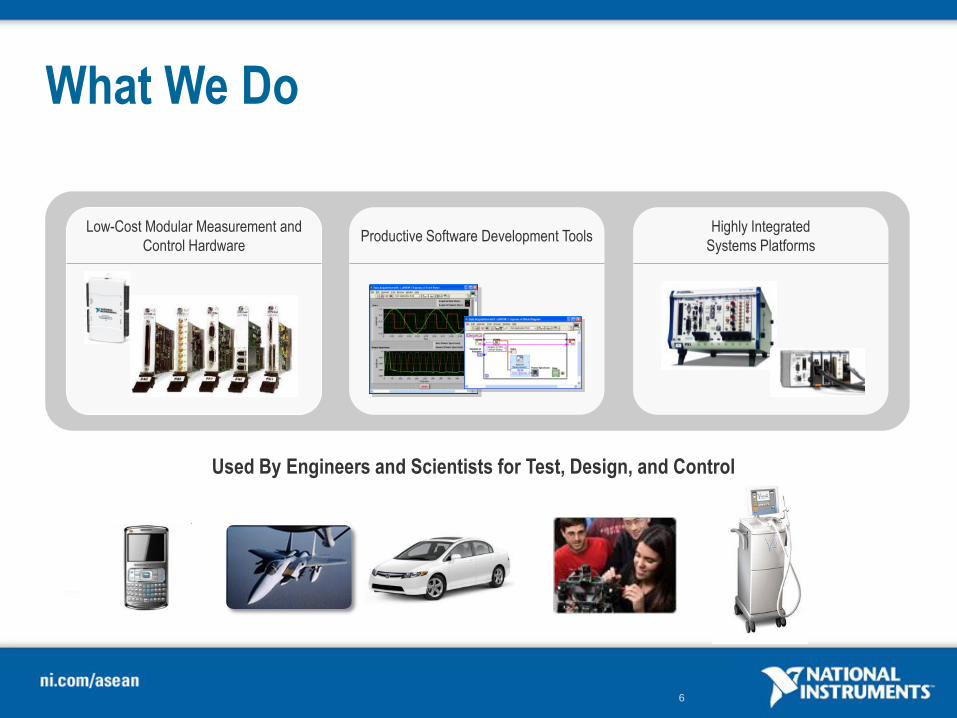
Low-Cost Modular Measurement and
Control Hardware Productive Software Development Tools
Highly Integrated
Systems Platforms
Used By Engineers and Scientists for Test, Design, and Control
What We Do

7
Empowering Users Through Software Providing unique differentiation and competitive advantage
LEGO® MINDSTORMS® NXT
“the smartest, coolest toy
of the year”
CERN Large Hadron Collider
“the most powerful instrument on earth”

8
Embedded Devices and Machines
Algorithm IP
Display
Drives and Motors
Vision
Controller and I/O
Control Software

9
Diversity of Applications
No Industry >15% of Revenue
Electronics Semiconductors Computers
Advanced
Research
Petrochemical Food
Processing
Textiles
Automotive Telecom
ATE Military/ Aerospace
Academic

10
Who are NI Customers? More than 30,000 companies More than 90% of Fortune 500 manufacturing companies

11
What is Virtual Instrumentation?
Customer-Defined PC-Based Measurement
and Automation Solutions
Traditional Vendor-Defined Instruments
Processor
RAM
ROM
Display
Power Supply
Hard Disk
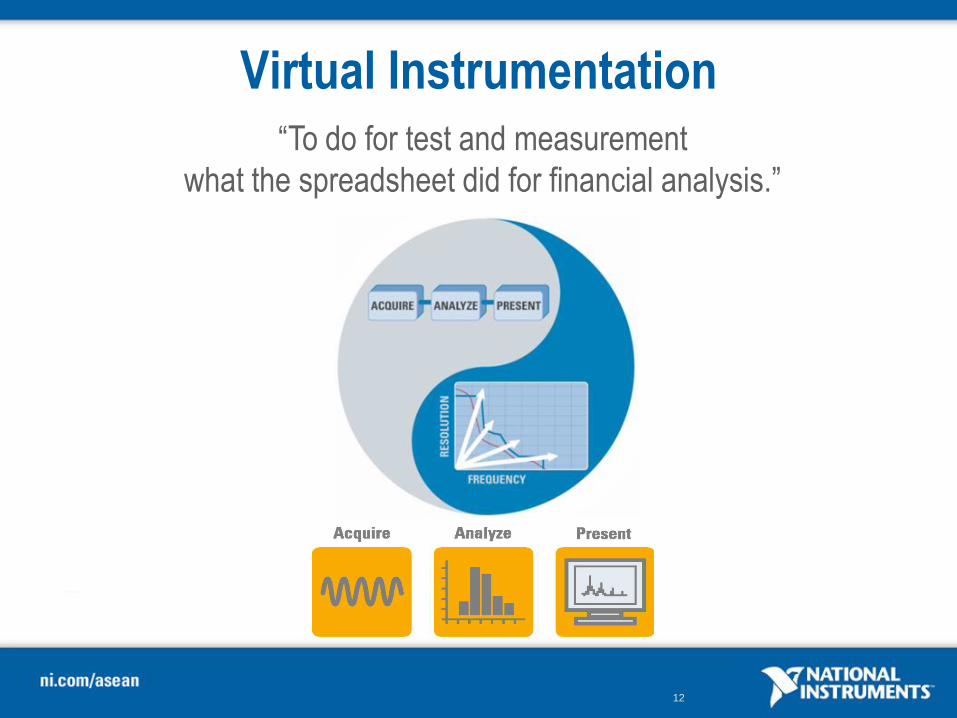
12
Virtual Instrumentation “To do for test and measurement
what the spreadsheet did for financial analysis.”
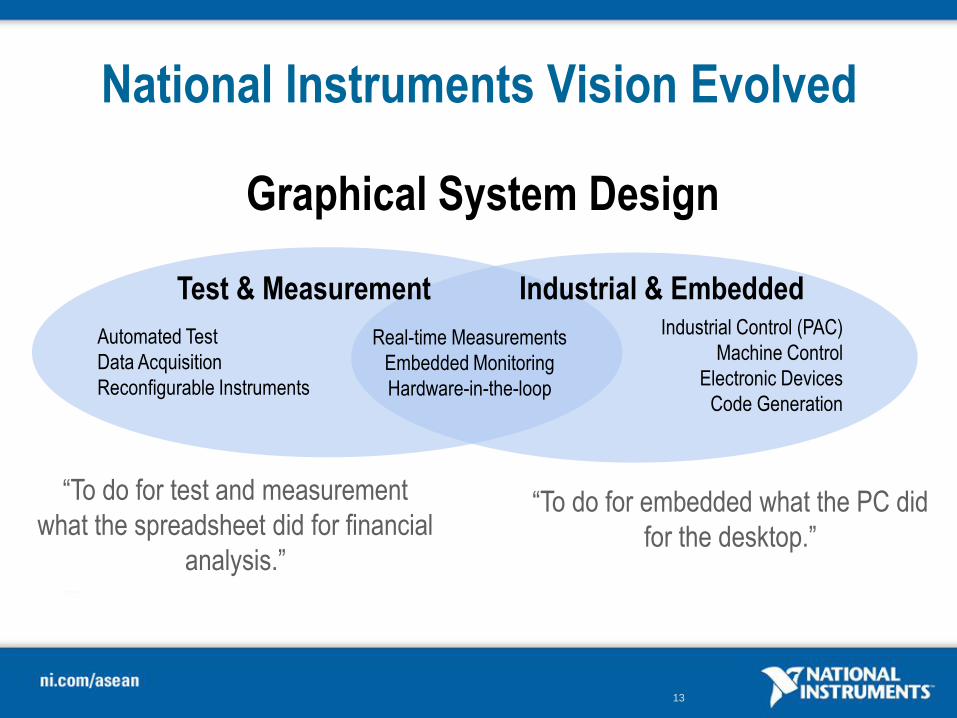
13
Graphical System Design
National Instruments Vision Evolved
Industrial & Embedded Test & Measurement
Real-time Measurements
Embedded Monitoring
Hardware-in-the-loop
Automated Test
Data Acquisition
Reconfigurable Instruments
Industrial Control (PAC)
Machine Control
Electronic Devices
Code Generation
“To do for embedded what the PC did
for the desktop.”
“To do for test and measurement
what the spreadsheet did for financial
analysis.”

14

15
Virtual Instrumentation with LabVIEW
Automated
Test
Industrial
Embedded
Software-defined
behavior
Modular
I/O
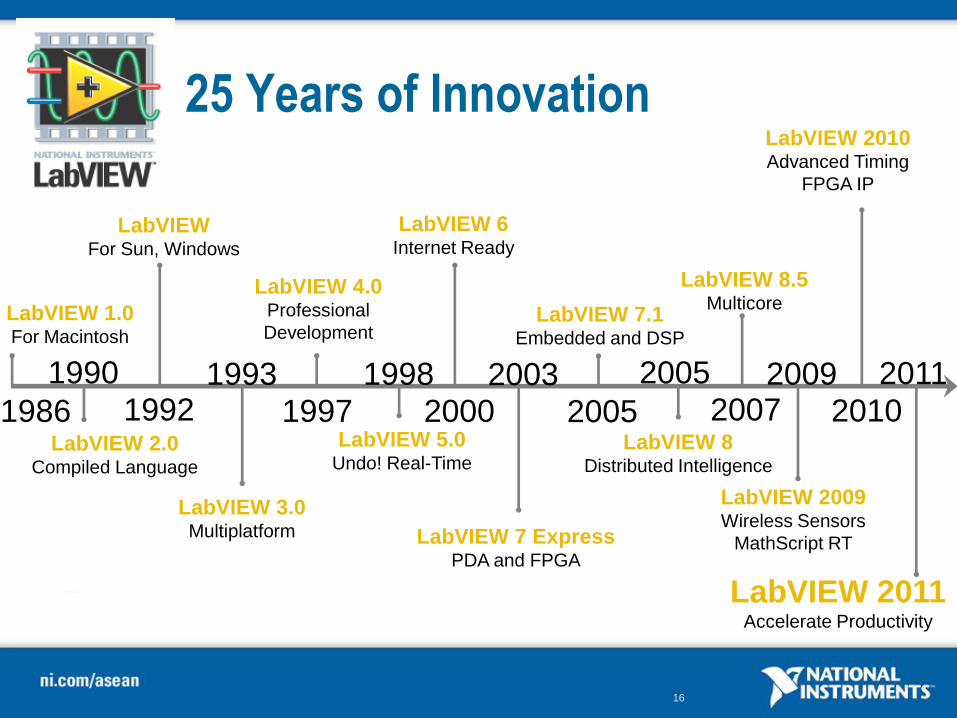
16
2005 2007
2003 2005
1998 2000
1993 1997
1990 1992 1986
LabVIEW 1.0 For Macintosh
LabVIEW 2.0 Compiled Language
LabVIEW For Sun, Windows
LabVIEW 3.0 Multiplatform
LabVIEW 4.0 Professional
Development
LabVIEW 6 Internet Ready
LabVIEW 5.0 Undo! Real-Time
LabVIEW 7 Express PDA and FPGA
LabVIEW 7.1 Embedded and DSP
LabVIEW 8.5 Multicore
LabVIEW 8 Distributed Intelligence
25 Years of Innovation
LabVIEW 2009 Wireless Sensors
MathScript RT
2009 2010
LabVIEW 2010 Advanced Timing
FPGA IP
2011
LabVIEW 2011 Accelerate Productivity

17
Virtual Instrumentation Case Study
Application
Boeing used LabVIEW and 70 PXI chassis to
collect over 400 channels of acoustic data
simultaneously in their research to decrease
noise during takeoff
NI Products
LabVIEW, PXI
"Using NI software and hardware, we were able to
create a high-end, low-cost system that could distribute the acquisition system across multiple chassis, tightly
synchronize all channels, provide high channel count with full bandwidth on all channels simultaneously, and
allow virtually unlimited channel-count expansion. “ -- James Underbrink, Boeing Aero/Noise/Propulsion Laboratory

18
Virtual Instrumentation Case Study 448-channel Microphone Array
200 Hz
400 Hz
Airframe Noise
Inlet Noise

19
Oil Wells Vibration Monitoring for Vietsovpetro
• Applications: Vietsovpetro wants to drill
more oil wells between existing wells to
maintain output level when some existing
wells are depleted. This system is to
monitor the vibration during drilling to
alert operator if drilling shaft is about to
touch the existing wells. System was
developed by NI partner AIC.
http://sine.ni.com/cs/app/doc/p/id/cs-14201

20
What is LabVIEW?

21
Programming Approaches
Analysis Libraries
Deployment Targets
A Highly Productive Graphical Development Environment for Engineers and Scientists
APIs and Drivers Custom User Interfaces
Technology Abstractions
22
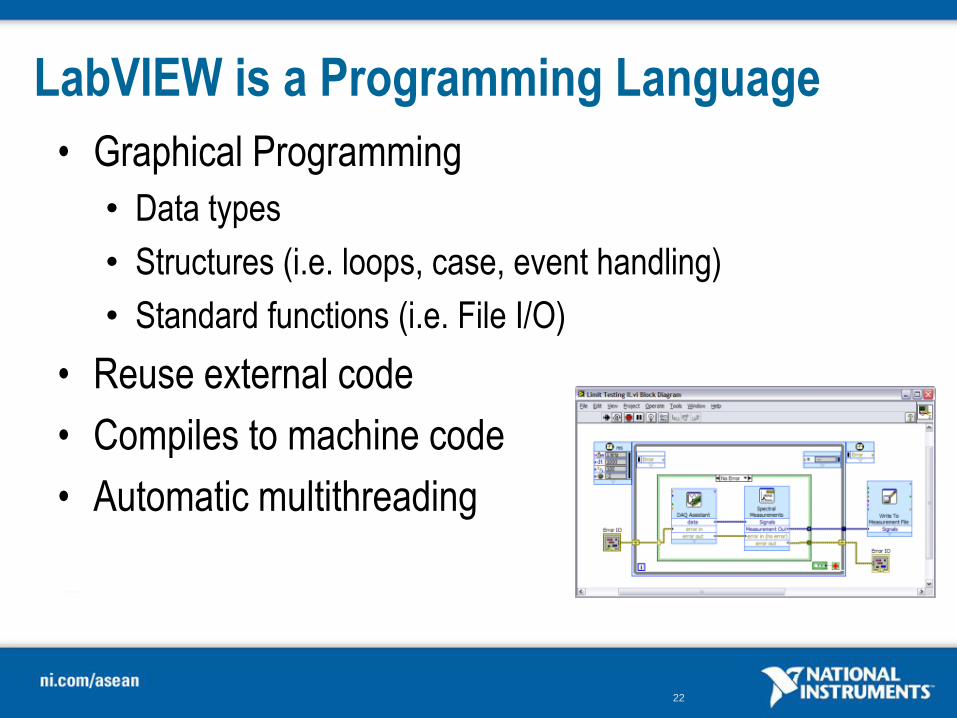
LabVIEW is a Programming Language
• Graphical Programming
• Data types
• Structures (i.e. loops, case, event handling)
• Standard functions (i.e. File I/O)
• Reuse external code
• Compiles to machine code
• Automatic multithreading

23
LabVIEW is a Development Environment
• Debugging tools
• Assistants
• Configurable functions
• I/O Finder
• Easy UI Development
• Software Engineering Tools
• Performance Tools

24
LabVIEW Has Built-in Engineering Libraries
• In-line and off-line analysis and control
• Signal processing
• Analysis and filtering
• Complex math
• PID
• Vision
• Motion

25
LabVIEW Easily Connects to Hardware I/O
• More than 9,000 instruments from over 350 vendors
• PCI, PCI Express (PCIe), PXI, PXI Express (PXIe), USB,
Ethernet, serial, GPIB, and CAN devices
• Modular data acquisition hardware from DC to 26.5 GHz
• Motion control stages
• Cameras
• Hundreds of PLCs

26
LabVIEW Fundamentals
27
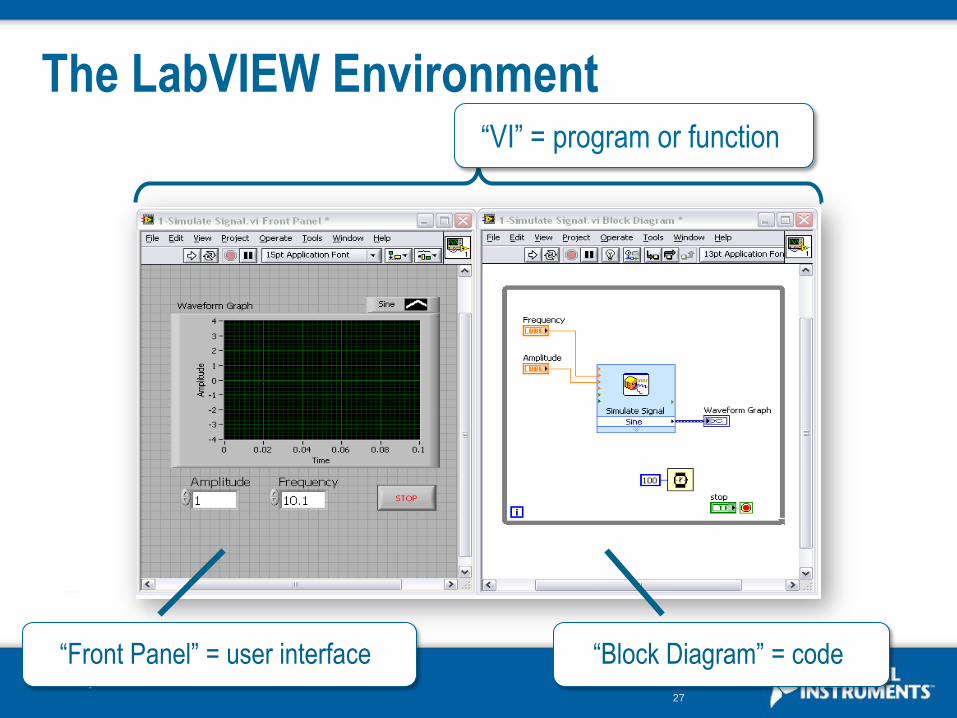
The LabVIEW Environment “VI” = program or function
“Front Panel” = user interface “Block Diagram” = code
28
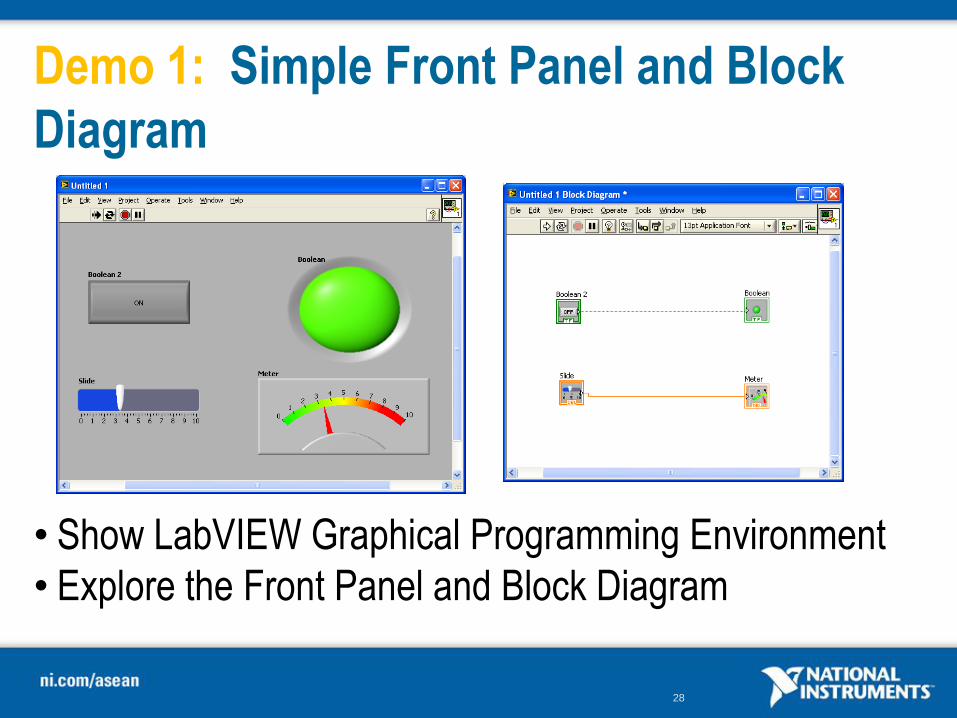
Demo 1: Simple Front Panel and Block
Diagram
• Show LabVIEW Graphical Programming Environment
• Explore the Front Panel and Block Diagram

29
Controls & Indicators
• Knobs/Dials
• Graphs/Charts
• Buttons
• Digital Displays
• Sliders
• Thermometers
• Customize and
create your own

30
Finding Front Panel Objects
or
• Right-click on Front Panel
• Browse by object hierarchy
• Press <ctrl + space> to bring up
• Search by object name
Controls Palette Controls Quick Drop

31
Functions and Express VIs
Configuration Based
Express VI
Standard VIs

32
Dataflow Programming
1
2
3
Comparison waits until all inputs are present, then executes
Once executed, output from comparison continues through code
Both Simulate Signal Express VIs execute simultaneously
1 2 3

33
Wires and Data Types
• Transfer data between block diagram objects
through wires
• Wires are different colors, styles, and thicknesses,
depending on their data types
• A broken wire appears as a dashed
black line with a red X in the middle
33
Scalar
1D Array
2D Array
DBL Numeric Integer Numeric String
34
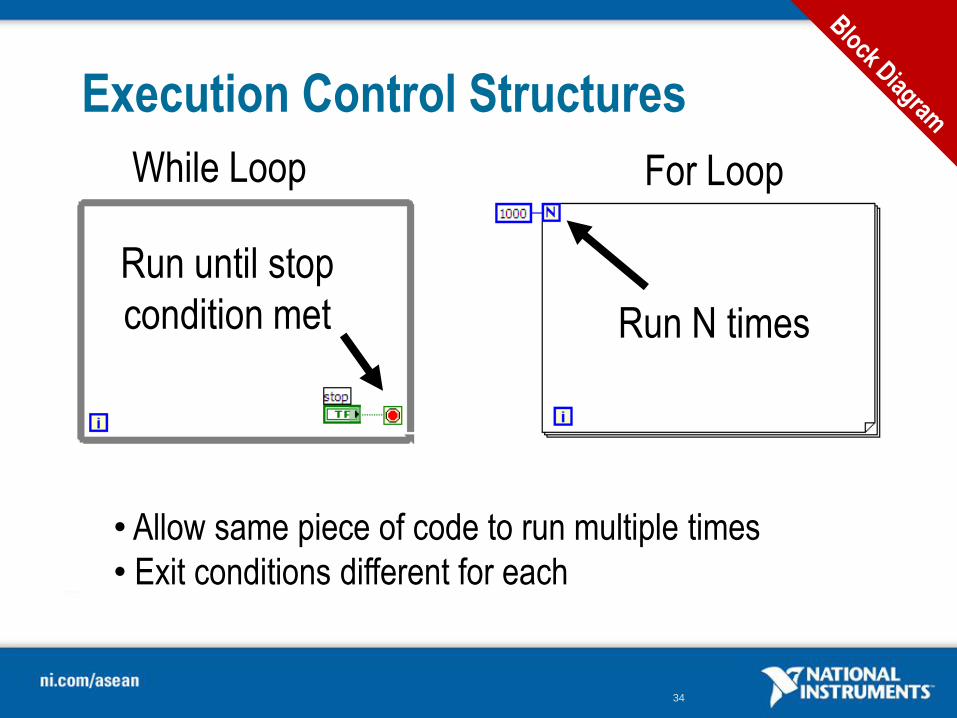
Execution Control Structures
While Loop For Loop
Run until stop
condition met Run N times
• Allow same piece of code to run multiple times
• Exit conditions different for each

35
Finding Block Diagram Functions
or
Functions Palette Functions Quick Drop
• Right-click on Block Diagram
• Browse by object hierarchy
• Press “ctrl + space” to bring up
• Search by object name
36
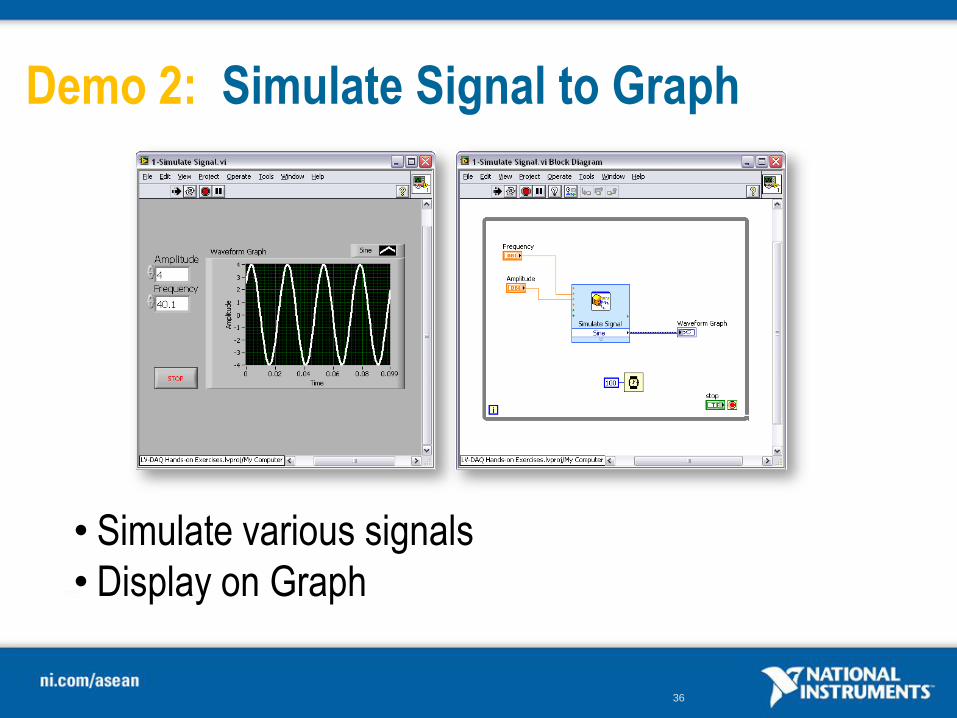
Demo 2: Simulate Signal to Graph
• Simulate various signals
• Display on Graph

37
Built-in Programming Assistance
Highlight Execution
Block Diagram Cleanup
Context Help

38
Data Acquisition
with LabVIEW
39
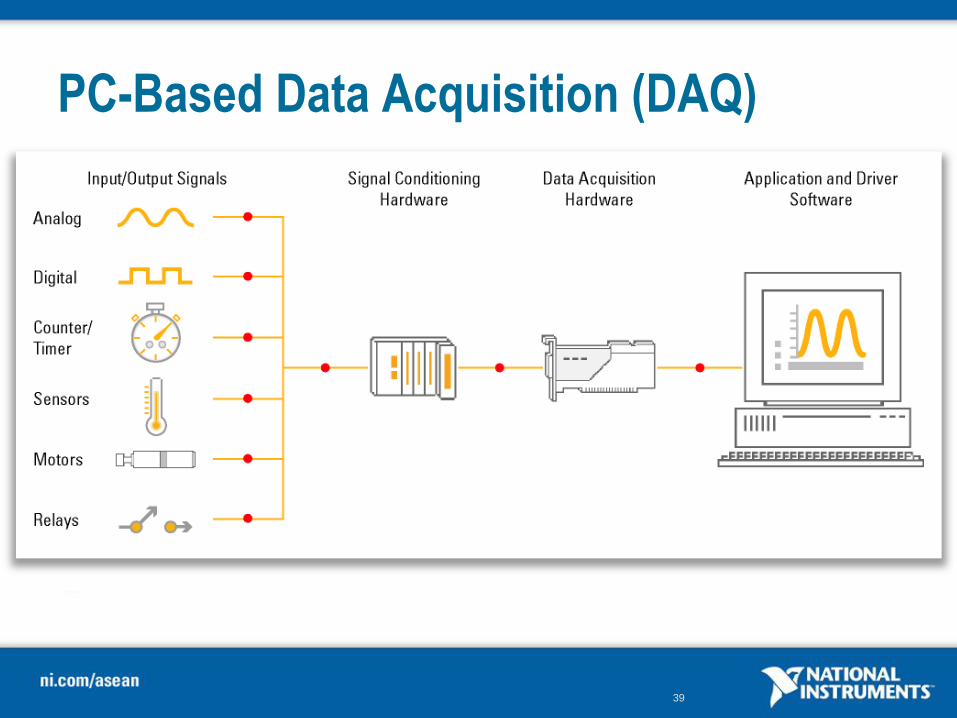
PC-Based Data Acquisition (DAQ)

40
NI DAQ Platforms
PCI/PCIe PXI/PXIe
USB Wireless
CompactDAQ
One application,
multiple targets
41
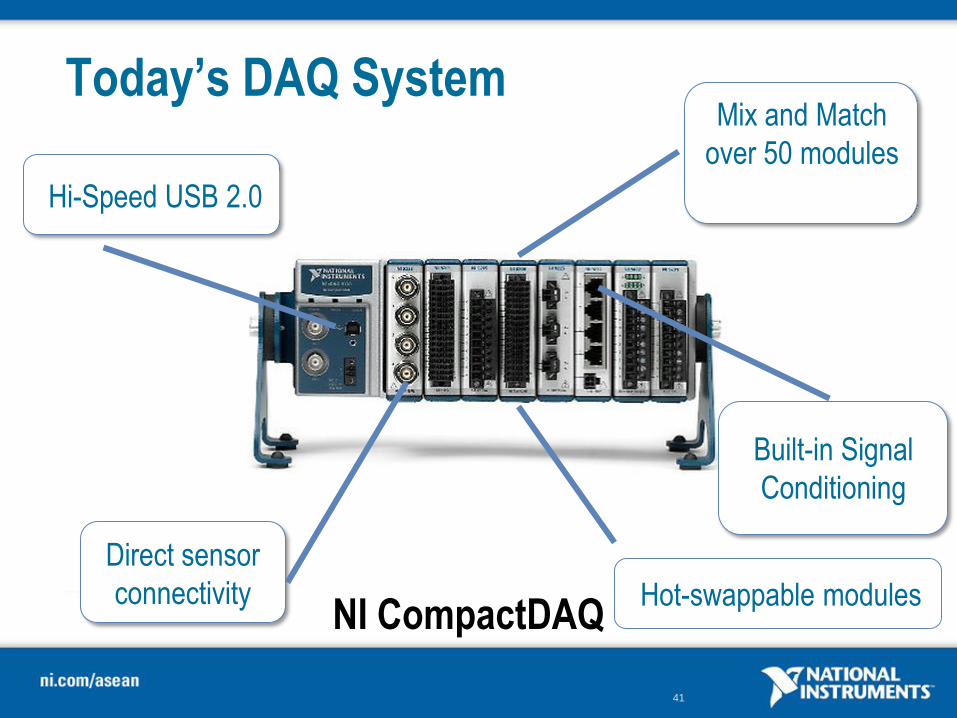
Today’s DAQ System
Hi-Speed USB 2.0
Mix and Match
over 50 modules
Hot-swappable modules
Direct sensor
connectivity NI CompactDAQ
Built-in Signal
Conditioning

42
Demo 3: Measurement and Automation
Explorer (MAX)
• Explore MAX and located/test connected Devices
• Do simple Data Acquisition

43
CompactDAQ Door Rattle Noise Analyzer
“We need a quote here to highlight how great LabVIEW, cDAQ and S&V are for making
advanced portable solutions.”
- Youngkey Kim, CEO, SM Instruments
NI Products
LabVIEW, CompactDAQ
Application
SM Instruments used LabVIEW and
CompactDAQ to design a portable “Sound
Camera” to analyze unwanted noise in
automobile testing.

44
Demo 4a: Taking a Basic Measurement
• Acquire temperature signal
• Display to graph
45
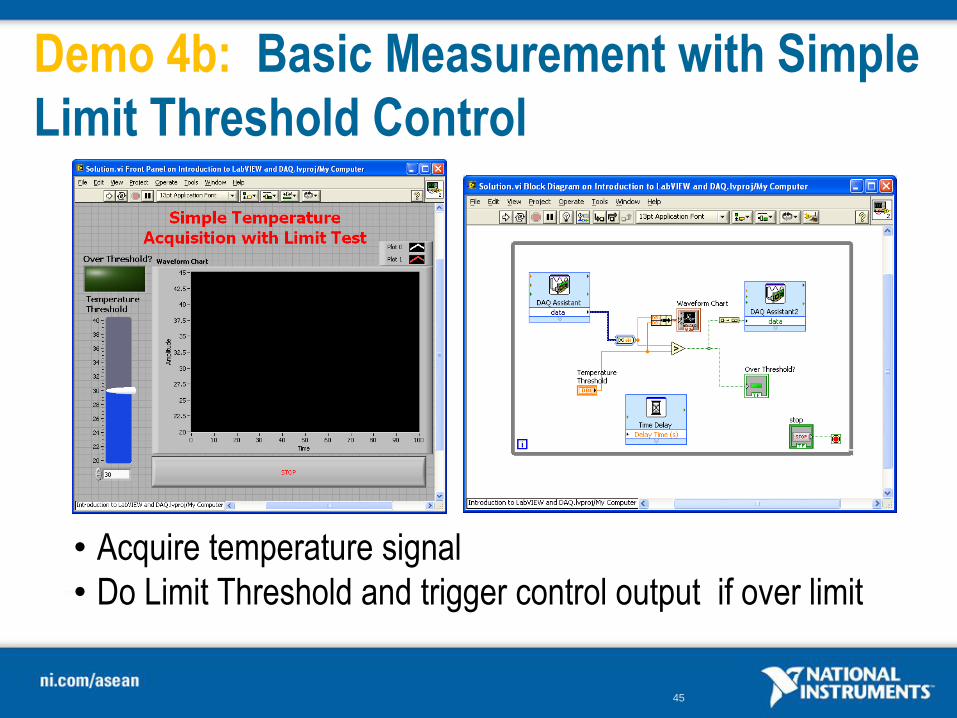
Demo 4b: Basic Measurement with Simple
Limit Threshold Control
• Acquire temperature signal
• Do Limit Threshold and trigger control output if over limit

46
Application Areas
Green Engineering Solving Environment Challenges with
Graphical System Design

47
Measure It and Fix It The Engineering Innovation Process
Measure Water and Air Quality
Measure CO2 and NOx Emissions
Measure Power Usage
Fix Old Engine Controllers
Fix Wasteful Processes
Fix New Sources of Energy
Measure Torque
Measure Horsepower
Measure Fuel consumption
Fix Spark and Fuel Timing
Fix Stability Control
Fix Reliability Issues

48
“Measure It” for Green Applications
• Acquire environmental data (CO2,
water quality, and temperature)
• Analyze power and energy (electrical
power quality and energy consumption)
• Present results reports (mercury and NOx regulation compliance)

49
“Fix It” for Green Applications
• Design more efficiently (more energy efficient products)
• Prototype new technologies (renewable energy generation)
• Deploy advanced controllers (optimize existing machinery)

50
“Once you start monitoring something in an automation system, you know you can fix things”
- Dave Brandt Electrical Engineer

51
• Green Benefit - Reduced chiller energy consumption by
up to 30%
Chiller Optimization in Tropical Countries
52
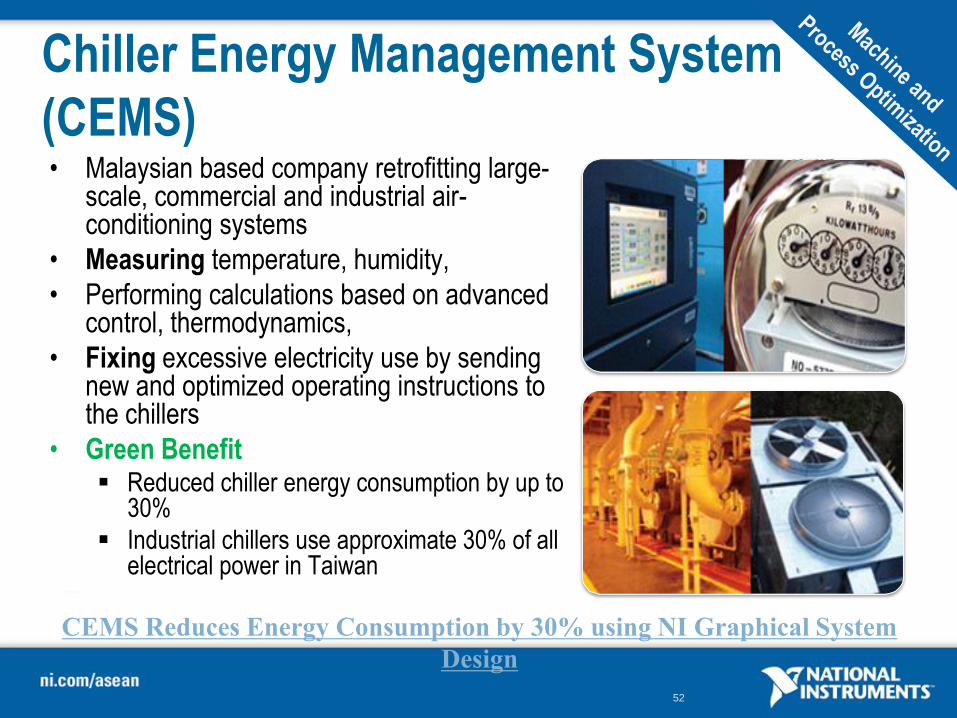
• Malaysian based company retrofitting large-scale, commercial and industrial air-conditioning systems
• Measuring temperature, humidity,
• Performing calculations based on advanced control, thermodynamics,
• Fixing excessive electricity use by sending new and optimized operating instructions to the chillers
• Green Benefit Reduced chiller energy consumption by up to
30%
Industrial chillers use approximate 30% of all electrical power in Taiwan
Chiller Energy Management System
(CEMS)
CEMS Reduces Energy Consumption by 30% using NI Graphical System
Design

53
Demo 5: Wireless Monitoring of
Temperature and Solar Panel
• Using NI WSN
(Wireless Sensor
Network) to monitor
ambient temperature
as well as voltage
output from a solar
panel NI Wireless Sensor Network (NI WSN)

54
Power Quality Measurements
• Definition
The ability of a power system to operate loads
without disturbing or damaging them
The ability of loads to operate without disturbing or
reducing the efficiency of the power
• Metrics
Flicker, dip/swell/interruption, harmonic, unbalance,
…

55
Reasons of Increased Interest in PQ
• Metering
• Protective Relays
• Downtime
• Cost
• Electromagnetic Compatibility
56
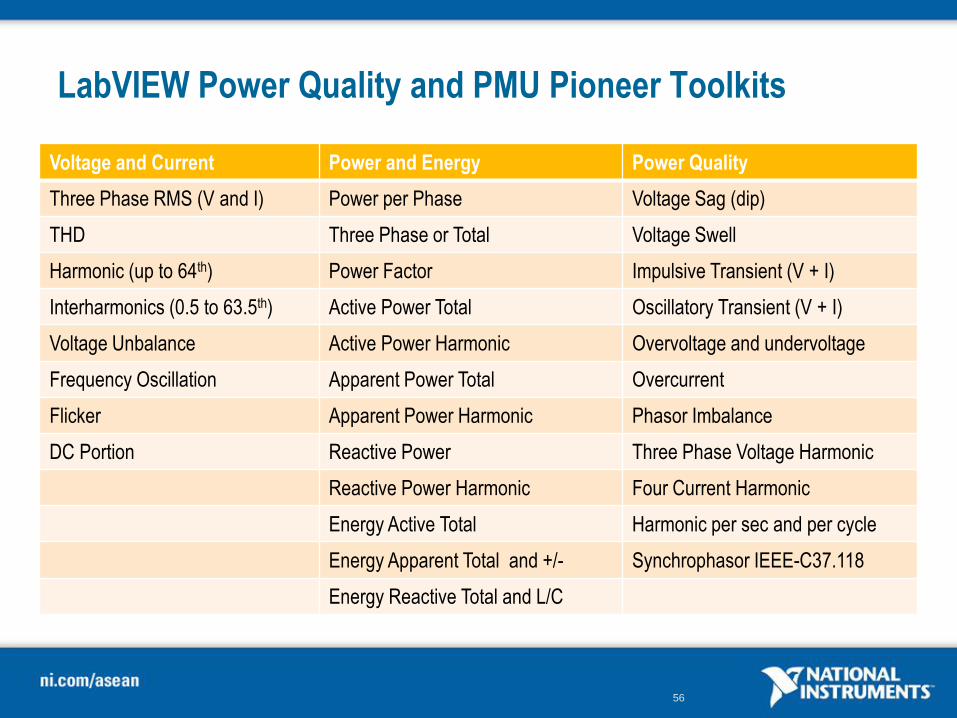
LabVIEW Power Quality and PMU Pioneer Toolkits
Voltage and Current Power and Energy Power Quality
Three Phase RMS (V and I) Power per Phase Voltage Sag (dip)
THD Three Phase or Total Voltage Swell
Harmonic (up to 64th) Power Factor Impulsive Transient (V + I)
Interharmonics (0.5 to 63.5th) Active Power Total Oscillatory Transient (V + I)
Voltage Unbalance Active Power Harmonic Overvoltage and undervoltage
Frequency Oscillation Apparent Power Total Overcurrent
Flicker Apparent Power Harmonic Phasor Imbalance
DC Portion Reactive Power Three Phase Voltage Harmonic
Reactive Power Harmonic Four Current Harmonic
Energy Active Total Harmonic per sec and per cycle
Energy Apparent Total and +/- Synchrophasor IEEE-C37.118
Energy Reactive Total and L/C

57
LabVIEW Power Quality Toolkit
58
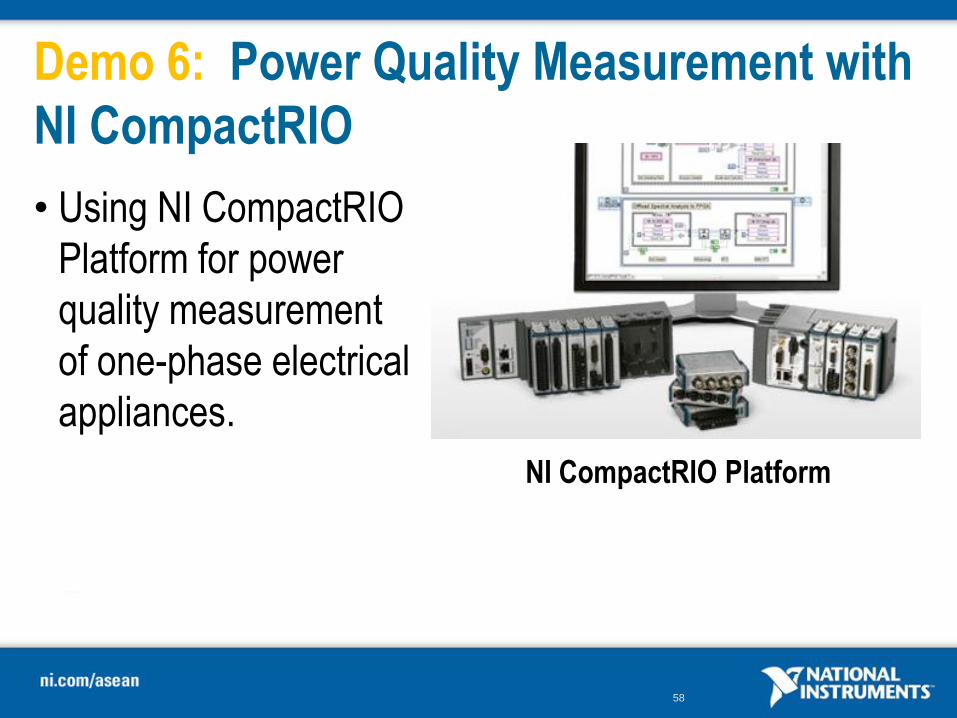
Demo 6: Power Quality Measurement with
NI CompactRIO
• Using NI CompactRIO
Platform for power
quality measurement
of one-phase electrical
appliances.
NI CompactRIO Platform

59
Case Study: Advanced Smart Distribution
Switch • Advanced analytics for distribution automation
• Development and introduction of advanced
switching features
• Embedded electrical power measurements and
monitoring
• Wireless communication for configuration and
file transfer
• Remote updates, configuration and firmware
upgrades
Analytics (NI Smart Grid Analyzer) •833 Samples/Cycle, 24-bit Resolution
•Advanced Embedded Analytics
•Data Storage, 1000+ event captures
•Remote upgrade
•Multi Protocol Communications
Distribution Switch •Rated Through 38kV
•Vacuum Interruption Technology
•Integrated CTs & Voltage Sensors
•Optional future upgrades
•ANSI / IEEE C37.60
•3-phase protection

60
Sound and Vibration Measurement
System Components
Data
Acquisition
Signal
Conditioning
A/D
Sensors
V
Input Signals
Output Signals
V
Analysis
61
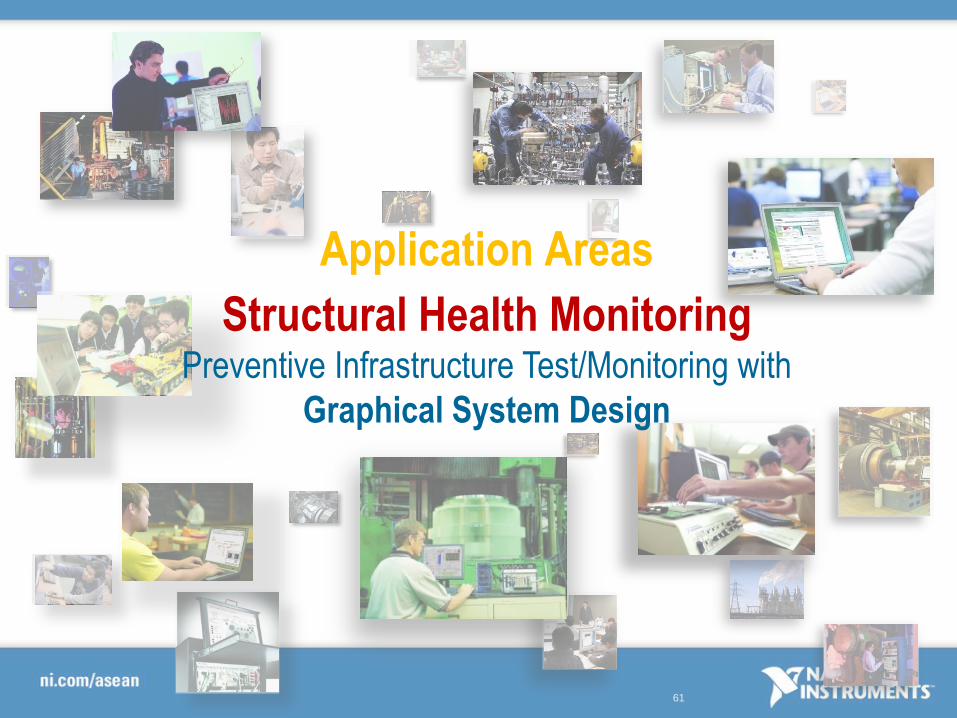
Application Areas
Structural Health Monitoring Preventive Infrastructure Test/Monitoring with
Graphical System Design

62
Sensors
Structural Measurement System
Signal
Conditioning
A/D
Timing
Data Storage
Online Processing
Comm. Data
Storage
Data Analysis
Data Presentation, Report Gen.
• More options
• MEMS and
more
dynamic
options
• Smarter
• Integrated signal conditioning
• Higher resolution (24-bit)
• Higher speed
• Lower cost
• Embedded software options
• Higher speed
• Distributed
• Web
connectivity
• Wireless
• Distributed
• Higher
performance; multi
core computing
V
Data Acquisition System
Bus/
Network
Data Mgt.
Trends
63
PXI
SCXI
CompactRIO
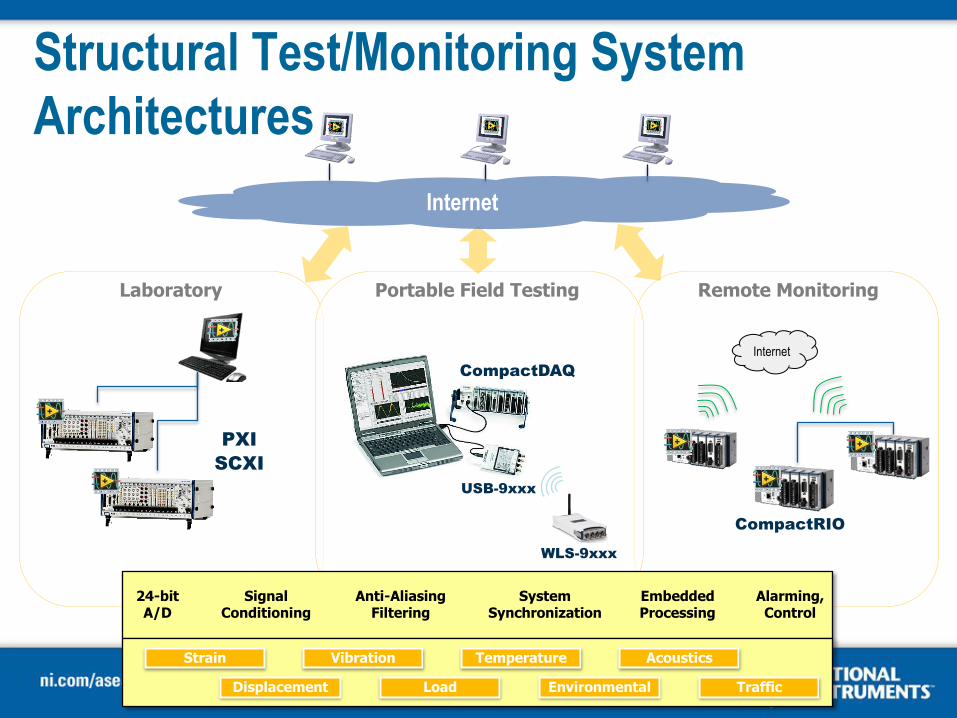
Structural Test/Monitoring System
Architectures
Laboratory Portable Field Testing Remote Monitoring
CompactDAQ
Internet
USB-9xxx
WLS-9xxx
24-bit A/D
Signal Conditioning
Anti-Aliasing Filtering
System Synchronization
Embedded Processing
Alarming, Control
Strain
Displacement
Vibration
Load
Temperature
Environmental
Acoustics
Traffic
Internet

64
Lab/Research Instrumentation
• PXI – Modular Instrumentation
PCI eXtensions for Instrumentation
Open; supported by over 60 vendors
Embedded PC controller
High performance ; best of class timing
and synchronization
• SCXI – Signal Conditioning
Front-end signal conditioning for PXI data
acquisition modules
Economical expansion of conditioned input
channels
NEES Centrifuge @ UC-Davis
Shaker Table @ UCSD
PXI
PXI/SCXI
SCXI

65
Large Channel Architecture with PXI/SCXI
• Maximum Scalability From 4 to 272 simultaneous channels in a single chassis
More than 10,000 synchronized channels in distributed systems
< 0.1 degree phase mismatch at 1 kHz
• Highest Data Throughput and Storage RAID-0 configurations with 3 TB of storage
• Best measurement performance 24-bit simultaneous A/D & D/A
120 dB dynamic range
204.8 kS/s/ch sampling rate
Wide range of sensor signal conditioning
PXI
SCXI
Combo PXI/SCXI
NI-449x 16-Ch IEPE
Module for PXI

66
Portable Application: Field Testing of Bridges
• Bridge testing and
diagnostics
Load rating
Calibrate FE model
Fatigue studies
Dynamic analysis
• Mode shapes, etc.
• Quick setup and
takedown
Strain Gauges
Accelerometers
• LabVIEW
• Signal Express
• CompactDAQ NI 9237 4-ch strain (2)
NI 9234 4-ch IEPE (2)

67
Portable DAQ with C Series
• CompactDAQ System
4-slot or 8-slot for I/O
Over 50 C Series I/O modules available
USB 2.0 / Gigabit Ethernet
• stream data at over 5Ms/s
Includes data logging software
• Single slot options
USB 2.0
Ethernet
Wi-Fi
68
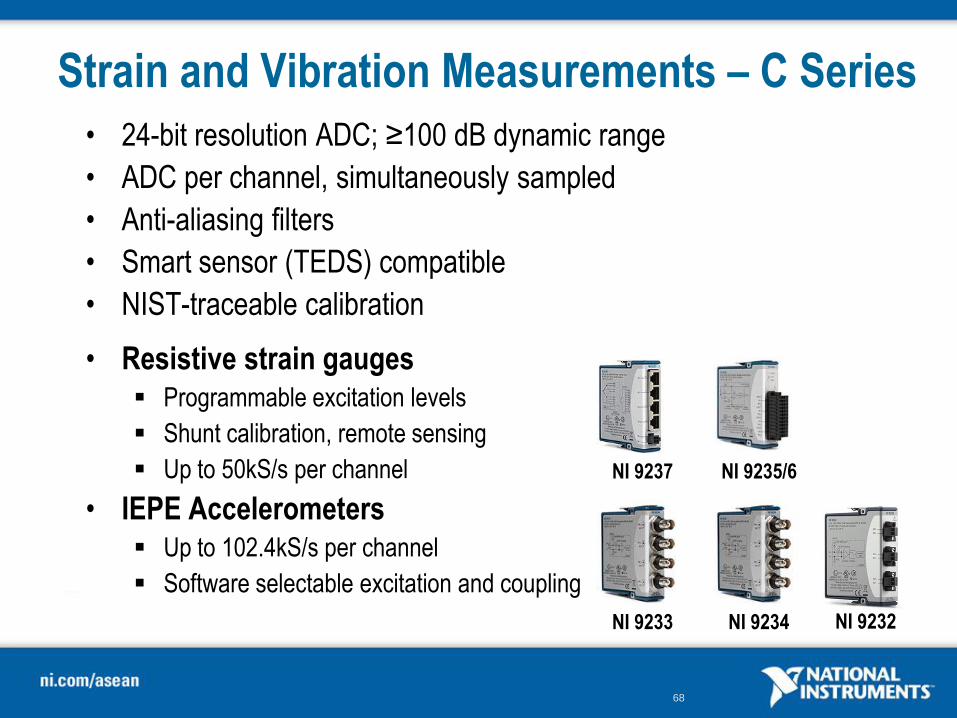
Strain and Vibration Measurements – C Series
• 24-bit resolution ADC; ≥100 dB dynamic range
• ADC per channel, simultaneously sampled
• Anti-aliasing filters
• Smart sensor (TEDS) compatible
• NIST-traceable calibration
• Resistive strain gauges Programmable excitation levels
Shunt calibration, remote sensing
Up to 50kS/s per channel
• IEPE Accelerometers Up to 102.4kS/s per channel
Software selectable excitation and coupling
NI 9233 NI 9234
NI 9237 NI 9235/6
NI 9232

69
Demo 7: Vibration Monitoring
• Using NI
CompactDAQ platform
to monitor vibration
and speed of motors
NI CompactDAQ Platform

70
Vibration Monitoring of Meazza Stadium in
Milan Requirements
• High-channel, distributed network
monitoring system
• Structural evaluations, modal
analysis, static and dynamic
measurements, and corrosion
testing
Solution
• 14 CompactRIO chassis with mixed
sensor connectivity
• LabVIEW for flexibility and
advanced analysis
Meazza Stadium Vibration Monitoring

71
Meazza Stadium in Milan
• Structural Measurement Diagnosis and Surveillance

72
Range of NI Machinery Applications
R&D Test Cells Factory Test Field Service,
Data logging
On-line
monitoring Protection

73
Web
Client Machines
Remote System
Industry Trend: Web-Based Monitoring and Control

74
Web Services Remote Monitoring and Control Technologies
• Introduced with LabVIEW 8.6
• Web services are web APIs
Hosted and executed on a remote system
Accessible via HTTP protocol
Response is typically formatted as XML
• Web services can be called from nearly all
programming languages
75
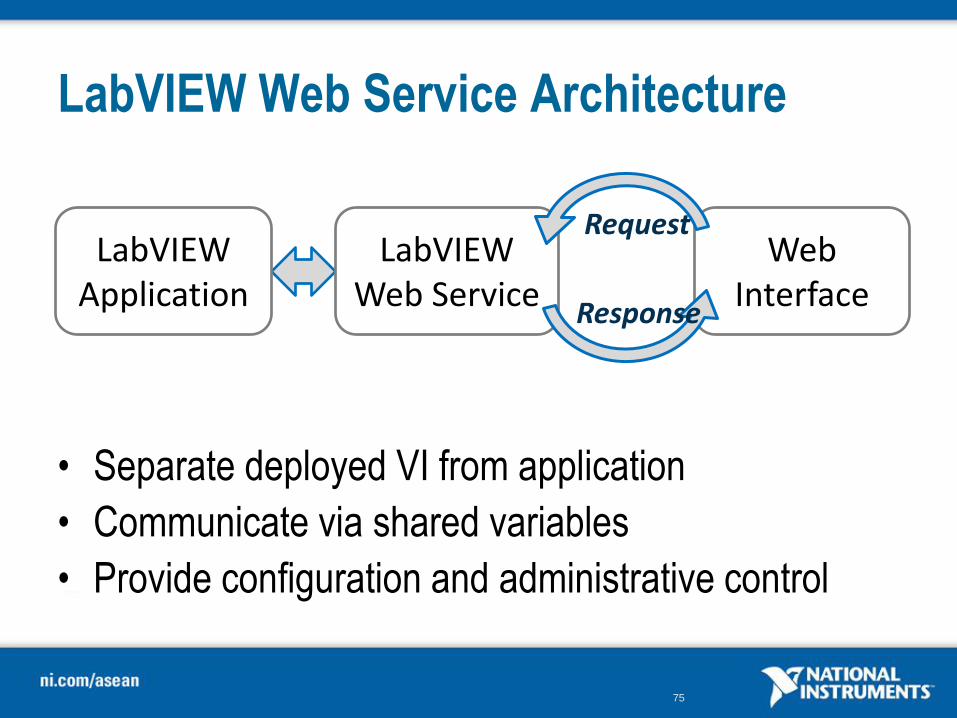
LabVIEW Web Service Architecture
• Separate deployed VI from application
• Communicate via shared variables
• Provide configuration and administrative control
LabVIEW Application
LabVIEW Web Service
Web Interface
Response
Request
76
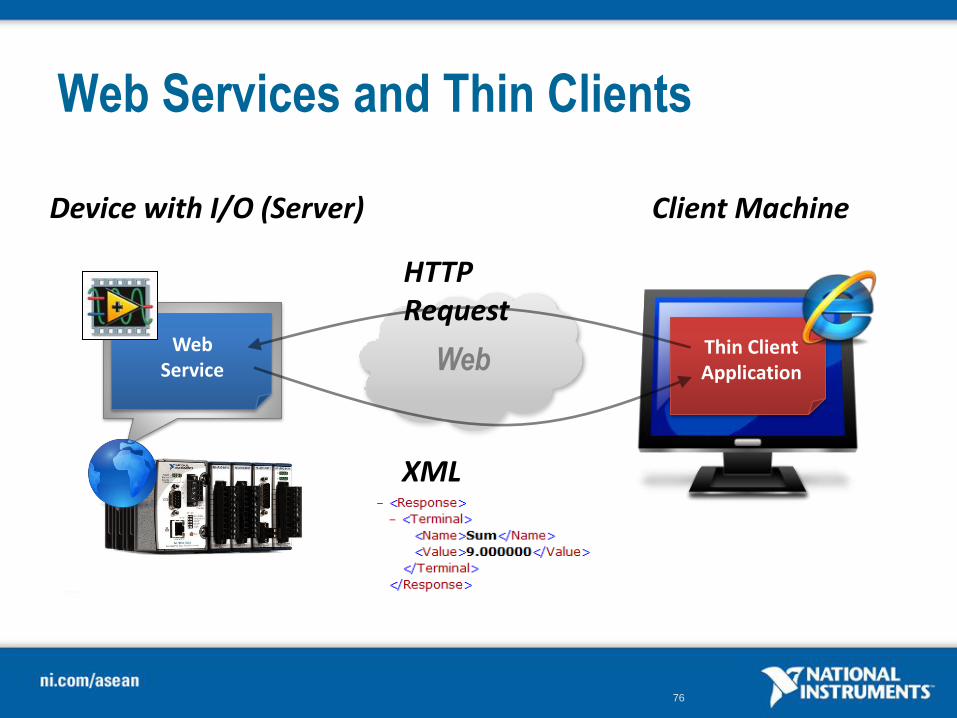
Web Services and Thin Clients
Device with I/O (Server) Client Machine
Web Web
Service Thin Client Application
HTTP Request
XML Response

77
Demo 8: Real-Life Data Monitoring from
iPad/Android
• Using iPad to monitor
real-life data
LabVIEW Dashboard for iPad &
Android
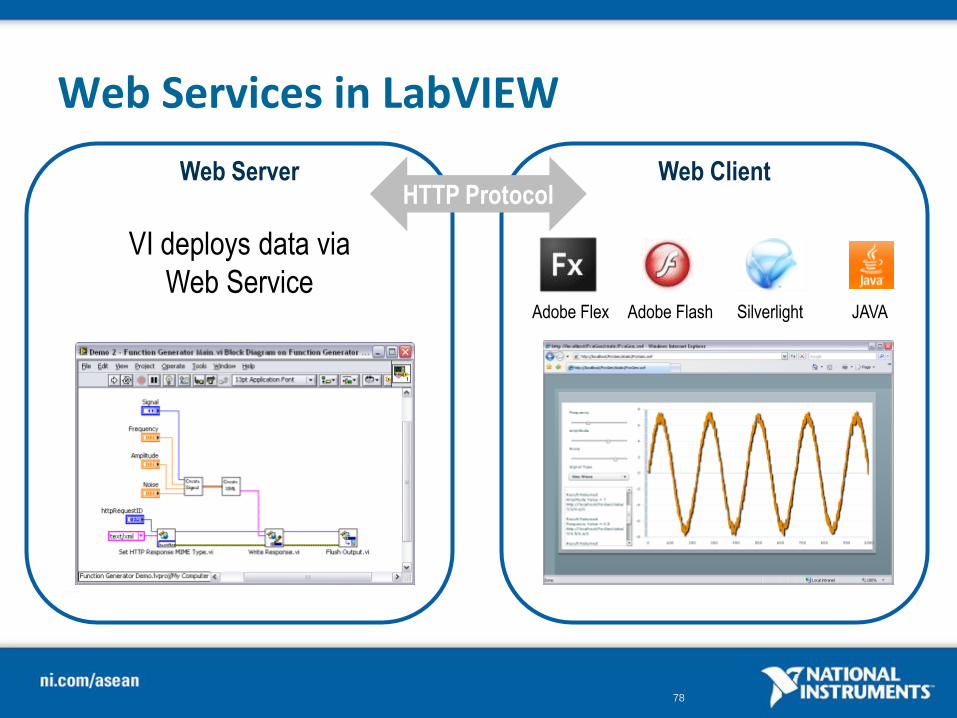
78
VI deploys data via
Web Service
Web Services in LabVIEW
HTTP Protocol Web Client
Adobe Flex Adobe Flash Silverlight JAVA
Web Server

79
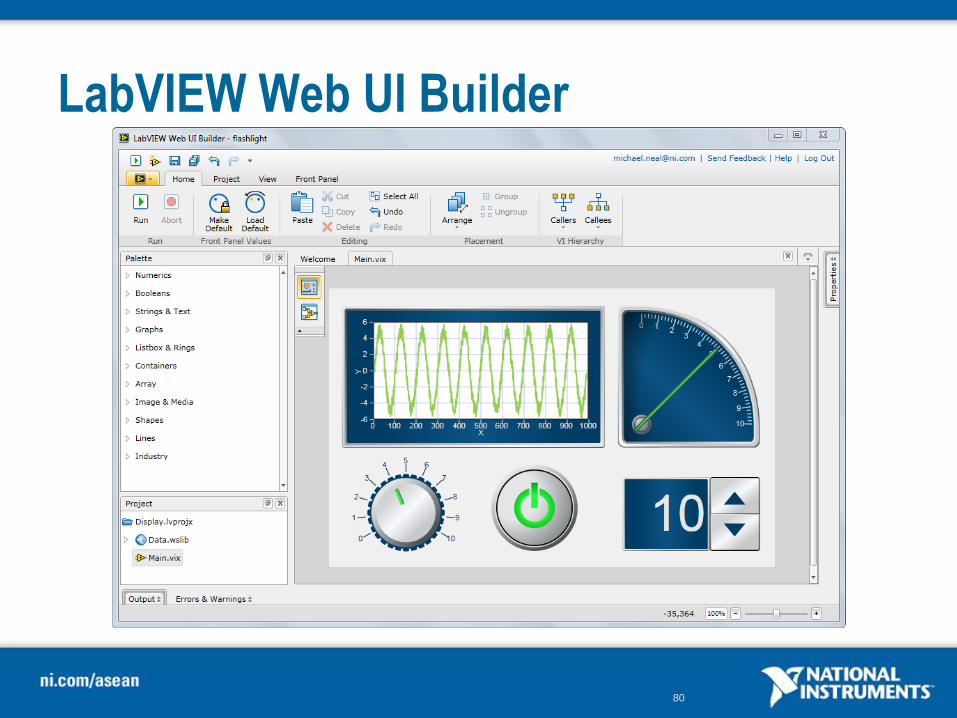
LabVIEW Web UI Builder
VI deploys data via
Web Service
Use the Web UI Builder for a
LabVIEW client application
without LabVIEW Run Time
HTTP Protocol Web Client Web Server
80
LabVIEW Web UI Builder

81
ni.com/uibuilder

82
Next Steps

83
Learn More about NI LabVIEW and NI
DAQ Systems
• Check out additional LabVIEW materials for
Automated Test, Industrial Measurement and
Control and Embedded:
www.ni.com/labview/whatis
• View DAQ product specs and demos:
www.ni.com/daq

84
Worldwide LabVIEW User Community • Over 50,000 members on award-winning
NI Discussion Forums
• NI and LabVIEW user-contributed blogs
• More than 100 LabVIEW User Groups
• Third-party community web sites in over
15 languages
• Hundreds of third-party add-on tools on
the LabVIEW Tools Network

85
Training and Certification
Together, the National Instruments training and certification programs deliver the fastest, most
certain route to increased proficiency and productivity using NI software and hardware.
NI Training: Build Your Knowledge
NI training helps you build the skills to
more efficiently develop robust,
maintainable applications. We provide
several training options including
classroom, self-paced, online, or on-site
training at your facility.
NI Certification: Validate Your Expertise
NI certification confirms your technical growth
and skill. This professional certification is ideal
for differentiating yourself from the competition
and making your own informed hiring and
outsourcing decisions.
Visit ni.com/training to learn more

86
To help us continually improve our seminar program, we would very much appreciate your comments by completing the seminar
feedback form and returning to us after the seminar.
Thank You.

87
National Instruments Technical Support
Request a visit with your local engineer today!
•Tel: (08) 6299 8281
[email protected] or visit vietnam.ni.com
Pham Quoc Hung
Field Systems Engineer
Tel: 0932529288
Email: [email protected]