Embed Size (px)
Citation preview
Creating a Accident Free Creating a Accident Free Work EnvironmentWork Environment
Presented By: Betty Knox
Why Not Set Your Goal to Why Not Set Your Goal to ZERO!ZERO!
AgendaAgenda
The Swiss Colony The Swiss Colony
Defining Zero Accidents Defining Zero Accidents
Measuring Safety PerformanceMeasuring Safety Performance
Creating a Zero Accident Creating a Zero Accident Program Program
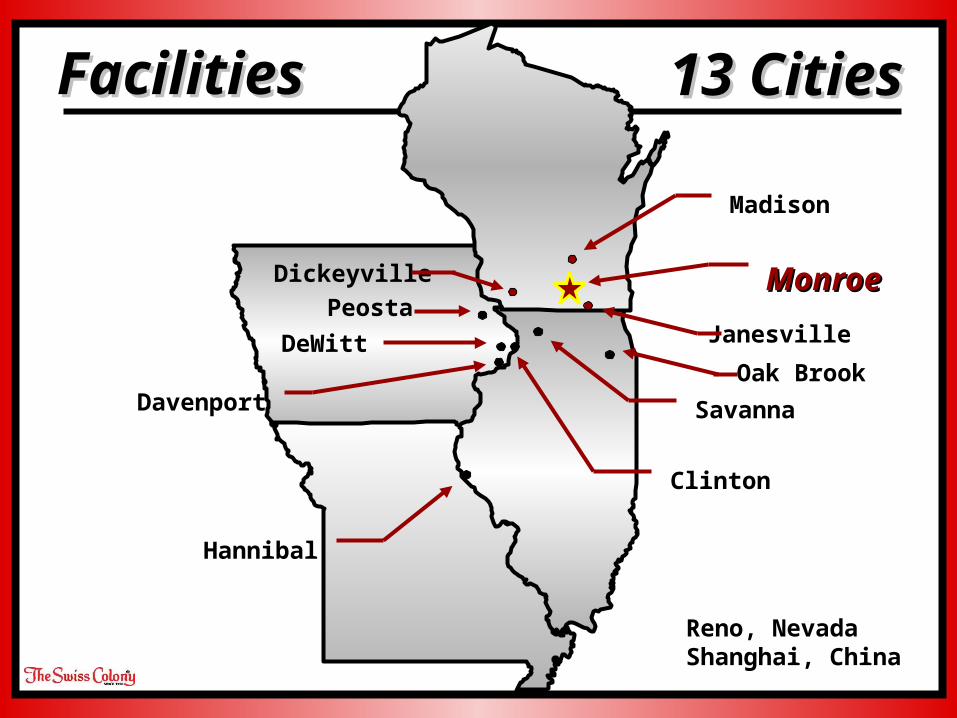
MonroMonroee
Savanna
Madison
Davenport
Hannibal
Clinton
Dickeyville
Janesville
FacilitiesFacilities
DeWitt
Peosta
13 Cities13 Cities
Oak Brook
Reno, NevadaShanghai, China


12 Jets 22 Pilots
Is Zero Accident Possible?Is Zero Accident Possible?
Many may look at Zero and think it is not Many may look at Zero and think it is not possible.possible.
Setting the Goal at Zero is setting us up for Setting the Goal at Zero is setting us up for failure.failure.
If we say that zero injuries is not possible, If we say that zero injuries is not possible, - then how many injuries are acceptable each then how many injuries are acceptable each
year, and what type of injuries are acceptable?year, and what type of injuries are acceptable?
Is it OK if we have only one injury during the Is it OK if we have only one injury during the year, year, - but what if the result is a serious injury of an but what if the result is a serious injury of an
employee or life altering event?employee or life altering event?
Zero Accidents Zero Accidents
Your company goes through stretches of time Your company goes through stretches of time when you have zero safety incidents. when you have zero safety incidents.
Safe minutes add up to safe hours, and safe Safe minutes add up to safe hours, and safe hours to days, and so on and so on. hours to days, and so on and so on.
From a workers standpoint, From a workers standpoint, zerozero is the only is the only supportable goalsupportable goal
- Any other goal leaves the subtle message that Any other goal leaves the subtle message that injuries will occur and that injuries are injuries will occur and that injuries are acceptable acceptable
Why Not Aim For Why Not Aim For Zero!Zero!
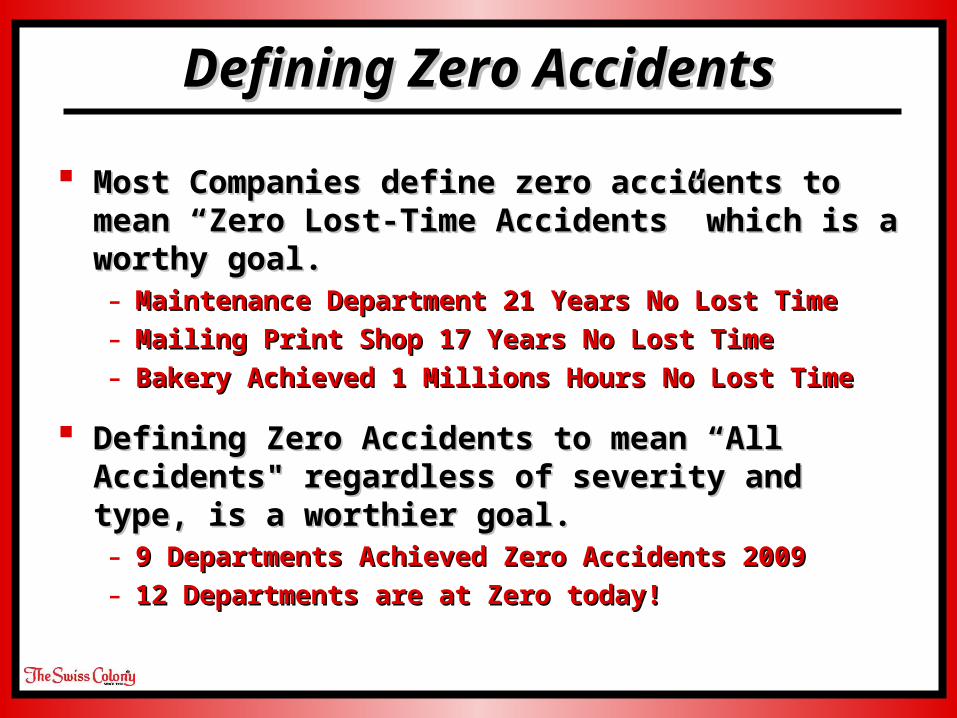
Defining Zero AccidentsDefining Zero Accidents
Most Companies define zero accidents to Most Companies define zero accidents to mean “Zero Lost-Time Accidents” which is a mean “Zero Lost-Time Accidents” which is a worthy goal.worthy goal.- Maintenance Department 21 Years No Lost TimeMaintenance Department 21 Years No Lost Time
- Mailing Print Shop 17 Years No Lost TimeMailing Print Shop 17 Years No Lost Time
- Bakery Achieved 1 Millions Hours No Lost Time Bakery Achieved 1 Millions Hours No Lost Time
Defining Zero Accidents to mean “All Defining Zero Accidents to mean “All Accidents" regardless of severity and type, Accidents" regardless of severity and type, is a worthier goal.is a worthier goal.- 9 Departments Achieved Zero Accidents 20099 Departments Achieved Zero Accidents 2009
- 12 Departments are at Zero today!12 Departments are at Zero today!
Employee Perception of SafetyEmployee Perception of Safety
Where is your Company now in safety Where is your Company now in safety performance?performance?
Measuring the Safety Management SystemMeasuring the Safety Management System
Measuring Safety PerformanceMeasuring Safety Performance
Problems with StatisticsProblems with Statistics
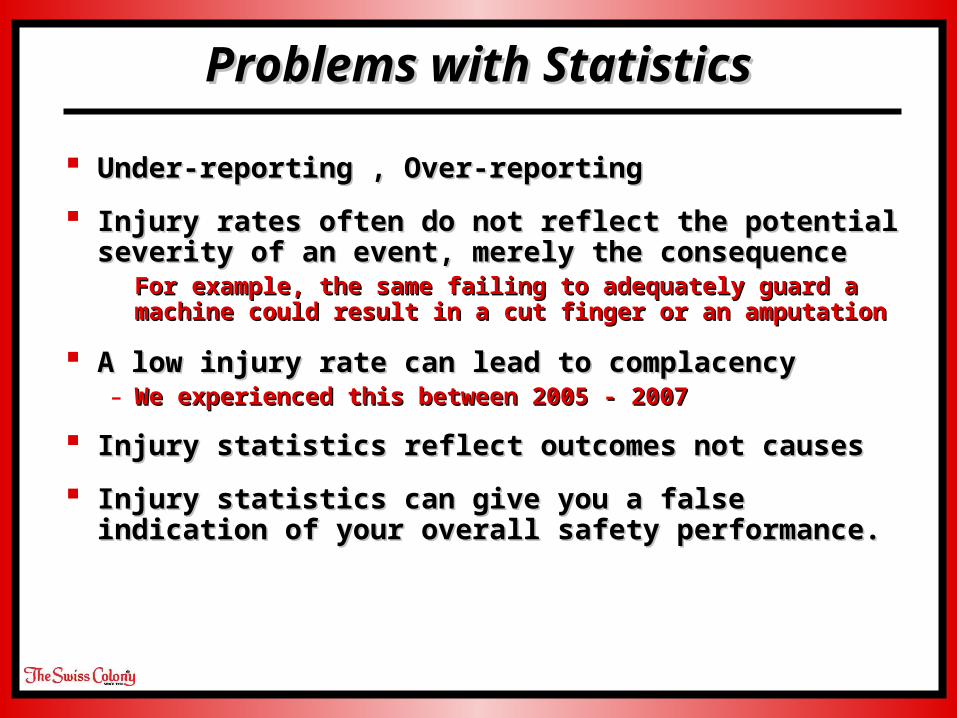
Under-reporting , Over-reportingUnder-reporting , Over-reporting
Injury rates often do not reflect the potential Injury rates often do not reflect the potential severity of an event, merely the consequenceseverity of an event, merely the consequence For example, the same failing to adequately guard a For example, the same failing to adequately guard a
machine could result in a cut finger or an amputationmachine could result in a cut finger or an amputation
A low injury rate can lead to complacencyA low injury rate can lead to complacency- We experienced this between 2005 - 2007We experienced this between 2005 - 2007
Injury statistics reflect outcomes not causesInjury statistics reflect outcomes not causes
Injury statistics can give you a false indication Injury statistics can give you a false indication of your overall safety performance.of your overall safety performance.
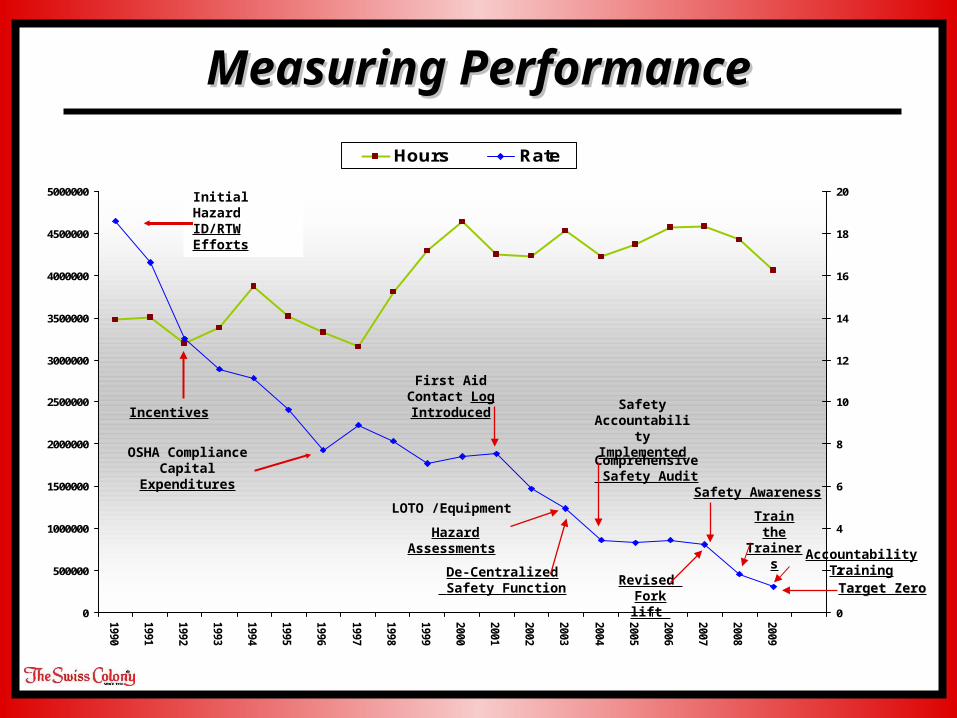
Measuring PerformanceMeasuring Performance
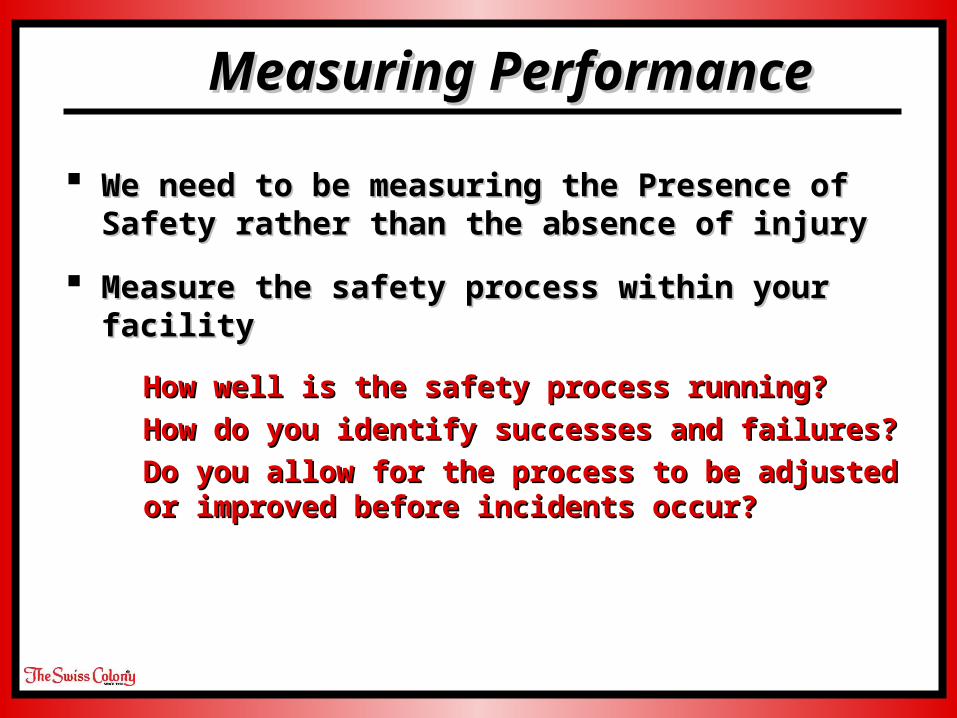
We need to be measuring the Presence of We need to be measuring the Presence of Safety rather than the absence of injurySafety rather than the absence of injury
Measure the safety process within your Measure the safety process within your facilityfacility
How well is the safety process running?How well is the safety process running?
How do you identify successes and failures?How do you identify successes and failures?
Do you allow for the process to be adjusted or Do you allow for the process to be adjusted or improved before incidents occur?improved before incidents occur?
Measuring Safety PerformanceMeasuring Safety Performance
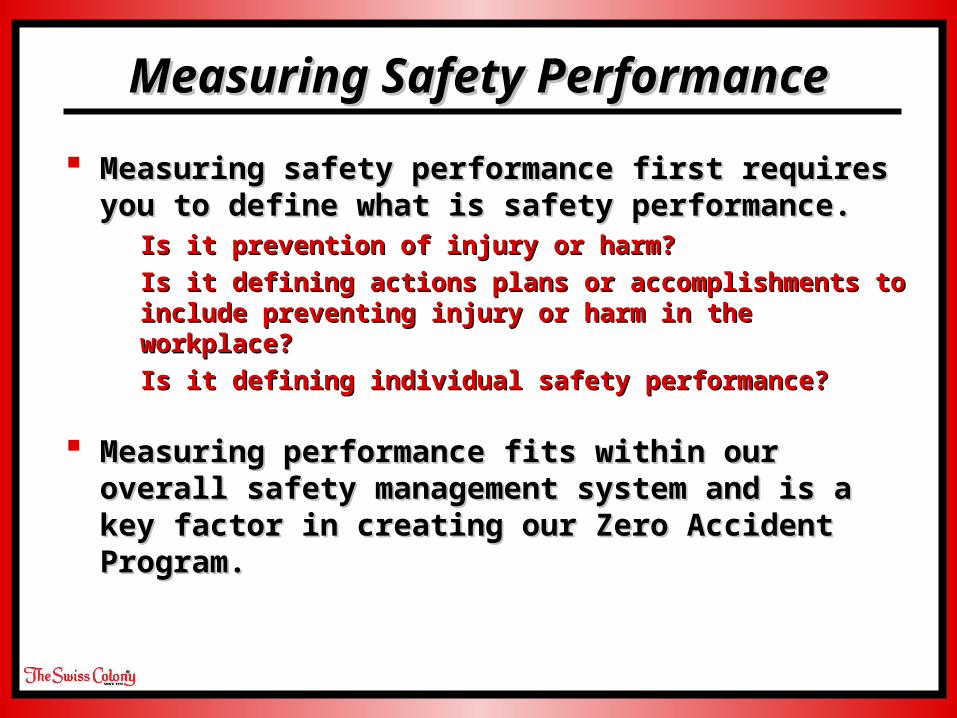
Measuring safety performance first requires Measuring safety performance first requires you to define what is safety performance.you to define what is safety performance. Is it prevention of injury or harm?Is it prevention of injury or harm?
Is it defining actions plans or accomplishments to Is it defining actions plans or accomplishments to include preventing injury or harm in the include preventing injury or harm in the workplace?workplace?
Is it defining individual safety performance?Is it defining individual safety performance?
Measuring performance fits within our Measuring performance fits within our overall safety management system and is a overall safety management system and is a key factor in creating our Zero Accident key factor in creating our Zero Accident Program.Program.
Measuring PerformanceMeasuring Performance
0
500000
1000000
1500000
2000000
2500000
3000000
3500000
4000000
4500000
5000000
1990
1991
1992
1993
1994
1995
1996
1997
1998
1999
2000
2001
2002
2003
2004
2005
2006
2007
2008
2009
0
2
4
6
8
10
12
14
16
18
20
Hours Rate
Initial Hazard ID/RTW Efforts
Incentives
OSHA Compliance Capital Expenditures
First Aid Contact Log Introduced
Safety Accountability Implemented
LOTO /Equipment
Hazard Assessments
De-Centralized Safety Function
Revised Fork lift
Comprehensive Safety Audit
Safety Awareness
Train the Trainers
Accountability Training
Target ZeroTarget Zero
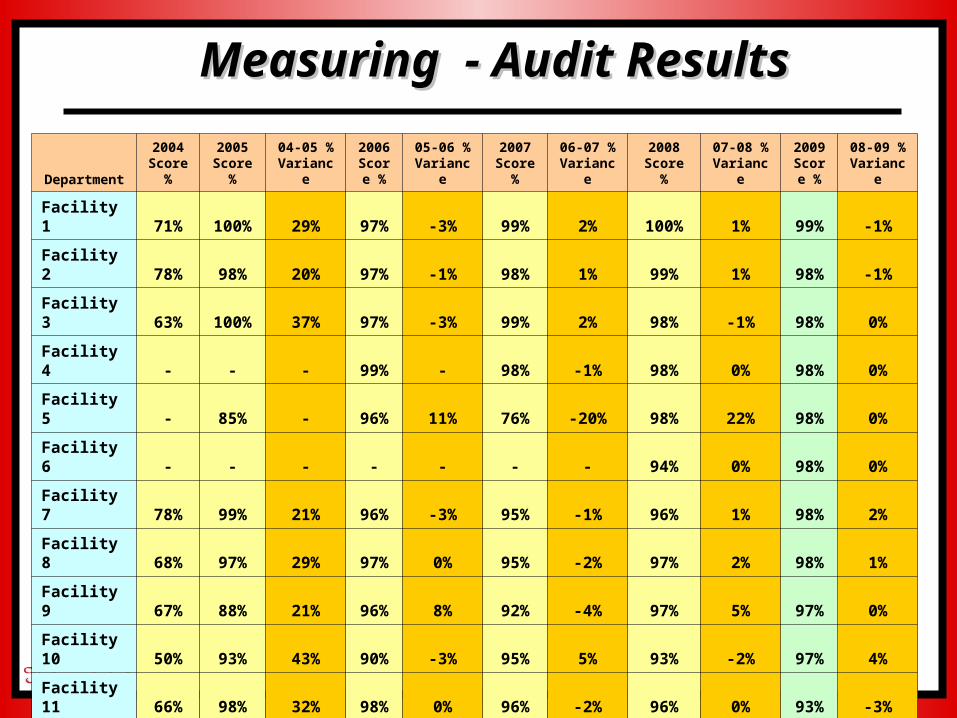
Measuring - Audit ResultsMeasuring - Audit Results
Department
2004 Score
%
2005 Score
%
04-05 % Variance
2006 Score
%
05-06 % Variance
2007 Score
%
06-07 % Variance
2008 Score %
07-08 % Variance
2009 Score
%
08-09 % Variance
Facility 1 71% 100% 29% 97% -3% 99% 2% 100% 1% 99% -1%
Facility 2 78% 98% 20% 97% -1% 98% 1% 99% 1% 98% -1%
Facility 3 63% 100% 37% 97% -3% 99% 2% 98% -1% 98% 0%
Facility 4 - - - 99% - 98% -1% 98% 0% 98% 0%
Facility 5 - 85% - 96% 11% 76% -20% 98% 22% 98% 0%
Facility 6 - - - - - - - 94% 0% 98% 0%
Facility 7 78% 99% 21% 96% -3% 95% -1% 96% 1% 98% 2%
Facility 8 68% 97% 29% 97% 0% 95% -2% 97% 2% 98% 1%
Facility 9 67% 88% 21% 96% 8% 92% -4% 97% 5% 97% 0%
Facility 10 50% 93% 43% 90% -3% 95% 5% 93% -2% 97% 4%
Facility 11 66% 98% 32% 98% 0% 96% -2% 96% 0% 93% -3%
Facility 12 77% 99% 22% - - - - - - - -
Facility 13 66% 99% 33% - - - - - - - -
Total 71% 96% 26.9% 97% 0.6% 94% -2.88% 97% 2.9% 98% 0.2%
5.85.86.4
7.47.78.4
10.311.9
16.5
13.610.73
14.51516.3
17.117.6
18.819.520
2.320.00
4.963.473.715.885.03
14.95
12.76
12.43
14.8613.65
20.56
17.08
14.1716.97
10.71
18.42
27.32
24.59
0
5
10
15
20
25
30
35
40
1990 1991 1992 1993 1994 1995 1996 1997 1998 1999 2000 2001 2002 2003 2004 2005 2006 2007 2008 2009
Food Manufacturing Production
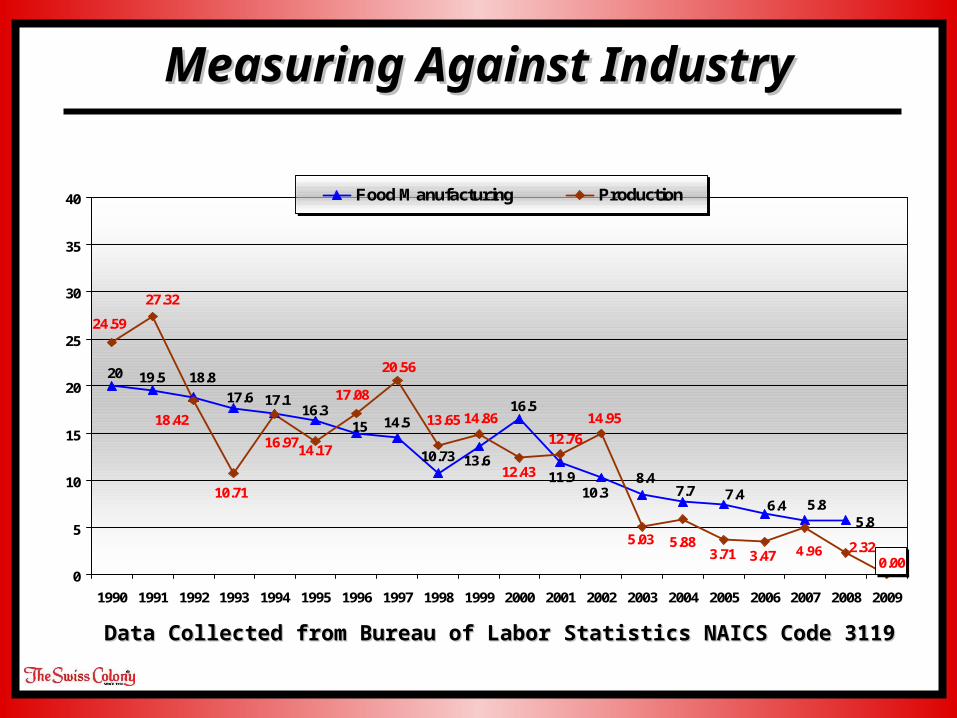
Data Collected from Bureau of Labor Statistics NAICS Code 3119Data Collected from Bureau of Labor Statistics NAICS Code 3119
Measuring Against IndustryMeasuring Against Industry
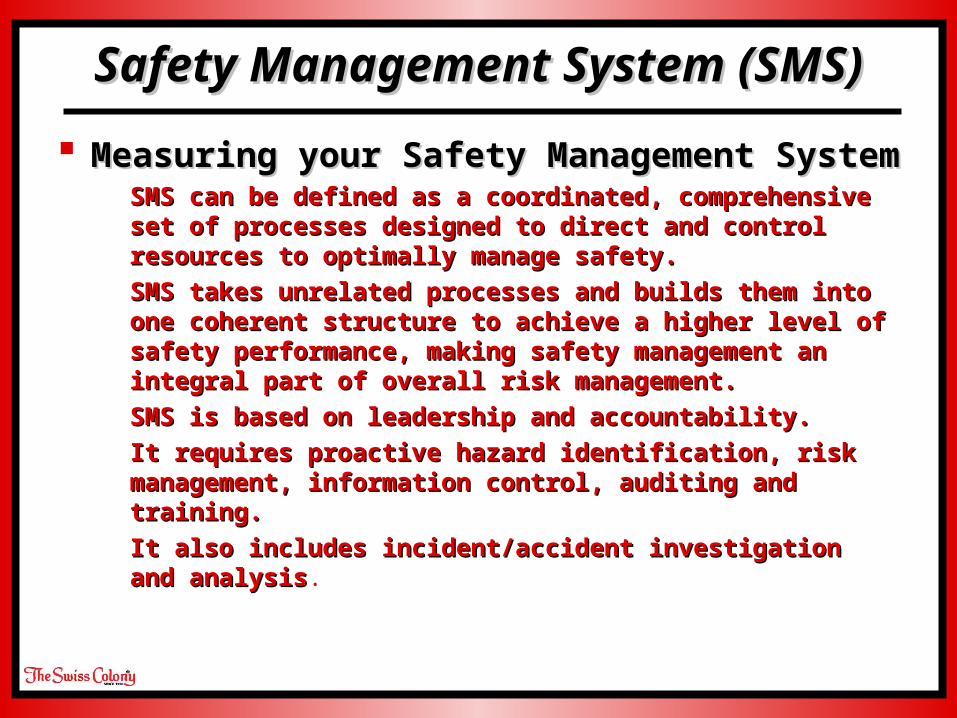
Safety Management System Safety Management System (SMS)(SMS) Measuring your Safety Management Measuring your Safety Management
SystemSystem SMS can be defined as a coordinated, comprehensive SMS can be defined as a coordinated, comprehensive
set of processes designed to direct and control set of processes designed to direct and control resources to optimally manage safety. resources to optimally manage safety.
SMS takes unrelated processes and builds them into SMS takes unrelated processes and builds them into one coherent structure to achieve a higher level of one coherent structure to achieve a higher level of safety performance, making safety management an safety performance, making safety management an integral part of overall risk management. integral part of overall risk management.
SMS is based on leadership and accountability. SMS is based on leadership and accountability. It requires proactive hazard identification, risk It requires proactive hazard identification, risk
management, information control, auditing and management, information control, auditing and training. training.
It also includes incident/accident investigation and It also includes incident/accident investigation and analysisanalysis.
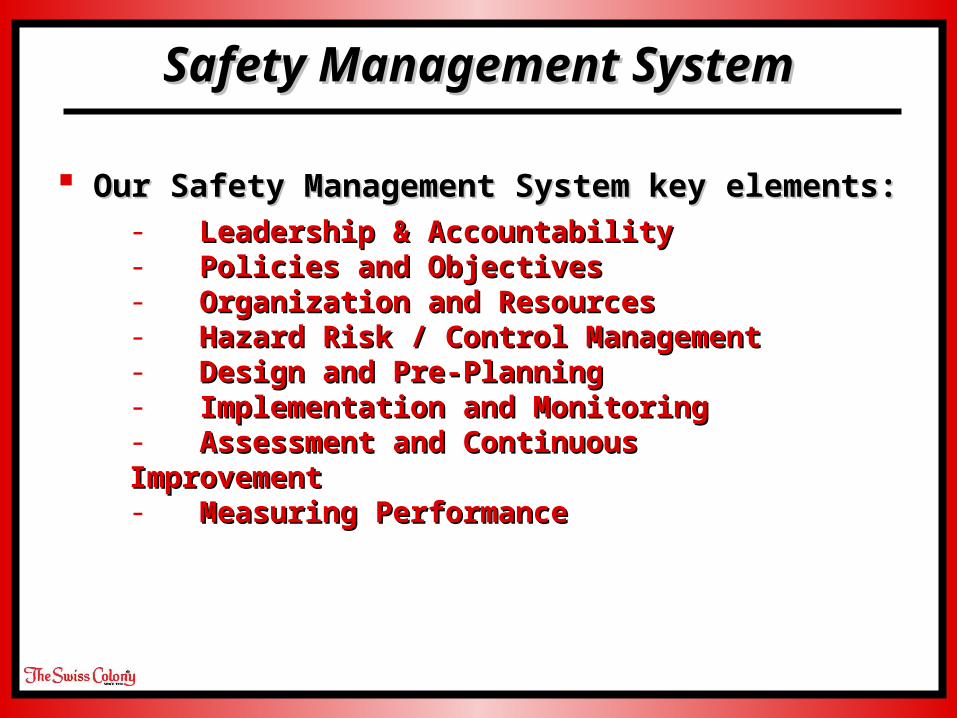
Our Safety Management System key Our Safety Management System key elements:elements:
Safety Management SystemSafety Management System
- Leadership & AccountabilityLeadership & Accountability- Policies and ObjectivesPolicies and Objectives- Organization and ResourcesOrganization and Resources- Hazard Risk / Control ManagementHazard Risk / Control Management- Design and Pre-PlanningDesign and Pre-Planning- Implementation and MonitoringImplementation and Monitoring- Assessment and Continuous Assessment and Continuous ImprovementImprovement- Measuring PerformanceMeasuring Performance
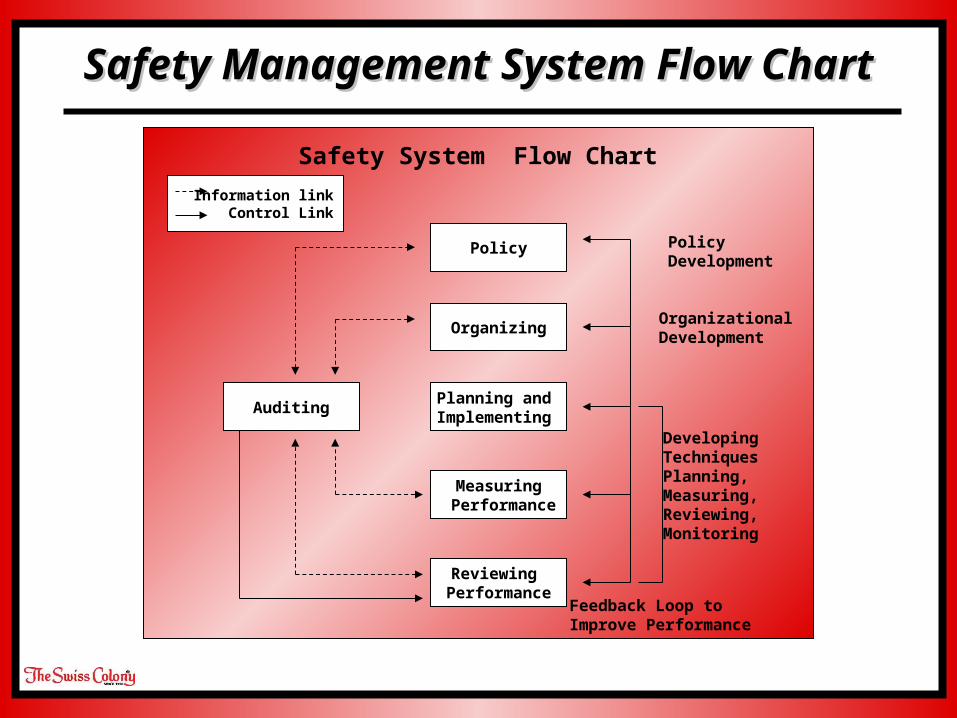
Safety Management System Flow Safety Management System Flow ChartChart
Information linkControl Link
Policy
Organizing
Planning and Implementing
Measuring Performance
Reviewing Performance
Auditing
Policy Development
Organizational Development
Developing TechniquesPlanning,Measuring,Reviewing,Monitoring
Feedback Loop toImprove Performance
Safety System Flow Chart
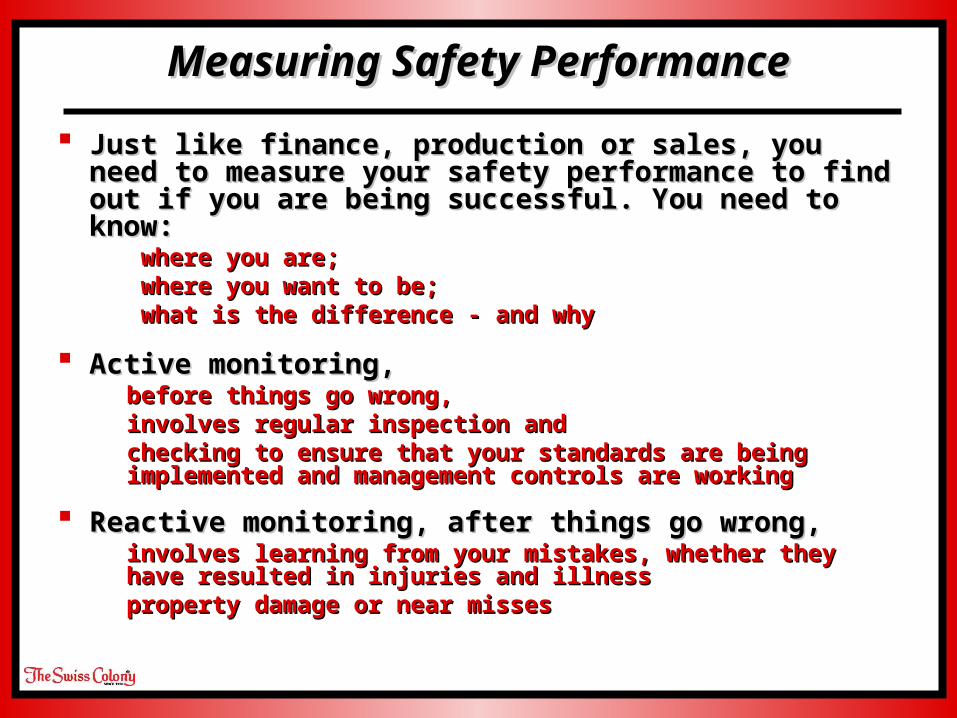
Measuring Safety PerformanceMeasuring Safety Performance
Just like finance, production or sales, you need Just like finance, production or sales, you need to measure your safety performance to find out to measure your safety performance to find out if you are being successful. You need to know:if you are being successful. You need to know: where you are;where you are; where you want to be;where you want to be; what is the difference - and whywhat is the difference - and why
Active monitoring, Active monitoring, before things go wrong, before things go wrong, involves regular inspection and involves regular inspection and checking to ensure that your standards are being checking to ensure that your standards are being
implemented and management controls are workingimplemented and management controls are working
Reactive monitoring, after things go wrong, Reactive monitoring, after things go wrong, involves learning from your mistakes, whether they involves learning from your mistakes, whether they
have resulted in injuries and illnesshave resulted in injuries and illness property damage or near missesproperty damage or near misses
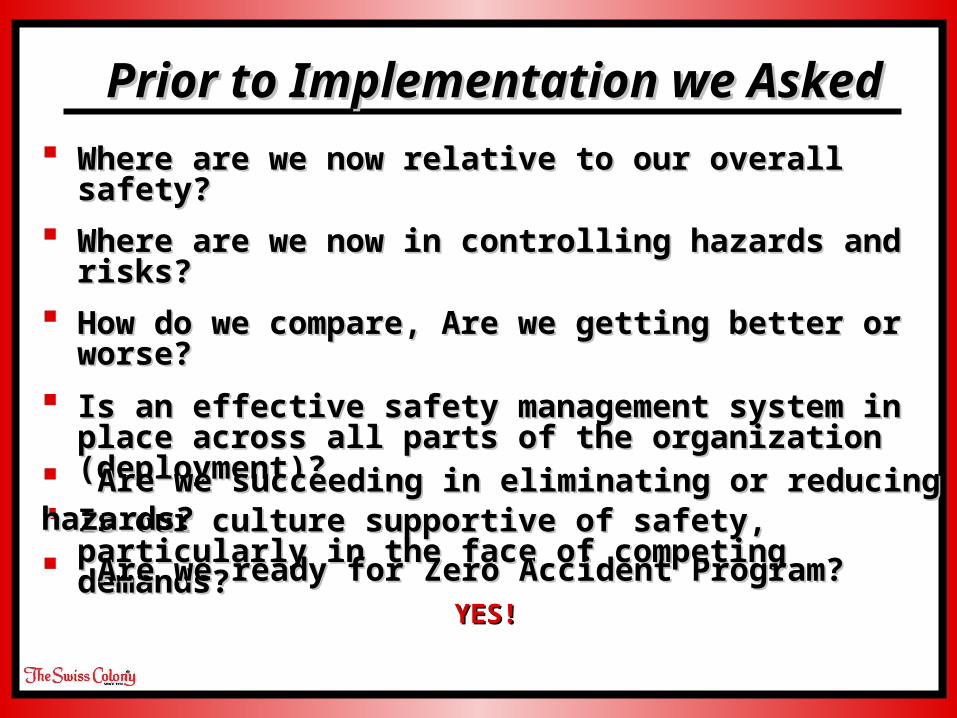
Where are we now relative to our overall Where are we now relative to our overall safety?safety?
Where are we now in controlling hazards and Where are we now in controlling hazards and risks?risks?
How do we compare, Are we getting better or How do we compare, Are we getting better or worse?worse?
Is an effective safety management system in Is an effective safety management system in place across all parts of the organization place across all parts of the organization (deployment)?(deployment)?
Is our culture supportive of safety, particularly Is our culture supportive of safety, particularly in the face of competing demands?in the face of competing demands?
Prior to Implementation we Prior to Implementation we AskedAsked
Are we succeeding in eliminating or reducing Are we succeeding in eliminating or reducing hazards?hazards?
Are we ready for Zero Accident Program?Are we ready for Zero Accident Program?YES!YES!
Creating Zero Accident Creating Zero Accident ProgramProgram
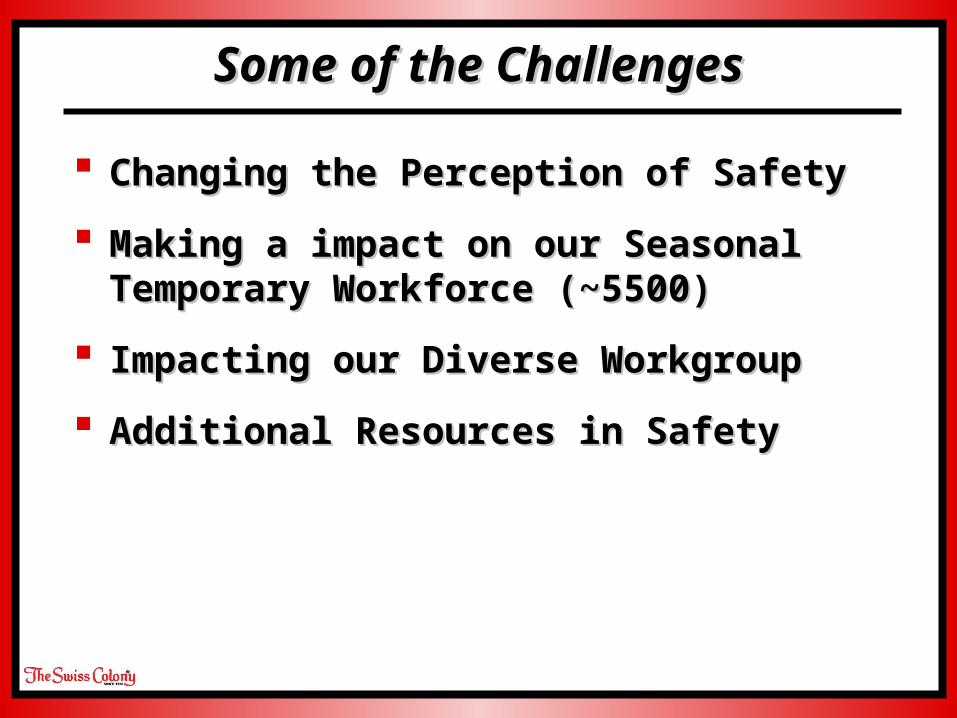
Some of the ChallengesSome of the Challenges
Changing the Perception of SafetyChanging the Perception of Safety
Making a impact on our Seasonal Making a impact on our Seasonal Temporary Workforce (~5500)Temporary Workforce (~5500)
Impacting our Diverse WorkgroupImpacting our Diverse Workgroup
Additional Resources in SafetyAdditional Resources in Safety
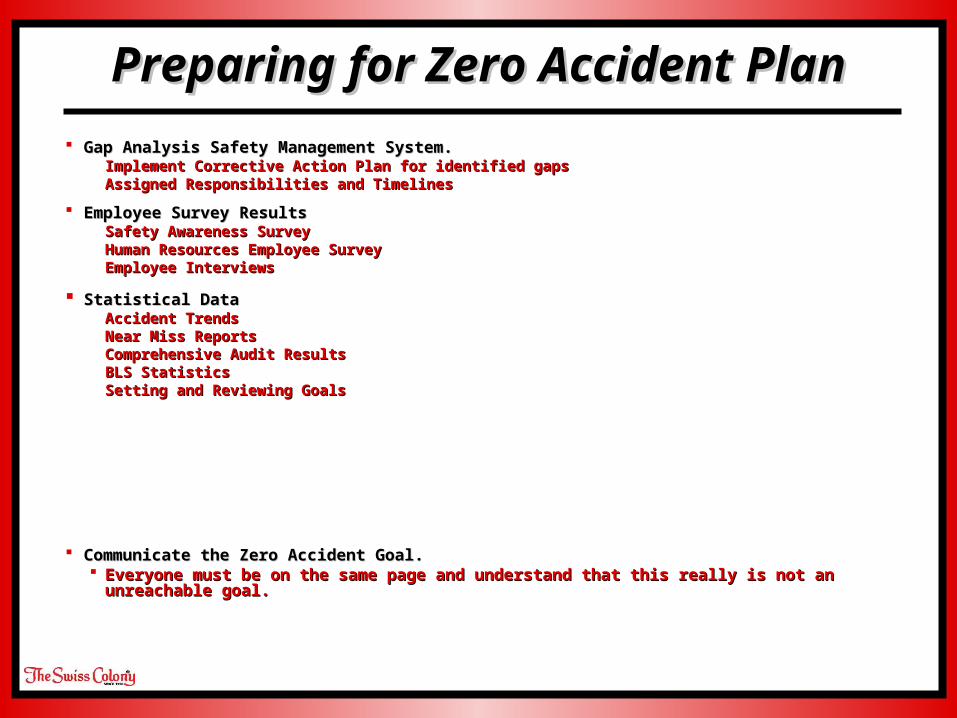
Preparing for Zero Accident Preparing for Zero Accident PlanPlan
Gap Analysis Safety Management System.Gap Analysis Safety Management System. Implement Corrective Action Plan for identified gapsImplement Corrective Action Plan for identified gaps Assigned Responsibilities and TimelinesAssigned Responsibilities and Timelines
Employee Survey ResultsEmployee Survey Results Safety Awareness SurveySafety Awareness Survey Human Resources Employee Survey Human Resources Employee Survey Employee InterviewsEmployee Interviews
Statistical DataStatistical Data Accident TrendsAccident Trends Near Miss ReportsNear Miss Reports Comprehensive Audit ResultsComprehensive Audit Results BLS StatisticsBLS Statistics Setting and Reviewing Goals Setting and Reviewing Goals
Communicate the Zero Accident Goal.Communicate the Zero Accident Goal. Everyone must be on the same page and understand that this really is not an Everyone must be on the same page and understand that this really is not an
unreachable goal.unreachable goal.
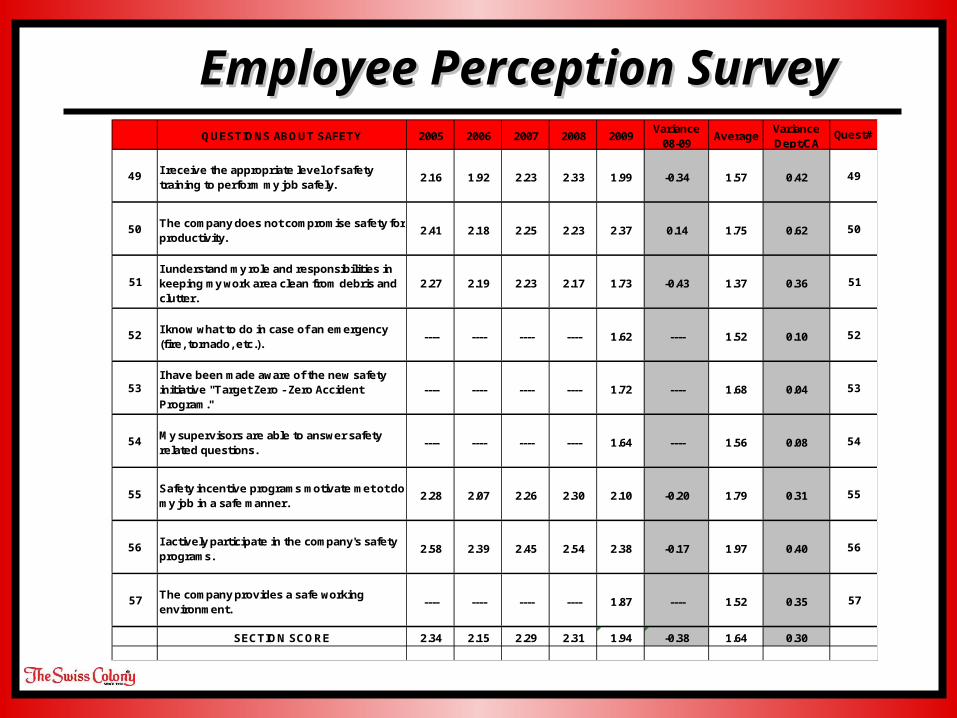
QUESTIONS ABOUT SAFETY 2005 2006 2007 2008 2009Variance
08-09Average
Variance Dept/CA
Quest#
49 I receive the appropriate level of safety training to perform my job safely.
2.16 1.92 2.23 2.33 1.99 -0.34 1.57 0.42 49
50 The company does not compromise safety for productivity.
2.41 2.18 2.25 2.23 2.37 0.14 1.75 0.62 50
51I understand my role and responsibilities in keeping my work area clean from debris and clutter.
2.27 2.19 2.23 2.17 1.73 -0.43 1.37 0.36 51
52 I know what to do in case of an emergency (fire, tornado, etc.).
---- ---- ---- ---- 1.62 ---- 1.52 0.10 52
53I have been made aware of the new safety initiative "Target Zero - Zero Accident Program."
---- ---- ---- ---- 1.72 ---- 1.68 0.04 53
54 My supervisors are able to answer safety related questions.
---- ---- ---- ---- 1.64 ---- 1.56 0.08 54
55 Safety incentive programs motivate met ot do my job in a safe manner.
2.28 2.07 2.26 2.30 2.10 -0.20 1.79 0.31 55
56 I actively participate in the company's safety programs.
2.58 2.39 2.45 2.54 2.38 -0.17 1.97 0.40 56
57 The company provides a safe working environment.
---- ---- ---- ---- 1.87 ---- 1.52 0.35 57
SECTION SCORE 2.34 2.15 2.29 2.31 1.94 -0.38 1.64 0.30
Employee Perception SurveyEmployee Perception Survey
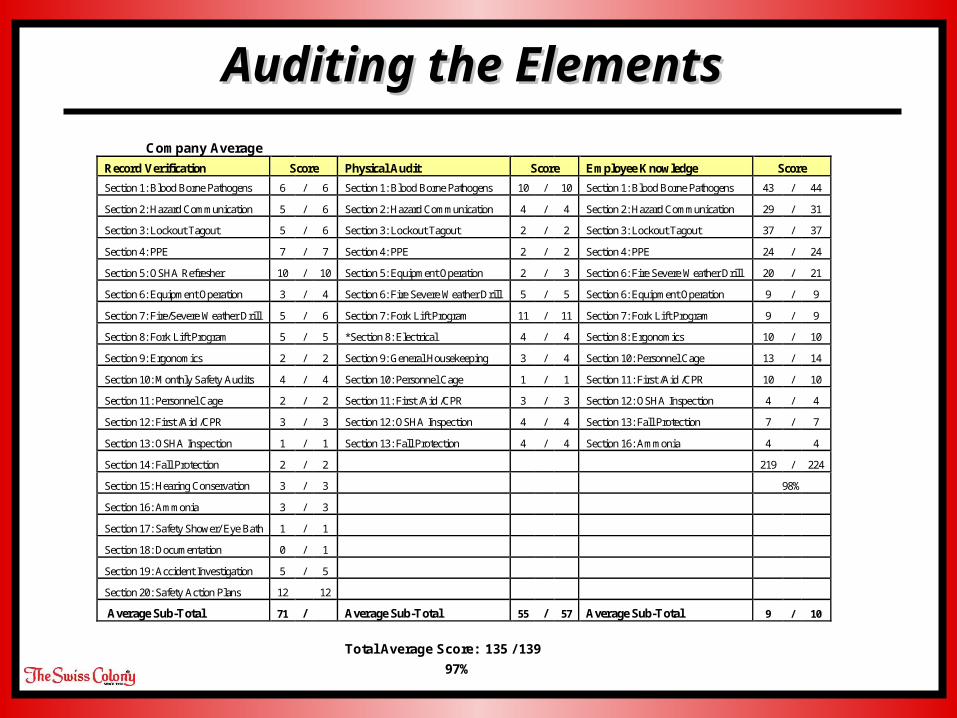
Auditing the Elements Auditing the Elements
Company Average
Record Verification Score Physical Audit Score Employee Knowledge Score
Section 1: Blood Borne Pathogens 6 / 6 Section 1: Blood Borne Pathogens 10 / 10 Section 1: Blood Borne Pathogens 43 / 44
Section 2: Hazard Communication 5 / 6 Section 2: Hazard Communication 4 / 4 Section 2: Hazard Communication 29 / 31
Section 3: Lockout Tagout 5 / 6 Section 3: Lockout Tagout 2 / 2 Section 3: Lockout Tagout 37 / 37
Section 4: PPE 7 / 7 Section 4: PPE 2 / 2 Section 4: PPE 24 / 24
Section 5: OSHA Refresher 10 / 10 Section 5: Equipment Operation 2 / 3 Section 6: Fire Severe Weather Drill 20 / 21
Section 6: Equipment Operation 3 / 4 Section 6: Fire Severe Weather Drill 5 / 5 Section 6: Equipment Operation 9 / 9
Section 7: Fire/Severe Weather Drill 5 / 6 Section 7: Fork Lift Program 11 / 11 Section 7: Fork Lift Program 9 / 9
Section 8: Fork Lift Program 5 / 5 *Section 8: Electrical 4 / 4 Section 8: Ergonomics 10 / 10
Section 9: Ergonomics 2 / 2 Section 9: General Housekeeping 3 / 4 Section 10: Personnel Cage 13 / 14
Section 10: Monthly Safety Audits 4 / 4 Section 10: Personnel Cage 1 / 1 Section 11: First /Aid /CPR 10 / 10
Section 11: Personnel Cage 2 / 2 Section 11: First /Aid /CPR 3 / 3 Section 12: OSHA Inspection 4 / 4
Section 12: First /Aid /CPR 3 / 3 Section 12: OSHA Inspection 4 / 4 Section 13: Fall Protection 7 / 7
Section 13: OSHA Inspection 1 / 1 Section 13: Fall Protection 4 / 4 Section 16: Ammonia 4 4
Section 14: Fall Protection 2 / 2 219 / 224
Section 15: Hearing Conservation 3 / 3 98%
Section 16: Ammonia 3 / 3
Section 17: Safety Shower/ Eye Bath 1 / 1
Section 18: Documentation 0 / 1
Section 19: Accident Investigation 5 / 5
Section 20: Safety Action Plans 12 12
Average Sub-Total 71 / Average Sub-Total 55 / 57 Average Sub-Total 9 / 10
Total Average Score: 135 / 139
97%
Accident Frequency
Incidence Rate
Accident Frequency
Incidence Rate
Accident Frequency
Incidence Rate
622,268 1 0.32 0 0.00 1 0.34 2 0.67 597,000145,580 0 0.00 0 0.00 0 0.00 1 1.37 146,000155,528 3 3.86 0 0.00 1 1.32 2 2.63 152,000
17,803 1 11.23 0 0.00 0 0.00 1 14.79 13,520127,749 8 12.52 0 0.00 2 2.97 3 4.45 134,846
342,947 5 2.92 0 0.00 3 1.99 6 3.98 301,17427,901 0 0.00 0 0.00 0 0.00 1 8.50 23,540
203,377 0 0.00 0 0.00 0 0.00 1 1.07 187,152260,150 1 0.77 0 0.00 1 0.95 2 1.90 210,95231,629 0 0.00 0 0.00 0 0.00 1 5.87 34,100
1,207,636 3 0.50 0 0.00 2 0.35 3 0.52 1,148,90060,533 0 0.00 0 0.00 0 0.00 1 3.31 60,481
68,423 0 0.00 0 0.00 0 0.00 1 2.80 71,366
93,205 1 2.15 0 0.00 1 2.07 2 4.14 96,608
441,493 0 0.00 0 0.00 0 0.00 1 0.53 375,000
196,610 0 0.00 0 0.00 0 0.00 1 1.03 195,000
57,020 0 0.00 0 0.00 0 0.00 1 3.09 64,6604,059,852 25 1.23 0 0.00 11 0.58 30 1.57 3,812,299
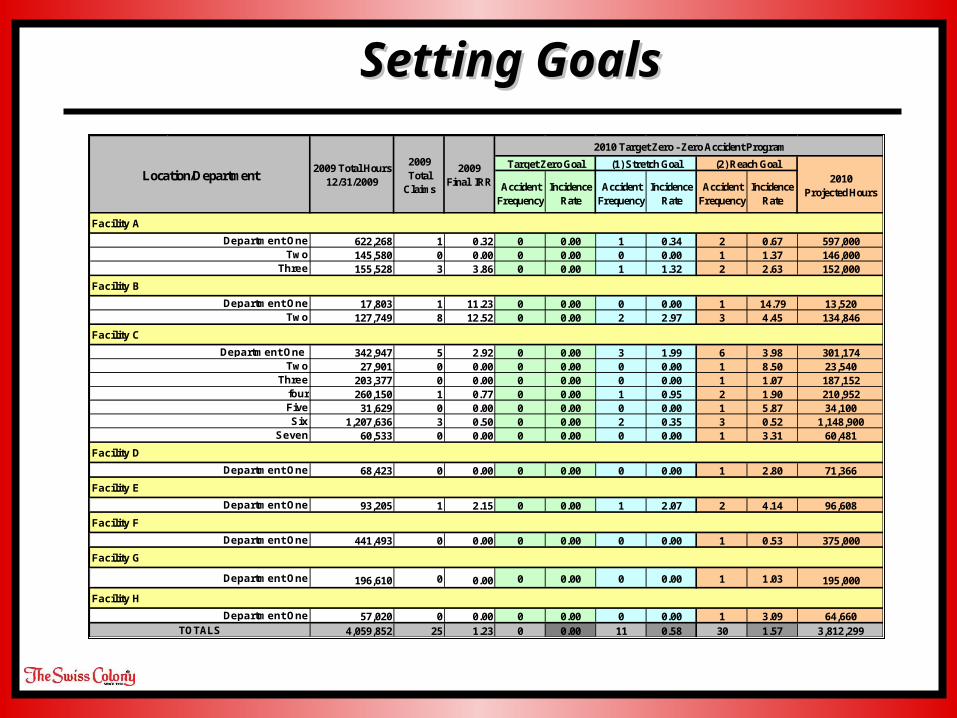
Location/Department2009 Total Hours
12/31/2009
2009 Total
Claims
2009 Final IRR
2010 Target Zero - Zero Accident Program
Target Zero Goal (1) Stretch Goal (2) Reach Goal
2010 Projected Hours
Facility A
Department OneTwo
Three
Facility B
Department OneTwo
Facility C
Department One Two
ThreefourFiveSix
Seven
Facility D
Department One
Facility E
Department One
Facility F
Department OneTOTALS
Department One
Facility G
Department One
Facility H
Setting GoalsSetting Goals
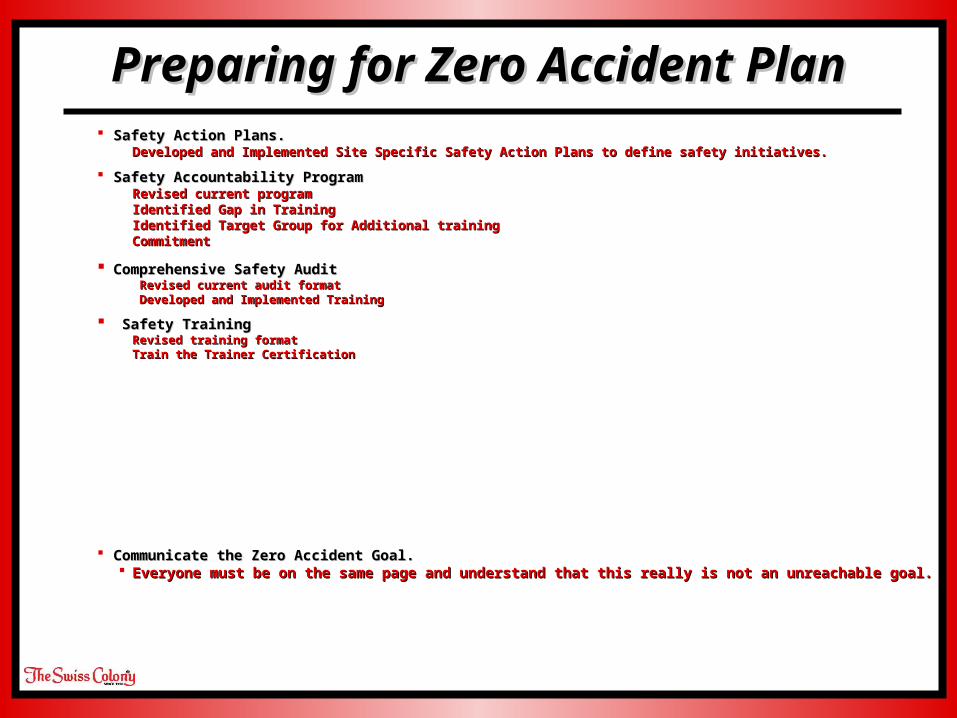
Preparing for Zero Accident Preparing for Zero Accident PlanPlan Safety Action Plans.Safety Action Plans.
Developed and Implemented Site Specific Safety Action Plans to define safety initiatives.Developed and Implemented Site Specific Safety Action Plans to define safety initiatives.
Safety Accountability ProgramSafety Accountability Program Revised current program Revised current program Identified Gap in TrainingIdentified Gap in Training Identified Target Group for Additional trainingIdentified Target Group for Additional training Commitment Commitment
Comprehensive Safety AuditComprehensive Safety Audit Revised current audit formatRevised current audit format Developed and Implemented TrainingDeveloped and Implemented Training
Safety TrainingSafety Training Revised training formatRevised training format Train the Trainer CertificationTrain the Trainer Certification
Communicate the Zero Accident Goal.Communicate the Zero Accident Goal. Everyone must be on the same page and understand that this really is not an unreachable Everyone must be on the same page and understand that this really is not an unreachable
goal.goal.
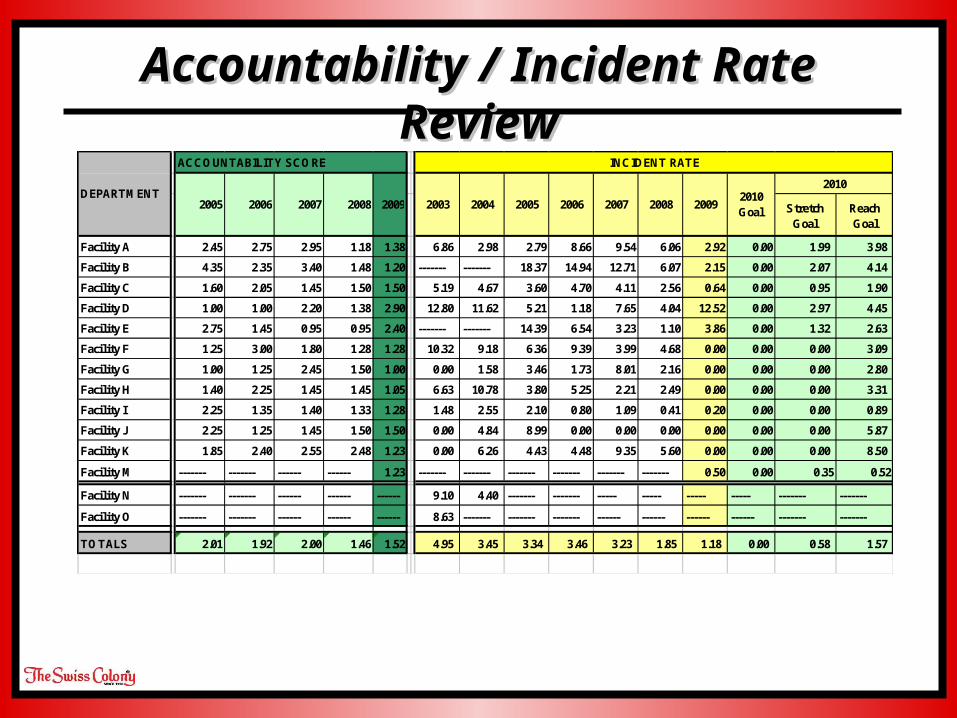
Accountability / Incident Rate Accountability / Incident Rate ReviewReview
Stretch Goal
Reach Goal
Facility A 2.45 2.75 2.95 1.18 1.38 6.86 2.98 2.79 8.66 9.54 6.06 2.92 0.00 1.99 3.98
Facility B 4.35 2.35 3.40 1.48 1.20 ------- ------- 18.37 14.94 12.71 6.07 2.15 0.00 2.07 4.14
Facility C 1.60 2.05 1.45 1.50 1.50 5.19 4.67 3.60 4.70 4.11 2.56 0.64 0.00 0.95 1.90
Facility D 1.00 1.00 2.20 1.38 2.90 12.80 11.62 5.21 1.18 7.65 4.04 12.52 0.00 2.97 4.45
Facility E 2.75 1.45 0.95 0.95 2.40 ------- ------- 14.39 6.54 3.23 1.10 3.86 0.00 1.32 2.63
Facility F 1.25 3.00 1.80 1.28 1.28 10.32 9.18 6.36 9.39 3.99 4.68 0.00 0.00 0.00 3.09
Facility G 1.00 1.25 2.45 1.50 1.00 0.00 1.58 3.46 1.73 8.01 2.16 0.00 0.00 0.00 2.80
Facility H 1.40 2.25 1.45 1.45 1.05 6.63 10.78 3.80 5.25 2.21 2.49 0.00 0.00 0.00 3.31
Facility I 2.25 1.35 1.40 1.33 1.28 1.48 2.55 2.10 0.80 1.09 0.41 0.20 0.00 0.00 0.89
Facility J 2.25 1.25 1.45 1.50 1.50 0.00 4.84 8.99 0.00 0.00 0.00 0.00 0.00 0.00 5.87
Facility K 1.85 2.40 2.55 2.48 1.23 0.00 6.26 4.43 4.48 9.35 5.60 0.00 0.00 0.00 8.50
Facility M ------- ------- ------ ------ 1.23 ------- ------- ------- ------- ------- ------- 0.50 0.00 0.35 0.52
Facility N ------- ------- ------ ------ ------ 9.10 4.40 ------- ------- ----- ----- ----- ----- ------- -------
Facility O ------- ------- ------ ------ ------ 8.63 ------- ------- ------- ------ ------ ------ ------ ------- -------
TOTALS 2.01 1.92 2.00 1.46 1.52 4.95 3.45 3.34 3.46 3.23 1.85 1.18 0.00 0.58 1.57
DEPARTMENT
ACCOUNTABILITY SCORE INCIDENT RATE
2005 2006 2007 2008 2009 2003 2004 20092010 Goal
2010
2005 2006 2007 2008
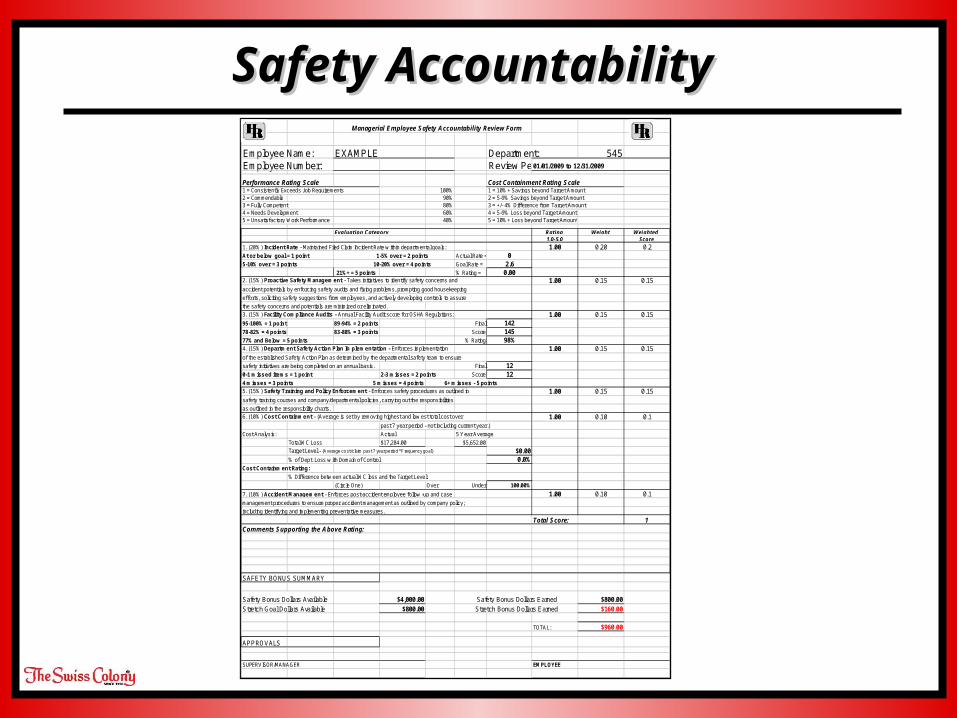
Safety Accountability Safety Accountability Managerial Employee Safety Accountability Review Form
Employee Name: EXAMPLE Department: 545Employee Number: Review Period:01/01/2009 to 12/31/2009
Performance Rating Scale Cost Containment Rating Scale1 = Consistently Exceeds Job Requirements 100% 1 = 10%+ Savings beyond Target Amount2 = Commendable 90% 2 = 5-9% Savings beyond Target Amount3 = Fully Competent 80% 3 = +/- 4% Difference from Target Amount4 = Needs Development 60% 4 = 5-9% Loss beyond Target Amount5 = Unsatisfactory Work Performance 40% 5 = 10%+ Loss beyond Target Amount
Evaluation Category Rating Weight Weighted 1.0-5.0 Score
1. (20%) Incident Rate - Maintained Filed Claim Incident Rate w ithin departmental goals: 1.00 0.20 0.2At or below goal = 1 point 1-5% over = 2 points Actual Rate = 05-10% over = 3 points 10-20% over = 4 points Goal Rate = 2.6
21%+ = 5 points % Rating = 0.002. (15%) Proactive Safety Management - Takes initiatives to identify safety concerns and 1.00 0.15 0.15accident potentials by enforcing safety audits and f ixing problems, prompting good housekeeping
efforts, soliciting safety suggestions from employees, and actively developing controls to assure
the safety concerns and potentials are minimized or eliminated.3. (15%) Facility Compliance Audits - Annual Facility Audit score for OSHA Regulations: 1.00 0.15 0.1595-100% = 1 point 89-94% = 2 points Final 14278-82% = 4 points 83-88% = 3 points Score 14577% and Below = 5 points % Rating 98%4. (15%) Department Safety Action Plan Implementation - Enforces implementation 1.00 0.15 0.15of the established Safety Action Plan as determined by the departmental safety team to ensure
safety initiatives are being completed on an annual basis. Final 120-1 missed items = 1 point 2-3 misses = 2 points Score 124 misses = 3 points 5 misses = 4 points 6+ misses - 5 points5. (15%) Safety Training and Policy Enforcement - Enforces safety procedures as outlined in 1.00 0.15 0.15safety training courses and company/departmental policies, carrying out the responsibilities
as outlined in the responsibility charts.6. (10%) Cost Containment - (Average is set by removing highest and low est total cost over 1.00 0.10 0.1
past 7 year period - not including current year.)
Cost Analysis: Actual 5 Year Average
Total WC Loss $17,284.00 $5,652.00Target Level - (Averagecost/claimpast7yearperiod*Frequencygoal) $0.00% of Dept. Loss w ith Domain of Control 0.0%
Cost Containment Rating:
% Difference betw een actual WC loss and the Target Level:
(Circle One) Over Under 100.00%
7. (10%) Accident Management - Enforces post-accident employee follow -up and case 1.00 0.10 0.1management procedures to ensure proper accident management as outlined by company policy;
including identifying and implementing preventative measures.
Total Score: 1Comments Supporting the Above Rating:
SAFETY BONUS SUMMARY
Safety Bonus Dollars Available $4,000.00 $800.00Stretch Goal Dollars Available $800.00 $160.00
TOTAL: $960.00
APPROVALS
SUPERVISOR/MANAGER EMPLOYEE
Safety Bonus Dollars EarnedStretch Bonus Dollars Earned
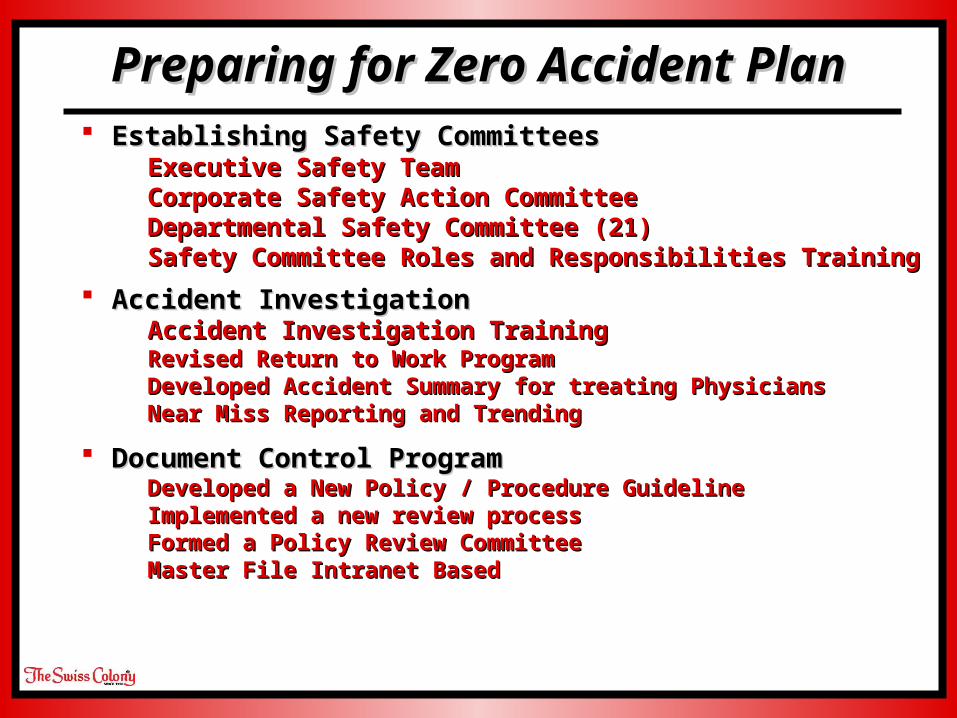
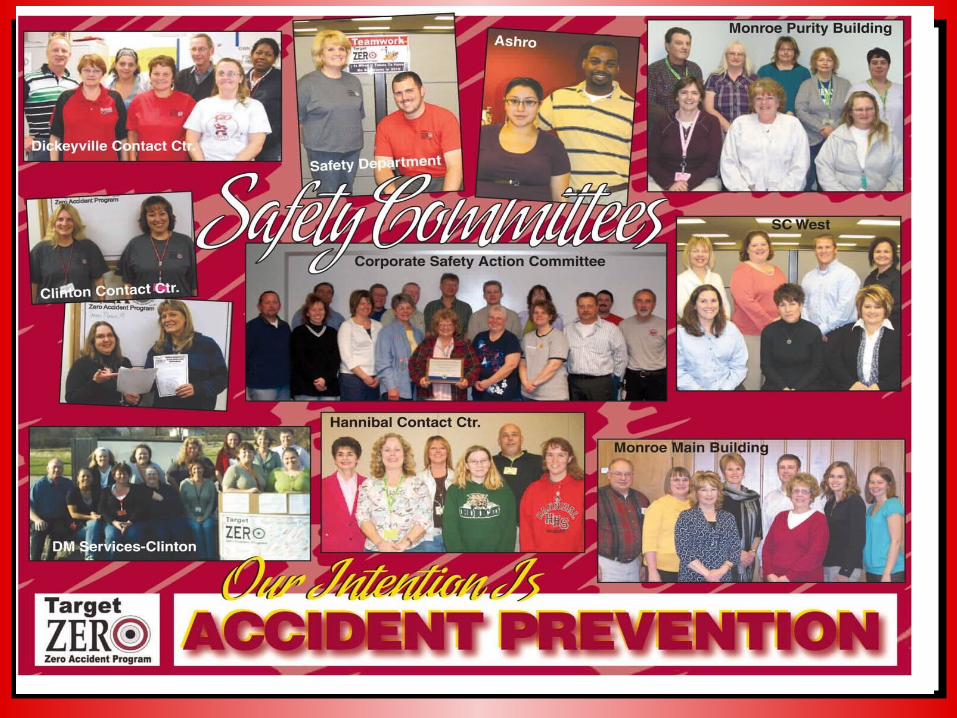
Preparing for Zero Accident Preparing for Zero Accident PlanPlan Establishing Safety CommitteesEstablishing Safety Committees
Executive Safety TeamExecutive Safety Team Corporate Safety Action CommitteeCorporate Safety Action Committee Departmental Safety Committee (21)Departmental Safety Committee (21) Safety Committee Roles and Responsibilities TrainingSafety Committee Roles and Responsibilities Training
Accident Investigation Accident Investigation Accident Investigation TrainingAccident Investigation Training Revised Return to Work ProgramRevised Return to Work Program Developed Accident Summary for treating Physicians Developed Accident Summary for treating Physicians Near Miss Reporting and TrendingNear Miss Reporting and Trending
Document Control ProgramDocument Control Program Developed a New Policy / Procedure GuidelineDeveloped a New Policy / Procedure Guideline Implemented a new review processImplemented a new review process Formed a Policy Review Committee Formed a Policy Review Committee Master File Intranet BasedMaster File Intranet Based
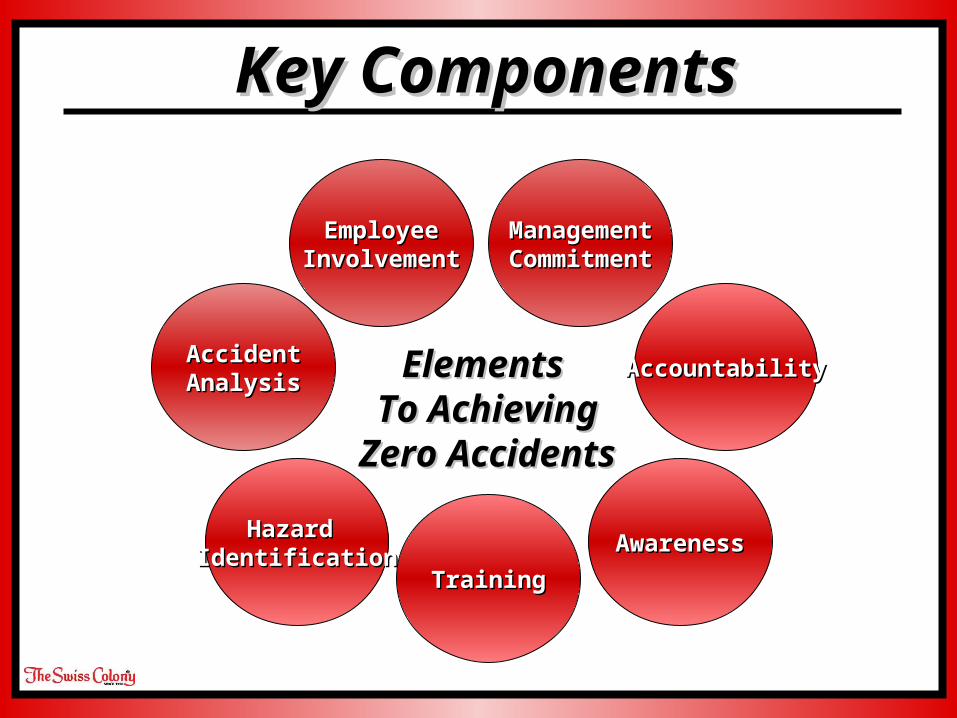
Hazard Hazard IdentificationIdentification
AccidentAccidentAnalysisAnalysis
ManagementManagementCommitmentCommitment
AccountabilityAccountability
TrainingTraining
AwarenessAwareness
EmployeeEmployeeInvolvementInvolvement
Key ComponentsKey Components
Elements Elements To AchievingTo Achieving
Zero AccidentsZero Accidents
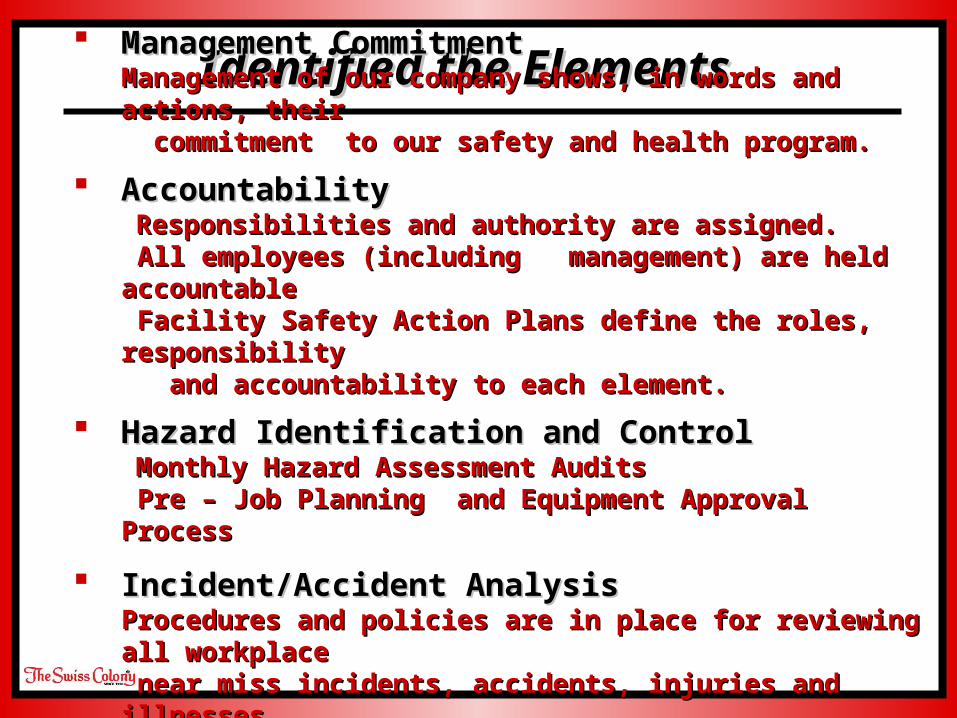
Identified the Elements Identified the Elements Management CommitmentManagement CommitmentManagement of our company shows, in words and Management of our company shows, in words and actions, theiractions, their commitment to our safety and health program.commitment to our safety and health program.
Accountability Accountability Responsibilities and authority are assigned. Responsibilities and authority are assigned. All employees (including management) are held All employees (including management) are held accountableaccountable Facility Safety Action Plans define the roles, Facility Safety Action Plans define the roles, responsibilityresponsibility and accountability to each element.and accountability to each element.
Hazard Identification and ControlHazard Identification and Control Monthly Hazard Assessment AuditsMonthly Hazard Assessment Audits Pre – Job Planning and Equipment Approval ProcessPre – Job Planning and Equipment Approval Process
Incident/Accident AnalysisIncident/Accident AnalysisProcedures and policies are in place for reviewing all Procedures and policies are in place for reviewing all workplace workplace near miss incidents, accidents, injuries and near miss incidents, accidents, injuries and illnesses.illnesses.
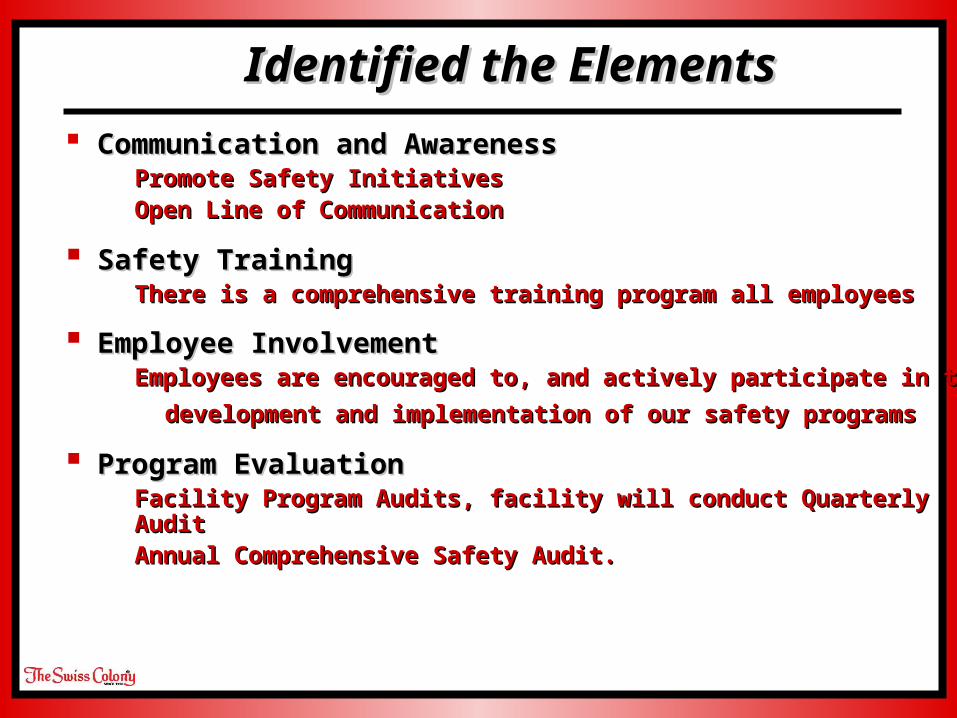
Identified the ElementsIdentified the Elements
Communication and AwarenessCommunication and Awareness Promote Safety Initiatives Promote Safety Initiatives Open Line of CommunicationOpen Line of Communication
Safety Training Safety Training There is a comprehensive training program all employeesThere is a comprehensive training program all employees
Employee Involvement Employee Involvement Employees are encouraged to, and actively participate in the Employees are encouraged to, and actively participate in the
development and implementation of our safety programsdevelopment and implementation of our safety programs
Program Evaluation Program Evaluation Facility Program Audits, facility will conduct Quarterly Audit Facility Program Audits, facility will conduct Quarterly Audit Annual Comprehensive Safety Audit. Annual Comprehensive Safety Audit.
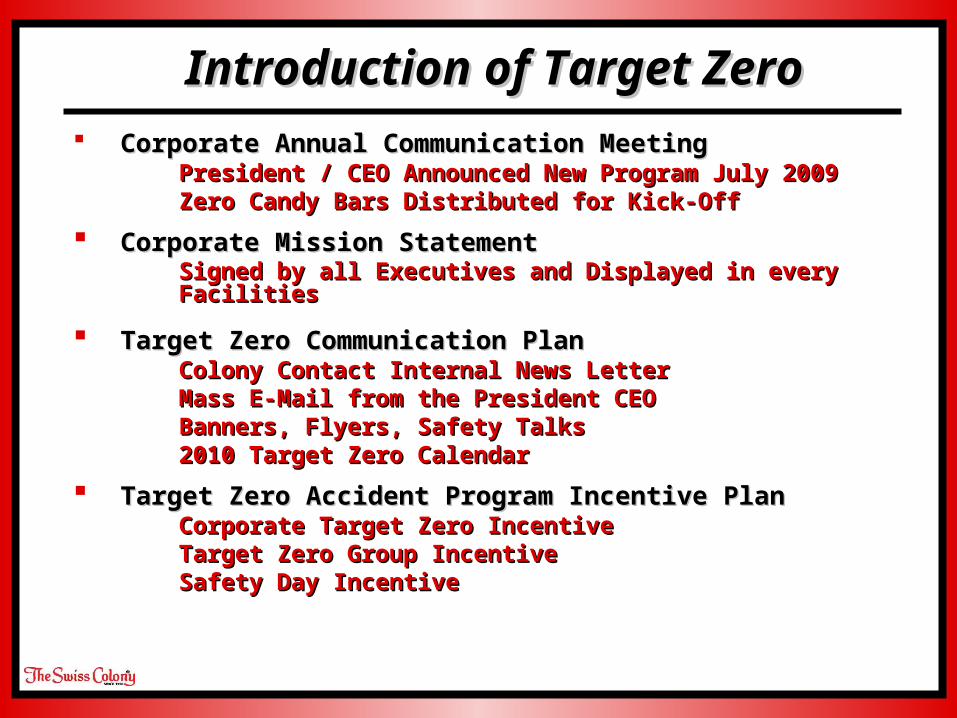
Introduction of Target ZeroIntroduction of Target Zero Corporate Annual Communication MeetingCorporate Annual Communication Meeting
President / CEO Announced New Program July 2009President / CEO Announced New Program July 2009 Zero Candy Bars Distributed for Kick-OffZero Candy Bars Distributed for Kick-Off
Corporate Mission StatementCorporate Mission Statement Signed by all Executives and Displayed in every Signed by all Executives and Displayed in every
FacilitiesFacilities
Target Zero Communication PlanTarget Zero Communication Plan Colony Contact Internal News LetterColony Contact Internal News Letter Mass E-Mail from the President CEOMass E-Mail from the President CEO Banners, Flyers, Safety Talks Banners, Flyers, Safety Talks 2010 Target Zero Calendar2010 Target Zero Calendar
Target Zero Accident Program Incentive PlanTarget Zero Accident Program Incentive Plan Corporate Target Zero IncentiveCorporate Target Zero Incentive Target Zero Group IncentiveTarget Zero Group Incentive Safety Day IncentiveSafety Day Incentive
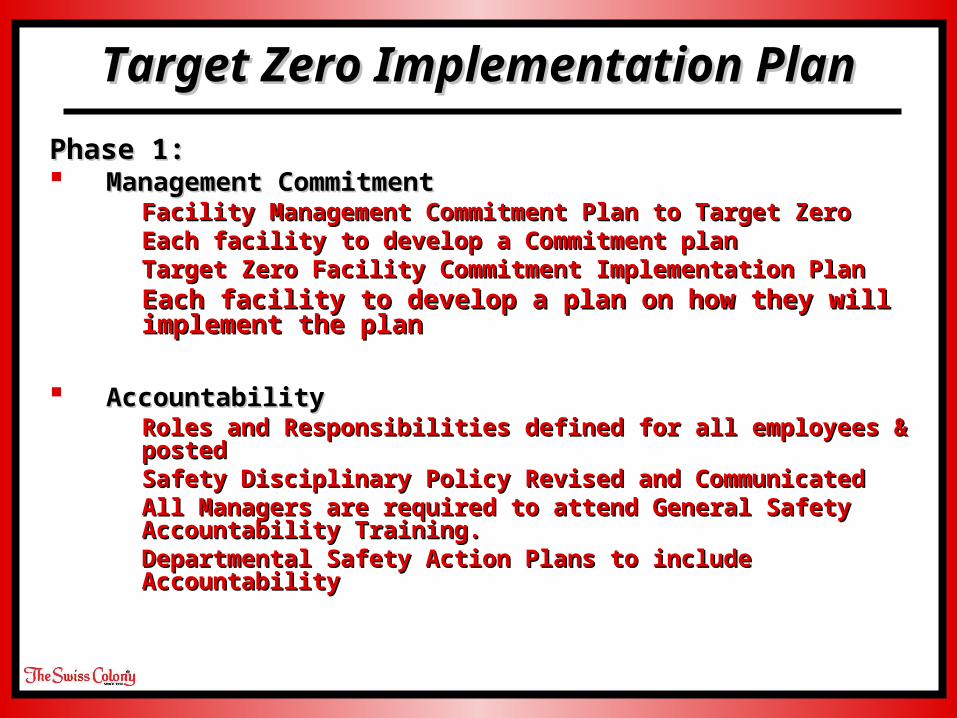
Phase 1: Phase 1: Management CommitmentManagement Commitment
Facility Management Commitment Plan to Target ZeroFacility Management Commitment Plan to Target Zero Each facility to develop a Commitment planEach facility to develop a Commitment plan Target Zero Facility Commitment Implementation PlanTarget Zero Facility Commitment Implementation Plan Each facility to develop a plan on how they will Each facility to develop a plan on how they will
implement the plan implement the plan
AccountabilityAccountability Roles and Responsibilities defined for all employees & Roles and Responsibilities defined for all employees &
postedposted Safety Disciplinary Policy Revised and CommunicatedSafety Disciplinary Policy Revised and Communicated All Managers are required to attend General Safety All Managers are required to attend General Safety
Accountability Training.Accountability Training. Departmental Safety Action Plans to include Departmental Safety Action Plans to include
AccountabilityAccountability
Target Zero Implementation Target Zero Implementation PlanPlan
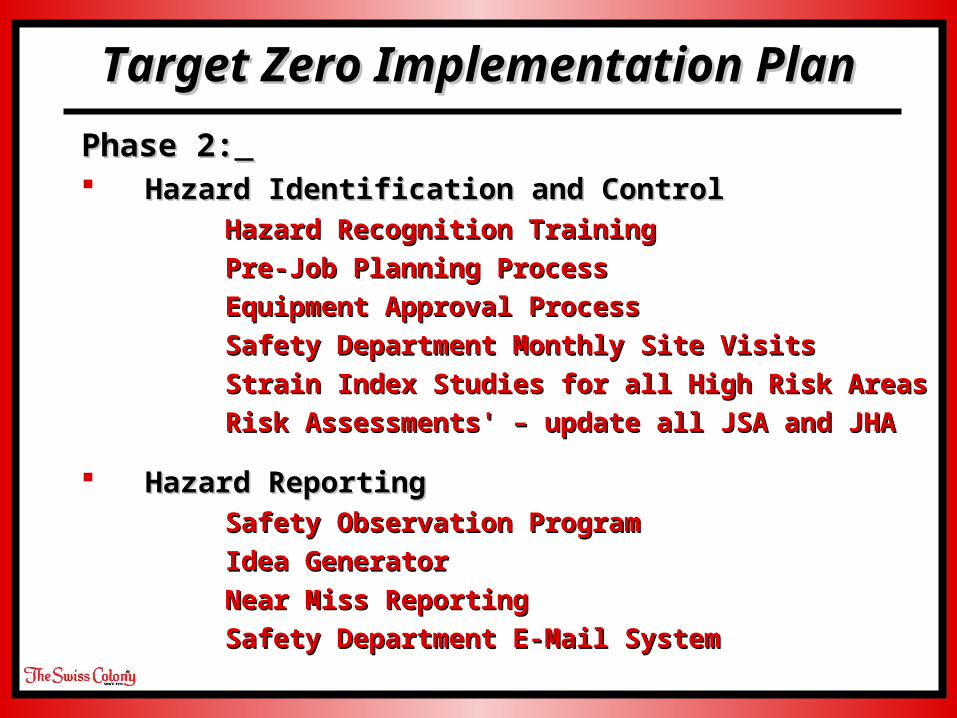
Phase 2:Phase 2: Hazard Identification and ControlHazard Identification and Control
Hazard Recognition Training Hazard Recognition Training Pre-Job Planning ProcessPre-Job Planning Process Equipment Approval Process Equipment Approval Process Safety Department Monthly Site VisitsSafety Department Monthly Site Visits Strain Index Studies for all High Risk AreasStrain Index Studies for all High Risk Areas Risk Assessments' – update all JSA and JHARisk Assessments' – update all JSA and JHA
Hazard ReportingHazard Reporting Safety Observation ProgramSafety Observation Program Idea GeneratorIdea Generator Near Miss ReportingNear Miss Reporting Safety Department E-Mail SystemSafety Department E-Mail System
Target Zero Implementation Target Zero Implementation PlanPlan
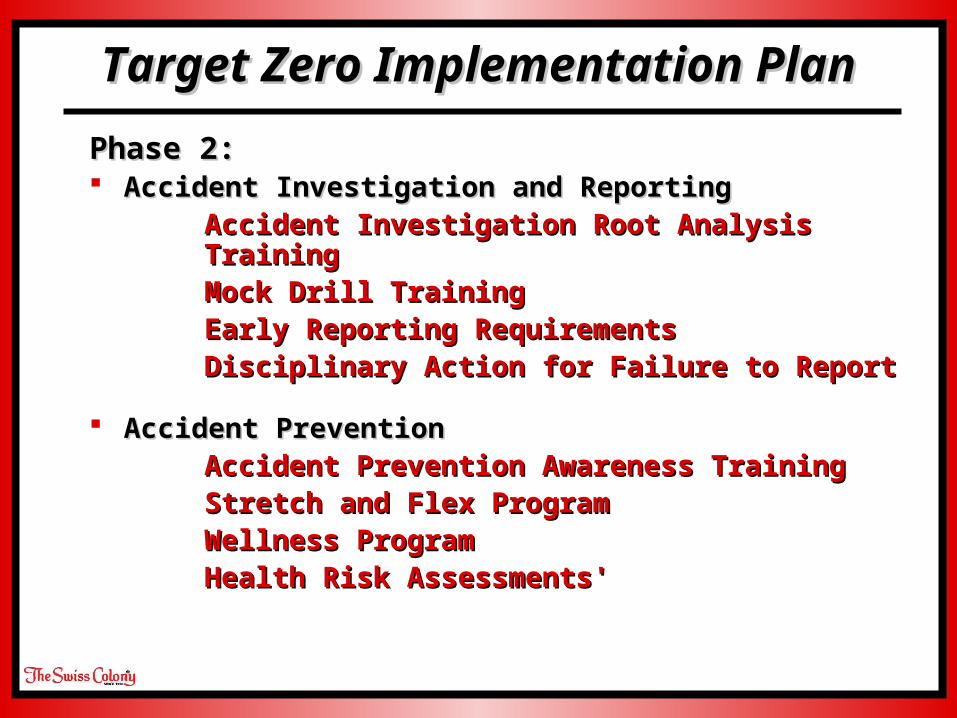
Phase 2: Phase 2: Accident Investigation and Reporting Accident Investigation and Reporting
Accident Investigation Root Analysis Accident Investigation Root Analysis TrainingTraining
Mock Drill TrainingMock Drill Training Early Reporting Requirements Early Reporting Requirements Disciplinary Action for Failure to Report Disciplinary Action for Failure to Report
Accident PreventionAccident Prevention Accident Prevention Awareness TrainingAccident Prevention Awareness Training Stretch and Flex ProgramStretch and Flex Program Wellness ProgramWellness Program Health Risk Assessments'Health Risk Assessments'
Target Zero Implementation Target Zero Implementation PlanPlan
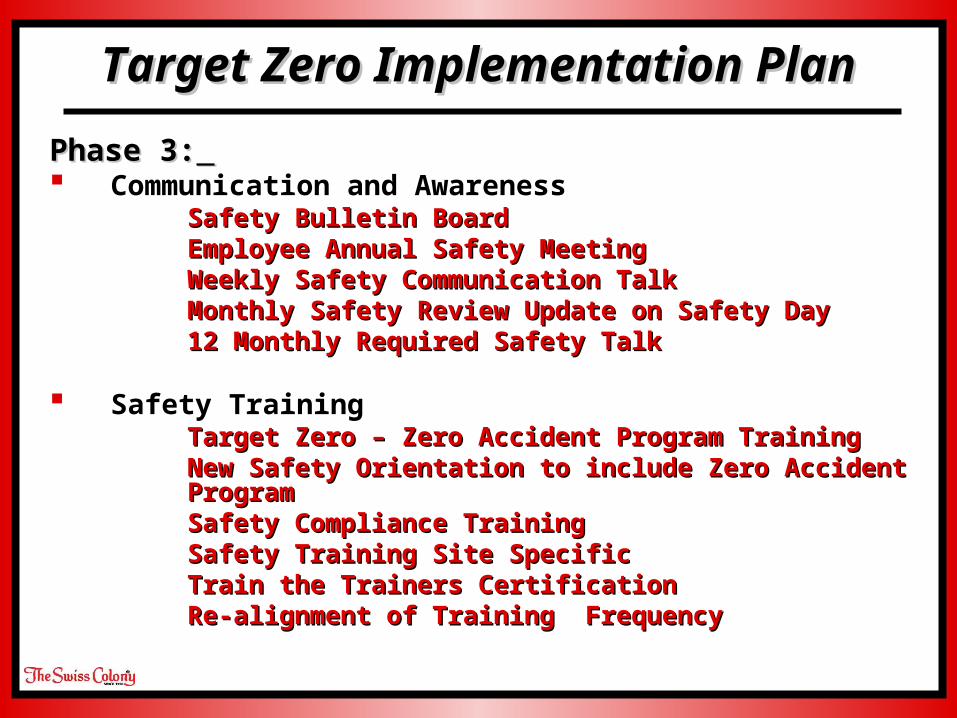
Phase 3:Phase 3: Communication and Awareness
Safety Bulletin BoardSafety Bulletin Board Employee Annual Safety MeetingEmployee Annual Safety Meeting Weekly Safety Communication TalkWeekly Safety Communication Talk Monthly Safety Review Update on Safety DayMonthly Safety Review Update on Safety Day 12 Monthly Required Safety Talk 12 Monthly Required Safety Talk
Safety Training Target Zero – Zero Accident Program TrainingTarget Zero – Zero Accident Program Training New Safety Orientation to include Zero Accident New Safety Orientation to include Zero Accident
Program Program Safety Compliance TrainingSafety Compliance Training Safety Training Site SpecificSafety Training Site Specific Train the Trainers CertificationTrain the Trainers Certification Re-alignment of Training FrequencyRe-alignment of Training Frequency
Target Zero Implementation Target Zero Implementation PlanPlan
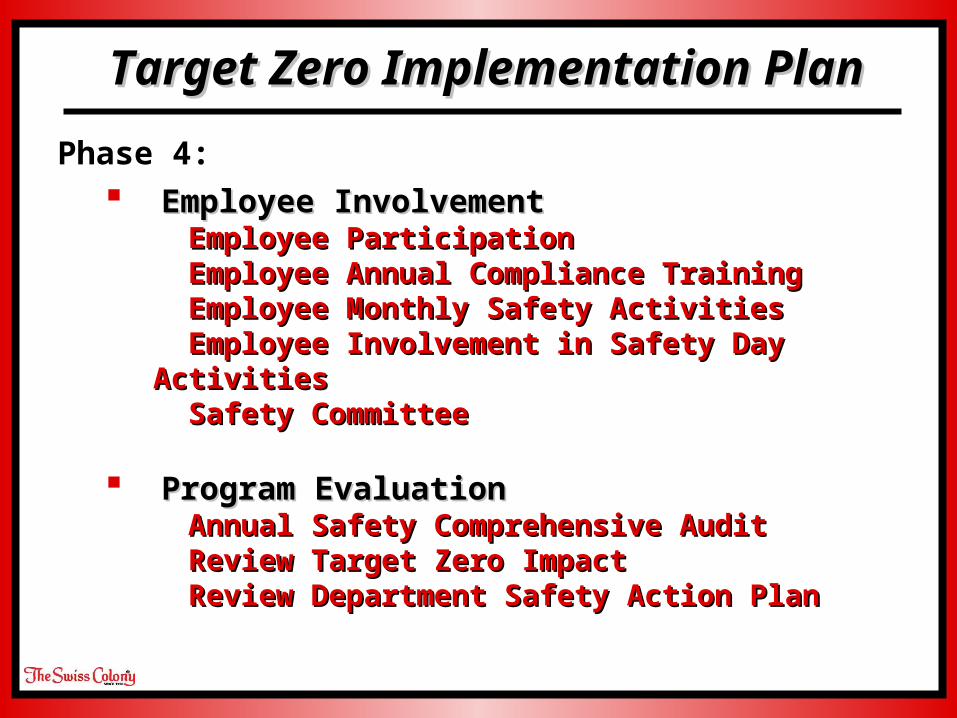
Phase 4: Employee Involvement Employee Involvement
Employee ParticipationEmployee Participation Employee Annual Compliance Training Employee Annual Compliance Training Employee Monthly Safety ActivitiesEmployee Monthly Safety Activities Employee Involvement in Safety Day Employee Involvement in Safety Day Activities Activities Safety CommitteeSafety Committee
Program Evaluation Program Evaluation Annual Safety Comprehensive AuditAnnual Safety Comprehensive Audit Review Target Zero Impact Review Target Zero Impact Review Department Safety Action PlanReview Department Safety Action Plan
Target Zero Implementation Target Zero Implementation PlanPlan
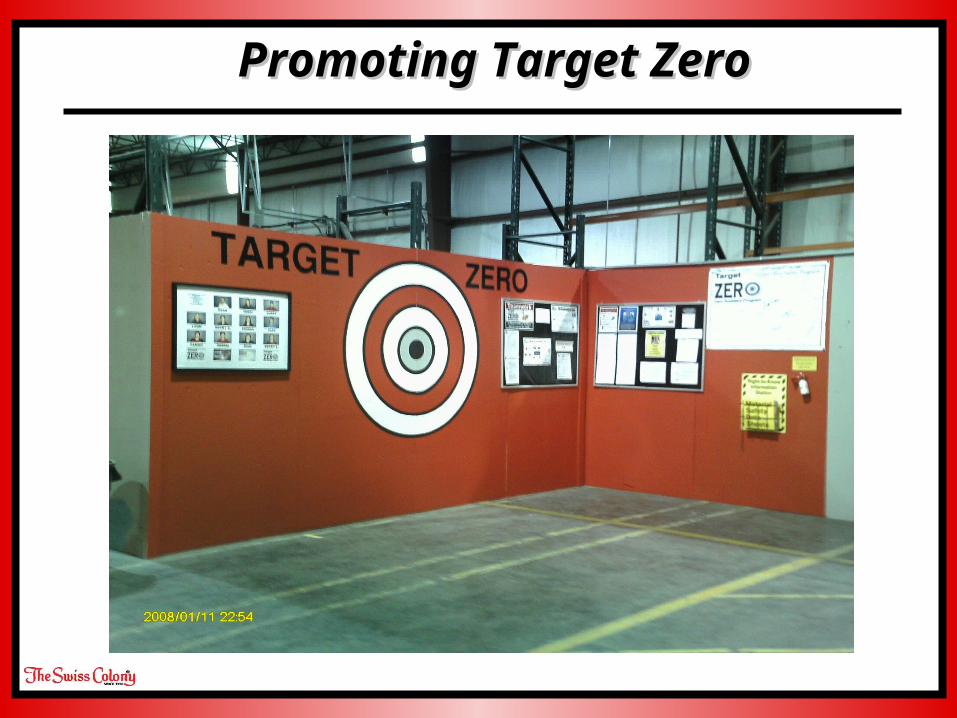
Promoting Target ZeroPromoting Target Zero
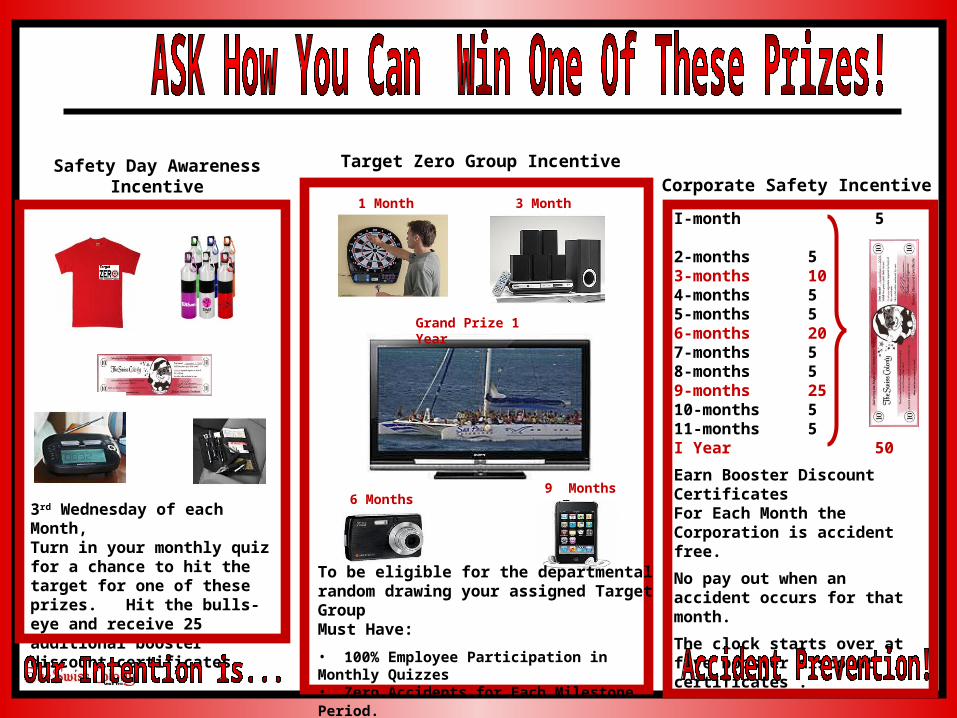
Safety Day Awareness Incentive
3rd Wednesday of each Month,Turn in your monthly quiz for a chance to hit the target for one of these prizes. Hit the bulls-eye and receive 25 additional booster discount certificates.
Target Zero Group Incentive
Grand Prize 1 Year
6 Months9 Months
1 Month 3 Month
To be eligible for the departmental random drawing your assigned Target Group Must Have:
• 100% Employee Participation in Monthly Quizzes• Zero Accidents for Each Milestone Period.
I-month 5 2-months 5 3-months 10 4-months 5 5-months 5 6-months 207-months 58-months 59-months 25 10-months 511-months 5I Year 50
Earn Booster Discount Certificates For Each Month the Corporation is accident free.
No pay out when an accident occurs for that month.
The clock starts over at five booster discount certificates .
Corporate Safety Incentive
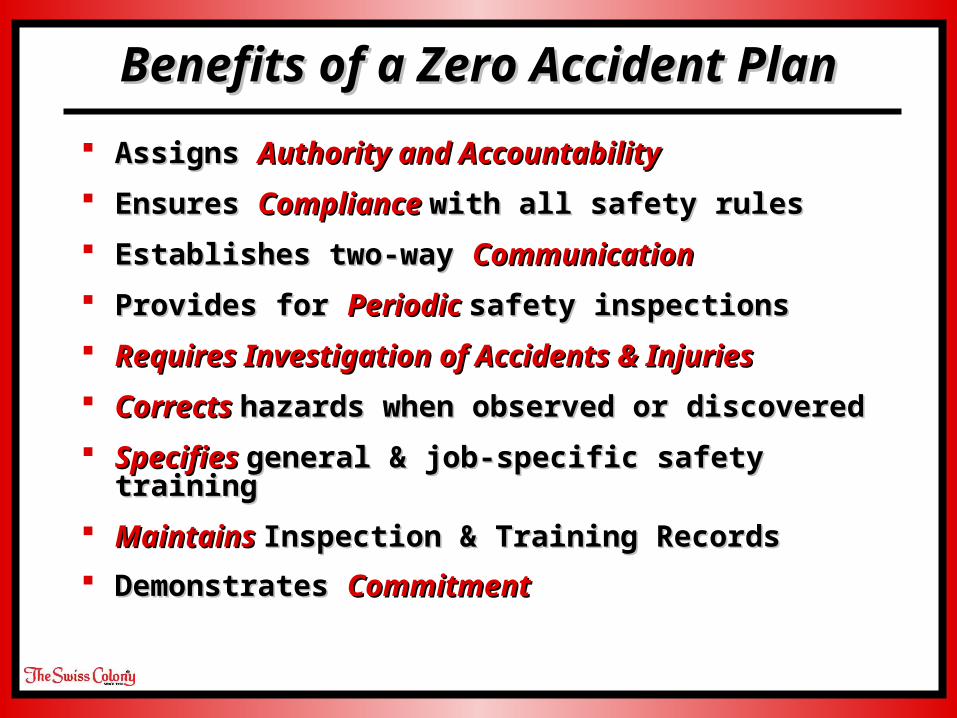
Assigns Assigns Authority and Accountability Authority and Accountability
Ensures Ensures ComplianceCompliance with all safety ruleswith all safety rules
Establishes two-way Establishes two-way CommunicationCommunication
Provides for Provides for Periodic Periodic safety inspectionssafety inspections
Requires Investigation of Accidents & InjuriesRequires Investigation of Accidents & Injuries
Corrects Corrects hazards when observed or discoveredhazards when observed or discovered
SpecifiesSpecifies general & job-specific safety traininggeneral & job-specific safety training
Maintains Maintains Inspection & Training RecordsInspection & Training Records
Demonstrates Demonstrates CommitmentCommitment
Benefits of a Zero Accident Benefits of a Zero Accident PlanPlan
““Thank-you” Thank-you”
The only goal that represents the The only goal that represents the intended results of an effective safety intended results of an effective safety program isprogram is
Zero Accidents.Zero Accidents.
It makes sense from a moral, It makes sense from a moral, economic, and safety standpoint. economic, and safety standpoint.
It says accidents are unacceptable and It says accidents are unacceptable and preventable. Make it your company's preventable. Make it your company's goalsgoals
It's all about expectationsIt's all about expectations! !