Embed Size (px)
Citation preview
213
Creating, Protecting, and Using Crop Biotechnologies Worldwide in an Era of Intellectual Property
Philip G. Pardey, Bonwoo Koo and Carol Nottenburg*
I. INTRODUCTION Most crops are grown in places where they did not occur
naturally, but were introduced there incidentally or intentionally. The international development and dissemination of new and improved seed varieties have been the basis for productivity improvement in agriculture since crops were first domesticated about ten millennia ago.1 Initially, the movement of plant material involved farmers carrying seed as they migrated to new areas.2 Columbus returned from his voyage to the New World in the latter part of the fifteenth century laden with new plants that ushered in an extended era of state-sponsored expeditions to gather and evaluate plant materials the world over.3 For most of that
* Philip Pardey is Professor of Science and Technology Policy in the Department of Applied Economics, University of Minnesota. Bonwoo Koo is a Research Fellow at the International Food Policy Research Institute, Washington D.C. Carol Nottenburg is a Principal of Cougar Patent Law, formerly Chief Legal Officer and Director, Cambia IP Resource, CAMBIA, Canberra, Australia. The authors thank Doug Ashton, Eduardo Castelo-Magalhães, Barry Ryan, and Patricia Zambrano for their help in preparing this paper. Brian Wright provided insightful comments for which we are especially grateful. This paper is a revised and updated version of a paper first presented at the WIPO-UPOV Symposium on Intellectual Property Rights in Plant Biotechnology held on October 24, 2003 at the World Intellectual Property Organization (WIPO) and International Union for the Protection of New Varieties of Plants (UPOV) headquarters, Geneva. 1. See Philip Pardey & Brian Wright, Agricultural Research & Development, Productivity & Global Food Products, in PLANTS, GENES AND CROP BIOTECHNOLOGY (M.J. Chrispeels & D.E. Sadava, eds., 2d ed. 2003). 2. Id. 3. Id.

214 MINN. J.L. SCI. & TECH. [Vol. 6:1
time, new crop varieties were largely treated as common property, shared freely among farmers and countries and generating billions of dollars of benefits worldwide.4
The era of free and unencumbered access to new crop varieties appears to be passing. This has implications beyond the movement and marketing of new crop varieties; it affects their creation as well. Scientific crop breeding, drawing on Mendelian Laws of Heredity, began in earnest about a century ago.5 For many countries, varietal innovations continued to rely heavily on introduced germplasm, and the international spillovers of germplasm, breeding techniques, and know-how continued to be integral to these crop improvement efforts.6 While substantial germplasm flowed from poorer countries into the rich ones, enhanced germplasm also moved back to the poorer parts of the world.7 This reverse flow accelerated as the Green Revolution took hold, beginning in the 1960s, as developing-country farmers took up improved varieties in a big way and local breeding efforts screened and adapted these varietal spill-ins to better deal with local agroecological realities and production constraints.8
Throughout all these changes, crop improvement has been, and largely remains, a cumulative or sequential innovation process—new varieties build directly on the selection and breeding efforts of farmers and scientists of yesteryear. A new twist has come with the advent of modern biotechnology tools. Now the genetic makeup of new varieties are altered by the “conventional or classical” genetic manipulation techniques practiced formally by scientists for the past 100 years (and less formally by farmers for eons prior to that), or by bioengineered techniques involving the purposeful insertion of gene fragments into plants from other plants or other organisms using genomic and transformation technologies developed within the past two
4. Sarah Boettiger, et al., Intellectual Property Rights for Plant Biotechnology: International Aspects, in HANDBOOK OF PLANT BIOTECHNOLOGY (P. Christou & H. Klee eds. 2004) 5. See PHILIP G. PARDEY & NIENKE M. BEINTEMA, SLOW MAGIC: AGRICULTURAL R&D A CENTURY AFTER MENDEL 3 (Int’l. Food Policy Research Inst. Food Policy Report, Oct. 2001). 6. See id. 7. See id. 8. See Robert Evenson & Douglas Gollin, Assessing the Impact of the Green Revolution, 1960 to 2000, 300 SCIENCE 758 (2003).

2004 USING CROP BIOTECHNOLGIES WORLDWIDE 215
decades.9 Like the crop varieties themselves, the tools of crop manipulation are increasingly encumbered by intellectual property, making the future of crop-improvement inextricably tied to the future of the biotechnologies increasingly used to manipulate them.
Whether these changing market, scientific, and intellectual property regimes will help or hinder efforts to develop and disseminate varietal technologies in the future, and especially the crop innovations required by the developing world, is an open question. This paper surveys and reports newly compiled evidence on the research and, especially, the intellectual property landscapes regarding plant biotechnologies as a step toward resolving these questions.
II. CROP BIOTECHNOLOGY CREATION Crop biotechnologies are not necessarily used or protected
where created. The location and structure of the relevant research and development sectors are important as a basis for analyzing the patterns of intellectual property rights in the resulting crop innovations and their uptake worldwide.
A. RESEARCH SPENDING In 1995 about half a trillion U.S. dollars were invested in
all public and privately financed science worldwide, of which eighty-five percent could be attributed to rich countries.10 Agricultural research accounted for thirty-three billion dollars, or nearly seven percent, of all private and public spending on
9. All crops are genetically modified, making the mnemonic “GMOs” (genetically modified organisms) misleading in ways that seem to have profoundly affected peoples’ perceptions about the latest set of crop-improvement techniques. Among the continuum of genetic modification methods, it is useful to distinguish between classically bred crops using techniques like hybridization that became commonplace among scientific breeders beginning a century ago, and varieties whose DNA have been manipulated with bioengineering techniques like the ballistic gun or Agrobacterium-mediated transformations of DNA that form the forefront of present crop improvement methods. Some modern varieties are conventionally bred but incorporate herbicide tolerant genes identified using modern genomic methods, confounding efforts to neatly classify crop varieties. For a more complete description of these technologies, see MAARTEN J. CHRISPEELS & DAVID E. SADAVA, PLANTS, GENES, AND CROP BIOTECHNOLOGY (2d ed. 2002). 10. See PARDEY & BEINTEMA, supra note 5, at 11 tbl.B4.

216 MINN. J.L. SCI. & TECH. [Vol. 6:1
science.11 The public share of agricultural investment was
substantial, but is now flagging. Worldwide, public investments in agricultural research nearly doubled in inflation-adjusted terms over the past two decades, from an estimated $11.8 billion in 1976 to nearly twenty-two billion dollars in 1995.12 Yet for many parts of the world, growth in spending during the 1990s slowed dramatically. In the rich countries, public investment grew just 0.2 percent annually between 1991 and 1996 compared with 2.2 percent per year during the 1980s.13 In Africa, there was no growth at all.14 In Asia, the 4.4 percent annual growth figure compared with 7.5 percent the previous decade.15
The distribution of spending on agricultural research has shifted as well. In the 1990s, for the first time, developing countries as a group spent more on public agricultural research than the developed countries.16 For example, a handful of rich countries accounted for $10.2 billion dollars in public spending.17 In 1995 the United States, Japan, France and Germany accounted for two-thirds of this public research, about the same as two decades before.18 Three developing countries China, India, and Brazil spent forty-four percent of the developing world’s public agricultural research money in 1995, up from thirty-five percent in the mid-1970s.19
As indicated in Table 1, by the mid-1990s about one-third of the thirty-three billion dollar total public and private agricultural research investment worldwide was private.20 But little of this research takes place in the developing world. The overwhelming majority ($10.8 billion, or ninety-four percent, of the global total in 1995) is conducted in developed counties,
11. Id. at 10. 12. Id. at 3. 13. Id. 14. Id. at 4 tbl.1. 15. See PARDEY & BEINTEMA, supra note 5, at 4 tbl.1. 16. Id. 17. Id. 18. Id. 19. Id. at 4. 20. Id. at 10.

2004 USING CROP BIOTECHNOLGIES WORLDWIDE 217
where private research is over half of all expenditures.21 In developing countries, the private share of research is just five percent, and public funds are still the major source of support.22
TABLE 1: PRIVATE AND PUBLIC AGRICULTURAL RESEARCH AND DEVELOPMENT INVESTMENTS, CIRCA 199524
Expenditures Shares
Public Private Total Public Private Total
(million 1993 international dollars) (percent)
Developing countries
11,469 672 12,141 94.5 5.5 100
Developed countries
10,215 10,829 21,044 48.5 51.5 100
Total 21,692 11,511 33,204 65.3 34.7 100
Private agricultural research is displacing public research
generally and specifically regarding the development of new varieties of crops that have high commercial value.25 This tendency is especially pronounced in countries like the United States where private agricultural research and development was ninety percent of public spending in 1960, growing to 133
21. See PARDEY & BEINTEMA, supra note 5, at 10 tbl.2. 22. Id. 24. Id. Drawing together estimates from various sources meant there were unavoidable discrepancies in what constitutes “private” and “public” research. For example, the available data for Asia includes nonprofit producer organizations as part of private research, whereas Pardey and Beintema opted to include research done by nonprofit agencies as part of public research in Latin America and elsewhere when possible. 25. See id. at 12.

218 MINN. J.L. SCI. & TECH. [Vol. 6:1
percent by 1996, the latest year for which comparable public-private data are available.26 Private investments, fueled by agricultural biotechnology research, gravitate to techniques which promise large markets, are protected by intellectual property rights, and are easily transferable across agroecologies. These included food processing and other post-harvest technologies and chemical inputs including pesticides, herbicides and fertilizers.27 Hence, while private research is much more geographically concentrated than public research, many of its fruits may be more easily transferred across borders and agroecological zones. Even so, private research is far less likely in products or methods with small markets, weak intellectual property protection, and limited transferability- precisely the situations in which most poor farmers are found.
B. RESEARCH INTENSITIES AND STOCKS OF KNOWLEDGE One way to gauge the commitment of agricultural research
funds, public or private, is to compare them to national agricultural output, rather than measuring them in absolute terms. This relative measure captures the intensity of investment in agricultural research as a percentage of agricultural gross domestic product (GDP), not just the amount of total research spending.28 In 1995 developed countries spent $5.43 on public and private agricultural research and development for every one hundred dollars of agricultural output, compared with just sixty-six cents per one hundred dollars of output for developing countries.29 The eightfold difference in total research intensities illustrates the size of the technological gap in agriculture between rich and poor countries. Moreover, the situation is growing worse. The difference in public research intensity ratios was 3.5−fold in the 1970s, compared with 4.3−fold now.30 An even wider gap would have opened up if private spending was also factored in.31
These trends may actually understate the scientific knowledge gap. Science is a cumulative endeavor, with a
26. See generally id. 27. See id. at 12. 28. See PARDEY & BEINTEMA, supra note 5, at 13. 29. See id. at 13-14. 30. See id. 31. See id.

2004 USING CROP BIOTECHNOLGIES WORLDWIDE 219
snowball effect. Innovations beget new ideas and further rounds of innovation or additions to the cumulative stock of knowledge. The sequential and cumulative nature of scientific progress and knowledge is starkly illustrated by crop-improvement. It generally takes seven to ten years of breeding to develop a uniform, stable, and superior variety.32 But breeders of today build on a base of knowledge built up by breeders of yesteryear.33 The cumulative nature of this process means that past discoveries and related research are an integral part of contemporary agricultural innovations. Conversely, the loss of a variety, or the details of the breeding histories that brought it about, means the loss of accumulated past research to the present stock of knowledge. “Providing adequate funding for research is thus only part of the science story. Putting in place the policies and practices to accumulate innovations and increase and preserve the stock of knowledge is an equally important and almost universally unappreciated foundation.”34
Estimates of the stocks of scientific knowledge arising from public and private research conducted in the United States and Sub-Saharan Africa have been developed by Philip G. Pardey and Nienke Beintema.35 In their report, Slow Magic, Pardey and Beintema compared historical research spending with the agricultural GDP for 1995.36 They examined historical research spending starting from 1850 for the United States and 1900 for Africa and allowed for a gradual diminution of the
32. See id. at 15. 33. See BONWOO KOO & BRIAN D. WRIGHT, ECONOMICS OF PATENTING A RESEARCH TOOL 3-5 (Int’l Food Policy Research Inst., Environment and Production Technology Division Discussion Paper No. 88, Jan. 2002), available at http://www.ifpri.org/. 34. PARDEY & BEINTEMA, supra note 5, at 15. Discoveries and data that are improperly documented or inaccessible (and so effectively exist only in the minds of the relevant researchers) are lost from the historical record when researchers retire from science. These “hidden” losses seem particularly prevalent in cash-strapped research agencies in the developing world, where inadequate and often irregular amounts of funding limit the functioning of libraries, data banks and gene banks, and hasten staff turnover. There can also be catastrophic losses, tied to the political instability that is a root cause of hunger. Civil strife and wars cause an exodus of scientific staff, or at least a flight from practicing science. Id. 35. Id. at 15-17. 36. See id. at 17.

220 MINN. J.L. SCI. & TECH. [Vol. 6:1
effect of distant past research and development spending on money measures of the current stock of knowledge.37 They found that the accumulated stock of knowledge in the United States was about eleven times more than the amount of agricultural output produced in that year.38 In other words, for every $100 of agricultural output there existed a $1,100 stock of knowledge to draw upon.39 In Africa, the stock of knowledge in 1995 was actually less than the value of African agricultural output.40 The ratio of the U.S. knowledge stock relative to U.S. agricultural output in 1995 was nearly twelve times higher than the corresponding amount for Africa.41 Stocks of knowledge measures provide a better basis for evaluating the developed versus developing country’s capacity for actually carrying out crop biotechnologies. In fact, the overall differences may understate the effective gaps for this advanced area of agricultural research and development. These gaps also underscore the immensity, if not the outright impossibility, of playing “catch-up,” in addition to the need to transfer knowledge across borders and continents.
C. BIOTECHNOLOGY TRIALS Absent meaningful data on “crop-related biotechnology
research” spending, the only indication of the location of crop biotechnology research are data on the number of field trials conducted internationally.42 “Crop-related biotechnology research” can be difficult to define. “Biotechnology” can run the whole gambit from conventional breeding through cultivating methods to genomic and bioengineering techniques. In addition, many biotechnology techniques developed with spending directed to the health sciences have agricultural applications as well. Focusing their search solely on crop-related biotechnology research, Pardey and Beintema compiled data on the number of field trials conducted on bioengineered crops from 1987 through December 2000 grouped by the
37. See id. at 15-17. 38. Id. at 17. 39. Id. 40. PARDEY & BEINTEMA, supra note 5, at 17 41. Id. 42. See id. at 18.
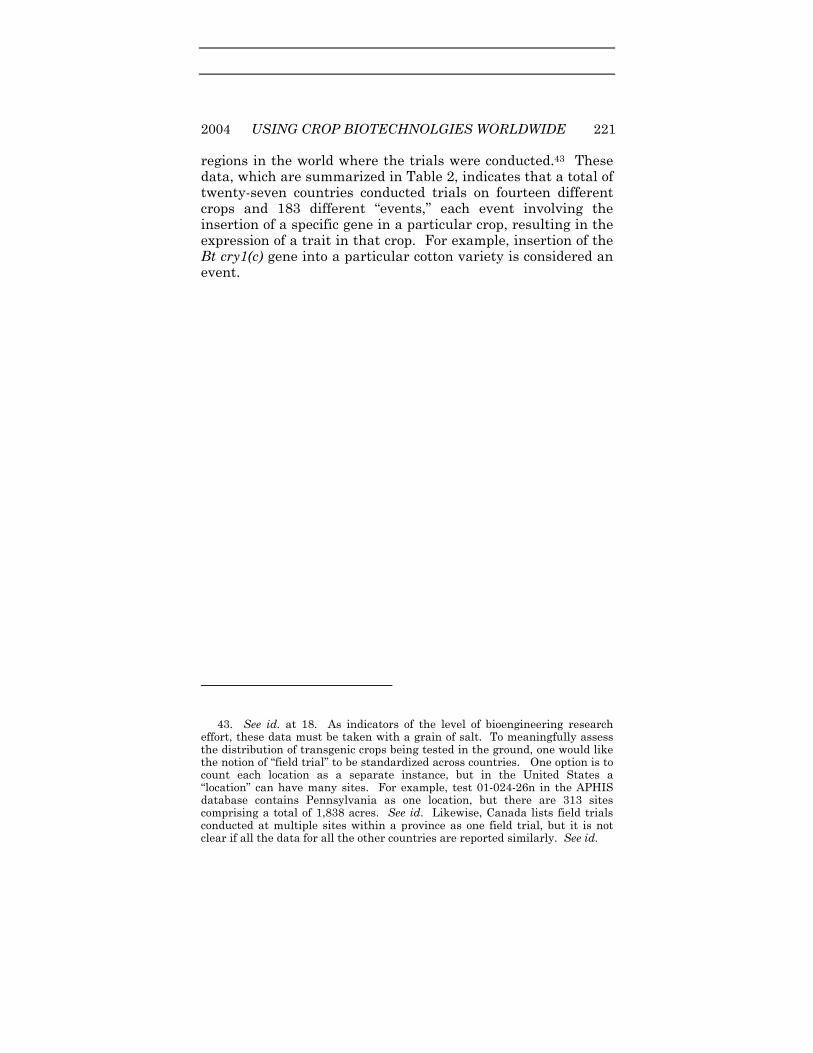
2004 USING CROP BIOTECHNOLGIES WORLDWIDE 221
regions in the world where the trials were conducted.43 These data, which are summarized in Table 2, indicates that a total of twenty-seven countries conducted trials on fourteen different crops and 183 different “events,” each event involving the insertion of a specific gene in a particular crop, resulting in the expression of a trait in that crop. For example, insertion of the Bt cry1(c) gene into a particular cotton variety is considered an event.
43. See id. at 18. As indicators of the level of bioengineering research effort, these data must be taken with a grain of salt. To meaningfully assess the distribution of transgenic crops being tested in the ground, one would like the notion of “field trial” to be standardized across countries. One option is to count each location as a separate instance, but in the United States a “location” can have many sites. For example, test 01-024-26n in the APHIS database contains Pennsylvania as one location, but there are 313 sites comprising a total of 1,838 acres. See id. Likewise, Canada lists field trials conducted at multiple sites within a province as one field trial, but it is not clear if all the data for all the other countries are reported similarly. See id.

222 MINN. J.L. SCI. & TECH. [Vol. 6:1
TABLE 2: FIELD TRIALS OF BIOENGINEERED CROPS BY REGIONS OF THE WORLD44
Number of Approved Field Trials
Events/crops Number of Share of
Global Private in-country
Countries Events45 Crops Countries Trials total total
(percentage) Developed Countries 19 160 14 20 9,701 84.2 na
United States 1 49 14 1 6,337 55 83.4
Canada 1 49 4 1 1,233 10.7 63.9
All others 17 62 5 18 2,131 18.5 na
Developing Countries 8 23 4 19 1,822 15.8 na
Argentina 1 7 3 1 393 3.4 90.1
China 1 5 4 1 45 0.4 na
All others 6 11 3 17 1,384 12 na
Total 27 183 14 39 11,523 100 na Eighty-four percent of the world’s trials were conducted in
rich countries.46 Two-thirds of that total was in the United States and Canada alone.47 This points to a biotechnology research gap between rich and poor countries that is even more pronounced than the gap in overall agricultural research and development spending in which sixty-four percent of global agricultural research and development was conducted in rich
44. Id. at 18. The notation “na” designates that the information is not available. The data is through December of 2000 where available. For the United States and Canada, and perhaps other countries, a single “trial” may consist of tests at different sites. 45. Data through to December 2000 where available. 46. See id. 47. See PARDEY & BEINTEMA, supra note 5, at 10 tbl.2.

2004 USING CROP BIOTECHNOLGIES WORLDWIDE 223
counties.48 Two fundamental factors may account for much of the marked spatial asymmetry in agricultural biotechnology research: who conducts the research and the nature of the science itself. First, as indicated in Table 2, the preponderance of these biotechnology trials are conducted by private firms and most of the world’s private agricultural research and development takes place in rich counties. Second, this type of cutting-edge research requires access to highly skilled scientists; well-functioning scientific infrastructure that provides ready access to reagents and a myriad of laboratory equipment and supplies, and technical information; and the appropriately trained support staff to help carry out the research. Even though most of the trials are conducted by private firms, the sophistication of the research involved and its pace of change mean that “applied” aspects of the biosciences are likely to receive significant spillovers from on-going basic research and from accumulated stocks of scientific knowledge arising from past research. Both of these elements are much more readily supplied in rich rather than poor countries. Indeed, it is the localized spillovers from university research often involving tacit knowledge embodied in the scientific and technically trained people of university communities that influence the location of industrialized research and development.49
III. AN ECONOMIC PRIMER ON INTELLECTUAL PROPERTY RIGHTS
Research and development, like almost all other aspects of life, is an economic activity. As a consequence, who pays for or performs the research, where it is performed, and who gains and loses are all influenced by economic incentives. The degree to which innovators can appropriate the fruits of their endeavors lies at the heart of the incentives to invest, giving rise to pervasive policies worldwide to assign property rights to innovations in an effort to better align private incentives with
48. See id. 49. See JAMES D. ADAMS, COMPARATIVE LOCALIZATION OF ACADEMIC AND INDUSTRIAL SPILLOVERS 2 (Nat’l Bureau of Econ. Research Working Paper No. 8292, May 2001), available at http://www.nber.org/papers/w8292; see also Gregory D. Graff, et al., Agricultural Biotechnology's Complementary Intellectual Assets. 85 REV. OF ECON. AND STAT. 349 (2003).

224 MINN. J.L. SCI. & TECH. [Vol. 6:1
social interests. The conventional rationale for protecting intellectual
property by patents or other means is to provide some proprietary or “monopoly” rights to an invention—albeit circumscribed and exclusionary in nature—in exchange for public disclosure of the details of the invention.50 The information that is disclosed may be useful for further innovation by others. However, the monopoly right also encourages invention directly, and the social value of the right tends to include surplus above the private value. Thus, the private and social benefits of patents include wide diffusion of the creation of aspects of new or advanced technologies. The costs are transitory, that is for the life of a patent, and entail higher-than-otherwise prices or constrained choices of innovations subject to some monopolistic behavior. However, this conventional, static, one-off view of invention does not fully reflect the dynamic nature of a large part of research and development.
Much technological change comes in the form of cumulative innovation processes, whereby the fruits of innovation frequently materialize as the embodiment of a sequence of prior innovations. While strong patent protection may stimulate the earlier-than-otherwise development of a research tool, it can also delay or deter follow-on innovation due to the transaction costs of negotiating a license or merger and the ability to prevent competitors from introducing similar technology.51 Thus the dynamic cost of a patent within a cumulative innovation scheme—which includes the accumulated costs of delayed follow-on inventions—is an important policy consideration that is often neglected when counting the conventional or static social cost of a patent.52
A special case of cumulative innovation involves the development of a research tool, that is a product or process
50. WILLIAM D. NORDHAUS, INVENTION, GROWTH AND WELFARE: A THEORETICAL TREATMENT OF TECHNOLOGICAL CHANGE 3-4 (M.I.T. Press, 1969). 51. See Robert P. Merges & Richard R. Nelson, On the Complex Economics of Patent Scope, 90 COLUM. L. REV. 839, 874-75 (1990); Michael A. Heller & Rebecca S. Eisenberg, Can Patents Deter Innovation? The Anticommons in Biomedical Research, 280 SCIENCE 698 (1998). 52. See KOO & WRIGHT, supra note 33, at 3-5.
2004 USING CROP BIOTECHNOLGIES WORLDWIDE 225
whose only value is as an input to follow-on innovations. In agricultural biotechnology, a research tool can be a patent on a DNA sequence modified to enhance the expression of a trait such as insect-resistance, while the follow-on innovation may be a new transgenic variety of cotton. Since the patentee of a research tool can capture revenue only through direct production of the follow-on innovations, efficient compensation of the patentee, through licensing, joint ventures, or other means, is critical in providing the incentive to innovate research tools. In addition, these efficient mechanisms also reduce the transaction costs incurred by those contracting for use of the rights, thereby encouraging the utilization of research tools by follow-on innovators.
One way of reducing dynamic costs and encouraging technology transactions is to clarify property rights. The Bayh-Dole Act of 1980 and subsequent legislation, which allowed U.S. universities, other non-profit institutions, and government labs to patent and exclusively license federally funded inventions, was intended to achieve this purpose.53 Firms are often unwilling to invest significantly in developing and disseminating innovations lacking clearly defined property rights. This point was clearly captured by the 1945 Report of the U.S. House of Representatives, which stated that “what is available for exploitation by everyone is undertaken by no one.”54 The main objective of the Bayh-Dole Act is to foster markets for the transfer of technology, and there is some evidence the Act has achieved these aims.55 However, the Bayh-Dole Act is most effective when inventions require heavy expenditure in downstream technology and product development, which is not the case for all technologies. In addition, some have argued that the Act may actually constrain and delay the flow of fundamental scientific knowledge as “prior art” concerns impede open scientific discourse through seminars and the professional literature.56 This could shift the
53. See 35 U.S.C. §§ 200-212 (2000). 54. Adam B. Jaffe, The U.S. Patent System in Transition: Policy Innovation and the Innovation Process, 29 RES. POL’Y. 531, 534 (2000), quoting H.R. DOC. NO. 22, at 5 (1945). 55. See Richard Jensen & Marie Thursby, Proofs and Prototypes for Sale: The Licensing of University Inventions, 91 AM. ECON. REV. 240, 241 (2001). 56. See, e.g., Roberto Mazzoleni & Richard R. Nelson, The Benefits and

226 MINN. J.L. SCI. & TECH. [Vol. 6:1
emphasis of university research from fundamental basic research toward more applied research that is potentially more rewarding financially for the university or its research faculty, but not necessarily for society as a whole over the long run.57
The impact of a patent system also depends on the type of technology itself. Agriculture seeds have special attributes, most significantly their almost costless reproducible nature, that merit special attention. Under plant variety protection schemes, farmers may legally save, reuse, and sometimes sell seeds in following seasons so that seed firms are faced with only the residual demand for their seeds in subsequent seasons. This problem, together with the difficulty of monitoring and enforcing property rights to seed, makes its legal protection less valuable than other forms of protection on other products. Private seed markets have responded to the appropriability problem by developing hybrid varieties or pursuing genetic use restriction technologies (GURTs). These methods prevent seeds from effectively reproducing and serve as a form of “biological” rather than legal property protection.58
What evidence is there that intellectual property rights stimulate inventive activity? Although there are no readily measurable markets for intellectual property rights in which the benefits and costs of patents, for example, can be easily evaluated, a few studies have sought to measure the overall inventive effects of patents. Findings from survey studies suggest that, with the exception or pharmaceuticals, innovators rely primarily on other means such as trade secrets or first-mover advantages rather than patent protection to appropriate the returns from their innovative investment.59 Some have estimated the private value of patent protection using patent data and concluded that the distribution of patent-rights values
Costs of Strong Patent Protection: A Contribution to the Current Debate, 27 RES. POL’Y 273 (1998). 57. Mazzoleni & Nelson, supra note 56, at 275-86. 58. Convention on Biological Diversity, Consequences of the Use of the New Technology for the Control of Plant Gene Expression for the Conservation and Sustainable Use of Biological Diversity (June 1999), available at http://www.biodiv.org/doc/meetings/sbstta/sbstta-04/official/sbstta-04-09-rev1-en.doc. 59. See Richard C. Levin et al., Appropriating the Returns from Industrial Research and Development, 1987 BROOKINGS PAPERS ON ECON. ACTIVITY 783, 796 (1987).

2004 USING CROP BIOTECHNOLGIES WORLDWIDE 227
is sharply skewed with most of the value concentrated in a small number of patents.60 Using European patent renewal data, Mark Schankerman estimated that the private value of patent protection was about fifteen to twenty-five percent of the related research and development expenditure, suggesting a small impact of patent rights on innovative behavior.61
Most empirical studies, all using U.S. data, have generally found weak or indeterminate empirical evidence to suggest that plant breeders’ rights are effective in stimulating investments in varietal-improvement research.62 Some point out that plant variety protection does not provide patent-like ex ante investment incentives, nor generate substantial ex post licensing and enforcement activity.63 Julian Alston and Raymond Venner found that varietal rights for wheat in the United States had little measurable impact on the rate of technical change in that crop and may simply have served as a marketing tool.64
Given evidence of the general lack of appropriability from patent or plant variety protection, why do innovators continue to apply for intellectual property protection? Even accepting the claim that practicing patents may not be the primary means by which large firms recoup their research and development investments, it can still be an important incentive
60. See Jean O. Lanjouw et al., How to Count Patents and Value Intellectual Property: The Uses of Patent Renewal and Application Data, 46 J. INDUS. ECON. 405, 410 (1998). 61. See Mark Schankerman, How Valuable is Patent Protection? Estimates by Technology Field, 29 RAND J. ECON. 77, 79 (1998) (noting that although patent protection provides a substantial incentive to research and development, it does not appear to be the major source of private returns on inventive activity). 62. See, e.g., Richard K. Perrin et. al., Some Effects of the US Plant Variety Act of 1970. (N.C. State Univ., Econ. Research Rep’t 46, 1983); Mary K. Knudson and Carl E. Pray, Plant Variety Protection, Private Funding, and Public Sector Research Priorities, 73 AM. J. AGRIC. ECON. 882 (1991); Julian M. Alston & Raymond J. Venner, The Effects of the US Plant Variety Protection Act on Wheat Genetic Improvement, 31 RES. POL’Y 527 (2002). 63. Mark D. Janis & Jay P. Kesan, U.S. Plant Variety Protection: Sound and Fury…?, 39 HOUS. L. REV. 727, 776-77 (2002). 64. JULIAN M. ALSTON & RAYMOND J. VENNER, THE EFFECTS OF THE US PLANT VARIETY PROTECTION ACT ON WHEAT GENETIC IMPROVEMENT 31 (Int’l Food Policy Research Inst., Environment and Production Technology Division Discussion Paper No. 62, May 2000), available at http://www.grain.org/docs/eptdp62.pdf.

228 MINN. J.L. SCI. & TECH. [Vol. 6:1
mechanism for smaller new entrants and the venture capital firms that often fund them. Patent portfolios may be critical to obtaining venture capital or maintaining control of the technology while downstream innovation is pursued or production and sales capabilities are established.65 In addition, both large and small firms use patents to block products of their competitors and as bargaining chips when negotiating cross-licensing agreements, as is the case of the semiconductor industry.66 Strategic patenting behavior that relies on larger patent portfolios is consistent with rising rates of patenting and high patent-to-research and development spending ratios, even absent any perceived increase in the appropriable value of patents.67 For some developing countries with newly introduced plant variety rights such as China, a surge in plant variety protection applications may be explained by an over-optimistic view of the prospective value of varietal rights even though the current size of the seed market and the cost and effectiveness of protection do not seem to economically justify the extent of protection presently being sought.68
IV. CROP BIOTECHNOLOGIES AS PROPERTY Creating new crop biotechnologies is one thing; protecting
the intellectual property embodied in them is a related but separate undertaking, with its own set of economic costs and benefits. Notwithstanding the incentive-to-innovate argument broached in the previous section, one view is that intellectual property rights over plant biotechnologies in rich and poor countries lead to a lock-out phenomenon, that is, the growth in intellectual property is restricting access to proprietary research results in ways that curtail the freedom to operate for research conducted in or on behalf of poor countries to the
65. See Edmund W. Kitch, The Nature and Function of the Patent System, 20 J.L. & ECON. 265, 275-80 (1977); Mazzoleni & Nelson, supra note 56, at 276-80. 66. See Bronwyn H. Hall & Rosemarie Ham Ziedonis, The Patent Paradox Revisited: An Empirical Study of Patenting in the U.S. Semiconductor Industry, 1979-1995, 32 RAND J. ECON. 101, 108-11 (2001). 67. See id. 68. BONWOO KOO ET AL., THE ECONOMICS OF GENERATING AND MAINTAINING PLANT VARIETY RIGHTS IN CHINA 26 (Int’l Food Policy Research. Inst., Environment and Production Technology Division Discussion Paper No. 100, February 2003), available at http://www.ifpri.org/.

2004 USING CROP BIOTECHNOLGIES WORLDWIDE 229
detriment of developing-country food-security prospects. This view is commonly held, even in the absence of evidence on the international pattern of intellectual property protection, a clear understanding of the effect this has on the rate and direction of inventive activity, the use to which these inventions are put, and the trade in agricultural products arising from this research. What follows is a first pass at describing the intellectual property rights evidence for plant biotechnologies internationally.
A. PLANT VARIETY PROTECTION
1. Global trends Plant breeders’ rights have been available in many rich
countries for at least the past three decades. Germany, for example, has issued plant breeders’ rights since at least the 1950s and likewise for a few other European countries. The United States began issuing plant variety protection certificates (PVPCs) in 1971 for sexually reproduced plants.69 Asexually reproduced plants such as grape vines, fruit trees, strawberries, and ornamentals that are propagated through cuttings and graftings have had recourse to intellectual property protection in the United States since 1930 when the Plant Patent Act was passed.70 Many middle-income countries passed plant variety protection legislation during the 1990s in compliance with their sui generis obligations to offer the intellectual property rights over plant varieties enshrined in Article 27.3(b) of the 1995 Trade-Related Aspects of Intellectual Property (TRIPS) agreement in the World Trade Organization (WTO).71
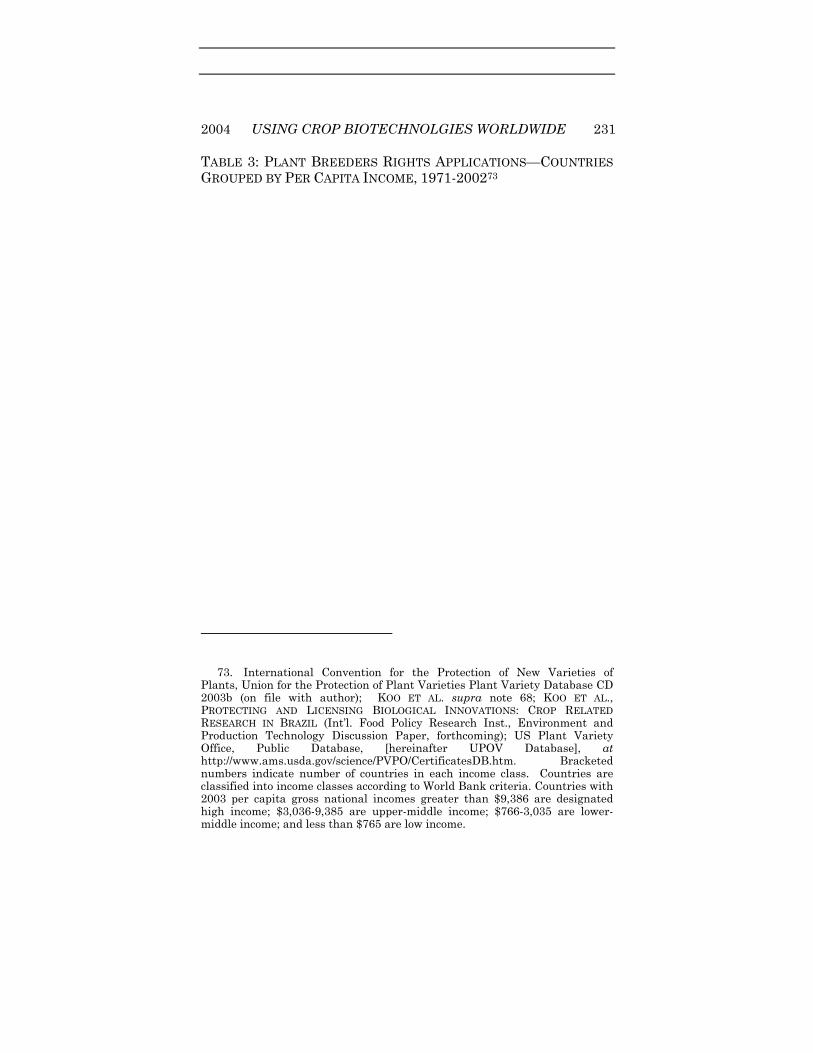
Table 3 shows the pattern of applications for plant breeders’ rights since 1971 for thirty-seven countries grouped into four classes based on per capita income.72 As indicated,
69. See Janis & Kesan, supra note 63 at 739-40. 70. 35 U.S.C. §§ 161-164 (2000). 71. See Biswajit Dhar, SUI GENERIS SYSTEMS FOR PLANT VARIETY PROTECTION OPTIONS UNDER TRIPS, available at http://www.geneva.quno.info/pdf/sgco11.pdf. 72. See International Convention for the Protection of New Varieties of Plants, Dec. 2 1961, as amended on Mar. 19, 1991 (listing the states party to the convention as of Oct. 24, 2002), available at

230 MINN. J.L. SCI. & TECH. [Vol. 6:1
nearly 138,000 plant breeders’ rights applications have been lodged worldwide since 1971. Some applications were lodged before 1970, but the number is small (less than three percent) when compared with the totals reported in Table 3. During the 1970s and 1980s, rich countries accounted for ninety-two to ninety-six percent of the total applications. Their share throughout the 1990s declined to average approximately seventy-five percent in 2001-02. Plant breeders’ rights applications filed in upper middle-income countries such as Argentina, Chile, Czech Republic, Hungary, Poland, Slovakia, South Africa, and Uruguay grew steadily since the early 1970s, while reported plant breeders’ rights applications in lower middle-income countries that now includes Brazil, Bulgaria, China, Colombia, Romania, the Russian Republic, and Ukraine began increasing a decade later.
http://www.upov.int/en/publications/gazette/pdf/pub422_24-10-02.pdf (last visited Nov. 15, 2004). At its inception in 1961, UPOV included five member countries: Belgium, France, Germany, Italy, and Netherlands – all high-income countries. By the end of 1992, there were twenty member countries; by September 2003, there were fifty-three member countries, of which twenty-one were high-income, twenty-seven were middle-income, and five were low-income countries. Id. Notably, under the TRIPs agreement, the “least developed” countries as defined by WTO are exempt from complying with Article 27.3(b) until 2005. See Patrick Mulvany, TRIPs, Biodiversity and Commonwealth Countries: Capacity Building Priorities for the 1999 review of TRIPs Article 27.3 (b), at http://www.ukabc.org/TRIPs/trips99.pdf (last visited Nov. 11 2004).
2004 USING CROP BIOTECHNOLGIES WORLDWIDE 231
TABLE 3: PLANT BREEDERS RIGHTS APPLICATIONS—COUNTRIES GROUPED BY PER CAPITA INCOME, 1971-200273
73. International Convention for the Protection of New Varieties of Plants, Union for the Protection of Plant Varieties Plant Variety Database CD 2003b (on file with author); KOO ET AL. supra note 68; KOO ET AL., PROTECTING AND LICENSING BIOLOGICAL INNOVATIONS: CROP RELATED RESEARCH IN BRAZIL (Int’l. Food Policy Research Inst., Environment and Production Technology Discussion Paper, forthcoming); US Plant Variety Office, Public Database, [hereinafter UPOV Database], at http://www.ams.usda.gov/science/PVPO/CertificatesDB.htm. Bracketed numbers indicate number of countries in each income class. Countries are classified into income classes according to World Bank criteria. Countries with 2003 per capita gross national incomes greater than $9,386 are designated high income; $3,036-9,385 are upper-middle income; $766-3,035 are lower-middle income; and less than $765 are low income.

232 MINN. J.L. SCI. & TECH. [Vol. 6:1
The shifting geographical pattern of plant varietal protection arises for several reasons. The growth in the total number of applications is largely due to an increase in the rate of applications per country per year. Most high-income countries had plant breeders’ rights legislation in place for most of the period reported here, while in middle-income countries there was a rapid growth in the number of countries offering plant breeders’ rights, for example, two countries in 1971, five in 1985, eight in 1990 and fifteen in 2002. Increasing rates of protection may reflect legal, economic, and institutional factors. One would expect applications to increase over time as awareness of the existence and effectiveness of plant breeders’ rights in a particular country increases and as the economic costs of applying for and evaluating applications decline with improved bureaucratic procedures.74
Notably, the number of plant breeders’ rights sought in low-income countries is negligible - only twenty-three applications from Kyrgyzstan.75 The principal proximate cause of this situation is the lack of rights on offer in poor-countries. More fundamentally, it reflects a range of economic influences regarding the costs and benefits of securing breeders’ rights in a particular jurisdiction.
To capture this cost-benefit calculus, Koo et al. use an option value model to characterize the crop breeders’ decision to apply for and retain varietal protection.76 While the costs of gaining and securing plant variety protection are known with reasonable surety, the sequence of future returns from a varietal right is highly uncertain for many reasons.77 There are uncertainties about the size of the appropriable seed market for a given crop, the probability of commercial success of the protected variety, and the extent of enforcement of assigned property rights.78 Where required, breeders make periodic,
74. Some countries have expanded the scope of crops eligible for protection overtime. In China, for instance, a total of ten species were eligible for protection in September 1999, growing to thirty species by March 2002 (including five major cereals, two oil crops, two roots and tubers, ten vegetables and fruits and eleven flowers and grasses but excluding cotton). KOO ET AL., supra note 68, at 19 n.32.
75 UPOV Database, supra note 73. 76 KOO ET AL., supra note 68, at 3-6.
77 See generally KOO ET AL., supra note 68. 78 See generally id.

2004 USING CROP BIOTECHNOLGIES WORLDWIDE 233
often annual, renewal decisions preserving the right to pay renewal fees and exercise their exclusionary rights in future periods.79 Applying for, and subsequently renewing, plant variety protection rights thereby allows breeders to reserve the rights to potential future revenues, even if revenues in the short term are negligible. Thus, the expected value of holding plant variety rights consists of the current returns captured from the coming year and the option to renew the right in the subsequent year.
2. Foreign Plant Varietal Rights Applications The UPOV data on varietal rights applications, shown in
Table 4, allow us to distinguish between domestic and foreign applicants. Overall, approximately thirty-four percent (17,529 of a total of 51,258) of the applications filed in fifty UPOV member countries during 1998–2002 were lodged by foreigners. This substantial fraction of foreign applications indicates extensive potential spillovers of varietal improvement research done in one locale on seed market and production developments elsewhere in the world. The intensity of foreign participation in domestic varietal rights markets differs markedly. Looking regionally, the fraction of the applications lodged by foreigners was approximately thirty-one percent in high-income countries, sixty-five percent in upper middle-income countries, twenty-five percent in lower-middle income countries, and thirty-nine percent in low-income countries. The country-by-country participation of foreigners is even more variable. For example, the share of foreign applications is eighty-five percent in Switzerland and Canada, forty-two percent in the United States, thirty-seven percent in the United Kingdom, twenty-four percent in Japan, sixteen percent in the Netherlands and Germany, and eleven percent in France.80
79 See generally id. 80. Int’l Union for the Protection of New Varieties of Plants, Plant Variety Protection Statistics for the Period 1998-2002 (2003), at http://www.upov.int/en/documents/c/37/c_37_7.pdf (last visited Nov. 11, 2004).

234 MINN. J.L. SCI. & TECH. [Vol. 6:1
TABLE 4: SHARE OF PLANT BREEDER RIGHTS APPLICATIONS LODGED BY FOREIGNERS, 1998-200281
Economies Total Residents Non-residents
(number of applications)
High income economies (23) 39,079 26,893 12,186
Upper middle income economies (11) 5,583 1,945 3,638
Lower middle income economies (12) 6,109 4,592 1,517
Low income economies (4) 487 299 188
Total (50) 51,258 33,729 17,529
3. European and United States Trends. Worldwide, seed sales are estimated to be $30 billion
annually.82 While the economic value of seed markets within the European Union, which is about $5.2 billion in total, is a little less than U.S. seed sales, that is, about $5.2 billion compared to $5.7 billion, respectively, Table 5 indicates that since 1971, there are three times more PBR applications in Europe than related applications in the United States. Much of the difference may stem from multiple applications for the same variety among national jurisdictions in Europe, whereas only one application is required per variety in the United States.83 Part of the difference may arise from the different forms of varietal protection offered in Europe (plant breeders’ rights) versus the United States (plant patents, plant variety protection certificates, and utility patents). About five percent of all the plant breeders and related patent applications in the
81. Id. See tbl.3 for country income classification criteria. Bracketed figures indicate number of countries included in the data. 82. Int’l Seed Federation, Estimated Size of the Internal Market for seed and Other Planting Material of Selected Countries, at http://www.worldseed.org/statistics.html (last visited Oct. 30, 2004). 83. The information needed to create these data is publicly available, but requires compiling the plant breeder’s rights data by scrutinizing each individual varietal protection certificate for the first forty years the rights were on offer in the United States

2004 USING CROP BIOTECHNOLGIES WORLDWIDE 235
United States are for utility patents, of which fifty-five percent pertain to corn and forty percent to soybeans.84
84. See UPOV Database, supra note 73. The utility patent data represent a preliminary tabulation by the authors based on patent-by-patent scrutiny of 4,080 patents from 1972-2003 assigned USPTO patent code 800 to identify patents with claims that encompass plant varieties.

236 MINN. J.L. SCI. & TECH. [Vol. 6:1
TABLE 5: PLANT-RELATED INTELLECTUAL PROPERTY APPLICATIONS IN THE EUROPEAN UNION AND THE UNITED STATES85
85. Compiled from commissioned data obtained from the United States Patent and Trademark Office, Office of Electronic Information Products for US plant and utility patents; the US Plant Variety Protection Office’s public access database for the US plant variety protection; and UPOV Database and Community Plant Variety Office (CPVO) for data of European Union countries and CPVO series respectively.
a. European Union aggregate includes applications for plant breeders’ rights in thirteen European countries. U.S. aggregate includes plant and utility patents granted and plant variety protection certificate applications.
b. CPVO members currently include Austria, Belgium, Denmark, Finland, France, Germany, Greece, Ireland, Italy, Luxembourg, Netherlands, Portugal, Spain, Sweden, and the United Kingdom. Individuals or companies from member states of UPOV, but not a member of the European Union, can also apply, provided that an agent domiciled in the Community has been nominated. Since it was first implemented in 1995, around thirty-five percent of these applications are lodged from the Netherlands, sixteen percent from Germany, fourteen percent from France, nineteen percent from elsewhere in the European Union and sixteen percent from outside the European Union.
c. Preliminary tabulation by authors based on patent-by-patent scrutiny of the U.S. patent database to identify patents with claims that encompass plant varieties.

2004 USING CROP BIOTECHNOLGIES WORLDWIDE 237
Four countries, the Netherlands, France, Germany and the United Kingdom, account for most of the European applications. Adding applications lodged with the Community Plant Variety Office (CPVO) to those filed nationally, the Netherlands accounted for thirty-five percent of the European total, France twenty-two percent, Germany sixteen percent and the United Kingdom eight percent.86 The number of plant breeders’ rights applications filed with the CPVO has increased over time, offsetting declines in the number of applications lodged with national protection offices. In 1996, there were 1,385 applications lodged with the CPVO and a total of 2,766 applications made to individual national systems. By 2000, almost equal numbers of plant breeders’ rights claims were filed with the CPVO and the respective national offices (about 2,000 applications each), and in 2001 CPVO applications (2,158) exceeded those filed with national offices (1,864).87
Regarding the types of crops for which varietal protection is sought, ornamental crops account for more than half the total applications in both the United States and Europe.88 In the United States, cereal crops such as wheat and corn; oil and fibers; and fruit crops have each made up more than ten percent of the total number of applications since 1970.89 Ornamentals and fruits are mostly protected by plant patents, while cereal, oil and fiber crops, and vegetables are usually
86. Prior to April 27, 1995 when the CPVO was established, a breeder seeking protection for a variety throughout the European Union was required to submit an application to each of the member states. Now with a single application to the CPVO, a breeder can be granted varietal protection rights throughout the European Union. This European-wide system—CPVO members currently include Austria, Belgium, Denmark, Finland, France, Germany, Greece, Ireland, Italy, Luxembourg, Netherlands, Portugal, Spain, Sweden, and the exploit both a community plant variety right (CPVR) and a national plant breeders’ right in relation to that variety. Individuals or companies from member states of UPOV, but not a member of the European Union, can also apply, provided that an agent domiciled in the Community has been nominated. The duration of CPVR protection is twenty-five years for most crops, and thirty years for potato, vine, and tree varieties. See COMMUNITY PLANT VARIETY OFFICE, 2002 ANNUAL REPORT 11-12 (2003). 87. UPOV Database, supra note 73. 88. See Bonwoo Koo, et al., Plants & Intellectual Property: An International Appraisal, 305 SCIENCE 1295-97 (2004). 89. Id.

238 MINN. J.L. SCI. & TECH. [Vol. 6:1
protected by plant variety rights.90 In Europe, cereals account for more than a quarter of the total PBR applications, followed by vegetable (ten percent), oil and fiber crop (five percent) and fruit (five percent).91
B. BIOTECHNOLOGY PATENTING PATTERNS An initial foray into examining the international
dimensions of patent activity in biotechnology and specific sectors, such as agriculture and health, is presented in Figure 1. Numbers of patent applications submitted to the World Intellectual Property Organization (WIPO) under the Patent Cooperation Treaty (PCT) (Panel a) and patents granted by the European Patent Office (EPO) (Panel b) are plotted against the year published. For this analysis, patent documents were selected on the basis of the International Patent Classification (IPC) scheme used by the patent offices. Data were obtained for documents satisfying criteria for “biotechnology” and further sub-divided into “agricultural biotechnology” and “health biotechnology.” For this work, “biotechnology” refers to “[t]he application of [s]cience and [t]echnology to living organisms as well as parts, products and models thereof, to alter living or non-living materials for the production of knowledge, goods and services”, a definition used by the Organisation for Economic Co-operation and Development.92 While initially agricultural biotechnology patent documents exceeded health related documents both at EPO and WIPO, the situation reversed in 1999. Furthermore, the spectacular rise in patent filings in the late 1980s and through the 1990s appears to be leveling off.
90. Id. 91. Id. 92. Organization for Economic Co-operation and Development, Scientific, Industrial and Health Applications of Biotechnology, Statistical Definition of Biotechnology, at http://www.oecd.org/document/42/0,2340,en_2649_34537_1933994_1_1_1_1,00.html (last visited Nov. 11, 2004).

2004 USING CROP BIOTECHNOLGIES WORLDWIDE 239
FIGURE 1: BIOTECHNOLOGY PATENTS93
Panel (a): PCT Applications
Panel (b): European Patent Grants
93. See generally Biological Innovation for Open Society (BIOS) [hereinafter BIOS Website], at http://www.bios.net/ (last visited Nov. 15, 2004) (on file with authors). The data supporting this table was originally compiled from information on the Center for the Application of Molecular Biology to International Agriculture (CAMBIA) Intellectual Property Resource Database, at http://www.cambiaip.org/Home/welcome.htm. The information on the CAMBIA Intellectual Property Resource Database was moved to the BIOS site. A copy of the original material remains on file with the authors.

240 MINN. J.L. SCI. & TECH. [Vol. 6:1
The data presented here contrast with recently reported analyses of Graff et al., who note drops in patent grants in plant biotechnology at the EPO after peaking in 1994-1995.94 The differences may be due to disparities in the definition of plant or agricultural biotechnology. The Graff et al. definition comprises a description of the scope of technologies such as genetic engineering of plants, plant genes, and plant breeding methods covering a small subset of IPC codes and specific technology keywords.95 In contrast, the definition used in this paper encompasses broader aspects of plant biotechnology, including genetic modification of plants, biocides, organismal or enzymic-based methods for preservation of foods, microbiological treatment of water and soil, compositions containing micro-organisms or enzymes, and processes using micro-organisms or enzymes. The definitional differences are highlighted by the order of magnitude difference in the number of documents that satisfy the criteria. For example, in 2000, the authors of this article obtained 8,859 PCT applications and 5,097 patents issued by the European Patent Office (EU patents) for inventions concerning agricultural biotechnology compared with around 625 PCT and 50 EU patent applications and 112 patents for the narrower area of “plant biotechnology” reported by Graff et al.96
The authors of this article have found that the percentage of PCT applications in agricultural biotechnology has been on the rise. In 1985, agricultural biotechnology applications were 4.0 percent of the total submitted.97 By 1990, they were 7.5 percent of the total, and in 2000 had risen to 9.7 percent of the total.98 In 2000, ag-biotech patents granted in EPO were 18.5 percent of the total granted.99 Clearly further examination of patent activity with an eye to the commercial and public good consequences encompassing the changing geographical and institutional origins of biotechnology innovations on a global
94. Gregory D. Graff et al., The Public-Private Structure of Intellectual Property Ownership in Agricultural Biotechnology, 21 NATURE BIOTECHNOLOGY 989, 990 (2003). 95. Id. 96. Id. See BIOS Website, supra note 93. 97. See id. 98. See id. 99. See id.

2004 USING CROP BIOTECHNOLGIES WORLDWIDE 241
scale, and their spillovers or transfer to other countries, will be sensitive to the patents included in the source set of documents.
V. CROP BIOTECHNOLOGY USE The evidence on the worldwide dissemination of
contemporary, bioengineered crop technologies is usefully viewed in the context of the diffusion of the classically bred crop varieties that preceded them.
A. CLASSICALLY BRED CROP VARIETIES
1. Gains in Productivity “Worldwide, [around ninety-five] percent of major cereal
production gains during the past four decades came from increased yields, which have more than doubled since 1961.”100 Increasing yields result from increased use of inputs such as agricultural chemicals including fertilizers, herbicides, and pesticides, irrigation water, and improved crop varieties.101 In the developed world at least, the growth in crop yields began picking up pace several hundred years ago. Looking in detail at developments in U.S. wheat varieties since 1800, Alan L. Olmstead and Paul W. Rhode, for example, estimated that roughly one-half of the U.S. growth in labor productivity between 1839 and 1909 was attributable to biological innovations.102 Pardey et al. showed that wheat varietal change in the United States accelerated during the twentieth century: an average of 5.1 commercially successful wheat varieties were introduced each year from 1901 to 1970; the rate jumped to 21.6 varieties per year during the period 1971 to 1990.103 Moreover, the creation of these new varieties continued to rely heavily on foreign germplasm.104 By the early
100. C. FORD RUNGE ET AL., ENDING HUNGER IN OUR LIFETIME: FOOD SECURITY AND GLOBALIZATION 71 (2003). 101. See id. at 69. 102. Alan L. Olmstead & Paul W. Rhode, The Red Queen and the Hard Reds: Productivity Growth in American Wheat, 1800-1940, 62 J. ECON. HIST. 929 (2002). 103. See PHILIP G. PARDEY ET AL., HIDDEN HARVEST: U.S. BENEFITS FROM INTERNATIONAL RESEARCH AID (Int’l. Food Policy Research Inst. Food Policy Report, September 1996), available at http://www.ifpri.org/pubs/fps/fps23.htm. 104. Id.
242 MINN. J.L. SCI. & TECH. [Vol. 6:1
1990s, one-fifth of the total U.S. wheat acreage and virtually all the spring-wheat cropped in California were sown to varieties with ancestry derived from the International Maize and Wheat Improvement Center (CIMMYT) based in El Batán, Mexico.105 Pardey et al. estimated that the improved genetic makeup of wheat varieties between 1970 and 1993 was worth almost $43 billion (in 1993 prices) to the United States, or the equivalent of 10.6 percent of the present value of wheat production during this period, and that up to $13.7 billion of that total benefit was attributable to varietal spill-ins from CIMMYT alone.106
There are long lags between committing research and development dollars and realizing the returns on that investment. Even in the United States it took decades to build up the genetic resource base and train and deploy the scientists skilled in classical genetic manipulation techniques before reaping the really big dividends during the latter half of the twentieth century.107 In the developing world, scientific crop breeding lagged well behind. Beginning in the 1950s and 1960s, improved varieties became increasingly available to farmers and yields rose: wheat yields went from one ton per hectare or less in China and India in the mid-1960s to over two and a half tons in India, and almost four tons in China, by the late 1990s.108 Table 6 shows the rapid spread of modern rice, wheat, and maize varieties throughout the developing world. Asia embraced these new varieties most rapidly, while adoption lagged in Sub-Saharan Africa. A striking feature of these data, however, is the limited uptake of scientifically bred crop varieties throughout most of the developing world as late as 1970. When virtually all the cropped acreage in rich countries was sown to scientifically bred rice and wheat varieties, less than one-third of the developing world’s rice acreage and just one-fifth of its wheat acreage were planted to modern forms of these crops.
105. Id. CIMMYT is the Spanish acronym for the International Maize and Wheat Improvement Center. 106. Id. 107. See Pardey & Wright, supra note 1. 108. See id.

2004 USING CROP BIOTECHNOLGIES WORLDWIDE 243
TABLE 6: SHARE OF AREA PLANTED TO MODERN VARIETIES OF RICE, WHEAT, AND MAIZE109
Rice Wheat Maize Regions 1970 1983 1991 1970 1977 1990 1997 1992 1996 (percentage of area planted) Sub-Saharan Africa 4 5 n.a. 5 22 52 66 37 46 West Asia/North Africa 0 11 n.a. 5 18 42 66 26 n.a. Asia (excluding China) 12 48 67 42 69 88 93 42 64 China 77 95 100 n.a. n.a. 70 79 97 99 Latin America 4 28 58 11 24 82 90 49 45 All Developing Countries 30 59 74 20 41 70 81 58 62
For these three food staples, much of the crop improvement
research involved publicly funded and conducted research. The big innovation of the 1960s and 1970s for rice and wheat was the development and release of increasing numbers of semi-dwarf varieties by national and international research agencies
109. See RUNGE ET AL., supra note 100; DEREK BYERLEE & PIEDAD MOYA, CIMMYT, IMPACTS OF INTERNATIONAL WHEAT BREEDING RESEARCH IN THE DEVELOPING WORLD 1966-90 (1993); Derek Byerlee, Modern Varieties, Productivity, and Sustainability: Recent Experience and Emerging Challenges, 24 WORLD DEV. 697 (1996); Paul W. Heisey et al., Assessing the Benefits of International Wheat Breeding Research: An Overview of the Global Wheat Impacts Study, in CIMMYT 1998-1999 WORLD WHEAT FACTS AND TRENDS: GLOBAL WHEAT RESEARCH IN A CHANGING WORLD: CHALLENGES AND ACHIEVEMENTS (P.L. Pingali ed. 1999). For maize, see Michael L. Morris, Overview of the World Maize Economy, in MAIZE SEED INDUSTRIES IN DEVELOPING COUNTRIES (Michael L. Morris ed., 1998); MICHAEL L. MORRIS, IMPACTS OF INTERNATIONAL MAIZE BREEDING RESEARCH IN DEVELOPING COUNTRIES, 1966-1998 (2002). The designation “na” indicates that data is not available. Modern varieties of rice and wheat refer mainly to semi-dwarf varieties, for maize it includes hybrid and improved open pollinated varieties.

244 MINN. J.L. SCI. & TECH. [Vol. 6:1
bred using plant material and crop transformation techniques that were entirely public domain.110 Almost all the resulting improved varieties were made available without personal or corporate intellectual property rights. The public sector performed most of the research, and in few jurisdictions were intellectual property rights over the varieties themselves or the techniques used to transform them even a legal option at that time.
For corn the story is different. While publicly bred varieties were, and remain, a feature of this crop, the private sector presence is much more pronounced.111 Hybrid corn technologies that took off in the United States in the 1930s and later elsewhere offered significant protection for the intellectual property embodied in them.112
This made it possible for breeders to appropriate a larger share of varietal benefits than was possible for the self-replicating forms of varietal transformations featured in rice and wheat.113 For hybrid corn varieties, as long as the in-bred lines were kept secret and laws were in place in the United States and elsewhere to help preserve these trade secrets, the cost of imitation was prohibitively large, enabling inventors to appropriate significant shares of the benefits stemming from their efforts.114
Table 6 indicates that the developing-country uptake of
110. Pardey et al., supra note 103. 111. Zvi Griliches, Hybrid Corn: An Explanation in the Economics of Technological Change, 25 ECONOMITRICA, 501-522 (1957). 112. Id. 113. Hybrid technologies were also pursued for rice and wheat but less extensively so. Mary Knudson and Vernon Ruttan document efforts to develop hybrid wheat in the United States. Mary K Knudson & Vernon W. Ruttan, Research and Development of a Biological Innovation: Commercial Hybrid Wheat, 21 FOOD RES. INST. STUD. 45 (1988). Hybrid rice is grown extensively in China, beginning in the mid-1960s. Since then, the area under hybrid rice has increased steadily to about twenty-three percent in 1981 and sixty-one percent in 2001. SHENGGEN FAN ET AL., NATIONAL AND INTERNATIONAL AGRICULTURAL RESEARCH AND RURAL POVERTY: THE CASE OF RICE RESEARCH IN INDIA AND CHINA 7-8 (Int’l Food Research Inst., Environment and Production Technology Division Discussion Paper No. 109, September 2003). Notably, profit potentials were not a contributing factor to the development of this technology in China where the research was a government undertaking. 114. Pardey & Wright, supra note 1.

2004 USING CROP BIOTECHNOLGIES WORLDWIDE 245
modern maize varieties has also been substantial, but less extensive than the move to improved forms of rice and wheat worldwide. This could partly be due to the greater proprietary and private sector nature of maize varietal changes, but a whole host of other influences could be operative as well. About eighty-six percent of the improved acreage world wide is sown to hybrids, the rest to open pollinated varieties.
2. Varietal Spillovers While the agroecological specificities of much agricultural
research and development, especially many crop biotechnologies, limit the geographical scope of agricultural innovations, there is overwhelming evidence that spatial spillovers of technologies have played a pivotal part in productivity improvements worldwide. In reviewing the economic studies of this phenomenon, Julian Alston concluded that interstate or international research and development spillovers might account for half or more of the total measured productivity growth.115
Spillovers of crop varietal technologies have flowed in all sorts of directions. Looking at the spill-ins to the United States of varietal improvement research done at the international research centers, specifically the CIMMYT in Mexico and the International Rice Research Institute (IRRI) in the Philippines, Pardey et al. estimated that, from 1970 to 1993, the U.S. economy gained $3.4 billion to $13.7 billion from the use of improved wheat varieties developed by CIMMYT depending on the benefit attribution methods employed.116 In the same twenty-three year period, they found that the U.S. economy realized at least thirty million dollars and up to one billion dollars through the use of rice varieties developed by the IRRI.117
In more recent research, Pardey et al. quantified the benefits from crop improvement research in Brazil and attributed them to the Brazilian national agricultural research agency (Embrapa), other public and private agencies operating
115. Julian M. Alston, Spillovers, 46 AUSTRALIAN J. AGRIC. & RESOURCE ECON. 315, 338 (2002). 116. PARDEY ET AL., supra note 103. 117. Id.

246 MINN. J.L. SCI. & TECH. [Vol. 6:1
in Brazil, and spillovers from the Consultative Group on International Agricultural Research (CGIAR) and the United States.118 They found that, from 1994-2000, sixty-four percent of the total benefits from varietal improvement for upland rice in Brazil ($1,683 million in 1999) were from non-Embrapa sources.119 Likewise, from 1985-2003, sixty-seven percent of the total benefits from varietal improvement research for edible beans ($677 million in 1999) came from non-Embrapa sources, mostly within Brazil, whereas from 1981-2003, seventy-seven percent of the total benefits from varietal improvement research for soybeans, ($12,473 million in 1999) were due to non-Embrapa sources, with twenty-two percent of the benefits attributable to spill-ins from the United States.120
B. BIOENGINEERED CROP VARIETIES Where the crop varieties and bioengineered traits
embodied in them perform well and are given approval for commercial use, the rate of uptake has been rapid, although contrary to some claims, not entirely unprecedented, even for biological innovations used in agriculture. For example, Zvi Griliches studied the uptake of hybrid corn technologies in the United States and showed that there was a zero to fifty percent increase in Iowa’s corn acreage sown to hybrid varieties in the six years from 1932 to 1938 and reaching ninety percent by 1940.121 Clive James estimates that 58.7 million hectares were planted to bioengineered crops worldwide in 2002, an increase from 52.6 million hectares in the previous year and well up on the 2.8 million hectares planted in 1996.122
118. PHILIP G. PARDEY ET AL., ASSESSING AND ATTRIBUTING THE BENEFITS FROM VARIETAL IMPROVEMENT RESEARCH IN BRAZIL (Int’l Food Policy Research Inst. Research Report No. 136, 2004), available at http://www.ifpri.org/. 119. Id. 120. Id. 121. Zvi Griliches, supra note 111, at 502 fig.1. 122. See Clive James, Global Review of Commercialized Transgenic Crops: 2002, (Int’l Service for the Acquisition of Agri- Biotech Applications (ISAAA), ISAAA Briefs 2002), available at http://www.isaaa.org. In 1994 the Flavr-SavrTM tomato, genetically engineered to delay softening so the tomato could ripen on the vine and retain its “fresh picked” flavor, became the first bioengineered crop to be grown commercially. See also, Michele C. Marra et al., The Payoffs to Transgenic Field Crops: An Assessment of the Evidence, 5 AGBIOFORUM 43 (2003), available at
2004 USING CROP BIOTECHNOLGIES WORLDWIDE 247
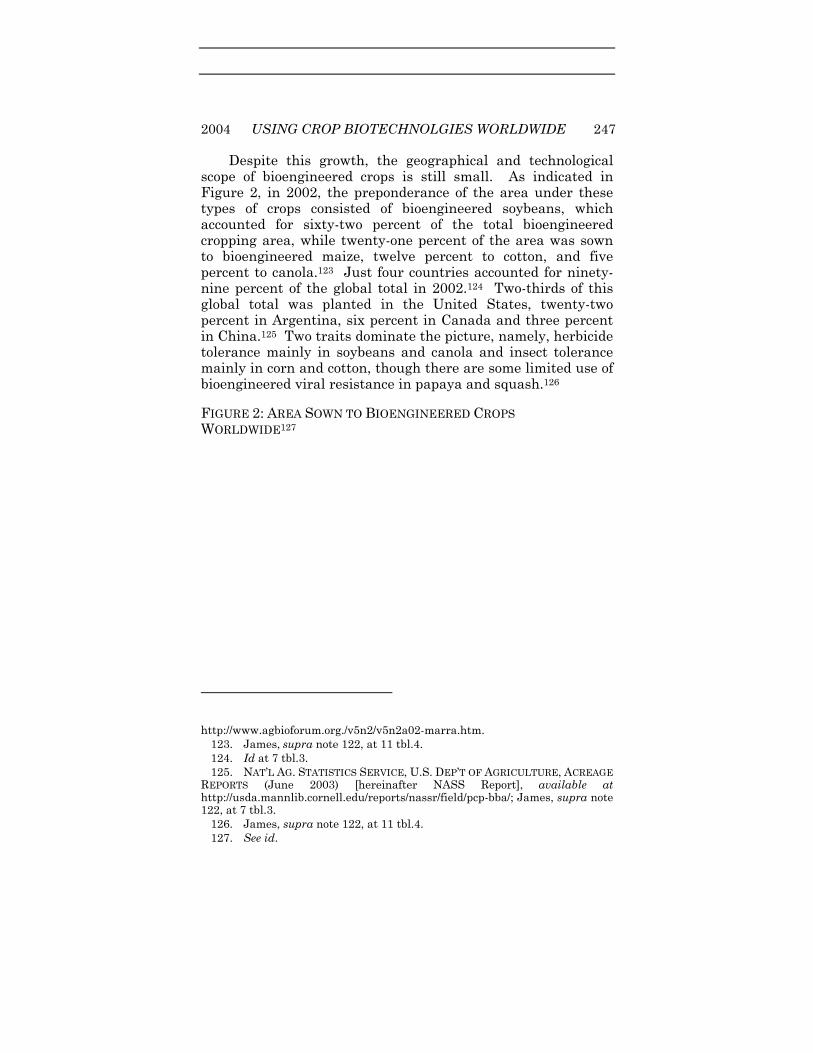
Despite this growth, the geographical and technological scope of bioengineered crops is still small. As indicated in Figure 2, in 2002, the preponderance of the area under these types of crops consisted of bioengineered soybeans, which accounted for sixty-two percent of the total bioengineered cropping area, while twenty-one percent of the area was sown to bioengineered maize, twelve percent to cotton, and five percent to canola.123 Just four countries accounted for ninety-nine percent of the global total in 2002.124 Two-thirds of this global total was planted in the United States, twenty-two percent in Argentina, six percent in Canada and three percent in China.125 Two traits dominate the picture, namely, herbicide tolerance mainly in soybeans and canola and insect tolerance mainly in corn and cotton, though there are some limited use of bioengineered viral resistance in papaya and squash.126
FIGURE 2: AREA SOWN TO BIOENGINEERED CROPS WORLDWIDE127
http://www.agbioforum.org./v5n2/v5n2a02-marra.htm. 123. James, supra note 122, at 11 tbl.4. 124. Id at 7 tbl.3. 125. NAT’L AG. STATISTICS SERVICE, U.S. DEP’T OF AGRICULTURE, ACREAGE REPORTS (June 2003) [hereinafter NASS Report], available at http://usda.mannlib.cornell.edu/reports/nassr/field/pcp-bba/; James, supra note 122, at 7 tbl.3. 126. James, supra note 122, at 11 tbl.4. 127. See id.

248 MINN. J.L. SCI. & TECH. [Vol. 6:1
As indicated in Figure 2, the developing country’s share of global bioengineered crop area has grown from fourteen percent of the world total in 1997 to about twenty-seven percent in 2002. Notably, plantings in just four countries, soybeans in Argentina and cotton in China, South Africa, and for the first time in 2002, India, account for the lion’s share of the developing-country bioengineered acreage.128 Finding bioengineered traits that deal successfully with local production constraints is one thing, expressing them in specific crop varieties that compete well locally against landraces and conventionally bred varieties of the same crop, absent the bioengineered trait, is another thing. Not surprisingly, the bioengineered traits are being grown in developing-country areas that are agroecologically similar to the rich countries for which the traits were first developed, and in most cases involve the identical crop varieties. For example, all the officially approved Monsanto/DeltaPine bioengineered cotton varieties grown in China are the same varieties grown in the United States, while most of the bioengineered Chinese varieties are based on older DeltaPine varieties introduced into China in the 1940s and 1950s.129 Likewise the transgenic cotton varieties grown in Mexico are from the United States;130 and in South Africa, NuCotn 37-B, an American variety, is widely used.131
This is precisely where the spillover costs are smallest and consist mainly of local screening and regulatory approval costs along with the costs of marketing the technology. That is, disseminating these particular bioengineered crop varieties involves only adaptive or imitative technology development costs beyond the initial discovery costs, a much smaller cost than inventing entirely new bioengineered traits and successfully expressing those traits in locally superior varieties of locally important crops.
The site-specificity of many agricultural biotechnologies
128. See id. at 5. 129. Carl .E. Pray et al., Five Years of Bt Cotton in China—The Benefits Continue, 31 PLANT J. 423, 424 (2002). 130. Greg S. Traxler, Transgenic Cotton in Mexico: Economic and Environmental Impacts, in THE ECONOMIC AND ENVIRONMENTAL IMPACTS OF AGBIOTECHNOLOGY: A GLOBAL PERSPECTIVE 183 (2003). 131. Colin Thirtle et al., Can GM-Technologies Help the Poor? The Impact of Bt Cotton in Makhathini Flats, KwaZulu-Natal, 31 WORLD DEV. 717, 719 (2003).

2004 USING CROP BIOTECHNOLGIES WORLDWIDE 249
arises from agroecological aspects, which defines the size of the relevant market in a way that is much less common in other industrial research and development. As Julian M. Alston and Philip G. Pardey described, one way to think of this is in terms of the unit costs of making local research results applicable to other locations by adaptive research, which must be added to the local research costs.132 Such costs grow with the size of the market.133 Economies of size, scale, and scope in research mean that unit costs fall with size of the research and development enterprise, but these economies must be traded off against the diseconomies of distance and adapting site-specific results such as the costs of “transporting” the research results to economically “more distant” locations.134 Thus, as the size of the research enterprise increases, unit costs are likely to decline at first because economies of size are relatively important, but will eventually rise as the costs of economic distance become ever-more important.
Given that the United States dominates the world totals, its trends are worth scrutinizing. Ranked in terms of total acreage, the world and U.S. crop relativities for 2002 are the same—soybeans dominate, followed by corn and cotton.135 However, the intensity of use of bioengineered versus classically bred crops differs between the Unites States and the rest of the world. As indicated in Figure 3, the United States uniformly makes more intensive use of bioengineered crops than the rest of the world. While seventy-seven percent of the U.S. canola crop was sown to bioengineered varieties in 2002, the corresponding rest-of-world share was twelve percent. Likewise, bioengineered soybeans covered seventy-one percent of the U.S. soybean acreage and only twenty-eight percent of
132. Julian M. Alston, & Philip G. Pardey, The Economics of Agricultural R&D Policy, in PAYING FOR AGRICULTURAL PRODUCTIVITY (Julian M. Alston et al. eds., 1999). 133. A close analogy can be drawn with spatial market models of food processing in which processing costs fall with throughput but input and output transportation costs rise with throughput so that when the two elements of costs are combined, a U-shaped average cost function is derived. See, e.g., Richard J. Sexton, Imperfect Competition in Agricultural Markets and the Role of Cooperatives: A Spatial Analysis, 72 AM. J. AGRIC. ECON. 709, 714 fig.1 (1990). 134. See Alston & Pardey, supra note 132. 135. NASS Report, supra note 125.

250 MINN. J.L. SCI. & TECH. [Vol. 6:1
the rest-of-world soybean area.136 For cotton the corresponding shares were seventy-one percent for the United States and eleven percent for the rest of the world; for corn it was thirty-four percent for the United States and 1.4 percent elsewhere.137 This reflects both technology and market realities. While the dominant bioengineered traits such as those that target mainly budworm/boll weevil complexes in cotton and European stem borers in corn, as well as Roundup® and Liberty Link® resistance in soybeans and canola have yield-enhancing or cost-reducing consequences for rest-of-world farmers, they are especially consequential for United States producers. In addition, given their earlier regulatory approval in the United States, these traits are now incorporated into a number of locally optimized crop varieties.
FIGURE 3: BIOENGINEERED CROPPING INTENSITIES – UNITED STATES VS REST-OF-THE-WORLD, 2002138
136. See Marra, supra note 122, at 43 (“In some U.S. states, the share of 2002 soybean acres planted to [Roundup Ready®] soybeans is approaching [ninety percent]”), available at http://www.agbioforum.org./v5n2/v5n2a02-marra.htm. 137. See James, supra note 122; NASS Report, supra note 125. 138. Data represent share of respective crop acreage in each region sown to bioengineered varieties. See James, supra note 122, at 11 tbl.4; NASS Report, supra note 125.
2004 USING CROP BIOTECHNOLGIES WORLDWIDE 251
VI. SUMMING UP This paper demonstrates that the preponderance of
research conducted on bioengineered crops is carried out in rich countries where the overwhelmingly large share of biotechnology acreage is still to be found, and much of the product development work is performed by private firms. Moreover, most of the bioengineered traits and the specific crop varieties that are planted in developing countries are spillovers from, or adaptive modifications of, rich-country research. Only when we achieve a reasonable rate of inventor appropriability of the returns to the technologies that are applicable in less-developed countries, combined with an economic infrastructure that facilitates adoption of those technologies, can we expect a significant private-sector role to emerge in the poorer parts of the world.
This paper also draws attention to the comparatively low rates of investment in public agricultural research and development in developing countries, where government revenues may be comparatively expensive due to lower tax revenues, or have a comparatively high opportunity cost.139 Many less-developed countries are characterized by under-investment in a host of other public goods, such as transportation and communications infrastructure, schools, hospitals, and the like, as well as agricultural science. These other activities, like agricultural science, might also have high social rates of return.140 In many less-developed countries, where agriculture represents a much greater share of the total economic activity, and where per capita incomes are much lower, a meaningful investment in public agricultural research might have a much more appreciable impact on individual citizens. The problem, however, is that this burden is felt now, while the payoff it promises may take a long time to come, and will be much less visible when it does.
Even among the rich countries of the world, most have not had very substantial private or public agricultural science industries. Why, then, should we expect the poorest countries
139. Julian M. Alston & Philip G. Pardey, Developing Country Perspectives on Agricultural R&D—New Pressures for Self Reliance?, in AGRICULTURAL R&D POLICY IN THE DEVELOPING WORLD (forthcoming 2005). 140. See id. (noting political factors are also present).

252 MINN. J.L. SCI. & TECH. [Vol. 6:1
of the world to be more like the richest of the rich in this regard?141 The lion’s share of the public, as well as private, investment in agricultural science has been undertaken by a small number of countries; generally, these countries have undertaken the lion’s share of scientific research as well.142 An important consideration is economies of size, scale, and scope in research, which influence the optimal size and portfolio of a given research institution. In some cases the “optimal” institution may efficiently provide research for a state or region within a nation, but for some kinds of research the efficient scale of institutions may be too great for an individual nation. Many nations may be too small to achieve an efficient scale in much if any of the relevant elements of their interests’ in crop biotechnology research, except perhaps in certain types of adaptive research.
Historically, there have been large spillovers of improved varieties and the technology and know-how embodied in them from one country to another. However, we cannot presume that the rich countries of the world will play the same roles as in the past.143 In particular, countries that in the past relied on technological spillovers from the North may no longer have that luxury available to them in the same ways or to the same extent.144 This change can be seen as involving three elements. First, the types of technologies being developed in the rich countries may no longer be as readily applicable to less-developed countries as they were in the past. The agenda in richer countries is shifting away from areas like yield improvement in major crops to other crop characteristics and even to non-agricultural issues.145 Second, the private presence in rich country agricultural research and development has increased and many biotech companies are not as interested in developing technologies for many less-developed country applications. Even where they have such technologies
141. See PARDEY & BIENTEMA, supra note 5, at 13 (noting the geographical concentration among countries of particular classes of research—for instance research into agricultural chemicals or machinery—is even greater than that for agricultural R&D in total). 142. See id. at 11-12 (reporting the United States conducted forty-two percent of the world’s total investment in all science in 1995). 143. See Alston & Pardey, supra note 139. 144. See id. 145. See id.
2004 USING CROP BIOTECHNOLGIES WORLDWIDE 253
available, often they are not interested in pursuing potential markets in less developed countries.146 And third, those technologies that are applicable and available are likely to require more substantial local development and adaptation, calling for more sophisticated and extensive forms of scientific research and development than in the past. For instance, more advanced skills in modern biotechnology or conventional breeding may be required to take advantage of enabling technologies or simply to make use of less-finished lines that require additional work to tailor them to local production environments.147 In short, different approaches may have to be devised to make it possible for less-developed countries to achieve equivalent access to technological potentials generated by rich countries. In many instances, less-developed countries may have to extend their own research and development efforts to more fundamental areas of the science.
Some argue that strengthening intellectual property regimes in poorer countries is one way of stimulating investments in developing-country research and development as well as efforts to commercialize crop technologies developed elsewhere.148 Others argue that the number and breadth of patents, plant breeders’ rights, and other forms of intellectual property hinders the research and development required to tackle food security concerns of poor countries.149 Binenbaum et al. studied the situation for fifteen staple food crops of the world and concluded there was undue concern that intellectual property rights were currently limiting the freedom to operate for research on developing-country food staples.150 The Binenbaum et al. study reinforced the intellectual property evidence assembled for some key enabling technologies used in agriculture: intellectual property rights concerning crop biotechnologies are overwhelmingly concentrated in rich-
146. See id. 147. See id. 148. See, e.g., Mark Schankerman, How Valuable Is Patent Protection? Estimates by Technology Field, 29 RAND JOURNAL OF ECONOMICS 77, 104 (1998) (“Patent rights are clearly valuable, but they are not the main source of private returns to inventive effort.”). 149. See, e.g., Eran Binenbaum et al., South-North Trade, Intellectual Property Jurisdictions, & Freedom to Operate in Agricultural Research on Staple Crops, 51 ECON. DEV. & CULTURAL CHANGE 309 (2003). 150. See id. at 317, 331.

254 MINN. J.L. SCI. & TECH. [Vol. 6:1
country jurisdictions, meaning poor-country research can proceed largely unencumbered by any intellectual property restraints.151 Binenbaum et al. also showed that bilateral trade in food staples from poor- to rich-countries in which intellectual property was presumptively in force was meager and limited to just a few crops from a few poor countries,152 meaning the results of this research can be disseminated and used with few if any intellectual property impediments if the intent is to feed and clothe poor people in poor countries.
As things stand today, the constraints to conducting modern crop biotechnology research in developing countries appear to lie largely beyond intellectual property concerns. Market considerations limit substantial private interests for many crops in many developing countries, and the intensity of public investments is generally low for reasons that do not seem likely to change soon.153 Intellectual property rights may have a role to play in stimulating efforts to commercialize crops in developing countries, especially helping to harness spill-in technologies developed elsewhere, but, at least in the nearer term, they will be no substitute for rich and poor country governments alike reinvesting in the research and development required to maintain and continue adding to the crop yields necessary in the decades ahead.
151. See id. at 317-18. 152. See id. at 323. 153. See Ismail Serageldin, Changing Agendas for Agricultural Research, in AGRICULTURAL SCIENCE POLICY: CHANGING GLOBAL AGENDAS 13, 19 (Julian M. Alston et al. eds., 2001) (Some even see a scientific apartheid taking shape, with large parts of the developing world being left behind or denied the prospects science has to offer for growth, development, and prosperity).