Embed Size (px)
Citation preview

A New Economy Series White Paperfrom Cambridge Technology Partners
Edison knew innovation meant
much more than development
of new products.That’s even
more true in the New Economy.
Edison knew innovation meant
much more than development
of new products.That’s even
more true in the New Economy.
Creating Value Through InnovationCreating Value Through Innovation

Foreword:
The telegraph ranks among the most significant achievementsof modern times. By liberating the delivery of communications from the limits of physical
transportation and from humans’ sensory boundaries, the new medium ushered the world into the information age.
Invented almost two centuries ago, the telegraph sparked innovation on an unprecedented scale. It immediately
precipitated flurries of incremental improvements in telegraph technologies – great strides were made in
transmission quality, and very quickly, the technology standardized around Morse Code. It even began to change
the way that businesses were organized. Many firms dramatically reinvented themselves to exploit its
advantages. Other sectors were annihilated. Soon, who needed the Pony Express?
The land grabs and surges of speculation that characterized the telegraph’s early days show that
the goal of innovation in a business context – to gain a monop-olistic hold on a new market – is as old as capitalism itself.Success then, as now, required a three-point strategy. Contenders had to get in early, rapidly grow their user
networks before competitors arrived, and focus on core competencies to stake out defensible positions.
As with every Next Big New Thing, the telegraph generated a range of innovations that conforms to a
hierarchy of value creation. On top are layers of disruptive innovations such as new business models that
reconfigure industries, or new technologies that redefine product categories. Lower down are the incremental
innovations that seek to improve existing products, services, or processes.
What’s different today? In two words: the Internet. Its unique
facility for slashing coordination costs – the costs of liaison between, say, a customer and a supplier – fosters
unprecedented levels of business-model innovation. Plummeting transaction costs, greater market liquidity, and
more partner transparency are just some of the Internet-fueled realities that allow innovative business models
to continually emerge.
Please do not presume you’re OK because your firm has an entrenched
“innovation process” or funds an “innovation engine.” Geared to deliver incremental innovations only, they will
not support the disruptive innovations needed to reinvent your business model. And both types of innovation
absolutely belong in your portfolio of options in the New Economy.
This white paper puts the innovation discussion on a new plane. It sketches out the innovation-value hierarchy.
It explains the link between innovation and value creation, and concludes with a self-diagnostic tool that will
help you determine where you truly stand in the innovation game.
Front Cover:Thomas Edison

3
Table of Contents
Introduction:A New Lexicon For Innovation
Innovation:The Quest For Dominance
Further Browsing:Sources And References
Diagnostics:Rating Your Innovation Capacity
Case Study:A Look At The Pharmaceutical Industry
The Innovation Lifecycle:All The World’s A Stage
21
4
7
14
16
23
4
In an economy predicated on intellectual
and relationship capital, few would argue
that focused innovation leads to value
creation. A recent study commissioned by
Forbes ASAP magazine found that inno-
vation was the dominant lever in the
value-creation process – in most
instances, more influential by far than
customer satisfaction. But few under-
stand what innovation is, much less how
it impacts the creation of value. And even
fewer can see beyond conventional beliefs
about innovation – they assume it’s all
about new-product development, or a
new manufacturing process – to broader
interpretations that are key to high
performance in the New Economy.
Those misunderstandings underscore
the need to develop a new lexicon for
innovation.
In 1942, economist Joseph Schumpeter
eloquently captured one essence of inno-
vation when he coined the term “creative
destruction.” Embodied in this descriptor
is the relentless leveraging and augmen-
tation of prior innovations to create new,
higher-valued innovations.The “standing-
on-the-shoulders-of-giants” quality of
this definition hints that innovation is the
result of continual improvements in rela-
tively stable environments. Schumpeter
also believed large corporate incumben-
cies were the bastion of innovation, which
implies that innovation is a predictable,
low-risk endeavor.
But what happens when the power of
incumbency becomes meaningless? The
work of Harvard professor Clayton
Christensen picks up where Schumpeter
leaves off. In his 1997 book The
Innovator’s Dilemma, Christensen postu-
lates that incumbents become so
entrenched in serving their existing cus-
tomer base that they fail to comprehend
the disruptive impact that new technolo-
gies can have on their markets. Thus,
disruptive technologies lead to the
eventual displacement of incumbents. In
the early stages, the risk is moderate,
increasing dramatically as the new
technology achieves critical mass.
Starting with the disk-drive industry as
example, Christensen shows how most of
the first companies to dominate the
sector were eventually displaced by new
entrants. These firms developed smaller
disk drives, with lower functionality,
targeted at small markets not served by
the incumbents. While doing everything
right to serve their existing customers,
the incumbents failed to appreciate the
value/performance “trajectory” of the
newer technology. By the time they
realized the new technology had evolved
to meet the needs of the mainstream
market, it was too late. As a result, the
new entrants knocked the incumbents off
their market-dominating pedestals.
A New Lexicon For InnovationIntroduction:Now that the Internet is adding new dimensions to innovation, we need a new vocabulary to describe the changes.
Ironically, many of these “new incum-
bents” were similarly dislodged by the
subsequent waves of new entrants.
Christensen’s work highlights an
important lesson. By focusing on existing
customers, the incumbents emphasized
incremental innovation that improved
existing products. Thus, they took their
eyes off the technology ball and neglected
the potential future impact of newer
technologies on their markets. In other
words, they failed to develop a portfolio
approach that balanced both incremental
and disruptive innovation. As in a Greek
tragedy, Christensen shows how this
scenario repeated itself in disparate
industries such as computers, excavation
equipment, motorcycles, and steel.
The Internet brings the Christensenian
view to a higher level. Now, smaller firms
with less physical capital and new
business models can (and do) emerge
overnight – and from anywhere in the
world. Honing their core competencies
while fluidly partnering to access comple-
mentary expertise, they threaten to
dynamically reconstitute the economies
of scope previously attainable only by
large hierarchies.
Trigger Event
There is another factor in the disruptive
innovation equation: dramatic shifts in
new business models are preceded by a
breakthrough or trigger event. The tele-
graph shattered the time lags associated
with physical transportation of informa-
tion. The steam engine, the internal
combustion engine, and heavier-than-air
travel spawned the rise of the railroad,
automotive, and airline industries respec-
tively (as well as ancillary industries such
as auto rental, travel agencies, etc.). The
Internet combines forces such as global
reach, decreasing transaction costs, and
increasing returns to scale to drive the
emergence of new business models. And
other disruptive catalysts are on the
horizon. The mapping of the human
genome promises to redefine the pharma-
ceutical and insurance industries. Fuel-
cell technology may replace the internal
combustion engine, dramatically affecting
the petroleum industry in the process.
A central theme of this paper is that
successful innovation leads to value
creation. Therefore, we need a definition
of value creation. In this paper, when we
discuss value we are referring to a firm’s
market valuation. For publicly traded
firms, market valuation is simply the
aggregate value of all outstanding
shares. For private firms, value equates
to the market-valuation assessment that
venture capitalists would perform prior to
taking a firm public. Because information
on publicly traded firms is more accessible,
the examples we cite are limited to public
companies.Value creation, then, represents
any period-to-period appreciation of exist-
ing capital, all other factors held constant.
5
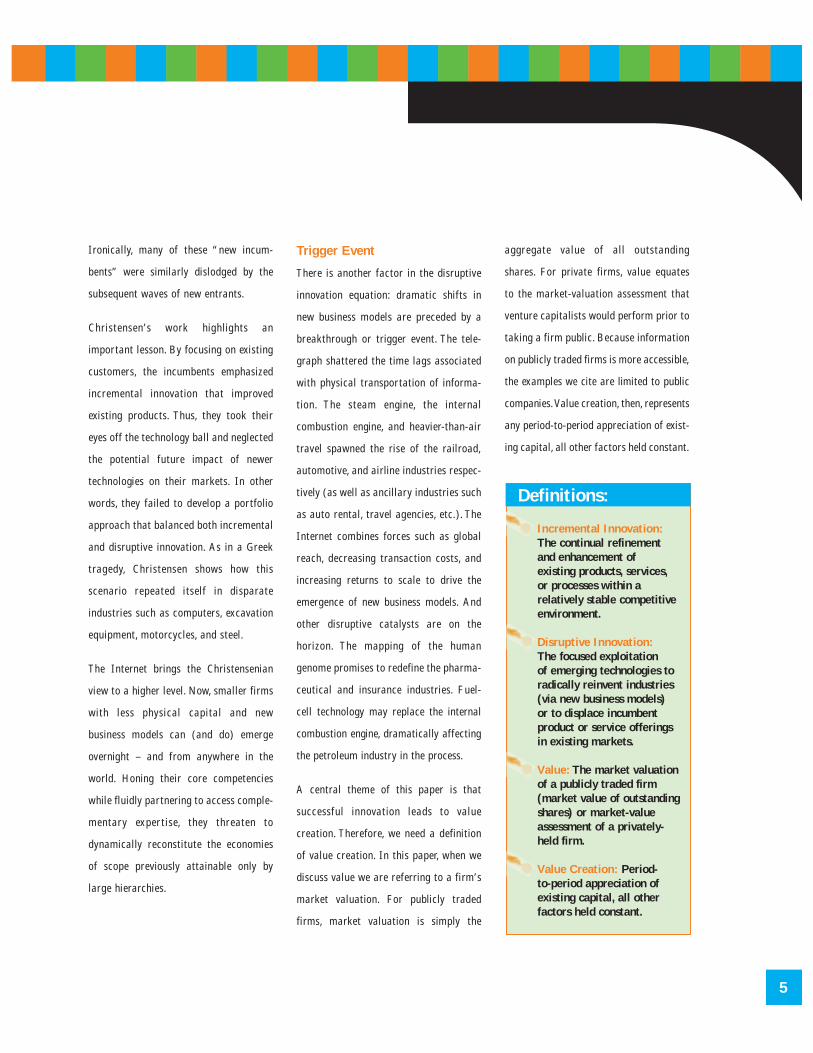
Incremental Innovation:The continual refinement and enhancement of existing products, services,or processes within a relatively stable competitiveenvironment.
Disruptive Innovation:The focused exploitation of emerging technologies toradically reinvent industries (via new business models) or to displace incumbent product or service offerings in existing markets.
Value: The market valuationof a publicly traded firm (market value of outstandingshares) or market-value assessment of a privately-held firm.
Value Creation: Period-to-period appreciation ofexisting capital, all other factors held constant.
Definitions:
The Innovation-Value Hierarchy
There is a well-known maxim concerning
risk and reward. The higher the risk, the
higher the expected payoff to those who
fund the risk. Successfully execute in a
high-risk environment, and shareholders
are rewarded with a dramatically
enhanced market valuation.
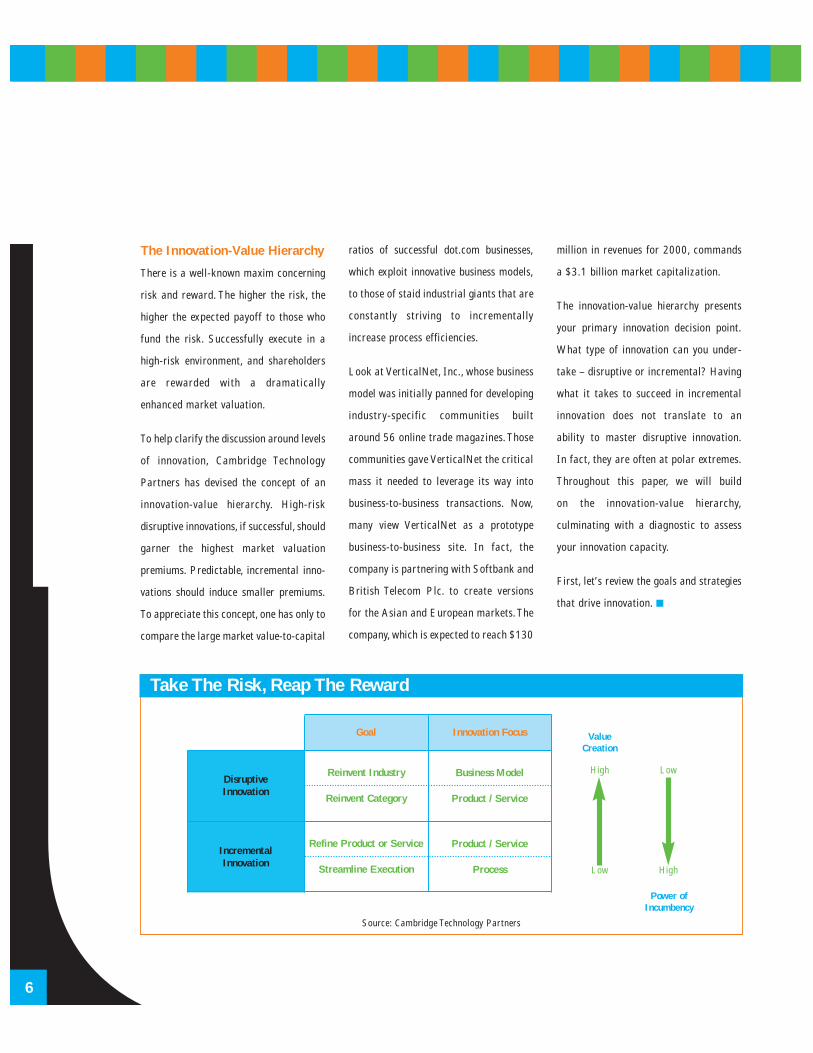
To help clarify the discussion around levels
of innovation, Cambridge Technology
Partners has devised the concept of an
innovation-value hierarchy. High-risk
disruptive innovations, if successful, should
garner the highest market valuation
premiums. Predictable, incremental inno-
vations should induce smaller premiums.
To appreciate this concept, one has only to
compare the large market value-to-capital
ratios of successful dot.com businesses,
which exploit innovative business models,
to those of staid industrial giants that are
constantly striving to incrementally
increase process efficiencies.
Look at VerticalNet, Inc., whose business
model was initially panned for developing
industry-specific communities built
around 56 online trade magazines.Those
communities gave VerticalNet the critical
mass it needed to leverage its way into
business-to-business transactions. Now,
many view VerticalNet as a prototype
business-to-business site. In fact, the
company is partnering with Softbank and
British Telecom Plc. to create versions
for the Asian and European markets.The
company, which is expected to reach $130
million in revenues for 2000, commands
a $3.1 billion market capitalization.
The innovation-value hierarchy presents
your primary innovation decision point.
What type of innovation can you under-
take – disruptive or incremental? Having
what it takes to succeed in incremental
innovation does not translate to an
ability to master disruptive innovation.
In fact, they are often at polar extremes.
Throughout this paper, we will build
on the innovation-value hierarchy,
culminating with a diagnostic to assess
your innovation capacity.
First, let’s review the goals and strategies
that drive innovation.
6
Take The Risk, Reap The Reward
Source: Cambridge Technology Partners
Reinvent Industry
Reinvent Category
Business Model
Product / Service
Product / Service
Process
Goal
DisruptiveInnovation
IncrementalInnovation
Refine Product or Service
Streamline Execution
Innovation Focus ValueCreation
High Low
Low High
Power ofIncumbency
7
The Quest For DominanceInnovation:
The business press is awash with articles
touting the importance of innovation.
Harvard Business Review, Sloan
Management Review, and Fortune, to
name a few, have all recently published
articles hailing its strategic significance.
However, there is a subtle point that
many of those articles miss. Successful
innovation does not cause value creation.
It leads to it. So then, how are innovation
and value creation linked? What drives
businesses to innovate? Economists such
as Paul Romer and W. Brian Arthur
provide an elegant, capitalistic answer.
Innovation is driven by the lure of
quasi-monopolistic power. Obtaining
uncontested market presence, even for a
short time, is enough to fuel innovation.
Efforts to be first to market can be
rewarded with acceptance by crucial
early adopters, which can lead to
increasing returns to scale and potentially
higher margins to subsidize the next
round of innovation. It is a virtuous circle
that can reinforce market dominance.
That dominance, in turn, leads to
premium market valuations.
If dominance is the goal, what is the
strategy? Throughout the capitalist era,
successful innovators invoke variations
on a three-point strategy. First, they
get in the game early. Second, they
aggressively expand their user networks.
Third, they focus on defensible, value-
adding competencies.
The shift to a networked economy is
intensifying these strategic tenets. The
convergence of network economics, short-
ening business cycles, increasing returns
to scale, and the law of comparative
advantage are recasting the classic three-
point strategy. Let’s take a closer look.
First Mover Takes All
Remember the classic bell-shaped
market-maturity curves that neatly
classify buyers into early adopters,
mainstream, and laggards? A business
could choose to play the role of market
leader, fast follower, or late entrant.
Well, those conventions work fine in
stable markets with long business cycles.
Compress these cycles to 18 months or
less, and it’s a new ball game. Erase the
laggard category; market leaders won’t
have time to court them. Eliminate the
late entrants; they’ll relinquish more and
more of their market presence to first
movers (see sidebar: “Advantage, First
Mover.”)
A textbook example of the “winner-
takes-all” phenomenon is Amazon.com,
which turned the staid book-selling trade
on its ear. In Amazon’s case, the innova-
tion centered on a business model that
separates information about well-defined
commodities (books, music, videos) from
the physical inventory and fulfillment
processes. This allows Amazon to
compete using information about books
to present a huge “virtual inventory”
to customers. As of June 2000, Amazon
had a market value of $11.9 billion.With
its own capitalization of $1.4 billion,
fast follower barnesandnoble.com is
still struggling to catch up. And the
revenues of late entrant Borders.com are
an order of magnitude lower than those
of Amazon.
Innovation is an inherently risky
proposition. It requires significant
up-front investments in R&D or customer
acquisition. And market acceptance is
not guaranteed. Thus, it is insufficient to
It’s not about the new ideas for their own beauty.Successful innovation leads to uncontested market presence, which sires high market value.

8
simply be first to market. Quasi-monopo-
listic status will be granted to the first
mover to successfully exploit emergent
market opportunities. The successful
contender will recoup prior R&D or
customer acquisition expenditures and live
to subsidize future innovation investments.
To do so, it’s vital to harness the second
stage of the three-point innovation
strategy – the power of network economics.
Advantage, First Mover
A few quick calculations show that the clear profit win goes to those who are first to market.
Basing our numbers on research done by the Iacocca Institute at Lehigh University, which shows that about 80% of
profits are realized during the first half of a market window, we can extrapolate profits breakdowns for three
companies pursuing a market opportunity that lasts three years.
Company A is first to market. Fast follower B enters six months later; late entrant C arrives when the market is 18
months old. Under these conditions, Company A will grab 60% of the profits while B would earn 33% and C gets
7%. Now shrink the window to 18 months. If the market entry timings remain constant, the profit distribution
changes to 77% for A, 23% for B and zero for C.
The implications go beyond the profit split. Company A’s fatter profits allow it to further entrench itself in the
market, but B and C have less to re-invest and so fall further behind. A pivotal lesson: those that get ahead tend to
gain positive momentum; those that fall behind tend to lag further – and faster.
Source: Cambridge Technology Partners
6 12 18 24 30 36
Cap
ture
d P
rofit
s (%
)
Market Window (Months)
Late Entrant
Fast Follower
First Mover
100%
0%10%
3% 5% 7%
23% 28%
0% 0% 0%
90%77%
68% 63% 60%
31% 33%
9
Network Effects
In evolutionary biology, the initial
success of a new species is greatly
influenced by its ability to rapidly radiate
across the environment and entrench
itself before competitive species enter the
fray. Business buzzwords such as “viral
marketing” or “market diffusion” have
their roots in this concept. Once an
exploitable opportunity presents itself,
the objective is to grow the user network
rapidly, before competitors can do so.
Economist W. Brian Arthur explains the
power of diffusion in two ways. First,
there are network effects, whereby the
larger the network of users, the more
likely the product will become a
standard. Second, familiarity with a
product or service, including training and
use, creates a lock-in effect. Thus, the
more users you acquire, the harder it
becomes for competitors to enter the
market. Consider Hotmail Corp., which
provided free e-mail and quickly
captured over 10 million users. The only
way Microsoft Corp. could deal with the
competitive threat to its Microsoft
Network (MSN) was to acquire the
company – for $385 million.
As the customer base expands, it is usual
for the marginal cost to produce a
product or acquire a customer to decline.
The law of increasing returns postulates
that the more your market expands, the
more advantage you stand to gain.
Consider America Online Inc. With its
“buddy lists,” AOL transforms users into
advocates who sell their friends on the
benefits of joining AOL. This reduces
AOL’s customer-acquisition costs,
thereby increasing margins. Microsoft
exemplifies a firm that enjoys the effects
of increasing returns (see sidebar:
“Justifying Microsoft’s Margins.”)
But there is a dark side to network
effects. The less adaptive you are to
market shifts, the faster your market
position will erode. Get behind the
innovation curve or cling to an obsolete
business model and you’ll lose your
market position. Look at Encyclopedia
Britannica Inc., which initially scoffed at
the concept of a CD-ROM encyclopedia –
an innovation that almost put Britannica
out of business. Innovation-driven
Darwinism? Absolutely.
The drive for ubiquity draws into
question just whom you will be
competing against in the New Economy.
Consider the battle for supremacy in
Internet browsers. Microsoft was able to
counter Netscape Communications Corp.
by leveraging its dominance in the
operating-systems user base. One could
argue that Netscape simply sought to
capture the lion’s share of the browser
market, viewing the browser as an
application that would seed a new
market. In hindsight, Netscape was
pushing the browser into a user base
dominated by Microsoft – namely the
users of the various Windows operating
systems. From Microsoft’s perspective,
this was an existing market where
browsers are an incremental enhance-
Quasi-monopolistic status
will be granted to the
first mover to successfully
exploit emergent market
opportunities. The
successful contender
will recoup prior R&D
or customer-acquisition
expenditures and live
to subsidize future
innovation investments.

0
ment for a user base that it controlled. In
the end, Microsoft proved to be an
incumbent that could not be dislodged.
The Netscape-Microsoft battle demon-
strates the downside of ubiquity – the
transition from novelty to utility. In the
early days, the browser was a disruptive
innovation. It redefined the use of
the Internet, transforming it into a
commercial medium. As the nascent
Internet world matured, the browser
itself became an indispensable utility
on every PC. Thus, it was a logical
progression for the browser to be
Justifying Microsoft’s Margins
Under the law of increasing returns, pricing mechanisms put forth in traditional economic theory, which are based
on production costs and "perfect competition," go out of the window. Let’s take Microsoft Corp. as an example. If
Microsoft set its prices at the same gross margin levels used by the auto industry, a copy of Windows NT would cost
20% of what it does now!
Microsoft is typical of businesses that experience increasing returns. Its cost of goods sold as a percentage of
revenue has dropped from 22.2% in fiscal 1995 to 13.0% in fiscal 2000 – a decreasing marginal cost per unit as
Microsoft amortizes costs over an expanding user base. Also, Microsoft’s sales and marketing as a percentage of
revenue has dropped from 25.7% in 1995 to 18.0% in 2000. This suggests lower acquisition costs per customer.
Using an industrial pricing strategy would detract from Microsoft’s twin objectives, the first of which is to have
margins sufficient to recoup its up-front R&D investments. Suppose Microsoft invested upwards of $250 million to
develop Windows NT. These investments represent the cost to produce the first CD. The cost to produce the second
CD? About $1.50 (distributing Windows NT on the Internet would result in zero production costs!). The second
objective is to use its generous profit stream to invest in future innovation.
FY95 FY96 FY97 FY98 FY99 FY00
0%
5%
10%
15%
20%
25%
30%
R&D
COGS
Sales & Marketing
Source: Cambridge Technology Partners

11
subsumed by the operating systems on
which the browser ran.
A similar scenario played out in the
dramatic shift from novel business-
to-consumer to utilitarian business-
to-business Web sites. The B2C sites
enticed investors and misdirected many
corporations’ initial forays into the
networked economy.The latter is proving
to be where the real Internet opportunity
lies.This awakening is fueling the current
shakeout in the Internet industry, where
novel dot.com companies with marginal
business plans and no signs of profits are
falling victim to investors’ needs for
returns on their investments.
The high-tech industry is rife with
examples of empires unrealized for lack
of a market-diffusion strategy. Check out
Lotus before the IBM acquisition. The
exorbitant pricing of the innovative Lotus
Notes product severely limited its market
penetration. Consider Apple Computer
Inc.’s decision not to license the
technically superior Macintosh to clone
makers. When the Windows market hit
critical mass, software developers had
much less motivation to emphasize
developing Mac versions of their
products. Apple was doomed to remain
a niche player.
Competency-based Innovation
Being a first mover armed with a market-
diffusion strategy is necessary, but it’s
still not a complete approach. Your cus-
tomers or business partners must value
Match Your Competencies To Your Value Orientation
Source: Cambridge Technology Partners, derived from “The Discipline Of Market Leaders”
Efficient FulfillmentSupply Chain Management
Process ExpertiseBrand Management
Asset Utilization
Structural Capital
Customer IntimacyProposal SpecificationProject ManagementExperience TransferBest Practices
Relationship Capital
Customer AcquisitionResearch ExpertiseDesign and DevelopmentProject ManagementCustomer Familiarity
Intellectual Capital
your offering more highly than all
alternatives. Remember: the Internet’s
reach allows sourcing to occur globally.
Thus, it is possible to reconstruct value
chains using only “best of breed”
offerings, regardless of where those
offerings are produced or headquartered.
This will require you to focus on your
core competencies – the value-adding
activities that you perform better than
anyone else.
Nineteenth-century economist David
Ricardo was the first to contemplate the
benefits of specialization, which led to
the law of comparative advantage. His
initial framework examined two
countries, each able to produce two
commodities. He proved that each
country should specialize in producing
the commodity where it has an advantage
compared to the other country. Through
specialization, the world output of both
commodities increases. In other words, by
leveraging each country’s competencies,
the aggregate value produced is
maximized. Economists have long used
Ricardo’s insights to argue against
protectionist trade barriers that favor
domestic production over comparatively
advantaged foreign production.
The law of comparative advantage has
profound implications as we move into
the New Economy. In the industrial era,
high transaction and coordination costs
made it economically more feasible for
vertically integrated hierarchies to
provide economies of scope by owning the
entire value chain. Sub-optimal
performance of any link in the chain was
offset by the aggregate performance of
the entire chain. In essence, transaction
costs acted as trade barriers that favored
large hierarchies over small firms.
In the Cambridge Technology Partners’
white paper entitled “Business Models
for the New Economy,” we argued that
as the Internet drives down transaction
and coordination costs, those barriers
will rapidly erode. Vertically integrated
firms will find it increasingly difficult to
compete with networked partnerships. In
the New Economy, each network partici-
pant specializes based on the knowledge,
competencies and complementary assets
2
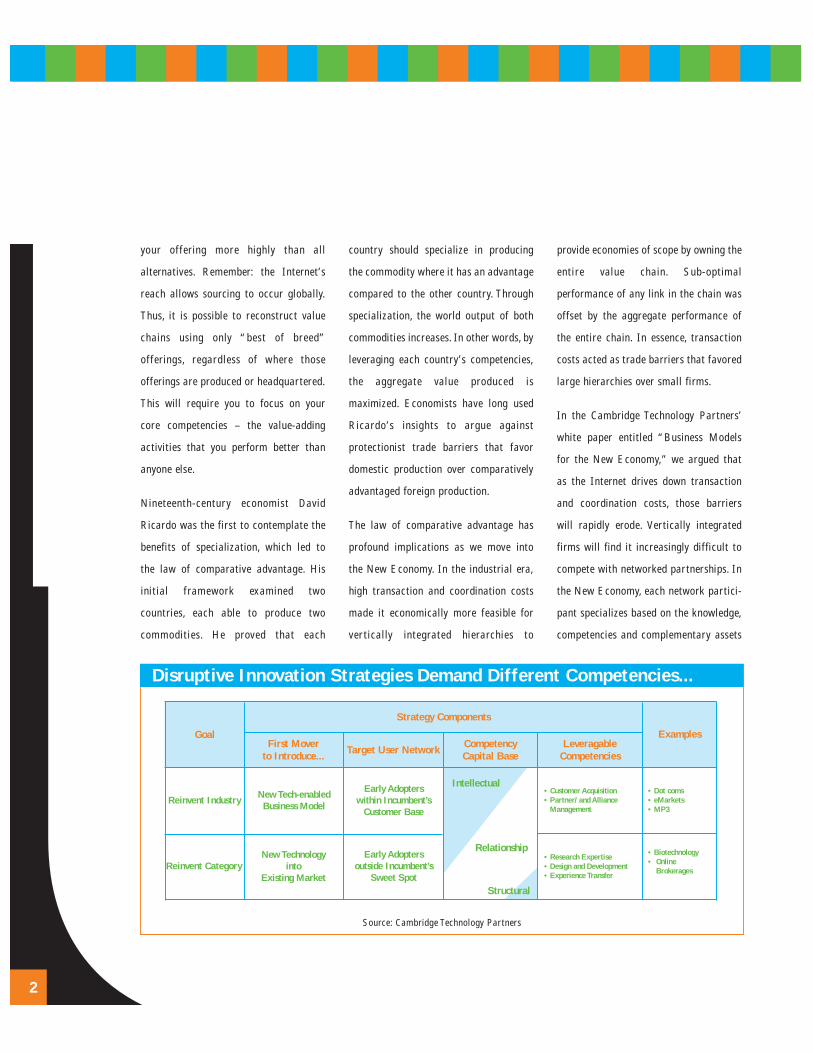
Source: Cambridge Technology Partners
Disruptive Innovation Strategies Demand Different Competencies...
Reinvent Industry
Reinvent Category
Goal
New Tech-enabledBusiness Model
New Technology into
Existing Market
First Mover to Introduce...
Early Adopters within Incumbent’s
Customer Base
Early Adopters outside Incumbent’s
Sweet Spot
Target User Network LeveragableCompetencies
Examples
Strategy Components
CompetencyCapital Base
• Customer Acquisition• Partner/ and Alliance
Management
• Dot coms• eMarkets• MP3
• Research Expertise• Design and Development • Experience Transfer
• Biotechnology• Online
Brokerages
Intellectual
Structural
Relationship
where it has a comparative advantage
over other potential partners. In this way,
the aggregate value of the network
output can be maximized.
An initial challenge is to correctly
identify your firm’s core competencies
(see “Rating Your Innovation Capacity,”
pg.21), which are related to how you
plan to deliver value to your customers
and partners. In their 1995 book “The
Discipline of Market Leaders,” authors
Michael Treacy and Fred Wiersema
proposed that firms focus primarily on one
of three value dimensions. Customer-
oriented firms focus on leveraging
relationships with customers and business
partners – that’s relationship capital.
Product- or service- oriented firms tap
into the brains of their employees (intel-
lectual capital) to create new offerings.
Finally, operationally focused companies
leverage their assets (structural capital)
to outperform competitors. It is
Cambridge Technology Partners’
contention that each of these dimensions
has an associated set of core competen-
cies. Later in this paper, we’ll present a
framework for assessing your core compe-
tencies and mapping them back to the type
of innovation you are geared to perform.
Linking Strategies to Value
Hierarchy
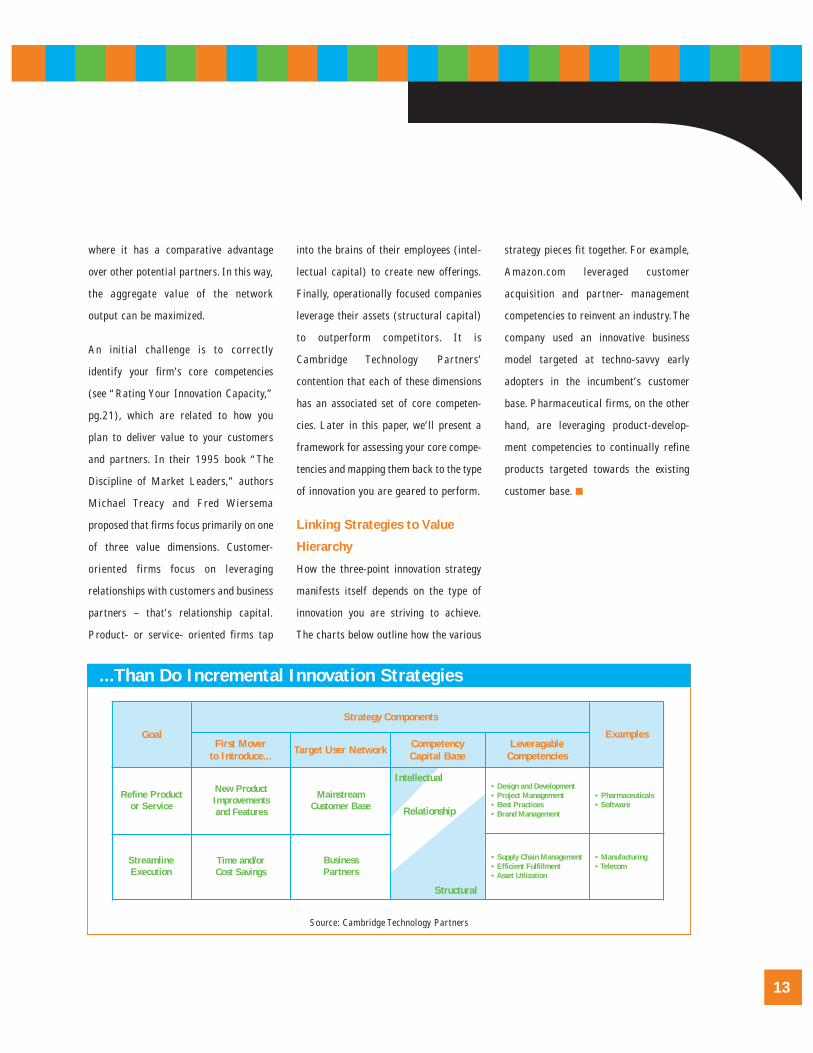
How the three-point innovation strategy
manifests itself depends on the type of
innovation you are striving to achieve.
The charts below outline how the various
strategy pieces fit together. For example,
Amazon.com leveraged customer
acquisition and partner- management
competencies to reinvent an industry.The
company used an innovative business
model targeted at techno-savvy early
adopters in the incumbent’s customer
base. Pharmaceutical firms, on the other
hand, are leveraging product-develop-
ment competencies to continually refine
products targeted towards the existing
customer base.
13
Source: Cambridge Technology Partners
...Than Do Incremental Innovation Strategies
Refine Product or Service
StreamlineExecution
Goal
New ProductImprovements and Features
Time and/or Cost Savings
First Mover to Introduce...
Mainstream Customer Base
Business Partners
Target User Network LeveragableCompetencies
Examples
Strategy Components
CompetencyCapital Base
• Design and Development• Project Management• Best Practices• Brand Management
• Pharmaceuticals• Software
• Supply Chain Management• Efficient Fulfillment • Asset Utlization
• Manufacturing• Telecom
Intellectual
Structural
Relationship
4
The question remains; does innovation
lead to value creation? Using 1999 data
from valuation experts Stern Stewart
and Co., we examined the performance of
1,000 companies in 22 industries. Our
analysis strongly suggests that successful
innovation is indeed a potent catalyst in
the value-creation process. We used
economic value added (EVA) as a proxy
for the predominant form of innovation.
(See sidebar: “The Mechanics of MVA
and EVA.”) A positive EVA means an
industry is generating real economic
profits and is dominated by incremental
innovations that refine or enhance existing
offerings or processes. A negative EVA,
on the other hand, indicates industries
that are economically in the red and ripe
for disruptive change. The lack of profits
is typically indicative of overcapitalization
of an “old economy”industry or high
levels of initial investments in “new
economy” business models.
To gauge innovation capabilities, we
analyzed the market value added (MVA)
performance of the 22 industries. MVA is
simply the difference between a company’s
market valuation (or market capitaliza-
tion) and the capital that has been
invested in the firm. High MVAs indicate
that investors are confident in the ability
of an enterprise to generate future
economic profits. If successful innovation
is key to the long-term viability of an
industry, then investor confidence, as
measured by MVA, is a solid metric.
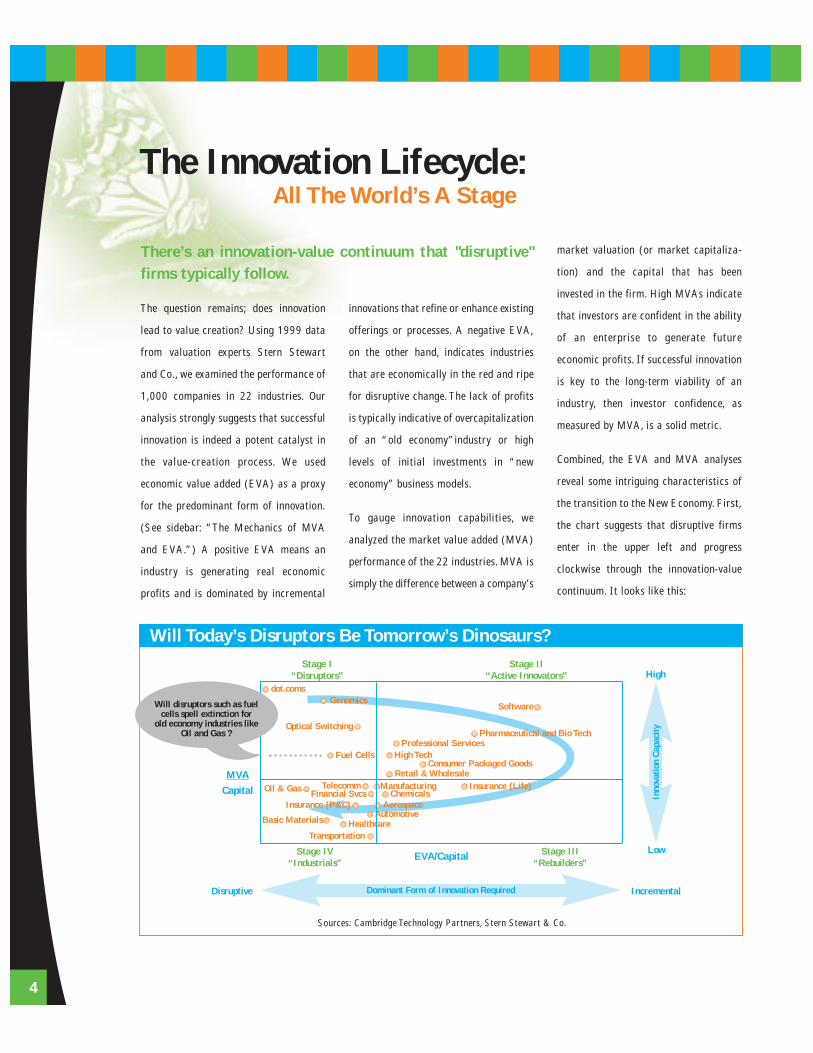
Combined, the EVA and MVA analyses
reveal some intriguing characteristics of
the transition to the New Economy. First,
the chart suggests that disruptive firms
enter in the upper left and progress
clockwise through the innovation-value
continuum. It looks like this:
There’s an innovation-value continuum that "disruptive"firms typically follow.
Will Today’s Disruptors Be Tomorrow’s Dinosaurs?
Sources: Cambridge Technology Partners, Stern Stewart & Co.
High
Low
MVACapital
EVA/Capital
IncrementalDisruptive
Inno
vatio
n Ca
paci
ty
Stage IV“Industrials”
Stage III“Rebuilders”
Stage I“Disruptors”
Stage II“Active Innovators”
Dominant Form of Innovation Required
Software
Fuel Cells High Tech
Oil & Gas
Retail & Wholesale
ChemicalsTelecomm
Basic Materials
Transportation
Manufacturing
Professional Services
Financial Svcs
AutomotiveAerospace
Healthcare
Insurance (P&C)
Pharmaceutical and Bio Tech
Insurance (Life)
Consumer Packaged Goods
The Innovation Lifecycle:All The World’s A Stage
Genomicsdot.coms
Optical Switching
Will disruptors such as fuel cells spell extinction for
old economy industries like Oil and Gas ?
The sectors that represent disruptions to
traditional business models, most notably
the dot.com companies, fall in the upper
left quadrant (Stage I). Despite the fact
that these firms are hemorrhaging red
ink, investors continue to throw
capital their way.This is not as insane as
it might appear. At this stage, the top
priority for the dot.coms is leveraging
network effects to grab user share, not
short-term profitability. However, while
it’s important, this situation is not
sustainable. Investors are willing to
gamble that some of the dot.coms will
secure their market positions and begin
to turn enormous profits. Those that fail
to do so will disappear. Stage I is where
you will find other nascent disrupters
such as genomics firms and companies
developing fuel-cell technology. The June
2000 announcement of the initial draft
of the human genome increased
awareness of the important role that
companies such as Celera Genomics
Group will play in the not-so-distant
future. The emergent genomics industry
will profoundly impact the pharmaceutical
and healthcare industries. For its part,
the emerging fuel cell threatens to have a
significant affect on both the automotive
and petroleum industries by eliminating
the need for conventional internal-
combustion engines.
In Stage II are the six sectors that
dominate the EVA/MVA race: software,
pharmaceuticals, consumer packaged
goods, high technology, retail and
professional services. Each of these
industries creates value through different
means of innovation (continued on p.18).
15
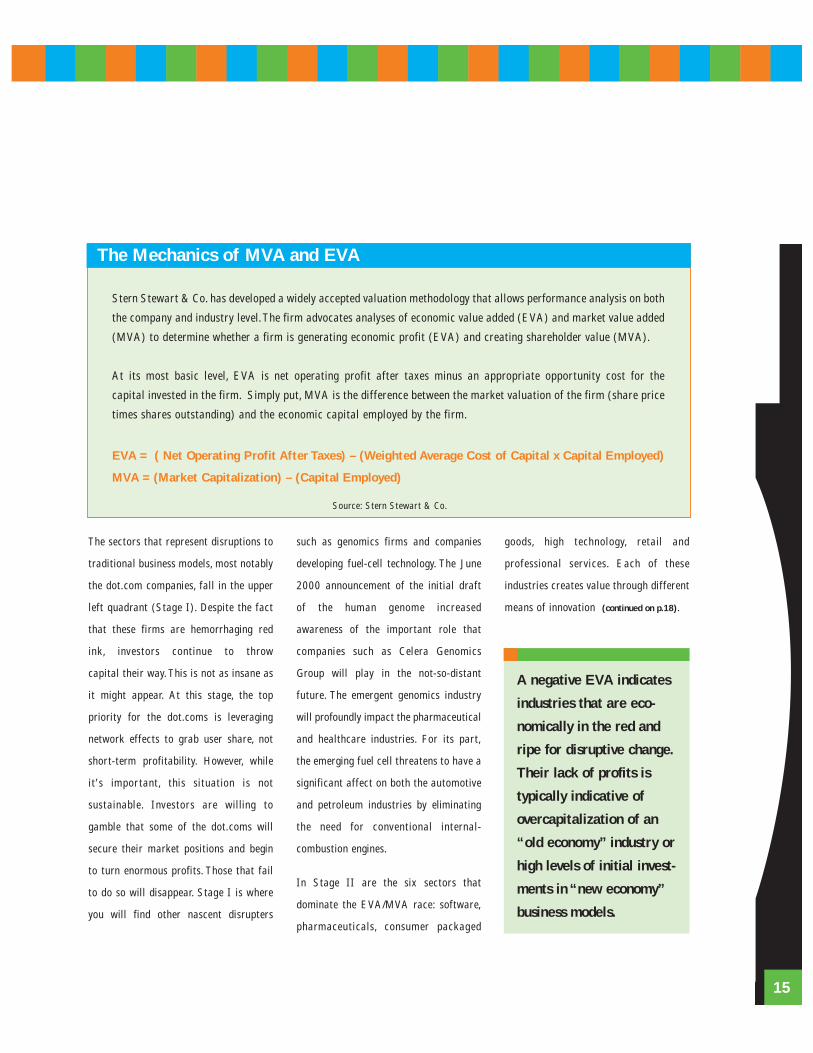
The Mechanics of MVA and EVA
Stern Stewart & Co. has developed a widely accepted valuation methodology that allows performance analysis on both
the company and industry level.The firm advocates analyses of economic value added (EVA) and market value added
(MVA) to determine whether a firm is generating economic profit (EVA) and creating shareholder value (MVA).
At its most basic level, EVA is net operating profit after taxes minus an appropriate opportunity cost for the
capital invested in the firm. Simply put, MVA is the difference between the market valuation of the firm (share price
times shares outstanding) and the economic capital employed by the firm.
EVA = ( Net Operating Profit After Taxes) – (Weighted Average Cost of Capital x Capital Employed)
MVA = (Market Capitalization) – (Capital Employed)
Source: Stern Stewart & Co.
A negative EVA indicates
industries that are eco-
nomically in the red and
ripe for disruptive change.
Their lack of profits is
typically indicative of
overcapitalization of an
“old economy” industry or
high levels of initial invest-
ments in “new economy”
business models.
Product-oriented firms often have more
discrete business models that allow for
direct analysis of the effects of innova-
tion on value creation. We chose to
analyze the performance of the top U.S.-
based pharmaceutical companies – a
decision bolstered by a recent study con-
ducted at McMaster University which, by
examining total R&D investment and
R&D investments relative to sales,
ranked top R&D-based innovation
industries as:
1. Pharmaceuticals and biotechnology
2. Prepackaged software
3. Telecommunications equipment
4. Semiconductors
As before, we assume that MVA provides
an accurate reflection of value created by
an enterprise. Second, we assume that
the knowledge supplied by people is the
basis of each firm’s intellectual capital
and core competencies. Thus, MVA per
employee can be used as an accurate
measure of the relative performance of
knowledge and competencies within the
firm. Then, market capitalization divided
by capital measures the ability of a firm
to convert capital into shareholder value.
Using 1997 and 1998 data as a basis of
comparison, we can objectively assess the
performance of the ten largest U.S.-
based pharmaceuticals.
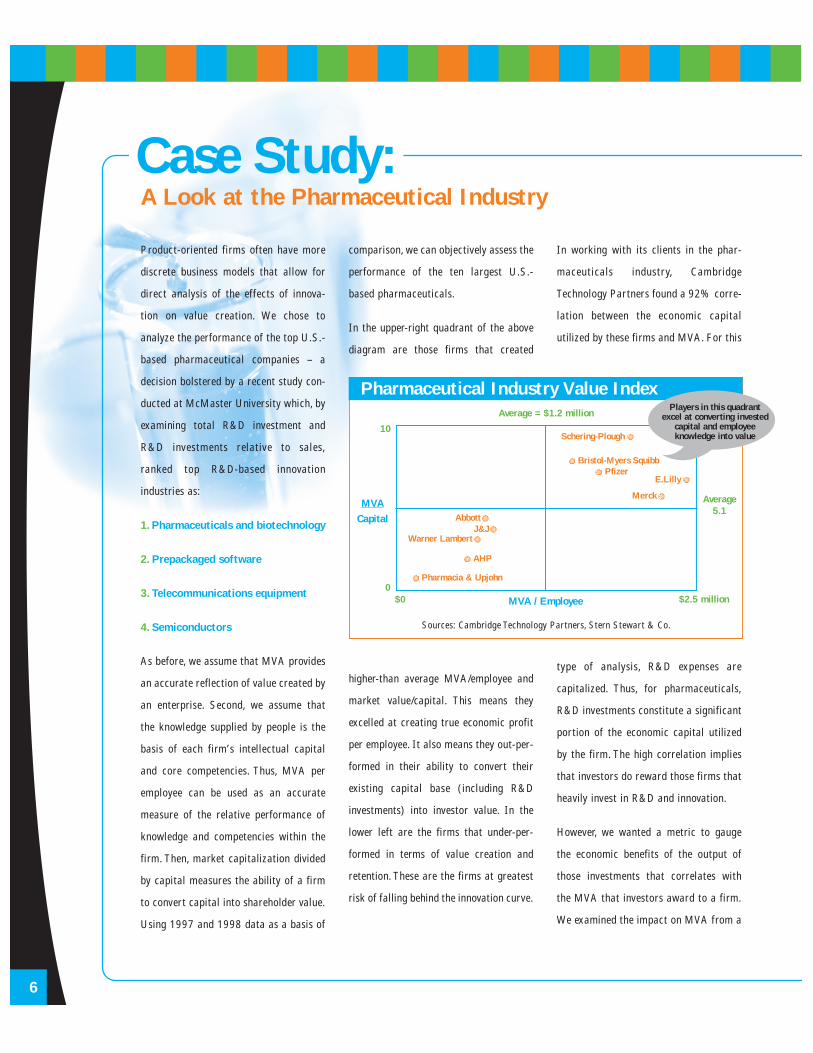
In the upper-right quadrant of the above
diagram are those firms that created
higher-than average MVA/employee and
market value/capital. This means they
excelled at creating true economic profit
per employee. It also means they out-per-
formed in their ability to convert their
existing capital base (including R&D
investments) into investor value. In the
lower left are the firms that under-per-
formed in terms of value creation and
retention. These are the firms at greatest
risk of falling behind the innovation curve.
In working with its clients in the phar-
maceuticals industry, Cambridge
Technology Partners found a 92% corre-
lation between the economic capital
utilized by these firms and MVA. For this
type of analysis, R&D expenses are
capitalized. Thus, for pharmaceuticals,
R&D investments constitute a significant
portion of the economic capital utilized
by the firm. The high correlation implies
that investors do reward those firms that
heavily invest in R&D and innovation.
However, we wanted a metric to gauge
the economic benefits of the output of
those investments that correlates with
the MVA that investors award to a firm.
We examined the impact on MVA from a
Pharmaceutical Industry Value Index
Sources: Cambridge Technology Partners, Stern Stewart & Co.
MVACapital
Average5.1
Average = $1.2 million
$2.5 million$00
10
MVA / Employee
AbbottJ&J
Warner Lambert
AHP
Pharmacia & Upjohn
Schering-Plough
Bristol-Myers SquibbPfizer
E.Lilly
Merck
Players in this quadrant excel at converting invested
capital and employee knowledge into value
6
Case Study:A Look at the Pharmaceutical Industry
number of operational factors within the
control of each firm. By comparing
changes in operational factors to changes
in MVA, we developed an understanding
of which factors strongly influence MVA.
We found that MVA for pharmaceutical
companies is strongly linked to their
ability to rejuvenate revenue through the
introduction of new products. In fact,
those firms with the highest levels of
revenue replenishment tended to be in the
upper-right quadrant of the graph.
This linkage between new product
revenue and MVA is entirely logical. The
goal of R&D investments is to prime the
product pipeline; therefore, successful
R&D investment should result in continu-
ally refreshed product revenue streams.
Working with 1997 industry data, we
have determined that the MVA for
pharmaceutical firms has a direct
correlation to the rate at which revenues
can be rejuvenated through the introduc-
tion of new products. For these purposes,
we considered revenue from products
that were five years old or younger to be
“new revenue.” We employed a five-year
threshold based on expected product life
cycles and rates of competition and
substitution experienced by the industry.
In general, pharmaceuticals that derive a
higher percentage of revenues from
products that are five years old or
younger have higher MVA/employee.
Similarly, revenue rejuvenation is strongly
linked to the ability of these firms to
invent, patent and commercialize new
products. By examining the relationship
of these operational activities to the reju-
venation of revenues, we have developed
a method to predict the impact (or
elasticity) on MVA/employee from an
increase in the rate of innovation and
commercialization of new products. This
formula predicts that a 1% change in the
amount of revenue derived from new
products would produce the indicated
change in MVA/employee for each of the
firms given their existing percentage of
new revenues.
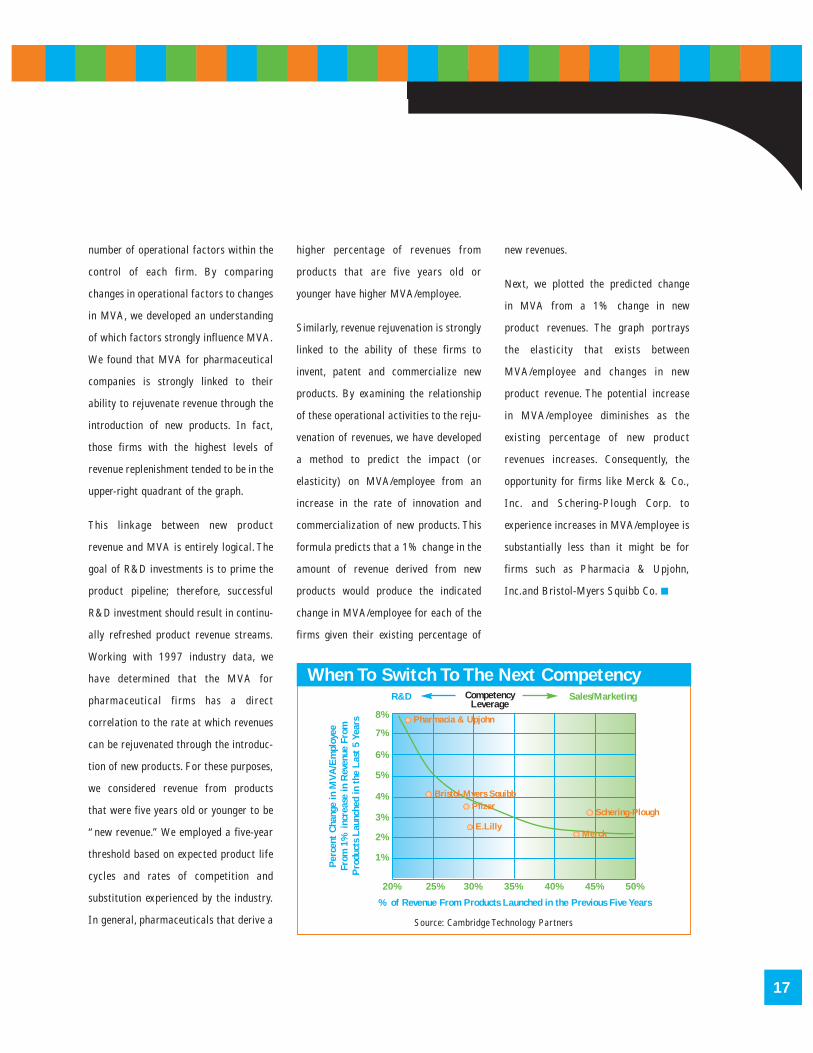
Next, we plotted the predicted change
in MVA from a 1% change in new
product revenues. The graph portrays
the elasticity that exists between
MVA/employee and changes in new
product revenue. The potential increase
in MVA/employee diminishes as the
existing percentage of new product
revenues increases. Consequently, the
opportunity for firms like Merck & Co.,
Inc. and Schering-Plough Corp. to
experience increases in MVA/employee is
substantially less than it might be for
firms such as Pharmacia & Upjohn,
Inc.and Bristol-Myers Squibb Co.
17
When To Switch To The Next Competency
Source: Cambridge Technology Partners
% of Revenue From Products Launched in the Previous Five Years
Per
cent
Cha
nge
in M
VA/E
mpl
oyee
Fr
om 1
% in
crea
se in
Rev
enue
Fro
mP
rodu
cts
Lau
nche
d in
the
Las
t 5
Year
s
20% 25% 30% 35% 40% 45% 50%
1%
2%
3%
4%
5%
6%
7%
8% Pharmacia & Upjohn
Bristol-Myers Squibb
E.Lilly
Pfizer
Merck
Schering-Plough
R&D CompetencyLeverage
Sales/Marketing
The software industry creates
the ultimate intangible. You
don’t actually buy software –
you pay for the right to use the
software. Low production costs
lead to huge margins and eco-
nomic profits. This, in turn,
results in substantial MVA for
players like Microsoft.
The same intellectual-capital
dynamics apply to the profes-
sional-services industry.
Pharmaceuticals add value by
transforming research-intensive
laboratory efforts into useful
(and commercially viable)
drugs. Patent protection allows
monopolistic pricing, which
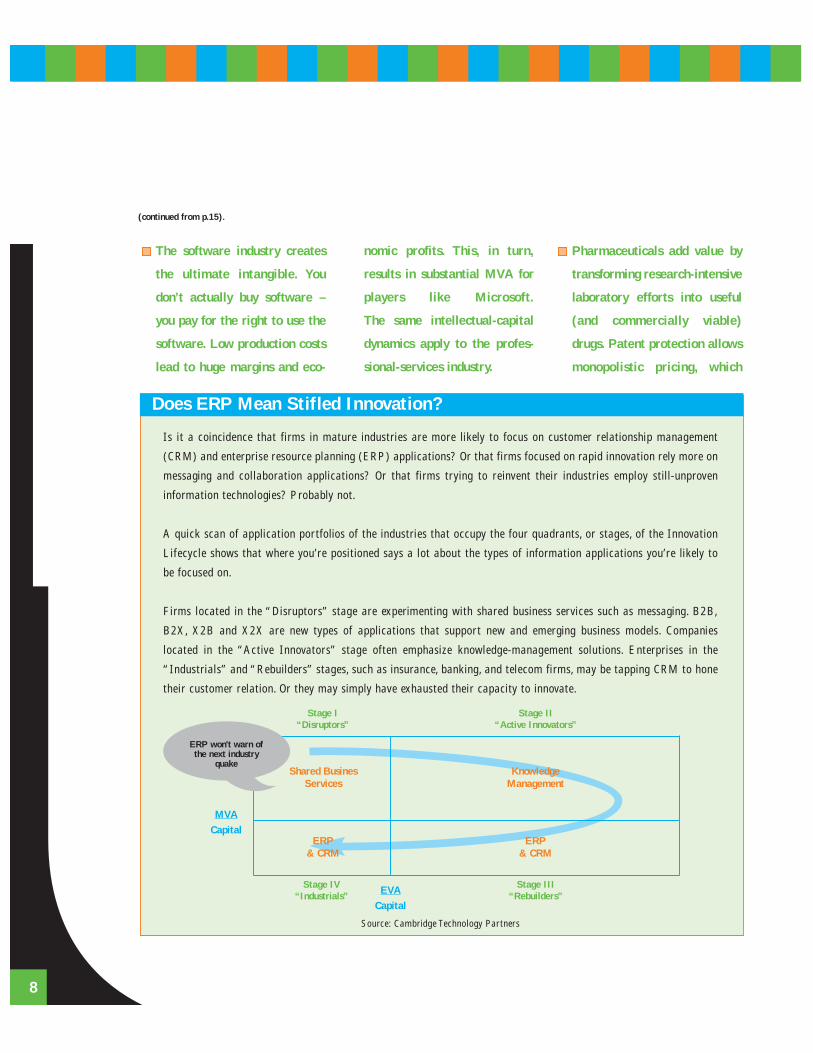
Does ERP Mean Stifled Innovation?
Is it a coincidence that firms in mature industries are more likely to focus on customer relationship management
(CRM) and enterprise resource planning (ERP) applications? Or that firms focused on rapid innovation rely more on
messaging and collaboration applications? Or that firms trying to reinvent their industries employ still-unproven
information technologies? Probably not.
A quick scan of application portfolios of the industries that occupy the four quadrants, or stages, of the Innovation
Lifecycle shows that where you’re positioned says a lot about the types of information applications you’re likely to
be focused on.
Firms located in the “Disruptors” stage are experimenting with shared business services such as messaging. B2B,
B2X, X2B and X2X are new types of applications that support new and emerging business models. Companies
located in the “Active Innovators” stage often emphasize knowledge-management solutions. Enterprises in the
“Industrials” and “Rebuilders” stages, such as insurance, banking, and telecom firms, may be tapping CRM to hone
their customer relation. Or they may simply have exhausted their capacity to innovate.
Source: Cambridge Technology Partners
MVACapital
Stage IV“Industrials”
Stage III“Rebuilders”
Stage I“Disruptors”
Stage II“Active Innovators”
Shared BusinesServices
KnowledgeManagement
ERP & CRM
ERP & CRM
8
(continued from p.15).
EVACapital
ERP won't warn of the next industry
quake
ensures long-term profitability
for successful drugs. This
protection offsets the risk asso-
ciated with development cycles
that can be as long as 15 years.
Innovations in consumer pack-
aged goods center on brand
management. They create
economic profits (and investor
value) by constantly refreshing,
repackaging and extending
product lines. The Coca-Cola
Co., the second-highest MVA
creator, excels at this.
The high-technology sector
exhibits the ability to quickly
innovate in industries that are
governed by Moore’s Law
and experience rapid shorten-
ing of product cycles. Think
about Cisco Systems Inc. and
Intel Corp.
Led by Wal-Mart Stores Inc.,
the retail sector emphasizes
both process innovation as well
as significant amounts of data
analysis to increase operational
efficiencies.
The other quadrants of the chart bear
examination. Most sectors in Stage III
are undergoing structural transforma-
tions. As such, the sectors in this quad-
rant represent areas that are ripe for
intermediaries to step in to facilitate
transactions. In life insurance, Internet
purchases will increasingly challenge the
traditional agent.The pressure to restruc-
ture in the chemicals industry precipitat-
ed the formation of the Chemdex market
exchange. By participating in e-markets,
many of the players in these sectors could
expand their served markets.
The “industrial” economy sectors are
concentrated in Stage IV. These indus-
tries are falling behind on both the EVA
and MVA fronts. Historically, these sec-
tors reaped profits through leveraging
economies of scale to produce commodi-
ties. Now industries such as financial serv-
ices are experiencing the power of the
Internet as a deconstruction catalyst. The
integrated business models of the banking
industry are rapidly unraveling.
Customers can now surf to institutions
anywhere on the globe to get the best
deals. The challenge for for many Stage
III industries is to disentangle the infor-
mational, or knowledge, component of
the commodity from the actual produc-
tion or delivery of the service.
Linking the Innovation Lifecycle
to the Hierarchy
Mapping the EVA and MVA characteris-
tics back to the innovation hierarchy yields
some profound insights. First, the forces
of EVA and MVA reach an
equilibrium that straddles disruptive and
incremental innovation. The implication is
that incremental innovation is required to
sustain your current business, while
disruptive innovations are needed
to renew your business. This calls for a
The forces of EVA
and MVA reach an
equilibrium that straddles
disruptive and incremental
innovation. The implica-
tion is that incremental
innovation is required
to sustain your current
business, while disruptive
innovations are needed
to renew your business.
This calls for a portfolio
approach to managing
innovation.
19
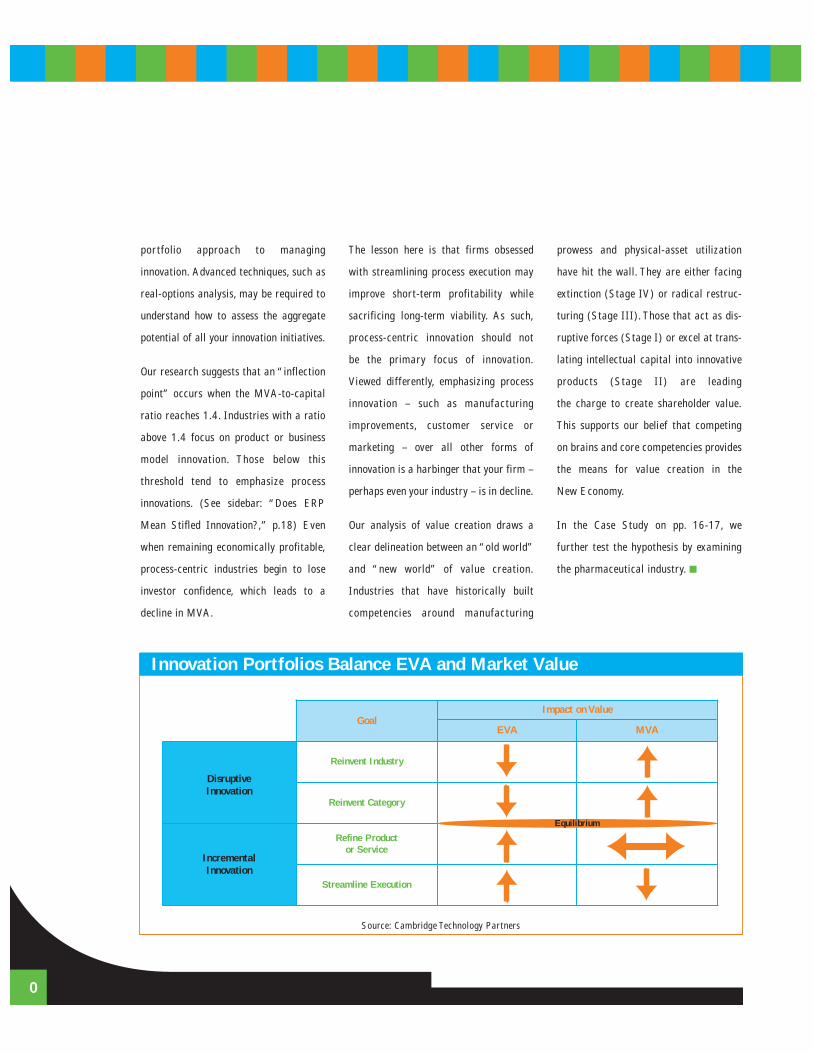
portfolio approach to managing
innovation. Advanced techniques, such as
real-options analysis, may be required to
understand how to assess the aggregate
potential of all your innovation initiatives.
Our research suggests that an “inflection
point” occurs when the MVA-to-capital
ratio reaches 1.4. Industries with a ratio
above 1.4 focus on product or business
model innovation. Those below this
threshold tend to emphasize process
innovations. (See sidebar: “Does ERP
Mean Stifled Innovation?,” p.18) Even
when remaining economically profitable,
process-centric industries begin to lose
investor confidence, which leads to a
decline in MVA.
The lesson here is that firms obsessed
with streamlining process execution may
improve short-term profitability while
sacrificing long-term viability. As such,
process-centric innovation should not
be the primary focus of innovation.
Viewed differently, emphasizing process
innovation – such as manufacturing
improvements, customer service or
marketing – over all other forms of
innovation is a harbinger that your firm –
perhaps even your industry – is in decline.
Our analysis of value creation draws a
clear delineation between an “old world”
and “new world” of value creation.
Industries that have historically built
competencies around manufacturing
prowess and physical-asset utilization
have hit the wall. They are either facing
extinction (Stage IV) or radical restruc-
turing (Stage III). Those that act as dis-
ruptive forces (Stage I) or excel at trans-
lating intellectual capital into innovative
products (Stage II) are leading
the charge to create shareholder value.
This supports our belief that competing
on brains and core competencies provides
the means for value creation in the
New Economy.
In the Case Study on pp. 16-17, we
further test the hypothesis by examining
the pharmaceutical industry.
Innovation Portfolios Balance EVA and Market Value
Source: Cambridge Technology Partners
Reinvent Category
Goal
DisruptiveInnovation
IncrementalInnovation
Streamline Execution
Impact on Value
MVA
Reinvent Industry
Refine Product or Service
Equilibrium
EVA
0

Rating Your Innovation CapacityDiagnostics:
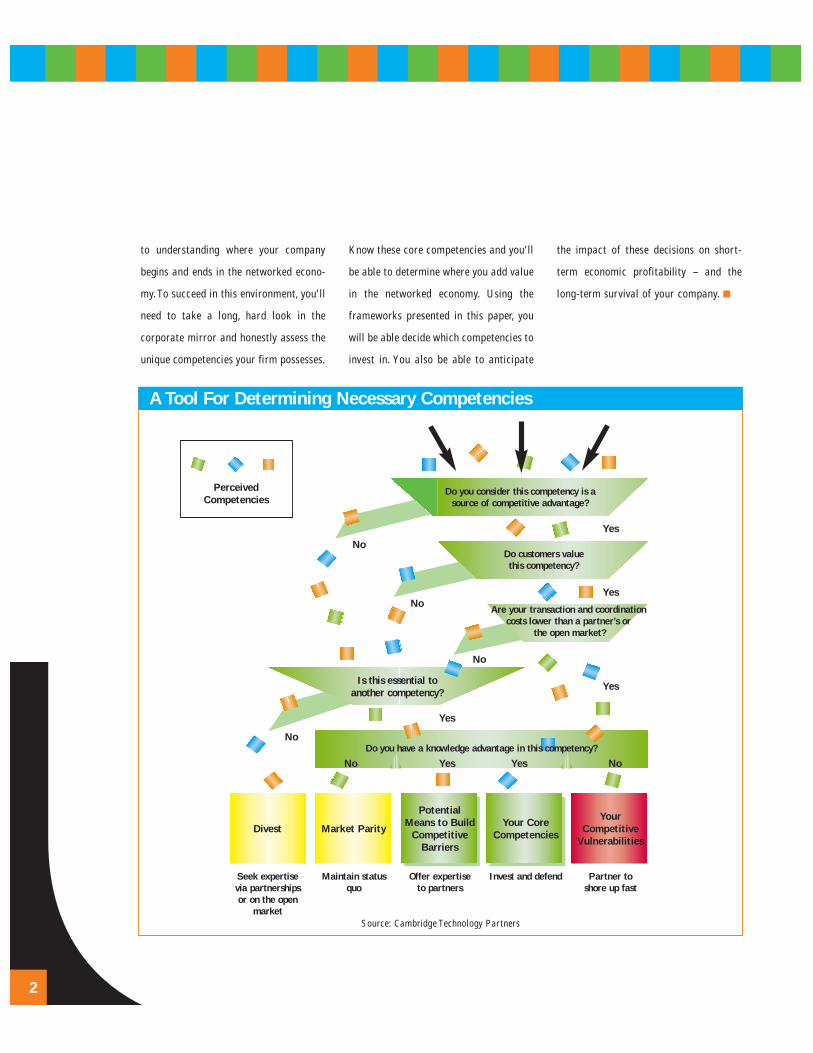
A pragmatic first step to understanding
your core competencies is to decompose
your value chain into its major business
processes. Next, you need to map the
information and intellectual-capital
resources required to perform each
process step.
Which of these resources constitute
areas where you have a defensible knowl-
edge advantage over competitors?
The chart on p.22 – which is based, in
part, on the work of economist James
Brian Quinn – will help you arrive at a set
of true core competencies, and a set of
supporting competencies, as well as a set
that would be better executed by
partners. In the New Economy, each
component of the value chain can be
optimized through partnerships and
alliances. This, in turn, increases the
overall value delivered to customers.
Now, map your intellectual assets and
knowledge advantages to the core
competencies. Competencies in which you
have a solid knowledge advantage are
your sweet spot. This is where your firm
truly creates value. Competencies where
you don’t have a clear knowledge advan-
tage are competitive vulnerabilities.
There are two choices: to invest heavily
to shore up these areas, or to partner
strategically to fill the gaps.
Supporting competencies with a knowl-
edge advantage also present two options.
First, they are a potential first line
of defense when protecting your core
competencies. Second, they are areas of
expertise that you can offer to partners
to strengthen your relationships. Finally,
supporting competencies that yield no
knowledge advantage represent areas
where it’s important to maintain the
status quo.
Finally, see where your core competencies
fall on the charts we’ve built throughout
this paper. The matrices on pp.12-13
show the market-dominance goal that the
competency supports.They also provide a
rough cut at the mix of competency
capital (intellectual, relationship, struc-
tural) that is required to successfully
implement your competencies.
In addition, the grid on p.20 indicates the
relative impact of each competency on
economic profitability (EVA) and
long-term viability (MVA). For example,
the design-and-development competency
supports the goal of maintaining market
dominance through incremental product
enhancements. It requires a balanced mix
of intellectual, relationship and structur-
al capital (see chart on p.13). Economic
profitability should be improved, while
MVA levels are sustained.
The matrices can also help identify
potential competency gaps. For example,
suppose your firm fits the profile of an
incremental product innovator. You
believe that the introduction of new
technologies could upset your current
market, so you decide to add some
disruptive product-innovator initiatives
to your innovation portfolio. Using the
matrices, you will need to add more
research expertise, most likely through
partnership (there’s no time to grow
it yourself.)
Required investments may mean a
negative hit on short-term profitability
(EVA). Yet, if successful, your MVA will
improve.
Next Steps
Understanding the linkages between
innovation and value creation is essential
21
Use this self-diagnostic to determine the health of yourinnovation effort.
to understanding where your company
begins and ends in the networked econo-
my.To succeed in this environment, you’ll
need to take a long, hard look in the
corporate mirror and honestly assess the
unique competencies your firm possesses.
Know these core competencies and you’ll
be able to determine where you add value
in the networked economy. Using the
frameworks presented in this paper, you
will be able decide which competencies to
invest in. You also be able to anticipate
the impact of these decisions on short-
term economic profitability – and the
long-term survival of your company.
A Tool For Determining Necessary Competencies
Source: Cambridge Technology Partners
2
Yes
Yes
Yes
NoYesYes
Yes
No
No
No
No
No
Is this essential to another competency?
Divest
Seek expertisevia partnershipsor on the open
market
Maintain statusquo
Offer expertise to partners
Invest and defend Partner to shore up fast
Market Parity
PotentialMeans to Build
CompetitiveBarriers
Your CoreCompetencies
YourCompetitive
Vulnerabilities
Do you consider this competency is a source of competitive advantage?
Do customers value this competency?
Do you have a knowledge advantage in this competency?
Are your transaction and coordinationcosts lower than a partner’s or
the open market?
Perceived Competencies

“The Discipline of MarketLeaders”Michael Treacy and FredWiersema, Addison-WesleyPublishing Company, 1995
“The Sixth Extinction: Patternsof Life and the Future of HumanKind”Richard Leakey and Roger Lewin,Doubleday Books, 1995
“The Victorian Internet : TheRemarkable Story of theTelegraph and the NineteenthCentury's On-Line Pioneers”Tom Standage, Walker & Co.,1998
“The Diversity of Life”Edward O. Wilson, Belknap Press,1992
“The New Economy Primer”John Kerr, Kirk Klasson,Cambridge Technology Partners,June 1999
“The Innovator’s Dilemma”Clayton M. Christensen, HarvardBusiness School Press, 1997
“Increasing Returns and the New World of Business”W. Brian Arthur,Harvard Business Review,July-August 1996
“An Interview with Paul M.Romer”Joel Kurtzman, Strategy andBusiness, First Quarter 1997
“How a Firm’s Capabilities AffectBoundary Decisions”Jay B. Barney, Sloan ManagementReview,Spring 1999
“Introducing the Value CreationIndex”Geoff Baum, Chris Ittner, DavidLarcker, Jonathan Low,TonySiesfeld and Michael S. Malone,Forbes ASAP, April 3, 2000
“Identifying ‘Super-Technology’Industries”John W. Medcof, ResearchTechnology Management,July 1999
“Strategic Outsourcing:Leveraging KnowledgeCapabilities”James Brian Quinn, SloanManagement Review,Summer 1999
23
Further Browsing:Sources And References

Other White PapersIn The New Economy Series
New Economy Primer
No business will be untouched by the New Economy. It will affect the way in which your
organization must interact with customers, suppliers, and employees, and it may
provoke alliances with competitors and with temporary partners whose value-added you
can't yet imagine. In this white paper, the first in the New Economy series from
Cambridge Technology Partners, the New Economy is defined and characterized in ways
that prompt businesses to gauge their vulnerability in the new competitive environment
and encourage them to imagine themselves as New Economy success stories.
Rethinking Customer Acquisition
The Web is commonly viewed as an ideal mechanism for acquiring customers, especially
when compared with proven but costly approaches such as advertising and direct mail.
And many are enchanted with the ease with which it scales to reach more prospects.
But in a medium where business models are evolving faster than the technology they're
built upon, e-markets – electronic mosaics of buyers and sellers – often prove much
more effective at driving the right new customers in your direction. Learn more in
Rethinking Customer Acquisition, the second in the New Economy series from
Cambridge Technology Partners.
Business Models for the New Economy
We've lived so long with the “vertical” organizational structure – the hierarchical busi-
ness model – that it would be reasonable to assume it's irreplaceable. Not so. Now that
the Internet is encouraging a natural selection of organization forms into specialized
value-producing and value-exchanging entities, networks and e-markets become highly
effective alternatives. So should your organization be structured differently? Find out
in Business Models for the New Economy, a special edition in the New Economy series
from Cambridge Technology Partners.

Notes:

Cambridge on the Web: ctp.com
Cambridge Technology Partners provides management consulting and systems integration
services to transform its clients into e-Businesses. Working in collaboration with Global
1000, high-velocity middle market companies and dot-com companies, Cambridge combines
a deep understanding of New Economy issues with integrated, end-to-end services, and a
proven track record of shared risk and rapid, guaranteed delivery. Cambridge generated
$628.1 million in revenue in 1999, with $243.3 million from its global e-Business solutions.
Cambridge has approximately 4,000 employees and 53 offices worldwide. Cambridge is a
Safeguard Scientifics (NYSE: SFE) partner company.
Creating Value Through Innovation staff:
Authors: Bob Flanagan, Kirk Klasson
Editor: John Kerr
Designer: Amanda Baldridge
Copy Editor: Paul Hoffman


8 Cambridge CenterCambridge, MA 02142Phone: 617.374.9800Fax: 617.914.8300ctp.com
Sept.2000127.1000©by Cambridge Technology Partners