Embed Size (px)
Citation preview
Creating Value through the Benchmarking of Capital Projects
Measuring the relationshipsbetween
what you get
what you do
and...
Purpose of the Discussion
n Discuss the progress of the process industries in capital effectiveness
n Explore primary drivers of project excellence
n Bring data to some contentious issues
Basis for the Discussion
n Each year Independent Project Analysis (IPA) conducts about 600 project evaluations for the process industries:
Ø oil (upstream and down)Ø chemicalsØ pharmaceuticalsØ mineralsØ consumer productsØ power
n We now have databases containing over 5000 major projects and 1400 small projects
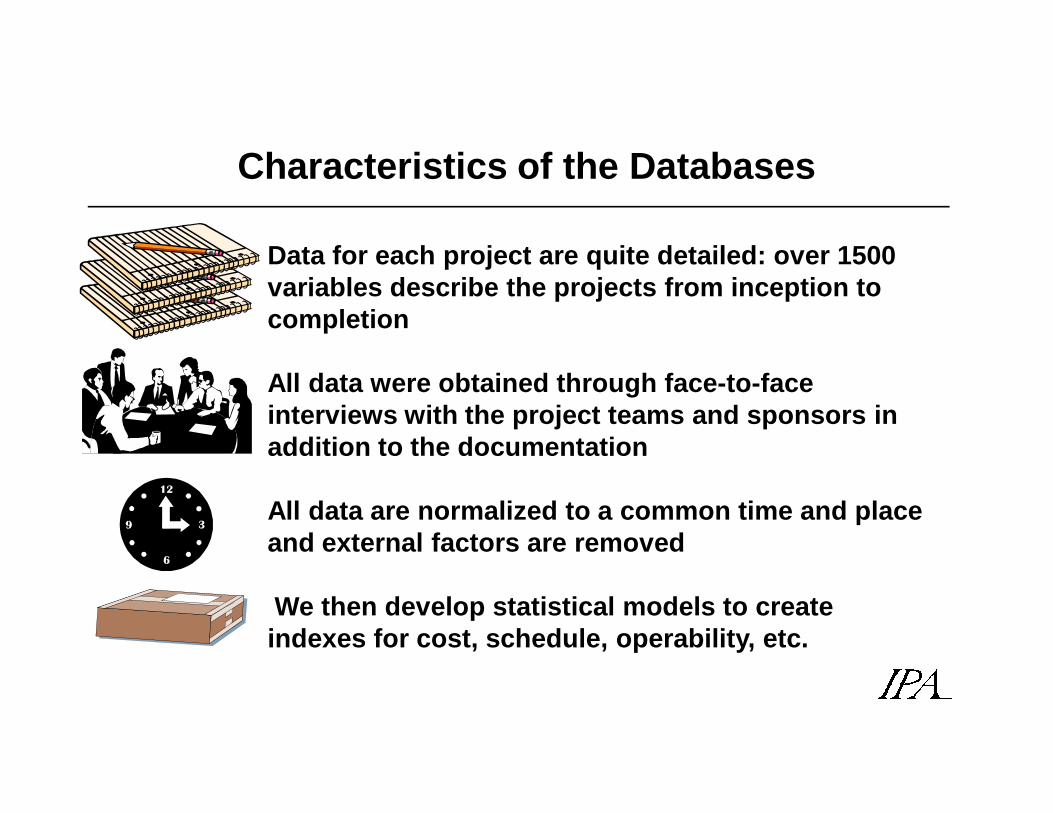
Characteristics of the Databases
Data for each project are quite detailed: over 1500 variables describe the projects from inception to completion
All data were obtained through face-to-face interviews with the project teams and sponsors in addition to the documentation
All data are normalized to a common time and place and external factors are removed
We then develop statistical models to create indexes for cost, schedule, operability, etc.
Outline
þ Keys to improvement
þ The role of contracting strategies
Ø Is fixed-price best?
ØDo incentives work?
Progress in capital effectiveness
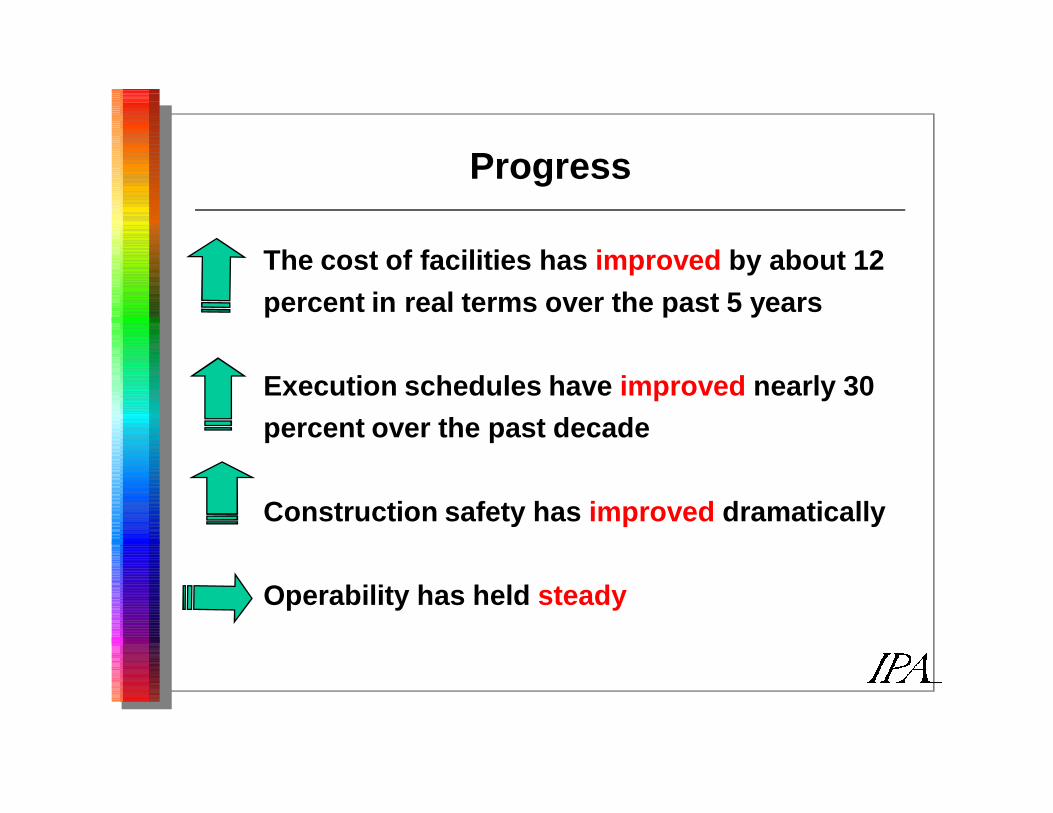
Progress
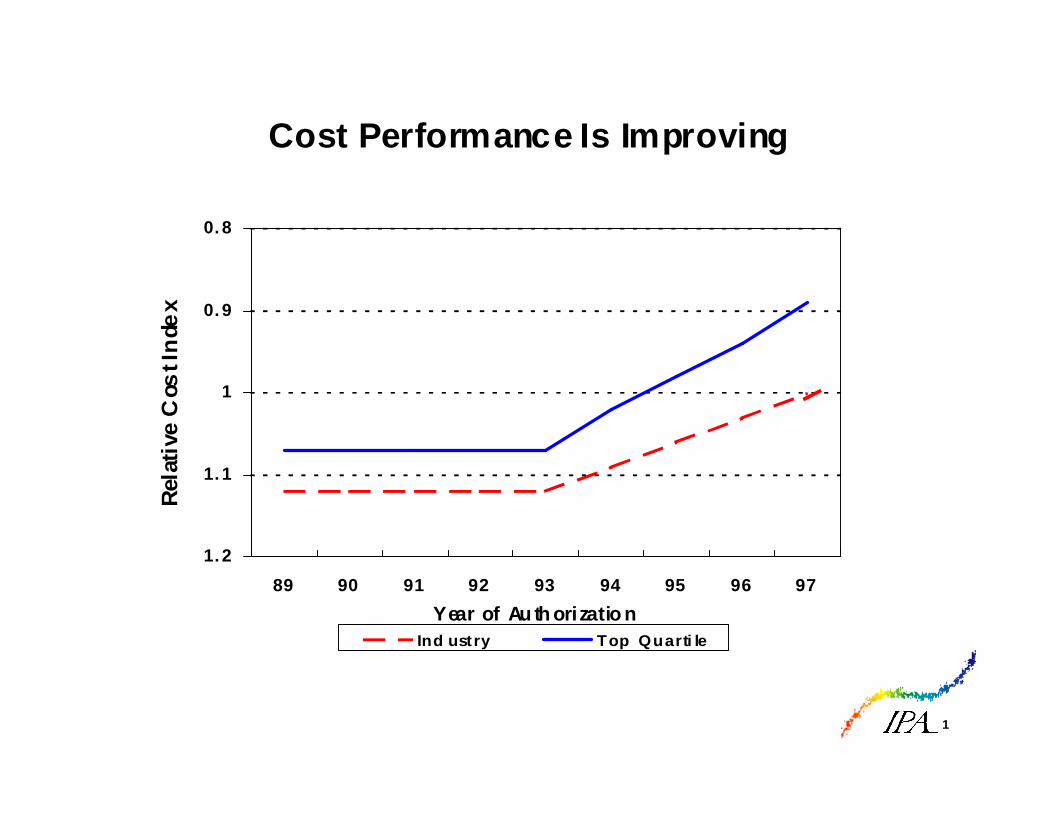
The cost of facilities has improved by about 12 percent in real terms over the past 5 years
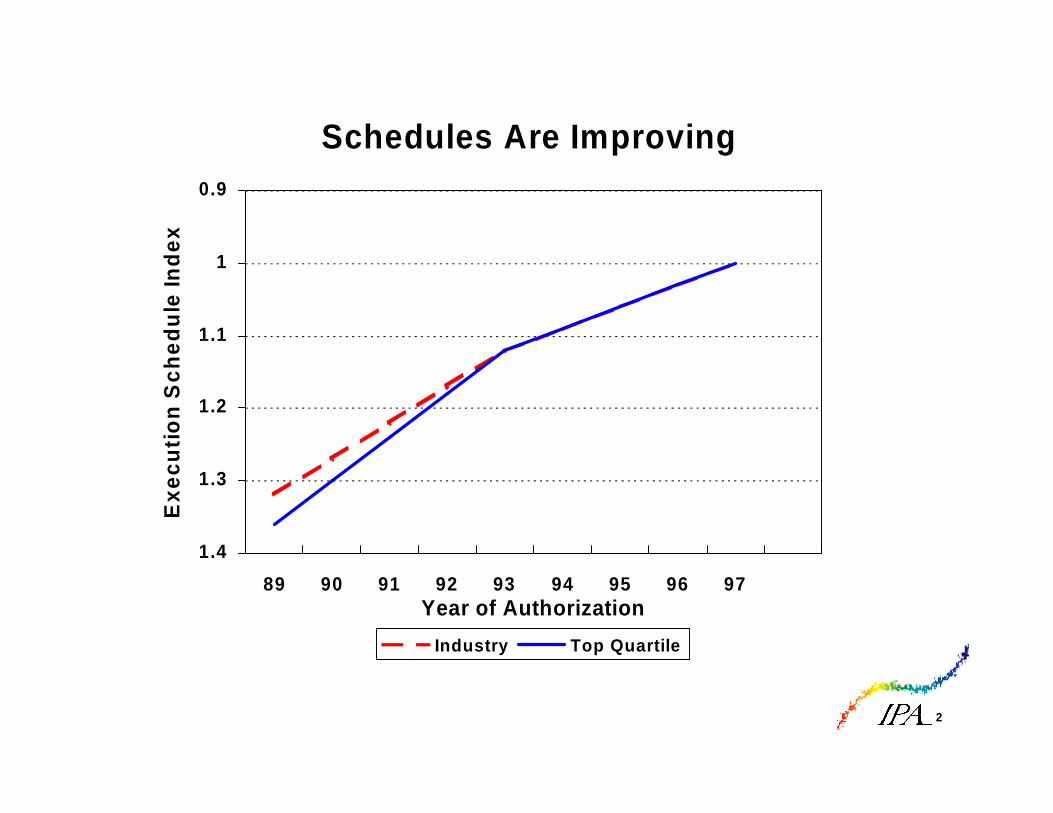
Execution schedules have improved nearly 30 percent over the past decade
Construction safety has improved dramatically
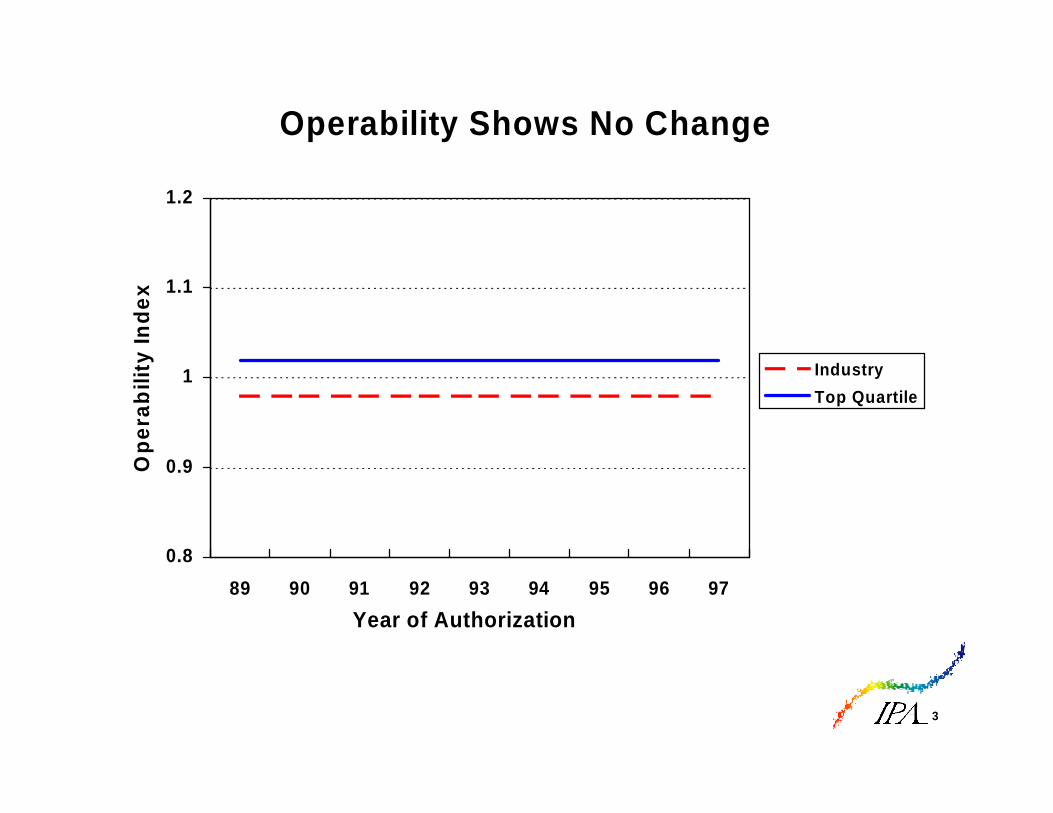
Operability has held steady
CONFIDENTIAL - FOR USE OF I BC CO MPANIES ONLY 1
Cost Performance Is Improving
0. 8
0. 9
1
1. 1
1. 289 90 91 92 93 94 95 96 97
Ind ustry Top Quarti leYear of Au th orizatio n
Rela
tive
Cos
t Ind
ex
CONFIDENTIAL - FOR USE OF IBC COMPANIES ONLY 2
Schedules Are Improving0.9
1
1.1
1.2
1.3
1.489 90 91 92 93 94 95 96 97
Exe
cutio
n S
ched
ule
Inde
x
Industry Top Quartile
Year of Authorization
CONFIDENTIAL - FOR USE OF IBC COMPANIES ONLY 3
Operability Shows No Change
0.8
0.9
1
1.1
1.2
89 90 91 92 93 94 95 96 97
Ope
rabi
lity
Inde
x
IndustryTop Quartile
Year of Authorization
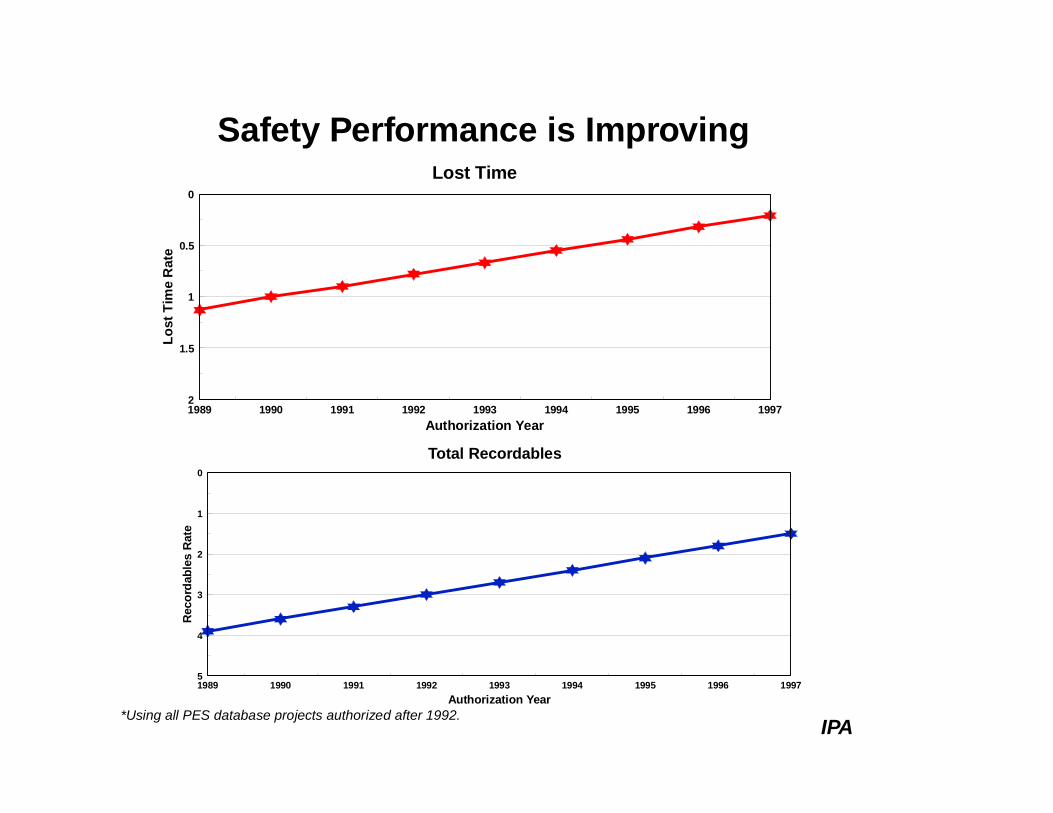
Safety Performance is ImprovingLost Time
1989 1990 1991 1992 1993 1994 1995 1996 1997
0
0.5
1
1.5
2
Authorization Year
Lost
Tim
e R
ate
Total Recordables
1989 1990 1991 1992 1993 1994 1995 1996 1997
0
1
2
3
4
5
Authorization Year
Rec
orda
bles
Rat
e
*Using all PES database projects authorized after 1992.IPA
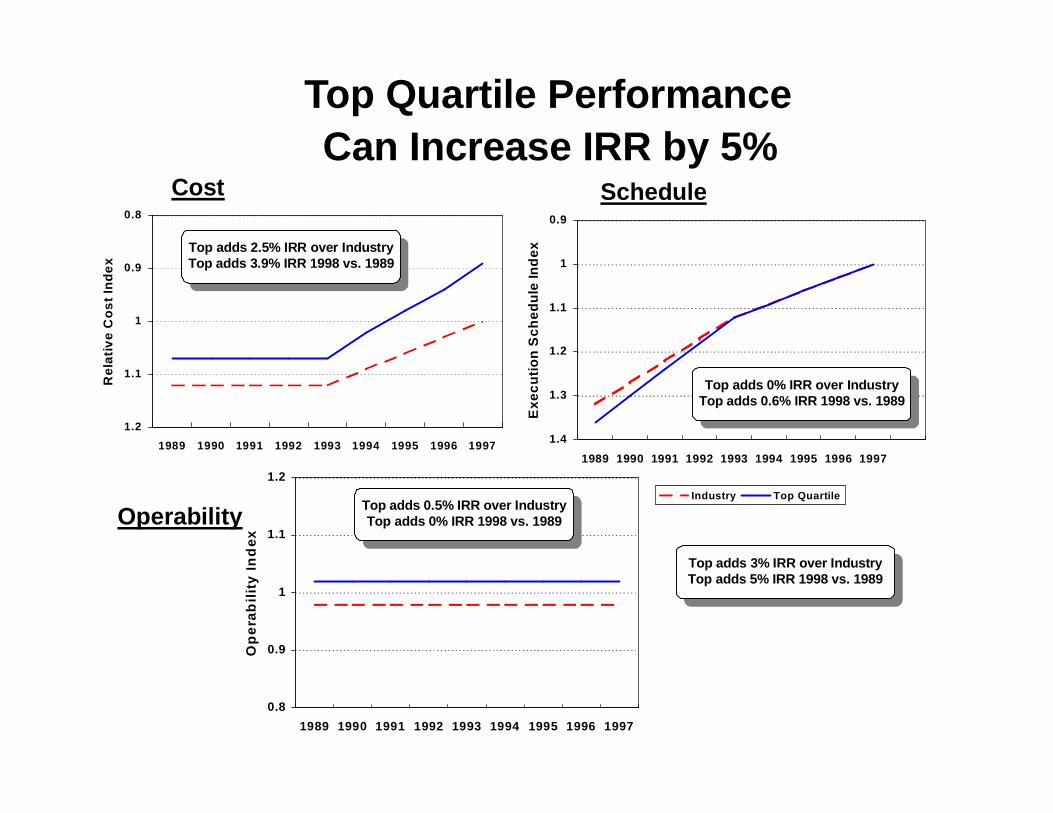
Top Quartile PerformanceCan Increase IRR by 5%
0.9
1
1.1
1.2
1.3
1.41989 1990 1991 1992 1993 1994 1995 1996 1997
Exe
cutio
n S
ched
ule
Inde
x
Industry Top Quartile
0.8
0.9
1
1.1
1.21989 1990 1991 1992 1993 1994 1995 1996 1997
Rel
ativ
e C
ost I
ndex
Cost Schedule
Operability
Top adds 2.5% IRR over IndustryTop adds 3.9% IRR 1998 vs. 1989
Top adds 2.5% IRR over IndustryTop adds 3.9% IRR 1998 vs. 1989
0.8
0.9
1
1.1
1.2
1989 1990 1991 1992 1993 1994 1995 1996 1997
Op
erab
ility
Ind
ex
Top adds 0% IRR over IndustryTop adds 0.6% IRR 1998 vs. 1989
Top adds 0% IRR over IndustryTop adds 0.6% IRR 1998 vs. 1989
Top adds 0.5% IRR over IndustryTop adds 0% IRR 1998 vs. 1989
Top adds 0.5% IRR over IndustryTop adds 0% IRR 1998 vs. 1989
Top adds 3% IRR over IndustryTop adds 5% IRR 1998 vs. 1989
Top adds 3% IRR over IndustryTop adds 5% IRR 1998 vs. 1989
Outline
þ Progress in capital effectiveness
þ Keys to improvement
þ The role of contracting strategies
Ø Is fixed-price best?
Ø Do incentives work?
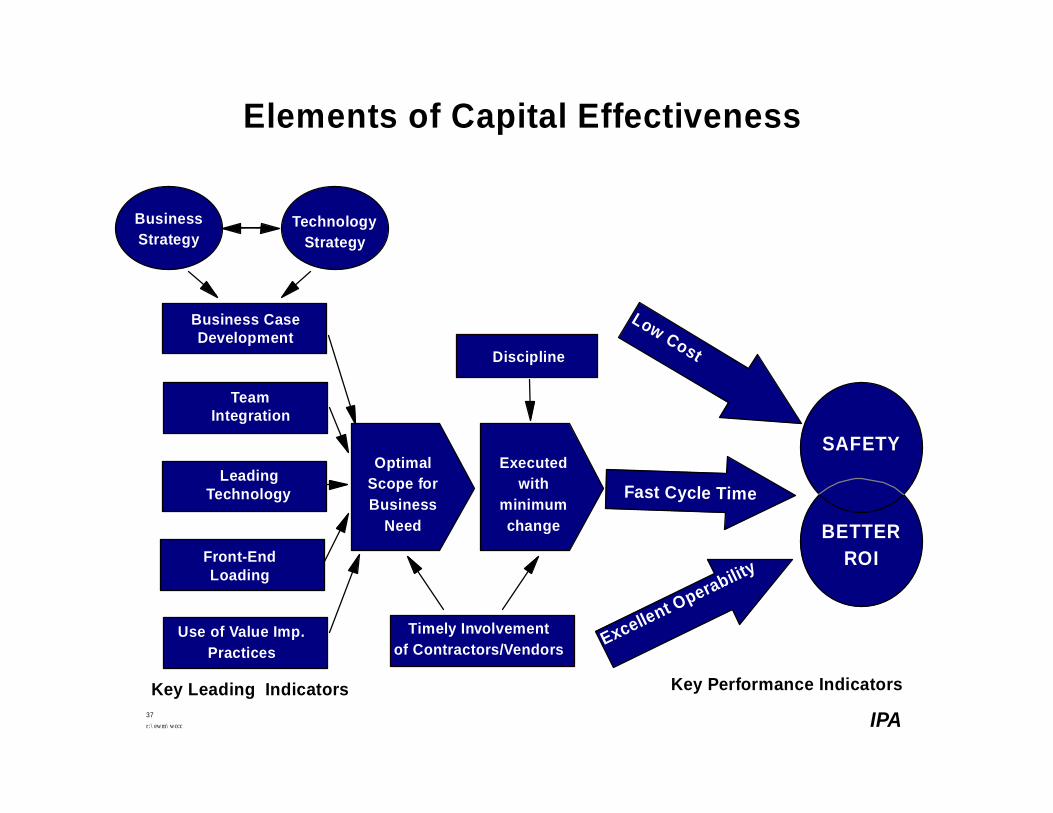
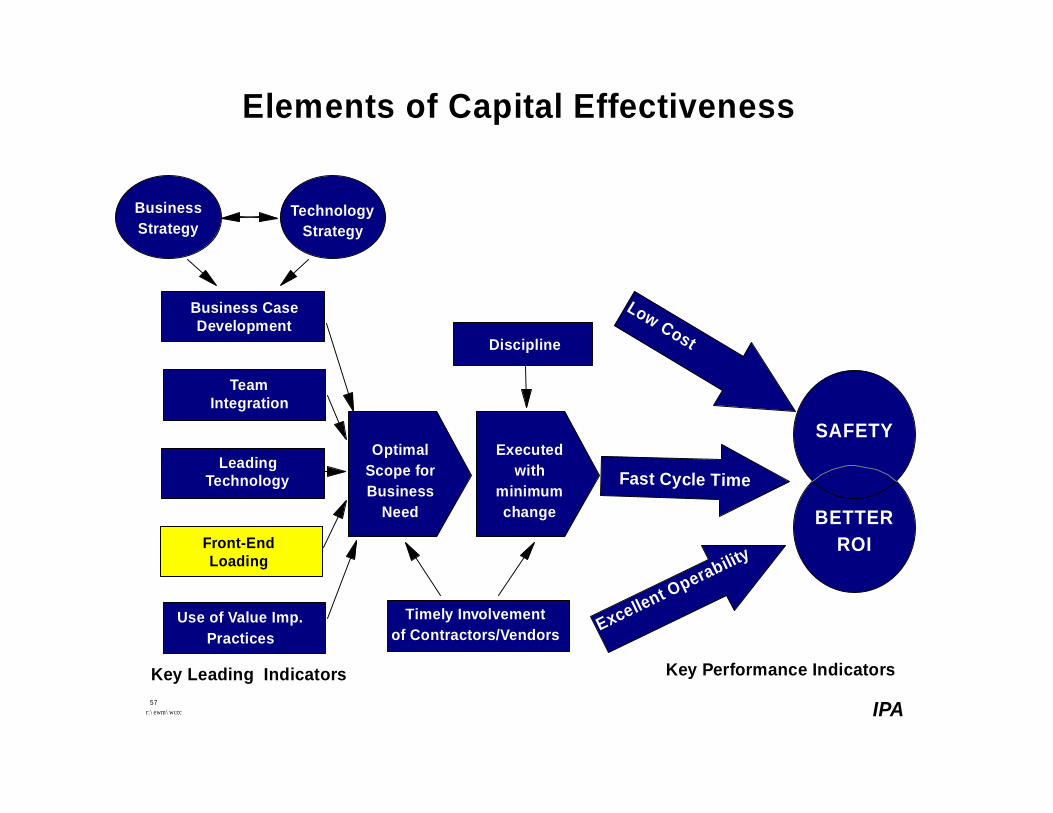
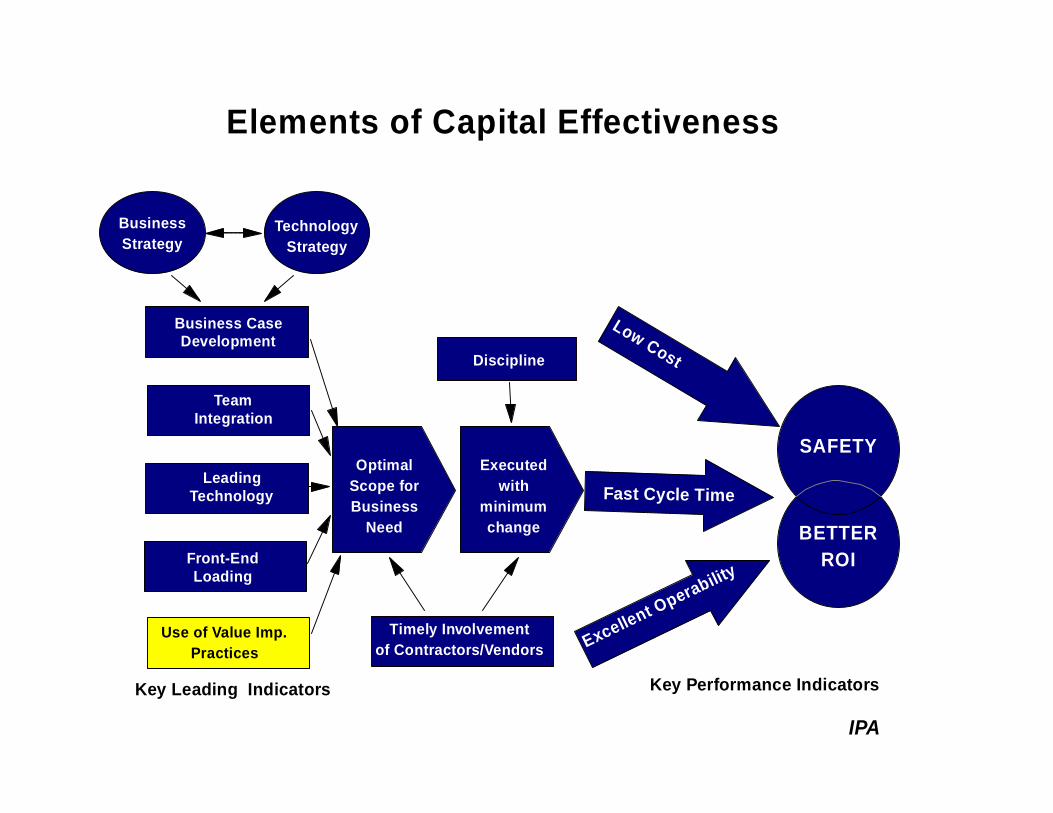
Elements of Capital Effectiveness
Optimal
Scope forBusiness
Need
Executedwith
minimumchange
Front-End Loading
Discipline
Business Case Development
Timely Involvementof Contractors/Vendors
BETTERROI
BusinessStrategy
TechnologyStrategy
Team Integration
Key Performance IndicatorsKey Leading Indicators
Leading Technology
Low Cost
Excellent Operability
Fast Cycle Time
SAFETY
Use of Value Imp.Practices
37r:\ewm\wccc IPA
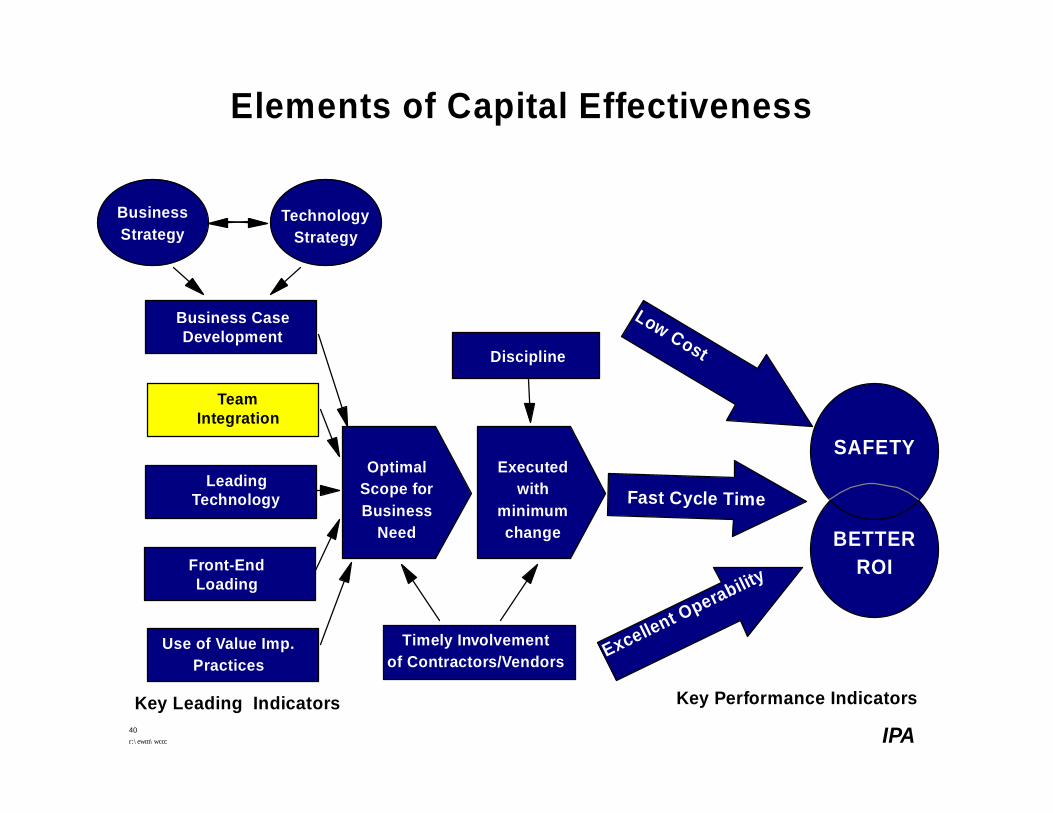
Elements of Capital Effectiveness
Optimal
Scope forBusiness
Need
Executedwith
minimumchange
Front-End Loading
Discipline
Business Case Development
Timely Involvementof Contractors/Vendors
BETTERROI
BusinessStrategy
TechnologyStrategy
Team Integration
Key Performance IndicatorsKey Leading Indicators
Leading Technology
Low Cost
Excellent Operability
Fast Cycle Time
SAFETY
Use of Value Imp.Practices
40r:\ewm\wccc IPA
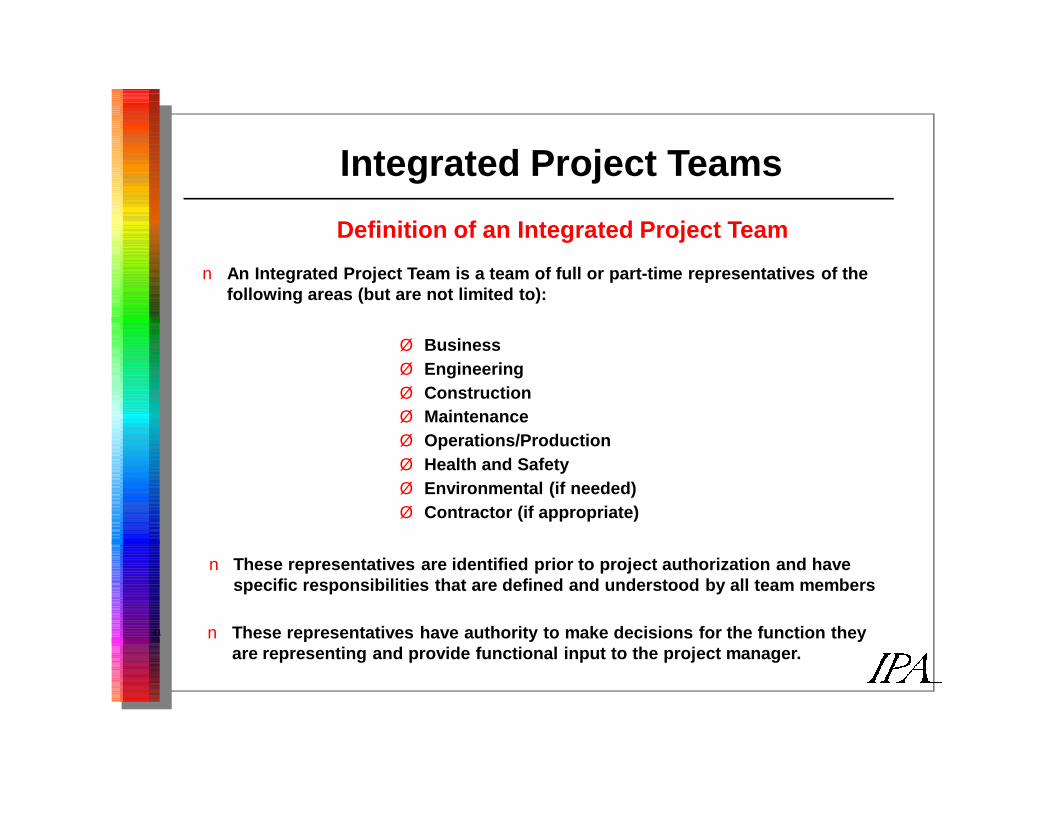
Integrated Project Teams
n An Integrated Project Team is a team of full or part-time representatives of the following areas (but are not limited to):
Ø Business Ø EngineeringØ ConstructionØ MaintenanceØ Operations/ProductionØ Health and SafetyØ Environmental (if needed)Ø Contractor (if appropriate)
n These representatives are identified prior to project authorization and have specific responsibilities that are defined and understood by all team members
n These representatives have authority to make decisions for the function they are representing and provide functional input to the project manager.
Definition of an Integrated Project Team
41
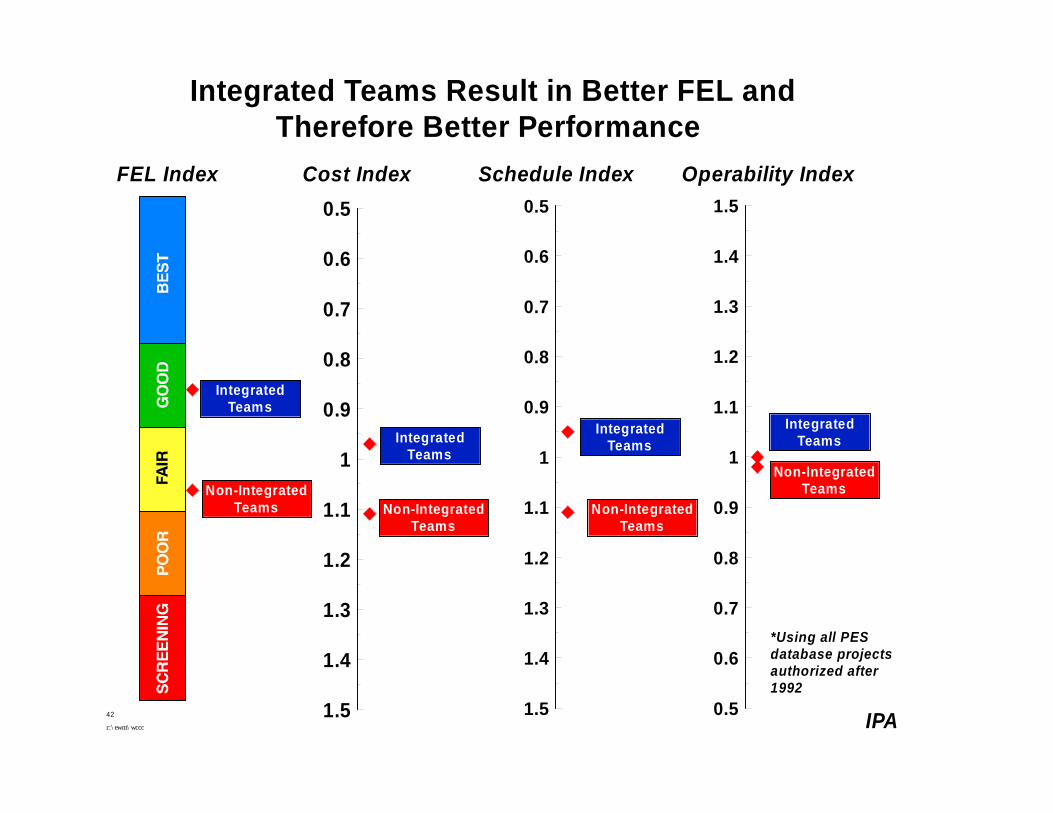
Integrated Teams Result in Better FEL andTherefore Better Performance
0.5
0.6
0.7
0.8
0.9
1
1.1
1.2
1.3
1.4
1.510
1
2
3
4
5
6
Integrated Teams
Non-Integrated Teams
0.5
0.6
0.7
0.8
0.9
1
1.1
1.2
1.3
1.4
1.5
FEL Index Cost Index
Integrated Teams
Non-Integrated Teams
0.5
0.6
0.7
0.8
0.9
1
1.1
1.2
1.3
1.4
1.5
Integrated Teams
Non-Integrated Teams
Integrated Teams
Non-Integrated Teams
Schedule Index Operability Index
*Using all PES database projects authorized after 1992
42
r:\ewm\wccc IPA
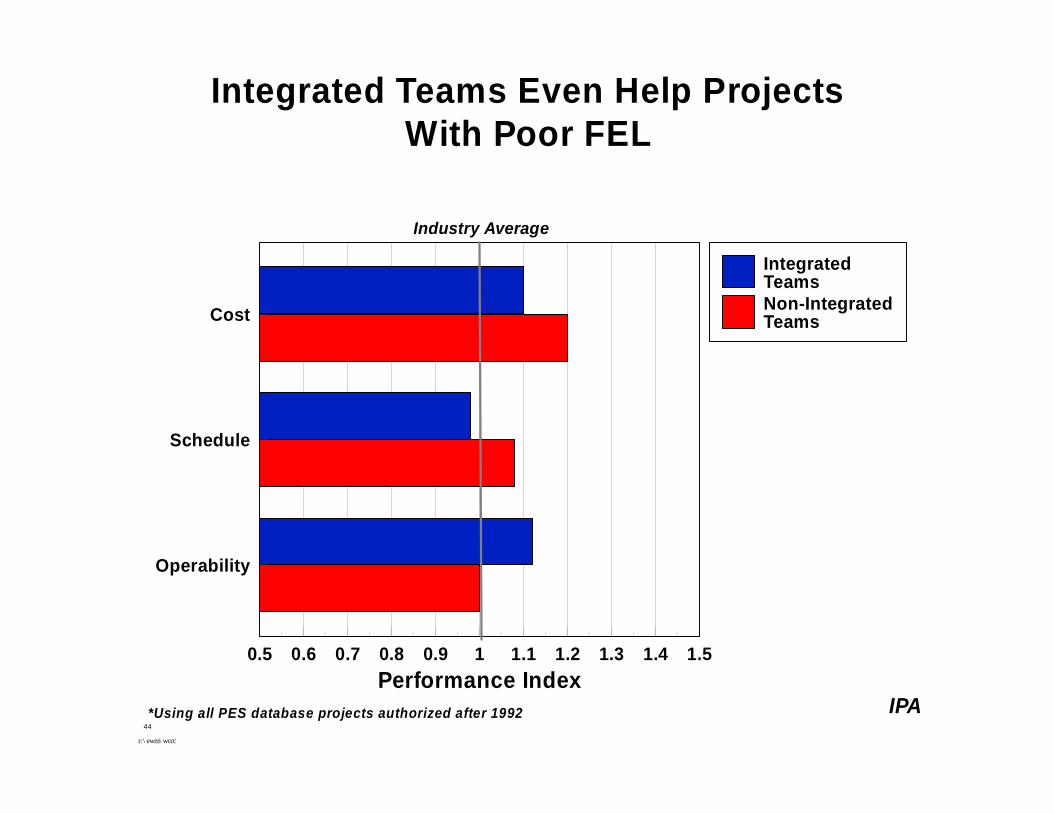
Integrated Teams Even Help ProjectsWith Poor FEL
Cost
Schedule
Operability
0.5 0.6 0.7 0.8 0.9 1 1.1 1.2 1.3 1.4 1.5Performance Index
IntegratedTeamsNon-IntegratedTeams
Industry Average
*Using all PES database projects authorized after 199244
r:\ewm\wccc
IPA
Elements of Capital Effectiveness
Optimal
Scope forBusiness
Need
Executedwith
minimumchange
Front-End Loading
Discipline
Business Case Development
Timely Involvementof Contractors/Vendors
BETTERROI
BusinessStrategy
TechnologyStrategy
Team Integration
Key Performance IndicatorsKey Leading Indicators
Leading Technology
Low Cost
Excellent Operability
Fast Cycle Time
SAFETY
Use of Value Imp.Practices
57r:\ewm\wccc IPA
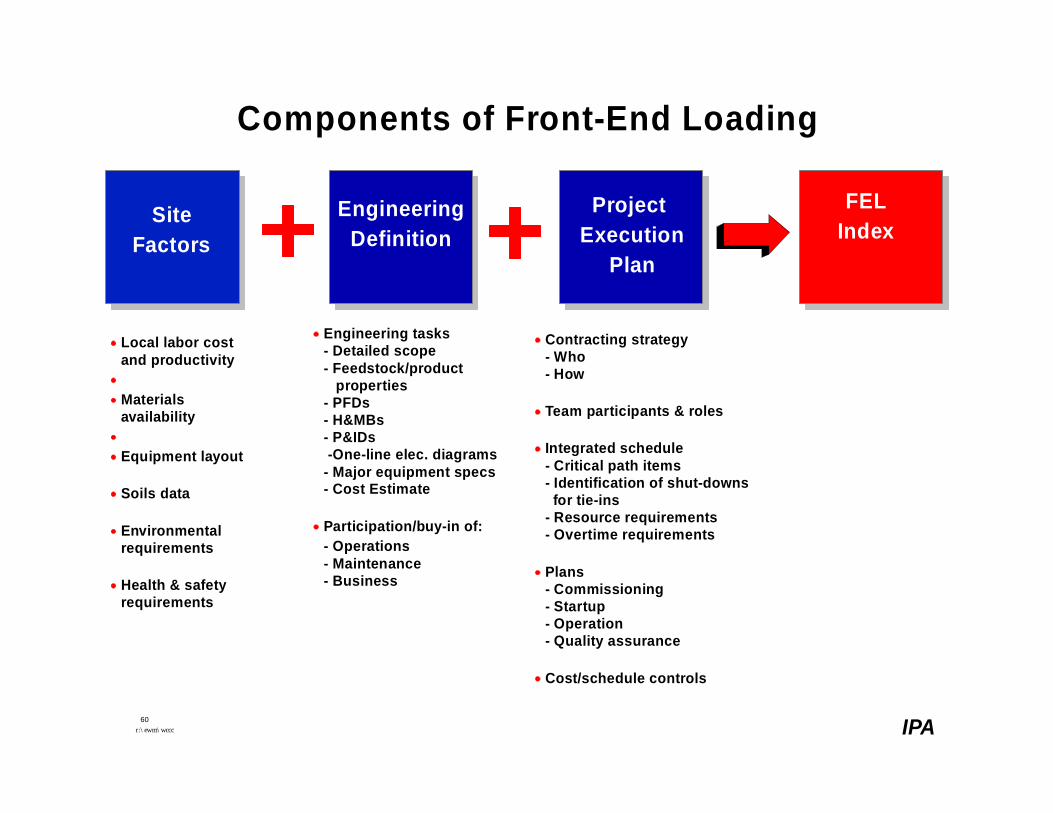
Components of Front-End Loading
SiteFactors
EngineeringDefinition
Project Execution
Plan
FELIndex
Local labor cost and productivity
Materials availability
Equipment layout
Soils data
Environmentalrequirements
Health & safetyrequirements
Engineering tasks- Detailed scope- Feedstock/product properties- PFDs- H&MBs- P&IDs -One-line elec. diagrams- Major equipment specs- Cost Estimate
Participation/buy-in of:- Operations- Maintenance- Business
Contracting strategy- Who- How
Team participants & roles
Integrated schedule- Critical path items- Identification of shut-downs for tie-ins- Resource requirements- Overtime requirements
Plans- Commissioning- Startup- Operation- Quality assurance
Cost/schedule controls
60r:\ewm\wccc IPA
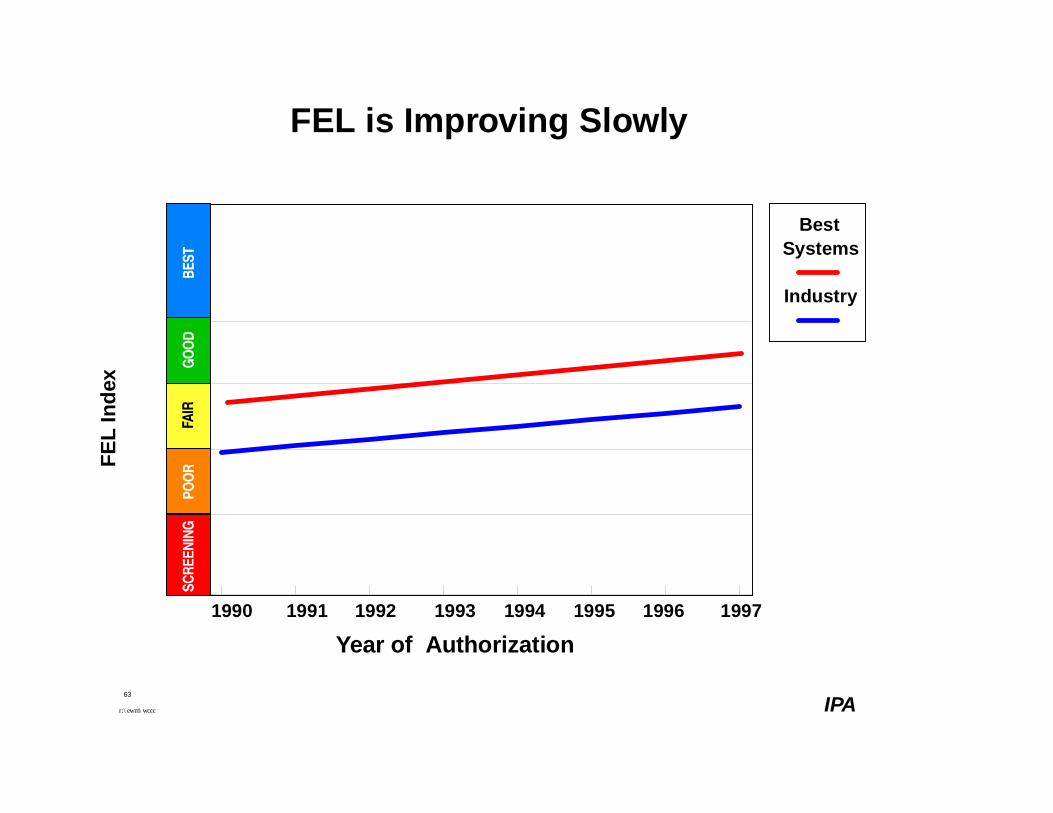
FEL is Improving Slowly
19961990 1991 1992 1993 1994 1995 1997
Year of Authorization
BestSystems
Industry
10
1
2
3
4
5
6
FEL
Inde
x
63
r:\ewm\wccc IPA
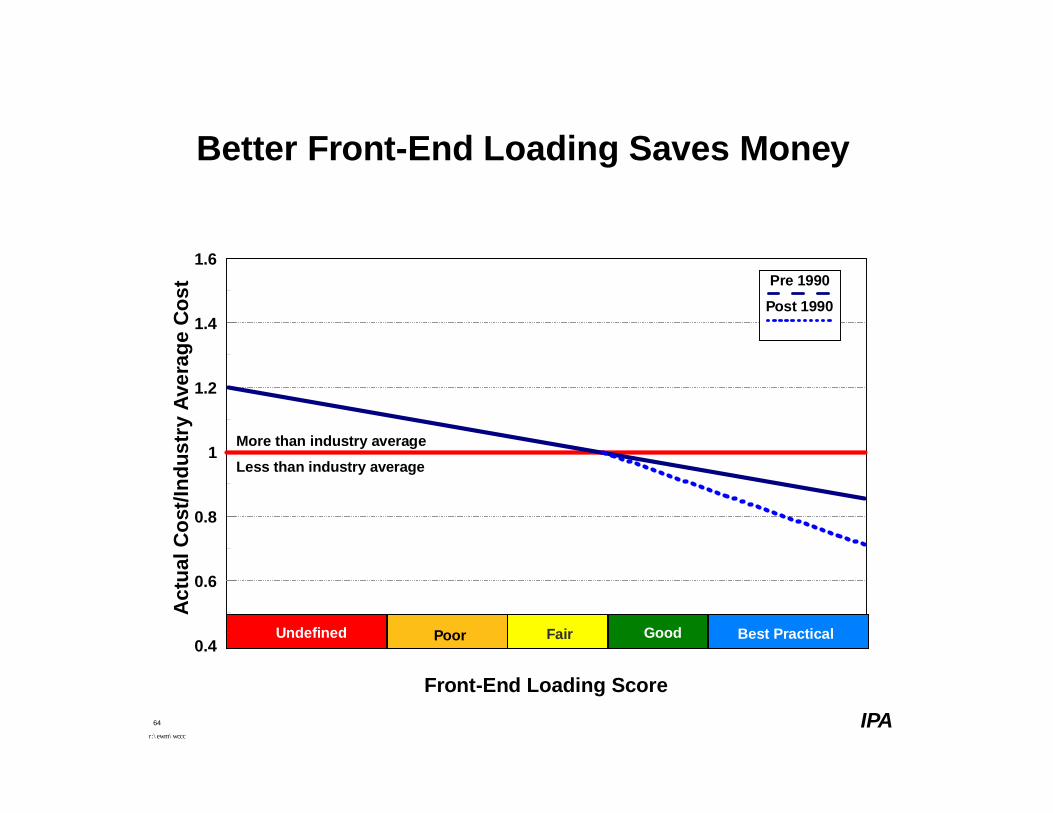
0.4
0.6
0.8
1
1.2
1.4
1.6
Front-End Loading Score
Act
ual C
ost/I
ndus
try
Aver
age
Cos
tBetter Front-End Loading Saves Money
More than industry average
Less than industry average
Pre 1990
Post 1990
1 Undefined GoodFairPoor Best Practical
64
r:\ewm\wccc
IPA
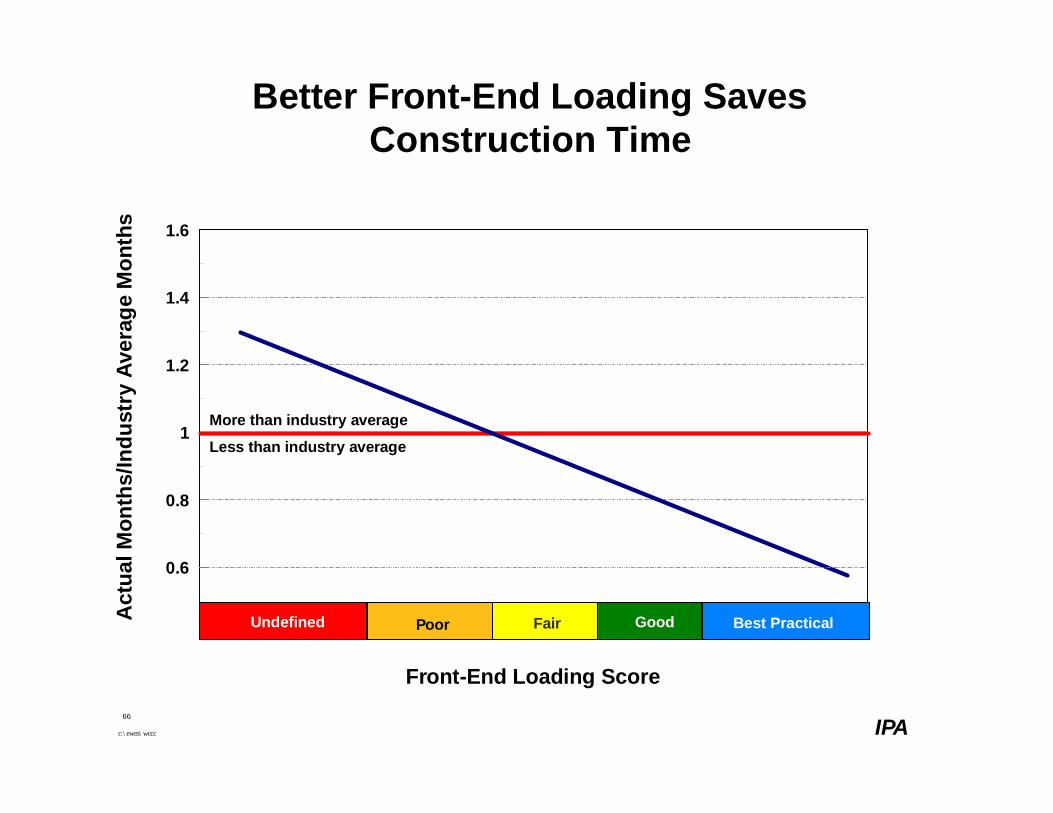
0.6
0.8
1
1.2
1.4
1.6
Front-End Loading Score
Act
ual M
onth
s/In
dust
ry A
vera
ge M
onth
sBetter Front-End Loading Saves
Construction Time
More than industry average
Less than industry average
1 Undefined GoodFairPoor Best Practical
66
r:\ewm\wccc IPA
Elements of Capital Effectiveness
Optimal
Scope forBusiness
Need
Executedwith
minimumchange
Front-End Loading
Discipline
Business Case Development
Timely Involvementof Contractors/Vendors
BETTERROI
BusinessStrategy
TechnologyStrategy
Team Integration
Key Performance IndicatorsKey Leading Indicators
Leading Technology
Low Cost
Excellent Operability
Fast Cycle Time
SAFETY
Use of Value Imp.Practices
IPA
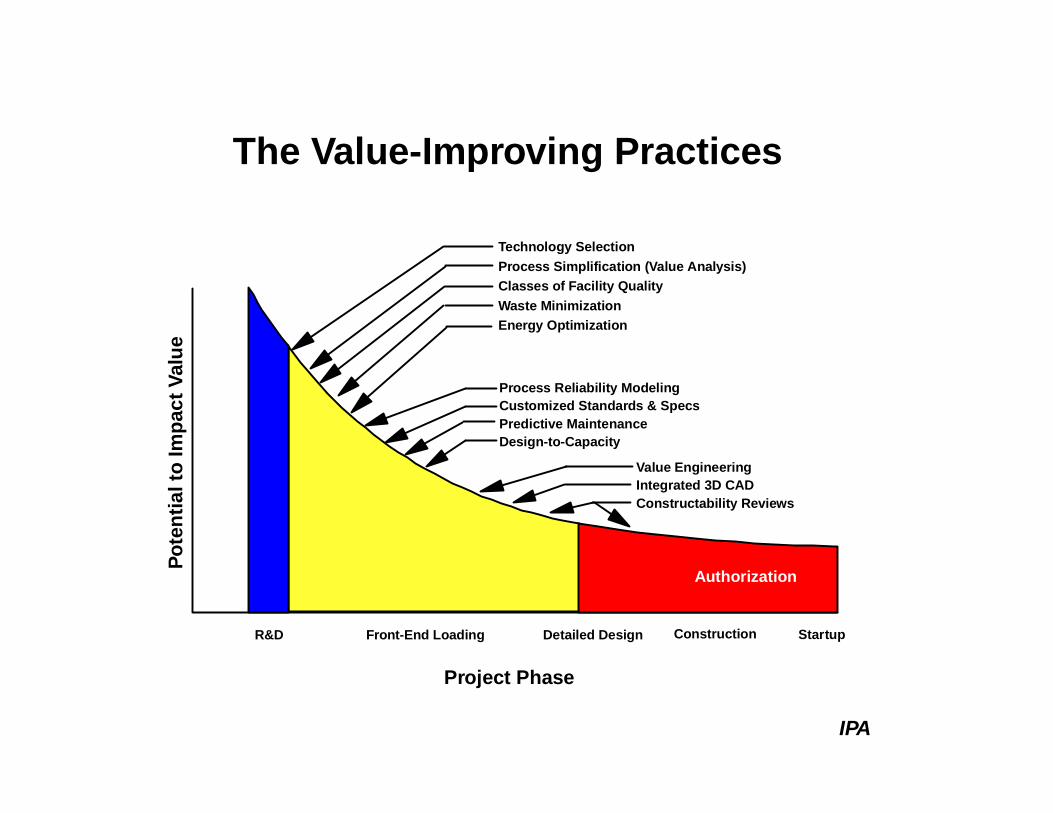
The Value-Improving Practices
Project Phase
Pote
ntia
l to
Impa
ct V
alue
Authorization
R&D Front-End Loading Detailed Design Construction Startup
Technology SelectionProcess Simplification (Value Analysis)Classes of Facility QualityWaste MinimizationEnergy Optimization
Process Reliability ModelingCustomized Standards & SpecsPredictive MaintenanceDesign-to-Capacity
Value EngineeringIntegrated 3D CADConstructability Reviews
IPA
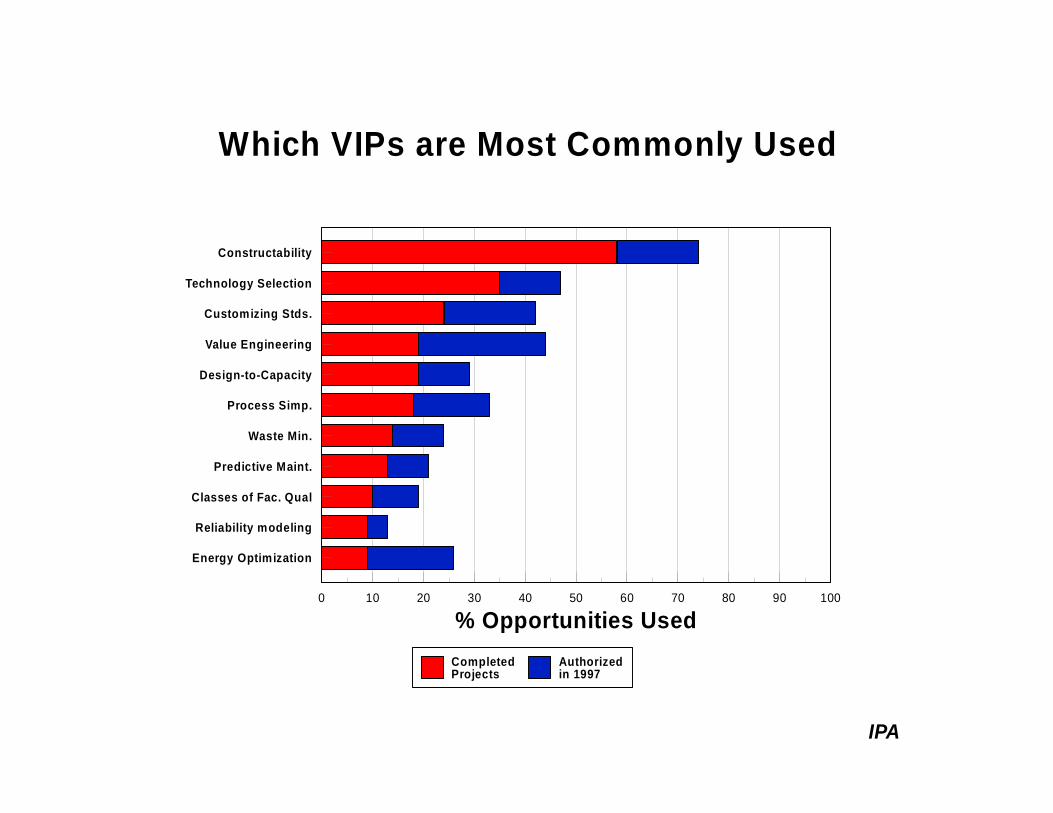
Which VIPs are Most Commonly Used
Constructability
Technology Selection
Customizing Stds.
Value Engineering
Design-to-Capacity
Process Simp.
Waste Min.
Predictive Maint.
Classes of Fac. Qual
Reliability modeling
Energy Optimization
0 10 20 30 40 50 60 70 80 90 100
% Opportunities UsedCompleted Projects
Authorizedin 1997
IPA
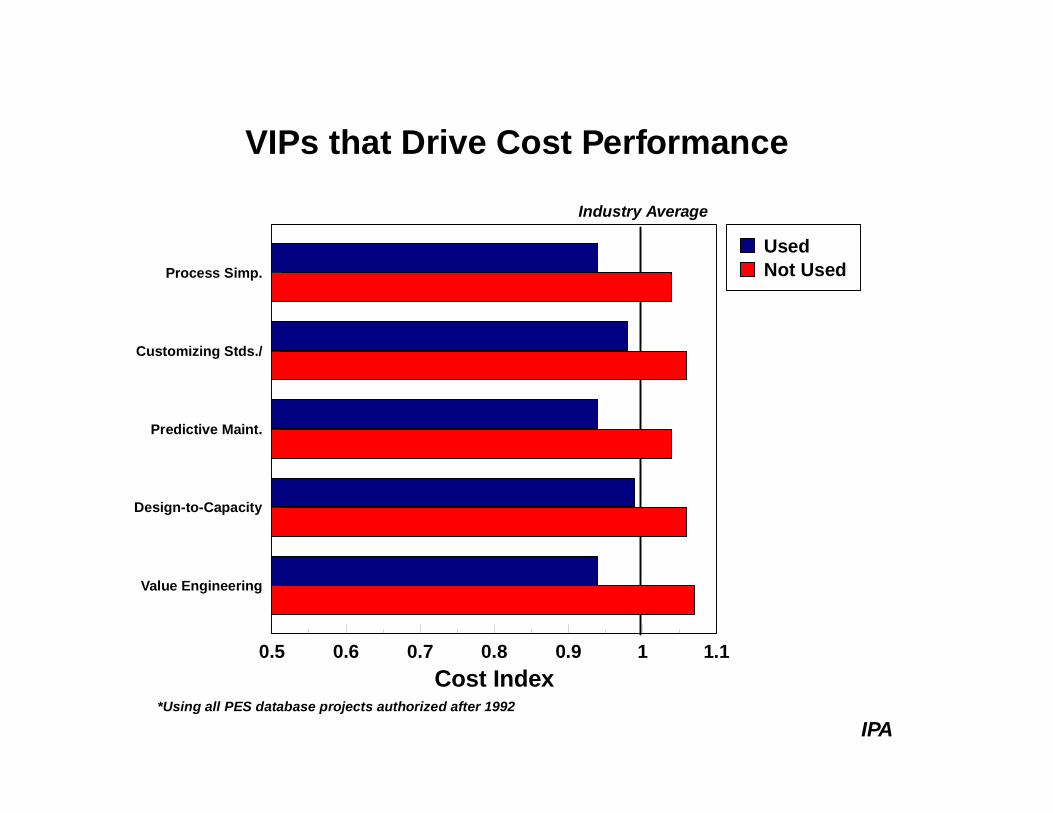
VIPs that Drive Cost Performance
Industry Average
*Using all PES database projects authorized after 1992
Process Simp.
Customizing Stds./
Predictive Maint.
Design-to-Capacity
Value Engineering
0.5 0.6 0.7 0.8 0.9 1 1.1Cost Index
UsedNot Used
IPA
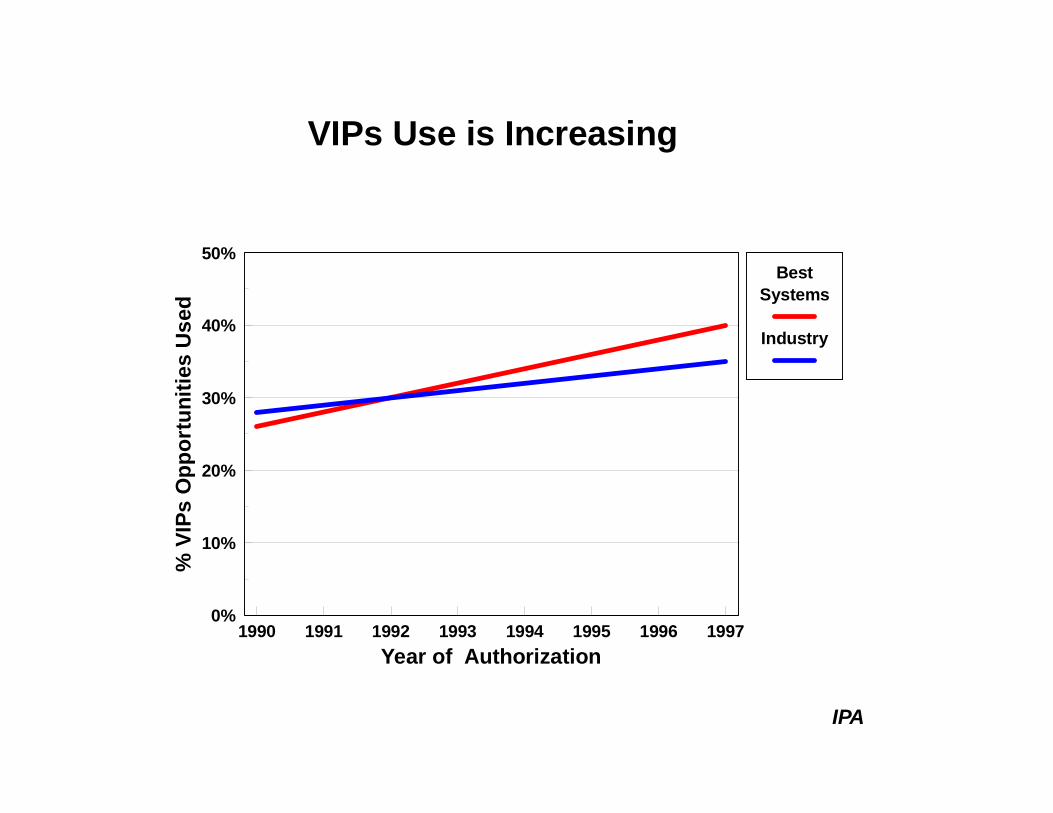
VIPs Use is Increasing
1990 1991 1992 1993 1994 1995 1996 19970%
10%
20%
30%
40%
50%
Year of Authorization
% V
IPs
Opp
ortu
nitie
s U
sed
BestSystems
Industry
IPA
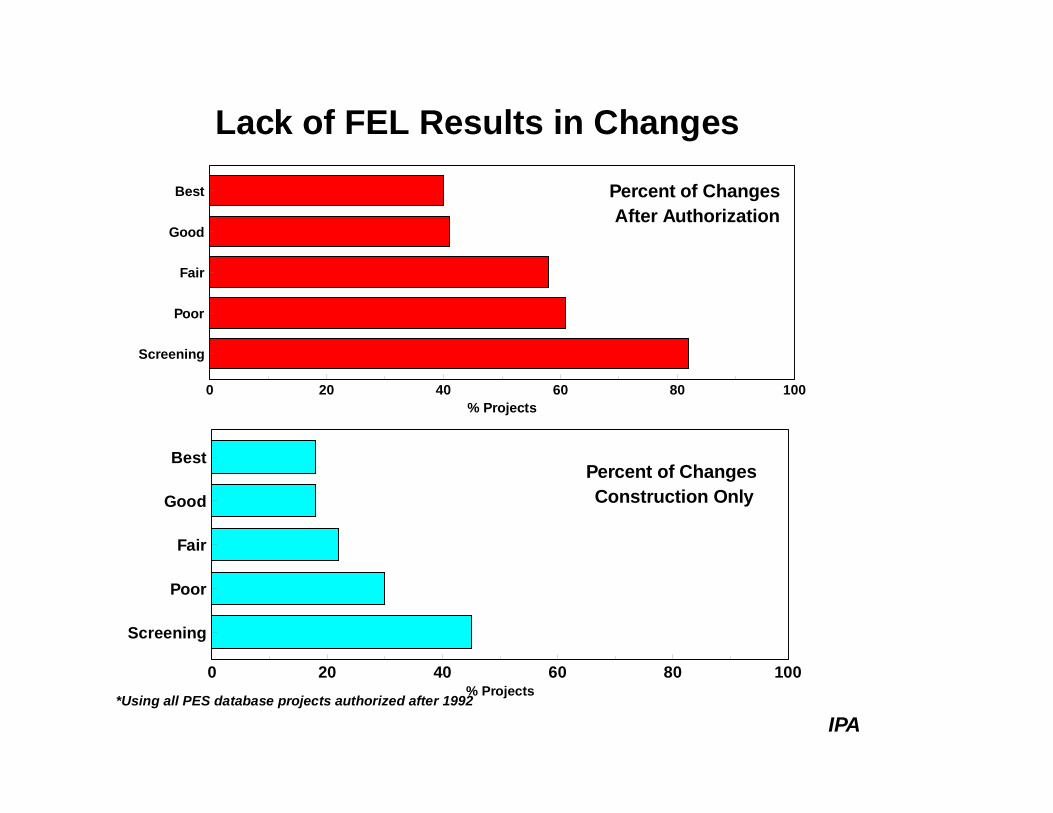
Lack of FEL Results in Changes
Best
Good
Fair
Poor
Screening
0 20 40 60 80 100% Projects
Best
Good
Fair
Poor
Screening
0 20 40 60 80 100% Projects
Percent of Changes After Authorization
Percent of Changes Construction Only
*Using all PES database projects authorized after 1992
IPA
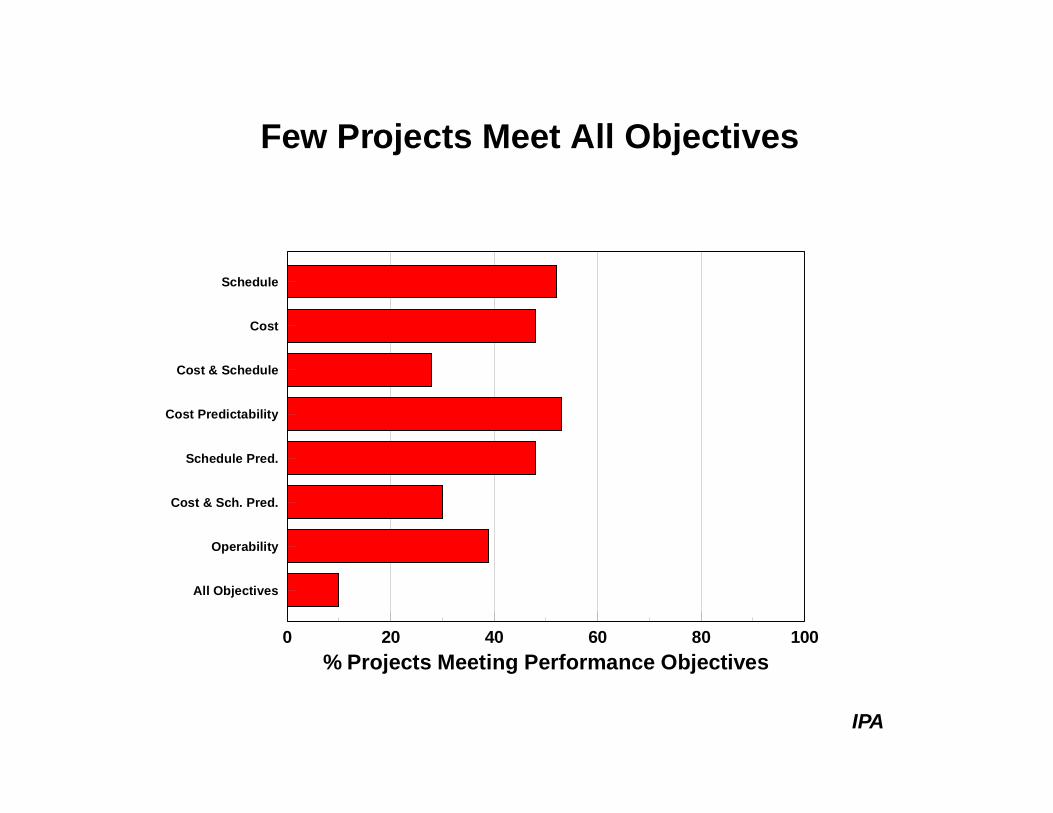
Few Projects Meet All Objectives
Schedule
Cost
Cost & Schedule
Cost Predictability
Schedule Pred.
Cost & Sch. Pred.
Operability
All Objectives
0 20 40 60 80 100% Projects Meeting Performance Objectives
IPA
Why is Capital Effectiveness So Difficult?
n In capital intensive businesses, capital effectiveness is an avenue to success
Ø low cost producers have some volume, margin, and market share control
Ø cycles provide opportunities as well as headaches
n Yet many commodity businesses waste large amount of capital, because...
work process is inadequateaccountability is poor
cross-functional cooperation is lacking
Outline
þ Progress in capital effectiveness
þ Keys to improvement
þ The role of contracting strategies
Ø Is fixed-price best?
Ø Do incentives work?

Elements of Capital Effectiveness
OptimalScope forBusiness
Need
Executedwith
minimumchange
Front-End Loading
Discipline
Business Case Development
Timely Involvement of Contractors/Vendors
BETTERROI
BusinessStrategy
TechnologyStrategy
Team Integration
Key Performance IndicatorsKey Leading Indicators
Leading Technology
SAFETY
Use of Value Imp.Practices
IPA
The Contracting Strategy Problem
n There are strongly held, diametrically opposed beliefs about the relative merits of different contracting approaches
n In general, these beliefs are unsupported by systematic data
n The contracting problem is also confused by the inability of many to distinguish between
Ø predictability and Ø effectiveness
Outline
þ Progress in capital effectiveness
þ Keys to improvement
þ The role of contracting strategies
Ø Is fixed-price best?
Ø Do incentives work?
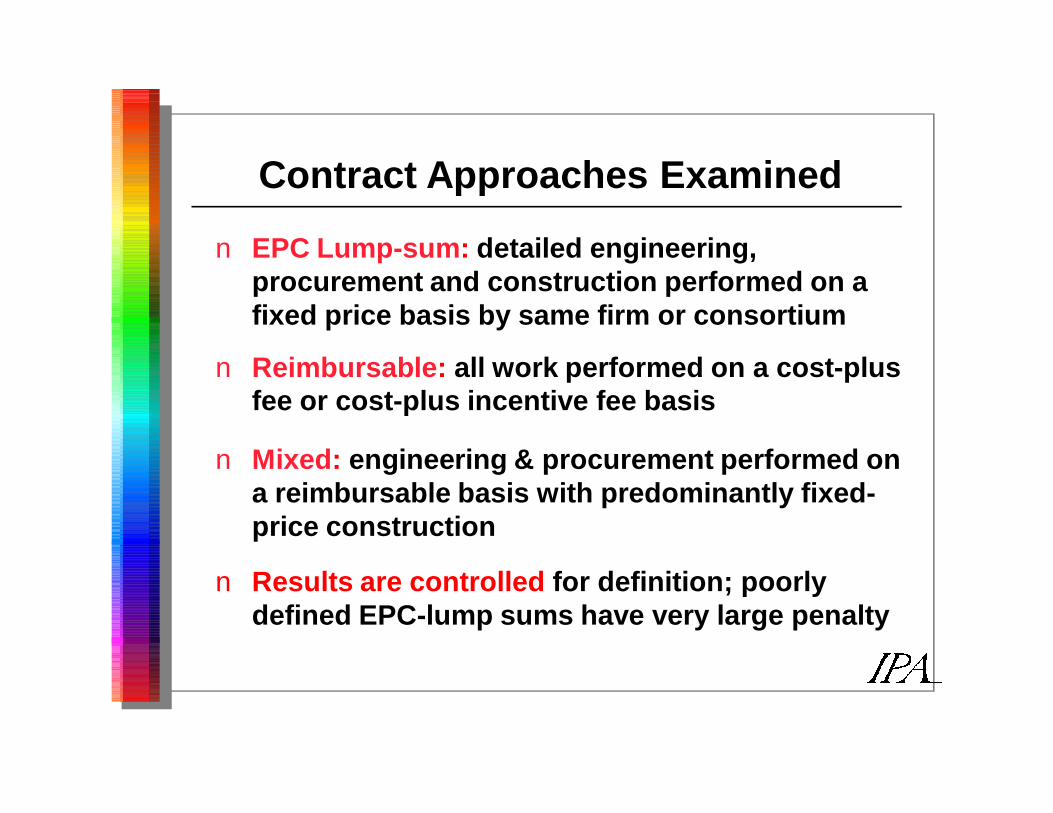
Contract Approaches Examined
n EPC Lump-sum: detailed engineering, procurement and construction performed on a fixed price basis by same firm or consortium
n Reimbursable: all work performed on a cost-plus fee or cost-plus incentive fee basis
n Mixed: engineering & procurement performed on a reimbursable basis with predominantly fixed-price construction
n Results are controlled for definition; poorly defined EPC-lump sums have very large penalty
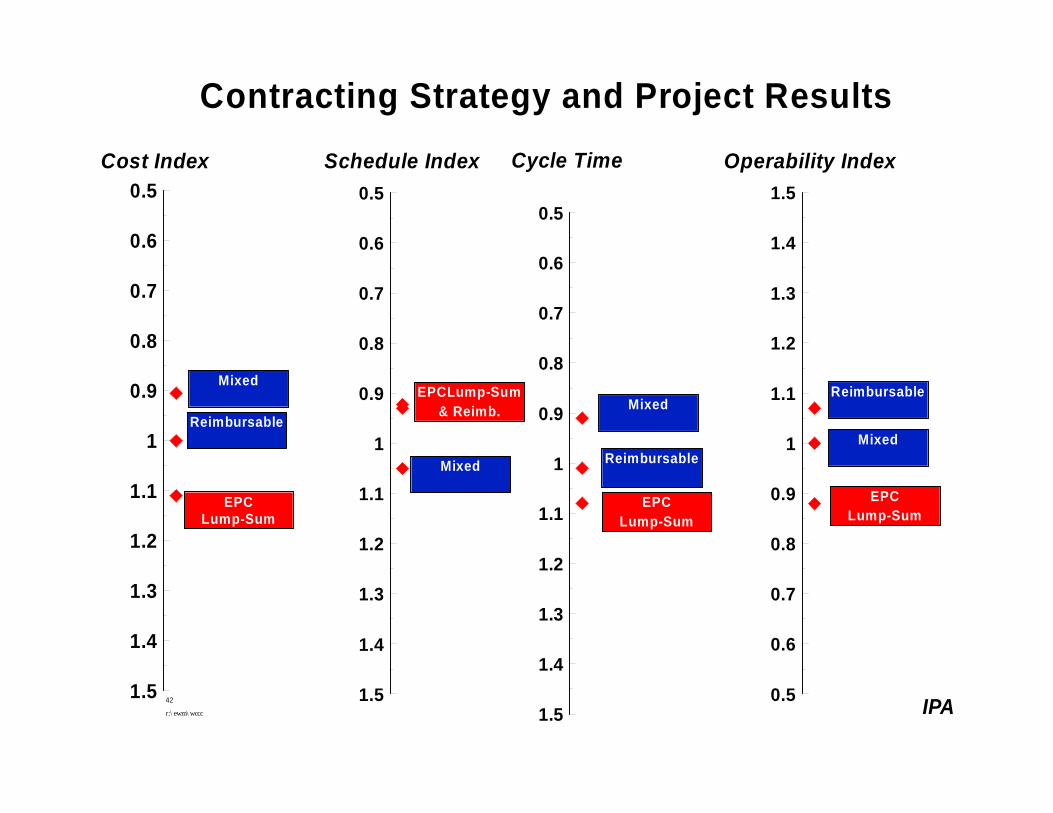
Contracting Strategy and Project Results
0.5
0.6
0.7
0.8
0.9
1
1.1
1.2
1.3
1.4
1.5
0.5
0.6
0.7
0.8
0.9
1
1.1
1.2
1.3
1.4
1.5
Cost Index
Reimbursable
EPC Lump-Sum
0.5
0.6
0.7
0.8
0.9
1
1.1
1.2
1.3
1.4
1.5
EPCLump-Sum& Reimb.
Mixed
EPCLump-Sum
Schedule Index Operability Index
42
r:\ewm\wccc IPA
0.5
0.6
0.7
0.8
0.9
1
1.1
1.2
1.3
1.4
1.5
Cycle Time
Mixed
Reimbursable
EPCLump-Sum
Mixed
Mixed
Reimbursable
Contracting Strategy Results
n EPC Lump-sum is on average significantly more expensive than average
n Reimbursable engineering followed by any form of fixed price construction (the "mixed strategy") is the most cost-effective approach
n Although Mixed strategy execution time is longer, the cycle time is shortest
n EPC Lump-sum carries a heavy operability penalty
n On average the Mixed strategy appears best and EPC lump-sum worst
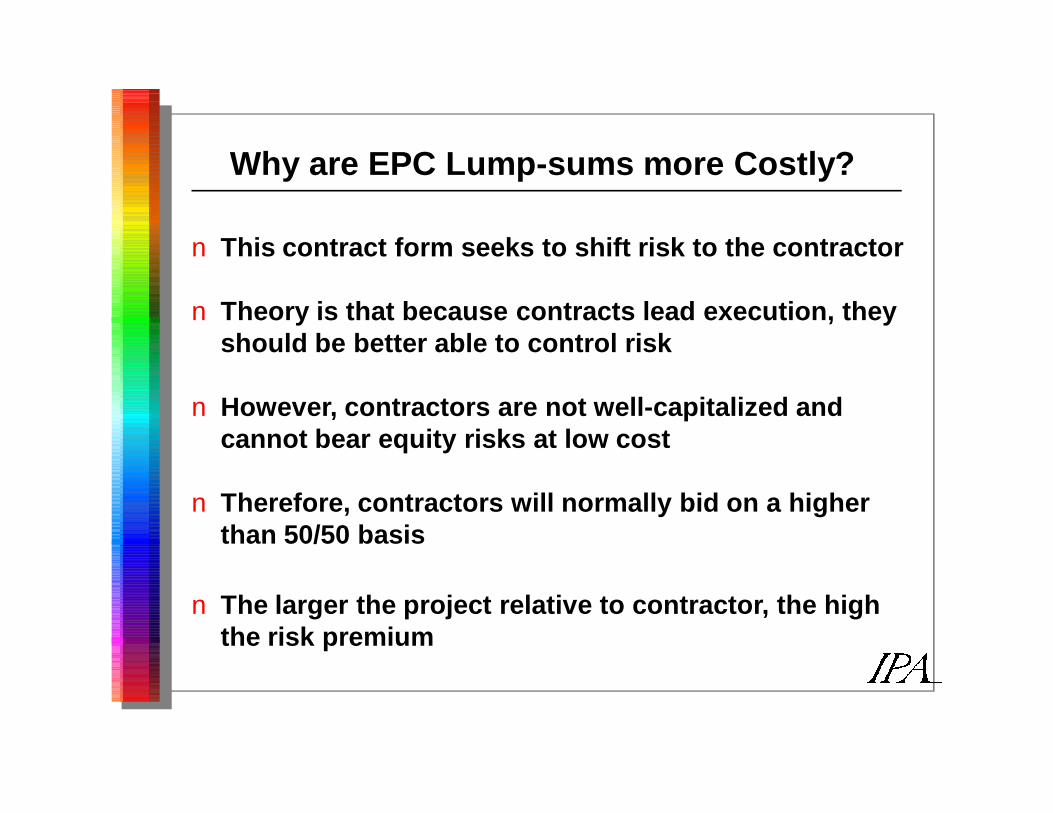
Why are EPC Lump-sums more Costly?
n This contract form seeks to shift risk to the contractor
n Theory is that because contracts lead execution, they should be better able to control risk
n However, contractors are not well-capitalized and cannot bear equity risks at low cost
n Therefore, contractors will normally bid on a higher than 50/50 basis
n The larger the project relative to contractor, the high the risk premium
Outline
þ Progress in capital effectiveness
þ Keys to improvement
þ The role of contracting strategies
Ø Is fixed-price best?
Ø Do incentives work?
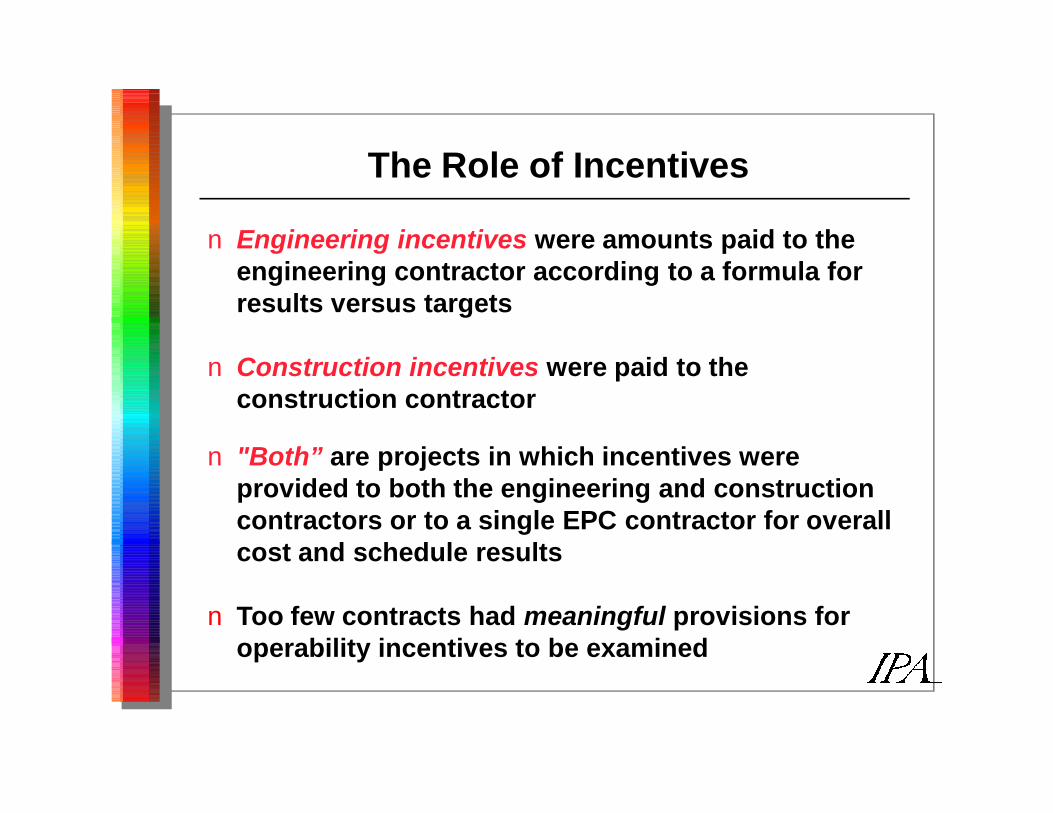
The Role of Incentives
n Engineering incentives were amounts paid to the engineering contractor according to a formula for results versus targets
n Construction incentives were paid to the construction contractor
n "Both” are projects in which incentives were provided to both the engineering and construction contractors or to a single EPC contractor for overall cost and schedule results
n Too few contracts had meaningful provisions for operability incentives to be examined
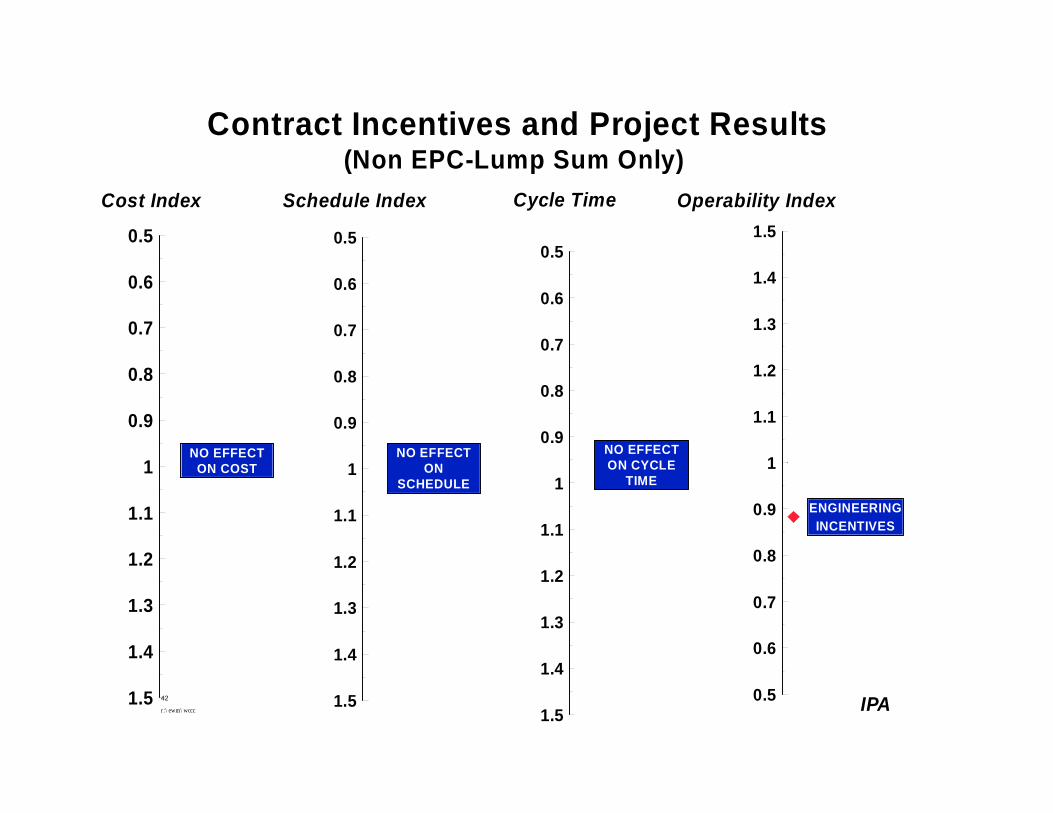
Contract Incentives and Project Results(Non EPC-Lump Sum Only)
0.5
0.6
0.7
0.8
0.9
1
1.1
1.2
1.3
1.4
1.5
0.5
0.6
0.7
0.8
0.9
1
1.1
1.2
1.3
1.4
1.5
Cost Index
NO EFFECT ON COST
0.5
0.6
0.7
0.8
0.9
1
1.1
1.2
1.3
1.4
1.5
ENGINEERINGINCENTIVES
Schedule Index Operability Index
42
r:\ewm\wccc IPA
0.5
0.6
0.7
0.8
0.9
1
1.1
1.2
1.3
1.4
1.5
Cycle Time
NO EFFECT ON CYCLE
TIME
NO EFFECT ON
SCHEDULE
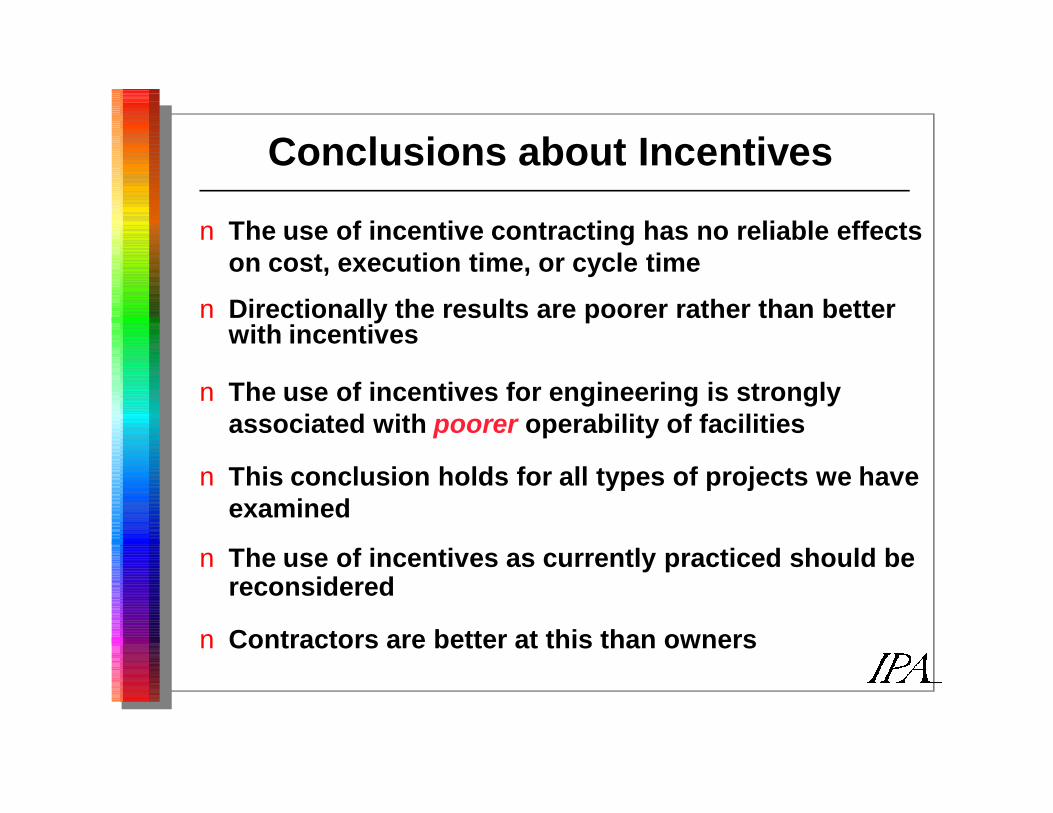
Conclusions about Incentives
n The use of incentive contracting has no reliable effects on cost, execution time, or cycle time
n Directionally the results are poorer rather than better with incentives
n The use of incentives for engineering is strongly associated with poorer operability of facilities
n This conclusion holds for all types of projects we have examined
n The use of incentives as currently practiced should be reconsidered
n Contractors are better at this than owners
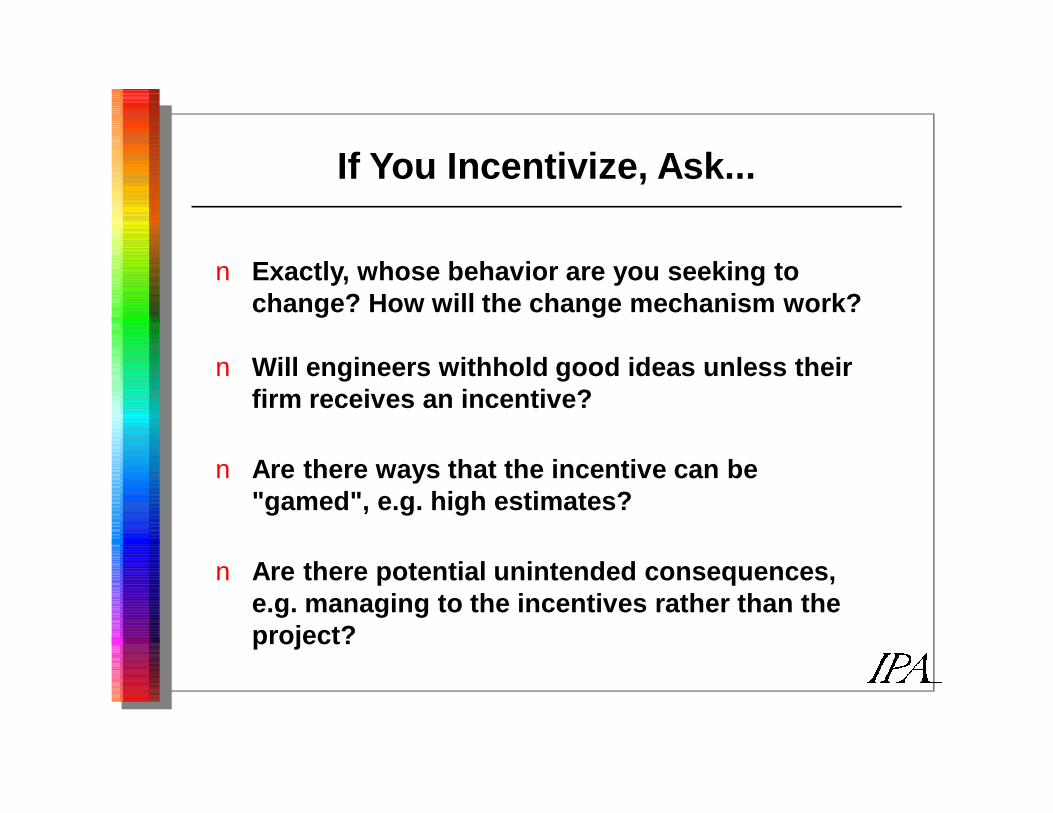
If You Incentivize, Ask...
n Exactly, whose behavior are you seeking to change? How will the change mechanism work?
n Will engineers withhold good ideas unless their firm receives an incentive?
n Are there ways that the incentive can be "gamed", e.g. high estimates?
n Are there potential unintended consequences, e.g. managing to the incentives rather than the project?