Embed Size (px)
Citation preview
Credit Loss Modeling Best Practices – ALM, Capital Stress Testing , Concentration Risk, and CECL

Credit Modeling Best Practices
, 2015
Wilary Winn Background
Founded in 2003, Wilary Winn provides independent and objective, fee-based, financial advice to credit unions and banks located across the country. We currently have more than 375 clients in 49 states and the District of Columbia, including 27 of the top 100 credit unions.

Credit Modeling Best Practices
, 2015 Today’s Presenters Douglas Winn – President Mr. Winn co-founded Wilary Winn in the summer of 2003 and his primary responsibility is to set the firm's strategic direction. Mr. Winn is a nationally recognized expert in financial institution accounting and regulatory reporting and has led seminars on the subject for many of the country's largest public accounting firms, the AICPA, the FDIC, and the NCUA. Mr. Winn began his career as a practicing CPA for Arthur Young & Company - now Ernst & Young.

Credit Modeling Best Practices
, 2015 Today’s Presenters Matt Erickson - Manager Mr. Erickson leads Wilary Winn’s asset liability management (ALM) business line. He consults with ALM clients on interest rate, credit, concentration and liquidity risks as well as capital stress testing, risk-based pricing and real return optimization. Matt uses his knowledge of credit risk analytics and quantitative analysis skills to strengthen the firm’s proprietary valuation models, develop assumption input databases, and track industry-wide performance trends on loans and deposits.
Topics Covered Today
• Balance sheet risk • Credit loss models – focus on discounted cash flow • Loan stratification • Predictive credit indicators • Capital stress testing • Concentration limits and sub-limits • Risk-based pricing and real return analyses • CECL implementation
5
Balance Sheet Risk
• Primary risks are credit, interest rate and liquidity which are ideally measured on an integrated basis.
• Credit is the most critical because losses incurred on loans and investments have been key factors in banking crises and failures.
• Credit risk is best measured from the bottom up.
6
Estimating Credit Losses
• Modeling should be based on type of loan. • For example, MBLs that are CRE – re-underwrite
lower rated loans and use migration analysis for higher rated loans.
• Residential real estate and consumer loans are best modeled statistically: – Roll rate analyses – Probability of default analyses – Discounted cash flow analyses
7
Discounted Cash Flow Analysis
Key Valuation Inputs:
• Conditional Repayment Rate (CRR) • Conditional Default Rate (CDR) • Conditional Prepayment Rate (CPR = CRR + CDR) • Loss Severity • Discount Rate – depends on accounting context. For
CECL it is original yield
8
Loan Example – 660-719 FICO
9
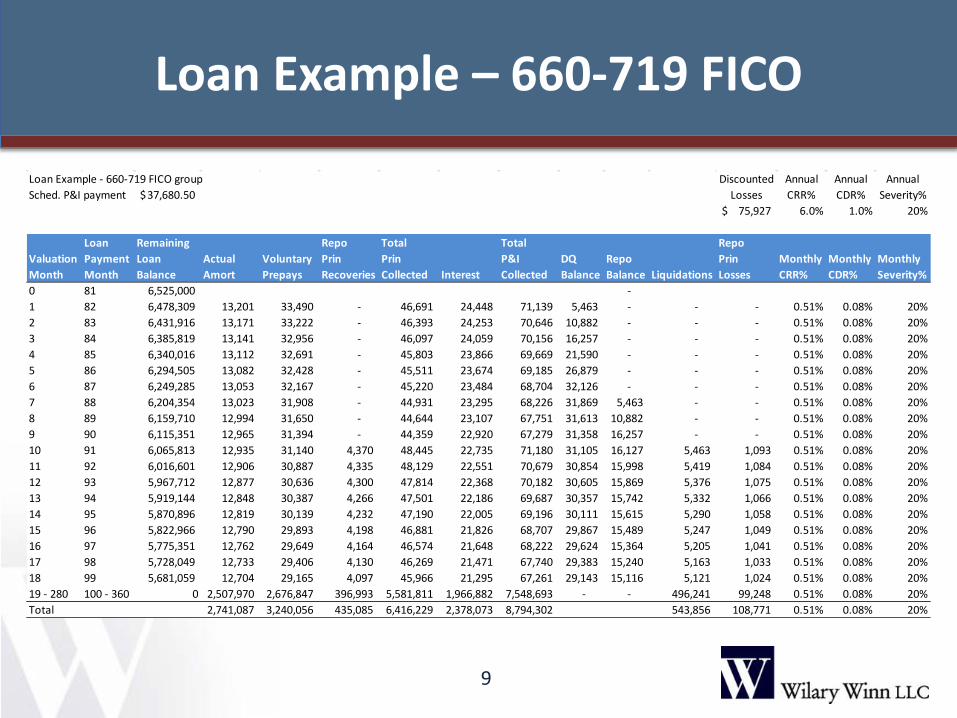
Loan Example - 660-719 FICO group Discounted Annual Annual AnnualSched. P&I payment 37,680.50$ Losses CRR% CDR% Severity%
75,927$ 6.0% 1.0% 20%
Loan Remaining Repo Total Total Repo Valuation Payment Loan Actual Voluntary Prin Prin P&I DQ Repo Prin Monthly Monthly MonthlyMonth Month Balance Amort Prepays Recoveries Collected Interest Collected Balance Balance Liquidations Losses CRR% CDR% Severity%0 81 6,525,000 - 1 82 6,478,309 13,201 33,490 - 46,691 24,448 71,139 5,463 - - - 0.51% 0.08% 20%2 83 6,431,916 13,171 33,222 - 46,393 24,253 70,646 10,882 - - - 0.51% 0.08% 20%3 84 6,385,819 13,141 32,956 - 46,097 24,059 70,156 16,257 - - - 0.51% 0.08% 20%4 85 6,340,016 13,112 32,691 - 45,803 23,866 69,669 21,590 - - - 0.51% 0.08% 20%5 86 6,294,505 13,082 32,428 - 45,511 23,674 69,185 26,879 - - - 0.51% 0.08% 20%6 87 6,249,285 13,053 32,167 - 45,220 23,484 68,704 32,126 - - - 0.51% 0.08% 20%7 88 6,204,354 13,023 31,908 - 44,931 23,295 68,226 31,869 5,463 - - 0.51% 0.08% 20%8 89 6,159,710 12,994 31,650 - 44,644 23,107 67,751 31,613 10,882 - - 0.51% 0.08% 20%9 90 6,115,351 12,965 31,394 - 44,359 22,920 67,279 31,358 16,257 - - 0.51% 0.08% 20%10 91 6,065,813 12,935 31,140 4,370 48,445 22,735 71,180 31,105 16,127 5,463 1,093 0.51% 0.08% 20%11 92 6,016,601 12,906 30,887 4,335 48,129 22,551 70,679 30,854 15,998 5,419 1,084 0.51% 0.08% 20%12 93 5,967,712 12,877 30,636 4,300 47,814 22,368 70,182 30,605 15,869 5,376 1,075 0.51% 0.08% 20%13 94 5,919,144 12,848 30,387 4,266 47,501 22,186 69,687 30,357 15,742 5,332 1,066 0.51% 0.08% 20%14 95 5,870,896 12,819 30,139 4,232 47,190 22,005 69,196 30,111 15,615 5,290 1,058 0.51% 0.08% 20%15 96 5,822,966 12,790 29,893 4,198 46,881 21,826 68,707 29,867 15,489 5,247 1,049 0.51% 0.08% 20%16 97 5,775,351 12,762 29,649 4,164 46,574 21,648 68,222 29,624 15,364 5,205 1,041 0.51% 0.08% 20%17 98 5,728,049 12,733 29,406 4,130 46,269 21,471 67,740 29,383 15,240 5,163 1,033 0.51% 0.08% 20%18 99 5,681,059 12,704 29,165 4,097 45,966 21,295 67,261 29,143 15,116 5,121 1,024 0.51% 0.08% 20%19 - 280 100 - 360 0 2,507,970 2,676,847 396,993 5,581,811 1,966,882 7,548,693 - - 496,241 99,248 0.51% 0.08% 20%Total 2,741,087 3,240,056 435,085 6,416,229 2,378,073 8,794,302 543,856 108,771 0.51% 0.08% 20%
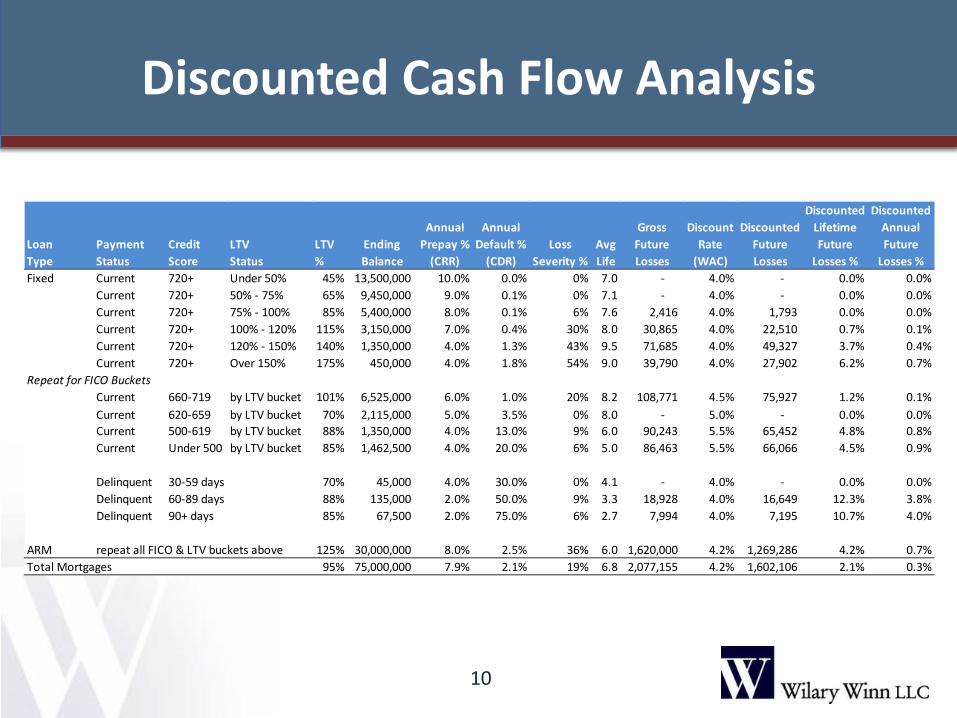
Discounted Cash Flow Analysis
10
Discounted DiscountedAnnual Annual Gross Discount Discounted Lifetime Annual
Loan Payment Credit LTV LTV Ending Prepay % Default % Loss Avg Future Rate Future Future FutureType Status Score Status % Balance (CRR) (CDR) Severity % Life Losses (WAC) Losses Losses % Losses %Fixed Current 720+ Under 50% 45% 13,500,000 10.0% 0.0% 0% 7.0 - 4.0% - 0.0% 0.0%
Current 720+ 50% - 75% 65% 9,450,000 9.0% 0.1% 0% 7.1 - 4.0% - 0.0% 0.0%Current 720+ 75% - 100% 85% 5,400,000 8.0% 0.1% 6% 7.6 2,416 4.0% 1,793 0.0% 0.0%Current 720+ 100% - 120% 115% 3,150,000 7.0% 0.4% 30% 8.0 30,865 4.0% 22,510 0.7% 0.1%Current 720+ 120% - 150% 140% 1,350,000 4.0% 1.3% 43% 9.5 71,685 4.0% 49,327 3.7% 0.4%Current 720+ Over 150% 175% 450,000 4.0% 1.8% 54% 9.0 39,790 4.0% 27,902 6.2% 0.7%
Repeat for FICO BucketsCurrent 660-719 by LTV bucket 101% 6,525,000 6.0% 1.0% 20% 8.2 108,771 4.5% 75,927 1.2% 0.1%Current 620-659 by LTV bucket 70% 2,115,000 5.0% 3.5% 0% 8.0 - 5.0% - 0.0% 0.0%Current 500-619 by LTV bucket 88% 1,350,000 4.0% 13.0% 9% 6.0 90,243 5.5% 65,452 4.8% 0.8%Current Under 500 by LTV bucket 85% 1,462,500 4.0% 20.0% 6% 5.0 86,463 5.5% 66,066 4.5% 0.9%
Delinquent 30-59 days 70% 45,000 4.0% 30.0% 0% 4.1 - 4.0% - 0.0% 0.0%Delinquent 60-89 days 88% 135,000 2.0% 50.0% 9% 3.3 18,928 4.0% 16,649 12.3% 3.8%Delinquent 90+ days 85% 67,500 2.0% 75.0% 6% 2.7 7,994 4.0% 7,195 10.7% 4.0%
ARM repeat all FICO & LTV buckets above 125% 30,000,000 8.0% 2.5% 36% 6.0 1,620,000 4.2% 1,269,286 4.2% 0.7%Total Mortgages 95% 75,000,000 7.9% 2.1% 19% 6.8 2,077,155 4.2% 1,602,106 2.1% 0.3%
Discounted Cash Flow Analysis
It is very important to note that while we are applying our statistical inputs at the loan level in order to achieve a more accurate result for the aggregated cash flows, we do not for a moment believe our results are accurate for any given loan. In fact, we show a small percentage of each loan prepaying and defaulting each year – the latter, of course, being impossible. We are not re-underwriting individual loans, we are applying inputs – prepayment rates, default rates and loss given defaults, which we have derived from our statistical analysis to a pool of loans. Our results are intended to be accurate and to be used only in the aggregate.
11
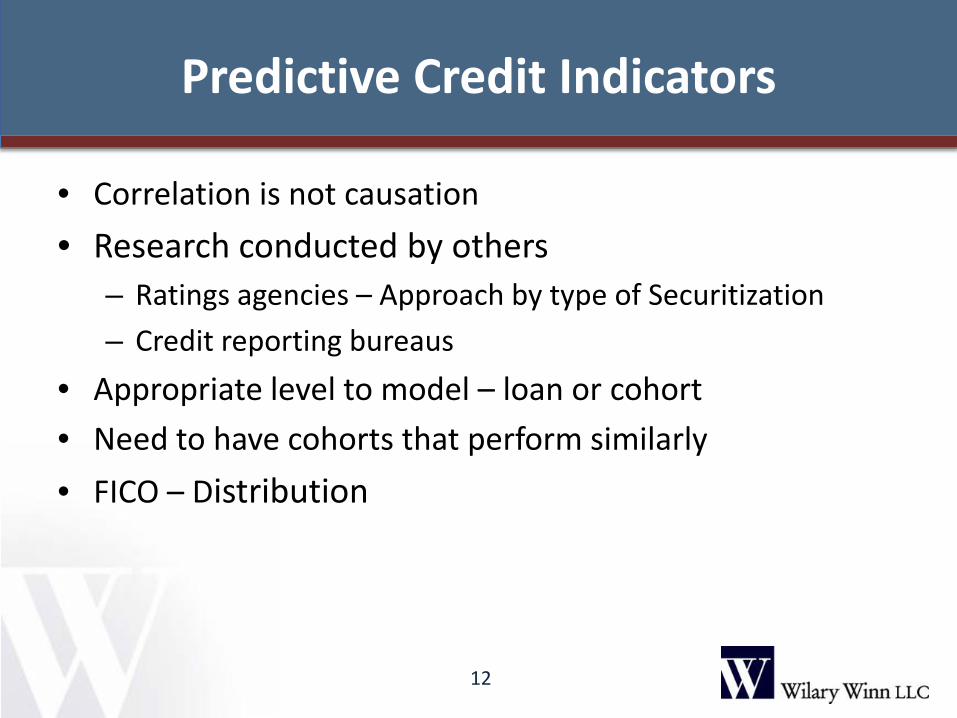
Predictive Credit Indicators
• Correlation is not causation • Research conducted by others
– Ratings agencies – Approach by type of Securitization – Credit reporting bureaus
• Appropriate level to model – loan or cohort • Need to have cohorts that perform similarly • FICO – Distribution
12
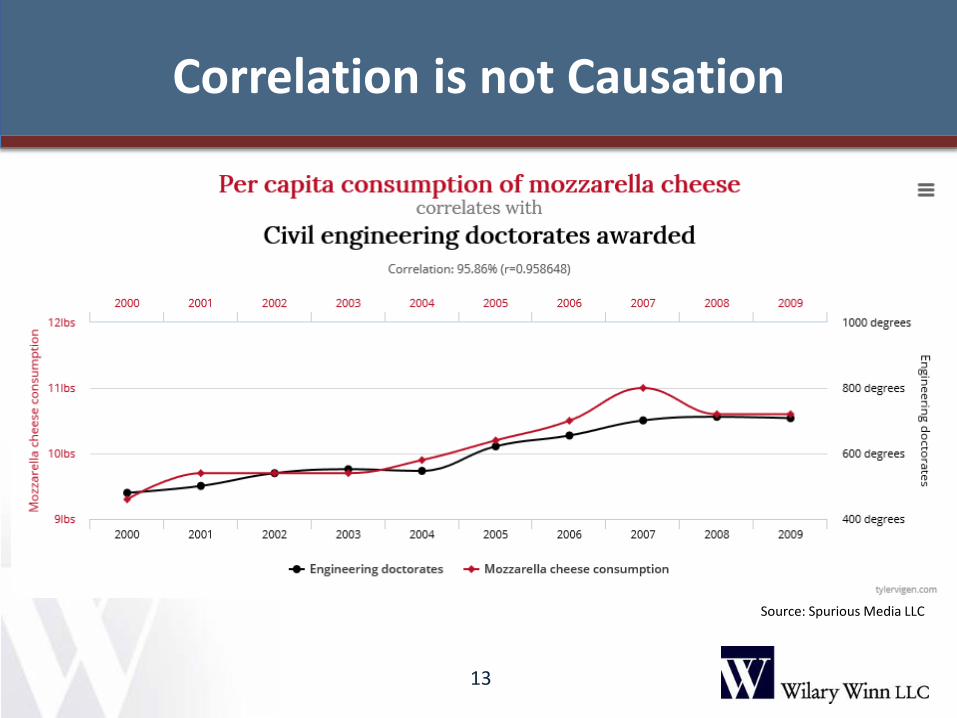
Correlation is not Causation
13
Source: Spurious Media LLC
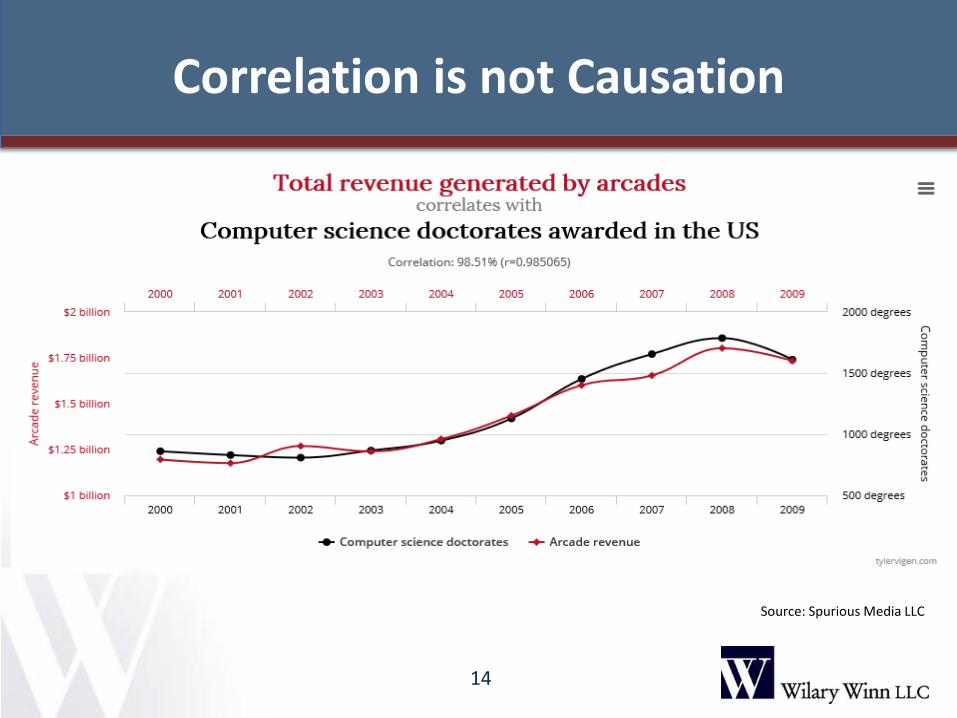
Correlation is not Causation
14
Source: Spurious Media LLC
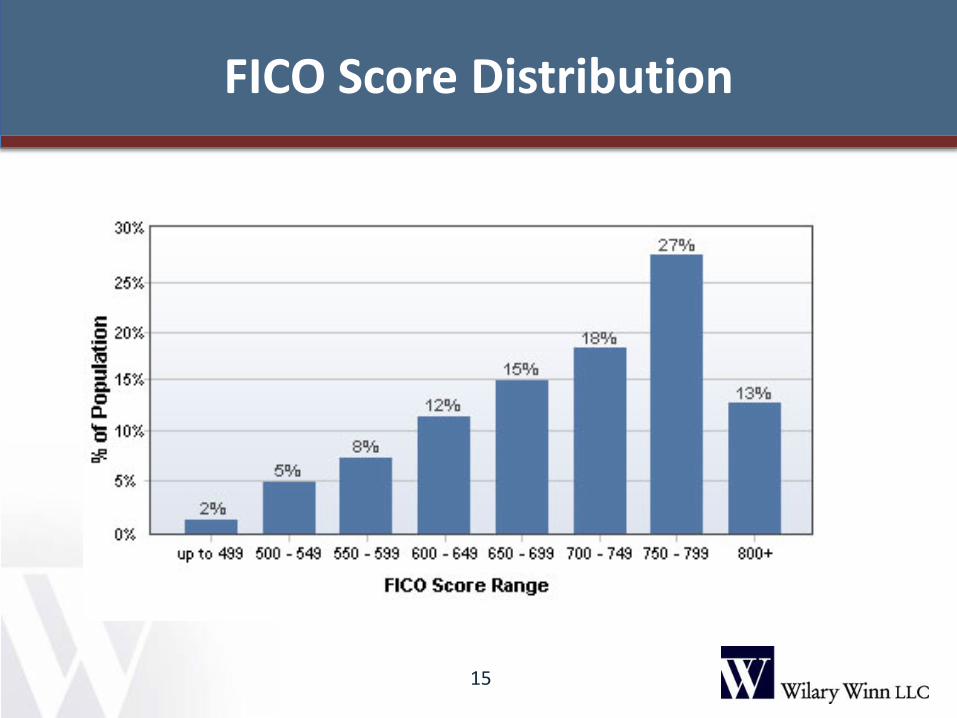
FICO Score Distribution
15
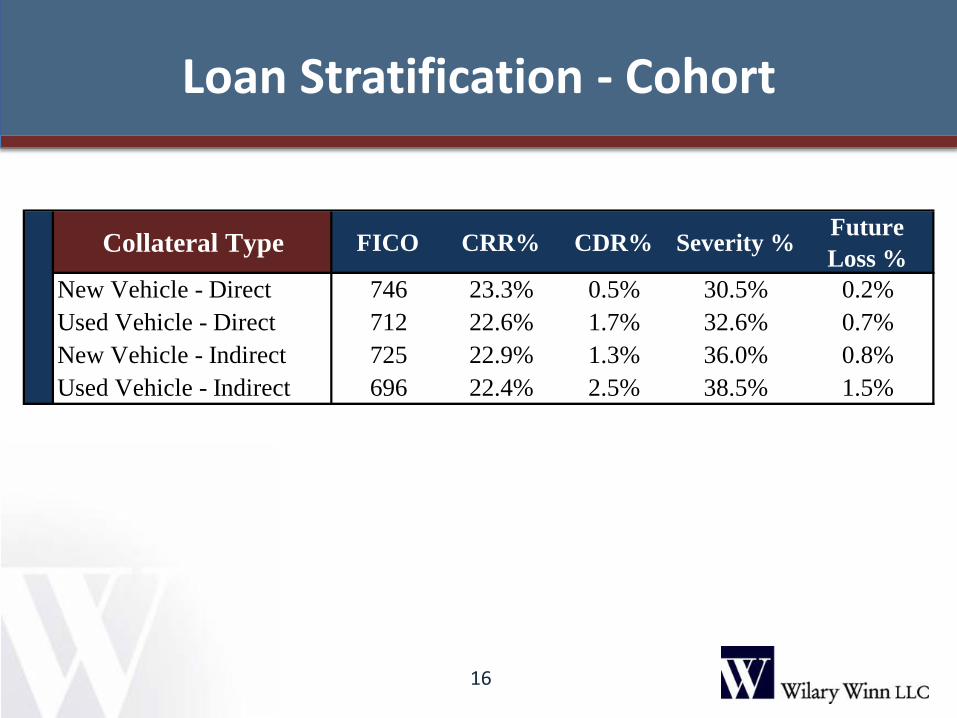
Loan Stratification - Cohort
16
Collateral Type FICO CRR% CDR% Severity % Future Loss %
New Vehicle - Direct 746 23.3% 0.5% 30.5% 0.2%Used Vehicle - Direct 712 22.6% 1.7% 32.6% 0.7%New Vehicle - Indirect 725 22.9% 1.3% 36.0% 0.8%Used Vehicle - Indirect 696 22.4% 2.5% 38.5% 1.5%
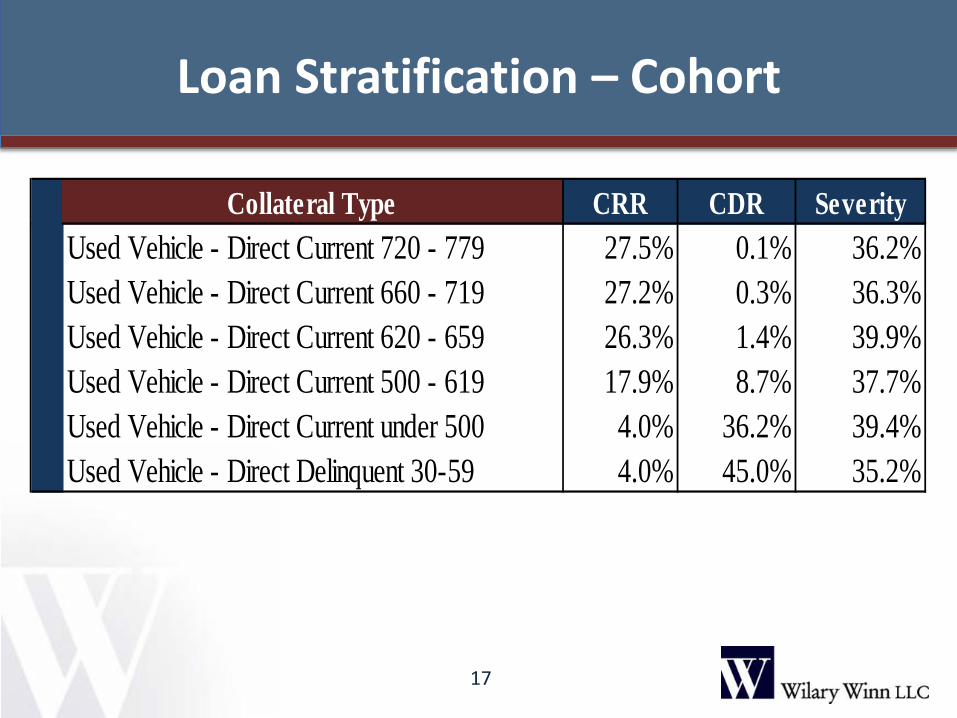
Loan Stratification – Cohort
17
Collateral Type CRR CDR SeverityUsed Vehicle - Direct Current 720 - 779 27.5% 0.1% 36.2%Used Vehicle - Direct Current 660 - 719 27.2% 0.3% 36.3%Used Vehicle - Direct Current 620 - 659 26.3% 1.4% 39.9%Used Vehicle - Direct Current 500 - 619 17.9% 8.7% 37.7%Used Vehicle - Direct Current under 500 4.0% 36.2% 39.4%Used Vehicle - Direct Delinquent 30-59 4.0% 45.0% 35.2%
Predictive Inputs
• Examples:
• Performance of auto loans is highly correlated to type of loan, FICO score and unemployment rate
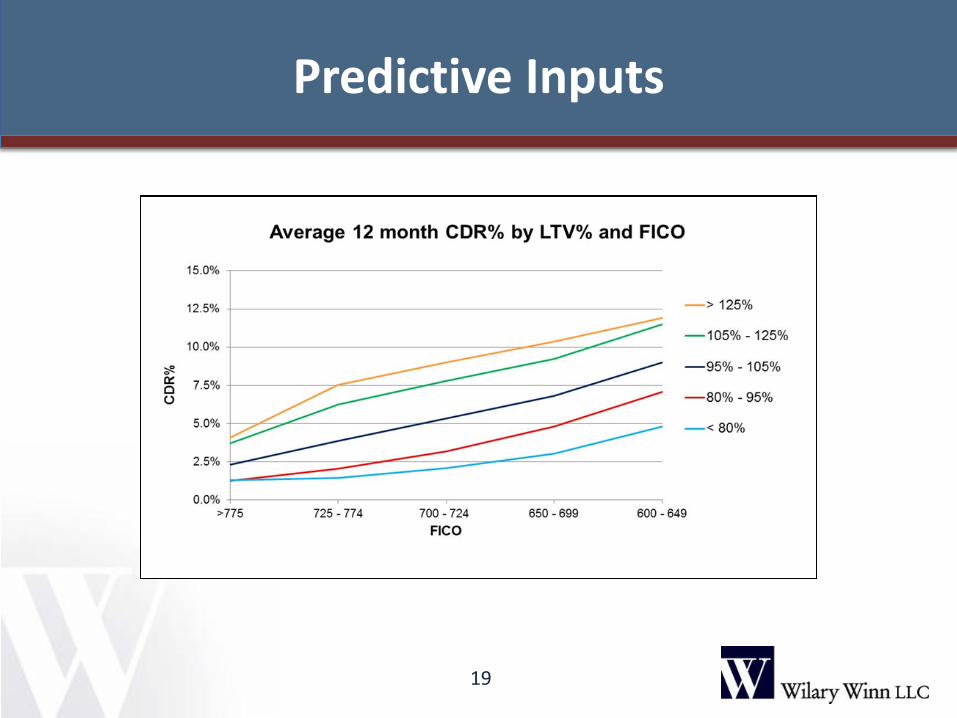
• Performance of residential real estate loans is highly correlated to FICO and CLTV
18
Predictive Inputs
19
20
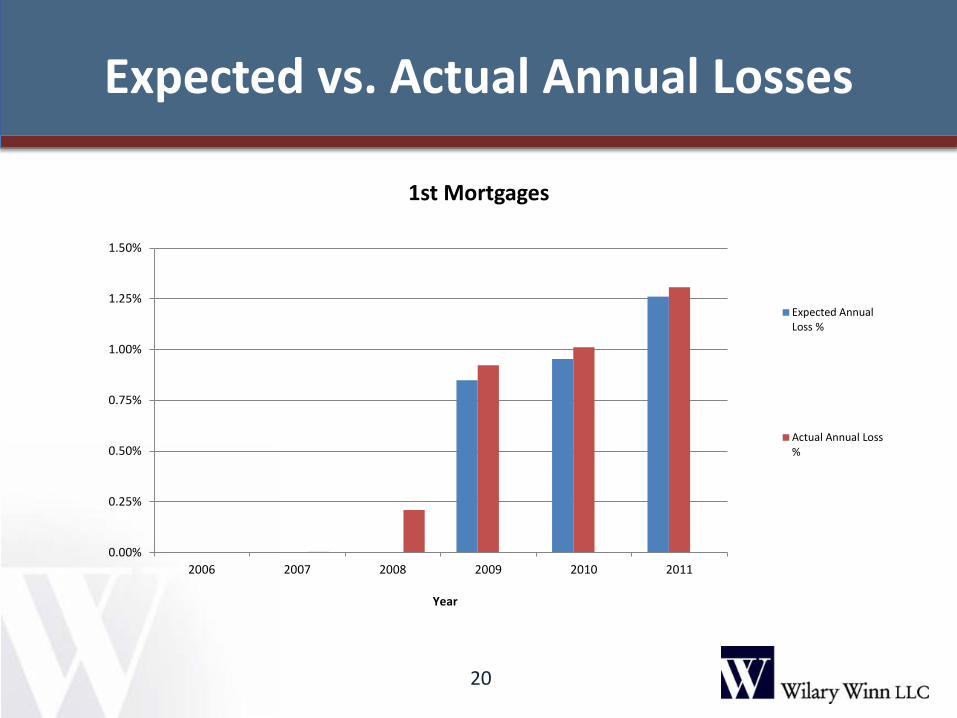
Expected vs. Actual Annual Losses
0.00%
0.25%
0.50%
0.75%
1.00%
1.25%
1.50%
2006 2007 2008 2009 2010 2011
Year
1st Mortgages
Expected AnnualLoss %
Actual Annual Loss%
Loan Stratification
21
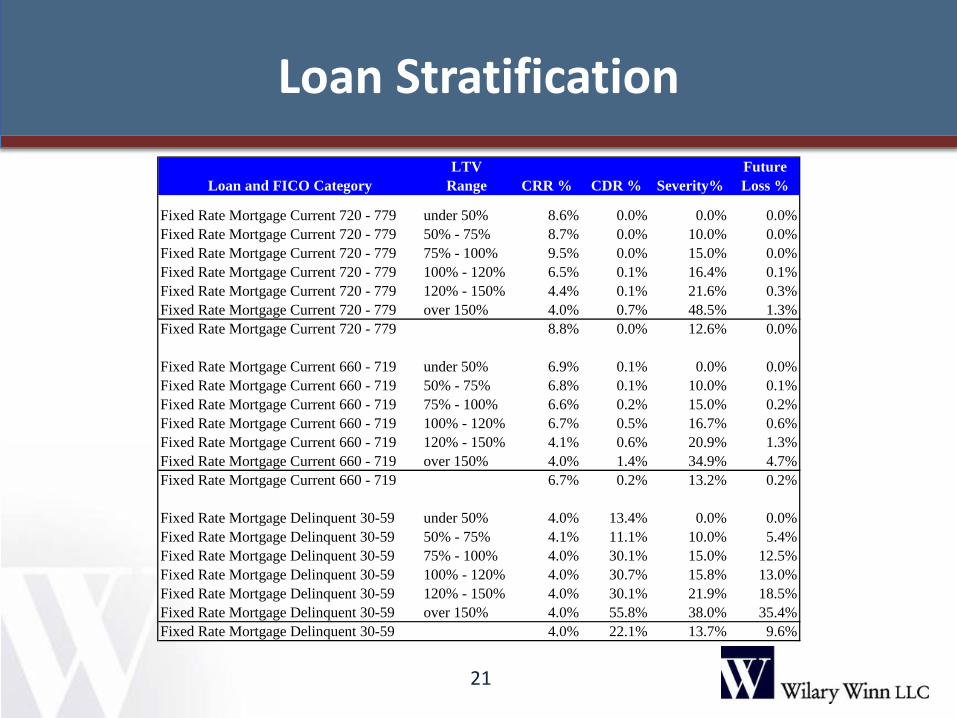
LTV FutureLoan and FICO Category Range CRR % CDR % Severity% Loss %
Fixed Rate Mortgage Current 720 - 779 under 50% 8.6% 0.0% 0.0% 0.0%Fixed Rate Mortgage Current 720 - 779 50% - 75% 8.7% 0.0% 10.0% 0.0%Fixed Rate Mortgage Current 720 - 779 75% - 100% 9.5% 0.0% 15.0% 0.0%Fixed Rate Mortgage Current 720 - 779 100% - 120% 6.5% 0.1% 16.4% 0.1%Fixed Rate Mortgage Current 720 - 779 120% - 150% 4.4% 0.1% 21.6% 0.3%Fixed Rate Mortgage Current 720 - 779 over 150% 4.0% 0.7% 48.5% 1.3%Fixed Rate Mortgage Current 720 - 779 8.8% 0.0% 12.6% 0.0%
Fixed Rate Mortgage Current 660 - 719 under 50% 6.9% 0.1% 0.0% 0.0%Fixed Rate Mortgage Current 660 - 719 50% - 75% 6.8% 0.1% 10.0% 0.1%Fixed Rate Mortgage Current 660 - 719 75% - 100% 6.6% 0.2% 15.0% 0.2%Fixed Rate Mortgage Current 660 - 719 100% - 120% 6.7% 0.5% 16.7% 0.6%Fixed Rate Mortgage Current 660 - 719 120% - 150% 4.1% 0.6% 20.9% 1.3%Fixed Rate Mortgage Current 660 - 719 over 150% 4.0% 1.4% 34.9% 4.7%Fixed Rate Mortgage Current 660 - 719 6.7% 0.2% 13.2% 0.2%
Fixed Rate Mortgage Delinquent 30-59 under 50% 4.0% 13.4% 0.0% 0.0%Fixed Rate Mortgage Delinquent 30-59 50% - 75% 4.1% 11.1% 10.0% 5.4%Fixed Rate Mortgage Delinquent 30-59 75% - 100% 4.0% 30.1% 15.0% 12.5%Fixed Rate Mortgage Delinquent 30-59 100% - 120% 4.0% 30.7% 15.8% 13.0%Fixed Rate Mortgage Delinquent 30-59 120% - 150% 4.0% 30.1% 21.9% 18.5%Fixed Rate Mortgage Delinquent 30-59 over 150% 4.0% 55.8% 38.0% 35.4%Fixed Rate Mortgage Delinquent 30-59 4.0% 22.1% 13.7% 9.6%
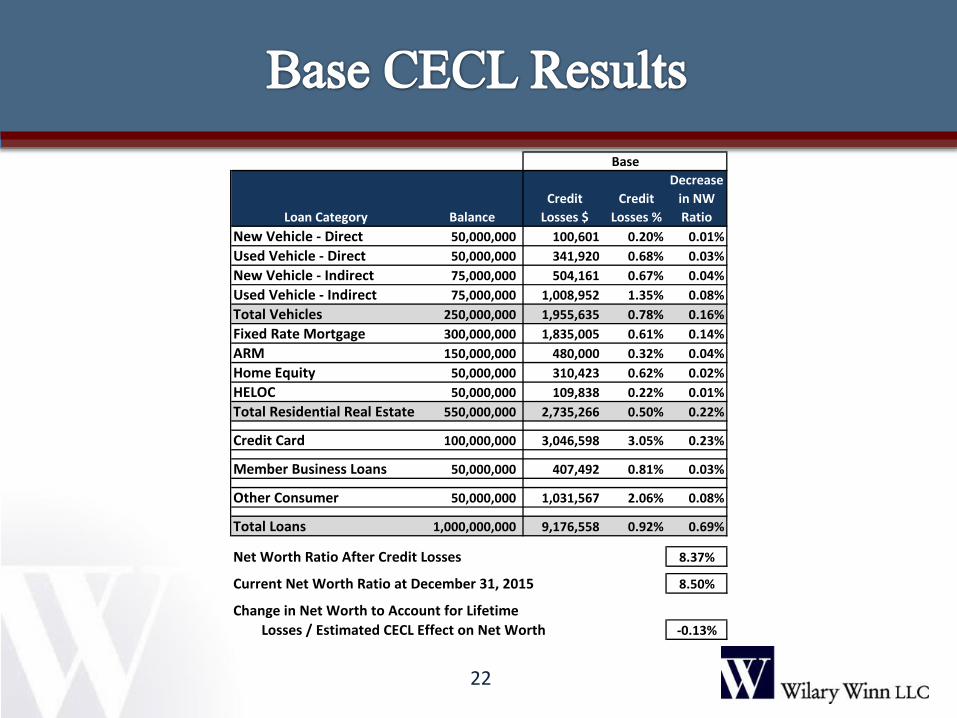
22
Loan Category BalanceCredit
Losses $Credit
Losses %
Decrease in NW Ratio
New Vehicle - Direct 50,000,000 100,601 0.20% 0.01%Used Vehicle - Direct 50,000,000 341,920 0.68% 0.03%New Vehicle - Indirect 75,000,000 504,161 0.67% 0.04%Used Vehicle - Indirect 75,000,000 1,008,952 1.35% 0.08%Total Vehicles 250,000,000 1,955,635 0.78% 0.16%Fixed Rate Mortgage 300,000,000 1,835,005 0.61% 0.14%ARM 150,000,000 480,000 0.32% 0.04%Home Equity 50,000,000 310,423 0.62% 0.02%HELOC 50,000,000 109,838 0.22% 0.01%Total Residential Real Estate 550,000,000 2,735,266 0.50% 0.22%
Credit Card 100,000,000 3,046,598 3.05% 0.23%
Member Business Loans 50,000,000 407,492 0.81% 0.03%
Other Consumer 50,000,000 1,031,567 2.06% 0.08%
Total Loans 1,000,000,000 9,176,558 0.92% 0.69%
Net Worth Ratio After Credit Losses 8.37%
Current Net Worth Ratio at December 31, 2015 8.50%
Change in Net Worth to Account for Lifetime Losses / Estimated CECL Effect on Net Worth -0.13%
Base
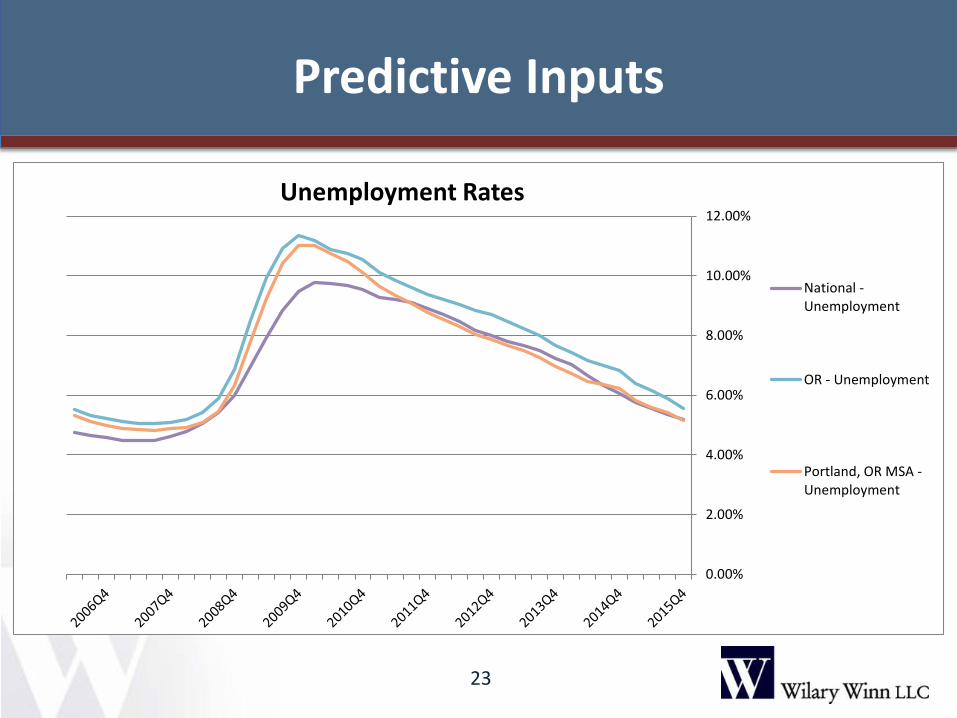
Predictive Inputs
23
0.00%
2.00%
4.00%
6.00%
8.00%
10.00%
12.00%Unemployment Rates
National -Unemployment
OR - Unemployment
Portland, OR MSA -Unemployment
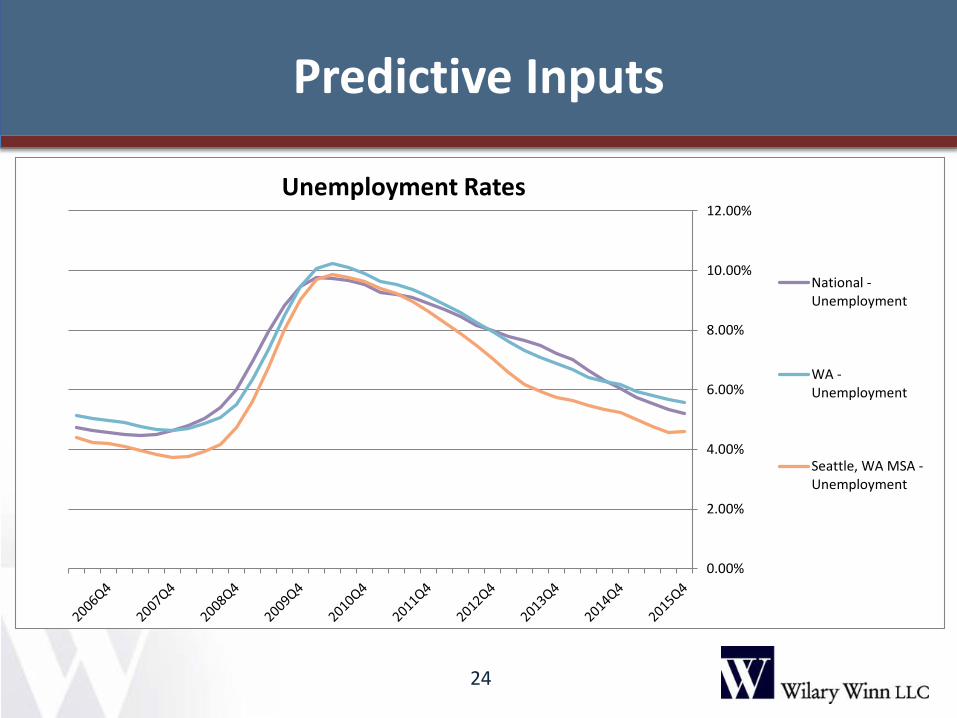
Predictive Inputs
24
0.00%
2.00%
4.00%
6.00%
8.00%
10.00%
12.00%Unemployment Rates
National -Unemployment
WA -Unemployment
Seattle, WA MSA -Unemployment
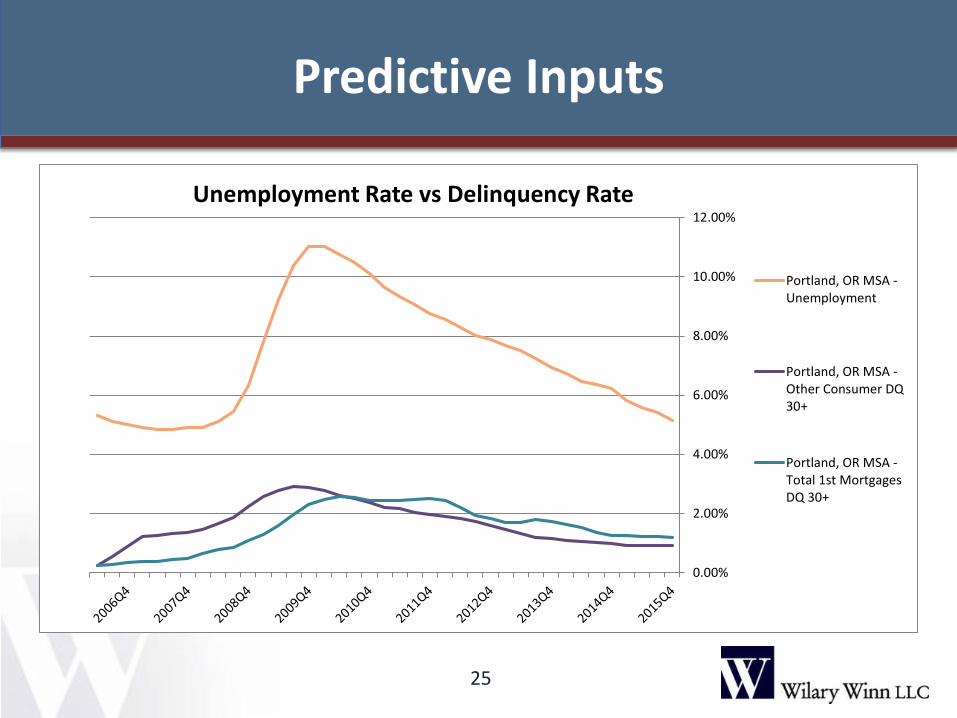
Predictive Inputs
25
0.00%
2.00%
4.00%
6.00%
8.00%
10.00%
12.00%Unemployment Rate vs Delinquency Rate
Portland, OR MSA -Unemployment
Portland, OR MSA -Other Consumer DQ30+
Portland, OR MSA -Total 1st MortgagesDQ 30+
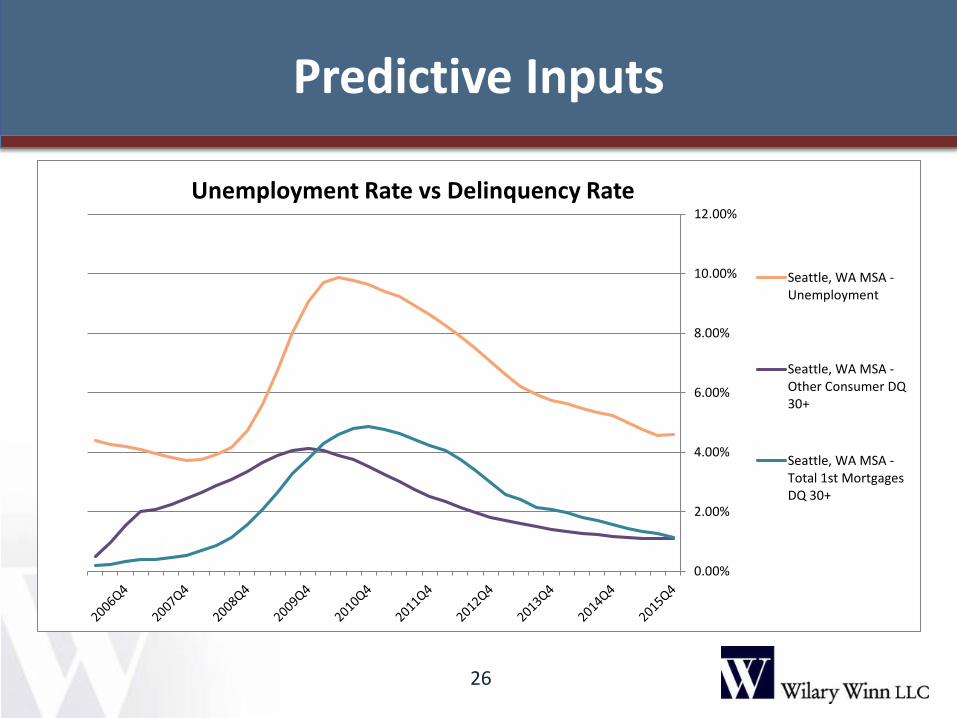
Predictive Inputs
26
0.00%
2.00%
4.00%
6.00%
8.00%
10.00%
12.00%Unemployment Rate vs Delinquency Rate
Seattle, WA MSA -Unemployment
Seattle, WA MSA -Other Consumer DQ30+
Seattle, WA MSA -Total 1st MortgagesDQ 30+
Predictive Inputs
27
Quantifying the relationship between unemployment and defaults • Perform regression analysis to determine best fit trend
line including beta and R-squared • Perform roll rate analysis to determine estimated default
rates for any given unemployment rate • Utilize changes between scenarios to determine default
factors
Predictive Inputs
28
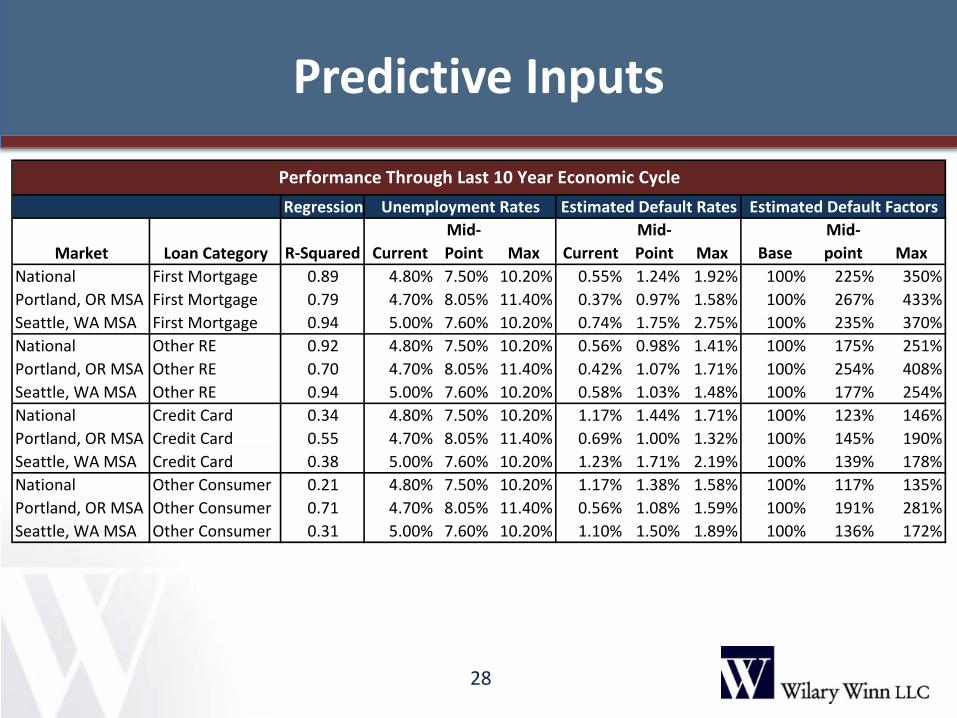
Regression
Market Loan Category R-Squared Current Mid-Point Max Current
Mid-Point Max Base
Mid-point Max
National First Mortgage 0.89 4.80% 7.50% 10.20% 0.55% 1.24% 1.92% 100% 225% 350%Portland, OR MSA First Mortgage 0.79 4.70% 8.05% 11.40% 0.37% 0.97% 1.58% 100% 267% 433%Seattle, WA MSA First Mortgage 0.94 5.00% 7.60% 10.20% 0.74% 1.75% 2.75% 100% 235% 370%National Other RE 0.92 4.80% 7.50% 10.20% 0.56% 0.98% 1.41% 100% 175% 251%Portland, OR MSA Other RE 0.70 4.70% 8.05% 11.40% 0.42% 1.07% 1.71% 100% 254% 408%Seattle, WA MSA Other RE 0.94 5.00% 7.60% 10.20% 0.58% 1.03% 1.48% 100% 177% 254%National Credit Card 0.34 4.80% 7.50% 10.20% 1.17% 1.44% 1.71% 100% 123% 146%Portland, OR MSA Credit Card 0.55 4.70% 8.05% 11.40% 0.69% 1.00% 1.32% 100% 145% 190%Seattle, WA MSA Credit Card 0.38 5.00% 7.60% 10.20% 1.23% 1.71% 2.19% 100% 139% 178%National Other Consumer 0.21 4.80% 7.50% 10.20% 1.17% 1.38% 1.58% 100% 117% 135%Portland, OR MSA Other Consumer 0.71 4.70% 8.05% 11.40% 0.56% 1.08% 1.59% 100% 191% 281%Seattle, WA MSA Other Consumer 0.31 5.00% 7.60% 10.20% 1.10% 1.50% 1.89% 100% 136% 172%
Performance Through Last 10 Year Economic CycleUnemployment Rates Estimated Default Rates Estimated Default Factors
Predictive Inputs
29
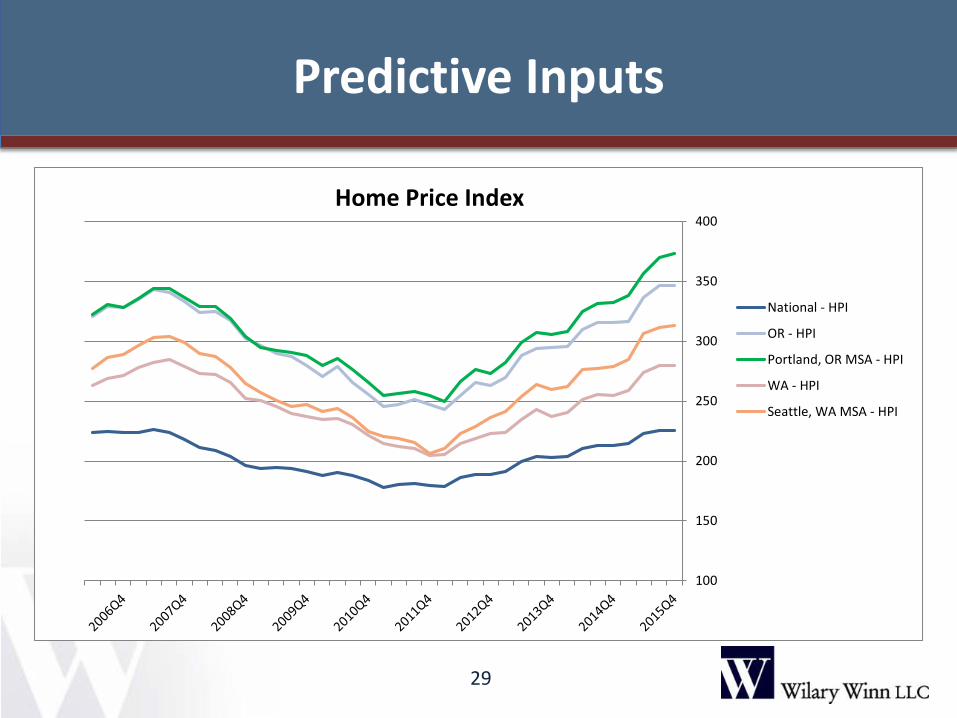
100
150
200
250
300
350
400Home Price Index
National - HPI
OR - HPI
Portland, OR MSA - HPI
WA - HPI
Seattle, WA MSA - HPI
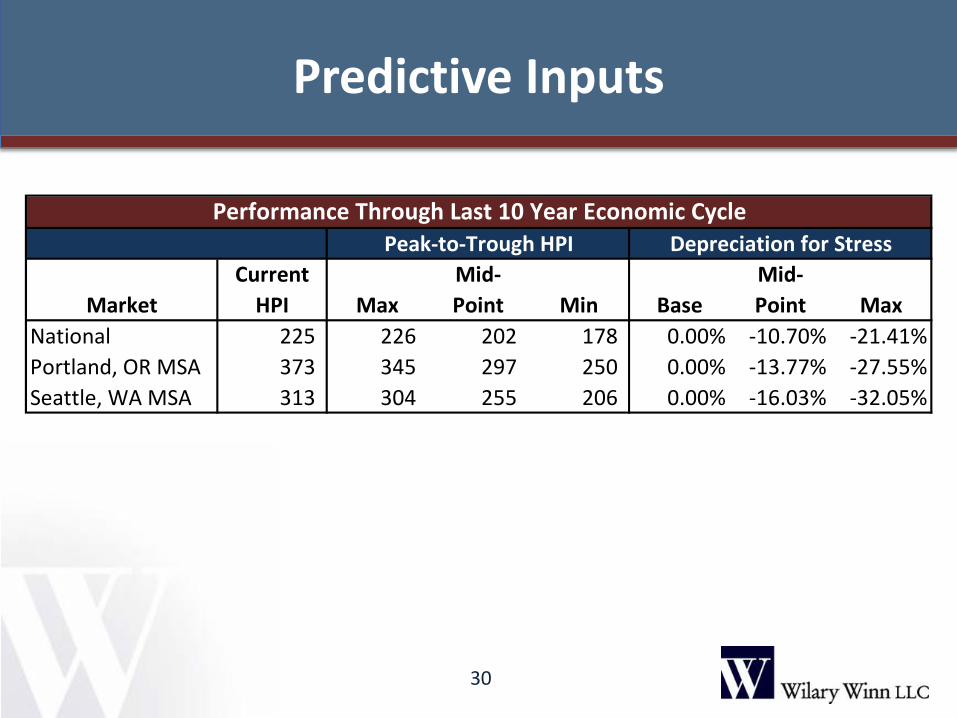
Predictive Inputs
30
MarketCurrent
HPI MaxMid-Point Min Base
Mid-Point Max
National 225 226 202 178 0.00% -10.70% -21.41%Portland, OR MSA 373 345 297 250 0.00% -13.77% -27.55%Seattle, WA MSA 313 304 255 206 0.00% -16.03% -32.05%
Peak-to-Trough HPI Depreciation for StressPerformance Through Last 10 Year Economic Cycle
Concentration Risk
31
Concentration Risk Stress Testing • Through the last economic cycle markets experienced
both an increase in unemployment and a decrease in housing values
• Both macroeconomic indicators are highly correlated to loan performance
• To stress modeling inputs we utilized the combined effect – Adjust default assumptions for changes in unemployment – Adjust real estate severity assumptions for changed in housing
values
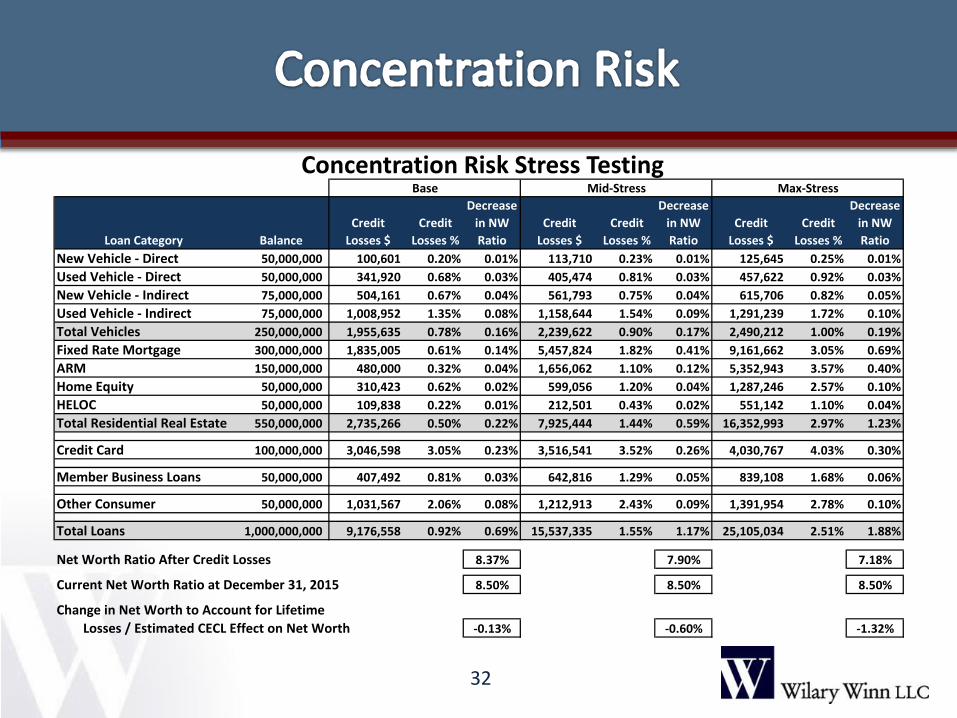
Concentration Risk Stress Testing
32
Loan Category BalanceCredit
Losses $Credit
Losses %
Decrease in NW Ratio
Credit Losses $
Credit Losses %
Decrease in NW Ratio
Credit Losses $
Credit Losses %
Decrease in NW Ratio
New Vehicle - Direct 50,000,000 100,601 0.20% 0.01% 113,710 0.23% 0.01% 125,645 0.25% 0.01%Used Vehicle - Direct 50,000,000 341,920 0.68% 0.03% 405,474 0.81% 0.03% 457,622 0.92% 0.03%New Vehicle - Indirect 75,000,000 504,161 0.67% 0.04% 561,793 0.75% 0.04% 615,706 0.82% 0.05%Used Vehicle - Indirect 75,000,000 1,008,952 1.35% 0.08% 1,158,644 1.54% 0.09% 1,291,239 1.72% 0.10%Total Vehicles 250,000,000 1,955,635 0.78% 0.16% 2,239,622 0.90% 0.17% 2,490,212 1.00% 0.19%Fixed Rate Mortgage 300,000,000 1,835,005 0.61% 0.14% 5,457,824 1.82% 0.41% 9,161,662 3.05% 0.69%ARM 150,000,000 480,000 0.32% 0.04% 1,656,062 1.10% 0.12% 5,352,943 3.57% 0.40%Home Equity 50,000,000 310,423 0.62% 0.02% 599,056 1.20% 0.04% 1,287,246 2.57% 0.10%HELOC 50,000,000 109,838 0.22% 0.01% 212,501 0.43% 0.02% 551,142 1.10% 0.04%Total Residential Real Estate 550,000,000 2,735,266 0.50% 0.22% 7,925,444 1.44% 0.59% 16,352,993 2.97% 1.23%
Credit Card 100,000,000 3,046,598 3.05% 0.23% 3,516,541 3.52% 0.26% 4,030,767 4.03% 0.30%
Member Business Loans 50,000,000 407,492 0.81% 0.03% 642,816 1.29% 0.05% 839,108 1.68% 0.06%
Other Consumer 50,000,000 1,031,567 2.06% 0.08% 1,212,913 2.43% 0.09% 1,391,954 2.78% 0.10%
Total Loans 1,000,000,000 9,176,558 0.92% 0.69% 15,537,335 1.55% 1.17% 25,105,034 2.51% 1.88%
Net Worth Ratio After Credit Losses 8.37% 7.90% 7.18%
Current Net Worth Ratio at December 31, 2015 8.50% 8.50% 8.50%
Change in Net Worth to Account for Lifetime Losses / Estimated CECL Effect on Net Worth -0.13% -0.60% -1.32%
Base Mid-Stress Max-Stress
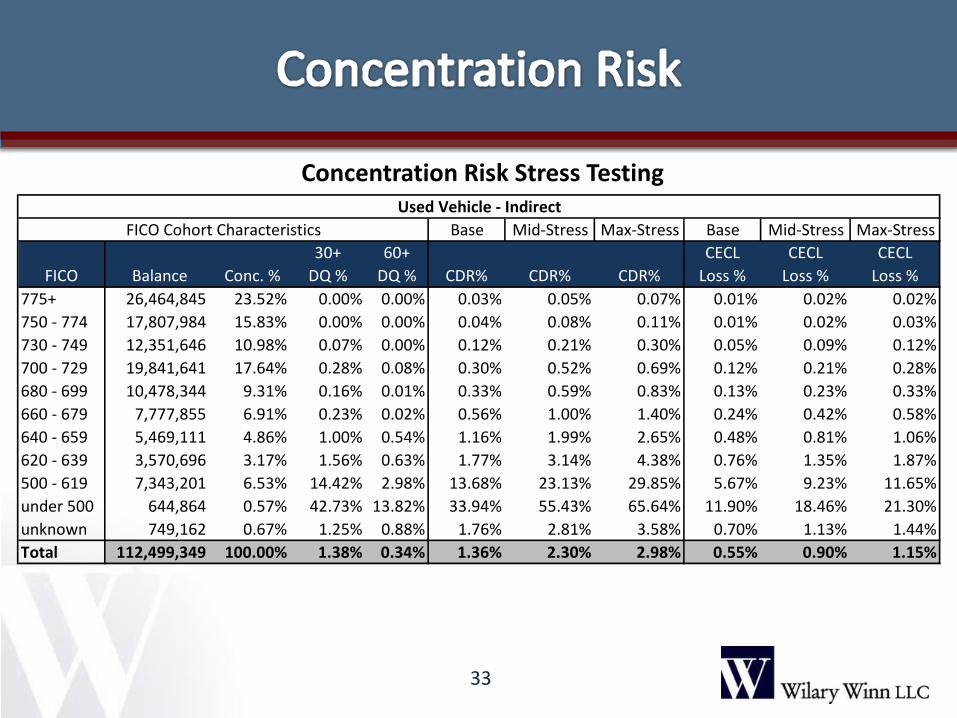
Concentration Risk Stress Testing
33
Base Mid-Stress Max-Stress Base Mid-Stress Max-Stress
FICO Balance Conc. %30+
DQ %60+
DQ % CDR% CDR% CDR%CECL
Loss %CECL
Loss %CECL
Loss %775+ 26,464,845 23.52% 0.00% 0.00% 0.03% 0.05% 0.07% 0.01% 0.02% 0.02%750 - 774 17,807,984 15.83% 0.00% 0.00% 0.04% 0.08% 0.11% 0.01% 0.02% 0.03%730 - 749 12,351,646 10.98% 0.07% 0.00% 0.12% 0.21% 0.30% 0.05% 0.09% 0.12%700 - 729 19,841,641 17.64% 0.28% 0.08% 0.30% 0.52% 0.69% 0.12% 0.21% 0.28%680 - 699 10,478,344 9.31% 0.16% 0.01% 0.33% 0.59% 0.83% 0.13% 0.23% 0.33%660 - 679 7,777,855 6.91% 0.23% 0.02% 0.56% 1.00% 1.40% 0.24% 0.42% 0.58%640 - 659 5,469,111 4.86% 1.00% 0.54% 1.16% 1.99% 2.65% 0.48% 0.81% 1.06%620 - 639 3,570,696 3.17% 1.56% 0.63% 1.77% 3.14% 4.38% 0.76% 1.35% 1.87%500 - 619 7,343,201 6.53% 14.42% 2.98% 13.68% 23.13% 29.85% 5.67% 9.23% 11.65%under 500 644,864 0.57% 42.73% 13.82% 33.94% 55.43% 65.64% 11.90% 18.46% 21.30%unknown 749,162 0.67% 1.25% 0.88% 1.76% 2.81% 3.58% 0.70% 1.13% 1.44%Total 112,499,349 100.00% 1.38% 0.34% 1.36% 2.30% 2.98% 0.55% 0.90% 1.15%
Used Vehicle - IndirectFICO Cohort Characteristics
34
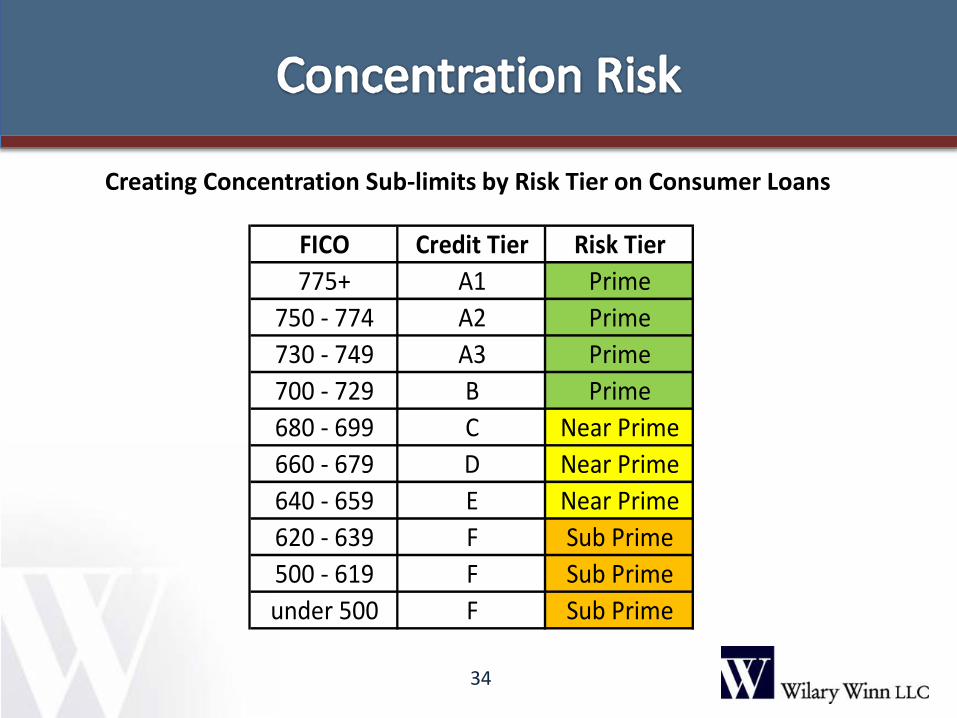
FICO Credit Tier Risk Tier775+ A1 Prime
750 - 774 A2 Prime730 - 749 A3 Prime700 - 729 B Prime680 - 699 C Near Prime660 - 679 D Near Prime640 - 659 E Near Prime620 - 639 F Sub Prime500 - 619 F Sub Primeunder 500 F Sub Prime
Creating Concentration Sub-limits by Risk Tier on Consumer Loans
35
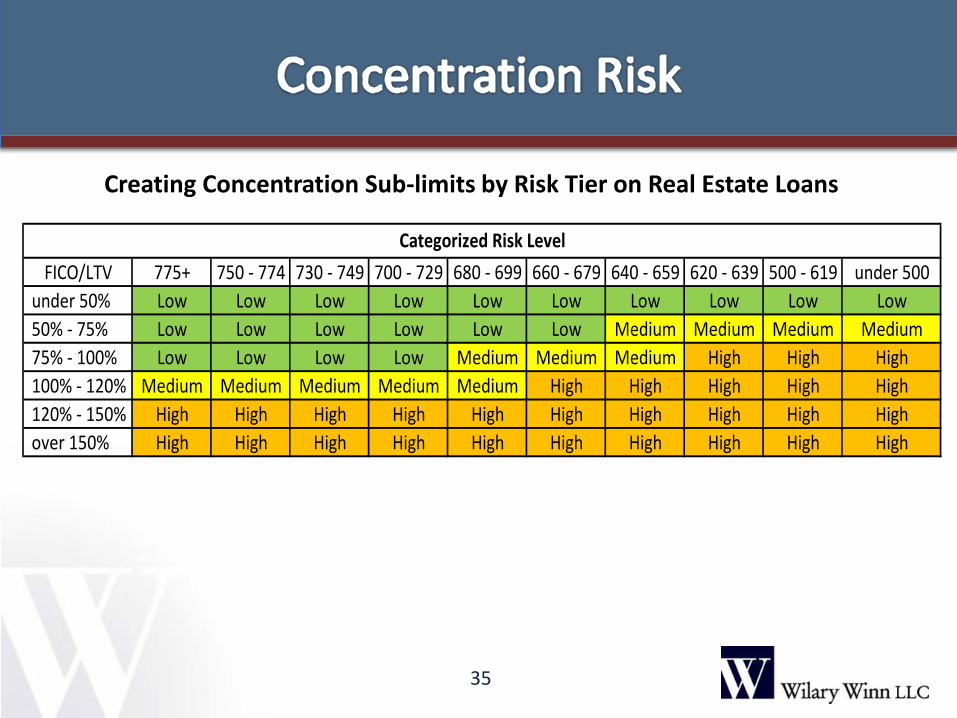
FICO/LTV 775+ 750 - 774 730 - 749 700 - 729 680 - 699 660 - 679 640 - 659 620 - 639 500 - 619 under 500under 50% Low Low Low Low Low Low Low Low Low Low50% - 75% Low Low Low Low Low Low Medium Medium Medium Medium75% - 100% Low Low Low Low Medium Medium Medium High High High100% - 120% Medium Medium Medium Medium Medium High High High High High120% - 150% High High High High High High High High High Highover 150% High High High High High High High High High High
Categorized Risk Level
Creating Concentration Sub-limits by Risk Tier on Real Estate Loans
36
Loan CategoryCurrent Balance
Concentration % of Net Worth
Proposed Limit
Balance at Proposed Limit
Credit Losses $
Credit Losses %
Decrease in NW Ratio
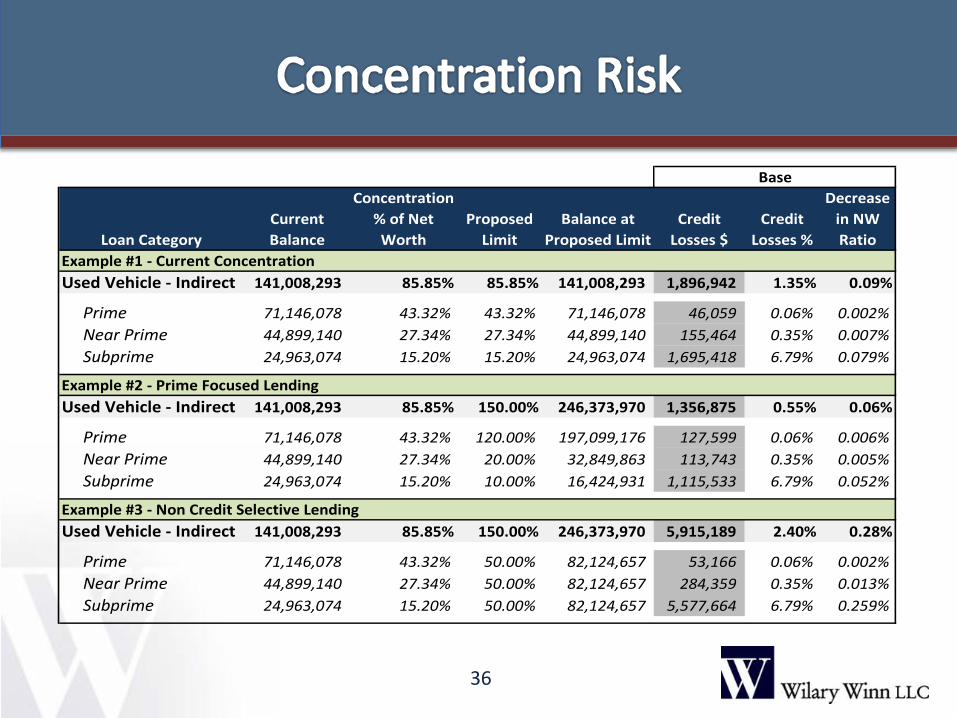
Used Vehicle - Indirect 141,008,293 85.85% 85.85% 141,008,293 1,896,942 1.35% 0.09%
Prime 71,146,078 43.32% 43.32% 71,146,078 46,059 0.06% 0.002% Near Prime 44,899,140 27.34% 27.34% 44,899,140 155,464 0.35% 0.007% Subprime 24,963,074 15.20% 15.20% 24,963,074 1,695,418 6.79% 0.079%
Used Vehicle - Indirect 141,008,293 85.85% 150.00% 246,373,970 1,356,875 0.55% 0.06%
Prime 71,146,078 43.32% 120.00% 197,099,176 127,599 0.06% 0.006% Near Prime 44,899,140 27.34% 20.00% 32,849,863 113,743 0.35% 0.005% Subprime 24,963,074 15.20% 10.00% 16,424,931 1,115,533 6.79% 0.052%
Used Vehicle - Indirect 141,008,293 85.85% 150.00% 246,373,970 5,915,189 2.40% 0.28%
Prime 71,146,078 43.32% 50.00% 82,124,657 53,166 0.06% 0.002% Near Prime 44,899,140 27.34% 50.00% 82,124,657 284,359 0.35% 0.013% Subprime 24,963,074 15.20% 50.00% 82,124,657 5,577,664 6.79% 0.259%
Base
Example #1 - Current Concentration
Example #3 - Non Credit Selective Lending
Example #2 - Prime Focused Lending
37
Loan CategoryCurrent Balance
Current Concentration
% of Net WorthProposed
LimitBalance at
Proposed LimitLoan Growth within Limit
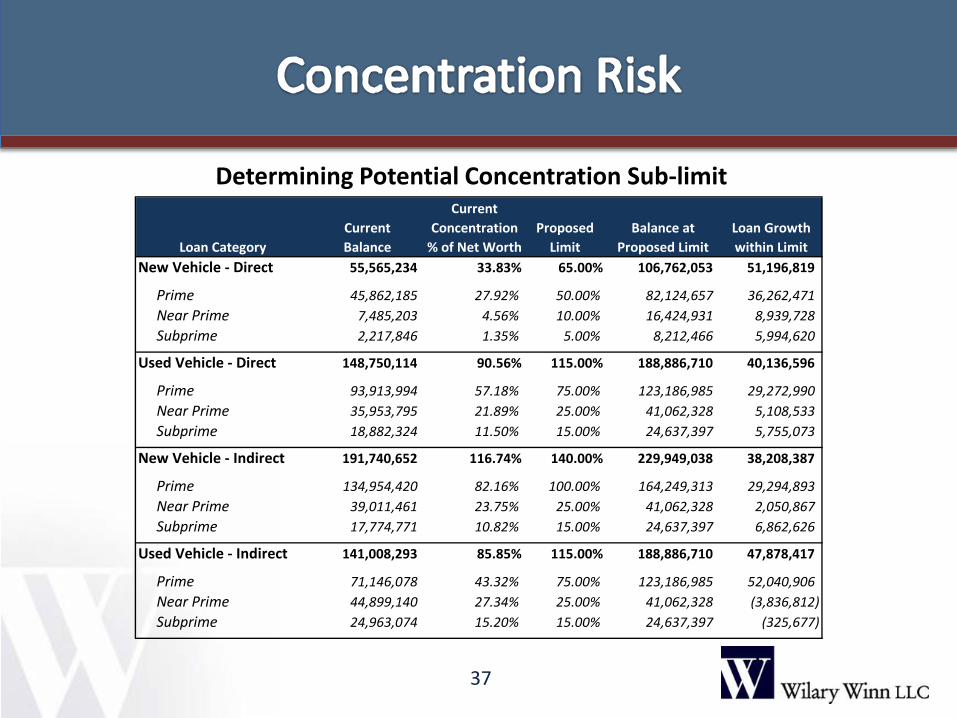
New Vehicle - Direct 55,565,234 33.83% 65.00% 106,762,053 51,196,819
Prime 45,862,185 27.92% 50.00% 82,124,657 36,262,471 Near Prime 7,485,203 4.56% 10.00% 16,424,931 8,939,728 Subprime 2,217,846 1.35% 5.00% 8,212,466 5,994,620
Used Vehicle - Direct 148,750,114 90.56% 115.00% 188,886,710 40,136,596
Prime 93,913,994 57.18% 75.00% 123,186,985 29,272,990 Near Prime 35,953,795 21.89% 25.00% 41,062,328 5,108,533 Subprime 18,882,324 11.50% 15.00% 24,637,397 5,755,073
New Vehicle - Indirect 191,740,652 116.74% 140.00% 229,949,038 38,208,387
Prime 134,954,420 82.16% 100.00% 164,249,313 29,294,893 Near Prime 39,011,461 23.75% 25.00% 41,062,328 2,050,867 Subprime 17,774,771 10.82% 15.00% 24,637,397 6,862,626
Used Vehicle - Indirect 141,008,293 85.85% 115.00% 188,886,710 47,878,417
Prime 71,146,078 43.32% 75.00% 123,186,985 52,040,906 Near Prime 44,899,140 27.34% 25.00% 41,062,328 (3,836,812) Subprime 24,963,074 15.20% 15.00% 24,637,397 (325,677)
Determining Potential Concentration Sub-limit
38
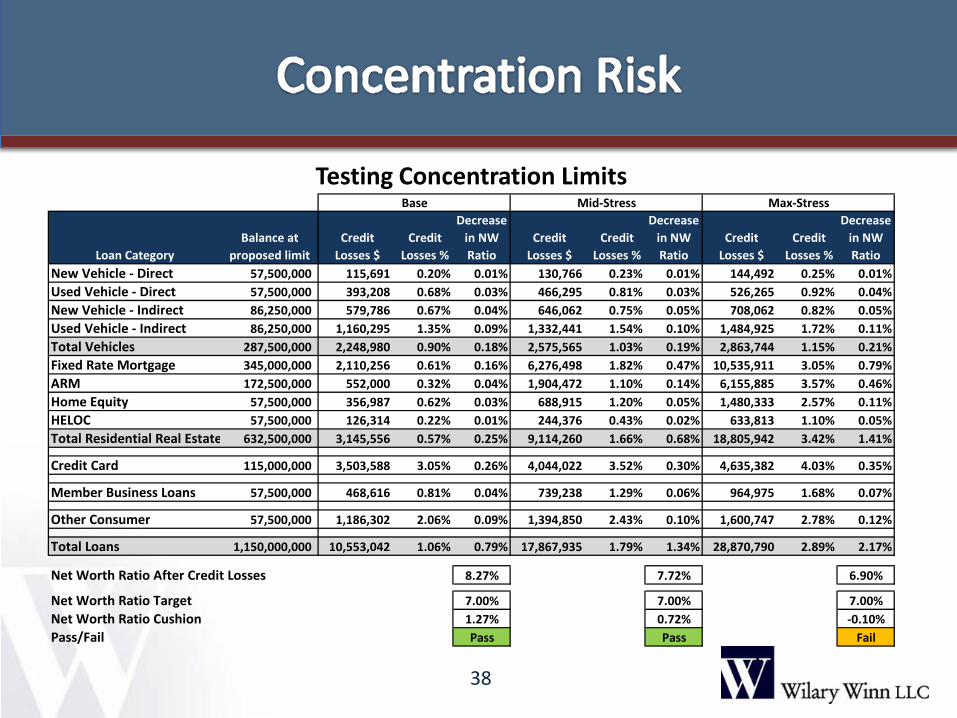
Loan CategoryBalance at
proposed limitCredit
Losses $Credit
Losses %
Decrease in NW Ratio
Credit Losses $
Credit Losses %
Decrease in NW Ratio
Credit Losses $
Credit Losses %
Decrease in NW Ratio
New Vehicle - Direct 57,500,000 115,691 0.20% 0.01% 130,766 0.23% 0.01% 144,492 0.25% 0.01%Used Vehicle - Direct 57,500,000 393,208 0.68% 0.03% 466,295 0.81% 0.03% 526,265 0.92% 0.04%New Vehicle - Indirect 86,250,000 579,786 0.67% 0.04% 646,062 0.75% 0.05% 708,062 0.82% 0.05%Used Vehicle - Indirect 86,250,000 1,160,295 1.35% 0.09% 1,332,441 1.54% 0.10% 1,484,925 1.72% 0.11%Total Vehicles 287,500,000 2,248,980 0.90% 0.18% 2,575,565 1.03% 0.19% 2,863,744 1.15% 0.21%Fixed Rate Mortgage 345,000,000 2,110,256 0.61% 0.16% 6,276,498 1.82% 0.47% 10,535,911 3.05% 0.79%ARM 172,500,000 552,000 0.32% 0.04% 1,904,472 1.10% 0.14% 6,155,885 3.57% 0.46%Home Equity 57,500,000 356,987 0.62% 0.03% 688,915 1.20% 0.05% 1,480,333 2.57% 0.11%HELOC 57,500,000 126,314 0.22% 0.01% 244,376 0.43% 0.02% 633,813 1.10% 0.05%Total Residential Real Estate 632,500,000 3,145,556 0.57% 0.25% 9,114,260 1.66% 0.68% 18,805,942 3.42% 1.41%
Credit Card 115,000,000 3,503,588 3.05% 0.26% 4,044,022 3.52% 0.30% 4,635,382 4.03% 0.35%
Member Business Loans 57,500,000 468,616 0.81% 0.04% 739,238 1.29% 0.06% 964,975 1.68% 0.07%
Other Consumer 57,500,000 1,186,302 2.06% 0.09% 1,394,850 2.43% 0.10% 1,600,747 2.78% 0.12%
Total Loans 1,150,000,000 10,553,042 1.06% 0.79% 17,867,935 1.79% 1.34% 28,870,790 2.89% 2.17%
Net Worth Ratio After Credit Losses 8.27% 7.72% 6.90%
Net Worth Ratio Target 7.00% 7.00% 7.00%Net Worth Ratio Cushion 1.27% 0.72% -0.10%Pass/Fail Pass Pass Fail
Base Mid-Stress Max-Stress
Testing Concentration Limits
Risk-Based Pricing
39
Summary Loan Category 775+750 - 774
730 - 749
700 - 729
680 - 699
660 - 679
640 - 659
620 - 639
500 - 619
under 500 Total
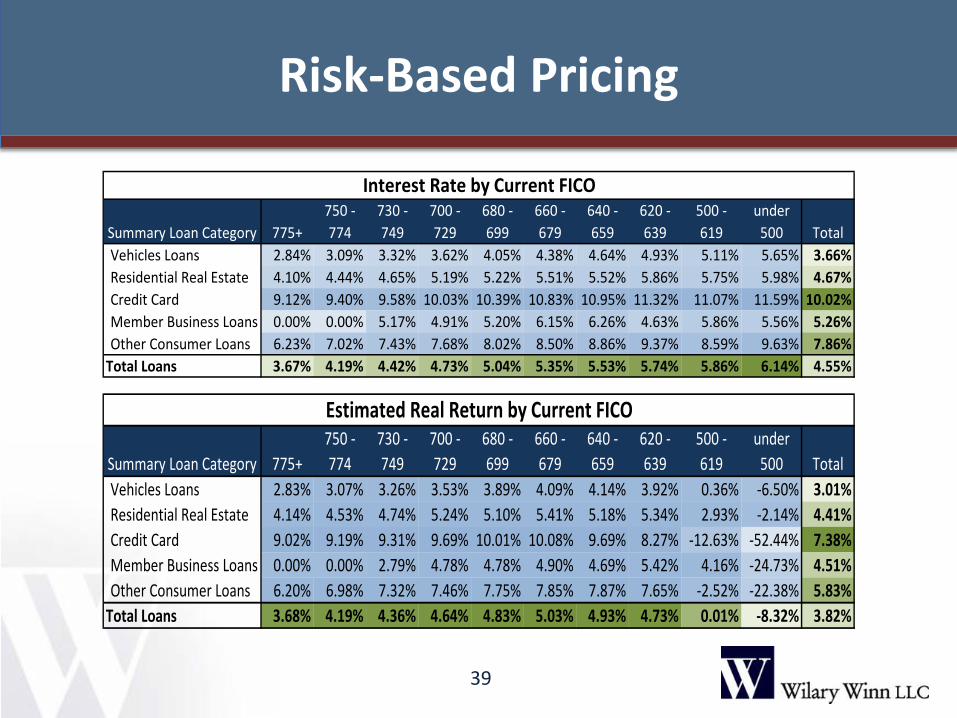
Vehicles Loans 2.84% 3.09% 3.32% 3.62% 4.05% 4.38% 4.64% 4.93% 5.11% 5.65% 3.66%Residential Real Estate 4.10% 4.44% 4.65% 5.19% 5.22% 5.51% 5.52% 5.86% 5.75% 5.98% 4.67%Credit Card 9.12% 9.40% 9.58% 10.03% 10.39% 10.83% 10.95% 11.32% 11.07% 11.59% 10.02%Member Business Loans 0.00% 0.00% 5.17% 4.91% 5.20% 6.15% 6.26% 4.63% 5.86% 5.56% 5.26%Other Consumer Loans 6.23% 7.02% 7.43% 7.68% 8.02% 8.50% 8.86% 9.37% 8.59% 9.63% 7.86%
Total Loans 3.67% 4.19% 4.42% 4.73% 5.04% 5.35% 5.53% 5.74% 5.86% 6.14% 4.55%
Interest Rate by Current FICO
Summary Loan Category 775+750 - 774
730 - 749
700 - 729
680 - 699
660 - 679
640 - 659
620 - 639
500 - 619
under 500 Total
Vehicles Loans 2.83% 3.07% 3.26% 3.53% 3.89% 4.09% 4.14% 3.92% 0.36% -6.50% 3.01%Residential Real Estate 4.14% 4.53% 4.74% 5.24% 5.10% 5.41% 5.18% 5.34% 2.93% -2.14% 4.41%Credit Card 9.02% 9.19% 9.31% 9.69% 10.01% 10.08% 9.69% 8.27% -12.63% -52.44% 7.38%Member Business Loans 0.00% 0.00% 2.79% 4.78% 4.78% 4.90% 4.69% 5.42% 4.16% -24.73% 4.51%Other Consumer Loans 6.20% 6.98% 7.32% 7.46% 7.75% 7.85% 7.87% 7.65% -2.52% -22.38% 5.83%
Total Loans 3.68% 4.19% 4.36% 4.64% 4.83% 5.03% 4.93% 4.73% 0.01% -8.32% 3.82%
Estimated Real Return by Current FICO
Why The Change to CECL?
• GAAP did not properly reflect risk pre-financial crisis because of the delayed recognition of credit losses
• Departs from the incurred loss model which means the probable threshold is removed – Removes the prohibition on recording day one losses
40
FASB Proposed Accounting Standards Update (ASU)
• Second CECL ASU was issued on December 20, 2012 • Comment time period ended May 31, 2013 • Final rule was expected end of 2014 • Now final rule is expected 2Q 2016 with implementation
required for credit unions in 2021 • Rule will significantly change the allowance for loan and
lease losses and other approaches to impairment • Not just the ALLL, applies to all financial assets not
classified at fair value e.g. AFS securities not included in scope
41
Amortized Cost Should be Based on the Present Value of the Cash Flows an Entity Expects to Collect
• Contractual cash flows are adjusted for expected prepayments and defaults – Cash flows should not be adjusted for extensions, renewals, or
modifications unless a TDR is reasonably expected
• Cash flows expected to be collected are discounted at the effective interest rate
• Cash flows not expected to be collected are also discounted at the effective interest rate
42
Measuring Expected Credit Losses
• Begin with historical loss rates for similar assets (grouped approach)
• Adjust for current conditions • Adjust for reasonable and supportable forecasts • Life of loan estimate - can assume economic conditions
after the end of the reasonable forecast time period remain the same or can revert to historical loss rates – Final guidance is expected to state that the entity should revert
to historical loss experience
43
Technical Considerations
• Permits allowance calculation to be based on methods which “implicitly” include the time value of money – DCF explicitly considers time value of money – Loss-rate, roll-rates, probability of default methods, and
provision matrices implicitly consider discount
• Contemplates use of mean and not mode if using statistical modeling
44
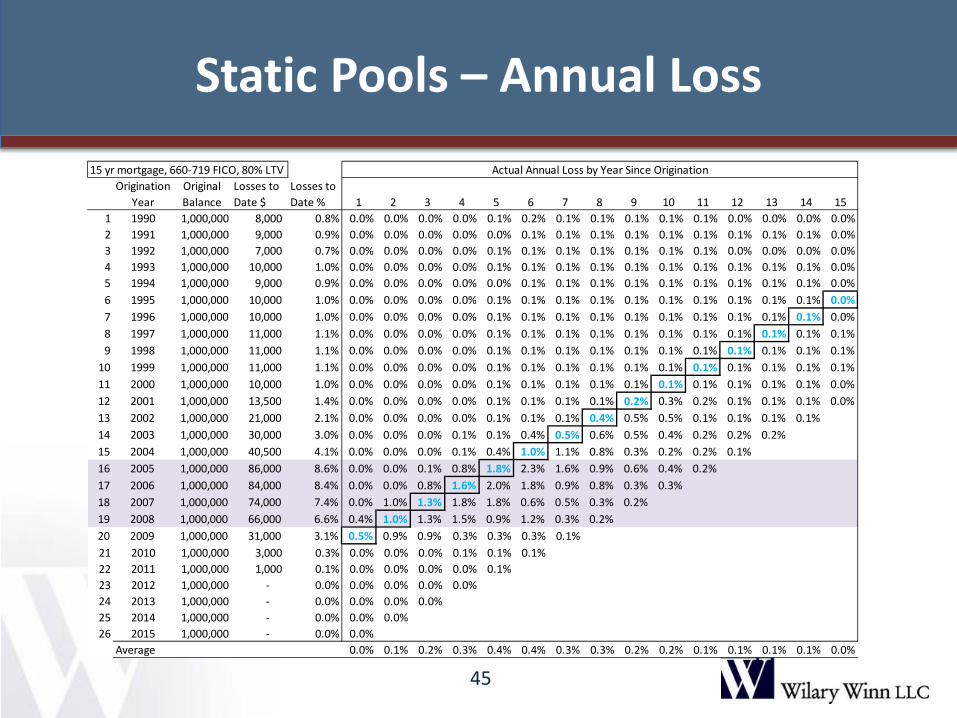
Static Pools – Annual Loss
45
15 yr mortgage, 660-719 FICO, 80% LTV Actual Annual Loss by Year Since OriginationOrigination
YearOriginal Balance
Losses to Date $
Losses to Date % 1 2 3 4 5 6 7 8 9 10 11 12 13 14 15
1 1990 1,000,000 8,000 0.8% 0.0% 0.0% 0.0% 0.0% 0.1% 0.2% 0.1% 0.1% 0.1% 0.1% 0.1% 0.0% 0.0% 0.0% 0.0%2 1991 1,000,000 9,000 0.9% 0.0% 0.0% 0.0% 0.0% 0.0% 0.1% 0.1% 0.1% 0.1% 0.1% 0.1% 0.1% 0.1% 0.1% 0.0%3 1992 1,000,000 7,000 0.7% 0.0% 0.0% 0.0% 0.0% 0.1% 0.1% 0.1% 0.1% 0.1% 0.1% 0.1% 0.0% 0.0% 0.0% 0.0%4 1993 1,000,000 10,000 1.0% 0.0% 0.0% 0.0% 0.0% 0.1% 0.1% 0.1% 0.1% 0.1% 0.1% 0.1% 0.1% 0.1% 0.1% 0.0%5 1994 1,000,000 9,000 0.9% 0.0% 0.0% 0.0% 0.0% 0.0% 0.1% 0.1% 0.1% 0.1% 0.1% 0.1% 0.1% 0.1% 0.1% 0.0%6 1995 1,000,000 10,000 1.0% 0.0% 0.0% 0.0% 0.0% 0.1% 0.1% 0.1% 0.1% 0.1% 0.1% 0.1% 0.1% 0.1% 0.1% 0.0%7 1996 1,000,000 10,000 1.0% 0.0% 0.0% 0.0% 0.0% 0.1% 0.1% 0.1% 0.1% 0.1% 0.1% 0.1% 0.1% 0.1% 0.1% 0.0%8 1997 1,000,000 11,000 1.1% 0.0% 0.0% 0.0% 0.0% 0.1% 0.1% 0.1% 0.1% 0.1% 0.1% 0.1% 0.1% 0.1% 0.1% 0.1%9 1998 1,000,000 11,000 1.1% 0.0% 0.0% 0.0% 0.0% 0.1% 0.1% 0.1% 0.1% 0.1% 0.1% 0.1% 0.1% 0.1% 0.1% 0.1%
10 1999 1,000,000 11,000 1.1% 0.0% 0.0% 0.0% 0.0% 0.1% 0.1% 0.1% 0.1% 0.1% 0.1% 0.1% 0.1% 0.1% 0.1% 0.1%11 2000 1,000,000 10,000 1.0% 0.0% 0.0% 0.0% 0.0% 0.1% 0.1% 0.1% 0.1% 0.1% 0.1% 0.1% 0.1% 0.1% 0.1% 0.0%12 2001 1,000,000 13,500 1.4% 0.0% 0.0% 0.0% 0.0% 0.1% 0.1% 0.1% 0.1% 0.2% 0.3% 0.2% 0.1% 0.1% 0.1% 0.0%13 2002 1,000,000 21,000 2.1% 0.0% 0.0% 0.0% 0.0% 0.1% 0.1% 0.1% 0.4% 0.5% 0.5% 0.1% 0.1% 0.1% 0.1%14 2003 1,000,000 30,000 3.0% 0.0% 0.0% 0.0% 0.1% 0.1% 0.4% 0.5% 0.6% 0.5% 0.4% 0.2% 0.2% 0.2%15 2004 1,000,000 40,500 4.1% 0.0% 0.0% 0.0% 0.1% 0.4% 1.0% 1.1% 0.8% 0.3% 0.2% 0.2% 0.1%16 2005 1,000,000 86,000 8.6% 0.0% 0.0% 0.1% 0.8% 1.8% 2.3% 1.6% 0.9% 0.6% 0.4% 0.2%17 2006 1,000,000 84,000 8.4% 0.0% 0.0% 0.8% 1.6% 2.0% 1.8% 0.9% 0.8% 0.3% 0.3%18 2007 1,000,000 74,000 7.4% 0.0% 1.0% 1.3% 1.8% 1.8% 0.6% 0.5% 0.3% 0.2%19 2008 1,000,000 66,000 6.6% 0.4% 1.0% 1.3% 1.5% 0.9% 1.2% 0.3% 0.2%20 2009 1,000,000 31,000 3.1% 0.5% 0.9% 0.9% 0.3% 0.3% 0.3% 0.1%21 2010 1,000,000 3,000 0.3% 0.0% 0.0% 0.0% 0.1% 0.1% 0.1%22 2011 1,000,000 1,000 0.1% 0.0% 0.0% 0.0% 0.0% 0.1%23 2012 1,000,000 - 0.0% 0.0% 0.0% 0.0% 0.0%24 2013 1,000,000 - 0.0% 0.0% 0.0% 0.0%25 2014 1,000,000 - 0.0% 0.0% 0.0%26 2015 1,000,000 - 0.0% 0.0%
Average 0.0% 0.1% 0.2% 0.3% 0.4% 0.4% 0.3% 0.3% 0.2% 0.2% 0.1% 0.1% 0.1% 0.1% 0.0%
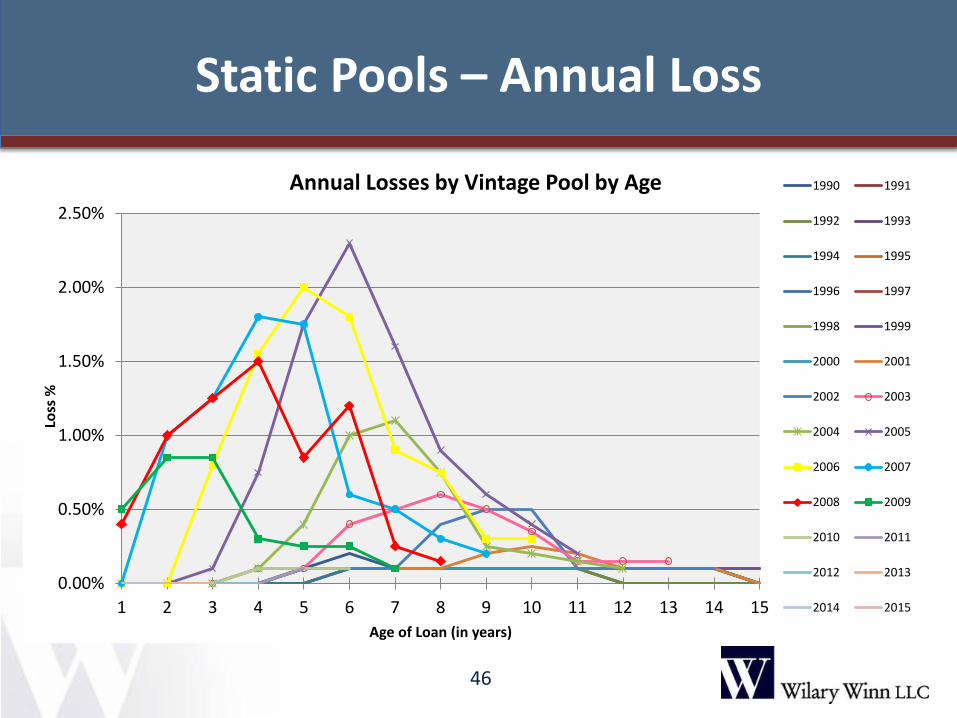
Static Pools – Annual Loss
46
0.00%
0.50%
1.00%
1.50%
2.00%
2.50%
1 2 3 4 5 6 7 8 9 10 11 12 13 14 15
Loss
%
Age of Loan (in years)
Annual Losses by Vintage Pool by Age 1990 1991
1992 1993
1994 1995
1996 1997
1998 1999
2000 2001
2002 2003
2004 2005
2006 2007
2008 2009
2010 2011
2012 2013
2014 2015
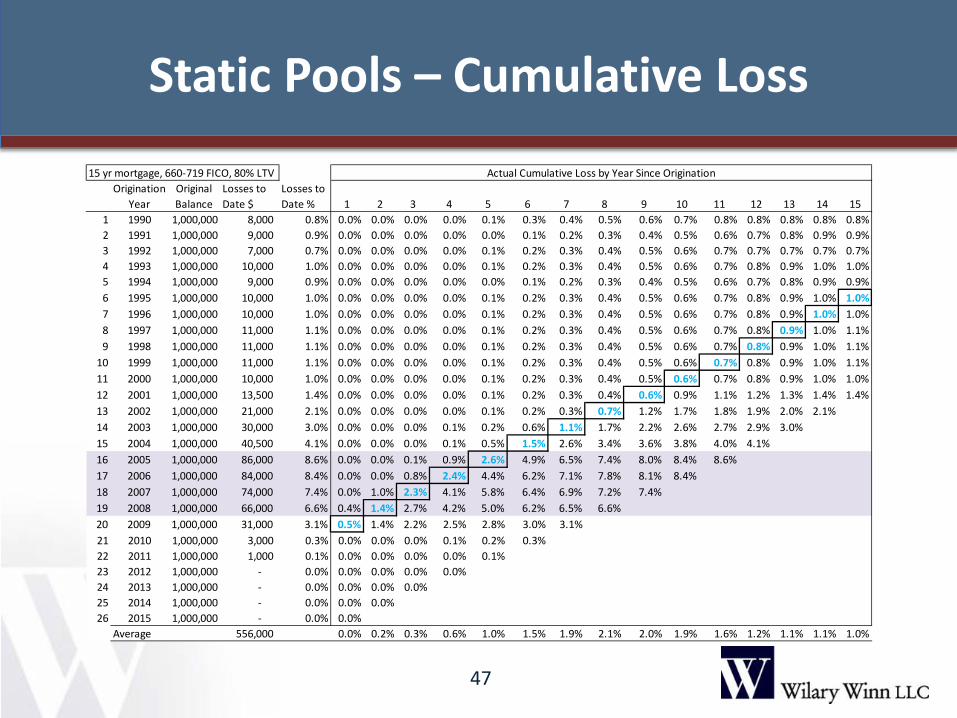
Static Pools – Cumulative Loss
47
15 yr mortgage, 660-719 FICO, 80% LTV Actual Cumulative Loss by Year Since OriginationOrigination
YearOriginal Balance
Losses to Date $
Losses to Date % 1 2 3 4 5 6 7 8 9 10 11 12 13 14 15
1 1990 1,000,000 8,000 0.8% 0.0% 0.0% 0.0% 0.0% 0.1% 0.3% 0.4% 0.5% 0.6% 0.7% 0.8% 0.8% 0.8% 0.8% 0.8%2 1991 1,000,000 9,000 0.9% 0.0% 0.0% 0.0% 0.0% 0.0% 0.1% 0.2% 0.3% 0.4% 0.5% 0.6% 0.7% 0.8% 0.9% 0.9%3 1992 1,000,000 7,000 0.7% 0.0% 0.0% 0.0% 0.0% 0.1% 0.2% 0.3% 0.4% 0.5% 0.6% 0.7% 0.7% 0.7% 0.7% 0.7%4 1993 1,000,000 10,000 1.0% 0.0% 0.0% 0.0% 0.0% 0.1% 0.2% 0.3% 0.4% 0.5% 0.6% 0.7% 0.8% 0.9% 1.0% 1.0%5 1994 1,000,000 9,000 0.9% 0.0% 0.0% 0.0% 0.0% 0.0% 0.1% 0.2% 0.3% 0.4% 0.5% 0.6% 0.7% 0.8% 0.9% 0.9%6 1995 1,000,000 10,000 1.0% 0.0% 0.0% 0.0% 0.0% 0.1% 0.2% 0.3% 0.4% 0.5% 0.6% 0.7% 0.8% 0.9% 1.0% 1.0%7 1996 1,000,000 10,000 1.0% 0.0% 0.0% 0.0% 0.0% 0.1% 0.2% 0.3% 0.4% 0.5% 0.6% 0.7% 0.8% 0.9% 1.0% 1.0%8 1997 1,000,000 11,000 1.1% 0.0% 0.0% 0.0% 0.0% 0.1% 0.2% 0.3% 0.4% 0.5% 0.6% 0.7% 0.8% 0.9% 1.0% 1.1%9 1998 1,000,000 11,000 1.1% 0.0% 0.0% 0.0% 0.0% 0.1% 0.2% 0.3% 0.4% 0.5% 0.6% 0.7% 0.8% 0.9% 1.0% 1.1%
10 1999 1,000,000 11,000 1.1% 0.0% 0.0% 0.0% 0.0% 0.1% 0.2% 0.3% 0.4% 0.5% 0.6% 0.7% 0.8% 0.9% 1.0% 1.1%11 2000 1,000,000 10,000 1.0% 0.0% 0.0% 0.0% 0.0% 0.1% 0.2% 0.3% 0.4% 0.5% 0.6% 0.7% 0.8% 0.9% 1.0% 1.0%12 2001 1,000,000 13,500 1.4% 0.0% 0.0% 0.0% 0.0% 0.1% 0.2% 0.3% 0.4% 0.6% 0.9% 1.1% 1.2% 1.3% 1.4% 1.4%13 2002 1,000,000 21,000 2.1% 0.0% 0.0% 0.0% 0.0% 0.1% 0.2% 0.3% 0.7% 1.2% 1.7% 1.8% 1.9% 2.0% 2.1%14 2003 1,000,000 30,000 3.0% 0.0% 0.0% 0.0% 0.1% 0.2% 0.6% 1.1% 1.7% 2.2% 2.6% 2.7% 2.9% 3.0%15 2004 1,000,000 40,500 4.1% 0.0% 0.0% 0.0% 0.1% 0.5% 1.5% 2.6% 3.4% 3.6% 3.8% 4.0% 4.1%16 2005 1,000,000 86,000 8.6% 0.0% 0.0% 0.1% 0.9% 2.6% 4.9% 6.5% 7.4% 8.0% 8.4% 8.6%17 2006 1,000,000 84,000 8.4% 0.0% 0.0% 0.8% 2.4% 4.4% 6.2% 7.1% 7.8% 8.1% 8.4%18 2007 1,000,000 74,000 7.4% 0.0% 1.0% 2.3% 4.1% 5.8% 6.4% 6.9% 7.2% 7.4%19 2008 1,000,000 66,000 6.6% 0.4% 1.4% 2.7% 4.2% 5.0% 6.2% 6.5% 6.6%20 2009 1,000,000 31,000 3.1% 0.5% 1.4% 2.2% 2.5% 2.8% 3.0% 3.1%21 2010 1,000,000 3,000 0.3% 0.0% 0.0% 0.0% 0.1% 0.2% 0.3%22 2011 1,000,000 1,000 0.1% 0.0% 0.0% 0.0% 0.0% 0.1%23 2012 1,000,000 - 0.0% 0.0% 0.0% 0.0% 0.0%24 2013 1,000,000 - 0.0% 0.0% 0.0% 0.0%25 2014 1,000,000 - 0.0% 0.0% 0.0%26 2015 1,000,000 - 0.0% 0.0%
Average 556,000 0.0% 0.2% 0.3% 0.6% 1.0% 1.5% 1.9% 2.1% 2.0% 1.9% 1.6% 1.2% 1.1% 1.1% 1.0%
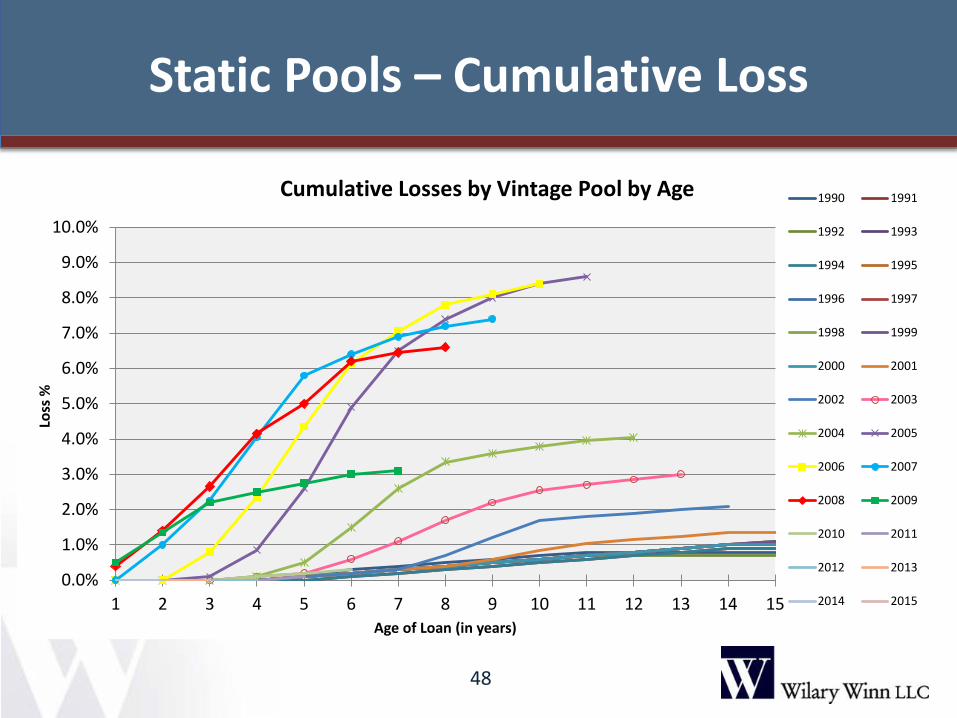
Static Pools – Cumulative Loss
48
0.0%
1.0%
2.0%
3.0%
4.0%
5.0%
6.0%
7.0%
8.0%
9.0%
10.0%
1 2 3 4 5 6 7 8 9 10 11 12 13 14 15
Loss
%
Age of Loan (in years)
Cumulative Losses by Vintage Pool by Age 1990 1991
1992 1993
1994 1995
1996 1997
1998 1999
2000 2001
2002 2003
2004 2005
2006 2007
2008 2009
2010 2011
2012 2013
2014 2015
Miscellaneous Items
• Final rule is expected to state that on collateral-dependent assets, the reserve is measured as the difference between the collateral’s fair value (less selling costs) and the amortized cost basis of the asset.
• Final guidance is expected to clarify that an entity is not required to recognize a loss on a financial asset for which the risk of nonpayment is greater than zero, yet the amount of the loss would be zero
- Example – have a CDR, but have a zero loss severity
49
Incorporating Your Credit Union’s Loss Experience
Data to collect: – Unemployment rate – Change in housing prices – Change in used auto prices – Delinquency rates by loan cohort by quarter – Balance of defaulted loan and date of default – Proceeds from liquidation of defaulted loan – FICO and combined LTV at time of default – Balance of prepaid loan and date of prepayment
50
Statistical Significance and Creditability
51
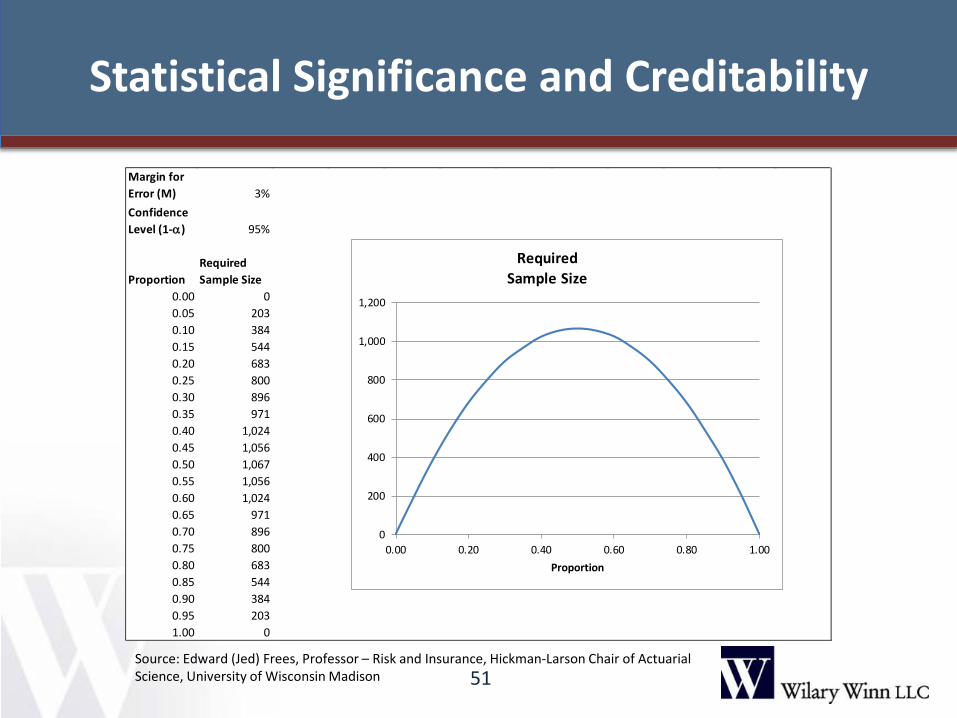
Margin for Error (M) 3%Confidence Level (1-α) 95%
ProportionRequired Sample Size
0.00 00.05 2030.10 3840.15 5440.20 6830.25 8000.30 8960.35 9710.40 1,0240.45 1,0560.50 1,0670.55 1,0560.60 1,0240.65 9710.70 8960.75 8000.80 6830.85 5440.90 3840.95 2031.00 0
0
200
400
600
800
1,000
1,200
0.00 0.20 0.40 0.60 0.80 1.00Proportion
Required Sample Size
Source: Edward (Jed) Frees, Professor – Risk and Insurance, Hickman-Larson Chair of Actuarial Science, University of Wisconsin Madison
Statistical Significance and Creditability
52
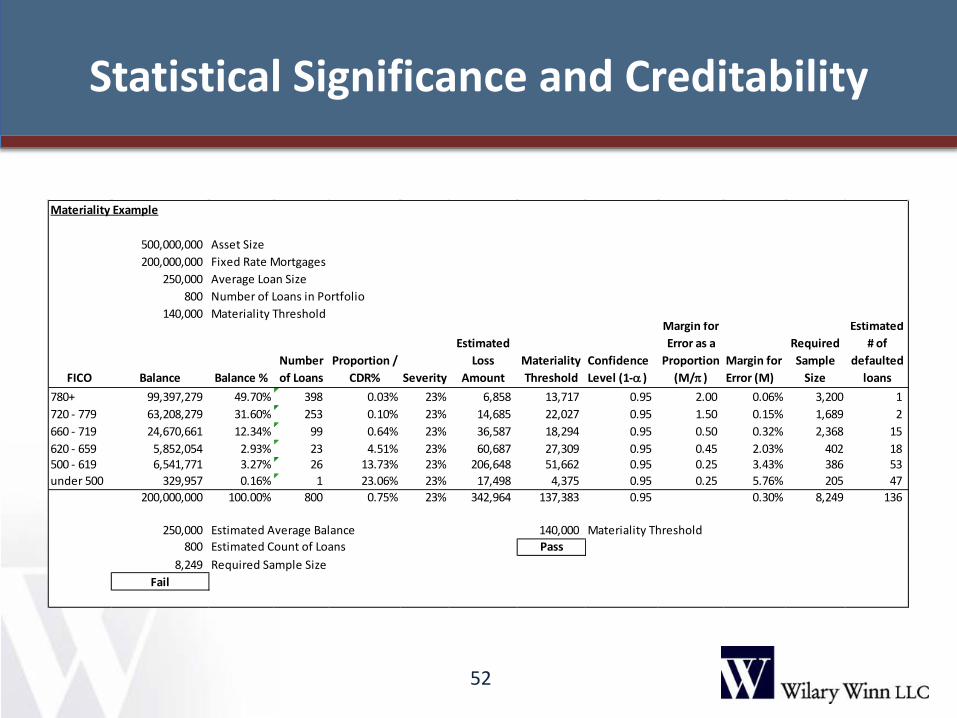
Materiality Example
500,000,000 Asset Size200,000,000 Fixed Rate Mortgages
250,000 Average Loan Size800 Number of Loans in Portfolio
140,000 Materiality Threshold
FICO Balance Balance %Number of Loans
Proportion / CDR% Severity
Estimated Loss
AmountMateriality Threshold
Confidence Level (1-α )
Margin for Error as a
Proportion (M/π )
Margin for Error (M)
Required Sample
Size
Estimated # of
defaulted loans
780+ 99,397,279 49.70% 398 0.03% 23% 6,858 13,717 0.95 2.00 0.06% 3,200 1 720 - 779 63,208,279 31.60% 253 0.10% 23% 14,685 22,027 0.95 1.50 0.15% 1,689 2 660 - 719 24,670,661 12.34% 99 0.64% 23% 36,587 18,294 0.95 0.50 0.32% 2,368 15 620 - 659 5,852,054 2.93% 23 4.51% 23% 60,687 27,309 0.95 0.45 2.03% 402 18 500 - 619 6,541,771 3.27% 26 13.73% 23% 206,648 51,662 0.95 0.25 3.43% 386 53 under 500 329,957 0.16% 1 23.06% 23% 17,498 4,375 0.95 0.25 5.76% 205 47
200,000,000 100.00% 800 0.75% 23% 342,964 137,383 0.95 0.30% 8,249 136
250,000 Estimated Average Balance 140,000 Materiality Threshold 800 Estimated Count of Loans Pass
8,249 Required Sample SizeFail
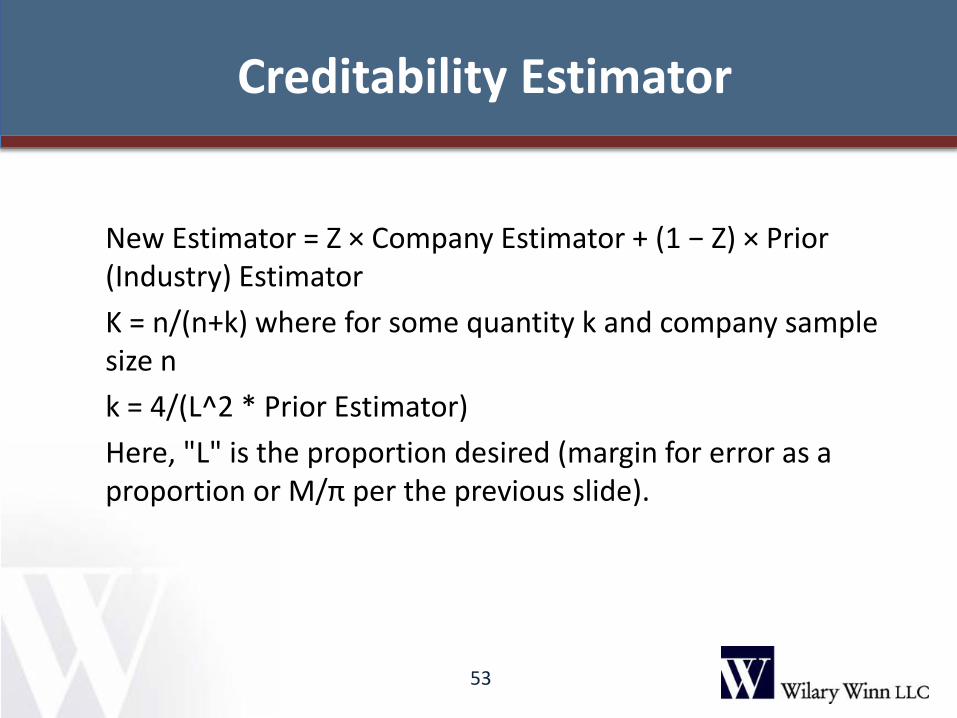
Creditability Estimator
New Estimator = Z × Company Estimator + (1 − Z) × Prior (Industry) Estimator K = n/(n+k) where for some quantity k and company sample size n k = 4/(L^2 * Prior Estimator) Here, "L" is the proportion desired (margin for error as a proportion or M/π per the previous slide).
53
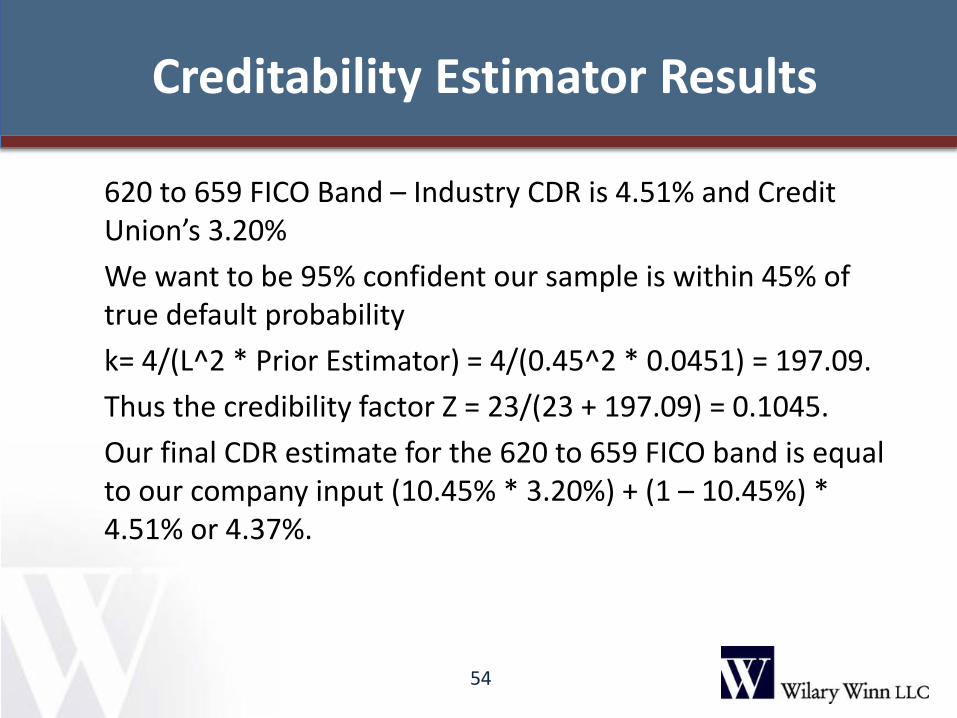
Creditability Estimator Results
620 to 659 FICO Band – Industry CDR is 4.51% and Credit Union’s 3.20% We want to be 95% confident our sample is within 45% of true default probability k= 4/(L^2 * Prior Estimator) = 4/(0.45^2 * 0.0451) = 197.09. Thus the credibility factor Z = 23/(23 + 197.09) = 0.1045. Our final CDR estimate for the 620 to 659 FICO band is equal to our company input (10.45% * 3.20%) + (1 – 10.45%) * 4.51% or 4.37%.
54
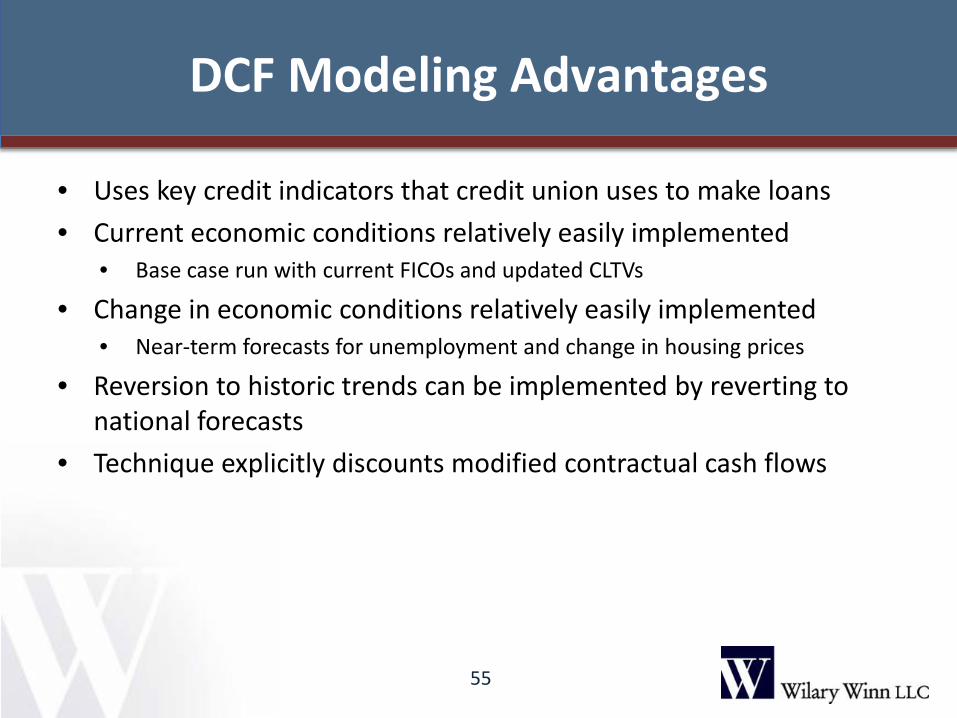
DCF Modeling Advantages
• Uses key credit indicators that credit union uses to make loans • Current economic conditions relatively easily implemented
• Base case run with current FICOs and updated CLTVs
• Change in economic conditions relatively easily implemented • Near-term forecasts for unemployment and change in housing prices
• Reversion to historic trends can be implemented by reverting to national forecasts
• Technique explicitly discounts modified contractual cash flows
55
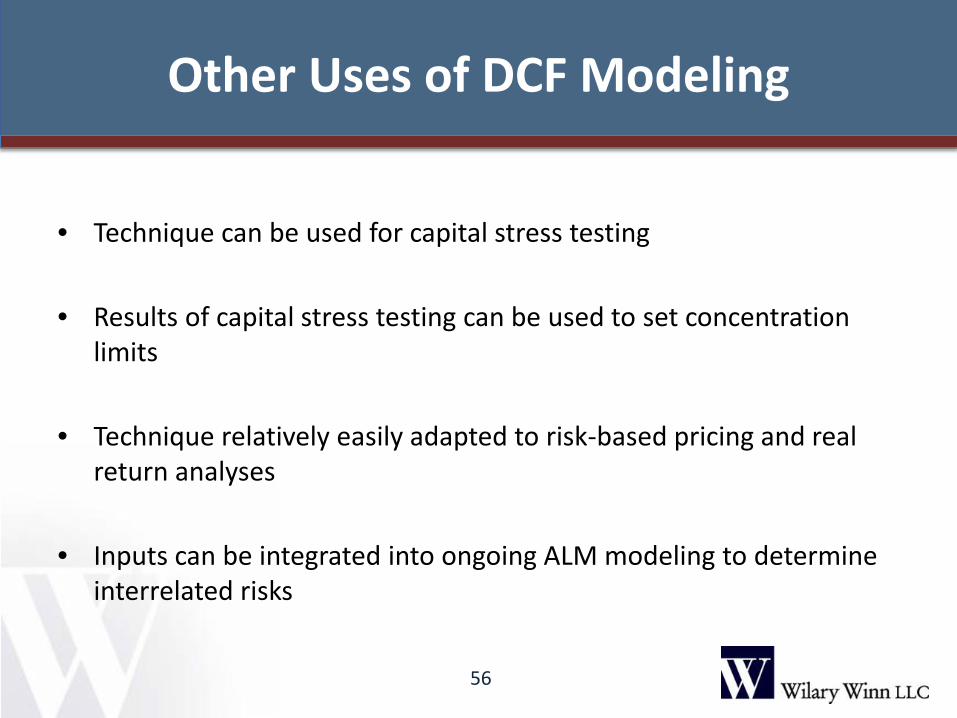
Other Uses of DCF Modeling
• Technique can be used for capital stress testing
• Results of capital stress testing can be used to set concentration
limits
• Technique relatively easily adapted to risk-based pricing and real return analyses
• Inputs can be integrated into ongoing ALM modeling to determine interrelated risks
56
Resources
57
Services and Contact Information
Asset Liability Management, Capital Stress Testing,
Concentration Risk Analyses Frank Wilary [email protected] Matt Erickson [email protected] Mergers and Acquisitions, CECL Analyses, ASC 310-30, Goodwill
Impairment Testing, and TDRs: Brenda Lidke [email protected] Servicing Rights and Mortgage Banking Derivatives: Eric Nokken [email protected]
58

Contact Information
Wilary Winn LLC First National Bank Building
332 Minnesota Street, Suite 1750 Saint Paul, MN 55101
651-224-1200
www.wilwinn.com
59