Embed Size (px)
Citation preview

CRIMECRIMECRIMECRIMEININININCALIFORNIACALIFORNIACALIFORNIACALIFORNIA
����
����
����
CRIME IN CALIFORNIA
April 2001
� CJSC Home Page � CJSC Publications � AG’s Home Page
Bill Lockyer, Attorney General Bill Lockyer, Attorney GeneralCalifornia Department of Justice California Department of JusticeDivision of Criminal Justice Information Services
Bureau of Criminal Information and Analysis Division of Criminal Justice Information Services CRIMINAL JUSTICE STATISTICS CENTER Bureau of Criminal Information and Analysis
CRIMINAL JUSTICE STATISTICS CENTER
CRIME INCRIME INCRIME INCRIME INCALIFORNIACALIFORNIACALIFORNIACALIFORNIA
Criminal Justice Statistics CenterCriminal Justice Statistics CenterCriminal Justice Statistics CenterCriminal Justice Statistics Center
i
CRIME IN CALIFORNIA
Bill Lockyer, Attorney General California Department of Justice Division of Criminal Justice Information Services Bureau of Criminal Information and Analysis CRIMINAL JUSTICE STATISTICS CENTER
An electronic version of this report and other reports are available from the California Attorney General's website:
http://caag.state.ca.us
Crime in California
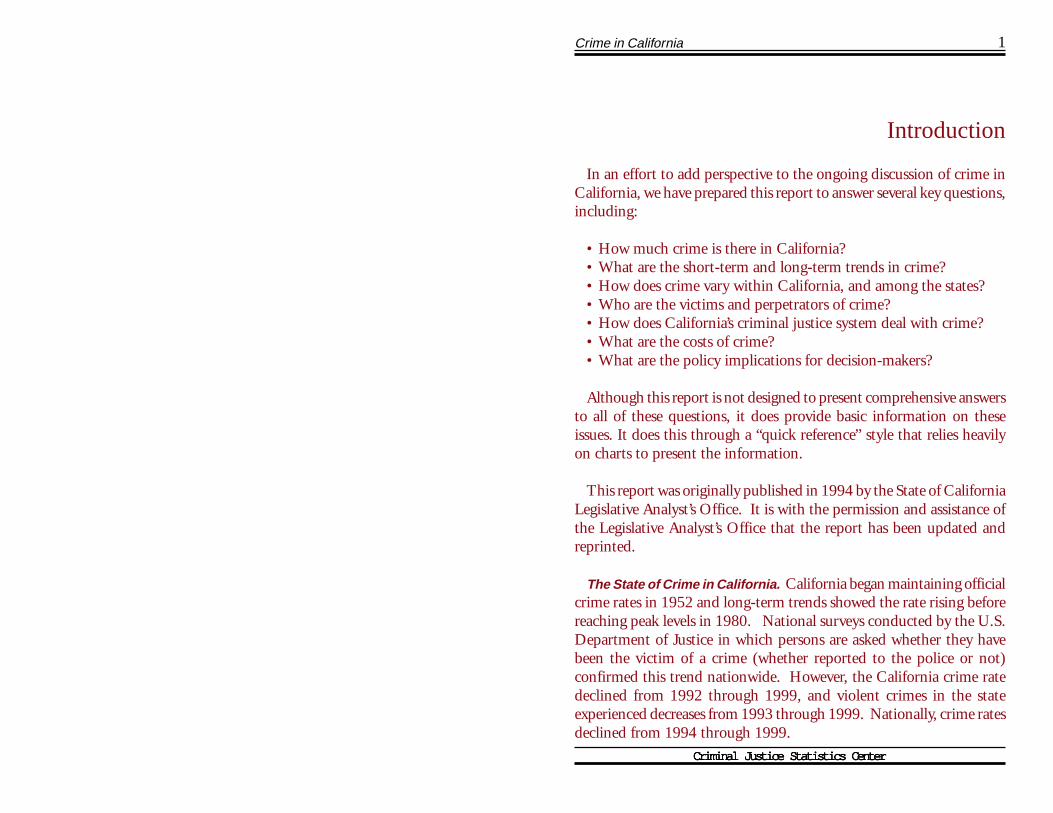
Table of Contents
Introduction ............................................................................... 1
What Is Crime? ........................................................................... 3
How Much Crime Is There in California? ................................... 5
What Are the Trends in Crime in California? .............................. 9
How Does Crime Vary Among States and Within California? .................................................................................. 15
Who Are the Victims of Crime? .................................................. 19
Who Commits Crime? ............................................................... 23
How Does California’s Criminal Justice System Work? ............... 27
How Much Does Crime Cost? .................................................... 41
What Are the Policy Implications? .............................................. 47
Criminal Justice Flowchart
Criminal Justice Statistics Center
Criminal Justice Statistics CenterCriminal Justice Statistics CenterCriminal Justice Statistics CenterCriminal Justice Statistics Center
1 Crime in California
Introduction
In an effort to add perspective to the ongoing discussion of crime in California, we have prepared this report to answer several key questions, including:
� How much crime is there in California? � What are the short-term and long-term trends in crime? � How does crime vary within California, and among the states? � Who are the victims and perpetrators of crime? � How does California’s criminal justice system deal with crime? � What are the costs of crime? � What are the policy implications for decision-makers?
Although this report is not designed to present comprehensive answers to all of these questions, it does provide basic information on these issues. It does this through a “quick reference” style that relies heavily on charts to present the information.
This report was originally published in 1994 by the State of California Legislative Analyst’s Office. It is with the permission and assistance of the Legislative Analyst’s Office that the report has been updated and reprinted.
The State of Crime in California. California began maintaining official crime rates in 1952 and long-term trends showed the rate rising before reaching peak levels in 1980. National surveys conducted by the U.S. Department of Justice in which persons are asked whether they have been the victim of a crime (whether reported to the police or not) confirmed this trend nationwide. However, the California crime rate declined from 1992 through 1999, and violent crimes in the state experienced decreases from 1993 through 1999. Nationally, crime rates declined from 1994 through 1999.
Criminal Justice Statistics Center

Criminal Justice Statistics CenterCriminal Justice Statistics CenterCriminal Justice Statistics CenterCriminal Justice Statistics Center Criminal Justice Statistics CenterCriminal Justice Statistics CenterCriminal Justice Statistics CenterCriminal Justice Statistics Center
2 3 Crime in California
Criminal Justice Statistics Center
Crime in California
What Is Crime?
In its simplest definition, “crime” is any specific act prohibited by law for which society has provided a formally sanctioned punishment. This also can include the failure of a person to perform an act specifically required by law.
Types of Offenses. Crimes are classified by the seriousness of the offenses as follows:
� A felony is the most serious offense, for which the offender may be sentenced to state prison. Felonies generally include violent crimes, sex offenses, and many types of drug and property violations.
� A misdemeanor is a less serious offense for which the offender may be sentenced to probation, county jail, a fine, or some combination of the three. Misdemeanors generally include crimes such as assault and battery, petty theft, and public drunkenness.
� An infraction is the least serious offense and generally is punishable by a fine. Many motor vehicle violations are considered infractions.
California law permits law enforcement and prosecutors to charge many types of crimes as either a felony or misdemeanor (known as a “wobbler”), or as either a misdemeanor or an infraction. Most of the resources of the criminal justice system are devoted to dealing with felonies.
Categories of Crimes. In general, felonies, misdemeanors, and infractions are classified in one of three broad categories: violent, property, and drug-related. Violent crime refers to events such as homicide, rape, and assault that result in an injury to a person. Robbery is also considered a violent crime because it involves the use or threat of force against a person.
Criminal Justice Statistics Center

Criminal Justice Statistics CenterCriminal Justice Statistics CenterCriminal Justice Statistics CenterCriminal Justice Statistics Center Criminal Justice Statistics CenterCriminal Justice Statistics CenterCriminal Justice Statistics CenterCriminal Justice Statistics Center
4 5 Crime in California
Property crime refers to events such as burglary and motor vehicle theft. Such crimes are often referred to as “household crimes.”
Drug-related crimes, such as possession or sale of illegal narcotics, are generally in a separate category altogether. This is because such offenses do not fall under the definition of either violent or property offenses.
Another area of crime which has gained much attention is that of “Hate Crimes”. Hate crimes are not separate, distinct crimes. Rather, they are offenses motivated by the victim’s race, ethnicity, religion, sexual orientation, physical or mental disability, or gender. The “Hate Crimes Statistics Act”, passed in 1990, required the U.S. Attorney General to collect bias-motivated crime information, with the Federal Bureau of Investigation (FBI) publishing its first report in 1992. California began collecting data in 1994 and first published its findings in 1995.
Society’s Definition of Crime Can Change. Although many offenses, such as homicide, robbery, and burglary, have been considered crimes for centuries, changes in the values and moral attitudes of society result in some conduct being criminalized while other conduct is decriminalized. For example, in recent years California has chosen to criminalize more severely drunken driving, while lessening criminal penalties for the possession of small amounts of marijuana.
Also, society’s attitudes towards the amount of punishment that should be dealt out for particular crimes changes over time. For instance, the state has enacted many laws that increase punishment for felonies and limit the discretion of state and local criminal justice officials in dealing with offenders.
Criminal Justice Statistics Center
Crime in California
How Much Crime Is There in California?
Although this is a simple question, the answer to it is often confusing because of the bewildering volume of crime statistics. For this reason, it is important to first understand how crimes are counted. Crime is counted in two different ways. One is based on official reports to law enforcement agencies, and is reflected in the national Uniform Crime Reporting (UCR) data and the California Crime Index (CCI) data. Crime is also counted based on surveys of individuals to determine if they have been victims of crime, even though the crime may not have been reported to the police. These data are obtained from national victimization surveys.
Crimes as Counted by Law Enforcement Reports. For more than 60 years, the FBI has collected criminal statistics from throughout the nation under the UCR Program. Under this program, law enforcement agencies in California report information on crimes to the state Department of Justice (DOJ), which forwards the data to the FBI. In order to eliminate differences among various states’ statutory definitions of crimes, the UCR reports data only on selected crimes, which are chosen because of their seriousness, frequency, and the likelihood of being reported to law enforcement. The UCR crimes are homicide, rape, robbery, assault, burglary, larceny-theft, motor vehicle theft, and arson.
The DOJ annually reports on California crime using the CCI. The state’s data are similar, but not identical, to the national data. The state’s data exclude larceny-theft and arson in order to maintain the long-term consistency in the CCI trend.
Crime as Counted by Victimization Surveys. The U.S. Department of Justice annually surveys households and organizations regarding
Criminal Justice Statistics Center
Criminal Justice Statistics CenterCriminal Justice Statistics CenterCriminal Justice Statistics CenterCriminal Justice Statistics Center
����
����
����
����
Criminal Justice Statistics CenterCriminal Justice Statistics CenterCriminal Justice Statistics CenterCriminal Justice Statistics Center
6 7 Crime in California
whether they have been victims of crimes. These studies, known as victimization surveys, are conducted nationally, not on a state-by-state basis, using scientific survey techniques.
Crime “Rates.” Crime data are often presented in terms of “rates.” A rate is defined as the number of occurrences of a criminal event within a given population. For example, the overall crime rate in California (according to the CCI) for 1999 was 1,763.3, which means that there were about 1,763 reported crimes per 100,000 Californians in 1999.
Crime is Underreported. Crime statistics from law enforcement agencies don’t tell the entire story for two reasons. Victimization surveys generally show that there is a significant amount of crime committed each year that is not counted in official statistics because it is not reported to law enforcement authorities. However, the proportion of crimes reported to law enforcement agencies has increased steadily since the victimization surveys began in the early 1970s. Improvements in technology and methodology led to a redesign of the survey in 1992, and victims are now reporting more types of crime incidents to survey interviewers.
Some crimes are more likely to be reported than others. For example, crimes involving personal injury or large economic loss are more apt to be reported. Violent crimes that are attempted, but not completed, and property crimes involving small amounts of money are much less likely to be reported. According to the U.S. Department of Justice, in 1999, about 64 percent of all crimes went unreported to police. This figure includes about 56 percent of all violent victimizations and 66 percent of all property crimes.
Another reason for underreporting of crime is that sometimes several crimes are committed by an offender at the same time, but only one (usually the most severe) is counted in the data. For example, if an offender robbed a store, assaulted a clerk, and killed the owner, only the homicide would be reported.
Criminal Justice Statistics Center
Crime in California
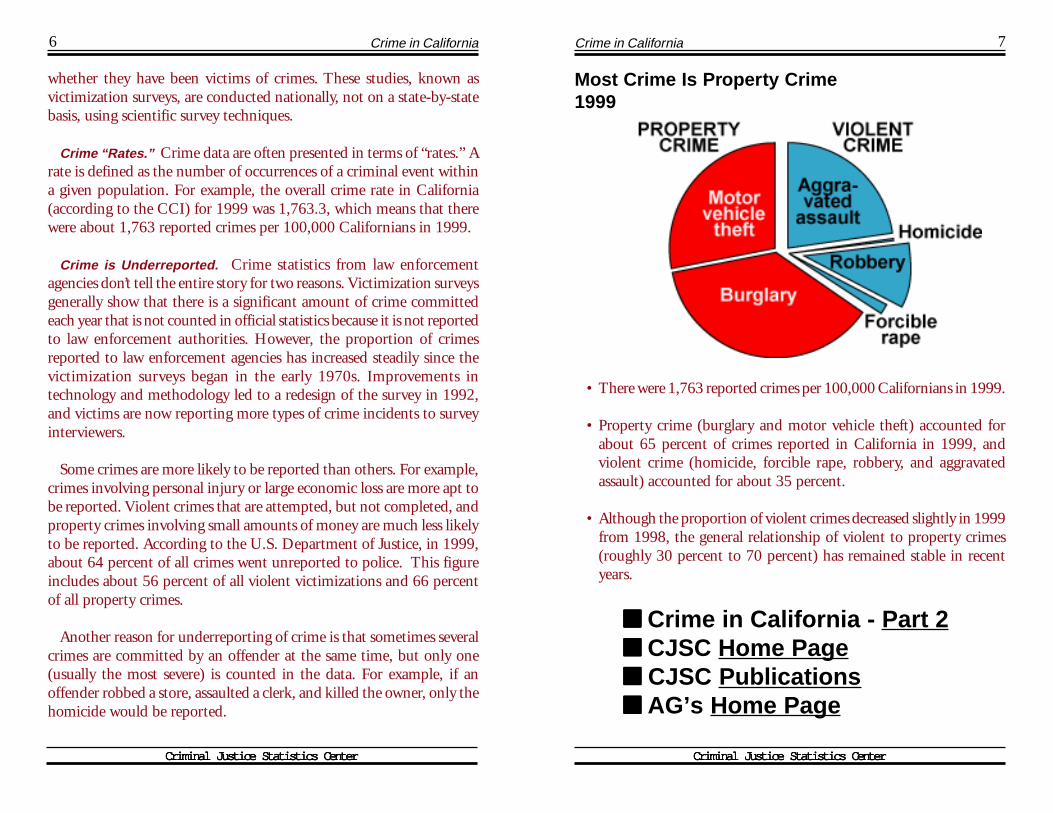
Most Crime Is Property Crime 1999
� There were 1,763 reported crimes per 100,000 Californians in 1999.
� Property crime (burglary and motor vehicle theft) accounted for about 65 percent of crimes reported in California in 1999, and violent crime (homicide, forcible rape, robbery, and aggravated assault) accounted for about 35 percent.
� Although the proportion of violent crimes decreased slightly in 1999 from 1998, the general relationship of violent to property crimes (roughly 30 percent to 70 percent) has remained stable in recent years.
� Crime in California - Part 2 � CJSC Home Page � CJSC Publications � AG’s Home Page
Criminal Justice Statistics Center
����
����
����
����
����
Criminal Justice Statistics CenterCriminal Justice Statistics CenterCriminal Justice Statistics CenterCriminal Justice Statistics Center
9
� Crime in California - Part 1 � Crime in California - Part 3
� CJSC Home Page � CJSC Publications � AG’s Home Page
Crime in California
What Are the Trends in Crime in California?
When considering the trends in crime, it is important to consider both the long-term and the short-term directions of crime in the state. Changes that occur over the years in demographics, economic conditions and values, lifestyles, and residential patterns have a significant impact on crime trends. In several of the charts that follow, we present California crime data starting with 1952 - the first year in which the DOJ began publishing the statistics.
In addition to the reported crime data, it is also important to consider trends in victimization rates to obtain a truer picture of overall trends in crime. As mentioned earlier, the national victimization survey, which began in 1973, provides valuable data in this area. These data are national in scope, however, and are not broken down specifically for California.
Criminal Justice Statistics Center
Criminal Justice Statistics CenterCriminal Justice Statistics CenterCriminal Justice Statistics CenterCriminal Justice Statistics Center Criminal Justice Statistics CenterCriminal Justice Statistics CenterCriminal Justice Statistics CenterCriminal Justice Statistics Center
10 11 Crime in California
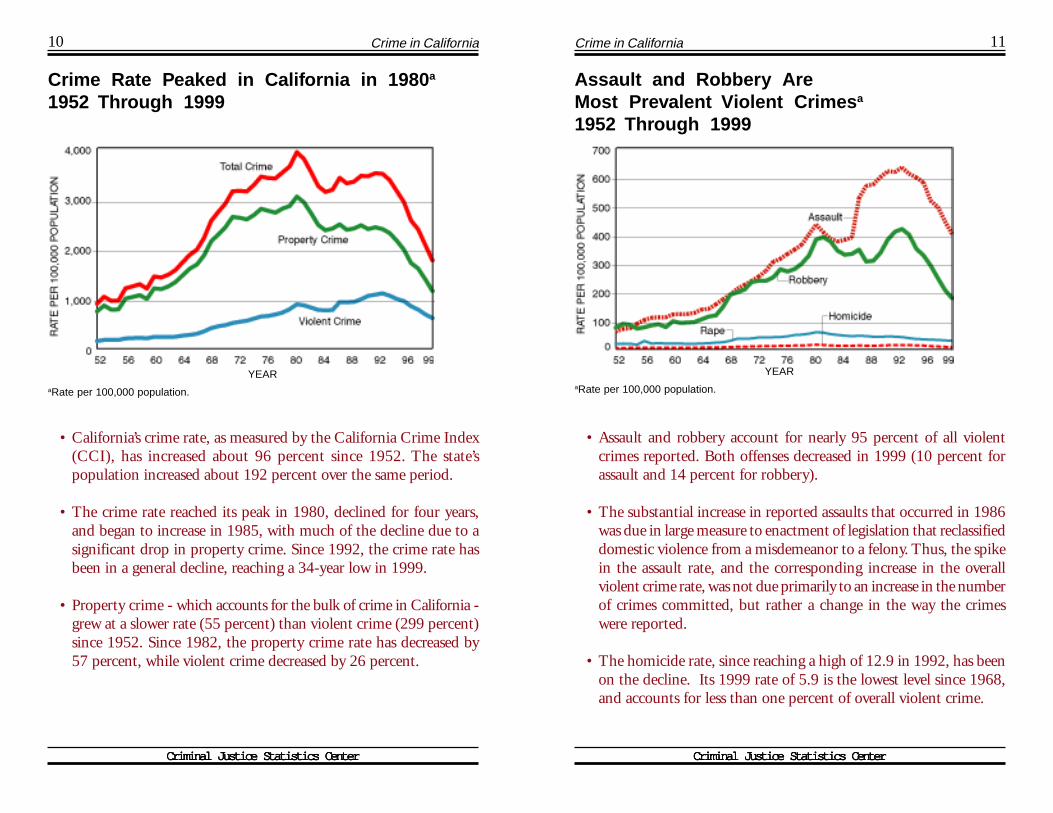
Crime Rate Peaked in California in 1980a
1952 Through 1999
YEAR aRate per 100,000 population.
� California’s crime rate, as measured by the California Crime Index (CCI), has increased about 96 percent since 1952. The state’s population increased about 192 percent over the same period.
� The crime rate reached its peak in 1980, declined for four years, and began to increase in 1985, with much of the decline due to a significant drop in property crime. Since 1992, the crime rate has been in a general decline, reaching a 34-year low in 1999.
� Property crime - which accounts for the bulk of crime in California -grew at a slower rate (55 percent) than violent crime (299 percent) since 1952. Since 1982, the property crime rate has decreased by 57 percent, while violent crime decreased by 26 percent.
Criminal Justice Statistics Center
Crime in California
Assault and Robbery Are Most Prevalent Violent Crimesa
1952 Through 1999
YEAR aRate per 100,000 population.
• Assault and robbery account for nearly 95 percent of all violent crimes reported. Both offenses decreased in 1999 (10 percent for assault and 14 percent for robbery).
� The substantial increase in reported assaults that occurred in 1986 was due in large measure to enactment of legislation that reclassified domestic violence from a misdemeanor to a felony. Thus, the spike in the assault rate, and the corresponding increase in the overall violent crime rate, was not due primarily to an increase in the number of crimes committed, but rather a change in the way the crimes were reported.
� The homicide rate, since reaching a high of 12.9 in 1992, has been on the decline. Its 1999 rate of 5.9 is the lowest level since 1968, and accounts for less than one percent of overall violent crime.
Criminal Justice Statistics Center

Criminal Justice Statistics CenterCriminal Justice Statistics CenterCriminal Justice Statistics CenterCriminal Justice Statistics Center Criminal Justice Statistics CenterCriminal Justice Statistics CenterCriminal Justice Statistics CenterCriminal Justice Statistics Center
12 13 Crime in California
Property Crime Downa
1952 Through 1999
YEAR aRate per 100,000 population.
� Property crimes have sustained a pattern of decline since reaching a high in 1980.
� The property crime rate declined for the eighth consecutive year and the motor vehicle theft rate is the lowest it has been since 1967.
� The burglary rate has fallen 71 percent since 1980, including an 18 percent decrease from 1998 to 1999.
Criminal Justice Statistics Center
Crime in California
National Victimization Studies Show Decline in Overall U.S. Crimea
1973 Through 1999
YEAR aVictimization per 1,000 households.
� The national surveys mirror the decline in rates that California has enjoyed for the last few years. Criminal victimization estimates from 1999 were the lowest since the survey’s inception in 1973.
� Between 1993 and 1999, violent crime rates fell 34 percent, while property crime rates (includes burglary, motor vehicle theft, and larceny) fell 38 percent.
� The national victimization surveys are an important measure of the actual amount of crime because the official crime rate data do not include crimes that go unreported to the police.
Criminal Justice Statistics Center
Criminal Justice Statistics CenterCriminal Justice Statistics CenterCriminal Justice Statistics CenterCriminal Justice Statistics Center Criminal Justice Statistics CenterCriminal Justice Statistics CenterCriminal Justice Statistics CenterCriminal Justice Statistics Center
14 15 Crime in California
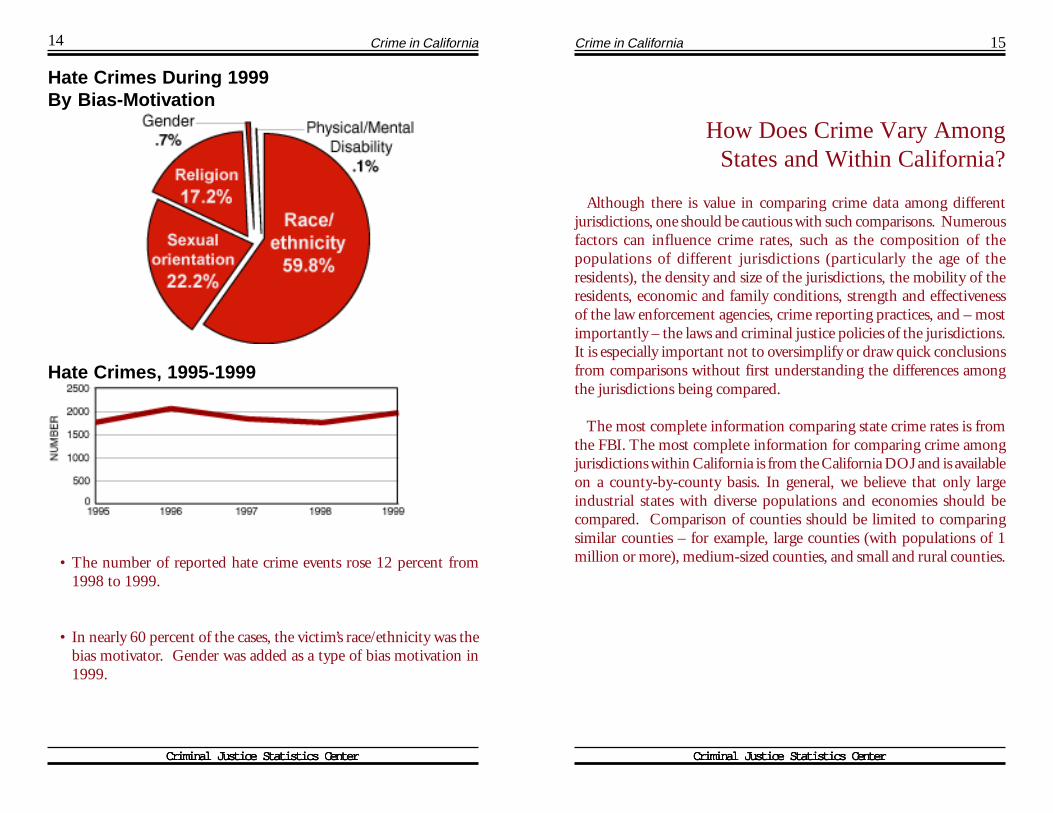
Hate Crimes During 1999 By Bias-Motivation
Hate Crimes, 1995-1999
� The number of reported hate crime events rose 12 percent from 1998 to 1999.
� In nearly 60 percent of the cases, the victim’s race/ethnicity was the bias motivator. Gender was added as a type of bias motivation in 1999.
Criminal Justice Statistics Center
Crime in California
How Does Crime Vary Among States and Within California?
Although there is value in comparing crime data among different jurisdictions, one should be cautious with such comparisons. Numerous factors can influence crime rates, such as the composition of the populations of different jurisdictions (particularly the age of the residents), the density and size of the jurisdictions, the mobility of the residents, economic and family conditions, strength and effectiveness of the law enforcement agencies, crime reporting practices, and – most importantly – the laws and criminal justice policies of the jurisdictions. It is especially important not to oversimplify or draw quick conclusions from comparisons without first understanding the differences among the jurisdictions being compared.
The most complete information comparing state crime rates is from the FBI. The most complete information for comparing crime among jurisdictions within California is from the California DOJ and is available on a county-by-county basis. In general, we believe that only large industrial states with diverse populations and economies should be compared. Comparison of counties should be limited to comparing similar counties – for example, large counties (with populations of 1 million or more), medium-sized counties, and small and rural counties.
Criminal Justice Statistics Center
Criminal Justice Statistics CenterCriminal Justice Statistics CenterCriminal Justice Statistics CenterCriminal Justice Statistics Center Criminal Justice Statistics CenterCriminal Justice Statistics CenterCriminal Justice Statistics CenterCriminal Justice Statistics Center
16 17 Crime in California
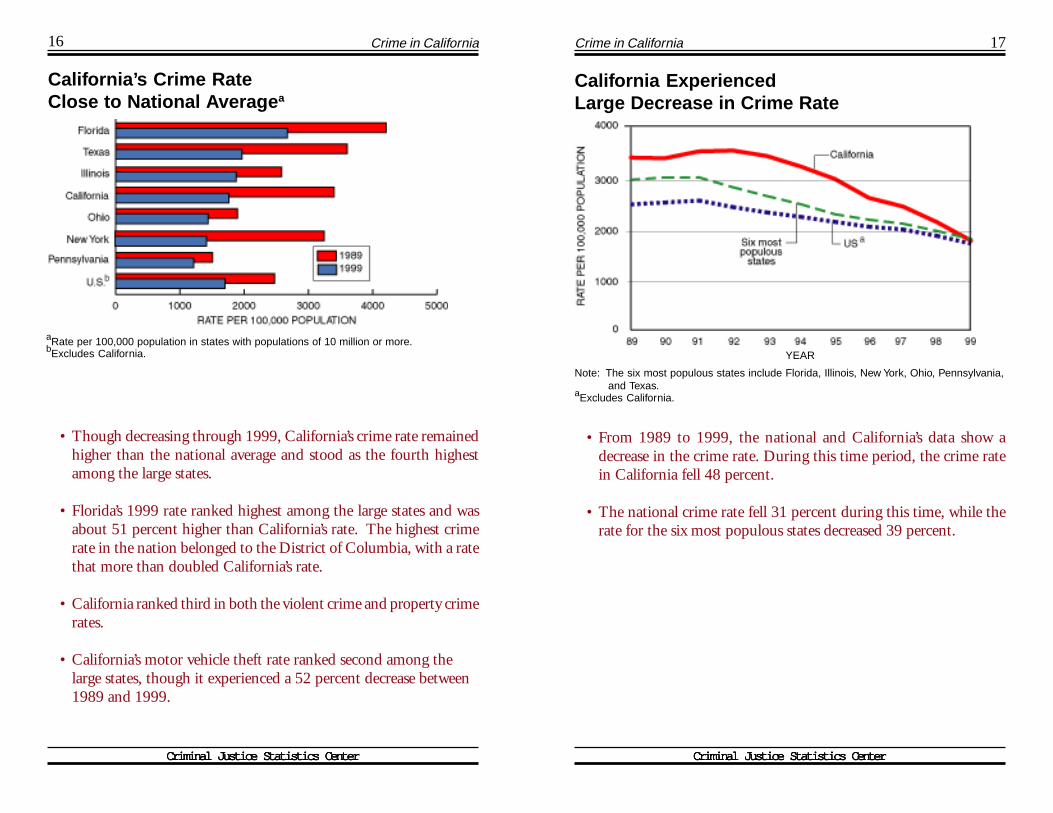
California’s Crime Rate Close to National Averagea
aRate per 100,000 population in states with populations of 10 million or more.bExcludes California.
� Though decreasing through 1999, California’s crime rate remained higher than the national average and stood as the fourth highest among the large states.
� Florida’s 1999 rate ranked highest among the large states and was about 51 percent higher than California’s rate. The highest crime rate in the nation belonged to the District of Columbia, with a rate that more than doubled California’s rate.
� California ranked third in both the violent crime and property crime rates.
� California’s motor vehicle theft rate ranked second among the large states, though it experienced a 52 percent decrease between 1989 and 1999.
Criminal Justice Statistics Center
Crime in California
California Experienced Large Decrease in Crime Rate
YEAR
Note: The six most populous states include Florida, Illinois, New York, Ohio, Pennsylvania, and Texas.
aExcludes California.
� From 1989 to 1999, the national and California’s data show a decrease in the crime rate. During this time period, the crime rate in California fell 48 percent.
� The national crime rate fell 31 percent during this time, while the rate for the six most populous states decreased 39 percent.
Criminal Justice Statistics Center

Criminal Justice Statistics CenterCriminal Justice Statistics CenterCriminal Justice Statistics CenterCriminal Justice Statistics Center Criminal Justice Statistics CenterCriminal Justice Statistics CenterCriminal Justice Statistics CenterCriminal Justice Statistics Center
18 19 Crime in California
Crime Rates Vary Among Countiesa
1999
aCrime rates in counties with populations of 500,000 or more.
� Among those counties with populations of 500,000 or more, Fresno had the highest crime rate in 1999 - about 42 percent higher than the statewide rate. San Mateo County was the lowest and was less than half the statewide rate.
� From 1998 to 1999, all counties experienced a decrease in their crime rate. Sacramento county’s rate fell 24 percent and its crime rate ranking among the most populous counties fell from the highest to fifth highest.
� From 1998 to 1999, the crime rate in Fresno county fell 13 percent, though its rate has remained as one of the highest in California for the past several years.
Criminal Justice Statistics Center
Crime in California
Who Are the Victims of Crime?
National victimization surveys (1999) provide a good deal of reliable data about the victims of crime. These surveys reveal that:
� Groups at the highest risk of becoming victims – young men – are not the ones who generally express the greatest fear of crime – women and the elderly. Males experienced violent crime at rates 28 percent higher than that of females.
� Persons age 12 to 24 sustained violent victimizations at rates higher than individuals of all other ages.
� Teenagers are most often the victims of both violence and personal theft. Persons age 16 to 19 were twice as likely to be robbed than persons age 25 to 34, and 12 times as likely as persons age 65 or older.
� Blacks are most often the victims of violence – the violent victimization rate for blacks is about 30 percent higher than for whites. There is little difference in victimization rates between Hispanics and non-Hispanics in violent offenses, but Hispanics are more likely to be victims of a property crime.
� Victims and offenders are of the same race in 75 percent of all violent crimes.
� Urban dwellers are much more likely to be victims of all types of crime than are persons who live in suburban and rural areas.
� The elderly made up 15 percent of the population age 12 or older, but were victims in only 7 percent of measured crimes.
Criminal Justice Statistics Center

Criminal Justice Statistics CenterCriminal Justice Statistics CenterCriminal Justice Statistics CenterCriminal Justice Statistics Center
����
����
����
����
����Criminal Justice Statistics CenterCriminal Justice Statistics CenterCriminal Justice Statistics CenterCriminal Justice Statistics Center
20 21 Crime in California
How Do Crime Rates in the U.S. Compare With the Rates of Other Life Events? 1998
Rate per 1,000 Events adults per year
Accidental injury, all circumstances ................
Accidental injury at home ...............................
Injury in a motor vehicle accident ...................
Personal theft ................................................
386
82
50
39
Violent victimization .....................................
Assault (aggravated and simple) ................
Death, all causes ............................................
Serious (aggravated) assault ......................
37
31
9
8
Heart disease death .......................................
Robbery .........................................................
Cancer death ..................................................
Pneumonia/influenza death ............................
3
2
2
0.4
Rape (women only) .......................................
Accidental death, all circumstances ...............
Motor vehicle accident death ..........................
Homicide .......................................................
Suicide ............................................................
0.3
0.3
0.2
0.1
0.1
Source: U.S. Bureau of Justice Statistics.
Criminal Justice Statistics Center
Crime in California
Homicide Most Often Committed By Acquaintance, 1999
� Of those homicides for which the offender has been identified, California’s data indicate that the victim and offender are likely to know each other.
� Of the 2,006 homicides reported in 1999, 632 were committed by a friend or acquaintance, which includes an ex-husband or ex-wife, employer, employee, gang member, etc. This represents about 50 percent of all known victim-offender relationships.
� Homicides committed by a stranger accounted for nearly 30 percent of all known relationships.
� Crime in California - Part 1 � Crime in California - Part 3
� CJSC Home Page � CJSC Publications � AG’s Home Page
Criminal Justice Statistics Center

����
����
����
����
����
Criminal Justice Statistics CenterCriminal Justice Statistics CenterCriminal Justice Statistics CenterCriminal Justice Statistics Center Criminal Justice Statistics CenterCriminal Justice Statistics CenterCriminal Justice Statistics CenterCriminal Justice Statistics Center
22 23 Crime in California
� Crime in California - Part 1 � Crime in California - Part 4
� CJSC Home Page � CJSC Publications � AG’s Home Page
Criminal Justice Statistics Center
Crime in California
Who Commits Crime?
National victimization surveys provide information about criminal offenders. These reports show that:
• About 35 percent of violent victimizations involved an offender who was under the influence of alcohol. Of these incidents, about 1 in 5 also involved perceived drug use on the part of the offender.
� Victims identified intimates (spouses, boyfriend or girlfriend) as offenders in 11 percent of violent crimes, robberies and simple assaults.
� The proportion of violent crimes committed by juveniles as reported in victimization surveys has changed little since 1980.
� Males are much more likely to be the victims of a stranger in assault and robbery offenses. Females, however, are equally likely to be victimized by a husband or boyfriend as they are by an acquaintance or a stranger.
Criminal Justice Statistics Center
Criminal Justice Statistics CenterCriminal Justice Statistics CenterCriminal Justice Statistics CenterCriminal Justice Statistics Center Criminal Justice Statistics CenterCriminal Justice Statistics CenterCriminal Justice Statistics CenterCriminal Justice Statistics Center
24 25 Crime in California
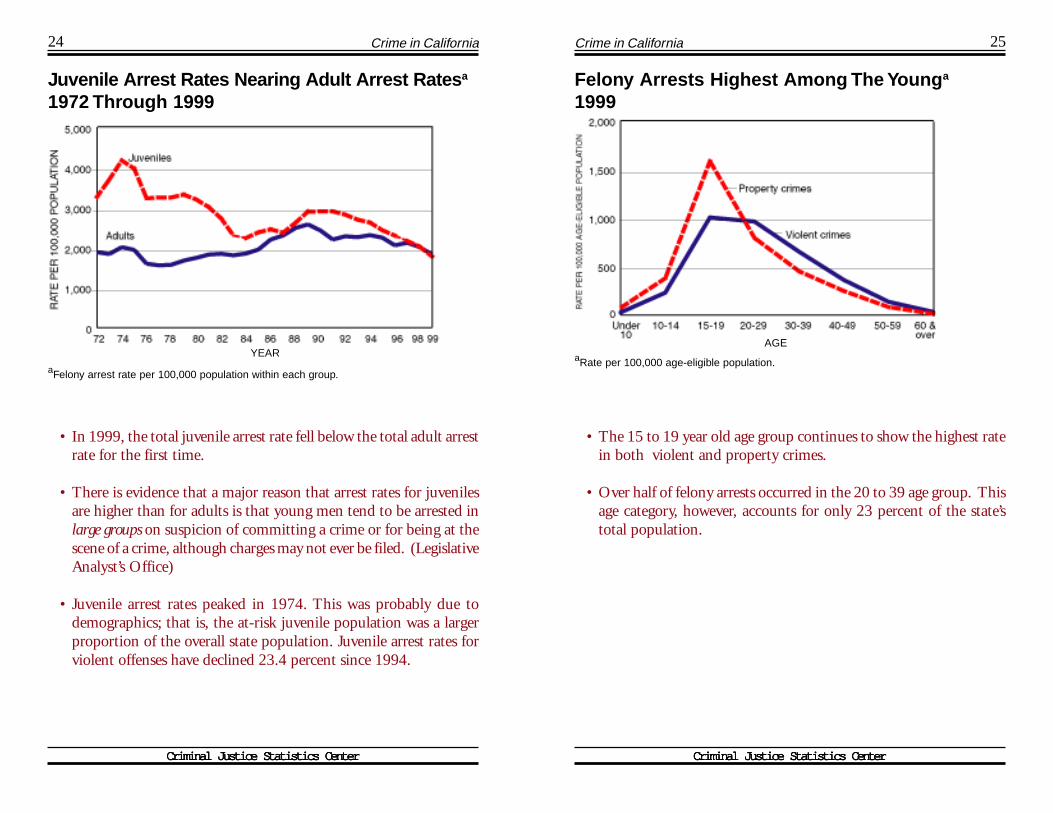
Juvenile Arrest Rates Nearing Adult Arrest Ratesa
1972 Through 1999
YEAR
aFelony arrest rate per 100,000 population within each group.
� In 1999, the total juvenile arrest rate fell below the total adult arrest rate for the first time.
� There is evidence that a major reason that arrest rates for juveniles are higher than for adults is that young men tend to be arrested in large groups on suspicion of committing a crime or for being at the scene of a crime, although charges may not ever be filed. (Legislative Analyst’s Office)
� Juvenile arrest rates peaked in 1974. This was probably due to demographics; that is, the at-risk juvenile population was a larger proportion of the overall state population. Juvenile arrest rates for violent offenses have declined 23.4 percent since 1994.
Criminal Justice Statistics Center
Crime in California
Felony Arrests Highest Among The Younga
1999
AGE aRate per 100,000 age-eligible population.
� The 15 to 19 year old age group continues to show the highest rate in both violent and property crimes.
� Over half of felony arrests occurred in the 20 to 39 age group. This age category, however, accounts for only 23 percent of the state’s total population.
Criminal Justice Statistics Center

����
����
����
����
����
Criminal Justice Statistics CenterCriminal Justice Statistics CenterCriminal Justice Statistics CenterCriminal Justice Statistics Center
26 Crime in California
Firearms Used in Most Homicides 1999
� Firearms are the weapons used in 67 percent of reported homicides in 1999, or about five times more often than knives.
� Firearms account for more homicides than all other weapons combined.
� The age group that suffered the most homicides by firearms was the 18 to 24 year old category.
� Crime in California - Part 1 � Crime in California - Part 4
� CJSC Home Page � CJSC Publications � AG’s Home Page
Criminal Justice Statistics Center

����
����
����
����
����
Criminal Justice Statistics CenterCriminal Justice Statistics CenterCriminal Justice Statistics CenterCriminal Justice Statistics Center
27
� Crime in California - Part 1 � Crime in California - Part 5
� CJSC Home Page � CJSC Publications � AG’s Home Page
U.S. Bureau of Justice Statistics FLOWCHART
Crime in California
How Does California’s Criminal Justice System Work?
In general, the criminal justice system does not respond to all crime because about two-thirds of all crimes are not discovered or reported to law enforcement authorities. And of those crimes reported to law enforcement officials, only about one-quarter are solved. In 1999, for example, only about 26 percent of all reported crimes were solved or “cleared” (that is, a person was charged with a crime). This figure has remained relatively stable for a number of years.
Following an arrest, a law enforcement agency may file a complaint against the individual and he or she may be prosecuted. Prosecution may result in the person being convicted. Persons who are convicted are given a fine or are sentenced to county probation, county jail, county probation with a jail term, state prison, or Youth Authority. The vast majority of convicted offenders end up on county probation and/or in jail.
Although the Legislature and Governor enact laws that define crimes and set penalties, criminal justice officials exercise a great deal of discretion in enforcing these laws. The greatest discretion is at the local level, when police decide whether to arrest someone for a crime, prosecutors decide whether or how to charge a person with a crime, and courts adjudicate suspected offenders.
Criminal Justice Statistics Center

28 29 Crime in California
Most Criminal Justice Personnel in Law Enforcement 1999
Total Positions
Law enforcement 102,769 Corrections 65,380 Prosecution 16,476 Public defense 3,857 Courts 1,880
190,362
Criminal Justice Statistics CenterCriminal Justice Statistics CenterCriminal Justice Statistics CenterCriminal Justice Statistics Center Criminal Justice Statistics CenterCriminal Justice Statistics CenterCriminal Justice Statistics CenterCriminal Justice Statistics Center
� Law enforcement personnel (police, sheriffs, CHP) make up about 54 percent of total criminal justice personnel. This proportion has declined from about 60 percent in 1989, although the total number of law enforcement personnel increased by 23 percent.
� Corrections personnel (probation, prisons, Youth Authority) make up about 34 percent of the total, up from 30 percent in 1989.
Crime in California
Prosecution Personnel has Grown Most 1989 through 1999
� Prosecution personnel showed the largest increase (84 percent).
� Law enforcement (police, sheriffs, CHP), which is the largest portion of total criminal justice personnel, grew 23 percent.
� The state’s total population increased about 18 percent between 1989 and 1999.
Criminal Justice Statistics Center Criminal Justice Statistics Center
Criminal Justice Statistics CenterCriminal Justice Statistics CenterCriminal Justice Statistics CenterCriminal Justice Statistics Center Criminal Justice Statistics CenterCriminal Justice Statistics CenterCriminal Justice Statistics CenterCriminal Justice Statistics Center
30 31 Crime in California
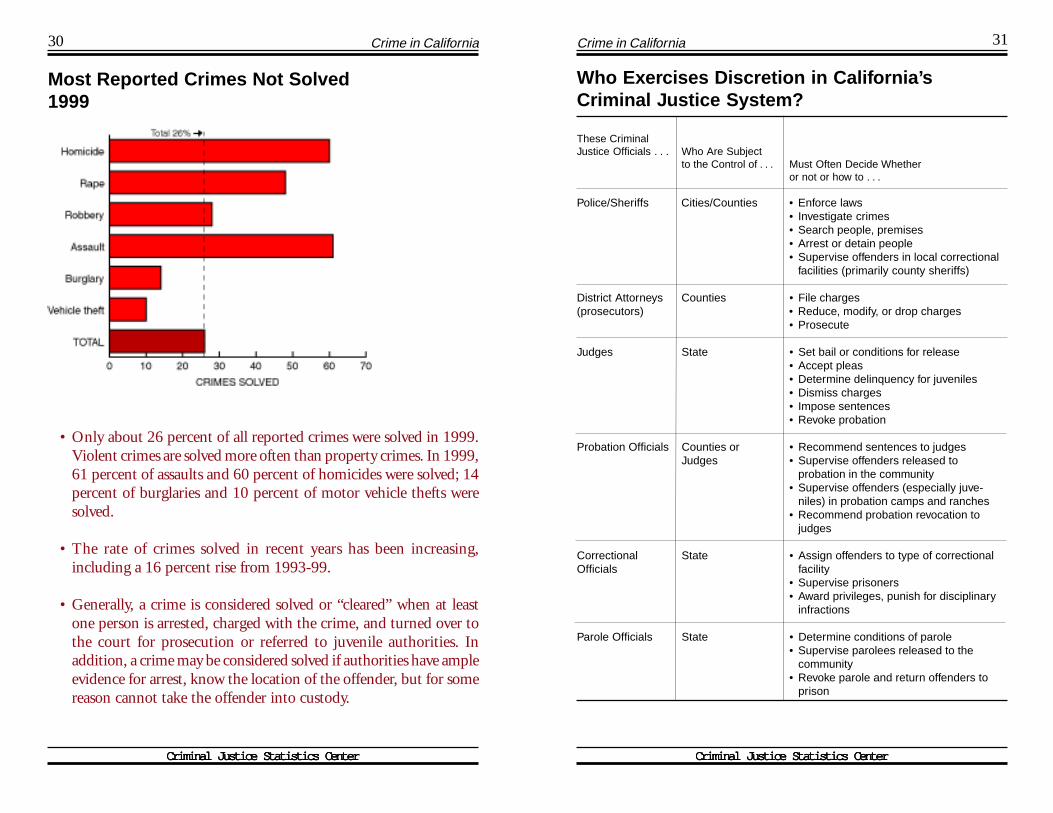
Most Reported Crimes Not Solved 1999
� Only about 26 percent of all reported crimes were solved in 1999. Violent crimes are solved more often than property crimes. In 1999, 61 percent of assaults and 60 percent of homicides were solved; 14 percent of burglaries and 10 percent of motor vehicle thefts were solved.
� The rate of crimes solved in recent years has been increasing, including a 16 percent rise from 1993-99.
� Generally, a crime is considered solved or “cleared” when at least one person is arrested, charged with the crime, and turned over to the court for prosecution or referred to juvenile authorities. In addition, a crime may be considered solved if authorities have ample evidence for arrest, know the location of the offender, but for some reason cannot take the offender into custody.
Criminal Justice Statistics Center
Crime in California
Who Exercises Discretion in California’s Criminal Justice System?
These Criminal Justice Officials . . . Who Are Subject
to the Control of . . . Must Often Decide Whether or not or how to . . .
Police/Sheriffs Cities/Counties • Enforce laws � Investigate crimes � Search people, premises � Arrest or detain people � Supervise offenders in local correctional
facilities (primarily county sheriffs)
District Attorneys (prosecutors)
Counties � File charges � Reduce, modify, or drop charges � Prosecute
Judges State � Set bail or conditions for release � Accept pleas � Determine delinquency for juveniles � Dismiss charges � Impose sentences � Revoke probation
Probation Officials Counties or Judges
� Recommend sentences to judges � Supervise offenders released to
probation in the community � Supervise offenders (especially juve-
niles) in probation camps and ranches � Recommend probation revocation to
judges
Correctional Officials
State � Assign offenders to type of correctional facility
� Supervise prisoners � Award privileges, punish for disciplinary
infractions
Parole Officials State � Determine conditions of parole � Supervise parolees released to the
community � Revoke parole and return offenders to
prison
Criminal Justice Statistics Center

Criminal Justice Statistics CenterCriminal Justice Statistics CenterCriminal Justice Statistics CenterCriminal Justice Statistics CenterCriminal Justice Statistics CenterCriminal Justice Statistics CenterCriminal Justice Statistics CenterCriminal Justice Statistics Center
��
32 Crime in California Crime in California 33
What Happened to Adult Felony Arrests In 1999?
Vast Majority of Convicted Felons Supervised by Counties 1999
16%
Offenders Released or Complaints
Denied
100%
ACTIONS TAKEN ON FELONY ARRESTS
84%
Complaints Filed
71%
Convictions
� About 78 percent of convicted felons are housed and/or supervised by counties.
� Only 22 percent of all convicted felons are sentenced to the Department of Corrections or the Department of the Youth
��
13%
Not Convicted
Authority.
� 46% Probation with Jail 15% State Prison 6% Probation 3% Jail 1% Fine/Other
Criminal Justice Statistics Center Criminal Justice Statistics Center
Criminal Justice Statistics CenterCriminal Justice Statistics CenterCriminal Justice Statistics CenterCriminal Justice Statistics Center Criminal Justice Statistics CenterCriminal Justice Statistics CenterCriminal Justice Statistics CenterCriminal Justice Statistics Center
34 35 Crime in California
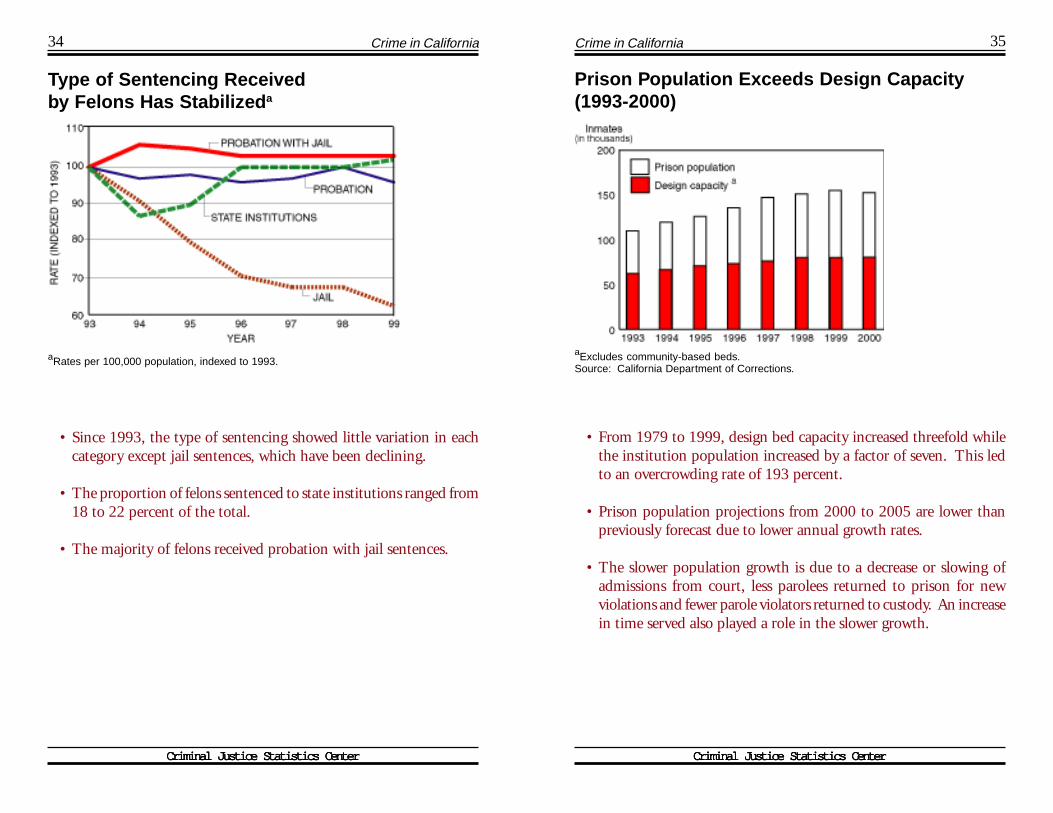
Type of Sentencing Received by Felons Has Stabilizeda
aRates per 100,000 population, indexed to 1993.
� Since 1993, the type of sentencing showed little variation in each category except jail sentences, which have been declining.
� The proportion of felons sentenced to state institutions ranged from 18 to 22 percent of the total.
� The majority of felons received probation with jail sentences.
Criminal Justice Statistics Center
Crime in California
Prison Population Exceeds Design Capacity (1993-2000)
aExcludes community-based beds. Source: California Department of Corrections.
� From 1979 to 1999, design bed capacity increased threefold while the institution population increased by a factor of seven. This led to an overcrowding rate of 193 percent.
� Prison population projections from 2000 to 2005 are lower than previously forecast due to lower annual growth rates.
� The slower population growth is due to a decrease or slowing of admissions from court, less parolees returned to prison for new violations and fewer parole violators returned to custody. An increase in time served also played a role in the slower growth.
Criminal Justice Statistics Center

Criminal Justice Statistics CenterCriminal Justice Statistics CenterCriminal Justice Statistics CenterCriminal Justice Statistics CenterCriminal Justice Statistics CenterCriminal Justice Statistics CenterCriminal Justice Statistics CenterCriminal Justice Statistics Center
36 Crime in California Crime in California 37
A Profile of Criminal Offenders Supervised by Counties
A Profile of Criminal Offenders Supervised by the State
Type of Offender General Characteristics
County Juvenile � Male, about 16 years old, equally likely to be white Probationer (non-Hispanic), black, or Hispanic
� From urban area
� At least one year behind in schooling
� Committed for property or drug-related offense
� Likely to have had two or three other contacts (questioning or arrest) with law enforcement prior to most recent arrest
� Likely supervised at home on probation, after short stay in juvenile hall
� After completing probation, stands a good chance of not committing a new offense as a juvenile or an adult
County Adult � Male, about 25 years old, more likely to be black or Probationer Hispanic
� Committed nonviolent offense, usually property or drug-related offense
� Served a few months in jail before beginning probation, although many are placed in drug or DUI diversion programs (instead of jail) and then are placed on probation
� Generally not supervised during probation period, except to inform probation officer of whereabouts
County Jail � Male, 18 to 55 years old (usually 25 to 30), more likely Inmate to be black or Hispanic
� About half awaiting trial on misdemeanor charge, such as DUI, average stay is 19 days
� Other half sentenced to jail or jail and probation for less than one year for a misdemeanor or low-level felony
Type of Offender General Characteristics
State Youth � Male, 19 years old, from Los Angeles or Bay Area, Authority Ward more likely to be Hispanic or black
� 65 percent were committed for violent crime
� Has abused alcohol and/or drugs, but not incarcerated for drug-related crime
� Sixth-grade education level
� Likely to be committed only once to the Youth Authority, but has been arrested between 8 and 33 times - although not charged with a crime in many cases
� Has been previously incarcerated in county juvenile hall and/or probation camp
� Average stay will be 34 months, followed by parole in community
� 66 percent chance of completing parole without committing a new offense as a juvenile or adult
State Prison � Male, 20 to 34 years old, from southern California, more Inmate likely to be black or Hispanic
� 55 percent were committed for nonviolent offense, usually a drug or property crime
� Has a history of drug abuse
� Eighth-grade education level
� In prison for 20 months for nonviolent offense; 37 months for violent offense
� Will be supervised in community on parole for one year after discharge from prison
� About 55 percent will return to prison for less than one year for a technical violation of parole (a violation that did not result in criminal prosecution)
� About 13 percent will return to prison for committing a new felony offense, most likely a property offense
Source: Federal and state reports and interviews with selected counties. Source: CaliforniaYouth Authority and California Department of Corrections.
Criminal Justice Statistics Center Criminal Justice Statistics Center

Criminal Justice Statistics CenterCriminal Justice Statistics CenterCriminal Justice Statistics CenterCriminal Justice Statistics Center Criminal Justice Statistics CenterCriminal Justice Statistics CenterCriminal Justice Statistics CenterCriminal Justice Statistics Center
38 Crime in California
Who Is In State Prison?
Prison Population 1999 Admissions December 31, 1999 to Prison
Average Percent Term
Offenses Inmates of Total Inmates (years)
Violent Offenses
Murder, First Degreea
Murder, Second Degreea
Manslaughter
Vehicular Manslaughter
Robbery
Assault with Deadly Weapon
Other Assault/Battery
Rape
Lewd Act with Child
Oral Copulation
Sodomy
Penetration with Object
Other Sex Offenses
Kidnap
8,908 5.6 434
9,211 5.7 561
2,728 1.7 322
426 0.3 121
16,881 10.5 2,921
9,653 6.0 2,492
8,737 5.5 2,666
2,116 1.3 272
6,302 3.9 1,274
696 0.4 98
228 0.1 30
357 0.2 77
1,813 1.1 680
2,303 1.4 188
-
16.4
10.7
7.2
10.1
6.0
5.0
26.3
12.7
27.7
16.8
11.6
5.2
15.1
Subtotals 70,359 43.9 12,136 (-)
Property Offenses
Burglary, First Degree
Burglary, Second Degree
Grand Theft
Petty Theft with Prior
Receiving Stolen Property
Vehicle Theft
Forgery/Fraud
Other Property
7,900 4.9 1,628 6.9
6,455 4.0 2,032 3.1
2,666 1.7 1,185 2.8
7,204 4.5 1,910 2.8
2,906 1.8 964 2.7
4,494 2.8 1,412 2.8
1,870 1.2 844 2.7
581 0.4 218 3.2
Subtotals 34,076 21.3 10,193 (-)
Criminal Justice Statistics Center
Crime in California 39
Who Is In State Prison? CONTINUED
Offenses
Prison Population December 31, 1999
Percent Inmates of Total
1999 Admissions to Prison
Average Term
Inmates (years)
Drug Offenses
Possession
Possession for Sale
Sale
Manufacturing
Other drug
Marijuana Possession
Marijuana Possession for Sale
Marijuana Sale
Other marijuana
19,753 12.3 7,335
12,974 8.1 4,915
6,850 4.3 1,708
2,992 1.9 1,214
948 0.6 225
27 – 13
936 0.6 548
714 0.4 295
134 0.1 75
2.3
3.6
4.8
4.4
3.7
1.6
2.1
3.0
2.9
Subtotals 45,328 28.3 16,328 (-)
Other Offenses
Escape
Driving Under the Influence
Arson
Possession of a Weapon
Other Offenses
Unknown (data unavailable)
295 0.2 61 3.1
2,300 1.4 1,432 2.4
432 0.3 146 5.0
4,362 2.7 1,177 3.1
3,108 1.9 1,446 3.5
427 0.3 17 7.7
Subtotals 10,924 6.8 4,262 (-)
TOTALS 160,687 100.0 42,936 (-)
aSentence for Murder, First Degree is 25 to life, LWOP, or death. aSentence for Murder, Second Degree is 15 to life. Source: California Department of Corrections.
Criminal Justice Statistics Center
����
����
����
����
����
Criminal Justice Statistics CenterCriminal Justice Statistics CenterCriminal Justice Statistics CenterCriminal Justice Statistics Center
40 Crime in California
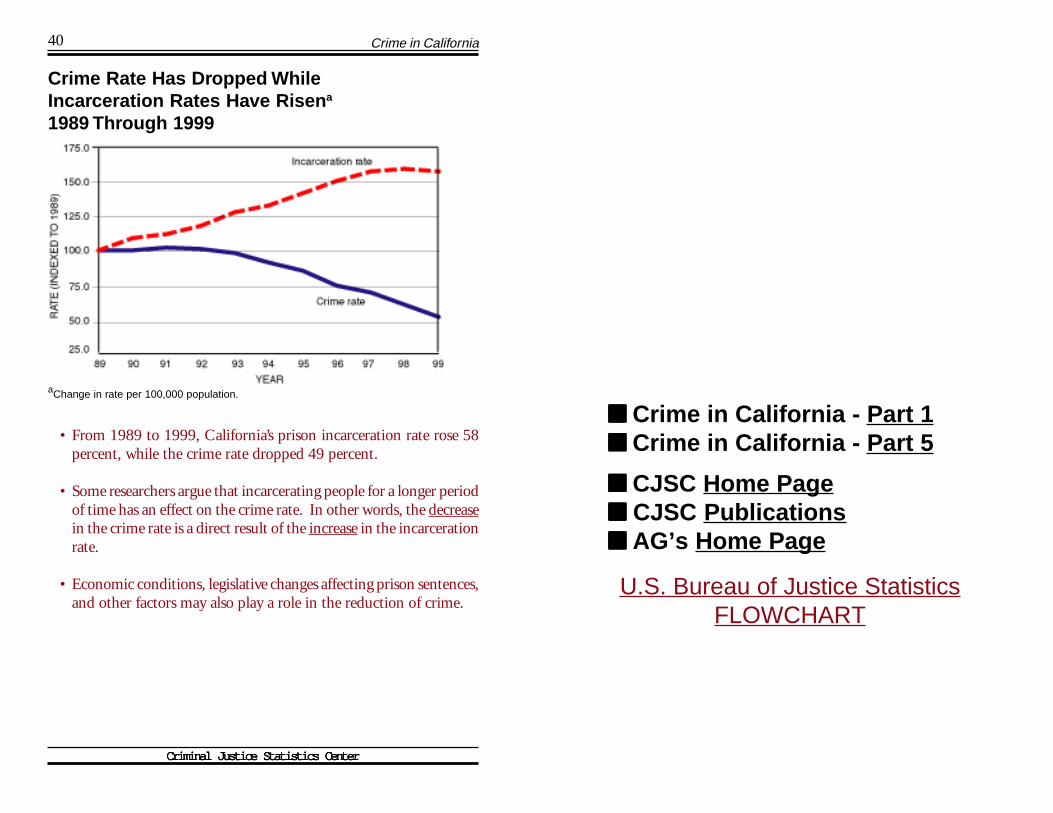
Crime Rate Has Dropped While Incarceration Rates Have Risena
1989 Through 1999
aChange in rate per 100,000 population.
� From 1989 to 1999, California’s prison incarceration rate rose 58 percent, while the crime rate dropped 49 percent.
� Some researchers argue that incarcerating people for a longer period of time has an effect on the crime rate. In other words, the decrease in the crime rate is a direct result of the increase in the incarceration rate.
� Economic conditions, legislative changes affecting prison sentences, and other factors may also play a role in the reduction of crime.
� Crime in California - Part 1 � Crime in California - Part 5
� CJSC Home Page � CJSC Publications � AG’s Home Page
U.S. Bureau of Justice Statistics FLOWCHART
Criminal Justice Statistics Center
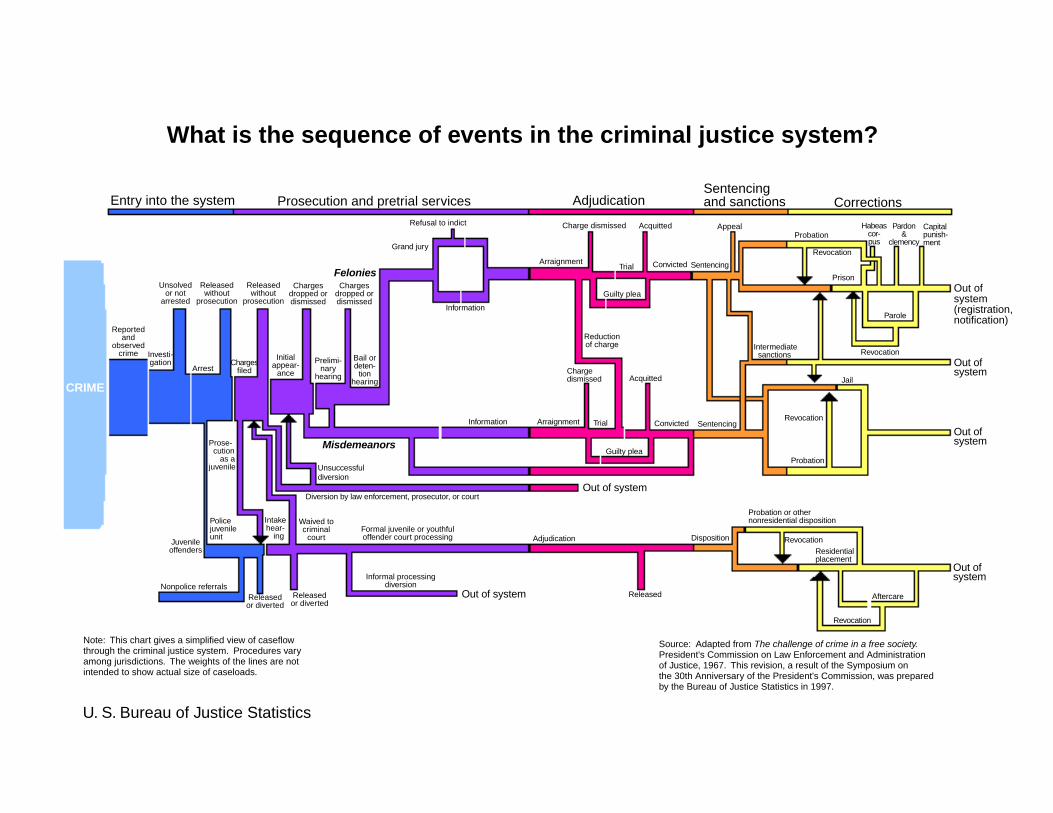
What is the sequence of events in the criminal justice system?
Sentencing Entry into the system Prosecution and pretrial services Adjudication and sanctions Corrections
Refusal to indict Charge dismissed Acquitted Appeal Habeas Pardon Capital Probation cor- & punish-
pus clemency mentGrand jury Revocation
Arraignment Trial Convicted Sentencing
Felonies Prison Unsolved Released Released Charges Charges Out ofor not without without dropped or dropped or Guilty pleaarrested prosecution prosecution dismissed dismissed system
Information (registration, Parole notification)
Reported and Reduction
observed of charge Intermediate crime Investi- sanctions Revocation
Initial Bail orPrelimi-gation Charges Out ofappear- deten-Arrest nary filed ance tion Charge systemhearing dismissed Acquittedhearing Jail CRIME
Revocation Information Arraignment Trial Convicted Sentencing Out of
Prose- systemMisdemeanorscution Guilty plea
as a Probation juvenile Unsuccessful
diversion
Out of system Diversion by law enforcement, prosecutor, or court
Probation or other Police Intake Waived to nonresidential disposition juvenile hear- criminal Formal juvenile or youthful unit ing court offender court processing Adjudication Disposition Revocation
offenders Residential placement
Out of Informal processing system
Nonpolice referrals
Juvenile
diversion
Released Released Out of system Released Aftercare or diverted or diverted
Revocation
Note: This chart gives a simplified view of caseflow Source: Adapted from The challenge of crime in a free society. through the criminal justice system. Procedures vary President's Commission on Law Enforcement and Administration among jurisdictions. The weights of the lines are not of Justice, 1967. This revision, a result of the Symposium on intended to show actual size of caseloads. the 30th Anniversary of the President's Commission, was prepared
by the Bureau of Justice Statistics in 1997.
U. S. Bureau of Justice Statistics

�����
�����
�����
�����
Criminal Justice Statistics CenterCriminal Justice Statistics CenterCriminal Justice Statistics CenterCriminal Justice Statistics Center
41
Crime in California - Part 1
CJSC Home Page CJSC Publications AG’s Home Page
Crime in California
How Much Does Crime Cost?
There is no simple answer to this difficult question. Although many studies over the years have attempted to quantify the total direct and indirect costs of crime to government and society, the results have varied widely, but all conclude that the nationwide costs are in the tens to hundreds of billions of dollars annually.
Some components of the cost of crime (such as the government’s cost of fighting crime) can be readily estimated. For example, in 1997-98, California spent about $18.1 billion to fight crime, which included costs for police, prosecution, courts, probation, and incarceration. (California Department of Finance)
Other costs cannot be easily measured. For example, many crimes go undetected or unreported – such as fraud, embezzlement, or arson – and thus their costs to society are not captured. Also, some costs are difficult to estimate because the costs are “transferred,” such as the costs for goods and services that are transferred to consumers by manufacturers and retailers to cover their costs for crime prevention activities or losses from crime.
Criminal Justice Statistics Center
�
�
�
�
�
�
�
Criminal Justice Statistics CenterCriminal Justice Statistics CenterCriminal Justice Statistics CenterCriminal Justice Statistics Center
0.01
Criminal Justice Statistics CenterCriminal Justice Statistics CenterCriminal Justice Statistics CenterCriminal Justice Statistics Center
42 43 Crime in California
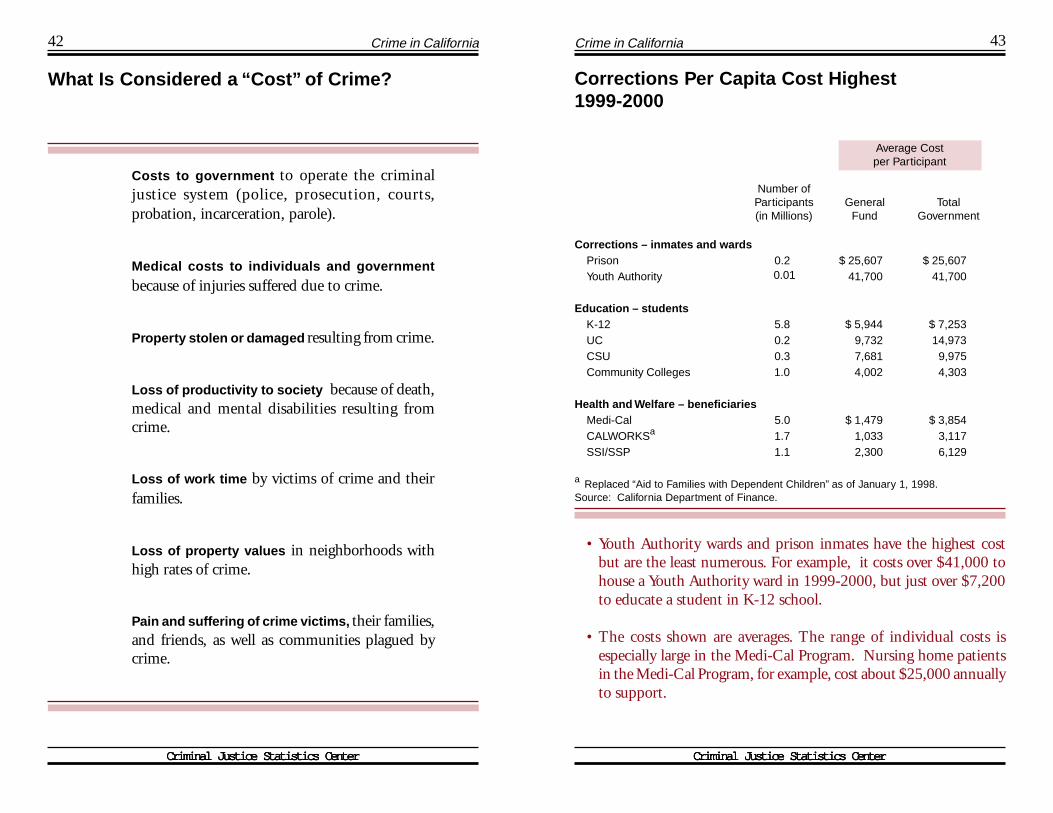
What Is Considered a “Cost” of Crime?
Costs to government to operate the criminal justice system (police, prosecution, courts, probation, incarceration, parole).
Medical costs to individuals and government
because of injuries suffered due to crime.
Property stolen or damaged resulting from crime.
Loss of productivity to society because of death, medical and mental disabilities resulting from crime.
Loss of work time by victims of crime and their families.
Loss of property values in neighborhoods with high rates of crime.
Pain and suffering of crime victims, their families, and friends, as well as communities plagued by crime.
Criminal Justice Statistics Center
Crime in California
Corrections Per Capita Cost Highest 1999-2000
Average Cost per Participant
Number of Participants General Total (in Millions) Fund Government
Corrections – inmates and wards Prison 0.2 $ 25,607 $ 25,607 Youth Authority 0.01 41,700 41,700
Education – students K-12 5.8 $ 5,944 $ 7,253 UC 0.2 9,732 14,973 CSU 0.3 7,681 9,975 Community Colleges 1.0 4,002 4,303
Health and Welfare – beneficiaries Medi-Cal 5.0 $ 1,479 $ 3,854 CALWORKSa 1.7 1,033 3,117 SSI/SSP 1.1 2,300 6,129
a Replaced “Aid to Families with Dependent Children” as of January 1, 1998. Source: California Department of Finance.
� Youth Authority wards and prison inmates have the highest cost but are the least numerous. For example, it costs over $41,000 to house a Youth Authority ward in 1999-2000, but just over $7,200 to educate a student in K-12 school.
� The costs shown are averages. The range of individual costs is especially large in the Medi-Cal Program. Nursing home patients in the Medi-Cal Program, for example, cost about $25,000 annually to support.
Criminal Justice Statistics Center

Criminal Justice Statistics CenterCriminal Justice Statistics CenterCriminal Justice Statistics CenterCriminal Justice Statistics Center Criminal Justice Statistics CenterCriminal Justice Statistics CenterCriminal Justice Statistics CenterCriminal Justice Statistics Center
44 45 Crime in California
Corrections Is Small Portion of Total 1999-2000 State Spending
Source: California Department of Finance.
� Spending for Corrections is about 6 percent of total state spending in 1999-2000.
� Ten years ago in 1989-90, spending for Corrections was about 4.5 percent of total state spending.
Criminal Justice Statistics Center
Crime in California
Corrections Spending Has Stabilized 1989-90 Through 1999-2000
Source: California Department of Finance.
� From 1989-90 to 1999-2000, spending for Corrections increased, on average, about 5 percent per year. Total state spending increased about 6 percent annually during this time period.
� During the 1980s, Corrections’ spending increased by an average of 19 percent annually, while the state’s budget increased by about 9 percent per year.
� Reasons for the stabilization may be the slowing of admissions to State institutions, a lower incarceration rate for the last 2 years, and the overall reduction in crime during the last 8 years.
Criminal Justice Statistics Center
Criminal Justice Statistics CenterCriminal Justice Statistics CenterCriminal Justice Statistics CenterCriminal Justice Statistics Center
47 Crime in California
What Are the Policy Implications?
The major policy implications of the data presented in this report are summarized briefly below.
Recognize Divergence of Crime Data and Public Perceptions of Crime. Californians are more likely to be victimized by an accident in their own homes than they are by crime. Both public perceptions and crime data should be taken into account by decision-makers when shaping public policy affecting the state’s criminal justice system.
Recognize That Criminal Justice System Deals With Small Portion of Total Crime. As we indicated earlier, the criminal justice system deals with only a small portion of all criminal activity in society, principally because about 64 percent of all crimes go unreported to, or undiscovered by, police (U.S. Department of Justice). If policy-makers wish to affect a larger share of crime, it will require a significantly larger investment of funds than is currently being spent by government. Given scarce government resources, such an increased investment will require that policy-makers select new, cost-effective approaches (and new strategies) to crime fighting, not using scarce resources for activities that may result in only marginal changes in the crime rate.
Recognize Importance of Demographics in Crime. As we indicated, a large amount of crime is committed by young people, and the decline in crime rates in California in the 1980s was due, at least in part, to the aging of the population (Source: Legislative Analyst’s Office). For these reasons, it is important for policy-makers to recognize that the changing demographics of California – particularly the boom in juvenile population that is projected to occur during the early part of the 2000 decade – could result in a return to the high crime rates of the late 1970s and early 1980s.
Criminal Justice Statistics Center

� � �
�����
�����
�����
�����
48 Crime in California
Recognize the Interrelationships Among the Parts of the Criminal Justice System and the Need for Flexibility. The component parts of the state’s criminal justice system are, by necessity, closely interrelated (persons arrested by police are prosecuted by district attorneys, decisions as to their fate are made by the courts, and punishment/treatment is applied by probation and corrections officials). It is important for policy-makers to understand and appreciate these interrelationships.
As we showed in the chart “Who Exercises Discretion in California’s Criminal Justice System” (see page 31), the system includes significant flexibility at various levels. The greatest flexibility is generally at the “front-end” of the process – police and prosecutors. The system functions as a result of this flexibility, and efforts to reduce flexibility could significantly affect the system as a whole. For example, eliminating the ability of prosecutors to reduce the charges against a nonviolent offender could result in greater costs for prosecution, courts, and corrections, thereby limiting resources available to deal with violent offenders or other high-priority matters.
Crime in California - Part 1
CJSC Home Page CJSC Publications AG’s Home Page
CJSC* PUBLICATIONS IN PRINT AND ON THE INTERNET**
Annuals Crime and Delinquency in California** Crime and Delinquency in California,
Advance Release** Crime as Reported by Selected California
Agencies, January through September** Criminal Justice Profile - A Supplement to
C&D (statewide and individual counties)** Hate Crime in California** Homicide in California** Preliminary Report, Crime (January
through June and January through December)**
BCS Foci and Forums The California Experience in American
Juvenile Justice: Some Historical Perspectives (December 1988)
Controlling Plea Bargaining in California (September 1985)
Coordinating Justice in California: “There ought to be a law about it” (December 1988)
Crime Control and the Criminal Career (December 1992)
The Development of California Drunk Driving Legislation (December 1988)
Employment and Crime (February 1989) The Impact of California’s “Prior Felony
Conviction” Law (September 1987) The Origins and Development of Penalties
for Drunk Drivers in California (August 1988)
A Policy Role for Focus Groups: Community Corrections (September 1991)
The Prevalence and Incidence of Arrests Among Adult Males in California (August 1988)
The Social Structure of Street Drug Dealing (December 1988)
BCS Outlooks Adult Felony Arrest Dispositions in
California (1982-1984,1986-1989) Crime in Urban and Rural California
(November 1984 and December 1997)** Felony Drug Arrests in California, 1985
(December 1986) Juvenile Justice in California, 1983 (June
1984) Motor Vehicle Theft in California
(December 1987) Motor Vehicle Theft Recovery Data,
1983-1989 (October 1990) Women in Crime: The Sentencing of
Female Defendants (April 1988)
BCS Reports Adult Felony Arrest Dispositions in
California (April 1992) Crime in California and the United States,
(1983, 1990, 2000) Effectiveness of Statutory Requirements
for the Registration of Sex Offenders - A Report to the California State Legislature
Executive Summary of the Final Report -Blue Ribbon Commission on Inmate Population Management (January 1990)
The Juvenile Justice System in California: An Overview (April 1989)
Parolees Returned to Prison and the California Prison Population (January 1988)
Target Hardening: A Literature Review (October 1989)
CJSC Report Series Report on Arrests for Burglary in California,
1998** Report on Arrests for Domestic Violence in
California, 1998** Report on Arrests for Driving Under the
Influence in California, 1997** Report on Violent Crimes Committed Against
Senior Citizens in California, 1998**
Monograph Series Conspicuous Depredation: Automobile
Theft in Los Angeles, 1904 to 1987 (March 1990)
Controlling Felony Plea Bargaining in California: The Impact of the Victim’s Bill of Rights (1986)
Development of a White Collar Crime Index (December 1992)
Incapacitation Strategies and the Career Criminal (December 1992)
Measuring White Collar Crime in Depository Institutions (December 1993)
Prosecutors’ Response to Parental Child Stealing: A Statewide Study (April 1995)
Race & Delinquency in Los Angeles Juvenile Court, 1950 (December 1990)
Survey Report: “The Expansion of the Criminal Justice and Penal System in California - Is greater coordination required?” (December 1988)
Miscellaneous Gang Organization and Migration/Drugs,
Gangs & Law Enforcement Proceedings of the Attorney General’s
Crime Conference 85 (September 1985) Proceedings of Symposium 87: White
Collar/Institutional Crime - Its Measure-ment and Analysis
*Prior to 1991, the Criminal Justice Statistics Center (CJSC) was known as the Bureau of Criminal Statistics (BCS).
**Available on the Internet.