Embed Size (px)
Citation preview

Cross-country comparison of health care system
efficiency
Isabelle Joumard, OECD, Economics Department IMF conference, June 21, 2011 “Public Health Care Reforms: Challenges and Lessons for Advanced and Emerging Europe”
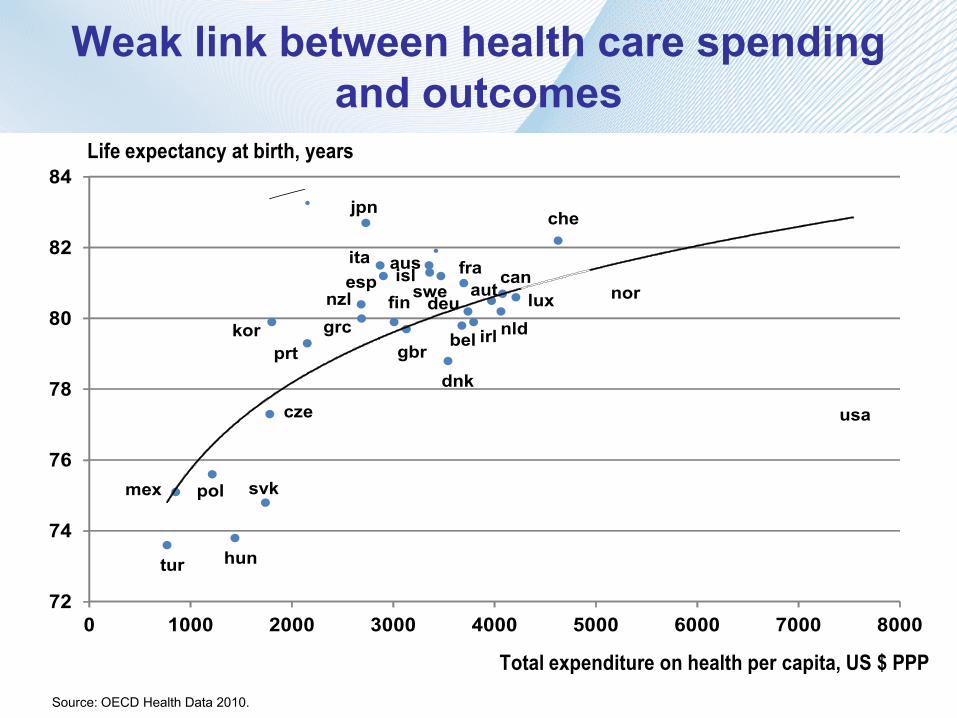
Weak link between health care spending and outcomes
ausaut
bel
can
cze
dnk
fin
fra
deugrc
hun
isl
irl
ita
jpn
kor
lux
mex
nldnzl nor
pol
prt
svk
esp swe
che
tur
gbr
usa
72
74
76
78
80
82
84
0 1000 2000 3000 4000 5000 6000 7000 8000
Total expenditure on health per capita, US $ PPP
Life expectancy at birth, years
Source: OECD Health Data 2010.

Presentation outline
1. Measuring health care spending efficiency
2. Reaping efficiency gains: why (effect on public spending) and how
1. Measuring health care efficiency: difficulties
No obvious definition of health care outcomes and inputs; cross-country data on outcomes are imperfect
A large variety of actors (hospitals, outpatient physicians, drug companies, etc.) and co-ordination matters a great deal
Mix of public and private spending
1. Measuring health care efficiency: OECD approach
Choose an outcome indicator
… and an input indicator
Identify the other determinants
Implement various approaches (panel regressions and DEA) and robustness checks
Complement/compare the overall efficiency index with other performance indicators

Life expectancy at birth Total population, 1960 and 2007
JapanSwitzerlandAustraliaItalyIcelandSpainFranceSwedenCanadaNorwayNew ZealandNetherlandsAustriaGermanyBelgiumIrelandFinlandUnited KingdomGreeceLuxembourgKoreaPortugalOECDDenmarkUnited StatesCzech RepublicPolandMexicoSlovak RepublicHungaryTurkey
82.681.981.481.481.281.081.081.080.780.680.280.280.180.079.879.779.579.579.579.479.479.179.178.478.177.0
75.475.074.373.373.2
405060708090
2007 1960
Years
Source: Health at a Glance 2009, OECD Indicators.

Life expectancy at 65, women Women, 1970 and 2007
JapanFrance
SwitzerlandSpainItaly
AustraliaCanadaFinlandBelgiumNorwayAustria
GermanyNew Zealand
SwedenIcelandKorea
NetherlandsUnited StatesLuxembourg
OECDPortugal
United KingdomIrelandGreece
DenmarkPoland
Czech RepublicMexico
HungarySlovak Republic
Turkey
23.622.322.222.021.821.621.421.321.020.820.820.720.720.720.620.520.520.320.320.220.220.120.1
19.619.218.918.518.2
17.317.1
15.8
510152025
2007 1970
Years
Source: Health at a Glance 2009, OECD Indicators.

Amenable mortality All causes, 2007 or latest year available
0 50 100 150 200 250
EstoniaHungary
Slovak RepublicPolandMexico
Czech RepublicPortugal
United StatesChile
OECDSloveniaDenmark
KoreaUnited Kingdom
New ZealandIreland
GermanyIsrael*
GreeceFinland
LuxembourgCanada
SpainNorwayAustria
AustraliaNetherlands
SwedenJapan
ItalyIcelandFrance
Age-standardised rates per 100 000 population
Source : Gay et al. (2011), "Mortality Amenable to Health Care in 31 OECD Countries: Estimates and Methodological Issues", OECD Health Working Paper, No. 55.
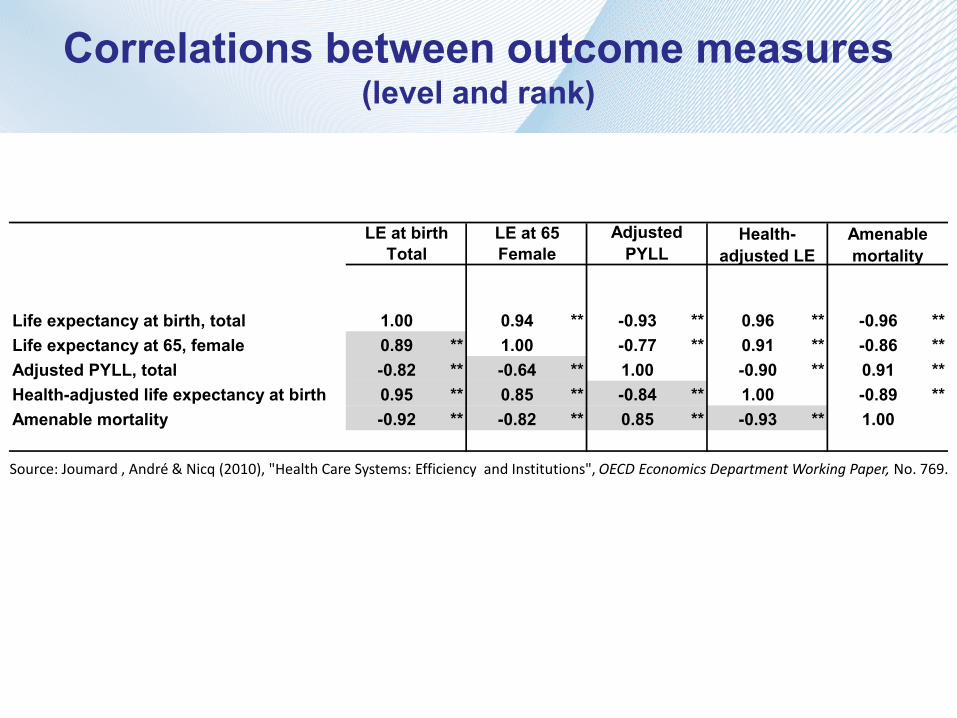
Correlations between outcome measures (level and rank)
LE at birth LE at 65Total Female
Life expectancy at birth, total 1.00 0.94 ** -0.93 ** 0.96 ** -0.96 **Life expectancy at 65, female 0.89 ** 1.00 -0.77 ** 0.91 ** -0.86 **Adjusted PYLL, total -0.82 ** -0.64 ** 1.00 -0.90 ** 0.91 **Health-adjusted life expectancy at birth 0.95 ** 0.85 ** -0.84 ** 1.00 -0.89 **Amenable mortality -0.92 ** -0.82 ** 0.85 ** -0.93 ** 1.00
Amenable mortality
Health-adjusted LE
Adjusted PYLL
Source: Joumard , André & Nicq (2010), "Health Care Systems: Efficiency and Institutions", OECD Economics Department Working Paper, No. 769.
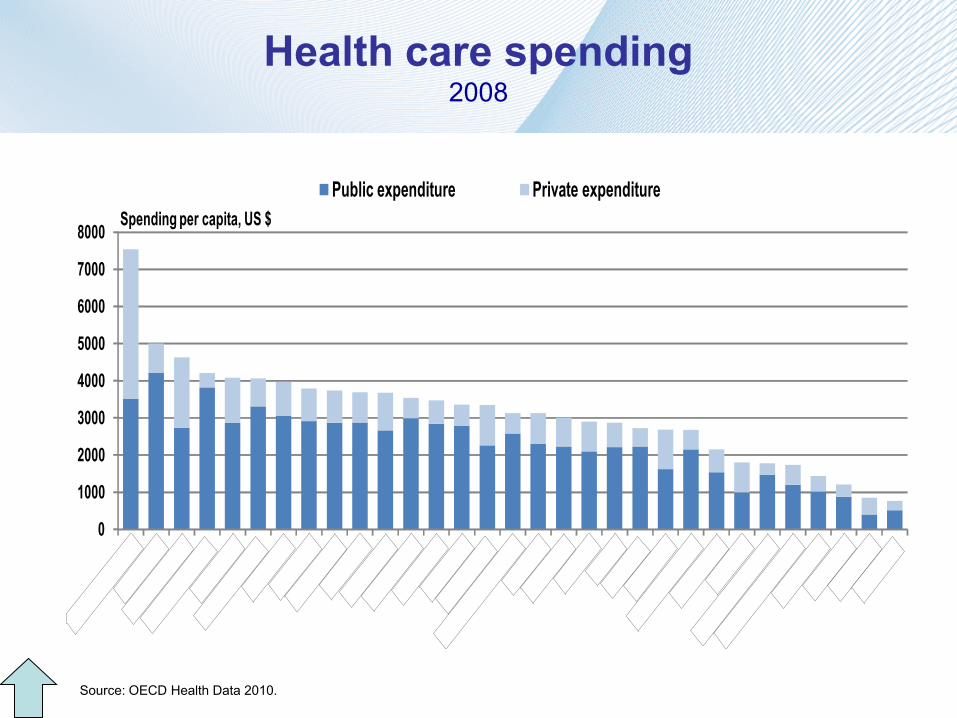
Health care spending 2008
0
1000
2000
3000
4000
5000
6000
7000
8000
Public expenditure Private expenditureSpending per capita, US $
Source: OECD Health Data 2010.
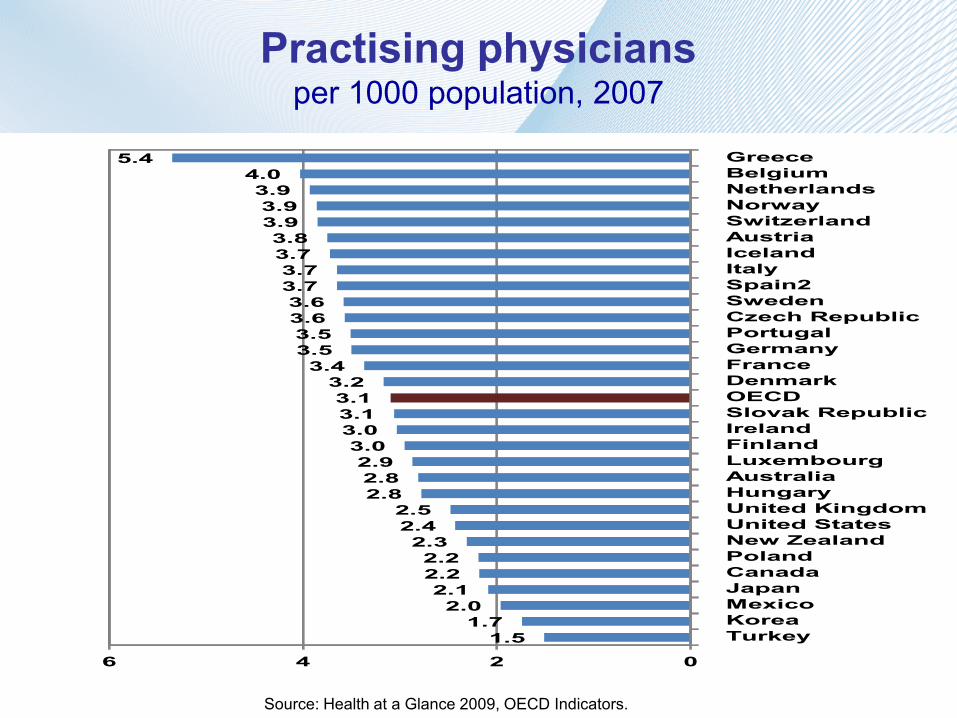
Practising physicians per 1000 population, 2007
GreeceBelgiumNetherlandsNorwaySwitzerlandAustriaIcelandItalySpain2SwedenCzech RepublicPortugalGermanyFranceDenmarkOECDSlovak RepublicIrelandFinlandLuxembourgAustraliaHungaryUnited KingdomUnited StatesNew ZealandPolandCanadaJapanMexicoKoreaTurkey
5.44.03.93.93.93.83.73.73.73.63.63.53.53.4
3.23.13.13.03.02.92.82.8
2.52.42.32.22.22.12.0
1.71.5
0246
Source: Health at a Glance 2009, OECD Indicators.
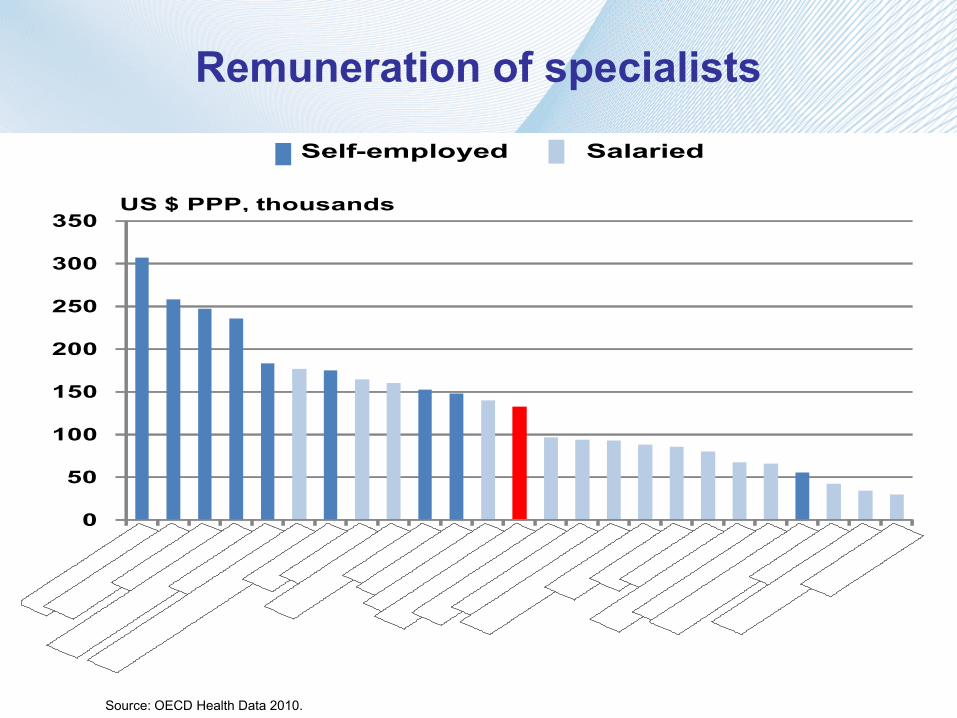
Remuneration of specialists
Self-employed Salaried
0
50
100
150
200
250
300
350US $ PPP, thousands
Source: OECD Health Data 2010.
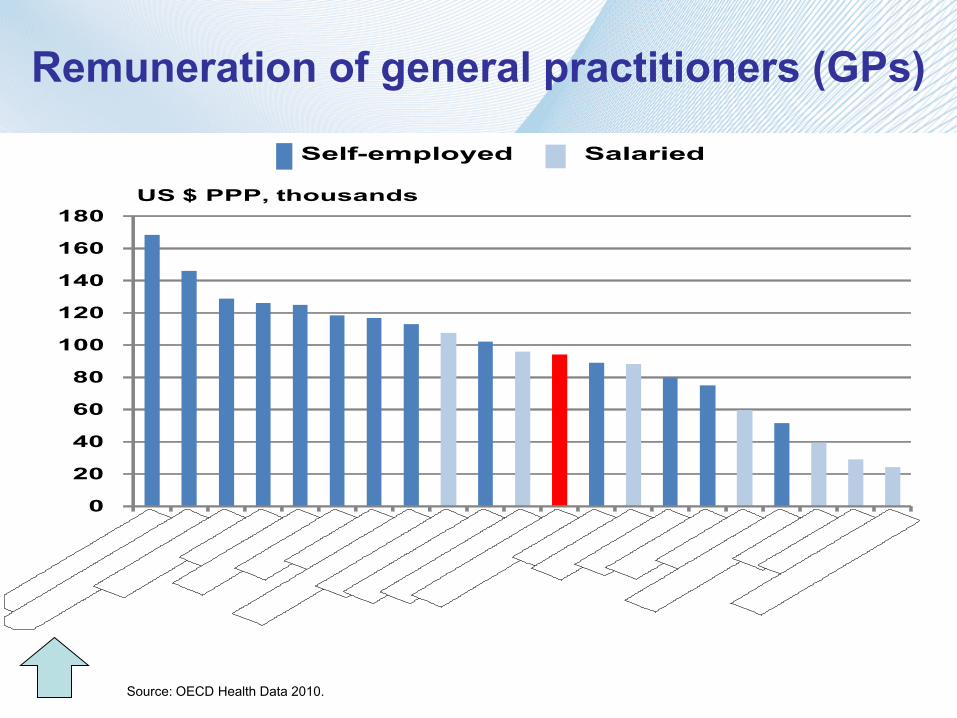
Remuneration of general practitioners (GPs)
Self-employed Salaried
0
20
40
60
80
100
120
140
160
180US $ PPP, thousands
Source: OECD Health Data 2010.

Health care resources
Lifestyle factors: diet, alcohol & tobbaco consumption
Socioeconomic environment: income and education
Pollution
Health care status determinants

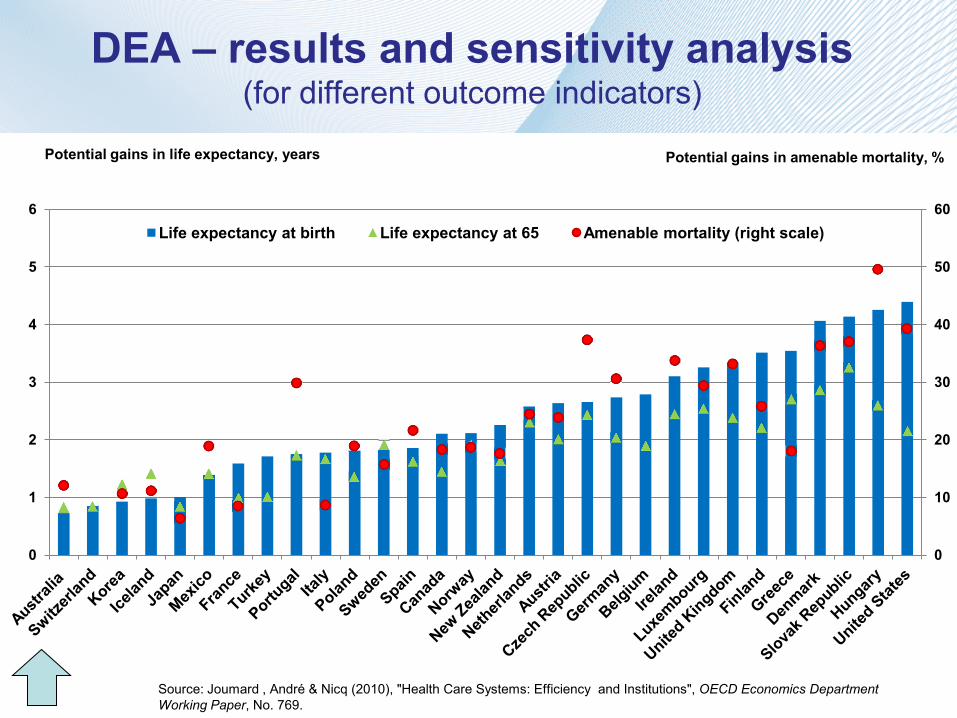
DEA – defining the efficiency frontier and potential efficiency gains
0
10
20
30
40
50
60
0
1
2
3
4
5
6 Life expectancy at birth Life expectancy at 65 Amenable mortality (right scale)
DEA – results and sensitivity analysis (for different outcome indicators)
Source: Joumard , André & Nicq (2010), "Health Care Systems: Efficiency and Institutions", OECD Economics Department Working Paper, No. 769.
Potential gains in life expectancy, years Potential gains in amenable mortality, %
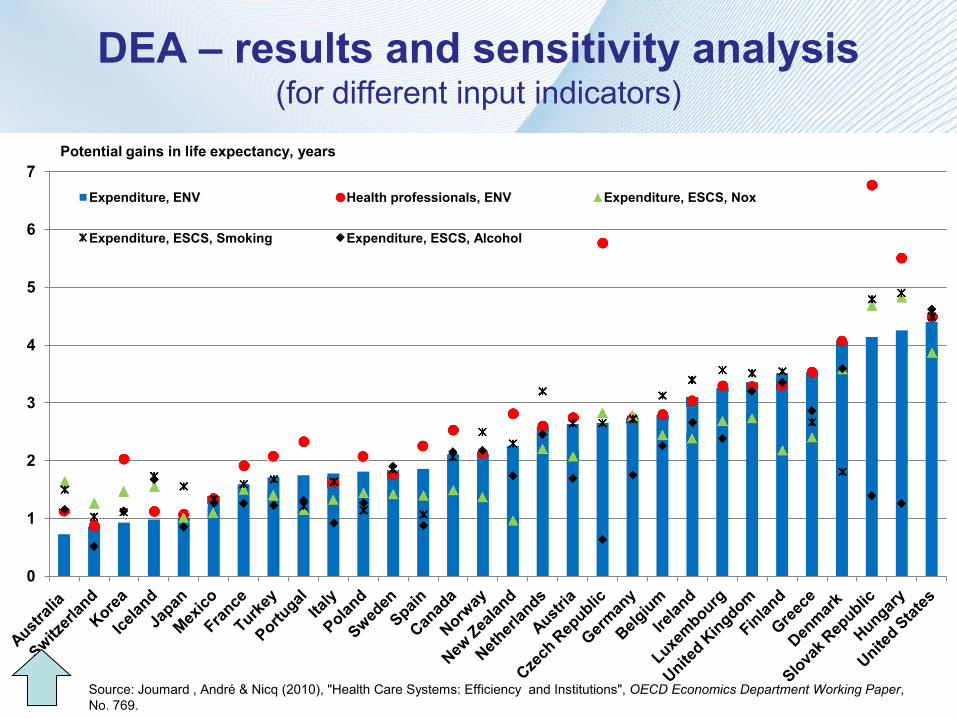
DEA – results and sensitivity analysis (for different input indicators)
0
1
2
3
4
5
6
7 Expenditure, ENV Health professionals, ENV Expenditure, ESCS, Nox
Expenditure, ESCS, Smoking Expenditure, ESCS, Alcohol
Potential gains in life expectancy, years
Source: Joumard , André & Nicq (2010), "Health Care Systems: Efficiency and Institutions", OECD Economics Department Working Paper, No. 769.
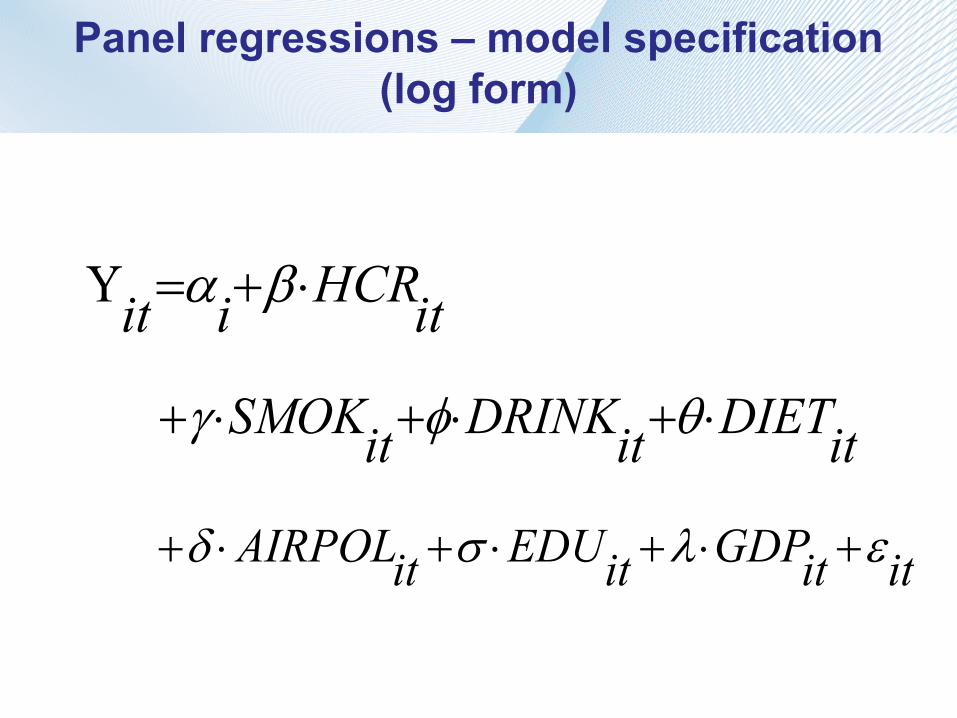
Panel regressions – model specification (log form)
itHCRiit ⋅+=Υ βα
itDIETitDRINKitSMOK ⋅+⋅+⋅+ θφγ
ititGDPitEDUitAIRPOL ελσδ +⋅+⋅+⋅+
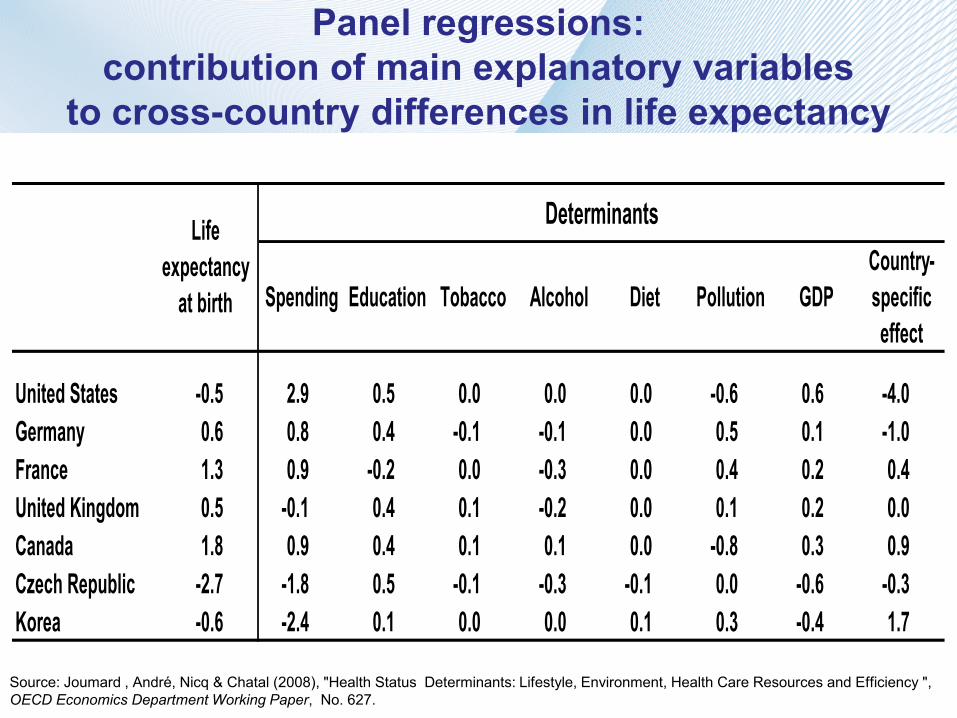
Panel regressions: contribution of main explanatory variables
to cross-country differences in life expectancy
Determinants
Spending Education Tobacco Alcohol Diet Pollution GDPCountry-specific effect
United States -0.5 2.9 0.5 0.0 0.0 0.0 -0.6 0.6 -4.0 Germany 0.6 0.8 0.4 -0.1 -0.1 0.0 0.5 0.1 -1.0 France 1.3 0.9 -0.2 0.0 -0.3 0.0 0.4 0.2 0.4 United Kingdom 0.5 -0.1 0.4 0.1 -0.2 0.0 0.1 0.2 0.0 Canada 1.8 0.9 0.4 0.1 0.1 0.0 -0.8 0.3 0.9 Czech Republic -2.7 -1.8 0.5 -0.1 -0.3 -0.1 0.0 -0.6 -0.3 Korea -0.6 -2.4 0.1 0.0 0.0 0.1 0.3 -0.4 1.7
Life expectancy
at birth
Source: Joumard , André, Nicq & Chatal (2008), "Health Status Determinants: Lifestyle, Environment, Health Care Resources and Efficiency ", OECD Economics Department Working Paper, No. 627.
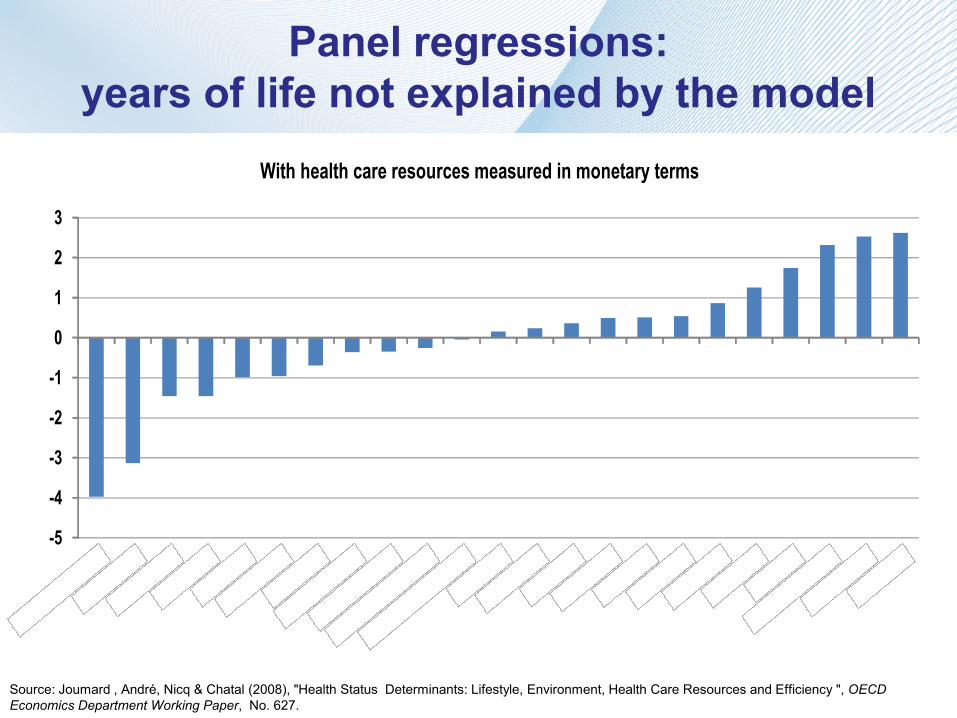
Panel regressions: years of life not explained by the model
With health care resources measured in monetary terms
-5
-4
-3
-2
-1
0
1
2
3
Source: Joumard , André, Nicq & Chatal (2008), "Health Status Determinants: Lifestyle, Environment, Health Care Resources and Efficiency ", OECD Economics Department Working Paper, No. 627.

Comparing efficiency indicators derived from panel regressions and DEA
aus
aut
can
cze
dnk
finfra
deu
grc
hun
isl
irl
kor
nld
nzl
nor
polswe
che tur
gbr
usa
0
1
2
3
4
5
6
7
0 1 2 3 4 5 6 7DEA (years)
Panel regression (years)
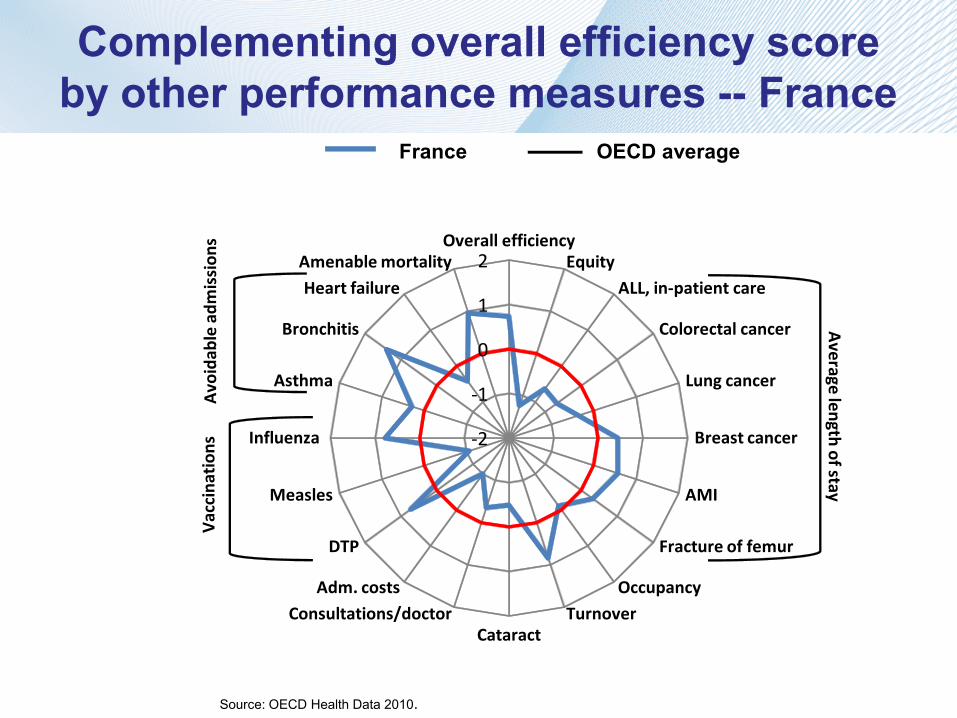
Complementing overall efficiency score by other performance measures -- France
France OECD average
-2
-1
0
1
2Overall efficiency
EquityALL, in-patient care
Colorectal cancer
Lung cancer
Breast cancer
AMI
Fracture of femur
OccupancyTurnover
CataractConsultations/doctor
Adm. costs
DTP
Measles
Influenza
Asthma
Bronchitis
Heart failureAmenable mortality
Vac
cina
tion
s
Average length of stay
Avo
idab
le a
dmis
sion
s
Source: OECD Health Data 2010.
2. Reaping efficiency gains -- Impact on public spending
Main assumptions:
• Health outcomes improve as they did in the past
• Two scenarios on the spending side are compared:
1. No reform scenario – spending increases as it did in the past
2. Reform scenario – efficiency gains are realised to finance all or part of health status improvements
Potential savings in public spending are large
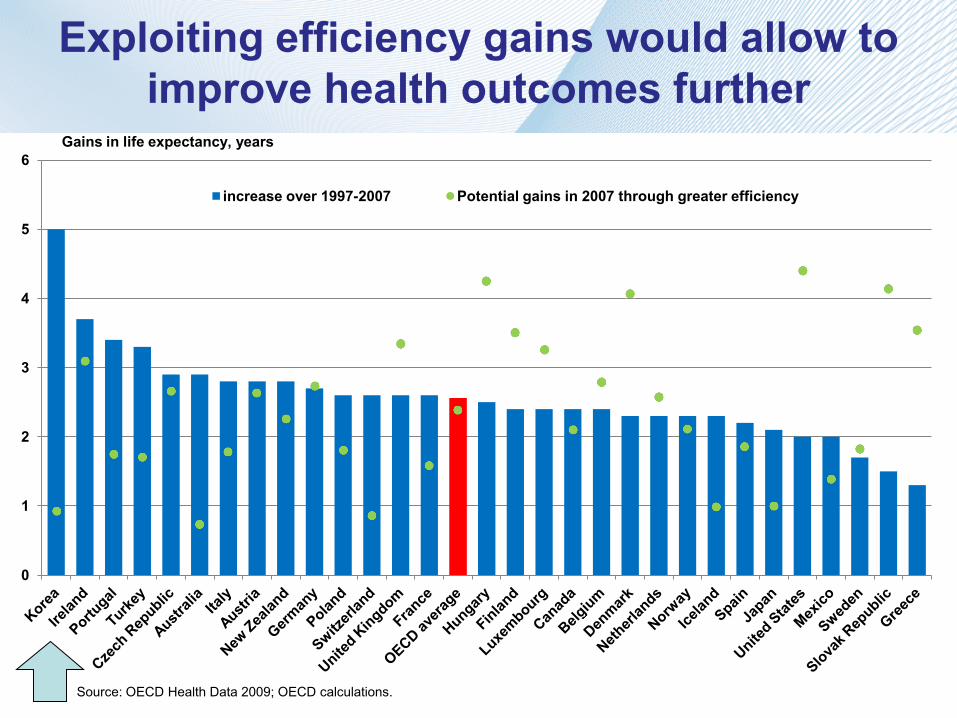
Exploiting efficiency gains would allow to improve health outcomes further
0
1
2
3
4
5
6
increase over 1997-2007 Potential gains in 2007 through greater efficiency
Gains in life expectancy, years
Source: OECD Health Data 2009; OECD calculations.
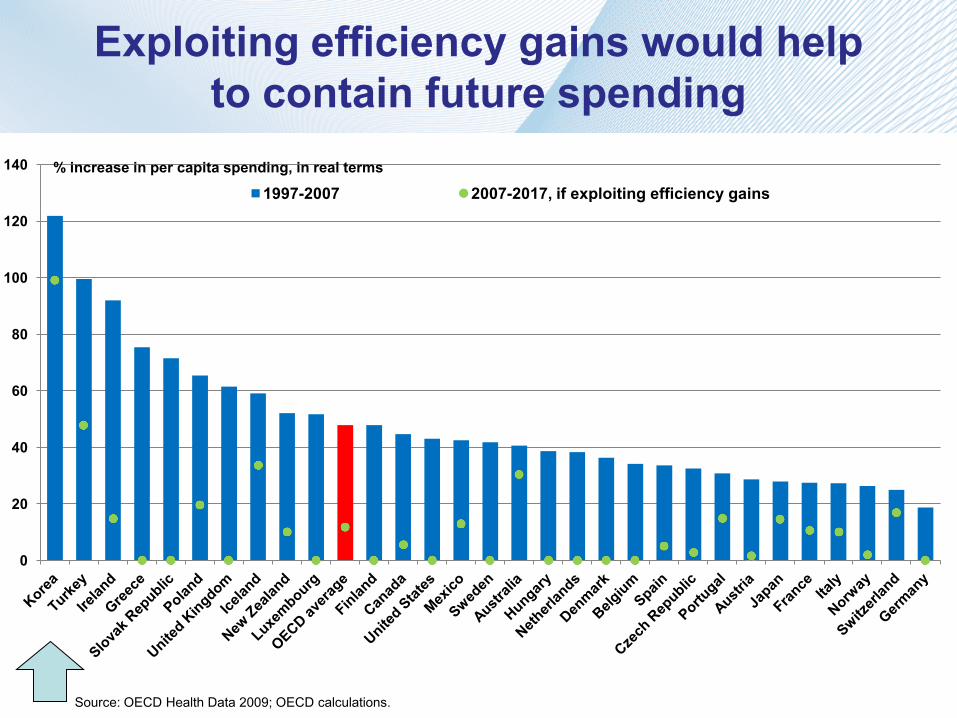
Exploiting efficiency gains would help to contain future spending
0
20
40
60
80
100
120
140
1997-2007 2007-2017, if exploiting efficiency gains % increase in per capita spending, in real terms
Source: OECD Health Data 2009; OECD calculations.
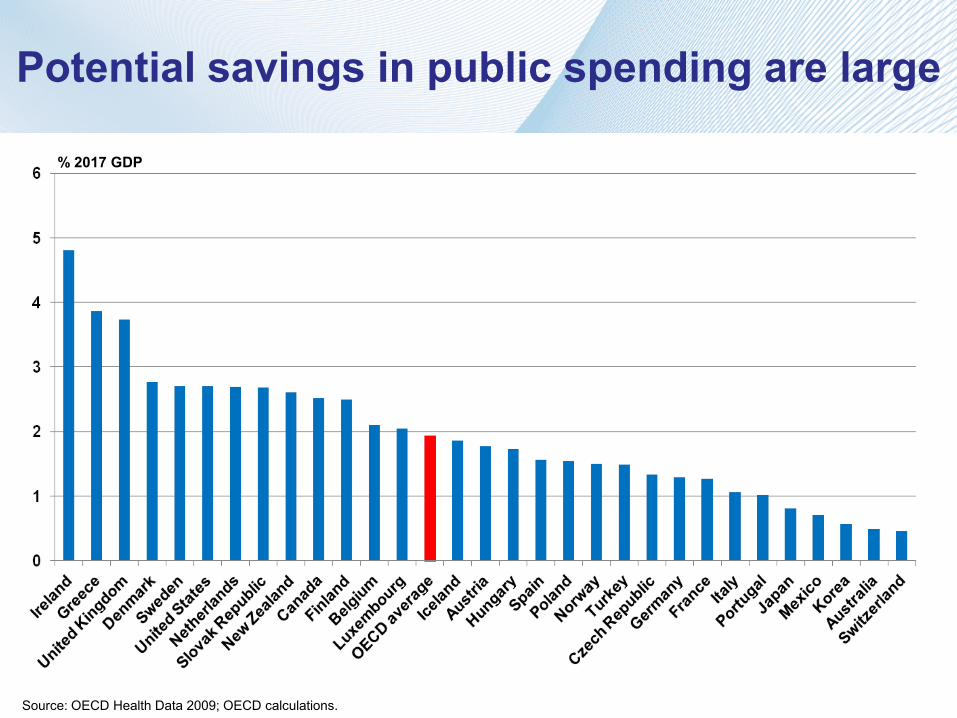
Potential savings in public spending are large
Source: OECD Health Data 2009; OECD calculations.
% 2017 GDP
-2
-1
0
1
2
3
4
5 Population covered
Scope of basic coverage
Depth of coverage
Choice of insurer, basic coverage
Insurer levers, basic coverage
Over-the-basic coverage
Patient choice among providers
Gate-keeping
Price signals on users
Degree of decentralisation Delegation to insurers
Consistency
Priority setting
Stringency of the budget constraint
Degree of private provision
Volume incentives embedded in provider payment schemes
Regulation of prices paid by third-party payers
Regulation of prices billed by providers
Regulation of workforce & equipement
User information on quality and prices
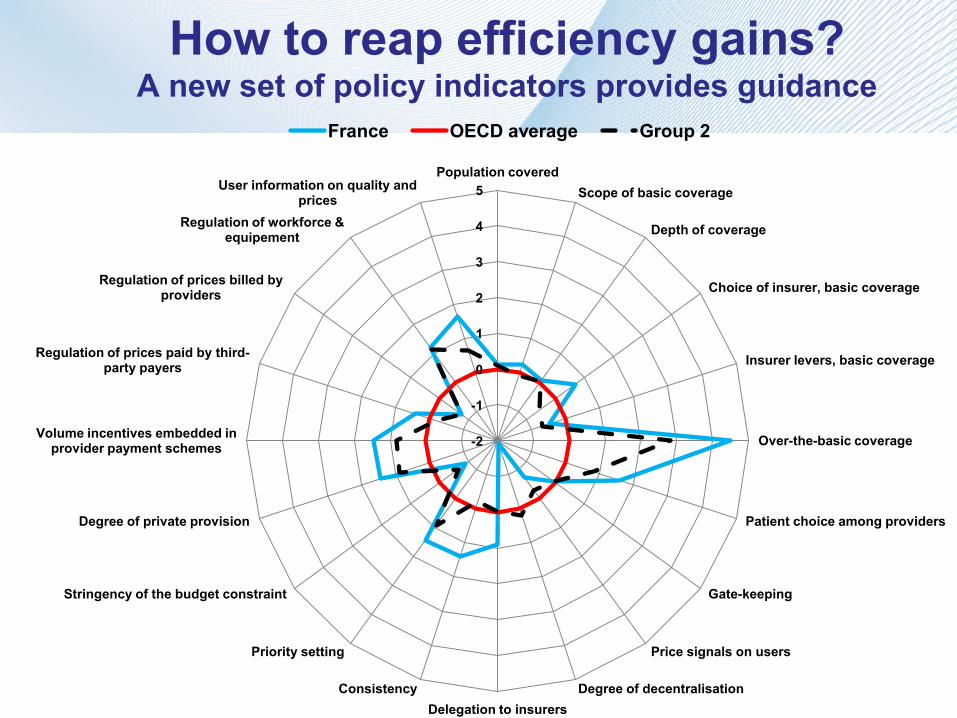
France OECD average Group 2
How to reap efficiency gains? A new set of policy indicators provides guidance
Indicators of health care spending efficiency at the system level can be built and are relatively robust
They can be complemented by indicators of the quality of care and other performance indicators
Exploiting potential efficiency gains would help contain public spending and result in large savings for some countries (on average 2% of GDP by 2017)
To conclude
OECD (2010), Health Care Systems: Efficiency and Policy Settings.
Joumard, André, Nicq & Chatal (2008), "Health Status Determinants: Lifestyle, Environment, Health Care Resources and Efficiency", OECD Economics Department Working Paper, No. 627.
OECD, Health at a Glance (bi-annual publication).
For more information
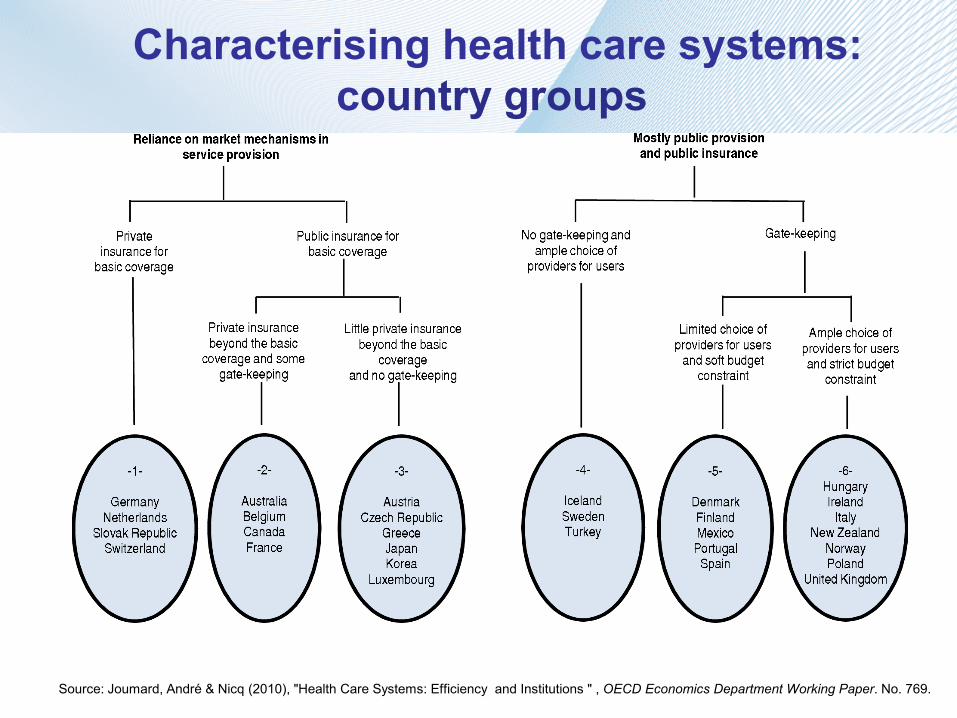
Characterising health care systems:
country groups
Source: Joumard, André & Nicq (2010), "Health Care Systems: Efficiency and Institutions " , OECD Economics Department Working Paper. No. 769.
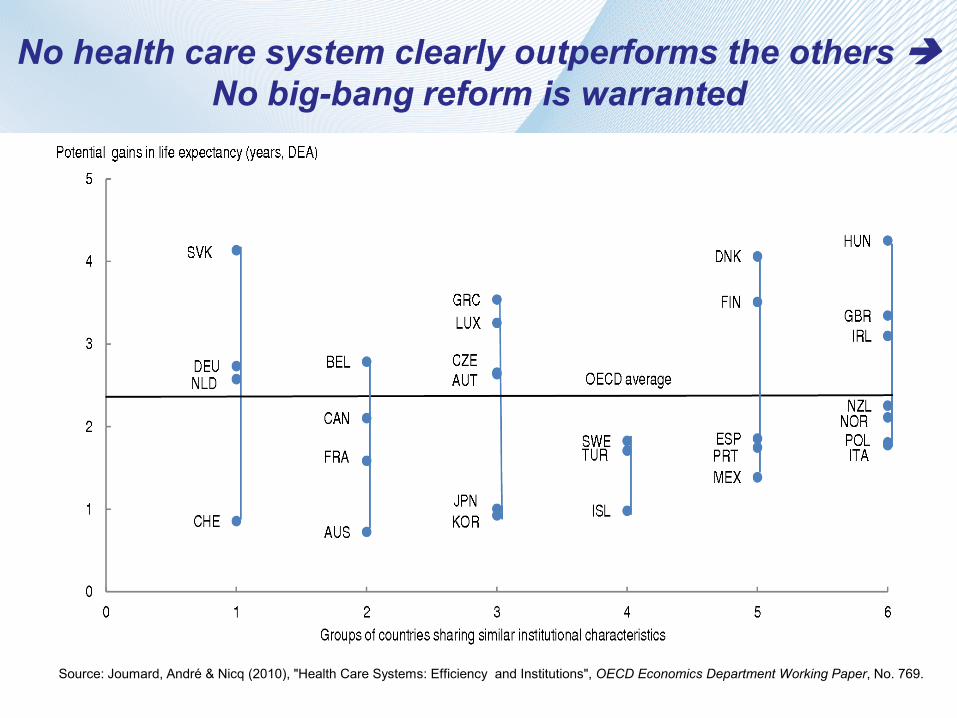
No health care system clearly outperforms the others
No big-bang reform is warranted
Source: Joumard, André & Nicq (2010), "Health Care Systems: Efficiency and Institutions", OECD Economics Department Working Paper, No. 769.