Embed Size (px)
Citation preview

Indian Institute of Management, Ahmedabad, India
Crucial Issues for an Effective Climate Policy in India
P.R. ShuklaIndian Institute of ManagementAhmedabad, India
Presented at International Workshop on, “Reconciling Domestic Energy Needs and Global Climate Policy: Challenges and Opportunities for China and India.”Palazzo Querini Stampalia,Venice, Italy, March 15, 2010
Subash DharUNEP Risoe CentreRoskilde, Denmark

Indian Institute of Management, Ahmedabad, India
Agenda
1. Drivers
2. Vision & Scenarios
3. Modeling & Base Case Projections
4. Stabilization Challenge
5. Crucial Issues
6. Conclusions

Indian Institute of Management, Ahmedabad, India
Demographic DriversYear: 2000 Pop: 1021 Million
80 60 40 20 0 20 40 60 80
Age
Population (million)
Female Male
15 -
60 y
ears
0
Male Female
18-6
2 Yr
s
80 60 40 20 20 40 60 80Population (Million)
Age
Pop: 1593 MillionYear: 2050
80 60 40 20 0 20 40 60 80
Age
Populat ion (mil l ion)
Female Male
15 -
60 y
ears
Male Female
18-6
2 Yr
s80 60 40 20 0 20 40 60 80
Population (Million)
Age
Population (Million)
358
555
849
1183
14491593
0
400
800
1200
1600
1950 1970 1990 2010 2030 2050
2.22%
2.15%
1.67%
1.02%
0.47%
Growth Rate
Labor Force (Million)
133
210
360
595
795915
0
200
400
600
800
1000
1950 1970 1990 2010 2030 2050
2.30%
2.74%
2.54%
1.46%
0.70%
Growth Rate

Indian Institute of Management, Ahmedabad, India
Drivers of Economic Growth Human Capital
⎯ High Labor Supply ⎯ Increasing Education ⎯ Migration (intra & inter county)
R&D⎯ Increasing Government/ Private Expenditure⎯ International Knowledge Flows ⎯ R&D Collaborations
Technology⎯ Infrastructures⎯ Learning, transfers, deployment
Behavioral Changes⎯ High Savings Rate⎯ Changing Lifestyles
Governance⎯ Institutions⎯ Laws⎯ Policies
Savings Rate
20.622.8
24.6
33.035.0
32
0
5
10
15
20
25
30
35
1980 1990 2000 2010 2020 2030
4037??

Indian Institute of Management, Ahmedabad, India
Base Scenario GDP
0
5
10
15
20
25
2005 2020 2035 2050
Bas
e Ye
ar 2
005=
1
Annual Growth Rate 2005-50: 7.3%Annual Growth Rate 2005-32: 8%
GDP
0
2000
4000
6000
8000
10000
12000
2000 2010 2020 2030 2040 2050
US
$/pe
rson
Per Capita Income
Base Case Assumptions: Summary1. GDP
• Ann. Growth Rate: 7.2% from 2005-50• 2050 Economy: 24 times larger than 2005
2. Population • 2000: 1021 Million• 2050: 1593 Million
3. 650 ppmv CO2e Concentration Stabilization (or 550 CO2)4. Radiative Forcing: 4.7 W/m2

Indian Institute of Management, Ahmedabad, India
Visions & Scenarios

Indian Institute of Management, Ahmedabad, India
Conventional Climate Centric Paradigm
Carbon Market
Technologies
Energy Resources
Universal Participation
Market Structure/ Rules
Allocation of Rights
Modify Preferences
Competition/ Trade
Energy-Mix Mandates
Tech Transfer
Cooperative R&D
Remove Market Barriers
TargetInterventionsDriversAim
Forecasting
Stabilization at Minimum GDP Loss
Global Greenhouse Gas
Concentration Stabilization

Indian Institute of Management, Ahmedabad, India
Sustainable Development&Climate Paradigm
Low Carbon Society
Innovations
Co-benefits
Sustainability
Technological
Social/Institutional
Management
Modify Preferences
Avoid Lock-ins
Long-term Vision
Win/Win OptionsShared Costs/Risks
Aligning Markets
National Socio-economic
Objectives and Targets
Global Climate Change
Objectives and Targets
TargetsInterventionsDriversAim
Back-casting
Indian Institute of Management, Ahmedabad, India
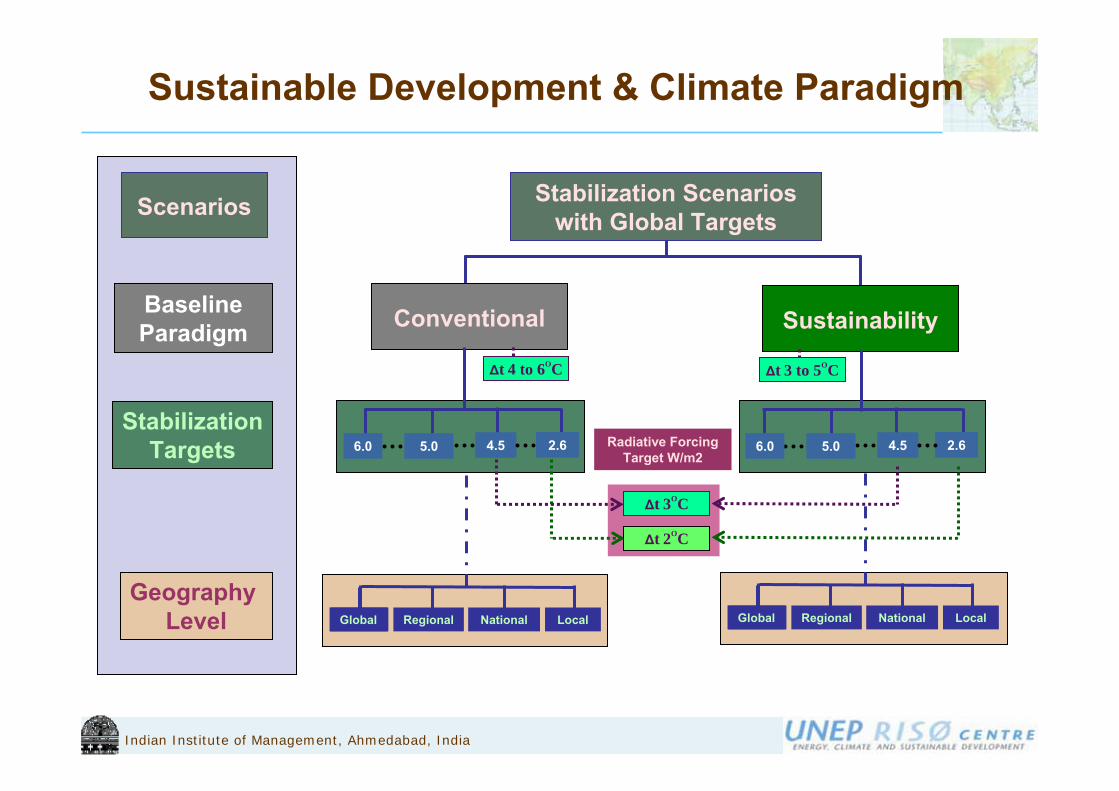
Sustainable Development & Climate Paradigm
Stabilization Scenarios with Global Targets
Baseline Paradigm
StabilizationTargets
Scenarios
Geography Level
2.66.0 5.0 Radiative Forcing Target W/m2
Global Regional National
4.5 2.66.0 5.0 4.5
Global Global Regional NationalGlobalLocal Local
Conventional Sustainability
Δt 4 to 6OC Δt 3 to 5OC
Δt 3OC
Δt 2OC

Indian Institute of Management, Ahmedabad, India
Modeling & Base Case Scenario

Indian Institute of Management, Ahmedabad, India
Integrated Modeling Framework
DATABASES-Socio-Economic, Technologies, Energy Resources, Environmental Constraints
AIM CGE Model
ANSWER-MARKALModel
AIM SNAPSHOT ModelEnd
Use
Dem
and
Mod
elA
IM Strategic D
atabase(SD
B)
Integrated Modelling FrameworkDATABASES
AIM SNAPSHOT ModelEnd
Use
Dem
and
Mod
elA
IM Strategic D
atabase(SD
B)
DATABASESSocio-Economic, Technologies, Energy Resources, Environment
AIM CGE/GCAM
ANSWER-MARKALModel
AIM ExSSEnd
Use
Dem
and
Mod
el
AIM
(SDB
)(Strategic D
atabase)

Indian Institute of Management, Ahmedabad, India
National Analysis: MARKAL & End Use Models
From 2005-2050:Annual Economic Growth: 7.2%Annual Population Growth: 0.9%
Absolute Growth in 2050 over 2005Economy 23 timesPopulation 1.56 times
0
500
1,000
1,500
2,000
2,500
3,000
3,500
2005 2010 2015 2020 2025 2030 2035 2040 2045 2050
Mto
e
Other RenewablesNuclearHydroGasOilCoalCommercial BiomassNon Com Biomass
Energy
Base Scenario: Growth of Economy and Population
Carbon Emissions
0
1,000
2,000
3,000
4,000
5,000
6,000
7,000
8,000
2000 2005 2010 2015 2020 2025 2030 2035 2040 2045 2050
Mill
ion
Ton
CO
2

Indian Institute of Management, Ahmedabad, India
2OC Stabilization Challenge

Indian Institute of Management, Ahmedabad, India
Global & National Analysis: GCAM & AIM/CGEBase Case Scenario: INDIA
0
1000
2000
3000
4000
5000
6000
2005 2020 2035 2050 2065 2080 2095
Mto
e
OilGas
Coal
Nuclear
Renewable
Unconventional oil
BaU
INDIA: Carbon Emissions
%
GDP Loss for India
0
1
2
3
4
5
6
7
8
2005 2020 2035 2050 2065 2080 2095
450 ppmv (2 deg C)
550 ppmv (3 deg C)
Electricity Production (in EJ) and CCS Share (in %)
5.543.190.710.00550 ppmv% share)
11.8310.675.720.00450 ppmvBiomass w/CCS
2.852.751.630.00550 ppmv(% share)
4.035.065.380.00450 ppmvGas w/CCS
29.0821.316.200.00550 ppmv(% share)
33.3836.2029.710.00450 ppmvCoal w/CCS
61.9139.5810.512.55550 ppmv
67.3543.8610.782.55450 ppmv
65.4343.1412.432.55BAU Total Electricity Production(in EJ)
2095206520352005Scenario

Indian Institute of Management, Ahmedabad, India
Mitigation Options: Conventional
0
2,000
4,000
6,000
8,000
2000 2010 2020 2030 2040 2050
Mill
ion
Ton
CO
2Other
CCS
Device EfficiencyNuclear
Renewable
Fossil Switch
Emissions (for 2O Target)
Baseline Emissions
Carbon Price ($) 20 87 136 20052
Conventional Approach: transition with conventional path and carbon price
• High Carbon Price• Climate Focused Technology Push• Top-down/Supply-side actions
Technology Co-operation Areas• Energy Efficiency• Wind/Solar/Biomass/Small Hydro• Nuclear/CCS

Indian Institute of Management, Ahmedabad, India
Mitigation Options: Sustainability
Sustainability Approach: aligning climate and sustainable development actions
• Low Carbon Price• Bottom-up/Demand-side actions• Behavioural change• Diverse Technology portfolio
Technology Co-operation Areas• Transport Infrastructure Technologies• 3R, Material Substitutes, Renewable Energy• Process Technologies• Urban Planning, Behavioral Changes
0
2,000
4,000
6,000
8,000
2000 2010 2020 2030 2040 2050
Mill
ion
Ton
CO
2
CCSTransport Reduced ConsumptionRecyclingMaterial SubstitutionsDevice Efficiency
Renewable Energy
Building
Fossil Switch
Emissions (for 2O Target)
Carbon Price ($) 15 55 100 11728

Indian Institute of Management, Ahmedabad, India
Co-benefits of Energy ChoicesCoCo--benefits of Southbenefits of South--Asia Asia
Integrated EnergyIntegrated Energy--Water MarketWater Market
Benefit (Saving) Cumulative from 2010 to 2030
$ Billion % GDP
Energy 60 Exa Joule 321 0.87
CO2 Equiv. 5.1 Billion Ton 28 0.08
SO2 50 Million Ton 10 0.03
Total 359 0.98
Spill-over Benefits / Co-Benefits
• More Water for Food Production (MDG1)
• 16 GW additional Hydropower (MDG1&7)
• Flood control (MDG1&7)
• Lower energy prices would enhance competitiveness of regional industries (MDG1)
¨
!.
!.
!.
!. !.
!.
!.!.!.!.
F
F
Ѻ
ѺѺ
India
China
Iran
Pakistan
Afghanistan
OmanMyanmar (Burma)
Thailand
Nepal
Turkmenistan
Saudi Arabia
Tajikistan
Yemen
Bangladesh
Sri Lanka
Bhutan
Uzbekistan
Somalia
United Arab Emirates
Qatar
Laos
Malaysia
Bahrain
IndonesiaMaldives
Pune
GayaKota
Guna
Gadag
Kochi
Patna
Delhi
Anand
Dadra
SuratOlpad
Kalol
Panvel
Hassan
Dispur
Ambala
Nangal
Kanpur
Jhansi
UjjainJhabua
Valsad
NadiadRajkot
SolapurGuhagarChiptun
Chennai
Nellore
Kolkata
Sangrur
Sonipat
AuraiyaGwalior
Chotila Bharuch
PalmanerChittoor
Kokinada
LudhianaBathinda
Bareilly
Vijaypur
Mahesana
Tutikorin
MangaloreBangalore
Vijaywada
Faridabad
Ratnagiri
Kayankulam
Coimbatore
Jagdishpuri
Shahjahanpur
Vishakhapattnam
Tiruchchirappalli
Herat
MultanQuetta
Khuzdar
Karachi
DelaramKandhar
South-ParsIranshaharBandar-e-Abbas
Legend Important PlacesExisting Gas Pipelines
Proposed Gas PipelinesExisting LNG terminalsProposed LNG terminalsExisting Gas Basin
Gas Pipelines under construction
Proposed Gas Basin¨

Indian Institute of Management, Ahmedabad, India
Implications for Primary Energy Mix
Energy Mix in 2050
0
400
800
1,200
1,600
Coal Oil Gas Nuclear Hydro Renewable
Prim
ary
Ene
rgy
Dem
and
(Mto
e) Base
LCS_CT
LCS_SS
Total Energy Demand (Mtoe)
Base 2825 LCS_CT 2945 LCS_SS 2207

Indian Institute of Management, Ahmedabad, India
Additional Renewable Energy
0
100
200
300
400
500
600
700
2020 2030 2040 2050
Incr
ease
ove
r B
ase
Cas
e (M
toe)
Hydro
Solar
Wind
Bio-energy
(in Sustainability Scenario over Base Case)

Indian Institute of Management, Ahmedabad, India
Primary Energy & Carbon Price
2OC Sustainability Scenario
Base Scenario0
50
100
150
200
250
2010 2020 2030 2040 2050
Pric
e (U
S $/
tCO
2)
2OC Conventional Mitigation Scenario
Carbon Price

Indian Institute of Management, Ahmedabad, India
Crucial Issues
Indian Institute of Management, Ahmedabad, India
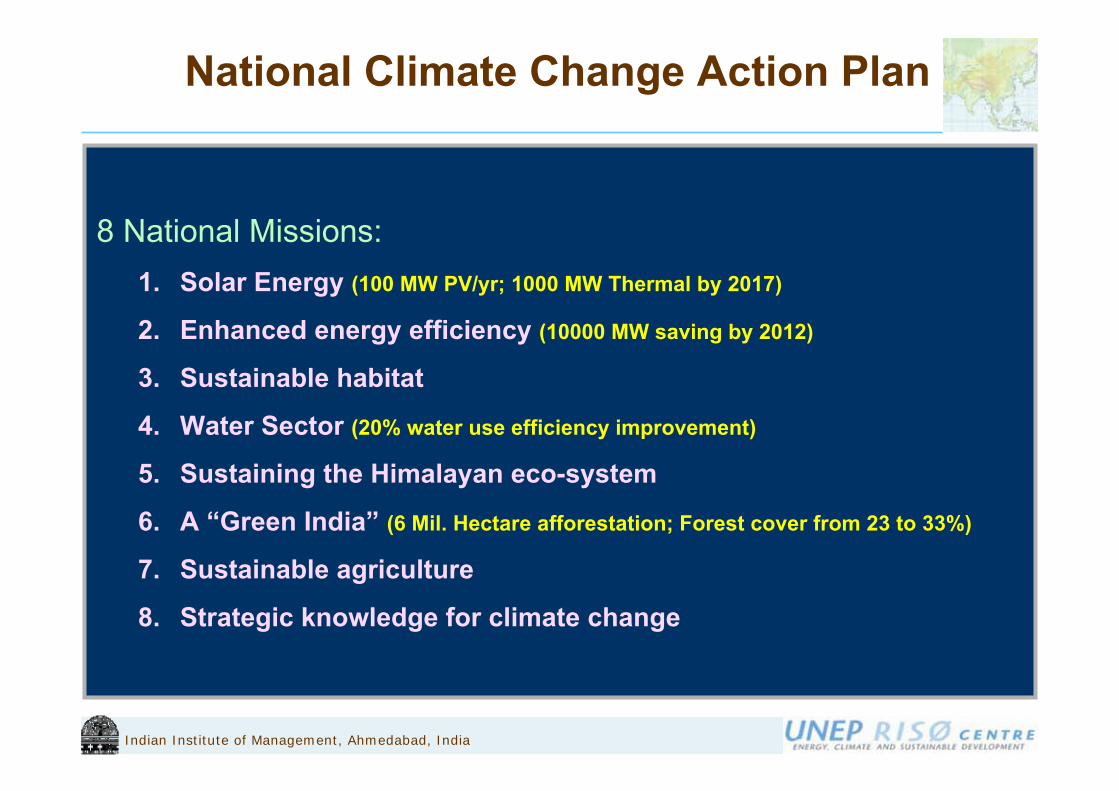
National Climate Change Action Plan
8 National Missions:1. Solar Energy (100 MW PV/yr; 1000 MW Thermal by 2017)
2. Enhanced energy efficiency (10000 MW saving by 2012)
3. Sustainable habitat
4. Water Sector (20% water use efficiency improvement)
5. Sustaining the Himalayan eco-system
6. A “Green India” (6 Mil. Hectare afforestation; Forest cover from 23 to 33%)
7. Sustainable agriculture
8. Strategic knowledge for climate change

Indian Institute of Management, Ahmedabad, India
Infrastructures to Overcome Lock-ins - 1
Gas Demand for Power Generation 2010-2030
10
30
50
70
90
2010 2015 2020 2025 2030B
cm
BaseCRCBW
Coal by Wire

Indian Institute of Management, Ahmedabad, India
Train Corridors • Sustainable modal shift
• Efficient logistics
• Infrastructures investments
• Associated development
Technologies for Train Corridors
Haryana Dadri
J.N.Port
Rajasthan
Maharashtra
GujaratMadhya Pradesh
Haryana
Uttar Pradesh
Infrastructures to Overcome Lock-ins - 2

Indian Institute of Management, Ahmedabad, India
AMC (Old
boundary)
AMC (New
boundary)
Sustainable Low Carbon CitiesAhmedabad (2009) Pop 5.5 Mil
Sectoral CO2 Emissions ( mt CO2)
0
10
20
30
40
50
60
70
2005 2035 BaU 2035 LCS
Mt C
O2
Freight TransportPassenger TransportIndustryCommercialResidential
0.02.04.06.08.0
10.012.014.016.0
Valu
e in
200
5 =
1
PassengerTransportDemand
Energy Demand GHG Emissions
2005 2035 BAU 2035 LCS
10.2
61.1
20.4
8.6
15.4
6.32.44.33.7
0
10
20
30
40
50
60
70
2005 2035 BaU 2035 LCS
GH
G E
mis
sion
s/re
duct
ions
(mt-
C02
)
Transport EfficiencyIndustry EfficiencyBuilding EfficiencyFuel Switch
Energy Service demand
Coal + CCS
Emissions
Mitigation Contributions
67%
Indian Institute of Management, Ahmedabad, India
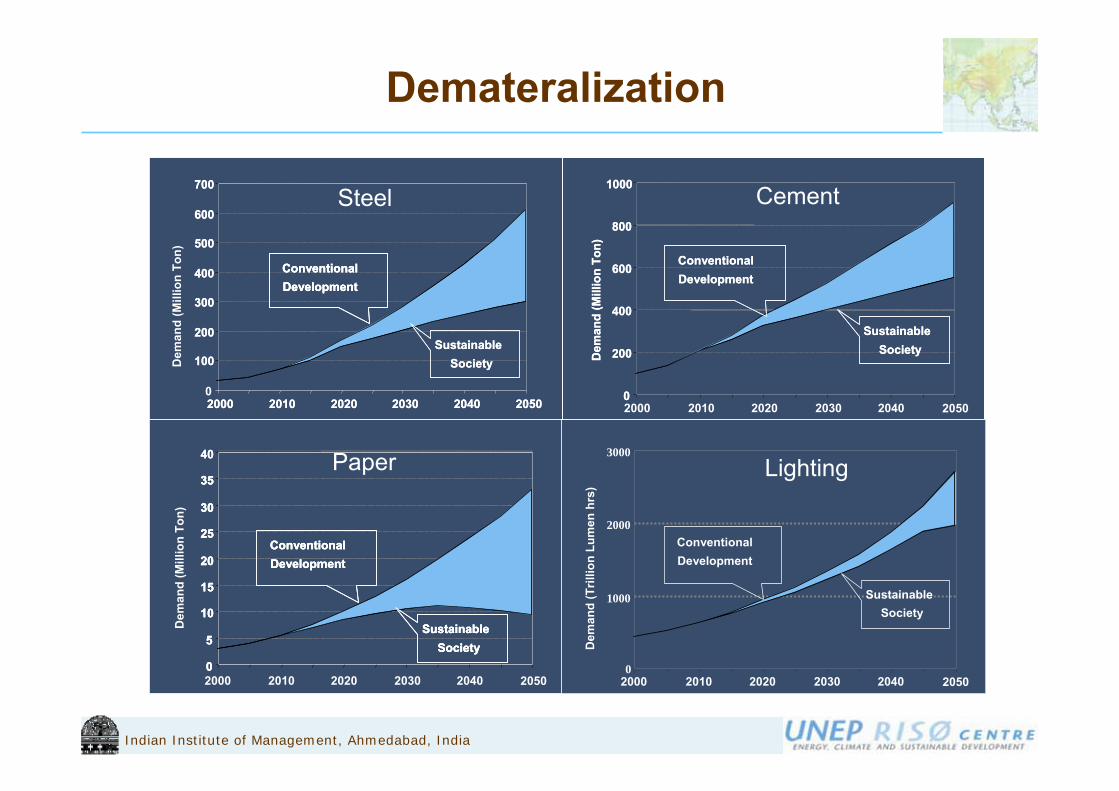
Demateralization
0
200
400
600
800
1000
Dem
and
(Mill
ion
Ton)
Conventional Development
Sustainable Society
0
200
400
600
800
1000
Dem
and
(Mill
ion
Ton)
Conventional Development
Sustainable Society
Cement
2000 2010 2020 2030 2040 20500
100
200
300
400
500
600
700
2000 2010 2020 2030 2040 2050
Dem
and
(Mill
ion
Ton)
Steel
Conventional Development
Sustainable SocietyD
eman
d (M
illio
n To
n)
0
100
200
300
400
500
600
700
2000 2010 2020 2030 2040 2050
Steel
Conventional Development
Sustainable Society100
200
300
400
500
600
700
2000 2010 2020 2030 2040 2050
Conventional DevelopmentConventional Development
Sustainable Society
0
5
10
15
20
25
30
35
40
Conventional Development
Sustainable Society
0
5
10
15
20
25
30
35
40
Conventional Development
Sustainable Society
0
5
10
15
20
25
30
35
Dem
and
(Mill
ion
Ton)
Conventional Development
Sustainable Society
2000 2010 2020 2030 2040 2050
Paper
Dem
and
(Tril
lion
Lum
en h
rs)
0
1000
2000
3000
Conventional Development
Sustainable Society
Lighting
2000 2010 2020 2030 2040 2050

Indian Institute of Management, Ahmedabad, India
Technologies
– Energy: Efficiency, Renewable, Nuclear
– Industrial Process: Cement, Steel, Paper
– Infrastructure: Transport, Pipelines, Electricity T&D, Hydro (+Canals)
– Soft Solutions: Communication
– Conservation/Behavioral: 3R, Material Substitutes
– Planning: Urban design, Industry locations
– End-of-pipe Solutions: CCS

Indian Institute of Management, Ahmedabad, India
Conclusions

Indian Institute of Management, Ahmedabad, India
US Secretary of State Hillary Clinton As told to CNN's Fareed Zakaria in an interview http://business.rediff.com/report/2009/aug/11/do-not-follow-us-growth-model-clinton-tells-india.htmhttp://edition.cnn.com/CNN/Programs/fareed.zakaria.gps/
"Although India and China have every right to choose their own path of development, they should not follow the American model in their Endeavour to improve the condition of their citizens, ….“
"Our argument to China and India is: Yes, you have a right to develop and we want you to develop, and in fact, we admire your commitment to eradicating poverty and we want to help you do that. But you can't do it the way we did it, because you will suffer consequences that will undermine your development" …
Developing Country Scenarios

Indian Institute of Management, Ahmedabad, India
Co-benefits & Technology ChoicesTechnologies delivers multiple dividends
• In developing countries, significant opportunities exist for gaining co-benefits
• Technology Assessment should consider all costs and benefits
“For developing countries, the ‘good news’ is that their environment and natural resources policies are often so bad that there are reforms which would be both good for the economy and good for the environment.”
Joseph Stiglitz

Indian Institute of Management, Ahmedabad, India
Conclusions
• Integration of Visions, Multiple Objectives and Targets
• Policies to align markets and deliver Co-benefits
• Incentives to induce Behavioral Changes
• Infrastructures to overcome long-term lock-ins
• Global Technology Cooperation Architecture
• Developing National Technology Industry
• Keeping along Long-term Development Vision
Indian Institute of Management, Ahmedabad, India
Thank You