Embed Size (px)
Citation preview
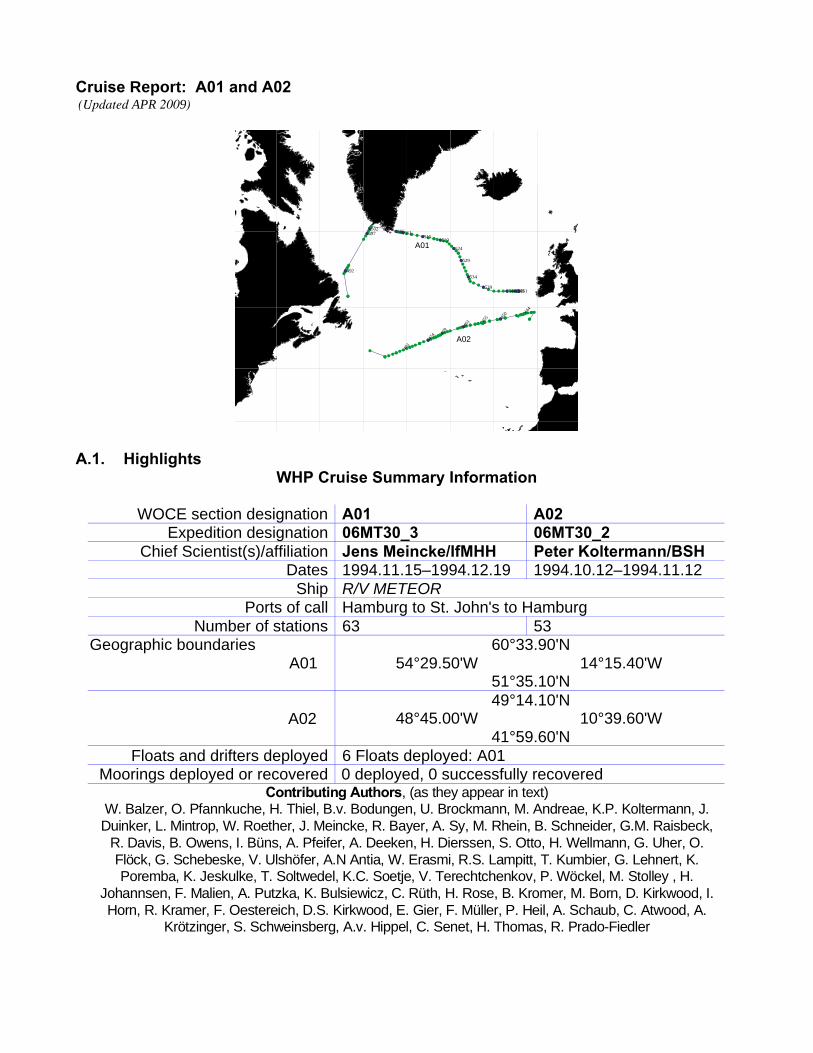
Cruise Report: A01 and A02
.492
.497.502 .506.511
.515.519
.524
.529
.534
.539.544.549.551
.444
.450
.455
.461
.469
.474
.481
A02
A01
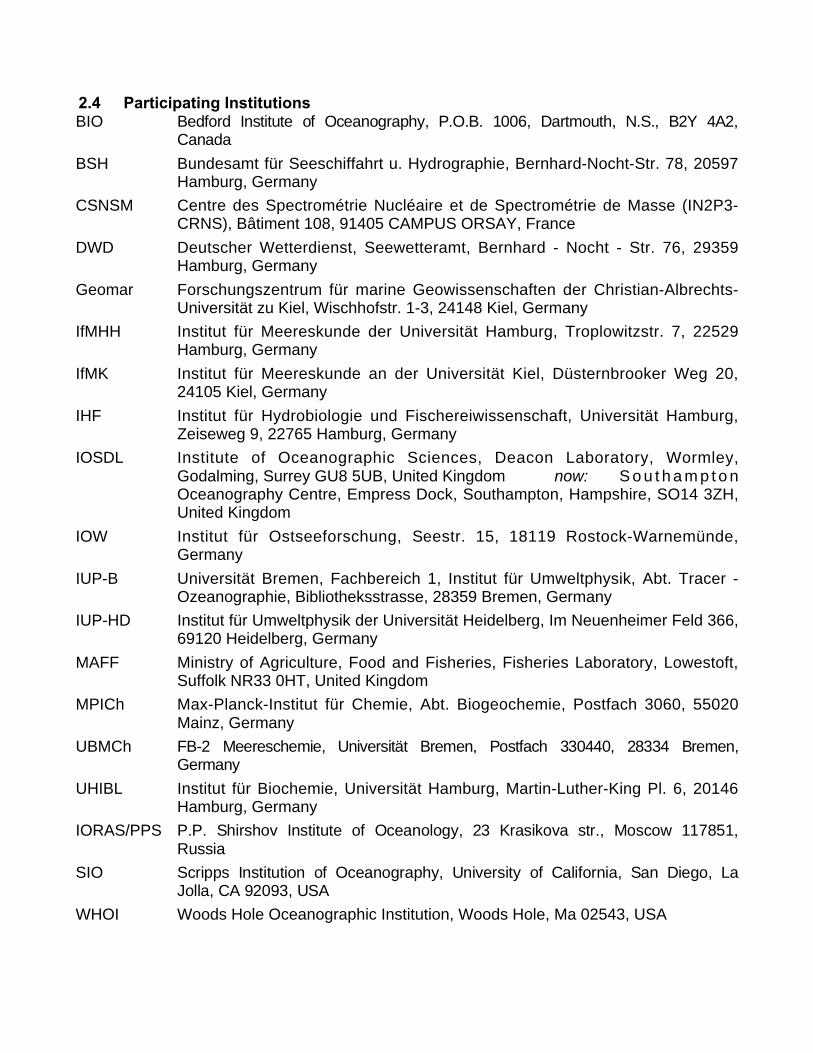
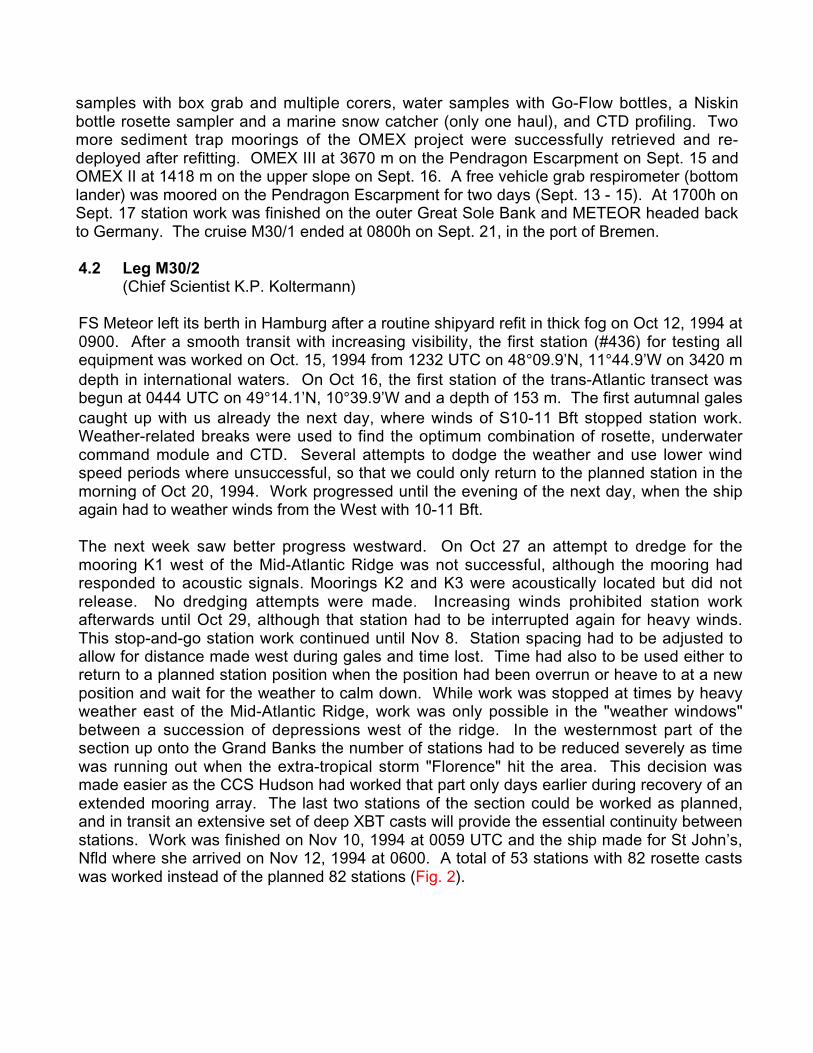
A.1. Highlights WHP Cruise Summary Information
WOCE section designation A01 A02Expedition designation 06MT30_3 06MT30_2
Chief Scientist(s)/affiliation Jens Meincke/IfMHH Peter Koltermann/BSHDates 1994.11.15–1994.12.19 1994.10.12–1994.11.12
Ship R/V METEORPorts of call Hamburg to St. John's to Hamburg
Number of stations 63 53Geographic boundaries
A0160°33.90'N
54°29.50'W 14°15.40'W 51°35.10'N
A0249°14.10'N
48°45.00'W 10°39.60'W 41°59.60'N
Floats and drifters deployed 6 Floats deployed: A01Moorings deployed or recovered 0 deployed, 0 successfully recovered
Contributing Authors, (as they appear in text)W. Balzer, O. Pfannkuche, H. Thiel, B.v. Bodungen, U. Brockmann, M. Andreae, K.P. Koltermann, J.Duinker, L. Mintrop, W. Roether, J. Meincke, R. Bayer, A. Sy, M. Rhein, B. Schneider, G.M. Raisbeck,
R. Davis, B. Owens, I. Büns, A. Pfeifer, A. Deeken, H. Dierssen, S. Otto, H. Wellmann, G. Uher, O.Flöck, G. Schebeske, V. Ulshöfer, A.N Antia, W. Erasmi, R.S. Lampitt, T. Kumbier, G. Lehnert, K.Poremba, K. Jeskulke, T. Soltwedel, K.C. Soetje, V. Terechtchenkov, P. Wöckel, M. Stolley , H.
Johannsen, F. Malien, A. Putzka, K. Bulsiewicz, C. Rüth, H. Rose, B. Kromer, M. Born, D. Kirkwood, I.Horn, R. Kramer, F. Oestereich, D.S. Kirkwood, E. Gier, F. Müller, P. Heil, A. Schaub, C. Atwood, A.
Krötzinger, S. Schweinsberg, A.v. Hippel, C. Senet, H. Thomas, R. Prado-Fiedler
(Updated APR 2009)
WHP Cruise and Data Information
Instructions: Click on headings below to locate primary reference or usenavigation tools above. (Shaded headings were not available whenthis report was assembled)
Cruise Summary Information A01 A02 Hydrographic Measurements A01 A02A01 A02 A01 A02
Description of scientific program A01 A02 CTD Data A01 A02A01 A02 CTD - general A01 A02
Geographic boundaries A01 A02 CTD - pressure A01 A02Cruise track (figures) PI WHPO CTD - temperature A01 A02Description of stations A01 A02 CTD - conductivity/salinity A01 A02Description of parameters A01 A02 CTD - dissolved oxygen A01 A02Bottle depth distributions (fig) A01 A02 A01 A02Floats and drifters deployed A01 A02 Bottle Data A01 A02Moorings deployed/recovered A01 A02 Salinity A01 A02
A01 A02 Oxygen A01 A02Principal Investigators A01 A02 Nutrients A01 A02Cruise Participants A01 A02 CFCs A01 A02
A01 A02 Helium A01 A02Problems/goals not achieved A01 A02 Tritium A01 A02Other incidents of note A01 A02 Radiocarbon A01 A02
A01 A02 CO2 system parameters A01 A02Underway Data Information A01 A02 Other parameters A01 A02
Navigation A01 A02 A01 A02Bathymetry A01 A02 DQE Reports A01 A02ADCP A01 A02 CTD A01 A02Thermosalinograph A01 A02 S/O2/nutrients A01 A02XBT and/or XCTD A01 A02 CFCs A01 A02Meteorological observations A01 A02 14C A01 A02Atmospheric chemistry data A01 A02 A01 A02
A01 A02 A01 A02Acknowledgments A01 A02 References: Criuse Report CFCs
Data Processing Notes A01 A02
80˚W
80˚W
70˚W
70˚W
60˚W
60˚W
50˚W
50˚W
40˚W
40˚W
30˚W
30˚W
20˚W
20˚W
10˚W
10˚W
0˚
0˚
0˚ 0˚
10˚N 10˚N
20˚N 20˚N
30˚N 30˚N
40˚N 40˚N
50˚N 50˚N
60˚N 60˚N
70˚N 70˚N
.492
.497.502 .506.511
.515.519
.524
.529
.534
.539.544.549.551
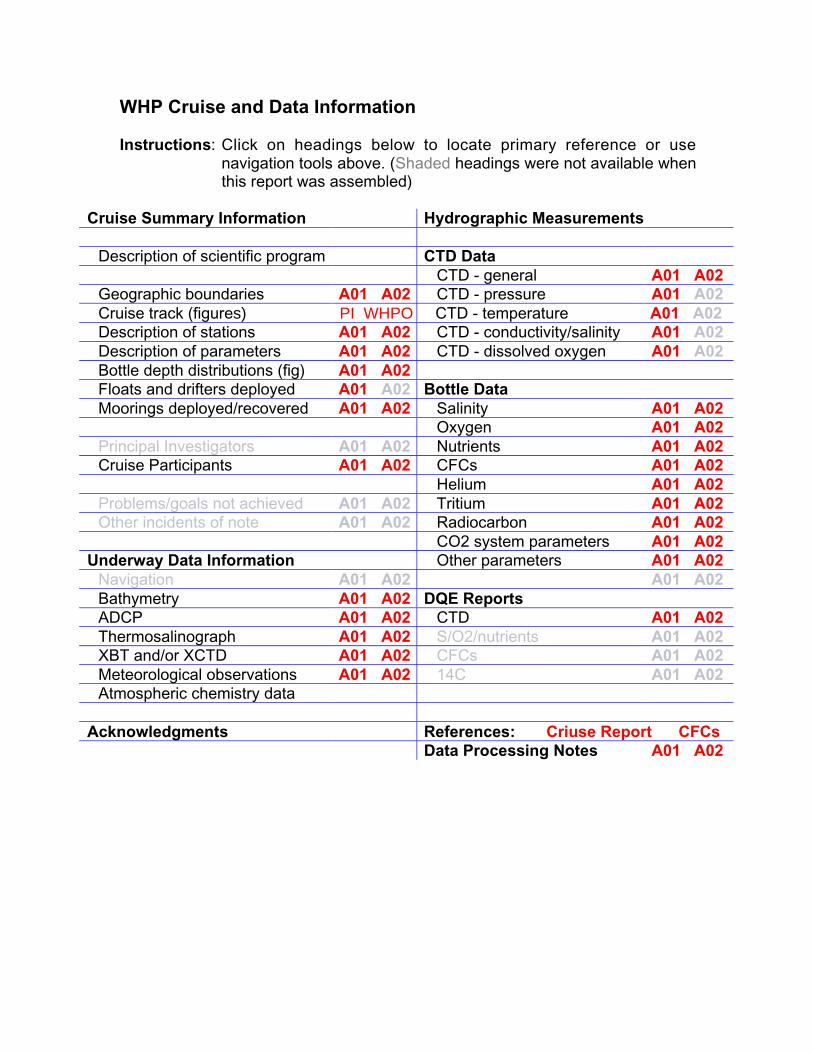
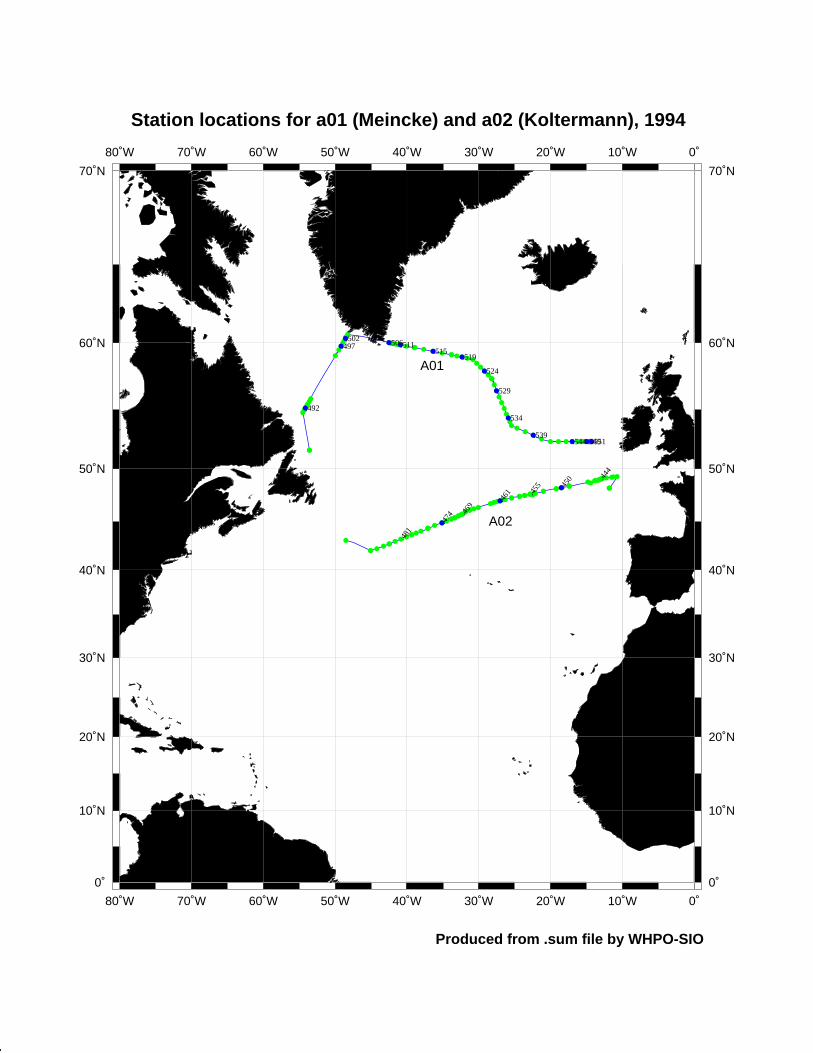
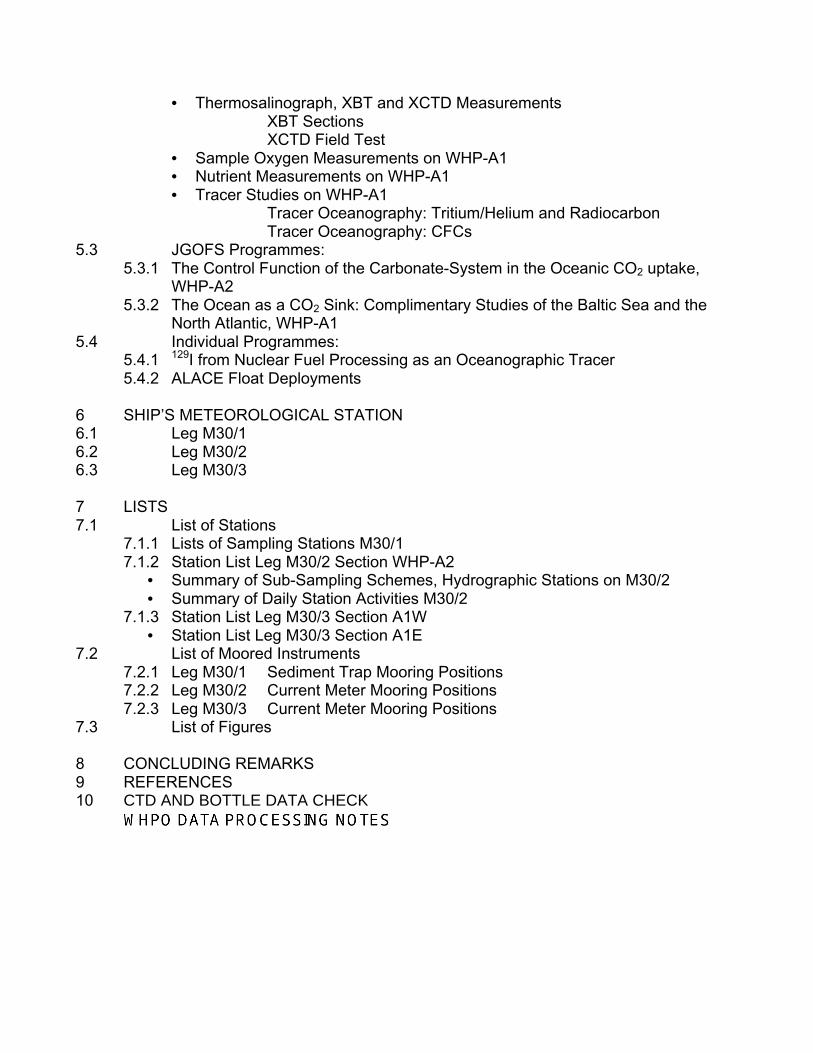
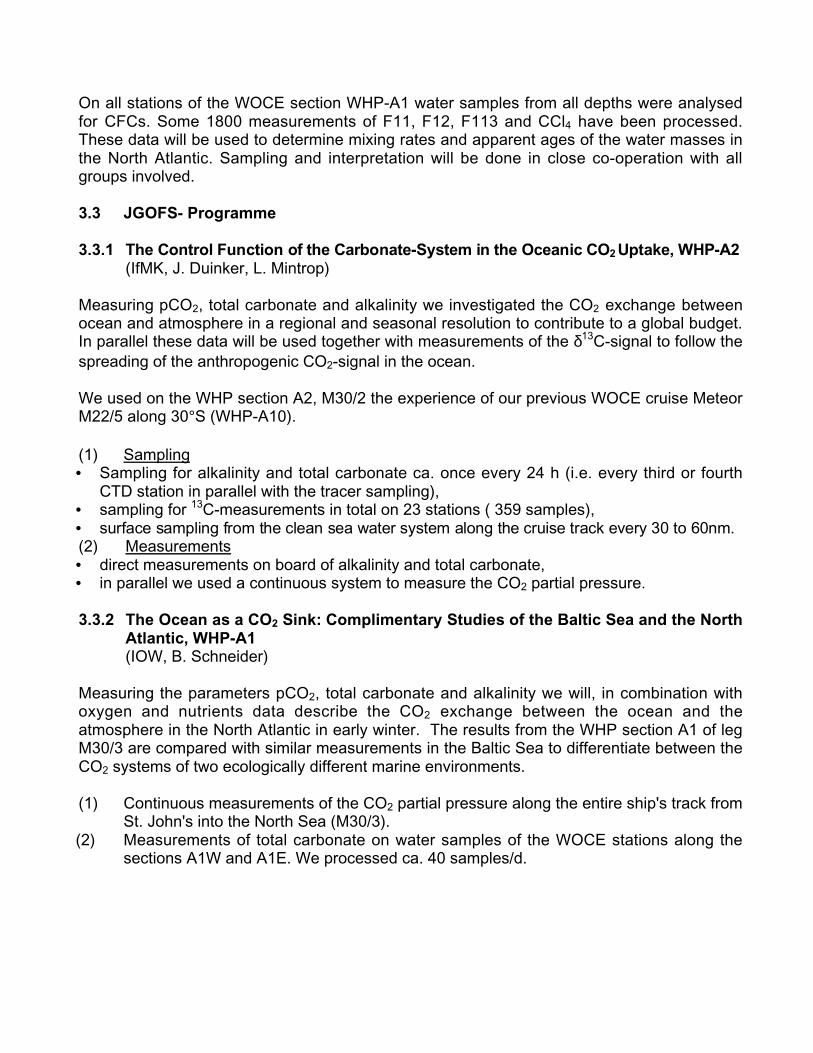
Station locations for a01 (Meincke) and a02 (Koltermann), 1994
.444
.450
.455
.461
.469
.474
.481
A02
A01
Produced from .sum file by WHPO-SIO
Meteor Cruise M30
JGOFS, OMEX and WOCEin the North Atlantic 1994
Cruise No 30
7 September - 22 December 1994
Las Palmas - Hamburg - St John’s - Hamburg
WHP Cruise and Data Information
Instructions: Click on items below to locate primary reference(s) or use navigationtools above.
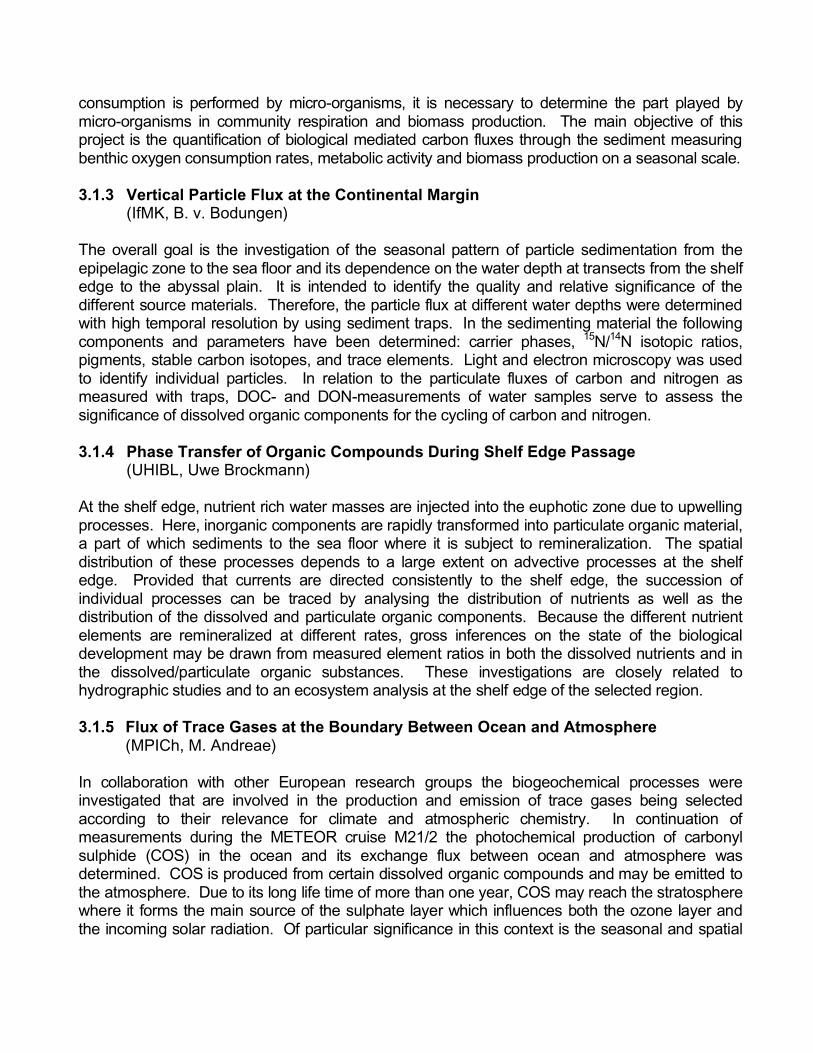
TABLE OF CONTENTS
ABSTRACTZUSAMMENFASSUNG
1 RESEARCH OBJECTIVESLeg M30/1: Las Palmas – HamburgOMEX Ocean Margin ExchangeLegs M30/2-3: Hamburg – St. John’s – HamburgWOCE World Ocean Circulation ExperimentJGOFS Joint Global Ocean Flux Study
2 PARTICIPANTS2.1 Leg M30/12.2 Leg M30/22.3 Leg M30/32.4 Participating Institutions
3 RESEARCH PROGRAMMES3.1 OMEX Programmes:
3.1.1 Organic Matter Degradation, Denitrification and Trace Metal Diagenesis3.1.2 Carbon Mineralization by the Benthic Community3.1.3 Vertical Particle Flux at the Continental Margin3.1.4 Phase Transfer of Organic Compounds During Shelf Edge Passage3.1.5 Flux of Trace Gases at the Boundary Between Ocean and Atmosphere
3.2 WOCE Programmes:3.2.1 Determination of the Meridional Transports of Heat, Salt and Freshwater at
48˚N in the North Atlantic along the WHP section A23.2.2 Nutrients Measurements for the Fine Resolution of Oceanic Water Masses on
the Meteor Cruise M30/2 (section WHP-A2) in the North Atlantic3.2.3 CFCs on the section WHP-A23.2.4 Mooring Recovery on sections WHP-A2 and WHP-A13.2.5 Tritium/Helium and 14C-Sampling along WHP-sections A2 and A13.2.6 WOCE North Atlantic Overturning Rate Determination
(WOCE-NORD, WHP section A1)3.2.7 CFCs on the section WHP-A1
3.3 JGOFS – Programmes:3.3.1 The Control Function of the Carbonate-System in the Oceanic CO2 uptake,
WHP-A2
3.3.2 The Ocean as a CO2 Sink: Complimentary Studies of the Baltic Sea and theNorth Atlantic, WHP-A1
3.4 Individual Projects3.4.1 129I from Nuclear Fuel Processing as an Oceanographic Tracer3.4.2 Profiling ALACE Floats to Determine the Development of the Stratification in the
Labrador Sea Over Two Years
4 NARRATIVE OF THE CRUISE4.1 Leg M30/1 (Chief Scientist-O. Pfannkuche)4.2 Leg M30/2 (Chief Scientist-K.P. Koltermann)4.3 Leg M30/3 (Chief Scientist-J. Meincke)
5 OPERATIONAL DETAILS AND PRELIMINARY RESULTS5.1 OMEX Programmes:
5.1.1 Biochemistry• Phase Transfer of Organic Compounds During Shelf Edge Passage• Organic Matter Degradation, Denitrification and Trace Metal Diagenesis• Dissolved Organic Carbon• Pore Water Chemistry• Benthis Denitrification and Bioirrigation
5.1.2 Air Chemistry• Exchange of Reduced Sulphur Compounds Between Ocean and
Atmosphere5.1.3 Sedimentology
• Particle Flux and in situ Marine Aggregate Studies at the Continental Margin• Particle Flux• Marine Snow Studies• CTD – work
5.1.4 Benthic Biology• Benthic Microbiology• Carbon Mineralization by the Benthic Community
5.2 WOCE Programmes:5.2.1 Physical and Chemical Oceanography on Leg M30/2
• Determination of the Meridional Transports of Heat, Salt and Freshwater at48˚N in the North Atlantic Along the WHP section A2
• Nutrients Measurements for Fine Resolution of Oceanic Water Masses onthe Meteor Cruise M30/2 (section WHP-A2) in the North Atlantic
• CFCs on the WHP section A2• Tritium/Helium and 14C-Sampling Along WHP-sections A2 and A1
5.2.2 Mooring Recovery on WHP-A2 and WHP-A15.2.3 Physical, Chemical and Tracer Oceanography on Leg M30/3
• Hydrographic Measurements on WHP-A1Nutrients Along WHP-A1
• Spreading of Newly Formed Labrador Sea Water
• Thermosalinograph, XBT and XCTD MeasurementsXBT SectionsXCTD Field Test
• Sample Oxygen Measurements on WHP-A1• Nutrient Measurements on WHP-A1• Tracer Studies on WHP-A1
Tracer Oceanography: Tritium/Helium and RadiocarbonTracer Oceanography: CFCs
5.3 JGOFS Programmes:5.3.1 The Control Function of the Carbonate-System in the Oceanic CO2 uptake,
WHP-A25.3.2 The Ocean as a CO2 Sink: Complimentary Studies of the Baltic Sea and the
North Atlantic, WHP-A15.4 Individual Programmes:
5.4.1 129I from Nuclear Fuel Processing as an Oceanographic Tracer5.4.2 ALACE Float Deployments
6 SHIP’S METEOROLOGICAL STATION6.1 Leg M30/16.2 Leg M30/26.3 Leg M30/3
7 LISTS7.1 List of Stations
7.1.1 Lists of Sampling Stations M30/17.1.2 Station List Leg M30/2 Section WHP-A2
• Summary of Sub-Sampling Schemes, Hydrographic Stations on M30/2• Summary of Daily Station Activities M30/2
7.1.3 Station List Leg M30/3 Section A1W• Station List Leg M30/3 Section A1E
7.2 List of Moored Instruments7.2.1 Leg M30/1 Sediment Trap Mooring Positions7.2.2 Leg M30/2 Current Meter Mooring Positions7.2.3 Leg M30/3 Current Meter Mooring Positions
7.3 List of Figures
8 CONCLUDING REMARKS9 REFERENCES10 CTD AND BOTTLE DATA CHECK
ABSTRACT
The Meteor Cruise M30 focused on the North Atlantic components of the global researchprogrammes Joint Ocean Flux Study JGOFS, the World Ocean Circulation Experiment WOCEand the European programme Ocean Margin EXchange OMEX.
On the first leg, the exchange processes between the oceanic continental margins and theopen ocean were addressed. A special emphasis has been put in this programme on theinterfaces sediment/ocean and ocean/atmosphere. The Celtic shelf edge was chosen as theregional focus for this multidisciplinary research work.
T he seco nd an d th ir d leg used th e un iqu e op p or tu n it y to de te r mine th e mo d if icat ion an dp ar titio ning of t he No rt h Atlan t ic wa te r ma sse s in a fu lly en closed re gio n be twe en 4 8 ° an d 61 ° N.T his pr o gr am m e is p a rt o f a lon g er -la st in g eff or t t o ob ser ve lo ng -t e rm ch an ge s of th e m er id io n alt ra nspo r ts of hea t, sa lt an d fr e sh -wa te r on time scales re le van t to clim a te cha n ge . Th e WO CEcom po ne n t of ca . 10 we eks fie ld - wo rk will be use d to de scr ib e in sp a ce th e qu asi-syn o pt ice vo lu tio n of th e hyd ro gr a ph ic situ at ion of the "o ve rt ur n in g cell" of the glob al t he rm oh a line cir cu la t io n in th e Nor th At la nt ic Oce an . Pr evio u s asse ssm en t s as pa rt of the WO CEHyd ro gr a ph ic Pr og ra m me WHP on th e se ction WHP- A1 E in 19 9 1 by FS Met e or , of AR7E in Sep te mb e r 19 9 2 with FS Valdivia (WO CE- NO RD) and of WHP- AR19 in sum m er 19 93 wit h FSG au ss alre ad y sho we d dra m at ic ch an ge s in wa t er ma ss pro p er tie s an d the de pt h of in divid ua lwat er ma ss la ye rs co mp ar e d to wo rk do ne dur ing th e In te r na tio na l Ge o ph ysica l Ye a r IG Y in1 95 7 an d oth e r in 19 62 an d 19 82 . Th e se cha n ge s in in te r me dia te and de ep wa te r masse sa ssocia t e dir ectly wit h the ann u al wint er se ct io n s wo rke d in th e La b ra do r Sea by Can a dian colle ag u es since 19 8 8 an d this new asse ssme n t pr o mise s to de scr ib e in mu ch gr ea t er de ta ilst he lin kag e bet we en lo ca l f or cin g an d t he la rg e- sca le r e actio n of t h e No r th Atla nt ic circula tion .
ZUSAMMENFASSUNG
Die Meteor - Reise 30 war den nordatlantischen Komponenten der globalenForschungsprogramme Joint Global Ocean Flux Study JGOFS und World Ocean CirculationExperiment WOCE und dem europäischen Programm Ocean Margin EXchange OMEX gewidmet.
Im ersten Fahrtabschnitt (M30/1) standen die Austauschprozesse zwischen den ozeanischenKontinentalrändern und dem offenen Ozean im Mittelpunkt. Dabei wurde ein besonderesGewicht auf die Grenzflächen Sediment/Wasser und Ozean/Atmosphäre gelegt. Alsregionaler Schwerpunkt für diese umfangreichen multidisziplinären Untersuchungen wurdeder keltische Schelfrand gewählt.
Der zweite und dritte Fahrtabschnitt (M30/2 und M30/3) boten die erstmalige Möglichkeit, dieModifikation der nordatlantischen Wassermassen und ihre daran beteiligten jeweiligen Anteile ineinem abgeschlossenen Gebiet zwischen 48°N und 61°N eindeutig zu bestimmen. Diese Arbeitenführen die Beobachtung der langzeitigen klimarelevanten Schwankungen von meridionalenWärme-, Salz- und Süßwassertransporten der letzten Jahre fort. Dabei gewährleistete das WOCE-Feldprogramm von ca. 10 Wochen erstmalig eine räumlich abgeschlossene quasi-synoptische
Erfassung des hydrographischen Zustandes der "overturning cell" der globalen thermohalinenZirkulation im Nordatlantik. Die bisherigen Aufnahmen im Rahmen des WOCE HydrographicProgramme WHP von WHP-A1E im Jahre 1991 mit FS "Meteor" bzw. von AR7E im September1992 mit FS "Valdivia" (WOCE-NORD) und WHP-AR19 im Sommer 1993 mit FS "Gauss" habenbereits drastische Veränderungen in den Eigenschaften der Wassermassen und der Tiefe derindividuellen Schichten der Wassermassen im Vergleich zu den früheren Aufnahmen während desInternationalen Geophysikalischen Jahr 1957 und in den Jahren 1962 und 1982 ergeben. Dieerneute Erfassung der intermediären und tiefen Zirkulation insbesondere im Zusammenhang mitden jährlichen winterlichen Aufnahmen der Labrador-See durch kanadische Kollegen seit 1988verbessert die Beschreibung der sich abzeichnenden Beziehung zwischen dem örtlichen "forcing"und der großräumigen Reaktion des nördlichen Atlantiks.
1 RESEARCH OBJECTIVES
Leg M30/1: Las Palmas – HamburgOMEX Ocean Margin Exchange
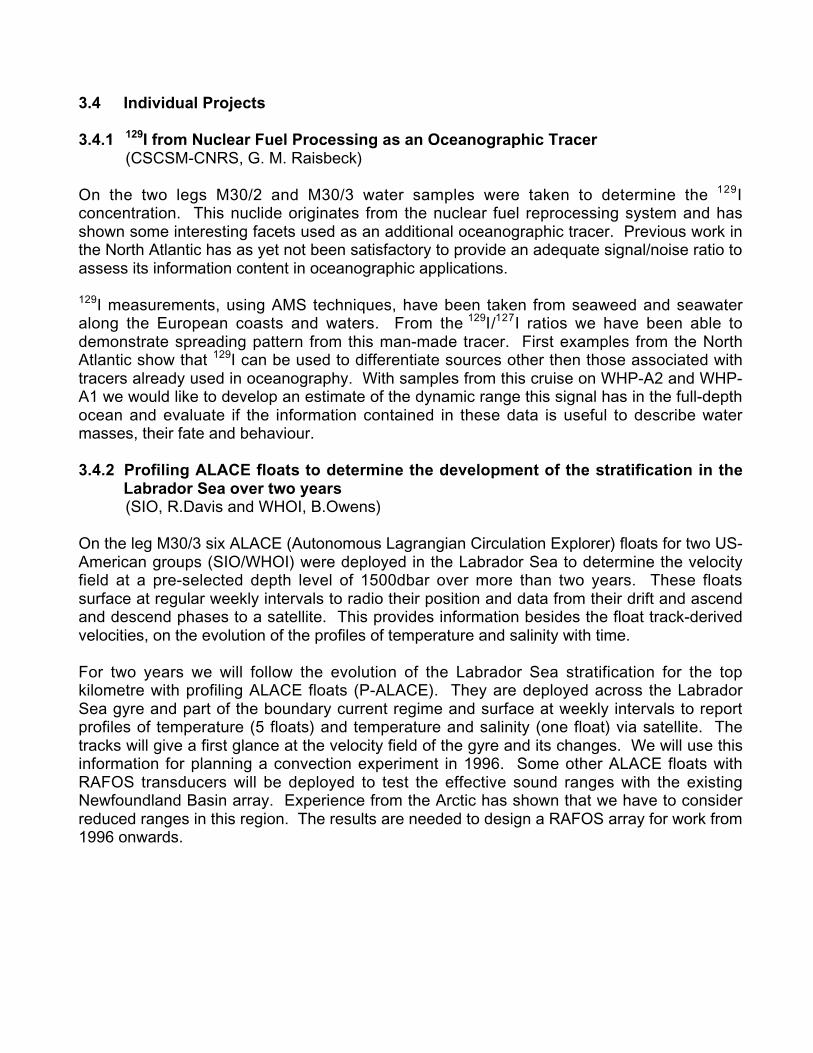
On the first leg of METEOR cruise 30 the exchange processes of carbon and "green house"gases between the western European shelf edge and the open ocean were studied within theframe of an interdisciplinary European Union Programme "Ocean Margin Exchange" (OMEX).Station work concentrated on a transect from the outer Celtic Sea (Great Sole Bank) acrossthe Goban Spur into the Porcupine Seabight covering a depth range from 220 m to 4800 m(Fig. 1). Special emphasis was put on the interfaces sediment/ocean and ocean/atmosphere.
Legs M30/2 and M30/3: Hamburg – St. John’s – HamburgWOCE World Ocean Circulation Experiment
This Germ an con tribut ion to the interna tional WOCE Progra mme as part of the World Clima teResearch Progra mme WCRP focused on the Northe rn Nor th Atlantic in lat e autu mn. Here we fin d sign ifican t chan ges in the water mass ch aracte ristics such as te mperat ure, salinit y and thecon tents of dissolved oxyge n caused by the highly variable mete orolog ical forcing on an nual andint erannu al tim e scales. These changes affect the contribution of th e Nort h Atla ntic to the globalthe rmohaline circulat ion in the form of the North Atlantic Deep Water and its sig nature s. It , in theend , will affect the mer idiona l tran sports of he at, sa linity and f reshwa ter.
For a hig hly re solved descr iption of th e wate r masses tha t are modified by these processesbesides measure ments of tem peratu re and salin ity, the con centra tions of dissolved oxyge ncon tent, nutrie nts an d a se quence of tr ansien t tracers su ch as CFCs, car bon 14C, helium 3He and4He and tr itium 3H was ana lysed from water samples. Using the chara cteristic in put fu nction s into the ocean , the releva nt mod ificat ion pr ocesse s and their region s will be be tter r esolve d.
Since the scientific programme for both cruise legs M30/2 and M30/3 is essentially identical and onlymost of the participating groups changed, for both legs a joint programme description is given below.
The German contributions to WOCE and JGOFS have been funded by the Federal Ministry forResearch and Technology (BMFT).

2 PARTICIPANTS
2.1 Leg M30/1
Name Speciality InstitutionPfa nnkuch e, Ola f, Dr. , Chie f Scie ntist Benthic Biology GEOMARAntia, Avan, Dr. Planktology IfMKBalzer, Wolfgang Prof. Dr. Marine Chemistry UBMChBassek, Dieter Weather Technician DWD/SWABehrens, Katrin Benthic Biology IHFBosse, Kai Benthic Biology IHFBüns, Ilse Biochemistry UHIBLDeeken, Aloys Marine Chemistry UBMChDierßen, Holger Marine Chemistry UBMChDölle, Martina Benthic Biology IHFErasmi, Wolfgang Hydrography IfMKFlöck, Otmar Biogeochemistry MPIChGötz, Sabine Benthic Biology IHFJeskulke, Karen Benthic Biology IfMKKahl, G. Meteorology DWD/SWAKumbier, Thomas Electronics IfMKLampitt, Richard Dr. Planktology IOSDLLehnert, Gerhard Planktology IOWNuppenau, Volker Electronics IHFOtto, Sabine Marine Chemistry UBMChPfeiffer, Alexander Biochemistry UHIBLPoremba, Knut, Dr. Benthic Biology IfMKSchebeske, Günther Biogeochemistry MPIChSoltwedel, Thomas Dr. Benthic Biology IHFUher, Günther Biogeochemistry MPIChUlshöver, Veit Biogeochemistry MPIChWellmann, Hartwig Marine Chemistry UBMChWitte, Ursula Dr. Benthic Biology IHF
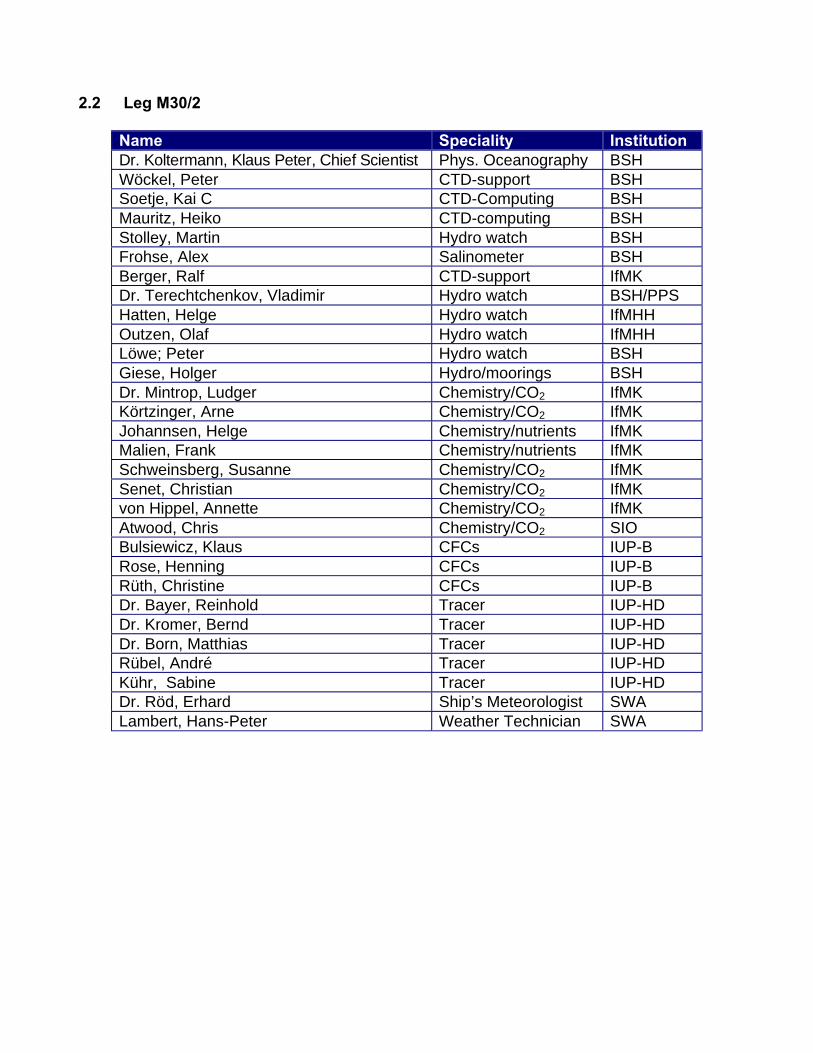
2.2 Leg M30/2
Name Speciality InstitutionDr. Kolte rmann, Klaus Peter , Chie f Scie ntist Phys. Oceanography BSHWöckel, Peter CTD-support BSHSoetje, Kai C CTD-Computing BSHMauritz, Heiko CTD-computing BSHStolley, Martin Hydro watch BSHFrohse, Alex Salinometer BSHBerger, Ralf CTD-support IfMKDr. Terechtchenkov, Vladimir Hydro watch BSH/PPSHatten, Helge Hydro watch IfMHHOutzen, Olaf Hydro watch IfMHHLöwe; Peter Hydro watch BSHGiese, Holger Hydro/moorings BSHDr. Mintrop, Ludger Chemistry/CO2 IfMKKörtzinger, Arne Chemistry/CO2 IfMKJohannsen, Helge Chemistry/nutrients IfMKMalien, Frank Chemistry/nutrients IfMKSchweinsberg, Susanne Chemistry/CO2 IfMKSenet, Christian Chemistry/CO2 IfMKvon Hippel, Annette Chemistry/CO2 IfMKAtwood, Chris Chemistry/CO2 SIOBulsiewicz, Klaus CFCs IUP-BRose, Henning CFCs IUP-BRüth, Christine CFCs IUP-BDr. Bayer, Reinhold Tracer IUP-HDDr. Kromer, Bernd Tracer IUP-HDDr. Born, Matthias Tracer IUP-HDRübel, André Tracer IUP-HDKühr, Sabine Tracer IUP-HDDr. Röd, Erhard Ship’s Meteorologist SWALambert, Hans-Peter Weather Technician SWA

2.3 Leg M30/3
Name Speciality InstitutionDr. Meincke, Jens, Chief Scientist Phys Oceanography IfMHHDr. Sy, Alexander Hydrography BSHBersch, Manfred Hydro watch IfMHHPaul, Uwe Hydro watch BSHDr. Lazier, John Hydro watch BIOGerdes, Jürgen Hydro watch IfMHHHaak, Helmuth Hydro watch IfMHHBock, Jan Hydro watch IfMHHDombrowski, Uwe CTD-support IfMKVerch, Norbert Salinometer IfMHHMauritz, Heiko CTD-computing BSHGottschalk, Ilse CTD-computing BSHKramer, Rita O2 BSHHorn, Ines O2 BSHOestereich, Frank O2/nutrients BSHKirkland, Donald Nutrients MAFFDr. Schneider, Bernd CO2 IOWThomas, Helmut CO2 IOWPrado-Fiedler, Ronaldo CO2 IOWDr. Bayer, Reinhold Tracer IUP-HDDr. Born, Matthias Tracer IUP-HDMüller, Franziska Tracer IUP-HDGier, Eva-Maria Tracer IUP-HDDr. Rhein, Monika CFCs IfMKHaie, Petra CFCs IfMKBadewien, Thomas CFCs IfMKDr Röd, Erhard Ship’s Meteorologist SWALambert, Hans-Peter Weather Technician SWA
2.4 Participating InstitutionsBIO Bedford Institute of Oceanography, P.O.B. 1006, Dartmouth, N.S., B2Y 4A2,
Canada
BSH Bundesamt für Seeschiffahrt u. Hydrographie, Bernhard-Nocht-Str. 78, 20597Hamburg, Germany
CSNSM Centre des Spectrométrie Nucléaire et de Spectrométrie de Masse (IN2P3-CRNS), Bâtiment 108, 91405 CAMPUS ORSAY, France
DWD Deutscher Wetterdienst, Seewetteramt, Bernhard - Nocht - Str. 76, 29359Hamburg, Germany
Geomar Forschungszentrum für marine Geowissenschaften der Christian-Albrechts-Universität zu Kiel, Wischhofstr. 1-3, 24148 Kiel, Germany
IfMHH Institut für Meereskunde der Universität Hamburg, Troplowitzstr. 7, 22529Hamburg, Germany
IfMK Institut für Meereskunde an der Universität Kiel, Düsternbrooker Weg 20,24105 Kiel, Germany
IHF Institut für Hydrobiologie und Fischereiwissenschaft, Universität Hamburg,Zeiseweg 9, 22765 Hamburg, Germany
IOSDL Institute of Oceanographic Sciences, Deacon Laboratory, Wormley,Godalming, Surrey GU8 5UB, United Kingdom now: S o u t h a m p t o nOceanography Centre, Empress Dock, Southampton, Hampshire, SO14 3ZH,United Kingdom
IOW Institut für Ostseeforschung, Seestr. 15, 18119 Rostock-Warnemünde,Germany
IUP-B Universität Bremen, Fachbereich 1, Institut für Umweltphysik, Abt. Tracer -Ozeanographie, Bibliotheksstrasse, 28359 Bremen, Germany
IUP-HD Institut für Umweltphysik der Universität Heidelberg, Im Neuenheimer Feld 366,69120 Heidelberg, Germany
MAFF Ministry of Agriculture, Food and Fisheries, Fisheries Laboratory, Lowestoft,Suffolk NR33 0HT, United Kingdom
MPICh Max-Planck-Institut für Chemie, Abt. Biogeochemie, Postfach 3060, 55020Mainz, Germany
UBMCh FB-2 Meereschemie, Universität Bremen, Postfach 330440, 28334 Bremen,Germany
UHIBL Institut für Biochemie, Universität Hamburg, Martin-Luther-King Pl. 6, 20146Hamburg, Germany
IORAS/PPS P.P. Sh irsho v Instit ut e of Ocea n olog y, 23 Kr asiko va str . , Mo sco w 11 7 85 1, Russia
SIO Scr ip ps In st itu tion of Ocea no gr a ph y, Un iver sit y of Ca lif or nia , Sa n Die go , LaJolla , CA 92 0 93 , USA
WHOI Woods Hole Oceanographic Institution, Woods Hole, Ma 02543, USA
3 RESEARCH PROGRAMMES
3.1 OMEX Programmes
The OMEX project is funded by the European Union within the frame-work of MAST II("Targeted Projects"). The various multinational and interdisciplinary programmes focus onthe exchange processes of carbon and a variety of gases - which occur to be relevant toclimatic changes - between European shelf areas, the adjacent continental margin and openocean. Special emphasis is paid on exchange processes at the sediment/water andocean/atmosphere interfaces. The Celtic Margin at the Goban Spur (Fig. 1), where leg M30/1took place, was chosen as a regional focus of the OMEX project for the time span 1993-1995.The cruise M30/1 was part of a series of cruises of various European research vesselsorganized to gain a seasonal coverage of the sampling stations on the Goban Spur Transect.It was intended to investigate a typical autumn situation for the different processes.
3.1.1 Organic Matter Degradation, Denitrification and Trace Metal Diagenesis(UBMCh, W. Balzer)
For the understanding of the major controls over release fluxes from margin sediments adetailed investigation of early diagenetic processes acting within the sediments is necessary.Therefore, extensive work on pore water chemistry and on solid sediment phases at transectsacross the continental margin was conducted. The integrated rate of organic matterremineralization in near-surface sediments will quantified by modelling the pore water profilesobtained during M27. In dependence on both the diagenetic redox milieu and the input terms,the benthic reactions and fluxes of selected trace metals were investigated to assess thesignificance of margin processes for the trace metal chemistry of the ocean. By analysing thetrace metal content in trapped particles, in suspended material, in sediments and in porewaters we will contribute to finding relationships between vertical/lateral sedimentation fluxes,benthic release fluxes and burial rates of chemically differing elements. A special study dealswith sedimentary denitrification in continental margin sediments.
3.1.2 Carbon Mineralization by the Benthic Community(GEOMAR, O. Pfannkuche; IHF, H. Thiel)
Rates of remineralization of organic carbon in the benthal are controlled by all transport processesin the water column. Parametrization of benthic processes is necessary to determine what portionof the sedimenting carbon is remineralized and what portion is accumulating in the sediments. Theunderstanding of the biological, chemical and physical processes involved and their quantitativedetermination is vital for balancing carbon fluxes in the sediment. For the assessment of the role ofbenthic organisms for carbon cycling it is necessary to determine benthic community respiration,biomass production and benthic activity. Present knowledge obtained from deep-sea investigationsof the temperate Atlantic Ocean suggests that benthic respiration, activity and biomass productionis subject to strong seasonal variations which correlate with carbon input by sedimentation. Thelargest part of benthic carbon removal is by organism respiration, its seasonal range being 80-90%.The determination of in-situ benthic oxygen respiration rates by use of "bottom landers" is thereforeof central significance for balancing the carbon fluxes. Since most of the biotic oxygen
consumption is performed by micro-organisms, it is necessary to determine the part played bymicro-organisms in community respiration and biomass production. The main objective of thisproject is the quantification of biological mediated carbon fluxes through the sediment measuringbenthic oxygen consumption rates, metabolic activity and biomass production on a seasonal scale.
3.1.3 Vertical Particle Flux at the Continental Margin(IfMK, B. v. Bodungen)
The overa ll goa l is the investiga tion of the season al pat tern of part icle sedimen tation from theepipelagic zone to th e sea floor and it s dependence on th e water dept h at tra nsects from the sh elfedg e to the abyssal plain. It is inten ded to ident ify th e quality an d rela tive significance of the dif ferent source mate rials. Ther efore, the particle flux at differen t wate r dept hs wer e dete rmined wit h high tempo ral re solution by using sedime nt tra ps. In the sed imenting mat erial the fo llowin gcom ponent s and parame ters have be en det ermine d: car rier phases, 15N/14N isotopic ratios,pig ments, stable carb on iso topes, and trace element s. Light an d electron microscopy wa s used to identify ind ividua l part icles. In relatio n to the par ticula te flu xes of carbo n and nitrog en asmea sured with traps, DOC- and DON-measu rement s of water samples serve to assess thesig nifica nce of disso lved o rganic compo nents for th e cycling of carbo n and nitrog en.
3.1.4 Phase Transfer of Organic Compounds During Shelf Edge Passage(UHIBL, Uwe Brockmann)
At the sh elf ed ge, nu trient rich water masses are injecte d into the eup hotic zone due to upwelling pro cesses. Her e, ino rganic compo nents are ra pidly transf ormed into particu late o rganic mater ial,a part of which sedim ents to the sea floor wh ere it is su bject to rem ineralizatio n. Th e spat ialdistribut ion of these proce sses depends to a large extent on advective proce sses at the shelfedg e. Pr ovided that curren ts are directed co nsiste ntly to the shelf edge, the su ccession ofind ividua l processes can be trace d by analysing the distr ibutio n of nutrien ts as well as thedistribut ion of the dissolved and particulate organ ic com ponent s. Be cause the differen t nutr ientele ments are rem ineralized at diff erent rates, gross infer ences on the state of th e biologicaldevelopme nt may be dr awn fr om mea sured elemen t ratios in both the dissolved nutrients and inthe disso lved/p articu late organic subst ances. These inve stigat ions are clo sely related tohyd rograp hic st udies and to an ecosyste m analysis a t the shelf edge o f the select ed reg ion.
3.1.5 Flux of Trace Gases at the Boundary Between Ocean and Atmosphere(MPICh, M. Andreae)
In collab oratio n with other Europ ean re search group s the bio geoche mical processes we reinvestiga ted th at are involved in the product ion an d emission of trace gase s bein g sele ctedaccording to th eir re levance for climat e and atmosp heric chemistry. In con tinuat ion of mea sureme nts du ring the MET EOR cr uise M21/2 the pho tochem ical product ion of carbo nylsulphide (COS) in the oce an and its exchang e flux betwe en oce an and atmosphere wasdet ermine d. COS is pr oduced from certain dissolved organic comp ounds and ma y be emitted tothe atmosphere. Due to its long life time of more than o ne yea r, COS may r each t he stratosph erewhe re it forms the ma in sou rce of the sulphat e laye r which influences both the ozone la yer an dthe incom ing so lar ra diatio n. Of particular signif icance in th is con text is the season al and spatial
var iability of the ocean as a sou rce of COS. Durin g M27/ 1 a ph otoche mical/ kinetic mode l wastested an d now improved tha t considers light depend ent pr oduction of COS, hydr olysis of COSand its e xchang e at t he oce an/atm ospher e inte rface as well as vertica l mixing in the ocean.
3.2 WOCE Programmes:
3.2.1 Determination of the Meridional Transports of Heat, Salt and Freshwater at 48˚Nin the North Atlantic along the WHP section A2(BSH, K.P. Koltermann)
The meridional transports of heat, freshwater and salt in the Atlantic Ocean and theirseasonal and interannual changes are determined for the 90s across the latitude of the globalmaximum freshwater transport at ca. 50°N in the Atlantic Ocean. These results are comparedwith previous measurements in the 50s and 80s. This "time series" is augmented withRussian data along 48°N that have been collected at quarterly intervals between 1975 and1987 down to a depth of 2000 m. This will result in a climatology of the changes in thesurface and intermediate layers and will improve the estimate of the seasonal cycle.Comparisons with results from eddy-resolving modelling efforts are separately pursued.
These estimates will provide the variance of these integral parameters, and finally lead to ahistory of their development since the IGY in 1957. This section elucidates the interaction ofthe thermohaline North Atlantic circulation with the wind-driven one at intermediate and greatdepths. Furthermore we expect a better formulation of the coupling between these changesand the changes in the "forcing fields", particularly the fluxes of latent and sensible heat,evaporation and precipitation E-P and wind stress from operational atmospheric models(ECMWF, NMC) at the surface. The WOCE-NORD project will in addition documentestimates of the temperature distribution and heat content at ca. 50°N for the top kilometre ontime scales of months from its VOS subprogramme to establish their seasonal cycle. In co-operation, we will attempt to complement the circulation estimates of the convective areanorth of 48°N with the estimates from this section.
Working this section in the summer of 1993 with FS Gauss has shown the Labrador SeaWater temperatures some 0.4°C below its historical characteristic temperature, and deeper inthe water column by some 700 m. This fits in with observations from the early 90s along 60°Nand 24°30'N and indicates a rapid reaction of the intermediate circulation of the northernNorth Atlantic to changes in the forcing in the Labrador Sea. We expect to get some firstestimates on how changes in the heat, salt and freshwater transports of the boundarycurrents of the North Atlantic continue into the ocean interior, and what likely impact this willhave on the coupled ocean-atmosphere system.
3.2.2 Nutrients Measurements for the Fine Resolution of Oceanic Water Masses on theMeteor Cruise M30/2 (section WHP-A2) in the North Atlantic(IfMK, J. Duinker, L. Mintrop)
The concentrations of nutrients PO4, NO3, NO2, NH4, Si(OH)4 from 1692 samples and thecontent of dissolved oxygen O2 from 1737 water samples have been determined on boardaccording to the WHP Standards. For quality assurance purposes additional samples weretaken as duplicates or replicates. All data were processed on board, subjected to detailedconsistency and quality checks and compared to existing data sets from this region. Anannotated data file was produced at the end of the cruise, containing all relevant informationand documentation on methodology and the quality of the data.
3.2.3 CFCs on the section WHP-A2(IUP-B, W. Roether)
O n all sta tio ns of the WO CE WHP se ct ion A2 wat er sa mp le s fro m all de pt hs we re an alyse d fo rCFCs. Som e 110 0 me a su re m en ts of F11 , F12 , F11 3 and CCl4 ha ve be en pr ocesse d . Th esed at a will be used t o d et e rm in e mixin g r at es an d a pp ar en t a ge s of th e wat e r ma sse s in th e No r th Atlan tic. Sa mp ling an d int er pr e ta tio n will be d o ne in clo se co -o pe r at io n wit h all g r ou ps in vo lve d.
For running the CFC analyses onboard
(1) 1062 samples for CFC have been collected and analysed for F11, F12, F113, CCl4. Allanalyses have been evaluated preliminarily at sea.
(2) In addition 77 3He-samples have been collected (classical method) for intercomparisons with the Heidelberg group.
All samples were collected with the standard rosette system. The CFC-samples were drawnon large glass syringes. During sampling, contamination with helium and CFCs was to beavoided or controlled. The sampling strategy on the section followed the WOCErecommendations. Except for shallower areas each station was sampled at up to 36 levels.The vertical resolution had a higher priority than the horizontal one for the case the throughputof the CFC-system was limited. The deep boundary currents, particularly in the western partof the section, were of special interest.
3.2.4 Mooring Recovery on sections WHP-A2 and WHP-A1(BSH, K.P. Koltermann and IfMHH, J. Meincke)
On the Gauss cruise 226 an array of three mooring was deployed west of the Mid-AtlanticRidge an section WHP-A2 in the summer of 1993 to measure the vertical and horizontalextend of a deep high salinity boundary current and its temporal changes. Previous attemptsto recover these mooring had failed as there seem to are problems with the acousticreleasers. On this cruise another attempt for recovery was planned, depending on theprevailing weather situation and time availability.
On WHP-A1 the mooring D2 wa s deployed to measure th e vert ical structu re of the de pthcon trolle d curr ent. Severa l atte mpts to reco ver th e moor ing acoustically had failed. On the legM30 /3 ano ther a ttempt to re cover the mo oring by dre dging was no t successful. Fur ther attempt sto dredge for o ther m ooring s on t his se ction had to be ab andone d for weathe r reasons.
3.2.5 Tritium/Helium and 14C-Sampling along WHP-sections A2 and A1(IUP-HD, R. Bayer)
The zonal section along 48°N (WHP-A2) was sampled for the first time for a detailed analysisof helium, tritium and 14C signals.
Com paring the 1972 GEOSECS data in the Nor thwest ern At lantic with the TT O/NAS data in198 0-81 has sho wn a promine nt invasion of the transient tracer signals from the surface into thedee p wate rs. An additional surve y of these tracer fields in 19 94 (WHP-A2) gives furthe rind icatio ns on how mu ch and how fast th is invasion has pr oceede d. Th is will help topar ameter ize th e rene wal ra tes fo r the individual deep ba sins. Clear horizontal gradie nts of hig her tr acer signals in th e West are seen. The de ep western boundar y curr ents with th e most recent an d youn gest waters are clearly eviden t, sho wing similar featu res as on th e A1 section sam pled in 1991 . A detaile d survey of these gradie nts along th e sect ions and the mer idiona lcon nectio n of t he tra cer signals in the Deep Wester n Boun dary Current s are of par ticula r inte rest.
On WHP-A2 474 helium and tritium samples have been collected. In addition 311 heliumsamples have been taken to test a sea-going extraction facility. Of the 51 stations sampled adenser coverage was attempted for the western boundary currents, but had to be aborted dueto bad weather but succeeded across the Mid Atlantic Ridge, with an even station distributionalong the rest of the section.
In parallel to the large volume 14C-sampling we sampled for AMS-14C-analyses. The largevolume samplers are used at the relevant stations in two casts: the shallow cast was followedby the CTD-rosette cast for small volume samples to give time for the 14C-extraction and thesubsequent preparation of the large volume samplers for the deep cast for 14C. Asexperienced in recent years in our polar work a complete 14C station was worked in about 5hours (ca. 20 LVS samples at 4000 m water depth). For the 48°N section 8 LVS stations with204 LVS samples and 60 samples for AMS-14C have been worked.
Sampling on WHP-A1 (West and East) followed for the Eastern part largely the 1991 strategyand results. Some 400 helium and tritium samples were analysed ashore. We used theseagoing extraction facility with great success. Similar to the sampling strategy on theprevious leg on A2, sampling focused on the basin boundaries with ca. 25 stations in total.We tried to resolve the temporal and seasonal variability of the tracer signatures in order tocompare them with existing data from the European Polar Seas and work done further southwithin the frame-work of WOCE. This also applies for the work in the Labrador Sea on A1West. Here we had planned ca. 100 samples for helium and tritium, and 3 stations for LVS-14C work but succeeded only in working 2 stations due to bad weather.
3.2.6 WOCE North Atlantic Overturning Rate Determination(WOCE-NORD, WHP section A1)(IfMHH, J. Meincke and BSH, A. Sy)
The meridional transports of heat and matter in the North Atlantic are quantified through a sectionconnecting Ireland and South Greenland. This section runs south of the region where theatmospheric forcing transforms the water advected to high latitudes such that it will sink tointermediate and greater depths and spreads further south, forming the source water masses of theNorth Atlantic Deep Water. This "overturning" process is regarded as the main driving mechanismfor the global thermohaline circulation. Quantifying both input and output in the North Atlanticoverturning system will help to improve modelling the role of the ocean in the climate system.
L eg M30 / 3 is pa rt of the WO CE-NO RD pr oject, ru nn ing ove r six ye ar s. To ext en d the da ta b asis ne ed ed to calculat e the t r an sp o rt r at e s in volve d in th e o ve rt u rn in g p ro ce ss, se ct io ns ha ve b ee n re p ea te d sea so n ally be twee n Ire lan d an d Sou t h Gr ee n la nd . A co m bina t io n of cu rr e nt m ea su re m en ts fr om th e sh ip in mo tion , lon g- t er m moo ring s of cur re nt me te r s an d sur fa cet op og ra p hies fr om altime t er dat a are be in g use d. This leg M3 0/ 3 wa s the th ir d rep ea t of th e WOCE hyd ro gr a ph ic se ct io n A1E/AR7E. Exte nd ing th is t im e the wo rk t o the we st er n p ar t A1Wt og et he r wit h t he wo rk o n A2 im p ro ve s t he t r an sp o rt e st ima te s u sing in ve r se modelling.
Along a section through the Labrador Sea Basin (A1W) from Hamilton Bank to SouthGreenland and continuing on a section from South Greenland to Ireland (A1E) we observedthe fields of the classical hydrographic parameters pressure, temperature, salinity, content ofdissolved oxygen and nutrients (NO3, NO2, PO4, SiO3). The work along A1E was, except forweather "gaps", an identical repeat of the work on Meteor cruise M18 (September 1991). Thework programme followed the strategy used during the previous leg M30/2 and all instrumentsand procedures were continued. Only for nutrients and oxygen work other groups joined inSt. John’s employing their own slightly modified procedures. All data, particular the CTD data,were processed on board, except for applying post-cruise laboratory calibrations to thepressure and temperature sensors.
3.2.7 CFCs on the section WHP-A1(IfMK, M. Rhein)
On the third leg of M30 we determined the tracer characteristics of the water masses thathave spilt over the ridge system between Greenland and Iceland (DSOW) and betweenIceland and the Shetlands (ISOW). After leaving the ridges these denser masses sink to thebottom and entrain ambient water masses. The extent of the mixing and the changes of thewater mass characteristics after leaving the ridges are also a focus of these investigations.The data will be used to improve the parameterisation of the Deep Water formation processnorth of the ridge system and to derive at better mean spreading velocities for individual watermass components. Other tracer and oceanographic data will be used as well. Besides theoverflow water masses we also sampled the newly formed deep water from the Labrador Sea,both at the exit of the Labrador Sea and along its spreading paths in the Irminger Sea and theNorth-Eastern Atlantic.
On all stations of the WOCE section WHP-A1 water samples from all depths were analysedfor CFCs. Some 1800 measurements of F11, F12, F113 and CCl4 have been processed.These data will be used to determine mixing rates and apparent ages of the water masses inthe North Atlantic. Sampling and interpretation will be done in close co-operation with allgroups involved.
3.3 JGOFS- Programme
3.3.1 The Control Fun ction of the Carbo nate-System in the Ocean ic CO2 Upt ake, WHP-A2(IfMK, J. Duinker, L. Mintrop)
Measuring pCO2, total carbonate and alkalinity we investigated the CO2 exchange betweenocean and atmosphere in a regional and seasonal resolution to contribute to a global budget.In parallel these data will be used together with measurements of the δ13C-signal to follow thespreading of the anthropogenic CO2-signal in the ocean.
We used on the WHP section A2, M30/2 the experience of our previous WOCE cruise MeteorM22/5 along 30°S (WHP-A10).
(1) Sampling• Sampling for alkalinity and total carbonate ca. once every 24 h (i.e. every third or fourth
CTD station in parallel with the tracer sampling),• sampling for 13C-measurements in total on 23 stations ( 359 samples),• sur fa ce sa mp lin g fr o m th e cle an se a wat er syst em alon g the cr uise t r ack eve ry 3 0 t o 60n m. (2) Measurements• direct measurements on board of alkalinity and total carbonate,• in parallel we used a continuous system to measure the CO2 partial pressure.
3.3.2 The Ocean as a CO2 Sink: Complimentary Studies of the Baltic Sea and the NorthAtlantic, WHP-A1(IOW, B. Schneider)
Measuring the parameters pCO2, total carbonate and alkalinity we will, in combination withoxygen and nutrients data describe the CO2 exchange between the ocean and theatmosphere in the North Atlantic in early winter. The results from the WHP section A1 of legM30/3 are compared with similar measurements in the Baltic Sea to differentiate between theCO2 systems of two ecologically different marine environments.
(1) Continuous measurements of the CO2 partial pressure along the entire ship's track fromSt. John's into the North Sea (M30/3).
(2) Measurements of total carbonate on water samples of the WOCE stations along thesections A1W and A1E. We processed ca. 40 samples/d.
3.4 Individual Projects
3.4.1 129I from Nuclear Fuel Processing as an Oceanographic Tracer(CSCSM-CNRS, G. M. Raisbeck)
On the two legs M30/2 and M30/3 water samples were taken to determine the 129Iconcentration. This nuclide originates from the nuclear fuel reprocessing system and hasshown some interesting facets used as an additional oceanographic tracer. Previous work inthe North Atlantic has as yet not been satisfactory to provide an adequate signal/noise ratio toassess its information content in oceanographic applications.
129I measurements, using AMS techniques, have been taken from seaweed and seawateralong the European coasts and waters. From the 129I/127I ratios we have been able todemonstrate spreading pattern from this man-made tracer. First examples from the NorthAtlantic show that 129I can be used to differentiate sources other then those associated withtracers already used in oceanography. With samples from this cruise on WHP-A2 and WHP-A1 we would like to develop an estimate of the dynamic range this signal has in the full-depthocean and evaluate if the information contained in these data is useful to describe watermasses, their fate and behaviour.
3.4.2 Profiling ALACE floats to determine the development of the stratification in theLabrador Sea over two years(SIO, R.Davis and WHOI, B.Owens)
On the leg M30/3 six ALACE (Autonomous Lagrangian Circulation Explorer) floats for two US-American groups (SIO/WHOI) were deployed in the Labrador Sea to determine the velocityfield at a pre-selected depth level of 1500dbar over more than two years. These floatssurface at regular weekly intervals to radio their position and data from their drift and ascendand descend phases to a satellite. This provides information besides the float track-derivedvelocities, on the evolution of the profiles of temperature and salinity with time.
For two years we will follow the evolution of the Labrador Sea stratification for the topkilometre with profiling ALACE floats (P-ALACE). They are deployed across the LabradorSea gyre and part of the boundary current regime and surface at weekly intervals to reportprofiles of temperature (5 floats) and temperature and salinity (one float) via satellite. Thetracks will give a first glance at the velocity field of the gyre and its changes. We will use thisinformation for planning a convection experiment in 1996. Some other ALACE floats withRAFOS transducers will be deployed to test the effective sound ranges with the existingNewfoundland Basin array. Experience from the Arctic has shown that we have to considerreduced ranges in this region. The results are needed to design a RAFOS array for work from1996 onwards.
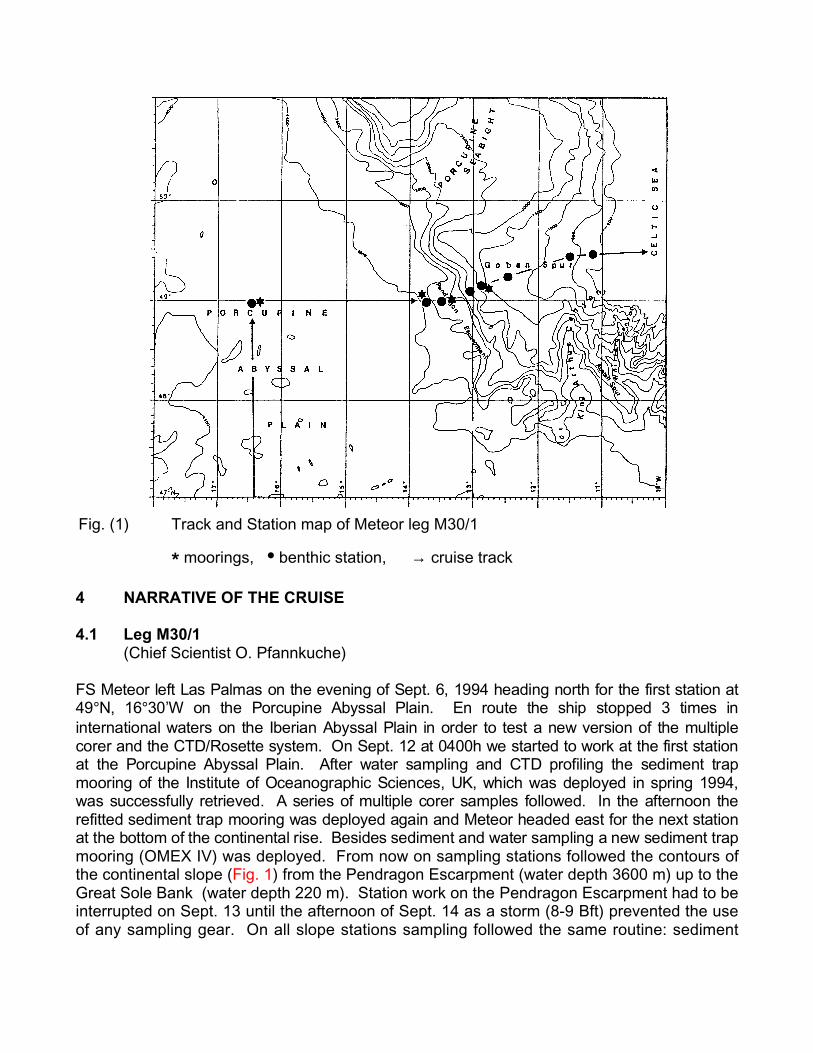
Fig. (1) Track and Station map of Meteor leg M30/1
* moorings, • benthic station, → cruise track
4 NARRATIVE OF THE CRUISE
4.1 Leg M30/1(Chief Scientist O. Pfannkuche)
FS Mete or le ft Las Palm as on th e eve nin g of Sep t. 6, 19 94 he ading no rth fo r the first stat io n at49 °N, 16°30 ’W on th e Por cup in e Abyssa l Plain. En rou te the ship st op ped 3 times in in te rna tio na l wate rs on th e Ibe ria n Abyssa l Pla in in or der to test a ne w ver sio n of the mu lt ipleco re r and th e CTD/ Ro set te syste m. O n Sept . 12 at 04 00h we star ted to work at the first st at ion at the Por cu pin e Abyssa l Pla in. Aft er wat er sa mplin g and CT D prof iling th e sed ime nt tr apmo or ing of the Institut e of Oce ano gr aph ic Scien ces, UK, wh ich was de plo yed in spring 19 94, wa s successf ully ret rie ved . A ser ie s of multip le co rer sa mp les fo llowe d. In the af ter noo n the re fitte d sed ime nt tr ap moo ring was deploye d aga in an d Mete or he ade d east for th e next stat io nat t he bot to m o f t he co ntine nta l r ise. Be sides se dimen t a nd wa ter samp lin g a n ew se dim ent t rap mooring (OMEX IV) was deployed. From now on sampling stations followed the contours ofthe continental slope (Fig. 1) from the Pendragon Escarpment (water depth 3600 m) up to theGreat Sole Bank (water depth 220 m). Station work on the Pendragon Escarpment had to beinterrupted on Sept. 13 until the afternoon of Sept. 14 as a storm (8-9 Bft) prevented the useof any sampling gear. On all slope stations sampling followed the same routine: sediment
samples with box grab and multiple corers, water samples with Go-Flow bottles, a Niskinbottle rosette sampler and a marine snow catcher (only one haul), and CTD profiling. Twomore sediment trap moorings of the OMEX project were successfully retrieved and re-deployed after refitting. OMEX III at 3670 m on the Pendragon Escarpment on Sept. 15 andOMEX II at 1418 m on the upper slope on Sept. 16. A free vehicle grab respirometer (bottomlander) was moored on the Pendragon Escarpment for two days (Sept. 13 - 15). At 1700h onSept. 17 station work was finished on the outer Great Sole Bank and METEOR headed backto Germany. The cruise M30/1 ended at 0800h on Sept. 21, in the port of Bremen.
4.2 Leg M30/2(Chief Scientist K.P. Koltermann)
FS Meteor left its berth in Hamburg after a routine shipyard refit in thick fog on Oct 12, 1994 at0900. After a smooth transit with increasing visibility, the first station (#436) for testing allequipment was worked on Oct. 15, 1994 from 1232 UTC on 48°09.9’N, 11°44.9’W on 3420 mdepth in international waters. On Oct 16, the first station of the trans-Atlantic transect wasbegun at 0444 UTC on 49°14.1’N, 10°39.9’W and a depth of 153 m. The first autumnal galescaught up with us already the next day, where winds of S10-11 Bft stopped station work.Weather-related breaks were used to find the optimum combination of rosette, underwatercommand module and CTD. Several attempts to dodge the weather and use lower windspeed periods where unsuccessful, so that we could only return to the planned station in themorning of Oct 20, 1994. Work progressed until the evening of the next day, when the shipagain had to weather winds from the West with 10-11 Bft.
The next week saw better progress westward. On Oct 27 an attempt to dredge for themooring K1 west of the Mid-Atlantic Ridge was not successful, although the mooring hadresponded to acoustic signals. Moorings K2 and K3 were acoustically located but did notrelease. No dredging attempts were made. Increasing winds prohibited station workafterwards until Oct 29, although that station had to be interrupted again for heavy winds.This stop-and-go station work continued until Nov 8. Station spacing had to be adjusted toallow for distance made west during gales and time lost. Time had also to be used either toreturn to a planned station position when the position had been overrun or heave to at a newposition and wait for the weather to calm down. While work was stopped at times by heavyweather east of the Mid-Atlantic Ridge, work was only possible in the "weather windows"between a succession of depressions west of the ridge. In the westernmost part of thesection up onto the Grand Banks the number of stations had to be reduced severely as timewas running out when the extra-tropical storm "Florence" hit the area. This decision wasmade easier as the CCS Hudson had worked that part only days earlier during recovery of anextended mooring array. The last two stations of the section could be worked as planned,and in transit an extensive set of deep XBT casts will provide the essential continuity betweenstations. Work was finished on Nov 10, 1994 at 0059 UTC and the ship made for St John’s,Nfld where she arrived on Nov 12, 1994 at 0600. A total of 53 stations with 82 rosette castswas worked instead of the planned 82 stations (Fig. 2).
Fig. (2) Track and station maps of Meteor legs M30/2 (WHP-A2) and M30/3 (WHP-A1).Top panel: hydrographic stations and numbers, bottom: XBT stations andnumbers
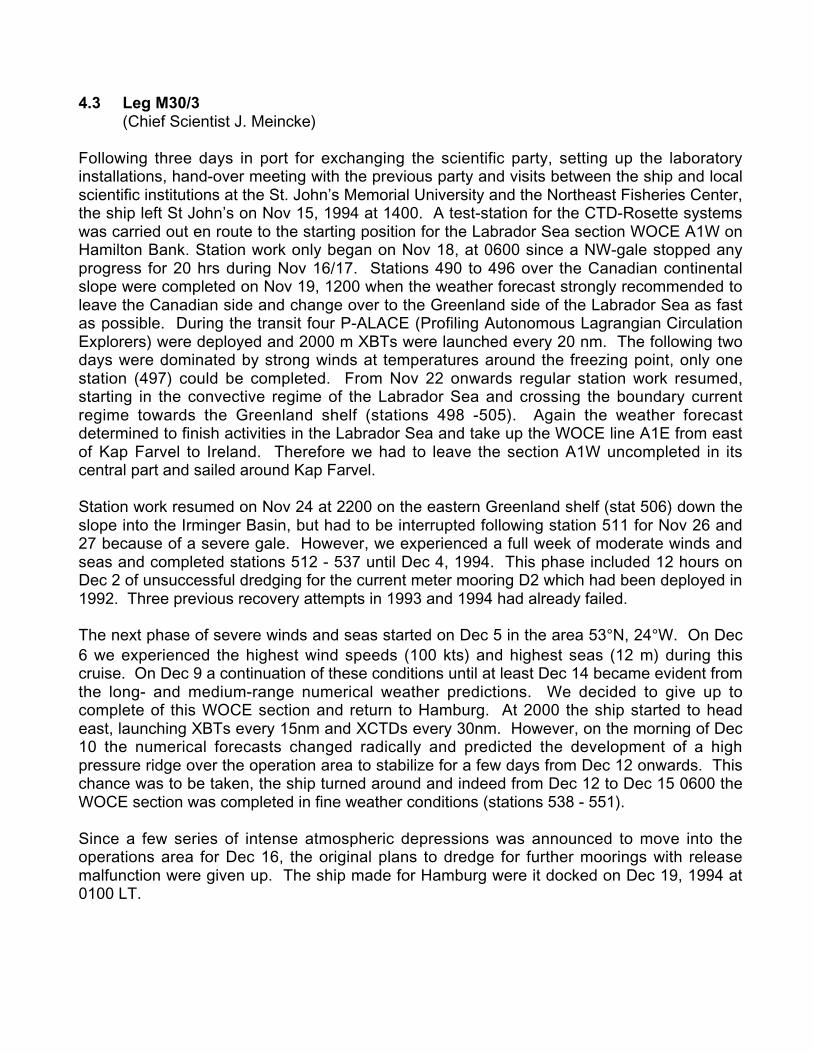
4.3 Leg M30/3(Chief Scientist J. Meincke)
Following three days in port for exchanging the scientific party, setting up the laboratoryinstallations, hand-over meeting with the previous party and visits between the ship and localscientific institutions at the St. John’s Memorial University and the Northeast Fisheries Center,the ship left St John’s on Nov 15, 1994 at 1400. A test-station for the CTD-Rosette systemswas carried out en route to the starting position for the Labrador Sea section WOCE A1W onHamilton Bank. Station work only began on Nov 18, at 0600 since a NW-gale stopped anyprogress for 20 hrs during Nov 16/17. Stations 490 to 496 over the Canadian continentalslope were completed on Nov 19, 1200 when the weather forecast strongly recommended toleave the Canadian side and change over to the Greenland side of the Labrador Sea as fastas possible. During the transit four P-ALACE (Profiling Autonomous Lagrangian CirculationExplorers) were deployed and 2000 m XBTs were launched every 20 nm. The following twodays were dominated by strong winds at temperatures around the freezing point, only onestation (497) could be completed. From Nov 22 onwards regular station work resumed,starting in the convective regime of the Labrador Sea and crossing the boundary currentregime towards the Greenland shelf (stations 498 -505). Again the weather forecastdetermined to finish activities in the Labrador Sea and take up the WOCE line A1E from eastof Kap Farvel to Ireland. Therefore we had to leave the section A1W uncompleted in itscentral part and sailed around Kap Farvel.
Station work resumed on Nov 24 at 2200 on the eastern Greenland shelf (stat 506) down theslope into the Irminger Basin, but had to be interrupted following station 511 for Nov 26 and27 because of a severe gale. However, we experienced a full week of moderate winds andseas and completed stations 512 - 537 until Dec 4, 1994. This phase included 12 hours onDec 2 of unsuccessful dredging for the current meter mooring D2 which had been deployed in1992. Three previous recovery attempts in 1993 and 1994 had already failed.
The next phase of severe winds and seas started on Dec 5 in the area 53°N, 24°W. On Dec6 we experienced the highest wind speeds (100 kts) and highest seas (12 m) during thiscruise. On Dec 9 a continuation of these conditions until at least Dec 14 became evident fromthe long- and medium-range numerical weather predictions. We decided to give up tocomplete of this WOCE section and return to Hamburg. At 2000 the ship started to headeast, launching XBTs every 15nm and XCTDs every 30nm. However, on the morning of Dec10 the numerical forecasts changed radically and predicted the development of a highpressure ridge over the operation area to stabilize for a few days from Dec 12 onwards. Thischance was to be taken, the ship turned around and indeed from Dec 12 to Dec 15 0600 theWOCE section was completed in fine weather conditions (stations 538 - 551).
Since a few series of intense atmospheric depressions was announced to move into theoperations area for Dec 16, the original plans to dredge for further moorings with releasemalfunction were given up. The ship made for Hamburg were it docked on Dec 19, 1994 at0100 LT.
5 OPERATIONAL DETAILS AND PRELIMINARY RESULTS
5.1. OMEX Programmes
5.1.1 Biochemistry
• Phase Transfer of Organic Compounds During Shelf Edge Passage(UHIBl, I. Büns, A. Pfeifer and U. Brockmann)
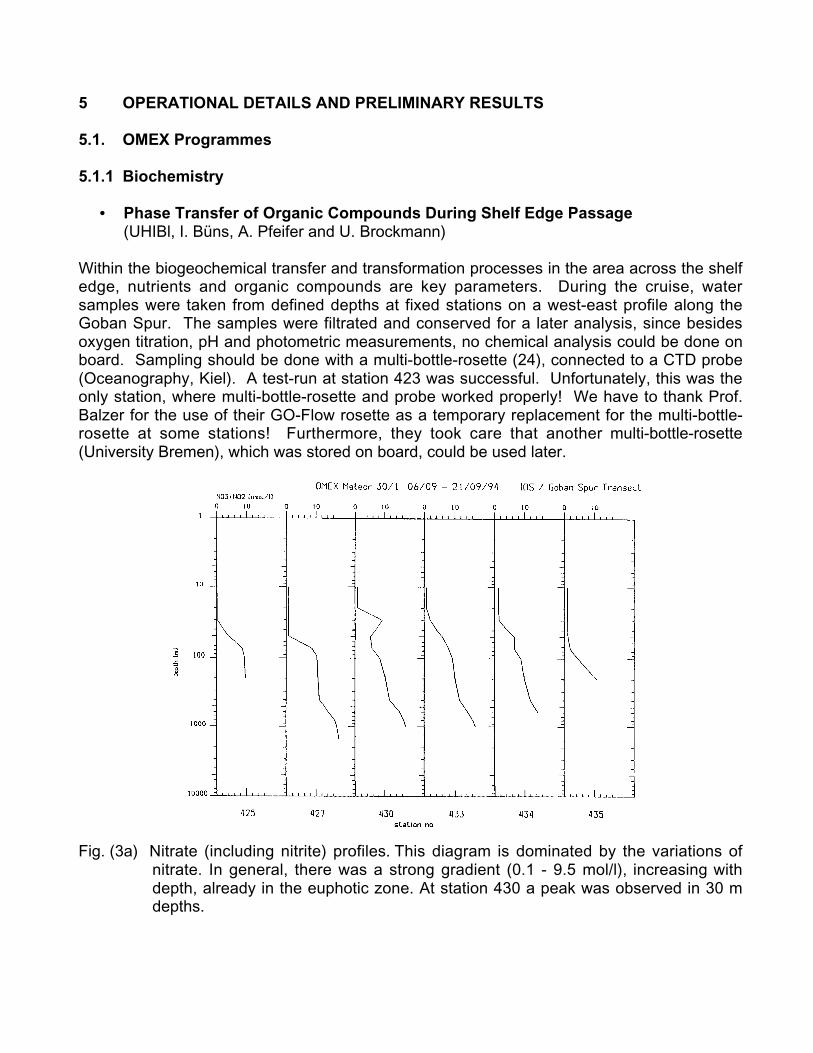
Within the biogeochemical transfer and transformation processes in the area across the shelfedge, nutrients and organic compounds are key parameters. During the cruise, watersamples were taken from defined depths at fixed stations on a west-east profile along theGoban Spur. The samples were filtrated and conserved for a later analysis, since besidesoxygen titration, pH and photometric measurements, no chemical analysis could be done onboard. Sampling should be done with a multi-bottle-rosette (24), connected to a CTD probe(Oceanography, Kiel). A test-run at station 423 was successful. Unfortunately, this was theonly station, where multi-bottle-rosette and probe worked properly! We have to thank Prof.Balzer for the use of their GO-Flow rosette as a temporary replacement for the multi-bottle-rosette at some stations! Furthermore, they took care that another multi-bottle-rosette(University Bremen), which was stored on board, could be used later.
Fig. (3a) Nitrate (including nitrite) profiles. This diagram is dominated by the variations ofnitrate. In general, there was a strong gradient (0.1 - 9.5 mol/l), increasing withdepth, already in the euphotic zone. At station 430 a peak was observed in 30 mdepths.
At station 425/IOS (depths > 4800 m), when multi-bottle-rosette and CTD totally failed, only 5samples with the GO-Flows down to 200 m could be taken.
Station 426/OMEX IV: multi-bottle-rosette and CTD still did not work; because of lack of timethe GO-Flows couldn't be used.
At station 427/OMEX III the CTD probe was run separately; the multi-bottle-rosette stillrefused to work properly. As there was no time for a separate sampling, we got part of thesamples of Prof. Balzer, but the total volume that we actually needed for the filtration was notavailable.
Station 428/F: another trial, to run the multi-bottle-rosette from Bremen together with the CTDfailed. We got samples from the GO-Flows, but as the interval between sampling and thetime where we got our subsamples was too long, we couldn't use them.
At the station 430/OMEX II the CTD probe and the multi-bottle-rosette were run separately.Finally, success!
At the stations 433/B 1, 434/OMEX 1 and 435/A sampling now was successful.
Methods:
A vacuum filtration was run with controlled 0.2 bar at 9 filtration stands. Depending on theconcentration of suspended matter, volumes from 750ml to 1750ml were filtrated overWhatman GF/C filters for the determination of CHN, part. P, part. CH and dry weight. Anadditional filtration stand was used for volumes up to 5 l for each filter for the determination oflipids. All filters were stored frozen at -17°C. The filtrate was fixed with mercury-(II)-chloride(0.01% w/v) and stored in glass and polyethylene bottles in a cooling chamber for a lateranalysis of nitrate, nitrite, phosphate, silicate and ammonium. A wet-chemical oxidationmethod was used to prepare samples for determination of total dissolved nitrogen andphosphorus. Immediately after sampling, measurements of turbidity (Turner nephelometer),pH (WTW pH 91) and fluorescence (Turner fluorometer and 1 Hz fluorometer) wereconducted. Oxygen was determined by Winkler titration with a Metrohm titration stand.
First results:
The following diagrams (Fig. 3a-c) show nutrient-depth profiles for the sequence of stationsfrom west to east. The profiles consist of raw data, not yet controlled. In general, the profilesshow high nutrient concentrations within the deep water masses and low values due tonutrient consumption in the euphotic zone in the mixed layer.
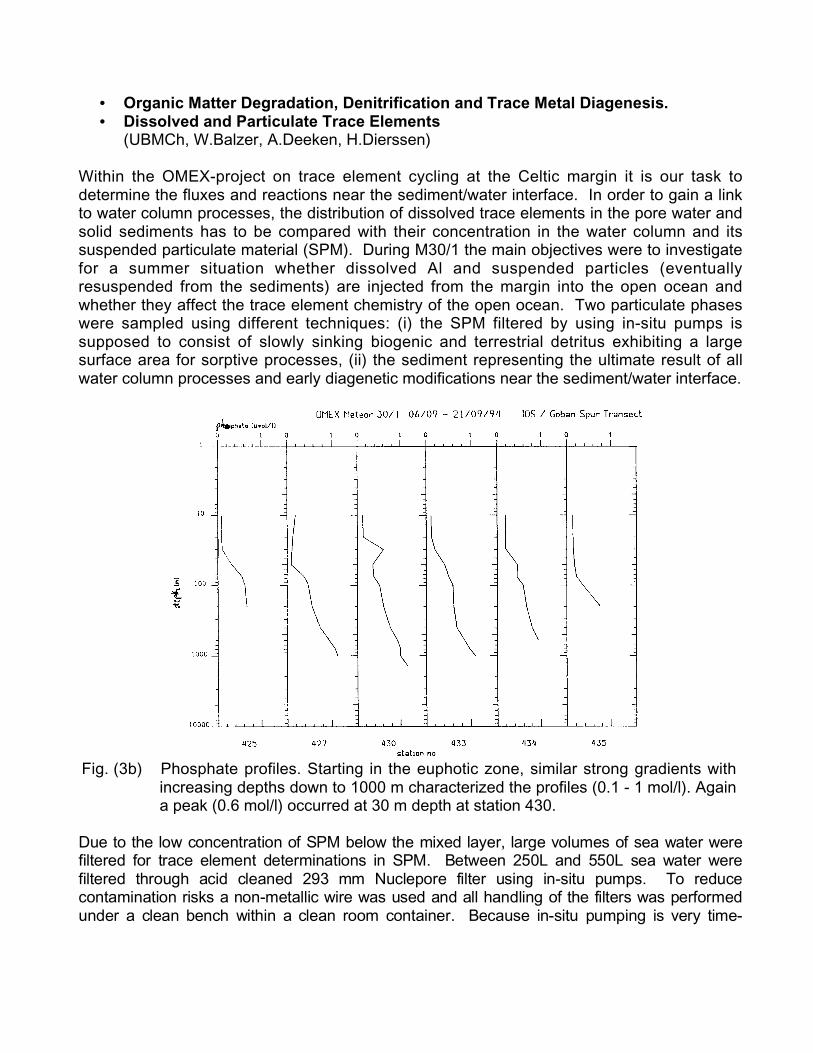
• Organic Matter Degradation, Denitrification and Trace Metal Diagenesis.• Dissolved and Particulate Trace Elements
(UBMCh, W.Balzer, A.Deeken, H.Dierssen)
Within the OMEX-project on trace element cycling at the Celtic margin it is our task todetermine the fluxes and reactions near the sediment/water interface. In order to gain a linkto water column processes, the distribution of dissolved trace elements in the pore water andsolid sediments has to be compared with their concentration in the water column and itssuspended particulate material (SPM). During M30/1 the main objectives were to investigatefor a summer situation whether dissolved Al and suspended particles (eventuallyresuspended from the sediments) are injected from the margin into the open ocean andwhether they affect the trace element chemistry of the open ocean. Two particulate phaseswere sampled using different techniques: (i) the SPM filtered by using in-situ pumps issupposed to consist of slowly sinking biogenic and terrestrial detritus exhibiting a largesurface area for sorptive processes, (ii) the sediment representing the ultimate result of allwater column processes and early diagenetic modifications near the sediment/water interface.
Fig. (3b) Phosphate profiles. Starting in the euphotic zone, similar strong gradients withincreasing depths down to 1000 m characterized the profiles (0.1 - 1 mol/l). Againa peak (0.6 mol/l) occurred at 30 m depth at station 430.
Due to the lo w co nce nt ra t io n of SPM below th e mixed laye r, la rg e vo lum es of sea wa te r wer ef ilte re d for tr ace ele me n t de te r mina t io ns in SPM . Be twe en 25 0L and 55 0L se a wa t er we re f ilte re d thr o ug h acid cle an ed 29 3 mm Nucle po r e filte r using in -sit u pum ps. To re du ce con ta min at io n risks a no n -m et allic wire was used an d all han d ling of the filt er s was pe rf or m ed u nd er a clea n ben ch with in a cle an ro om con t aine r . Beca use in- situ pu mp ing is ver y tim e-
con su min g pu m ps were com b in ed with b ott le ca st s whe ne ve r p ossib le. Du e to limit ed sh ip t im e o nly 7 filte r s we re ob ta ine d fr o m th e G ob an Sp ur t ra nsect a t dep th s bet we e n 50 m an d 145 0 m. Ano th er 3 filte rs we re disr up te d dur ing dep loyme n t. At all sta tion s whe r e in -situ -p u mp s we r ed ep lo ye d and espe cia lly whe re se dime n t tr ap mo or ing s we r e po sit io ne d , ca sts of G oF lo bo tt le swer e ta ken to ana lyse th e ver tical dist ribu t io n of Al an d eve nt ua lly oth e r tr ace met a ls in the wat er co lu mn . Fo r the tr ace me t al st ud ie s pre ca u tion s had to be ta ken ag ainst the risks of con ta min at io n : be fo r e use t he G oF lo b o tt le s wer e acid cle an ed th or o ug hly, at st at io n the b o tt le swer e at t ache d to a non -m e ta llic wire , dur in g h an d ling on d eck bot h ope nin g en ds we re co ve re d wit h pla st ic ba gs, all ma nipu la t io ns af te r sub -sa mp ling we re pe rf or m ed un de r a cle an be nch. Dur in g the cr uise Al fro m 6 sta t io ns wa s me a su re d on bo a rd usin g a f lu or om e tr ic te ch niq ue .T he ver t ical an d ho r izon t al d ist ribu t io n will be co mp ar e d wit h re su lts f r om t he pa rt icle an a lysis.
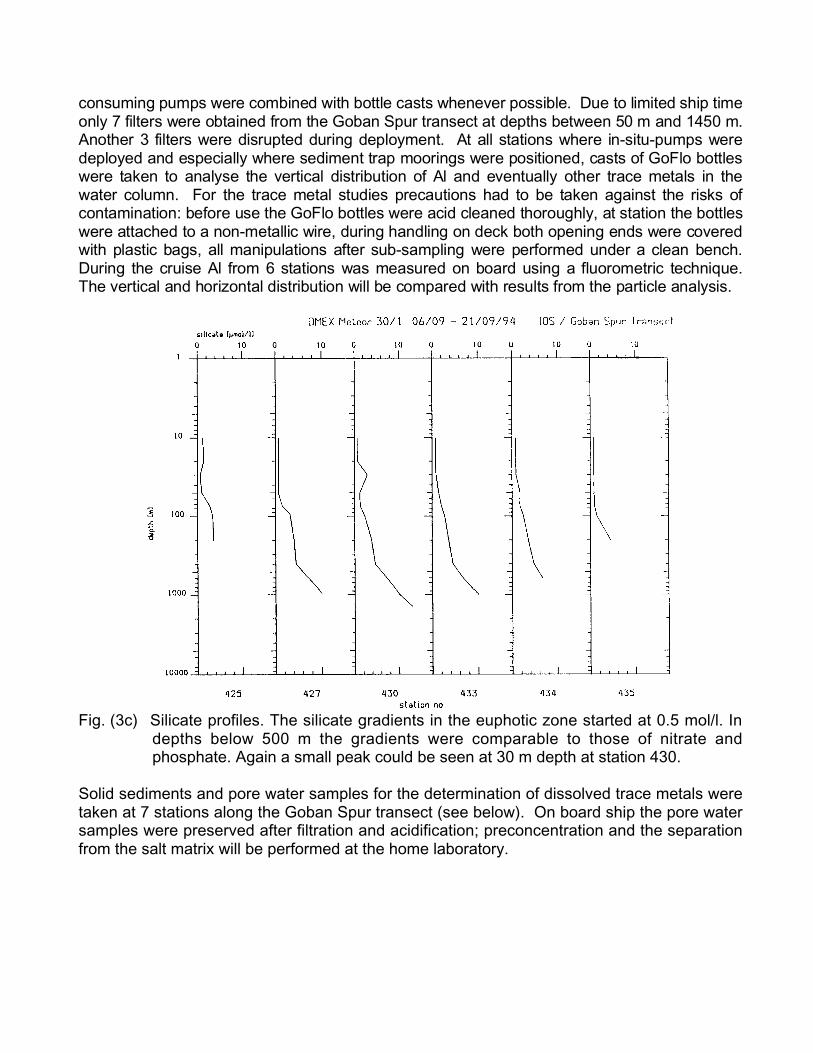
Fig. (3c) Silicate profiles. The silicate gradients in the euphotic zone started at 0.5 mol/l. Indepths below 500 m the gradients were comparable to those of nitrate andphosphate. Again a small peak could be seen at 30 m depth at station 430.
Solid sediments and pore water samples for the determination of dissolved trace metals weretaken at 7 stations along the Goban Spur transect (see below). On board ship the pore watersamples were preserved after filtration and acidification; preconcentration and the separationfrom the salt matrix will be performed at the home laboratory.
• Dissolved Organic Carbon(UBMCh, S.Otto, W.Balzer)
In order to investigate dissolved organic carbon (DOC) in the water column across thecontinental margin, samples from seven CTD-rosettes or GoFlo casts were taken at theGoban Spur transect. At each position the whole water column was sampled. It is verycritical in the determination of DOC to avoid contamination of the samples. Therefore, greatcare was taken from the first step of sampling throughout the whole work-up procedure:samples from the rosette were taken in pre-cleaned glass bottles, immediately filtered throughpre-combusted GF/F filters and finally acidified and sealed in brown glass ampoules. Allsamples were stored at +4°C until analysis. The DOC determinations were performed by theHigh-Temperature-Catalytic-Oxidation (HTCO).
In addition to the investigation of DOC in the water column, sediments taken at 6 stations witha multi-corer were sampled to determine DOC in pore waters. After squeezing the sedimentin a cold room, the pore water was analysed for DOC and for total inorganic carbon (TIC).While TIC at the deeper stations was always close to 2 mmol/L it was much higher at theshallow stations showing a maximum of 5.6 mmol/L. DOC in the pore water varied between0.8 and 2.6 mmol/L, again having higher concentrations at the shallower stations.
• Pore Water Chemistry(UBMCh, W.Balzer, A.Deeken, H.Wellmann)
The OMEX-project was established to contribute towards the understanding of the cycling ofnitrogen, carbon and trace metals at continental margins where benthic processes areexpected to play a significant role for the chemistry of the whole ocean. Necessary for theunderstanding of the major controls over release fluxes from boundary sediments is a detailedinvestigation of early diagenetic processes acting within the sediments. It was thereforeplanned to conduct extensive work on pore water chemistry and on solid sediment phases atthe Goban Spur transect across the Celtic margin. From the sediments taken at 7 stations(#425, #426, #427, #428, #430, #433, #434) by a multicorer, the pore water was squeezed orcentrifuged under in-situ temperature conditions (cool room). Nitrate as the pore waterconstituent providing most information about the diagenetic milieu, showed systematicvariations in the profiles over the transect. All nitrate pore water profile showed sub-oxicconditions typical for hemipelagic sediments of the North Atlantic ocean but there was also asignificant contribution of sulphate reduction to organic matter degradation at the stationsshallower than 1500 m. The rates of carbon combustion by oxygen and nitrate, respectively,were assessed by use of a model for steady-state diagenesis of organic matter. The rates fororganic carbon degradation by oxygen decreased systematically with water depth with oneexception: station #430 at 1500 m showed an extremely high rate which is consistent withbenthic lander results obtained by Dutch colleagues.
• Benthic Denitrification and Bioirrigation(UBMCh, W.Balzer, A.Deeken, H.Wellmann)
For the estimation of denitrification rates two independent methods were applied: (i) theevaluation of the rate from the modelling of the pore water nitrate distribution, and (ii) thedirect determination according to the "acetylene-block" incubation method. The pore waternitrate profiles can be used simultaneously to estimate integrated rates of denitrification, forthe reaction being first order with respect to nitrate. Denitrification was detectable but weak inthe depth range from 5300 m to 3665 m but became much more intensive when the shallowerregion (1500 m to 670 m) was approached.
The determination of denitrification rates by C2H2-block incubation comprises the followingsteps: (i) sub-sampling a box-corer with several acrylic glass tubes, (ii) injection of acetyleneinto the pore water of the whole sediment column of the sub-cores to block the furtherreduction of the intermittently formed N2O to dinitrogen, (iii) sectioning of the sub-cores afterappropriate incubation times, (iv) equilibration of the sediment sections with the gas phase insmall closed jars after stopping the reactions with KOH, and (v) head-space analysis of theN2O concentration in the gas phase by GC-ECD.
Only 4 sediment stations (#428, #430 (OMEX II), #433 and #434 (OMEX I)) were selected forthis lengthy procedure. For each station 6 sub-cores were used: 2 sub-cores for an averageN2O-profile, 2 sub-cores for an average 1-day-incubation and 2 sub-cores for an average 2-day-incubation. There was no N2O-production at station #428. The other 3 shallower stationsshowed intensive N2O-production close to the surface with maximum rates at the depth range2-4 cm in all cases. When comparing these rates with the denitrification rates obtained frompore water modelling two features deserve special attention: (i) considering the widelydiffering boundary conditions, assumptions, etc. of the two methods, the agreement within afactor of 3 is remarkable, (ii) there might be a difference in the process that is measured bythe two methods: the pore water profile might correspond more to the long-term steady-statesituation while the incubation might respond to seasonal effects more directly.
The N2O profiles in the pore-water (without incubation; from which release rates werecalculated) showed highest concentrations near the sediment surface in all coresinvestigated. N2O release, however, is significant only in sediments of the upper continentalmargin again having a relative maximum at 1530 m as suggested by the relative heights ofthe rates obtained from incubation. The relative heights of the N2O release rates can beestimated directly from a comparison of the profiles. The absolute rates can only becalculated when the modelling of the tracer incubation experiments for the calculation of bio-irrigation rates is finished - which is presently underway.
Especially in the shallower parts of the continental margin, the release fluxes from thesediment surface might be enhanced by the bio-irrigating action of (bioturbating) macrofaunaorganisms. To estimate the enhancement over molecular diffusion, tracer experiments wereperformed by applying a tracer in the overlying water and incubation of the sediment core atin-situ temperature. After 2-4 days the core was cut into slices and the tracer concentrationwas determined in the pore water. By numerical modelling (using a "quasi-diffusional"
coefficient) the transport of the tracer into the sediment column can be followed and the best-fitting coefficient can be evaluated.
5.1.2 Air Chemistry
• Exchange of Reduced Sulphur Compounds Between Ocean and Atmosphere(MPICh, G. Uher, O. Flöck, G. Schebeske, V.Ulshöfer)
The biogeochemical processes, which are controlling the production of carbonyl sulphide(COS) and dimethyl sulphide (DMS) in surface seawater as well as their emission to theatmosphere were the focus of the biogeochemical investigations by our group. These studieswere accompanied by measurements of chlorophyll concentration, absorbance andfluorescence of dissolved organic matter on one hand, and of the atmospheric concentrationsof condensation nuclei, black carbon, and radon (222Rn) on the other hand. In the followingsections some preliminary results are presented.
• COS in surface seawater and atmosphere(V. Ulshöfer)
COS is formed photochemically in surface seawater and is believed to be the main source ofthe stratospheric sulphate layer during periods of low volcanic activity. This sulphate layeraffects the Earth’s radiation balance as well as stratospheric ozone levels. Emission from theoceans is one of the main sources in the global budget of COS. In this budget, however,exists an imbalance between sources and sinks which partly may be due to largeuncertainties in the quantification of single sources and sinks. For a better assessment of theoceanic source, we investigated the diurnal and seasonal cycle of COS in the NortheastAtlantic. Atmospheric and dissolved COS was determined using a semi-continuous seawaterequilibration system with cryogenic preconcentration, gas chromatographic separation andflame photometric detection. Ambient air was drawn through a Teflon tube from the top of theship’s mast to the analytical system. Air was analysed directly and after equilibration withseawater (for the determination of dissolved COS in seawater). Water from approx. 7 mdepth was supplied continuously to the equilibrator by a non-contaminating pumping system.This pumping system consisted of a Teflon membrane pump (all wetted parts polyvinylidenefluoride) and a polyvinyl chloride tube mounted inside a hollow stainless steel shaft which wassubmerged beneath the keel through the ship’s "moon pool“. The fully automated systemallowed the hourly analysis of atmospheric and dissolved COS. The saturation ratio of COSin surface waters with respect to its atmospheric concentration was calculated:
SR = [COS]equilibrated air / [COS]ambient air
Dur in g the en tire cr uise le g disso lve d COS was su pe r sa tu ra t ed in sur fa ce wa t er s wit h re spe ct t o it s amb ie n t at mo sph er ic co nce nt ra t io n an d a diur na l cycle with m axim a in th e aft er n oo n and m in im a bef or e sun rise wa s obser ved . Th e re sults fr om th e fo r me r Me t eo r cru ise leg s M27 /1 ( Ja nu ar y 199 4 , OM EX ar ea ) and M2 1/ 2 (Ap ril/ M ay 19 92 , BI O TRANS are a at 47 ° N, 20 ° W) ar ein co nt r ast to th ese fin d in gs. Th e win te r dat a (M 27 /1 ) sho wed per siste n t u nd er sa t ur at ion and n o diur n al cycle of disso lved COS, pr o ba bly due to low ligh t int en sit y an d hen ce lo w
p ho to ch e mica l pro du ction du ring da yt ime . Th e sp r in g da t a fr o m th e BIO TRANS are a (M 21/ 2) sho we d u nd er sa t ur at ion as well as sup er sa t ur at ion and no ne t flux to th e at mo sph er e cou ld be f ou nd with in th e exp er im e nt al un ce rt a in ty. Th e results fr om th ese thr ee cr uise le gs co ve r thr ee sea so ns (win t er , sp r in g, an d su m me r) an d sh o w a pro no un ced se ason al va ria bility of th e se asur fa ce COS con cen tr a tion . Th is se t of da ta will be use d to est im at e an an n ua l cycle of d isso lve d COS in the No rt he ast Atla nt ic, based on met e or olo gica l and ocea no gr a ph ic da ta .M or eo ve r a kine tic mod el fo r th e diu r na l cycle of disso lve d COS will be app lied th at co nsid e rslig ht de pe nd e nt and ligh t ind ep e nd en t COS pro d uctio n, hyd r olysis, and ga s excha ng e acr o sst he a ir - se a int er fa ce. Con se qu e nces with r e sp ect t o est im at ion s of th e glo ba l mar in e e mission so f COS will b e add re sse d.
• Depth profiles of dissolved COS and photochemical incubation studies(O. Flöck)
Depth profiles of dissolved COS were taken using non-contaminating, gas tight GoFlo watersamplers. The water samples were pressure filtered (GF/F Whatman filters, preheated at 400C for 2h), transferred into volume-calibrated glass flasks (approx. 300 ml) and stored in thedark at 4 C for not longer than 6 hours. Photochemical incubation studies were performedusing surface seawater obtained from our non-contaminating seawater pumping system. Thewater was GF/F filtered, filled into glass flasks and exposed to sunlight for ca. 10 hours. Thesamples (including dark controls) were held at sea surface temperature during theirradiations. COS was determined by gas stripping of seawater, followed by cryogenictrapping, gas chromatographic separation, and flame photometric detection. All results werecorrected for sample losses due to hydrolysis.
At ten stations the vertical distributions of dissolved COS were recorded. These data includedhigh resolution profiles within the upper 100 m and profiles down to depths of 2000 m.Generally the vertical profiles showed maxima at the sea surface and an approximatelyexponential decay to a certain background level beneath the mixed layer (about 50 m duringthe cruise). Although the COS concentration in deeper waters was very low, some transportor non-photochemical production mechanisms are required to maintain this background leveland compensate losses due to hydrolysis. In addition to the station work, time series of COSphotoproduction were obtained from ten sunlight irradiations of surface seawater. These timeseries together with our continuously recorded UV-light intensities will enable us to determineCOS photoproduction constants. Our complete data set which includes atmospheric mixingratios, sea surface concentrations, depth profiles, and COS photoproduction constants, will beused to test one-dimensional transport models for the prediction of surface concentrationsand global marine emissions of COS. We will be able to investigate the influence ofdownward mixing of dissolved COS out of the zone of photochemical formation on the seasurface concentration and hence on the sea-to-air flux of this climatically relevant trace gas.
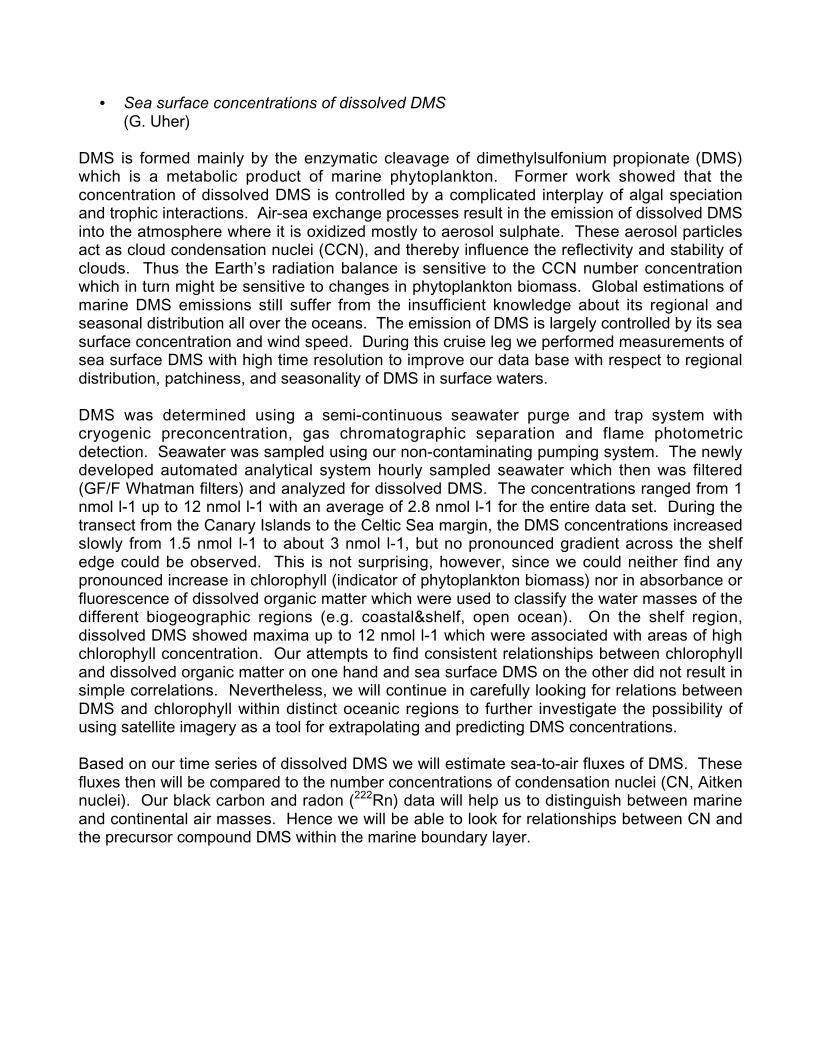
• Sea surface concentrations of dissolved DMS(G. Uher)
DMS is formed mainly by the enzymatic cleavage of dimethylsulfonium propionate (DMS)which is a metabolic product of marine phytoplankton. Former work showed that theconcentration of dissolved DMS is controlled by a complicated interplay of algal speciationand trophic interactions. Air-sea exchange processes result in the emission of dissolved DMSinto the atmosphere where it is oxidized mostly to aerosol sulphate. These aerosol particlesact as cloud condensation nuclei (CCN), and thereby influence the reflectivity and stability ofclouds. Thus the Earth’s radiation balance is sensitive to the CCN number concentrationwhich in turn might be sensitive to changes in phytoplankton biomass. Global estimations ofmarine DMS emissions still suffer from the insufficient knowledge about its regional andseasonal distribution all over the oceans. The emission of DMS is largely controlled by its seasurface concentration and wind speed. During this cruise leg we performed measurements ofsea surface DMS with high time resolution to improve our data base with respect to regionaldistribution, patchiness, and seasonality of DMS in surface waters.
DMS was determined using a semi-continuous seawater purge and trap system withcryogenic preconcentration, gas chromatographic separation and flame photometricdetection. Seawater was sampled using our non-contaminating pumping system. The newlydeveloped automated analytical system hourly sampled seawater which then was filtered(GF/F Whatman filters) and analyzed for dissolved DMS. The concentrations ranged from 1nmol l-1 up to 12 nmol l-1 with an average of 2.8 nmol l-1 for the entire data set. During thetransect from the Canary Islands to the Celtic Sea margin, the DMS concentrations increasedslowly from 1.5 nmol l-1 to about 3 nmol l-1, but no pronounced gradient across the shelfedge could be observed. This is not surprising, however, since we could neither find anypronounced increase in chlorophyll (indicator of phytoplankton biomass) nor in absorbance orfluorescence of dissolved organic matter which were used to classify the water masses of thedifferent biogeographic regions (e.g. coastal&shelf, open ocean). On the shelf region,dissolved DMS showed maxima up to 12 nmol l-1 which were associated with areas of highchlorophyll concentration. Our attempts to find consistent relationships between chlorophylland dissolved organic matter on one hand and sea surface DMS on the other did not result insimple correlations. Nevertheless, we will continue in carefully looking for relations betweenDMS and chlorophyll within distinct oceanic regions to further investigate the possibility ofusing satellite imagery as a tool for extrapolating and predicting DMS concentrations.
Based on our time series of dissolved DMS we will estimate sea-to-air fluxes of DMS. Thesefluxes then will be compared to the number concentrations of condensation nuclei (CN, Aitkennuclei). Our black carbon and radon (222Rn) data will help us to distinguish between marineand continental air masses. Hence we will be able to look for relationships between CN andthe precursor compound DMS within the marine boundary layer.
• Chlorophyll and dissolved organic matter in surface seawater(G.Schebeske, V. Ulshöfer)
In addition to the defemination of sulphur compounds, chlorophyll along with absorbance andfluorescence of seawater was recorded. We intended to use chlorophyll as an indicator ofphytoplankton biomass and furthermore absorbance and fluorescence of dissolved organicmatter as tracers to determine the degree of mixing between different water masses as wellas their optical and photochemical properties. Surface seawater from our non-contaminatingpumping system was sampled approximately every 4 hours. The samples were stored indetergent washed polyethylene bottles at 4˚C in the dark, generally for not longer than 10hours. 250 ml were filtered (GF/F Whatman filters, preheated at 400˚C for 2h). The filterswere homogenised and extracted with acetone/water (90/10) at room temperature. Then thesolution was filtered again to remove the glass fibres, filled up to a standard volume withacetone/water, and analyzed fluorometrically (Ex 425±20 nm, Em 665±20 nm) using aShimadzu RF1501 spectrofluorometer equipped with a 10 mm quartz cell. The instrumentwas calibrated before and after the cruise using a solution of chlorophyll a (Sigma Chemie) inacetone/water.Both absorbance and fluorescence was measured on filtered seawater (GF/FWhatman filters, preheated at 400 C for 2h). The spectral absorbance was recorded from 250nm to 700 nm using a Shimadzu UV160A spectrophotometer and 100 mm quartz cells. Milli-Qwater was used as a reference. The absorbance data have been normalized to compensatefor the instrument’s drift by subtracting the reading at 690 to 700 nm. Fluorescence emissionspectra., 325 nm, and 340 nm as excitation wavelengths and an emission wavelength scan inthe range of excitation wavelength plus 15 nm up to 600 nm. The spectral response of Milli-Qwater was subtracted and the fluorescence intensities then were expressed in quininesulphate units (the maximum intensity of 1 mg l-1 quinine sulphate dihydrate in 0.105 MHClO4 at the excitation wavelength used was defined as 1 quinine sulphate unit). Preliminaryresults show absorption coefficients a(350 nm) lower than 0.1 m-1 for the transect from theCanary islands to the celtic sea margin and no significant increase across the shelf edgecould be observed. (a(350 nm) here is defined as the decadic absorption coefficient andnormalized to one meter optical pathlength. Thus Lambert Beer’s law is written: A = a*l(A=absorbance, l=optical pathlength)). On the shelf area slightly higher absorptioncoefficients a(350 nm) of about 0.15 m-1 were found. The results from the fluorescencemeasurements in general showed the same trend.
(1) Condensation nuclei (CN, Aitken nuclei), black carbon, and radon (222Rn) within themarine boundary layer(G. Schebeske, V. Ulshöfer)
The atmospheric concentrations of condensation nuclei, black carbon, and radon were usedas tracers to distinguish between marine and continental air masses. The sampling inlets forthe continuous aerosol analysers (CN, black carbon, and 222Rn) were located on a beamextending into the air flow just above the flying bridge (ca. 30 m above sea surface) where theship’s air chemistry laboratory is located. Tubing lengths between inlet and instruments wereless than 5 m. For CN sampling electrically conductive tubing was used. The sampling inletfor black carbon was automatically interrupted by a Weathertronics sampler controller if therelative wind direction was more than 120 off the bow to avoid the sampling of stack
emissions. CN concentrations were determined with a TSI model 3020 condensation nucleuscounter. Black carbon was measured with an aethalometer (Magee Scientific). Both CN andblack carbon were recorded continuously and integrated over 5 min periods. 222Rn wasrecorded continuously via the decay products 214Po and 218Po using an APIA monitor. Thecounts were integrated over 2 hour periods.
Acknowledgements
We thank Karl Pegler, Ralf Lendt, and Harald Rätzer for letting us use their stainless steelsampling inlet. Thanks are due to Alexander Pfeiffer and Ilse Büns for helping us with theirpH-data.
5.1.3 Sedimentology
• Particle Flux and in situ Marine Aggregate Studies at the Continental Margin(IfMK, A.N. Antia, W. Erasmi; IOSDL, R.S.Lampitt; T. Kumbier; IOW, G. Lehnert)
• Particle Flux
Par ticle flu x stu die s wit hin th e OMEX pro gr a mm e focus on add r essing th e tra nspo r t of ma te ria lo n th e she lf - slop e reg io n s of th e G ob an Sp ur , wit h an em ph a sis on exch a ng e of ma te r ia lb et we en th ese reg io n s an d the ad ja ce n t op en ocea n . T he po sit io ns of moo r in gs with se dime nt t ra ps, cur re n t me te r s an d t ra nsmisso me t er s ha ve be e n ch ose n to qu an tif y bo t h pa rt icle flu x ou t o f th e e up ho tic zon e and wint er mixe d layer as well as to de te r mine mid- wa t er tr an sp or t at the slo pe ed ge on the Pen dr ag o n Escar pm en t , at wh ich posit ion par t icle s fro m the co nt in en t alm ar gin may be exp ect ed to be exp or te d to th e adjo in in g abyssa l ba sin and th e tr a nspo r t of d isso lve d nu t rien ts on to th e slo pe wo uld ta ke pla ce . Du ring METEOR 30 /1 th ese moo rin gswer e su cce ssf ully r e co ve r ed and re -d e ployed an d yie ld ed a ne a r- co mp let e set o f sed im e nt t ra p sam ples an d cur re nt me te r dat a for th e pr eviou s 9 mon th s of dep lo ym e nt (Jan - Se pt 19 94 ). F or t he de plo ym en t per iod July 199 3 - Jan 1 9 94 ( a ut um n/win te r ), cur r ents at t he po sit io n OM EX2 wer e see n to flow alon g the bo tt om co nt ou r s in a no rt h er ly dire ct ion , i.e . alo ng - slop e, whe re as at th e Ped ra go n Esca rp me nt of f -slop e wat er tr an sp o rt wa s re giste re d , acco m pa nie db y an in cr ea se in pa rt icle co nce nt ra t io ns in the se dime n t tr a ps at int er m ed ia te de pt h s ascom pa re d to tha t dir ectly ben ea t h th e win te r mixe d la ye r . Th e da ta ob ta ine d du r in g M 30/ 1sho w a d if fe ren t pictu re fo r the spr ing a nd su mm er. Fig . 4 (a - e) sh ows cur ren t me ter d ata f ro m t he moo r in gs OM EX 2 an d OMEX 3 at th e dif fe r en t dep th s. Dat a are pr esen t ed as 24- ho u rr un ning me an s to sm o ot h out tid a l oscilla tio ns wh ich ar e pre sen t in all dat a, th ou gh with d ecre asing am plit ud e wit h incre a sing dist an ce fr o m th e she lf . At OM EX 2 a ch an g e in cu rr en t d ir ectio n fr o m pr ed o mina n tly n or th we st- flo wing (~30 0° m ag n. ) to so u th -e ast er ly cu rr en t s du r in gM ar ch a n d ag a in d ur ing M a y is ap pa re n t. Me a n cu r re nt sp ee d decre ase s fr o m 11 .7 5 cm/ sec a t6 20 m to 9.4 1 cm/ se c at 107 0 m ove r the 9-m o nt h dep lo ym e nt . Alth ou g h fe w dat a of th is kind e xist f o r th e G ob an Sp ur , such a rever sal o f she lf cu rr en t s du r in g th e sum m er m on t hs h a s be en d ocum en t ed by Pin gr ee & L eCan n (19 89 ) in an ad ja cen t re g io n. This rever sal in cur re n td ir ectio n ha s imp licat io n s on th e so u rce ar e a of pa rt icu la te ma te ria l in t er ce pt e d in th e se d im en t t ra ps. Sou th we ste rly cur re n ts wo uld ca r ry ma te rial fr om th e re g io n of th e she lf br ea k, cha ra ct e rise d by hig h ch lor op hyll co n ce nt ra t io ns, to th e tra p posit ion s. Ano th e r fe a tu re th at is
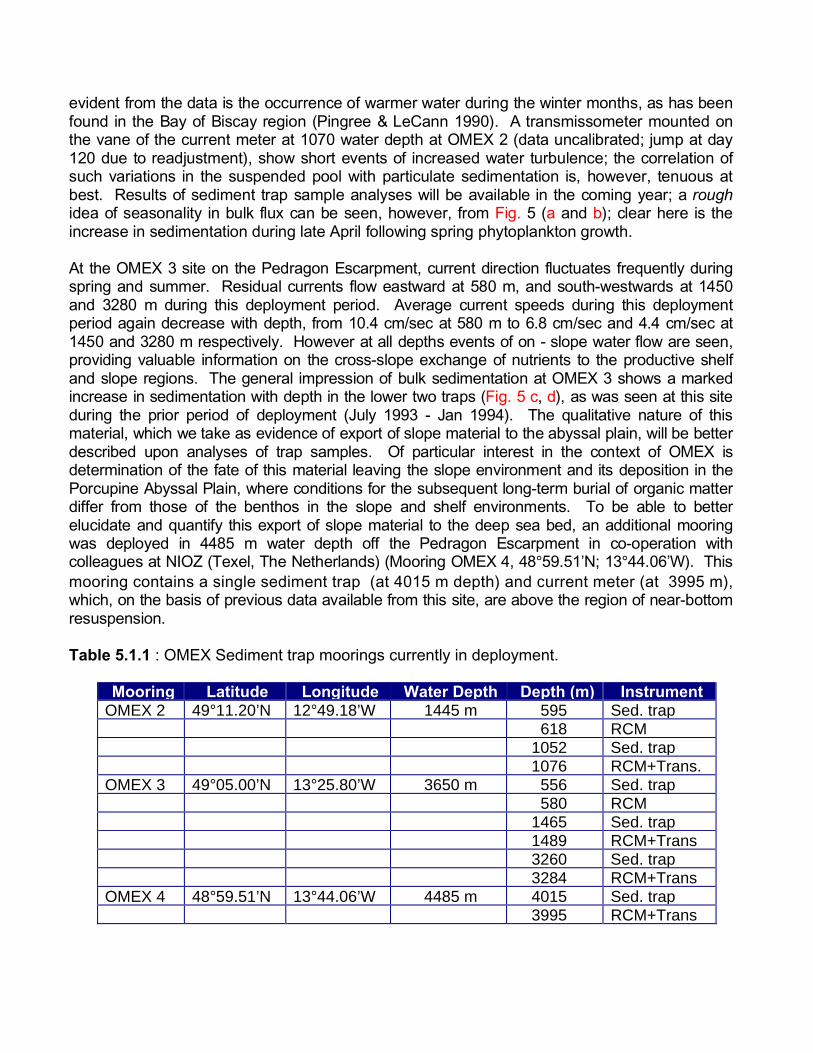
e vide nt fr om th e da t a is th e occur re n ce o f war me r wat er du rin g th e win te r mon th s, as ha s be e nf ou nd in the Ba y of Bisca y re gio n (Pin gr ee & L eCan n 199 0) . A t ra nsmisso me t er mou n te d ont he van e of the cur r en t met er at 107 0 wat er de pt h at OM EX 2 (da ta u ncalib r at ed ; jum p at da y1 20 due to re ad ju st m en t) , sho w sho rt even ts of in cr ea se d wat e r tu rb u le nce ; th e cor re lat io n ofsuch va r ia tio ns in the su sp en de d poo l wit h par ticulat e sed im e nt at io n is, ho we ve r , te n uo us at b est. Result s of se dime n t tr ap sa mp le an alyse s will be availab le in the co ming ye ar ; a r ou gh ide a of sea so na lit y in bu lk flux ca n be se en , howeve r, fr om Fig . 5 (a and b) ; cle ar her e is the incre ase in sed im en t at io n d ur in g lat e Apr il fo llo wing sp ring p hyto pla nkto n g ro wt h .
At the OM EX 3 site on the Ped ragon Escarp ment, curren t dire ction fluctu ates frequen tly du ringspr ing an d summ er. Residua l curr ents flow ea stward at 58 0 m, and sou th-westwards at 14 50and 3280 m during this deployment perio d. Average curren t spee ds dur ing th is dep loymen tper iod ag ain de crease with depth, from 10.4 cm/sec at 580 m to 6.8 cm /sec and 4.4 cm/se c at145 0 and 3280 m respe ctively. Ho wever at all depth s even ts of on - slope water flow ar e seen ,pro viding valua ble in format ion on the cross-slope exchang e of nutrien ts to the pr oductive she lfand slope regio ns. The gen eral impression of bulk sedime ntatio n at OMEX 3 shows a markedincrease in sed imenta tion with de pth in the lower two tra ps (Fig. 5 c, d), as was seen at this site dur ing th e prio r period of deployment (July 1993 - Jan 19 94). The qu alitat ive na ture of thismat erial, which we ta ke as eviden ce of export of slope ma terial to th e abyssal plain, will be bette rdescribed upon analyses of trap samples. Of particular interest in the con text of OMEX isdet ermina tion of the fate of this mater ial le aving the slope en vironm ent an d its deposition in thePor cupine Abyssal Pla in, wh ere co nditio ns for the subsequ ent lo ng-ter m burial of organic matt erdif fer fr om tho se of the ben thos in the slope and sh elf en vironm ents. To be able to bet terelu cidate and quantif y this expor t of slope materia l to the dee p sea bed, an additional mooringwas deplo yed in 4485 m wate r dept h off the Ped ragon Escarp ment in co-o peration wit hcolleague s at NIOZ (Texel, Th e Neth erland s) (Mo oring OMEX 4, 48°59. 51’N; 13°44. 06’W). Thismooring contains a single sediment trap (at 4015 m depth) and current meter (at 3995 m),which, on the basis of previous data available from this site, are ab ove th e region of near-b ottomresuspension.
Table 5.1.1 : OMEX Sediment trap moorings currently in deployment.
Mooring Latitude Longitude Water Depth Depth (m) InstrumentOMEX 2 49°11.20’N 12°49.18’W 1445 m 595 Sed. trap
618 RCM1052 Sed. trap1076 RCM+Trans.
OMEX 3 49°05.00’N 13°25.80’W 3650 m 556 Sed. trap580 RCM
1465 Sed. trap1489 RCM+Trans3260 Sed. trap3284 RCM+Trans
OMEX 4 48°59.51’N 13°44.06’W 4485 m 4015 Sed. trap3995 RCM+Trans
A list of OMEX moorings presently in deployment is given in Table 5.1.1. These moorings willbe recovered and redeployed from board the RSS DISCOVERY in September 1995.
The OMEX sediment trap mooring line naturally extends onto the Porcupine Abyssal Plain.Sediment traps have been deployed by the Institute of Oceanographic Sciences (UK.) at"Station H" (40°N, 16.5°W) since April 1992 with a view to determining long-term trends inparticle flux at an oceanic site removed from the influence of the continental shelf and slope.Traps have in general been at depths of 100, 3400 and 4500 m above bottom (water depth4600 m) with an array of current meters and camera systems to examine temporal trends inmarine snow concentration. The latest deployment had been from RSS DARWIN in April1994. During METEOR 30/1 this was recovered, refurbished and redeployed within 11 hours.From the recovered traps, apart from one on which the mechanism failed halfway through itscycle, all functioned well and have provided a good collection of samples. These will beanalysed in a variety of ways to give information about the composition of the material, andthe flux of organic carbon, nitrogen, pigments, radionuclides and various organic markers.
• Marine Snow Studies
Marine snow is loosely defined as inanimate particles of diameter greater than 0.5 mm. Theyare thought to be the principal vehicles by which material sinks through the water column.Such studies therefore are of considerable importance in developing our understanding ofmaterial flux. The distribution of these fragile particles is best determined using photographictechniques such as the Marine Snow Profiler. This instrument is attached to the CTD andphotographs about 40 l of water every 15 seconds using orthogonal illumination from a deep-sea flash light. Up to 400 frames can be taken.
During Meteor M30/1 seven deployments of the MSP were successfully made and theresulting images will be examined on an image analyser to determine the abundance, sizeand volume concentration of these particles.
In order to make further studies on marine snow particles they must be collected. This wasachieved during Meteor 30/1 using the specially designed marine snow catcher or "Snatcher".This is a messenger operated 100 l closing water bottle designed to minimise damage to themarine snow particles. After standing on deck for at least 2 hours, the upper 95 l is drainedoff and the lower portion of the Snatcher disconnected along with 5 l of water. The particlescan then be recovered from the base plate using a pipette. During this cruise, after someinitial compatibility problems, the Snatchers were successfully deployed on two occasions todepths of 30 and 50 m.
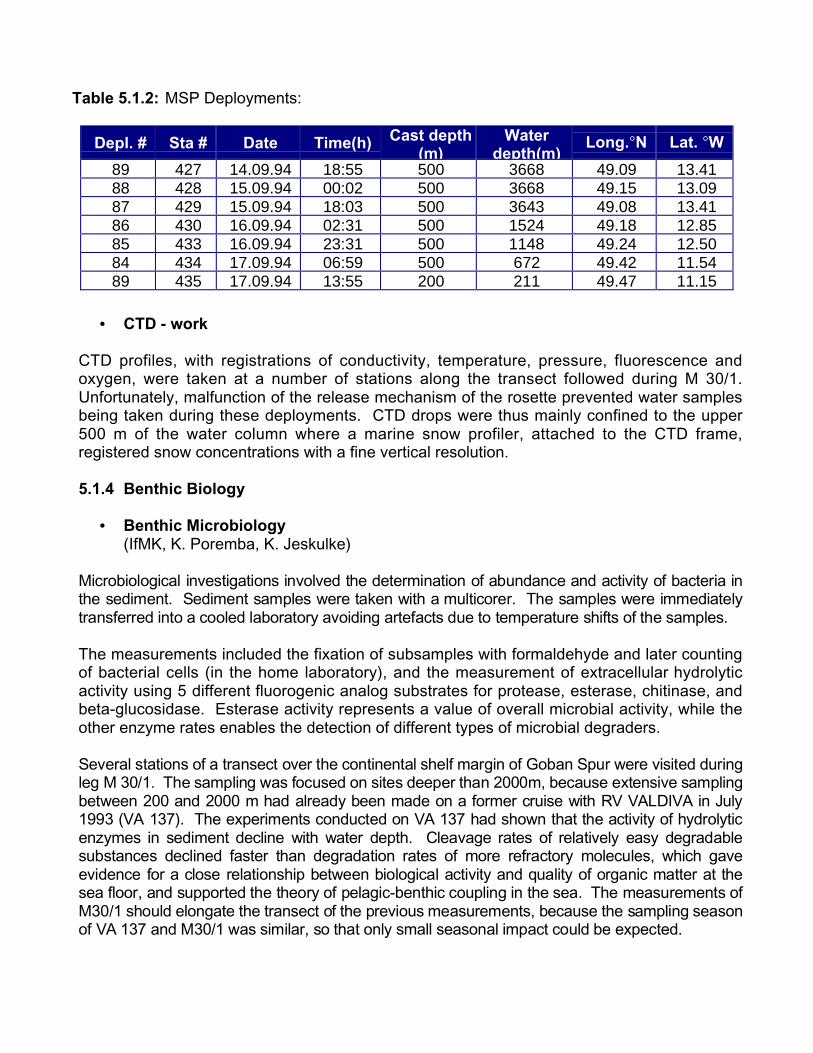
Table 5.1.2: MSP Deployments:
• CTD - work
CTD profiles, with registrations of conductivity, temperature, pressure, fluorescence andoxygen, were taken at a number of stations along the transect followed during M 30/1.Unfortunately, malfunction of the release mechanism of the rosette prevented water samplesbeing taken during these deployments. CTD drops were thus mainly confined to the upper500 m of the water column where a marine snow profiler, attached to the CTD frame,registered snow concentrations with a fine vertical resolution.
5.1.4 Benthic Biology
• Benthic Microbiology(IfMK, K. Poremba, K. Jeskulke)
Microbiological investigations in volved the determination of ab undance and activity of bacter ia inthe sedim ent. Sedime nt sam ples were ta ken with a multicore r. Th e samp les we re imm ediate lytra nsferr ed int o a co oled laborat ory avoiding artef acts d ue to temper ature shifts of th e samp les.
The measurements included the fixation of subsamples with formaldehyde and later countingof bacterial cells (in the home laboratory), and the measurement of extracellular hydrolyticactivity using 5 different fluorogenic analog substrates for protease, esterase, chitinase, andbeta-glucosidase. Esterase activity represents a value of overall microbial activity, while theother enzyme rates enables the detection of different types of microbial degraders.
Several station s of a tra nsect over t he con tinent al she lf mar gin of Gob an Spu r were visit ed dur ingleg M 30/ 1. Th e samp ling was focused on site s deep er tha n 2000 m, because e xtensive sam plingbet ween 200 and 2000 m had alread y been made on a former cruise with RV VAL DIVA in July199 3 (VA 137). The experim ents conduct ed on VA 137 had shown that th e activity of hydr olyticenzymes in sediment decline with water depth. Clea vage rates of rela tively easy degrad ablesub stance s declined faster than degrada tion rates of more refra ctory molecu les, which gaveevidence for a close relationship betwe en bio logica l activity and qua lity of orga nic ma tter at thesea floor , and suppor ted th e theo ry of pelagic-ben thic couplin g in the sea . The measu rement s ofM30 /1 sho uld elongate the transect of the previous me asurem ents, because the sampling sea sonof VA 137 and M 30/1 was sim ilar, so tha t only small season al imp act co uld be expected.
Depl. # Sta # Date Time(h) Cast depth(m)
Waterdepth(m)
Long. N Lat. W89 427 14.09.94 18:55 500 3668 49.09 13.4188 428 15.09.94 00:02 500 3668 49.15 13.0987 429 15.09.94 18:03 500 3643 49.08 13.4186 430 16.09.94 02:31 500 1524 49.18 12.8585 433 16.09.94 23:31 500 1148 49.24 12.5084 434 17.09.94 06:59 500 672 49.42 11.5489 435 17.09.94 13:55 200 211 49.47 11.15
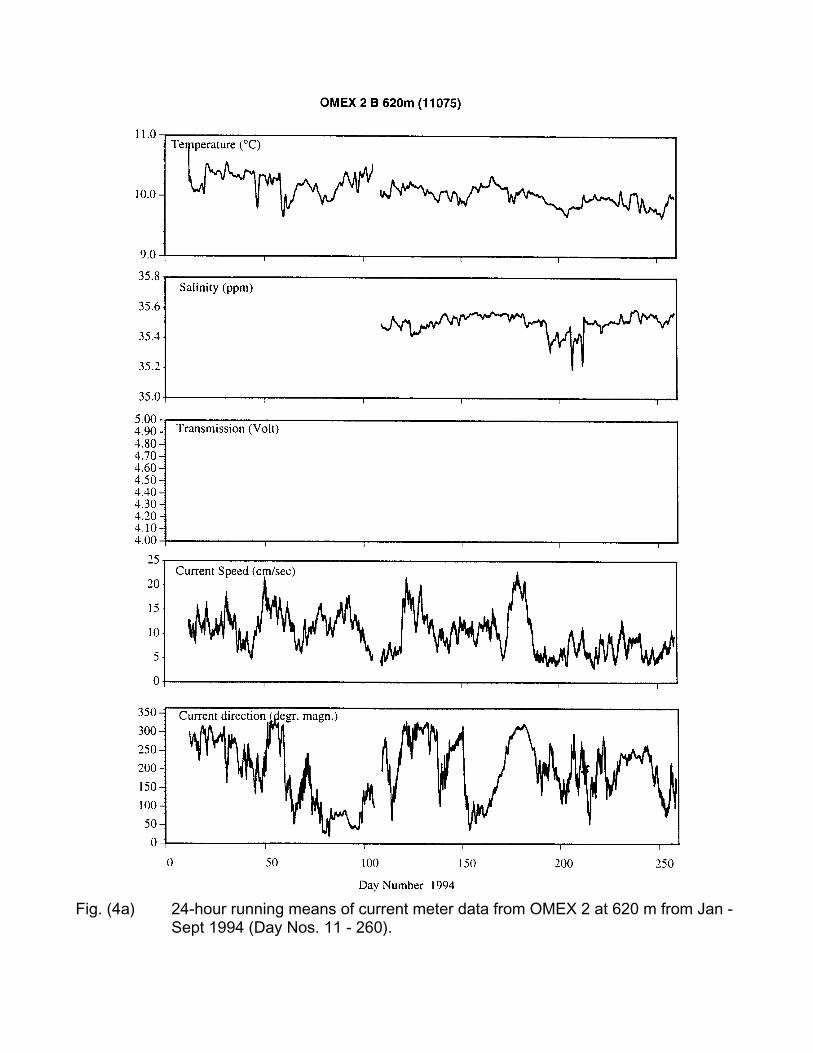
Fig. (4a) 24-hour running means of current meter data from OMEX 2 at 620 m from Jan -Sept 1994 (Day Nos. 11 - 260).
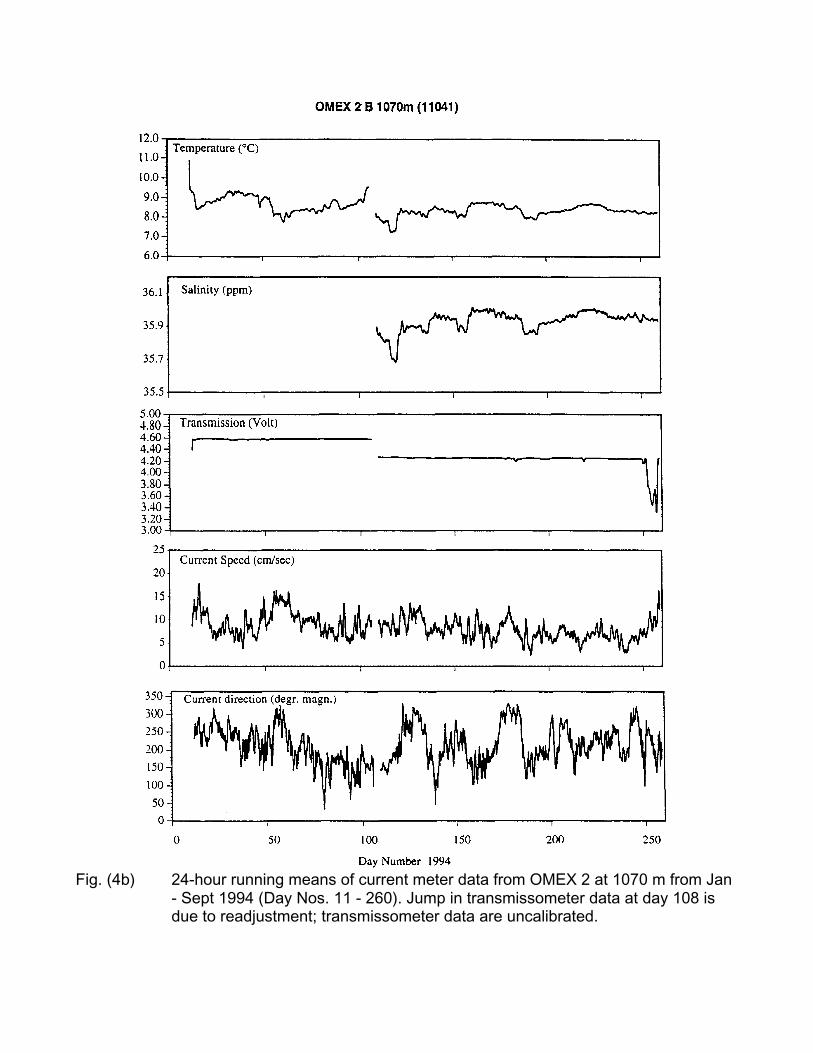
Fig. (4b) 24-hour running means of current meter data from OMEX 2 at 1070 m from Jan- Sept 1994 (Day Nos. 11 - 260). Jump in transmissometer data at day 108 isdue to readjustment; transmissometer data are uncalibrated.
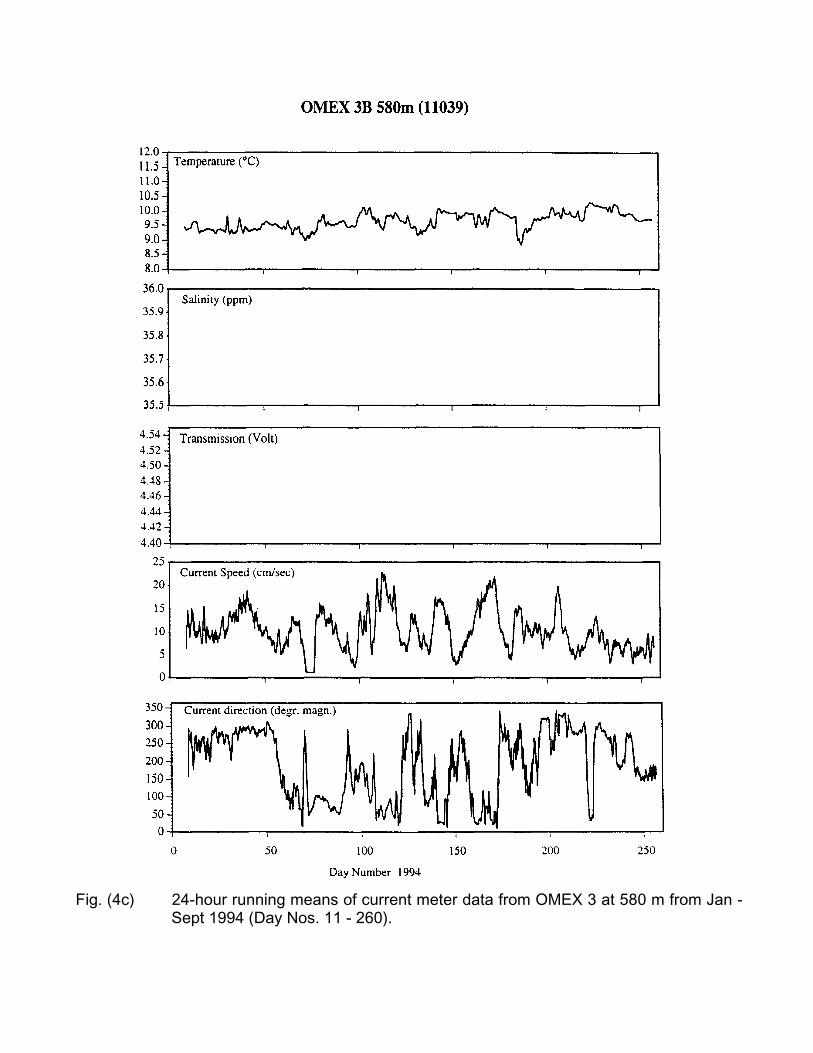
Fig. (4c) 24-hour running means of current meter data from OMEX 3 at 580 m from Jan -Sept 1994 (Day Nos. 11 - 260).
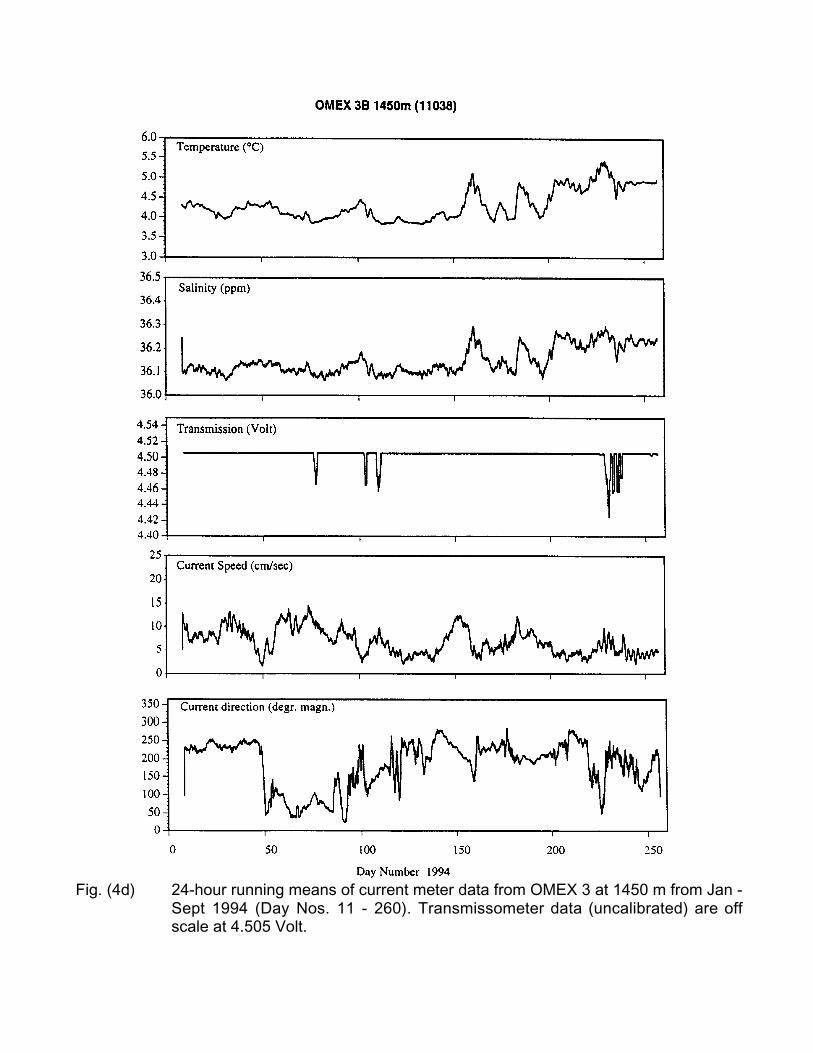
Fig. (4d) 24-hour running means of current meter data from OMEX 3 at 1450 m from Jan -Sept 1994 (Day Nos. 11 - 260). Transmissometer data (uncalibrated) are offscale at 4.505 Volt.
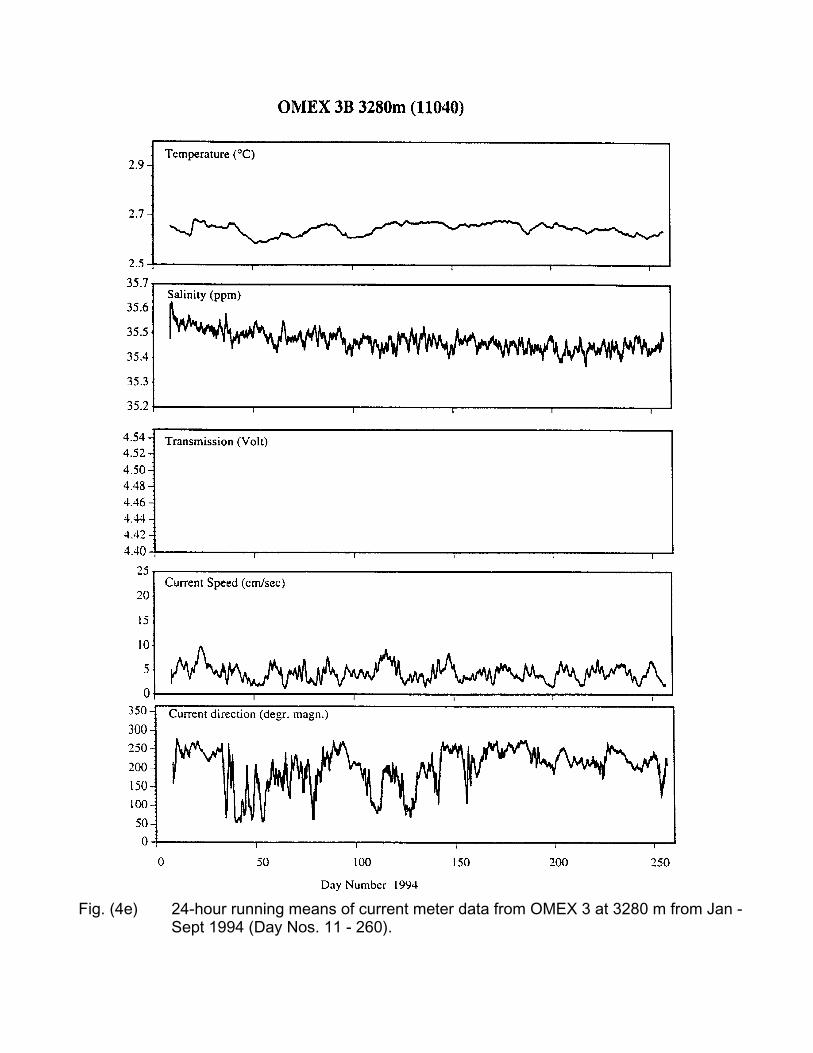
Fig. (4e) 24-hour running means of current meter data from OMEX 3 at 3280 m from Jan -Sept 1994 (Day Nos. 11 - 260).
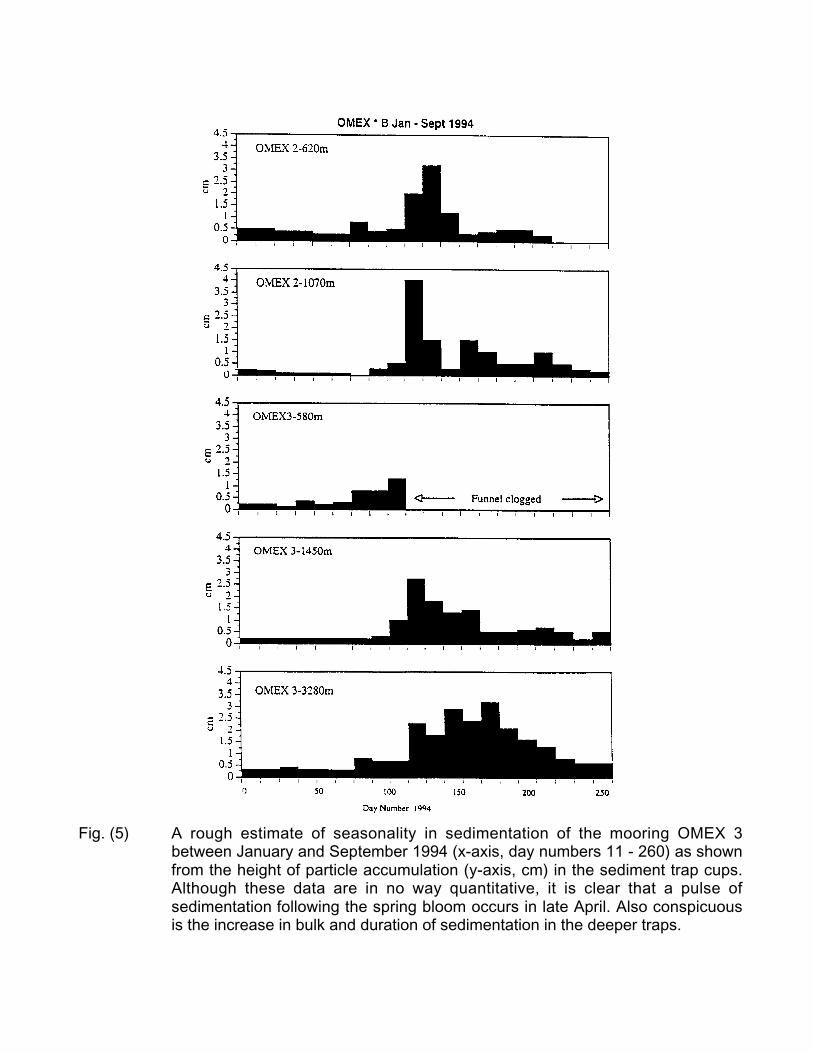
Fig. (5) A rough estimate of seasonality in sedimentation of the mooring OMEX 3between January and September 1994 (x-axis, day numbers 11 - 260) as shownfrom the height of particle accumulation (y-axis, cm) in the sediment trap cups.Although these data are in no way quantitative, it is clear that a pulse ofsedimentation following the spring bloom occurs in late April. Also conspicuousis the increase in bulk and duration of sedimentation in the deeper traps.
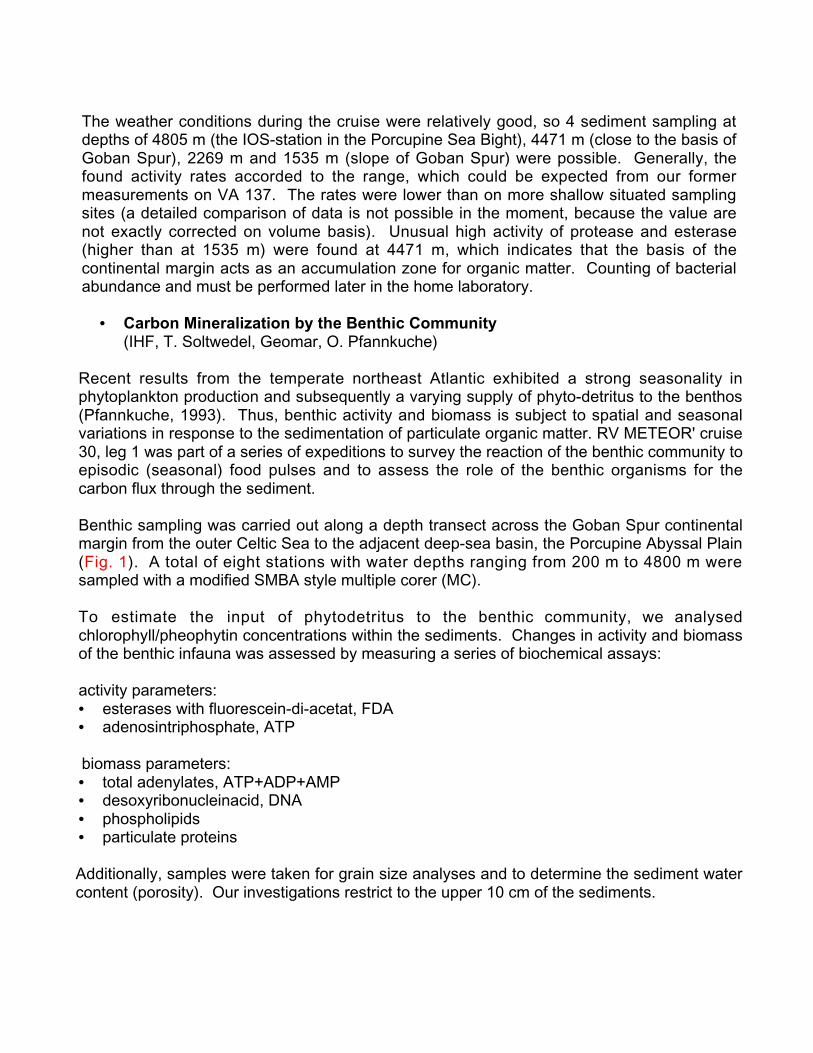
The weather conditions during the cruise were relatively good, so 4 sediment sampling atdepths of 4805 m (the IOS-station in the Porcupine Sea Bight), 4471 m (close to the basis ofGoban Spur), 2269 m and 1535 m (slope of Goban Spur) were possible. Generally, thefound activity rates accorded to the range, which could be expected from our formermeasurements on VA 137. The rates were lower than on more shallow situated samplingsites (a detailed comparison of data is not possible in the moment, because the value arenot exactly corrected on volume basis). Unusual high activity of protease and esterase(higher than at 1535 m) were found at 4471 m, which indicates that the basis of thecontinental margin acts as an accumulation zone for organic matter. Counting of bacterialabundance and must be performed later in the home laboratory.
• Carbon Mineralization by the Benthic Community(IHF, T. Soltwedel, Geomar, O. Pfannkuche)
Recent results from the temperate northeast Atlantic exhibited a strong seasonality inphytoplankton production and subsequently a varying supply of phyto-detritus to the benthos(Pfannkuche, 1993). Thus, benthic activity and biomass is subject to spatial and seasonalvariations in response to the sedimentation of particulate organic matter. RV METEOR' cruise30, leg 1 was part of a series of expeditions to survey the reaction of the benthic community toepisodic (seasonal) food pulses and to assess the role of the benthic organisms for thecarbon flux through the sediment.
Benthic sampling was carried out along a depth transect across the Goban Spur continentalmargin from the outer Celtic Sea to the adjacent deep-sea basin, the Porcupine Abyssal Plain(Fig. 1). A total of eight stations with water depths ranging from 200 m to 4800 m weresampled with a modified SMBA style multiple corer (MC).
To estimate the input of phytodetritus to the benthic community, we analysedchlorophyll/pheophytin concentrations within the sediments. Changes in activity and biomassof the benthic infauna was assessed by measuring a series of biochemical assays:
activity parameters:• esterases with fluorescein-di-acetat, FDA• adenosintriphosphate, ATP
biomass parameters:• total adenylates, ATP+ADP+AMP• desoxyribonucleinacid, DNA• phospholipids• particulate proteins
Additionally, samples were taken for grain size analyses and to determine the sediment watercontent (porosity). Our investigations restrict to the upper 10 cm of the sediments.
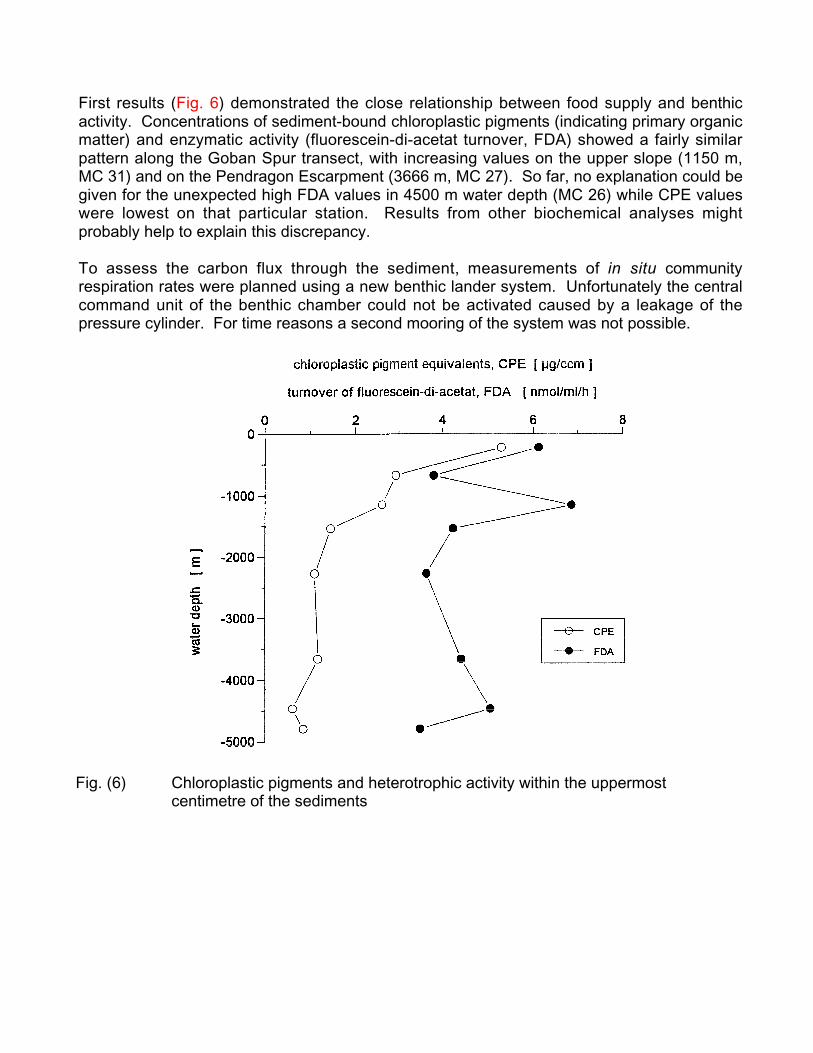
First results (Fig. 6) demonstrated the close relationship between food supply and benthicactivity. Concentrations of sediment-bound chloroplastic pigments (indicating primary organicmatter) and enzymatic activity (fluorescein-di-acetat turnover, FDA) showed a fairly similarpattern along the Goban Spur transect, with increasing values on the upper slope (1150 m,MC 31) and on the Pendragon Escarpment (3666 m, MC 27). So far, no explanation could begiven for the unexpected high FDA values in 4500 m water depth (MC 26) while CPE valueswere lowest on that particular station. Results from other biochemical analyses mightprobably help to explain this discrepancy.
To assess the carbon flux through the sediment, measurements of in situ communityrespiration rates were planned using a new benthic lander system. Unfortunately the centralcommand unit of the benthic chamber could not be activated caused by a leakage of thepressure cylinder. For time reasons a second mooring of the system was not possible.
Fig. (6) Chloroplastic pigments and heterotrophic activity within the uppermostcentimetre of the sediments
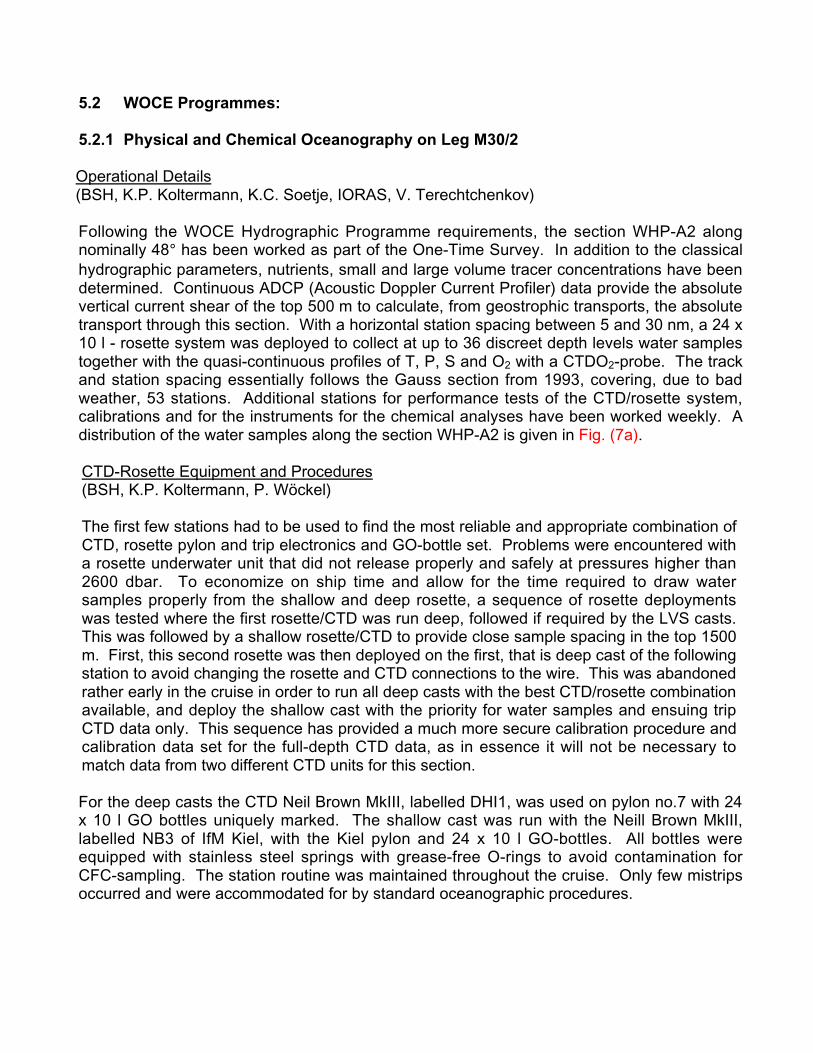
5.2 WOCE Programmes:
5.2.1 Physical and Chemical Oceanography on Leg M30/2
Operational Details(BSH, K.P. Koltermann, K.C. Soetje, IORAS, V. Terechtchenkov)
Following the WOCE Hydrographic Programme requirements, the section WHP-A2 alongnominally 48° has been worked as part of the One-Time Survey. In addition to the classicalhydrographic parameters, nutrients, small and large volume tracer concentrations have beendetermined. Continuous ADCP (Acoustic Doppler Current Profiler) data provide the absolutevertical current shear of the top 500 m to calculate, from geostrophic transports, the absolutetransport through this section. With a horizontal station spacing between 5 and 30 nm, a 24 x10 l - rosette system was deployed to collect at up to 36 discreet depth levels water samplestogether with the quasi-continuous profiles of T, P, S and O2 with a CTDO2-probe. The trackand station spacing essentially follows the Gauss section from 1993, covering, due to badweather, 53 stations. Additional stations for performance tests of the CTD/rosette system,calibrations and for the instruments for the chemical analyses have been worked weekly. Adistribution of the water samples along the section WHP-A2 is given in Fig. (7a).
CTD-Rosette Equipment and Procedures(BSH, K.P. Koltermann, P. Wöckel)
The first few stations had to be used to find the most reliable and appropriate combination ofCTD, rosette pylon and trip electronics and GO-bottle set. Problems were encountered witha rosette underwater unit that did not release properly and safely at pressures higher than2600 dbar. To economize on ship time and allow for the time required to draw watersamples properly from the shallow and deep rosette, a sequence of rosette deploymentswas tested where the first rosette/CTD was run deep, followed if required by the LVS casts.This was followed by a shallow rosette/CTD to provide close sample spacing in the top 1500m. First, this second rosette was then deployed on the first, that is deep cast of the followingstation to avoid changing the rosette and CTD connections to the wire. This was abandonedrather early in the cruise in order to run all deep casts with the best CTD/rosette combinationavailable, and deploy the shallow cast with the priority for water samples and ensuing tripCTD data only. This sequence has provided a much more secure calibration procedure andcalibration data set for the full-depth CTD data, as in essence it will not be necessary tomatch data from two different CTD units for this section.
For the deep casts the CTD Neil Brown MkIII, labelled DHI1, was used on pylon no.7 with 24x 10 l GO bottles uniquely marked. The shallow cast was run with the Neill Brown MkIII,labelled NB3 of IfM Kiel, with the Kiel pylon and 24 x 10 l GO-bottles. All bottles wereequipped with stainless steel springs with grease-free O-rings to avoid contamination forCFC-sampling. The station routine was maintained throughout the cruise. Only few mistripsoccurred and were accommodated for by standard oceanographic procedures.
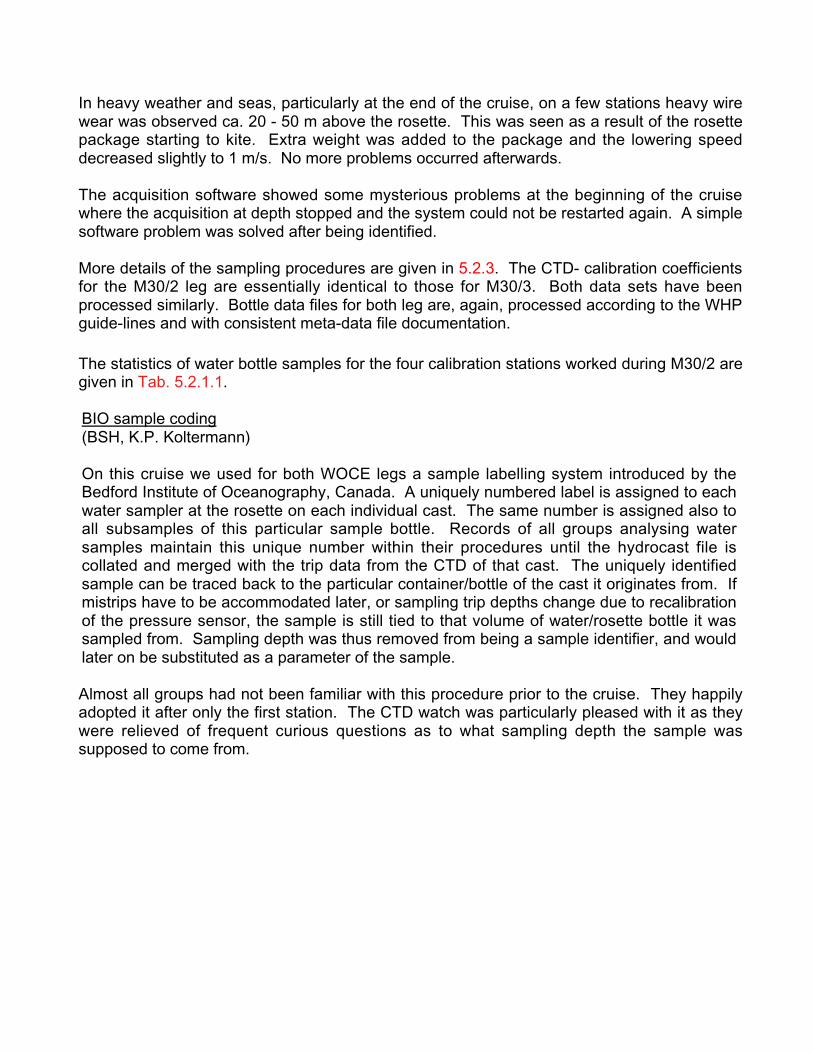
In heavy weather and seas, particularly at the end of the cruise, on a few stations heavy wirewear was observed ca. 20 - 50 m above the rosette. This was seen as a result of the rosettepackage starting to kite. Extra weight was added to the package and the lowering speeddecreased slightly to 1 m/s. No more problems occurred afterwards.
The acquisition software showed some mysterious problems at the beginning of the cruisewhere the acquisition at depth stopped and the system could not be restarted again. A simplesoftware problem was solved after being identified.
More details of the sampling procedures are given in 5.2.3. The CTD- calibration coefficientsfor the M30/2 leg are essentially identical to those for M30/3. Both data sets have beenprocessed similarly. Bottle data files for both leg are, again, processed according to the WHPguide-lines and with consistent meta-data file documentation.
The statistics of water bottle samples for the four calibration stations worked during M30/2 aregiven in Tab. 5.2.1.1.
BIO sample coding(BSH, K.P. Koltermann)
On this cruise we used for both WOCE legs a sample labelling system introduced by theBedford Institute of Oceanography, Canada. A uniquely numbered label is assigned to eachwater sampler at the rosette on each individual cast. The same number is assigned also toall subsamples of this particular sample bottle. Records of all groups analysing watersamples maintain this unique number within their procedures until the hydrocast file iscollated and merged with the trip data from the CTD of that cast. The uniquely identifiedsample can be traced back to the particular container/bottle of the cast it originates from. Ifmistrips have to be accommodated later, or sampling trip depths change due to recalibrationof the pressure sensor, the sample is still tied to that volume of water/rosette bottle it wassampled from. Sampling depth was thus removed from being a sample identifier, and wouldlater on be substituted as a parameter of the sample.
Almost all groups had not been familiar with this procedure prior to the cruise. They happilyadopted it after only the first station. The CTD watch was particularly pleased with it as theywere relieved of frequent curious questions as to what sampling depth the sample wassupposed to come from.
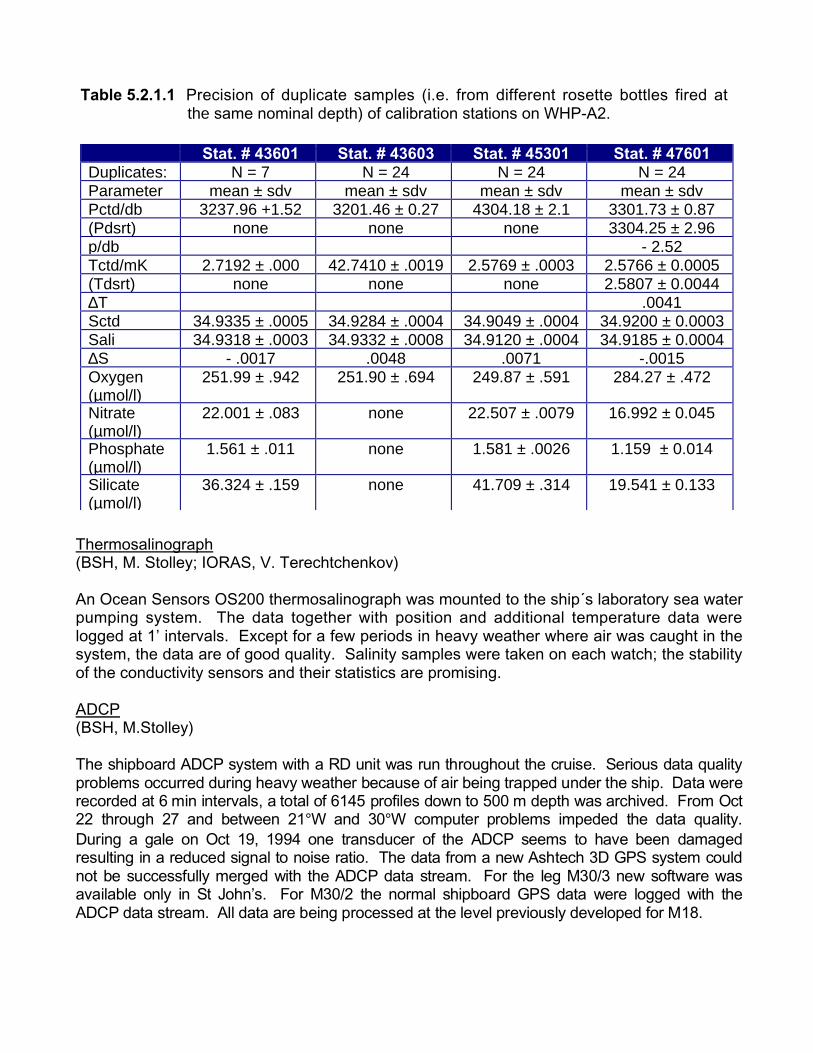
Table 5.2.1.1 Precision of duplicate samples (i.e. from different rosette bottles fired at the same nominal depth) of calibration stations on WHP-A2.
Thermosalinograph(BSH, M. Stolley; IORAS, V. Terechtchenkov)
An Ocean Sensors OS200 thermosalinograph was mounted to the ship´s laboratory sea waterpumping system. The data together with position and additional temperature data werelogged at 1’ intervals. Except for a few periods in heavy weather where air was caught in thesystem, the data are of good quality. Salinity samples were taken on each watch; the stabilityof the conductivity sensors and their statistics are promising.
ADCP(BSH, M.Stolley)
The shipb oard ADCP system with a RD unit was run th rougho ut the cruise. Se rious data qualitypro blems occurr ed dur ing he avy we ather because of a ir being tra pped u nder t he ship. Da ta wer erecorded at 6 m in int ervals, a to tal of 6145 profiles down to 500 m depth was archived. From Oct22 throug h 27 and bet ween 21°W and 30°W compute r prob lems impeded the data qu ality. Dur ing a gale on Oct 19, 19 94 one transducer of the ADCP seems to have been damag edresulting in a reduce d sign al to noise ratio. The data from a new Ash tech 3D GPS system could not be su ccessf ully merged with the ADCP data strea m. Fo r the leg M3 0/3 ne w soft ware wasava ilable only in St John’s. For M30/2 the normal shipbo ard GPS data were logged with theADCP data strea m. All data are b eing p rocessed at the le vel pr eviously developed for M 18.
Stat. # 43601 Stat. # 43603 Stat. # 45301 Stat. # 47601Duplicates: N = 7 N = 24 N = 24 N = 24Parameter mean ± sdv mean ± sdv mean ± sdv mean ± sdvPctd/db 3237.96 +1.52 3201.46 ± 0.27 4304.18 ± 2.1 3301.73 ± 0.87(Pdsrt) none none none 3304.25 ± 2.96p/db - 2.52Tctd/mK 2.7192 ± .000 42.7410 ± .0019 2.5769 ± .0003 2.5766 ± 0.0005(Tdsrt) none none none 2.5807 ± 0.0044∆T .0041Sctd 34.9335 ± .0005 34.9284 ± .0004 34.9049 ± .0004 34.9200 ± 0.0003Sali 34.9318 ± .0003 34.9332 ± .0008 34.9120 ± .0004 34.9185 ± 0.0004∆S - .0017 .0048 .0071 -.0015Oxygen(µmol/l)
251.99 ± .942 251.90 ± .694 249.87 ± .591 284.27 ± .472
Nitrate(µmol/l)
22.001 ± .083 none 22.507 ± .0079 16.992 ± 0.045
Phosphate(µmol/l)
1.561 ± .011 none 1.581 ± .0026 1.159 ± 0.014
Silicate(µmol/l)
36.324 ± .159 none 41.709 ± .314 19.541 ± 0.133
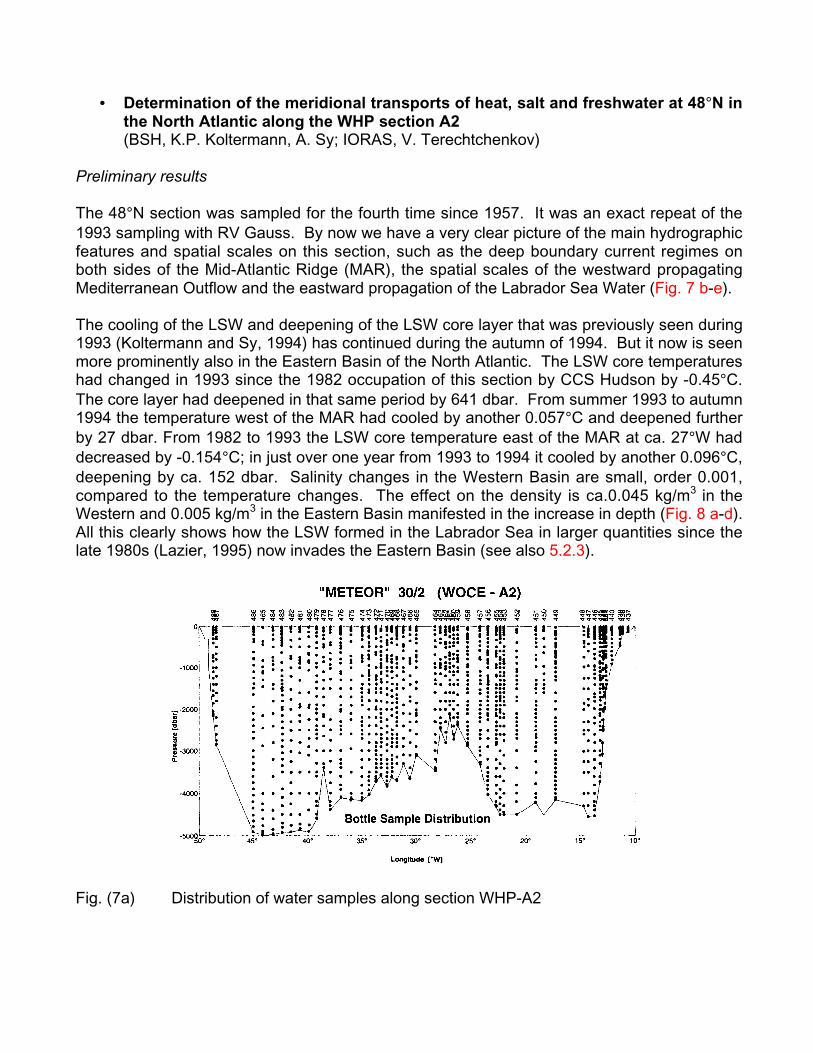
• Determination of the meridional transports of heat, salt and freshwater at 48°N inthe North Atlantic along the WHP section A2(BSH, K.P. Koltermann, A. Sy; IORAS, V. Terechtchenkov)
Preliminary results
The 48°N section was sampled for the fourth time since 1957. It was an exact repeat of the1993 sampling with RV Gauss. By now we have a very clear picture of the main hydrographicfeatures and spatial scales on this section, such as the deep boundary current regimes onboth sides of the Mid-Atlantic Ridge (MAR), the spatial scales of the westward propagatingMediterranean Outflow and the eastward propagation of the Labrador Sea Water (Fig. 7 b-e).
The cooling of the LSW and deepening of the LSW core layer that was previously seen during1993 (Koltermann and Sy, 1994) has continued during the autumn of 1994. But it now is seenmore prominently also in the Eastern Basin of the North Atlantic. The LSW core temperatureshad changed in 1993 since the 1982 occupation of this section by CCS Hudson by -0.45°C.The core layer had deepened in that same period by 641 dbar. From summer 1993 to autumn1994 the temperature west of the MAR had cooled by another 0.057°C and deepened furtherby 27 dbar. From 1982 to 1993 the LSW core temperature east of the MAR at ca. 27°W haddecreased by -0.154°C; in just over one year from 1993 to 1994 it cooled by another 0.096°C,deepening by ca. 152 dbar. Salinity changes in the Western Basin are small, order 0.001,compared to the temperature changes. The effect on the density is ca.0.045 kg/m3 in theWestern and 0.005 kg/m3 in the Eastern Basin manifested in the increase in depth (Fig. 8 a-d).All this clearly shows how the LSW formed in the Labrador Sea in larger quantities since thelate 1980s (Lazier, 1995) now invades the Eastern Basin (see also 5.2.3).
Fig. (7a) Distribution of water samples along section WHP-A2
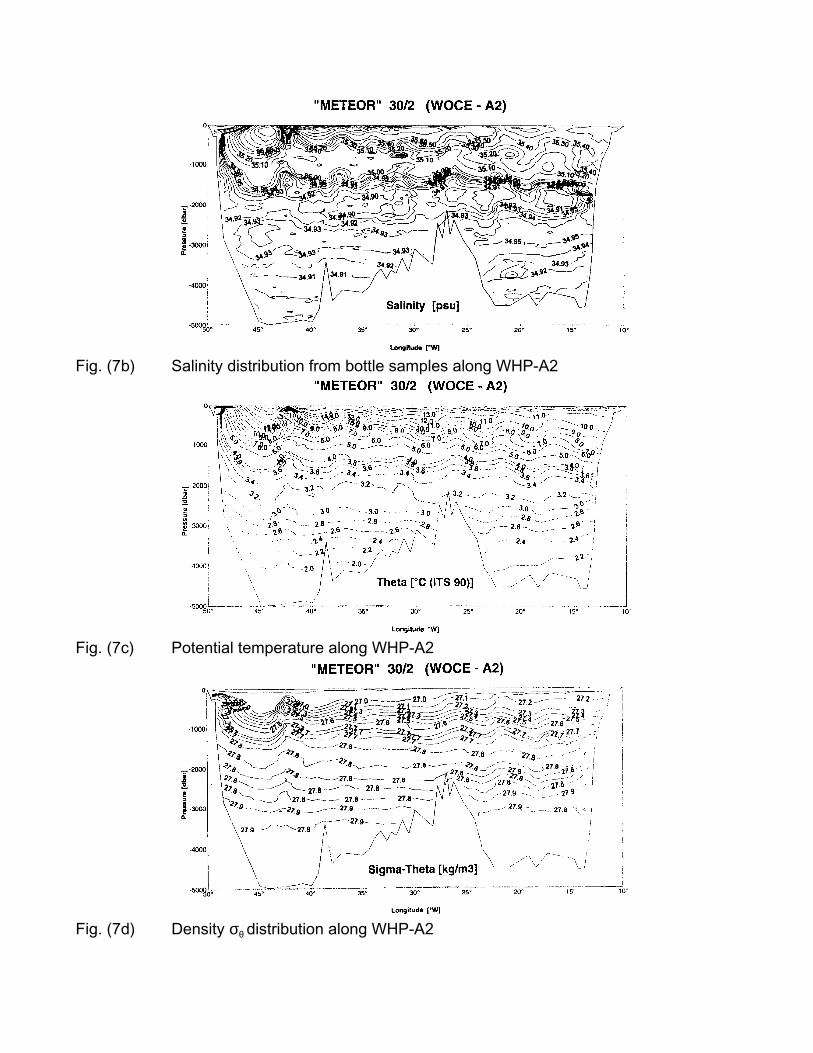
Fig. (7b) Salinity distribution from bottle samples along WHP-A2
Fig. (7c) Potential temperature along WHP-A2
Fig. (7d) Density σθ distribution along WHP-A2
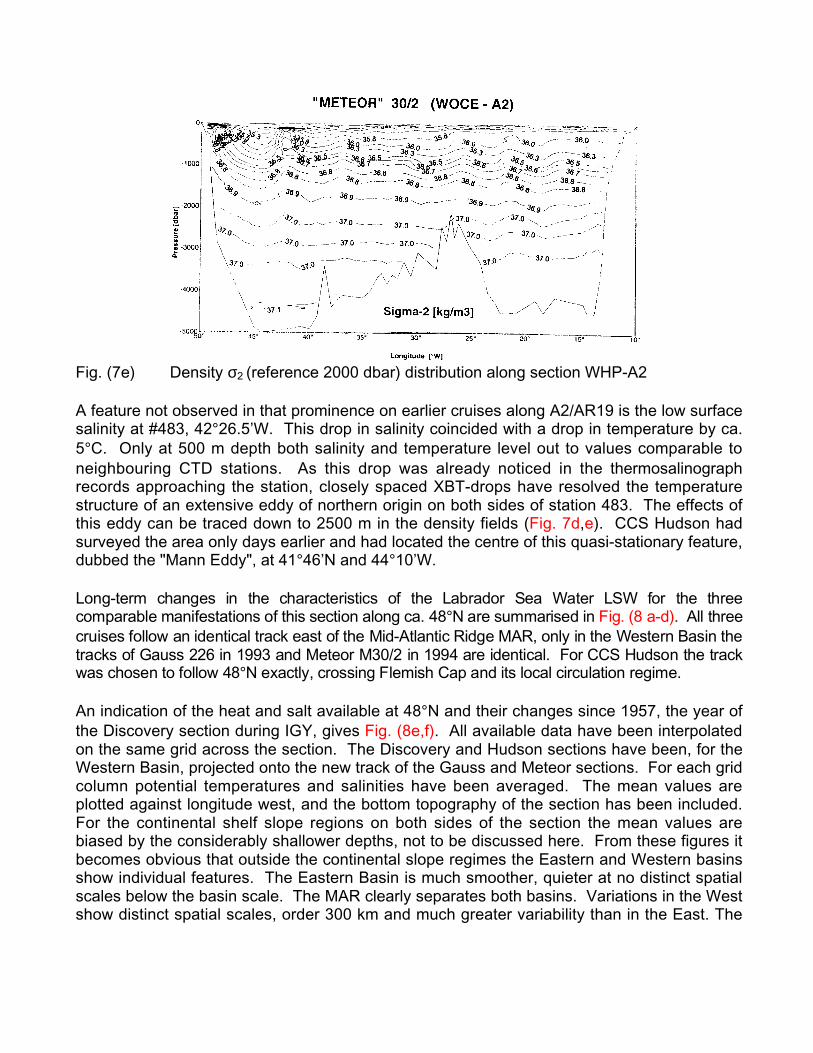
Fig. (7e) Density σ2 (reference 2000 dbar) distribution along section WHP-A2
A feature not observed in that prominence on earlier cruises along A2/AR19 is the low surfacesalinity at #483, 42°26.5’W. This drop in salinity coincided with a drop in temperature by ca.5°C. Only at 500 m depth both salinity and temperature level out to values comparable toneighbouring CTD stations. As this drop was already noticed in the thermosalinographrecords approaching the station, closely spaced XBT-drops have resolved the temperaturestructure of an extensive eddy of northern origin on both sides of station 483. The effects ofthis eddy can be traced down to 2500 m in the density fields (Fig. 7d,e). CCS Hudson hadsurveyed the area only days earlier and had located the centre of this quasi-stationary feature,dubbed the "Mann Eddy", at 41°46’N and 44°10’W.
Lon g-term chang es in the ch aracte ristics of the Lab rador Sea Wa ter LSW for the th reecom parable manifestat ions o f this section along ca. 48°N a re sum marise d in F ig. (8 a-d). All threecru ises f ollow an ide ntical track east of the Mid-Atlantic Ridg e MAR, only in the Weste rn Basin the tra cks of Gauss 226 in 1993 and Meteor M30/2 in 199 4 are identical. For CCS Hudso n the trackwas chose n to f ollow 48°N e xactly, crossing F lemish Cap a nd its local circu lation regim e.
An indication of the heat and salt available at 48°N and their changes since 1957, the year ofthe Discovery section during IGY, gives Fig. (8e,f). All available data have been interpolatedon the same grid across the section. The Discovery and Hudson sections have been, for theWestern Basin, projected onto the new track of the Gauss and Meteor sections. For each gridcolumn potential temperatures and salinities have been averaged. The mean values areplotted against longitude west, and the bottom topography of the section has been included.For the continental shelf slope regions on both sides of the section the mean values arebiased by the considerably shallower depths, not to be discussed here. From these figures itbecomes obvious that outside the continental slope regimes the Eastern and Western basinsshow individual features. The Eastern Basin is much smoother, quieter at no distinct spatialscales below the basin scale. The MAR clearly separates both basins. Variations in the Westshow distinct spatial scales, order 300 km and much greater variability than in the East. The
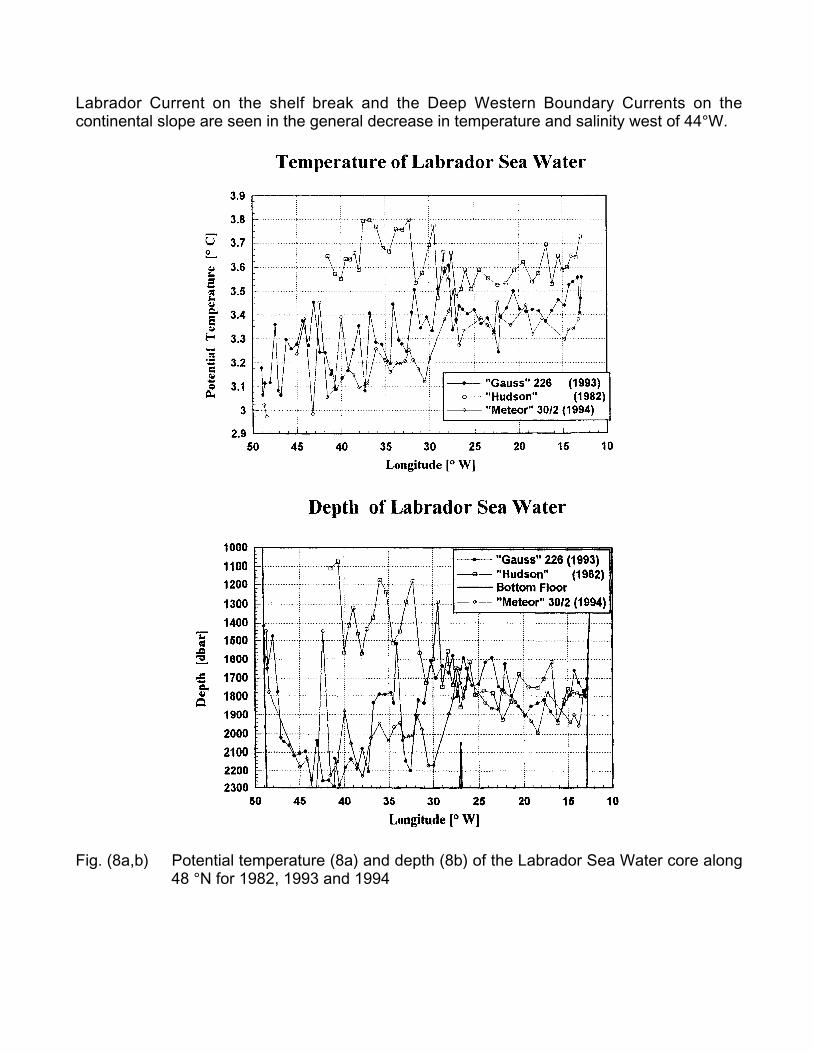
Labrador Current on the shelf break and the Deep Western Boundary Currents on thecontinental slope are seen in the general decrease in temperature and salinity west of 44°W.
Fig. (8a,b) Potential temperature (8a) and depth (8b) of the Labrador Sea Water core along48 °N for 1982, 1993 and 1994
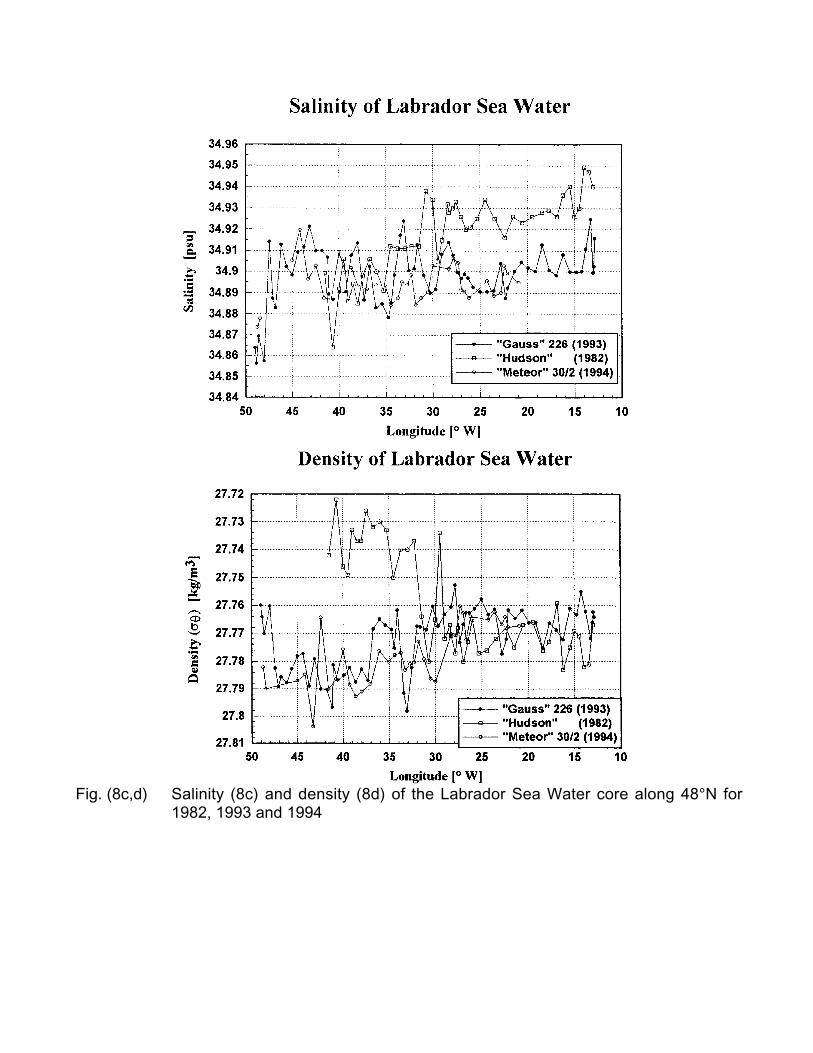
Fig. (8c,d) Salinity (8c) and density (8d) of the Labrador Sea Water core along 48°N for1982, 1993 and 1994
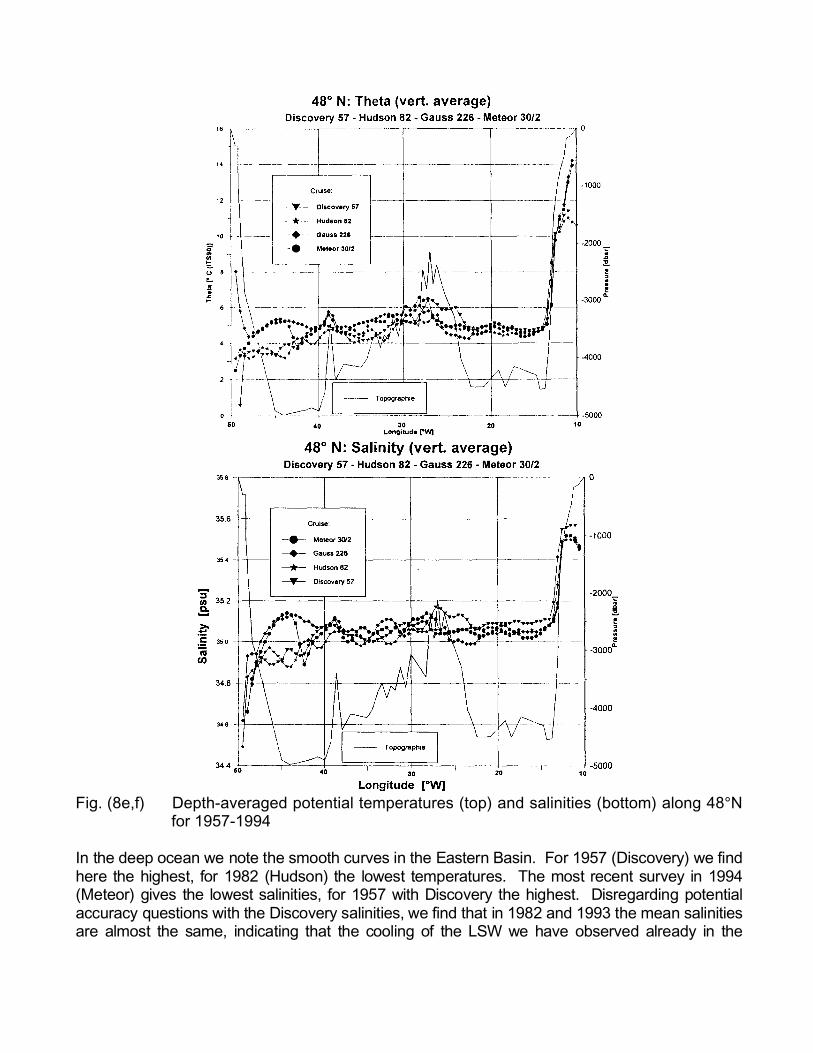
Fig. (8e,f) Depth-averaged potential temperatures (top) and salinities (bottom) along 48°Nfor 1957-1994
In the de ep oce an we note t he smo oth cu rves in the Easter n Basin. Fo r 1957 (Discovery) we findher e the highest, for 1982 (Hudso n) the lowest temp eratur es. The most rece nt sur vey in 1994(Me teor) gives the lo west salinit ies, for 195 7 with Disco very the hig hest. Disre gardin g pote ntialaccuracy questions with the Disco very salinit ies, we find that in 198 2 and 1993 t he mea n salinitiesare almost the same, indica ting that th e cooling of the LSW we have observe d alre ady in the
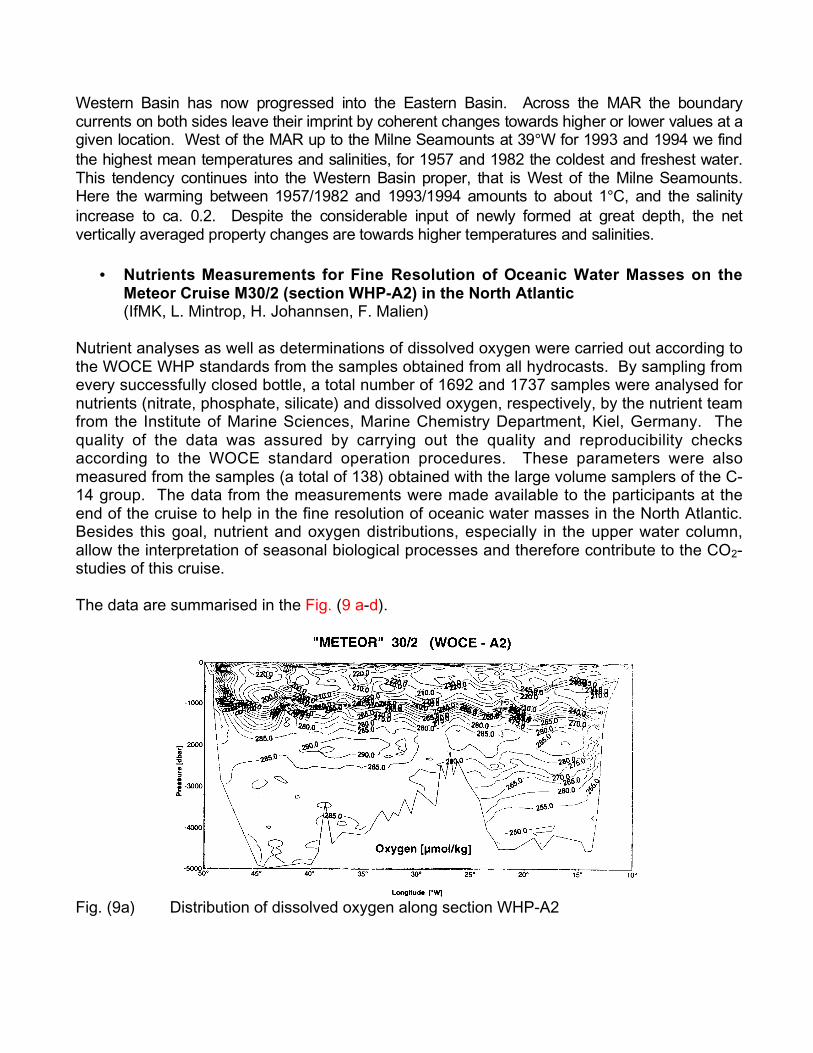
Western Basin has now progr essed into the Eastern Basin. Across the MAR th e boun darycur rents on bot h side s leave their impr int by coher ent ch anges towards high er or lower values at agiven location. West of th e MAR up to the Milne Sea mounts at 39 °W for 199 3 and 1994 we find the highe st mea n temp eratur es and salin ities, for 1957 an d 1982 the coldest and freshest wate r.This tend ency continu es int o the Wester n Basin prop er, th at is West of the Milne Sea mounts.Her e the warmin g between 19 57/198 2 and 1993/1 994 am ounts to abo ut 1°C, and th e salinityincrease to ca. 0.2. Despite the considerable inpu t of newly formed at gre at dep th, th e netver tically aver aged p ropert y chan ges ar e towa rds higher t empera tures and salinities.
• Nutrients Measurements for Fine Resolution of Oceanic Water Masses on theMeteor Cruise M30/2 (section WHP-A2) in the North Atlantic(IfMK, L. Mintrop, H. Johannsen, F. Malien)
Nutrient analyses as well as determinations of dissolved oxygen were carried out according tothe WOCE WHP standards from the samples obtained from all hydrocasts. By sampling fromevery successfully closed bottle, a total number of 1692 and 1737 samples were analysed fornutrients (nitrate, phosphate, silicate) and dissolved oxygen, respectively, by the nutrient teamfrom the Institute of Marine Sciences, Marine Chemistry Department, Kiel, Germany. Thequality of the data was assured by carrying out the quality and reproducibility checksaccording to the WOCE standard operation procedures. These parameters were alsomeasured from the samples (a total of 138) obtained with the large volume samplers of the C-14 group. The data from the measurements were made available to the participants at theend of the cruise to help in the fine resolution of oceanic water masses in the North Atlantic.Besides this goal, nutrient and oxygen distributions, especially in the upper water column,allow the interpretation of seasonal biological processes and therefore contribute to the CO2-studies of this cruise.
The data are summarised in the Fig. (9 a-d).
Fig. (9a) Distribution of dissolved oxygen along section WHP-A2
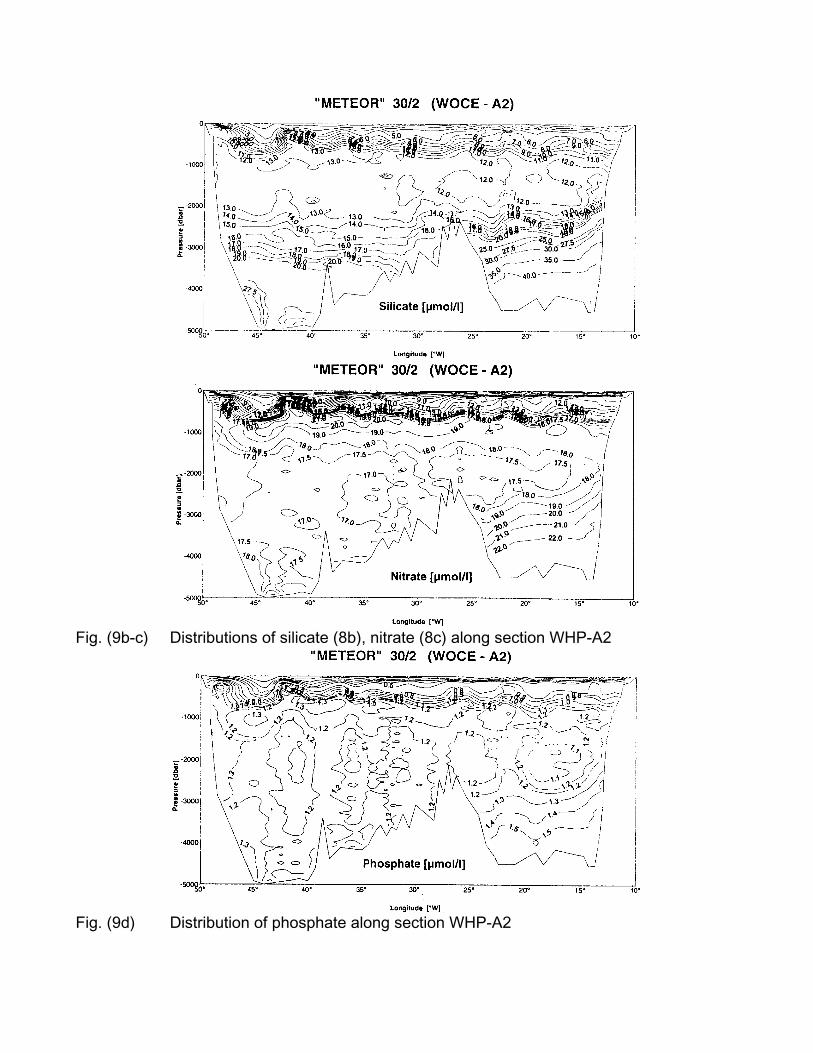
Fig. (9b-c) Distributions of silicate (8b), nitrate (8c) along section WHP-A2
Fig. (9d) Distribution of phosphate along section WHP-A2
• CFCs on the WHP section A2(IUP-B, W. Roether, A. Putzka, K. Bulsiewicz, C. Rüth, H. Rose)
Operational Details
The CFC analyses are performed onboard. Except for shallower areas almost each stationwas sampled at up to 36 levels. The CFC samples were drawn from 10 liter Niskin bottles onlarge glass syringes. During sampling the contamination with ambient CFC had to be avoidedand controlled. In all 1062 analyses for F11, F12, F113 and 978 analyses for CCl4 have beenperformed, and the data were evaluated preliminary at sea.
The investigated tracers are the man-made chlorofluorocarbons (CFC) F11, F12, F113 andcarbon tetrachloride CCl4. Their time-dependent input at the ocean surface is known. Thetracer concentration of the surface water is altered by mixing processes when the waterdescends to deeper levels of the ocean. Measuring the concentration of the tracers deliversinformation about time scales of ventilation processes of subsurface water. The atmosphericF11 and F12 contents increase monotonously with different rates since the forties. CCl4increases since 1920 while F113 started to increase in 1970. Hence the concentration ratiosof the different tracers vary over wide time ranges and can be used to indicate the 'age' ofwater masses (age since leaving the surface). 'Younger' water is tagged with higher CFCconcentration compared with 'older' water.
SamplingSamples were taken according to the WOCE scheme.
CFCs: glass syringes, on 45 of 53 hydrographic stations 1048 samples were taken andmeasured on board.
Helium: 80 helium samples in copper tubes for on shore extraction, intercalibration purposes.Samples to be measured on shore.
Measurements:All CFC measurements were done using a gas-chromatographic system especially improvedbecause of problems with the analysis of F113 (chromatographic interference with CH3I). Thesystem is now equipped with a new designed micro-trap for collecting the different gasespurged from a water sample, a special pre-column to improve especially the resolutionbetween CH3I and F113 and a electronic pressure regulator for a better baseline stability. Dueto these changes we were able to measure F113 with sufficient chromatographic resolutionand to produce for the first time a high quality set of measurements for the whole section.
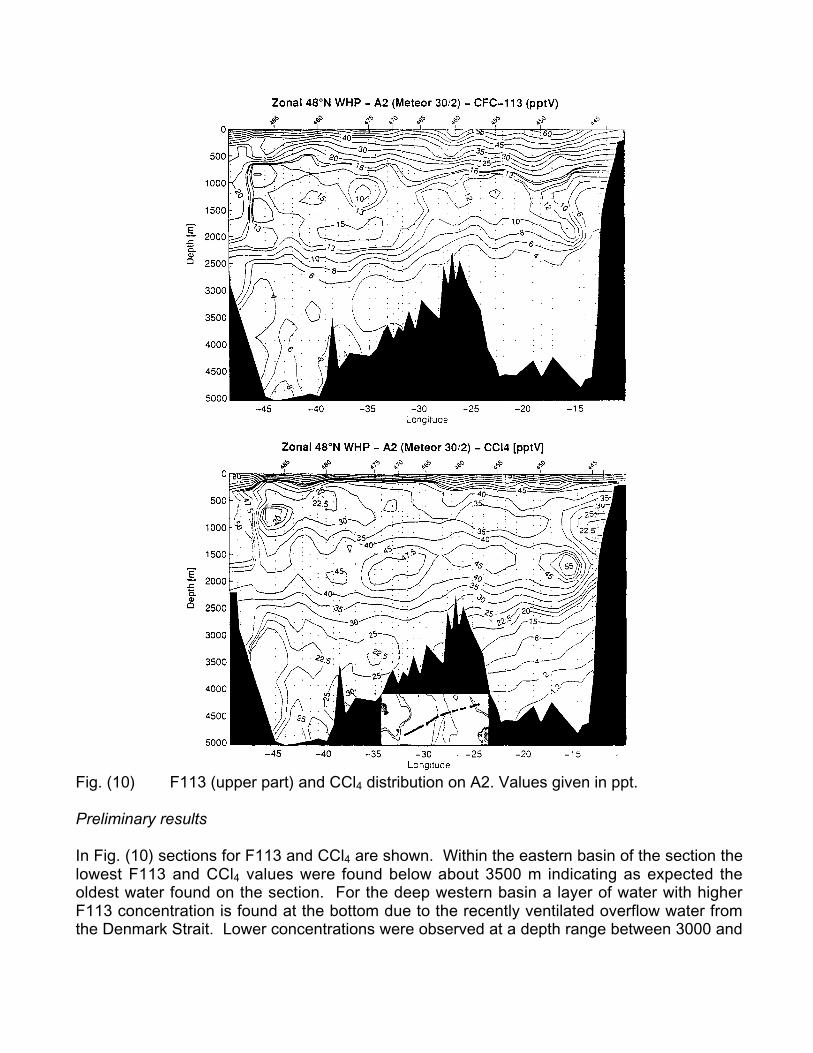
Fig. (10) F113 (upper part) and CCl4 distribution on A2. Values given in ppt.
Preliminary results
In Fig. (10) sections for F113 and CCl4 are shown. Within the eastern basin of the section thelowest F113 and CCl4 values were found below about 3500 m indicating as expected theoldest water found on the section. For the deep western basin a layer of water with higherF113 concentration is found at the bottom due to the recently ventilated overflow water fromthe Denmark Strait. Lower concentrations were observed at a depth range between 3000 and
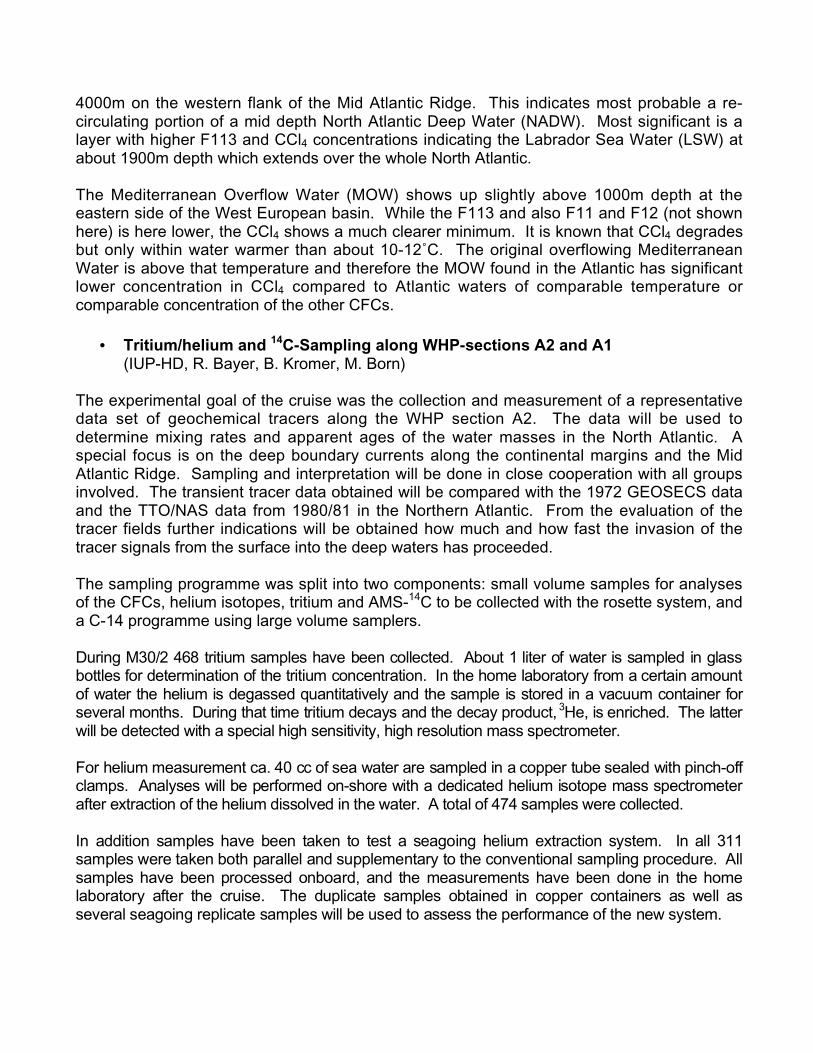
4000m on the western flank of the Mid Atlantic Ridge. This indicates most probable a re-circulating portion of a mid depth North Atlantic Deep Water (NADW). Most significant is alayer with higher F113 and CCl4 concentrations indicating the Labrador Sea Water (LSW) atabout 1900m depth which extends over the whole North Atlantic.
The Mediterranean Overflow Water (MOW) shows up slightly above 1000m depth at theeastern side of the West European basin. While the F113 and also F11 and F12 (not shownhere) is here lower, the CCl4 shows a much clearer minimum. It is known that CCl4 degradesbut only within water warmer than about 10-12˚C. The original overflowing MediterraneanWater is above that temperature and therefore the MOW found in the Atlantic has significantlower concentration in CCl4 compared to Atlantic waters of comparable temperature orcomparable concentration of the other CFCs.
• Tritium/helium and 14C-Sampling along WHP-sections A2 and A1(IUP-HD, R. Bayer, B. Kromer, M. Born)
The experimental goal of the cruise was the collection and measurement of a representativedata set of geochemical tracers along the WHP section A2. The data will be used todetermine mixing rates and apparent ages of the water masses in the North Atlantic. Aspecial focus is on the deep boundary currents along the continental margins and the MidAtlantic Ridge. Sampling and interpretation will be done in close cooperation with all groupsinvolved. The transient tracer data obtained will be compared with the 1972 GEOSECS dataand the TTO/NAS data from 1980/81 in the Northern Atlantic. From the evaluation of thetracer fields further indications will be obtained how much and how fast the invasion of thetracer signals from the surface into the deep waters has proceeded.
The sampling programme was split into two components: small volume samples for analysesof the CFCs, helium isotopes, tritium and AMS-14C to be collected with the rosette system, anda C-14 programme using large volume samplers.
During M30/2 468 tritium samples have been collected. About 1 liter of water is sampled in glassbottles for determination of the tritium concentration. In the home laboratory from a certain amountof water the helium is degassed quantitatively and the sample is stored in a vacuum container forseveral months. During that time tritium decays and the decay product, 3He, is enriched. The latterwill be detected with a special high sensitivity, high resolution mass spectrometer.
For helium measurement ca. 40 cc of sea water are sampled in a copper tube sealed with pinch-offclamps. Analyses will be performed on-shore with a dedicated helium isotope mass spectrometerafter extraction of the helium dissolved in the water. A total of 474 samples were collected.
In addition sam ples have be en taken to test a seago ing he lium extract ion system. In all 311sam ples were ta ken bo th par allel and su ppleme ntary to the conve ntiona l samp ling p rocedu re. Allsam ples have be en pro cessed onboa rd, an d the measur ements have been done in the homelab orator y afte r the cruise . The duplicate samples obtained in coppe r cont ainers as we ll asseveral seagoin g replicate sample s will be used to assess the p erform ance o f the new system.
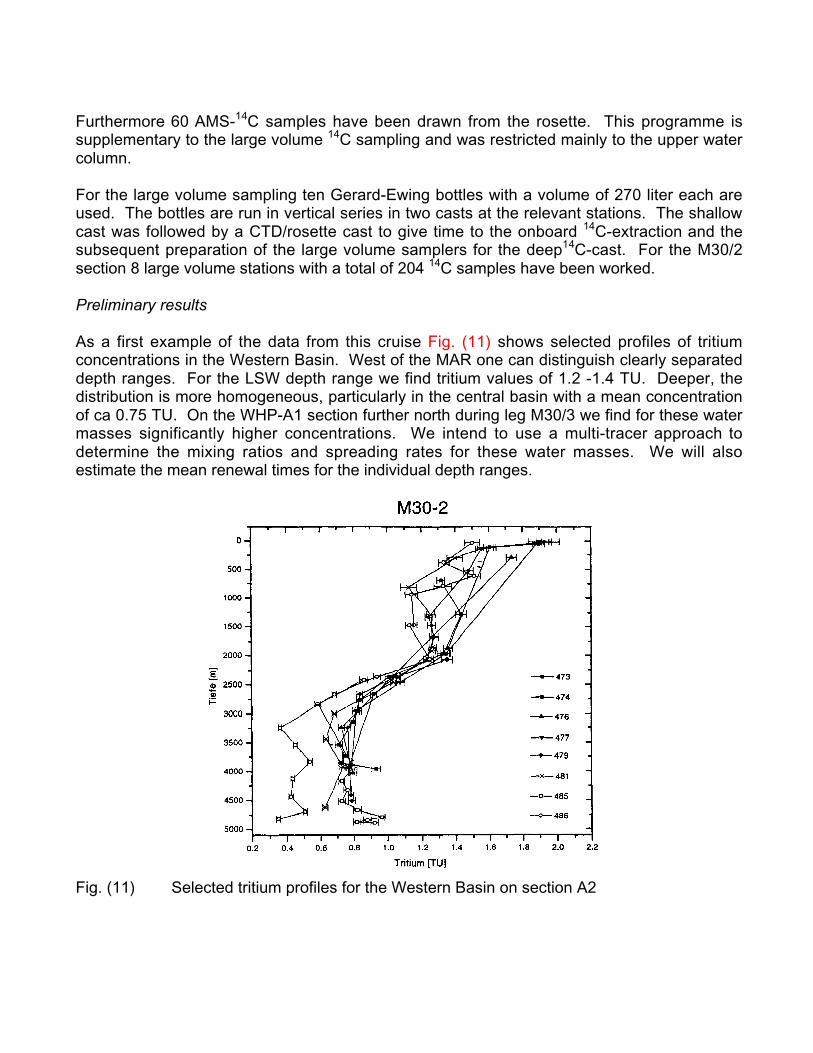
Furthermore 60 AMS-14C samples have been drawn from the rosette. This programme issupplementary to the large volume 14C sampling and was restricted mainly to the upper watercolumn.
For the large volume sampling ten Gerard-Ewing bottles with a volume of 270 liter each areused. The bottles are run in vertical series in two casts at the relevant stations. The shallowcast was followed by a CTD/rosette cast to give time to the onboard 14C-extraction and thesubsequent preparation of the large volume samplers for the deep14C-cast. For the M30/2section 8 large volume stations with a total of 204 14C samples have been worked.
Preliminary results
As a first example of the data from this cruise Fig. (11) shows selected profiles of tritiumconcentrations in the Western Basin. West of the MAR one can distinguish clearly separateddepth ranges. For the LSW depth range we find tritium values of 1.2 -1.4 TU. Deeper, thedistribution is more homogeneous, particularly in the central basin with a mean concentrationof ca 0.75 TU. On the WHP-A1 section further north during leg M30/3 we find for these watermasses significantly higher concentrations. We intend to use a multi-tracer approach todetermine the mixing ratios and spreading rates for these water masses. We will alsoestimate the mean renewal times for the individual depth ranges.
Fig. (11) Selected tritium profiles for the Western Basin on section A2
5.2.2 Mooring recovery on WHP- A2 and WHP-A1(BSH, K.P. Koltermann and IfMHH, J. Meincke)
During the Gauss cruise no 226 in the summer of 1993 three moorings were deployed west of theMid Atlantic Ridge on the WOCE section A2 to measure the fluctuations and spatial extent of adeep salinity maximum. These moorings could not be turned around in the summer of 1994 andthus a recovery was planned as part of this cruise. Two of the three moorings could be interrogatedacoustically, one failed to answer. An attempt to dredge for the mooring K1 in a weather lull was notsuccessful. Weather changes prevented other attempts to recover these moorings.
In summer 1995 the mooring K3 was completely and the mooring K1 partially recovered fromRV Gauss by dredging. The mooring K2 could not recovered. From K3 some 640 days ofdata are now available.
The recovery attempts for the mooring D2 on leg M30/3 by dredging was not successful.Further attempts for dredging operations for other moorings had to be cancelled because ofthe prevailing weather and time constraints.
5.2.3 Physical, Chemical and Tracer Oceanography on Leg M30/3
• Hydrographic Measurements on WHP-A1(BSH, A. Sy)
Hydrographic casts were carried out with a NBIS MK-IIIB CTDO2 unit (internal name: "DHI-1")mounted on a GO rosette frame with 24 x 10 litre Niskin bottles and owned by BSH. Themean constant maximum descent rate was 1 m/s. CTDO2 data were collected at a rate of 64ms/cycle using a PC based (HP Vectra 486) data acquisition software (CZHEAD rev. 18)designed by BSH. A video tape unit was used as a backup system on each cast. Hardwareand software instrumentation ran without serious problems during the whole cruise leg. Therosette system used proved to be well adapted to the CTD unit, and thus only few trippingfailures encountered.
Both pressure and temperature (ITS90) were calibrated before (Sept./Oct. 1994) and after thecruise (February 1995) by the calibration facilities at IfM Kiel. The post cruise pressurecalibration needed to be repeated in November 1995 due to uncertainties with results from theFebruary calibration. Salinity was calibrated by comparison of CTD with sample salinities. 24SIS digital temperature meters (RTM 4002) and 7 SIS digital pressure meters (RPM 6000),calibrated by the manufacturer in October 1994, were used in a rotating mode throughout thiscruise leg to control the CTD sensors' stability. DSRT readings, along with salinity, oxygenand chemical data from the rosette water samples, were also used to detect erroneous depthsof bottle firings. Unfortunately, 7 DSRTs were destroyed at the ship's side by heavy sea.
The bottle sampling sequence was as follows. Oxygen samples were collected soon after theCTD system was brought on board and after CFC and 3He were drawn. The sample watertemperature was measured immediately after the oxygen sample was drawn. The nextsamples drawn were TCO2, 14C, 3H, nutrients (NO2 + NO3, SIO3, PO4), and salinity. All bottle
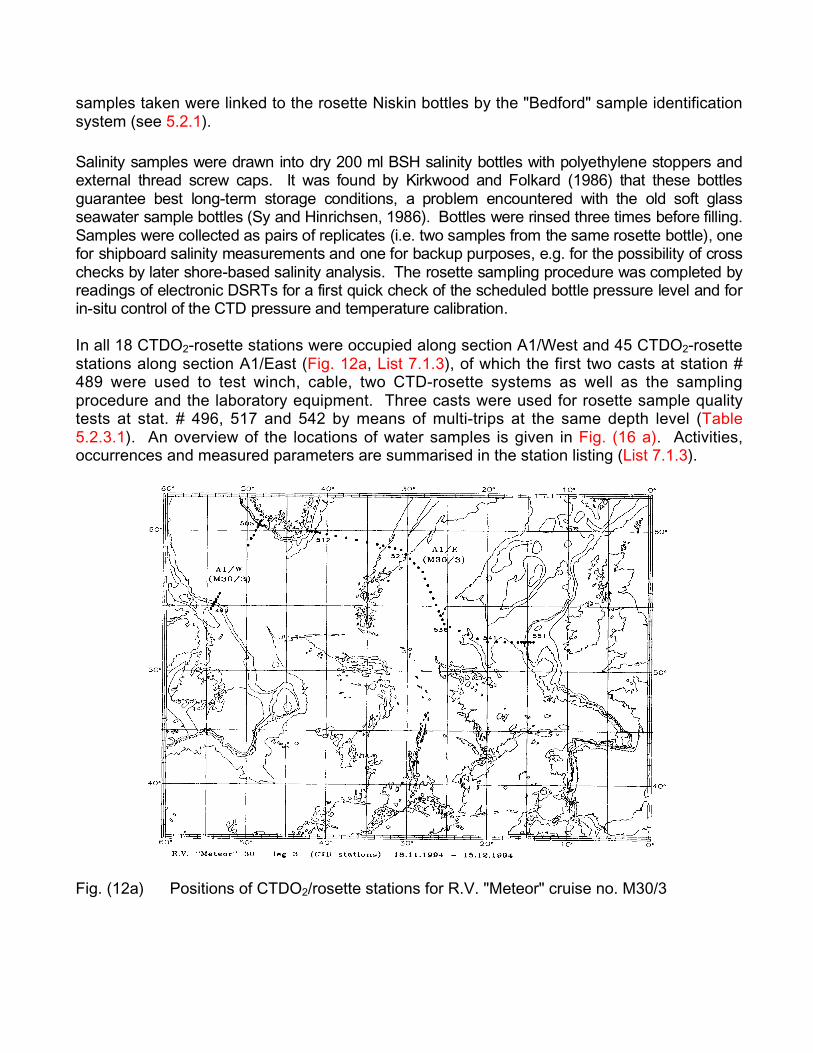
samples taken were linked to the rosette Niskin bottles by the "Bedford" sample identificationsystem (see 5.2.1).
Salinity sample s were drawn into dry 20 0 ml BSH salinity bottle s with polye thylen e stop pers andext ernal thread screw caps. It was fou nd by Kirkwo od and Folkard (1986) that these bottlesgua rantee best long-t erm st orage condit ions, a prob lem en counte red with the old soft glasssea water sample bottles (Sy and Hin richse n, 198 6). Bottles were rinsed three times befor e filling.Sam ples were co llecte d as pairs o f replicates (i.e. two samples from the sa me rosette bottle) , onefor shipb oard salinit y measuremen ts and one f or backup pu rposes, e.g. for the possibility of crossche cks by later shore -based salin ity an alysis. The roset te sam pling proced ure wa s comp leted byrea dings of ele ctronic DSRTs for a fir st quick che ck of the schedule d bott le pre ssure level and fo rin- situ control of th e CTD pressu re and tempe rature calib ration .
In all 18 CTDO2-rosette stations were occupied along section A1/West and 45 CTDO2-rosettestations along section A1/East (Fig. 12a, List 7.1.3), of which the first two casts at station #489 were used to test winch, cable, two CTD-rosette systems as well as the samplingprocedure and the laboratory equipment. Three casts were used for rosette sample qualitytests at stat. # 496, 517 and 542 by means of multi-trips at the same depth level (Table5.2.3.1). An overview of the locations of water samples is given in Fig. (16 a). Activities,occurrences and measured parameters are summarised in the station listing (List 7.1.3).
Fig. (12a) Positions of CTDO2/rosette stations for R.V. "Meteor" cruise no. M30/3
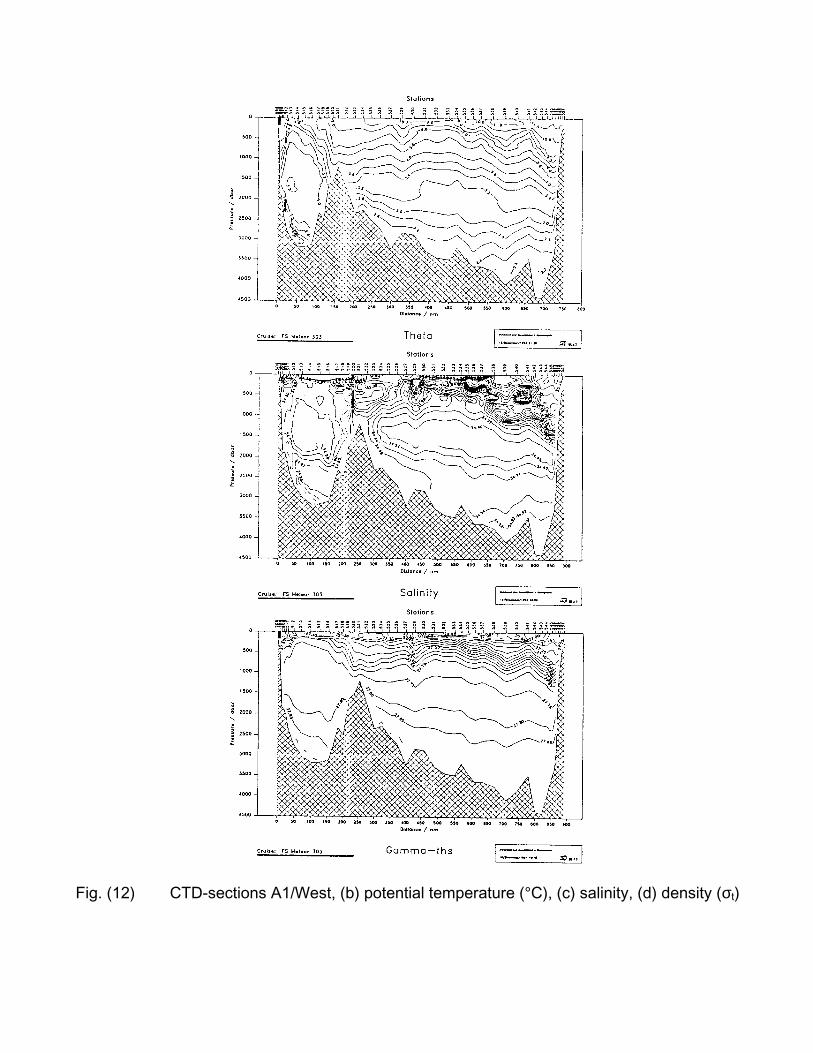
Fig. (12) CTD-sections A1/West, (b) potential temperature (°C), (c) salinity, (d) density (σt)
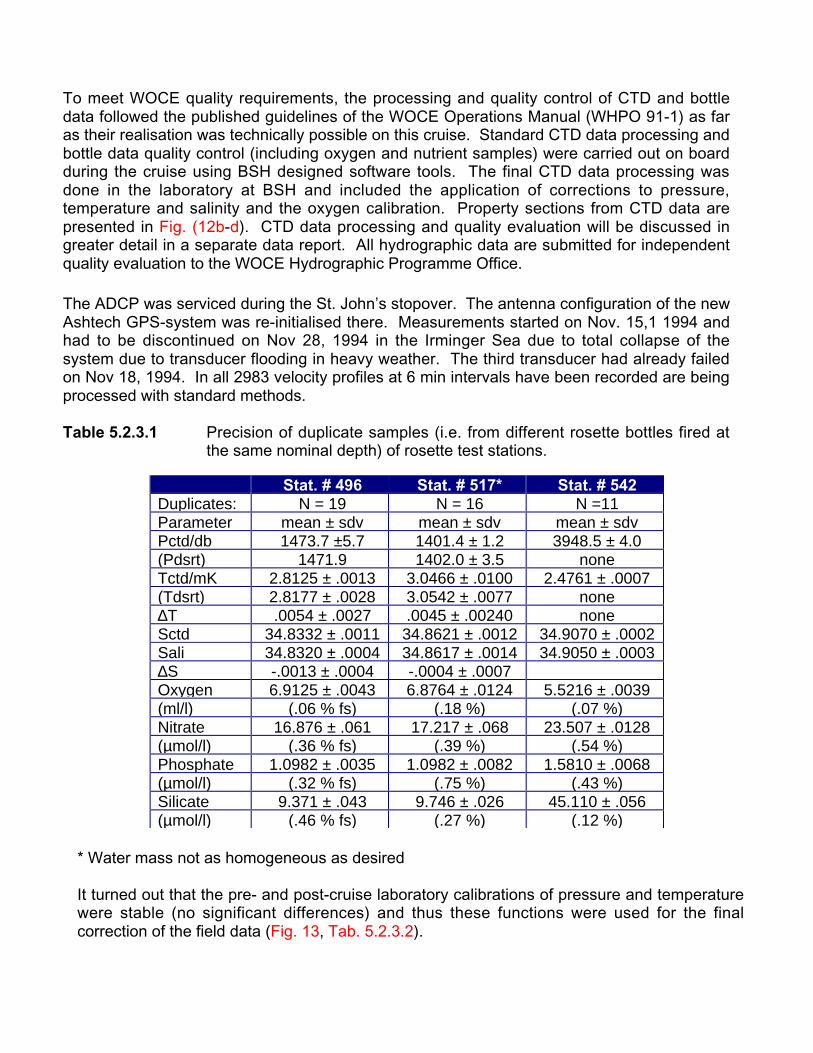
To meet WOCE quality requirements, the processing and quality control of CTD and bottledata followed the published guidelines of the WOCE Operations Manual (WHPO 91-1) as faras their realisation was technically possible on this cruise. Standard CTD data processing andbottle data quality control (including oxygen and nutrient samples) were carried out on boardduring the cruise using BSH designed software tools. The final CTD data processing wasdone in the laboratory at BSH and included the application of corrections to pressure,temperature and salinity and the oxygen calibration. Property sections from CTD data arepresented in Fig. (12b-d). CTD data processing and quality evaluation will be discussed ingreater detail in a separate data report. All hydrographic data are submitted for independentquality evaluation to the WOCE Hydrographic Programme Office.
The ADCP was serviced during the St. John’s stopover. The antenna configuration of the newAshtech GPS-system was re-initialised there. Measurements started on Nov. 15,1 1994 andhad to be discontinued on Nov 28, 1994 in the Irminger Sea due to total collapse of thesystem due to transducer flooding in heavy weather. The third transducer had already failedon Nov 18, 1994. In all 2983 velocity profiles at 6 min intervals have been recorded are beingprocessed with standard methods.
Table 5.2.3.1 Precision of duplicate samples (i.e. from different rosette bottles fired atthe same nominal depth) of rosette test stations.
* Water mass not as homogeneous as desired
It turned out that the pre- and post-cruise laboratory calibrations of pressure and temperaturewere stable (no significant differences) and thus these functions were used for the finalcorrection of the field data (Fig. 13, Tab. 5.2.3.2).
Stat. # 496 Stat. # 517* Stat. # 542Duplicates: N = 19 N = 16 N =11Parameter mean ± sdv mean ± sdv mean ± sdvPctd/db 1473.7 ±5.7 1401.4 ± 1.2 3948.5 ± 4.0(Pdsrt) 1471.9 1402.0 ± 3.5 noneTctd/mK 2.8125 ± .0013 3.0466 ± .0100 2.4761 ± .0007(Tdsrt) 2.8177 ± .0028 3.0542 ± .0077 none∆T .0054 ± .0027 .0045 ± .00240 noneSctd 34.8332 ± .0011 34.8621 ± .0012 34.9070 ± .0002Sali 34.8320 ± .0004 34.8617 ± .0014 34.9050 ± .0003∆S -.0013 ± .0004 -.0004 ± .0007Oxygen 6.9125 ± .0043 6.8764 ± .0124 5.5216 ± .0039(ml/l) (.06 % fs) (.18 %) (.07 %)Nitrate 16.876 ± .061 17.217 ± .068 23.507 ± .0128(µmol/l) (.36 % fs) (.39 %) (.54 %)Phosphate 1.0982 ± .0035 1.0982 ± .0082 1.5810 ± .0068(µmol/l) (.32 % fs) (.75 %) (.43 %)Silicate 9.371 ± .043 9.746 ± .026 45.110 ± .056(µmol/l) (.46 % fs) (.27 %) (.12 %)
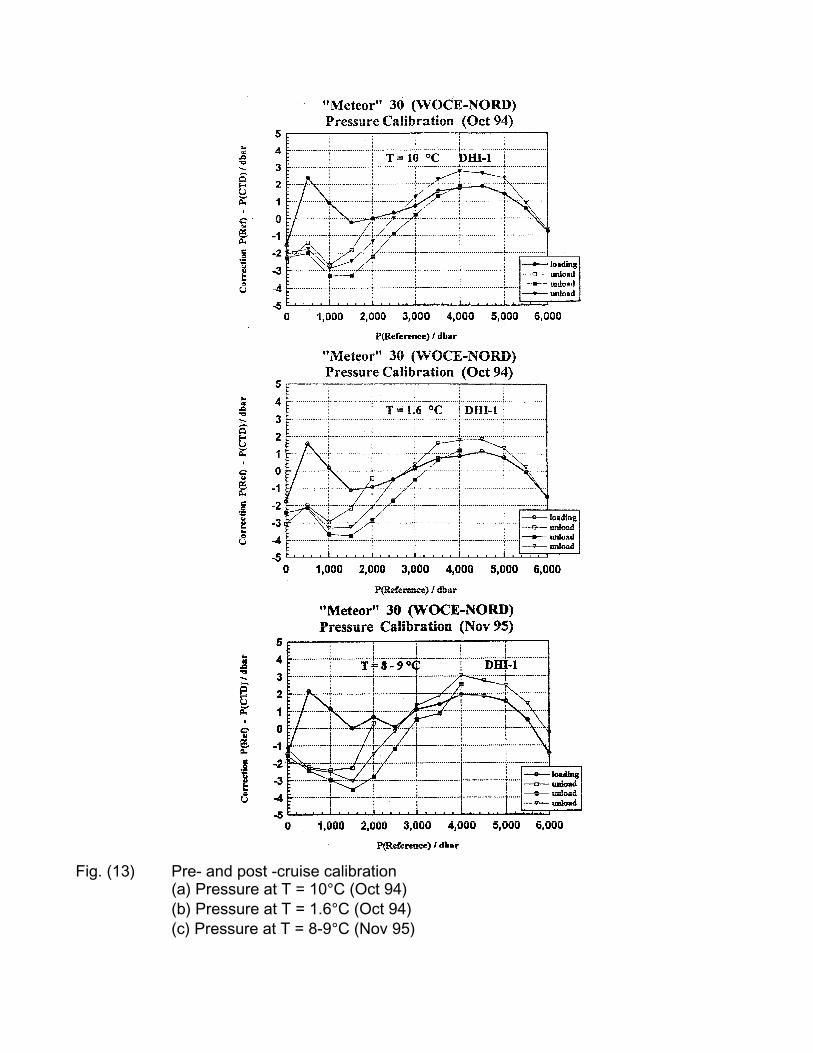
Fig. (13) Pre- and post -cruise calibration(a) Pressure at T = 10°C (Oct 94)(b) Pressure at T = 1.6°C (Oct 94)(c) Pressure at T = 8-9°C (Nov 95)
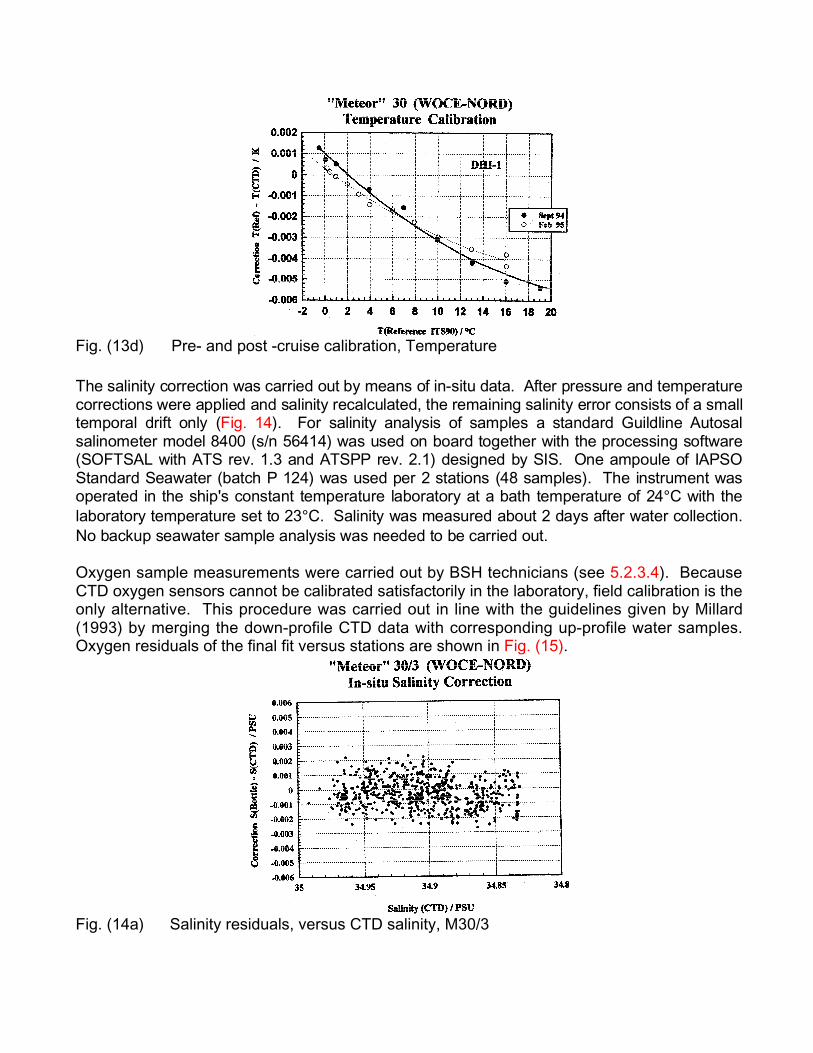
Fig. (13d) Pre- and post -cruise calibration, Temperature
T he salinity co rr ectio n was car r ie d out b y mea ns of in- sit u dat a. Aft er pr essu r e an d t em pe r at ur e cor re ct ion s wer e ap p lied an d sa linit y r ecalculat e d, t he re ma ining sa linit y er ro r con sists o f a sm allt em po ra l drif t on ly (F ig . 14) . Fo r salin it y ana lysis of sam p le s a sta nd a rd G uild lin e Aut osalsalin om e te r mod el 84 00 (s/n 564 1 4) wa s used on bo ar d to g et he r wit h the pr ocessin g so f twar e( SO FT SAL wit h ATS re v. 1. 3 an d ATSPP re v. 2. 1) de sign ed by SI S. On e amp o ule of IAPSO Sta nd ar d Sea wat er (b at ch P 12 4) wa s use d pe r 2 st at io ns (4 8 sam ples) . Th e in st r um en t waso pe ra te d in the ship 's co nsta nt te mp e ra tu re la bo r at or y at a bat h te m pe ra t ur e of 24 ° C wit h the lab or at o ry te mp er at u re se t to 23 ° C. Salinity wa s me a su re d abo ut 2 da ys af te r wat e r co lle ct io n .No ba cku p se a wa te r sam ple a na lysis wa s ne ed e d to be car r ie d out .
Oxygen sample measurements were carried out by BSH technicians (see 5.2.3.4). BecauseCTD oxygen sensors cannot be calibrated satisfactorily in the laboratory, field calibration is theonly alternative. This procedure was carried out in line with the guidelines given by Millard(1993) by merging the down-profile CTD data with corresponding up-profile water samples.Oxygen residuals of the final fit versus stations are shown in Fig. (15).
Fig. (14a) Salinity residuals, versus CTD salinity, M30/3
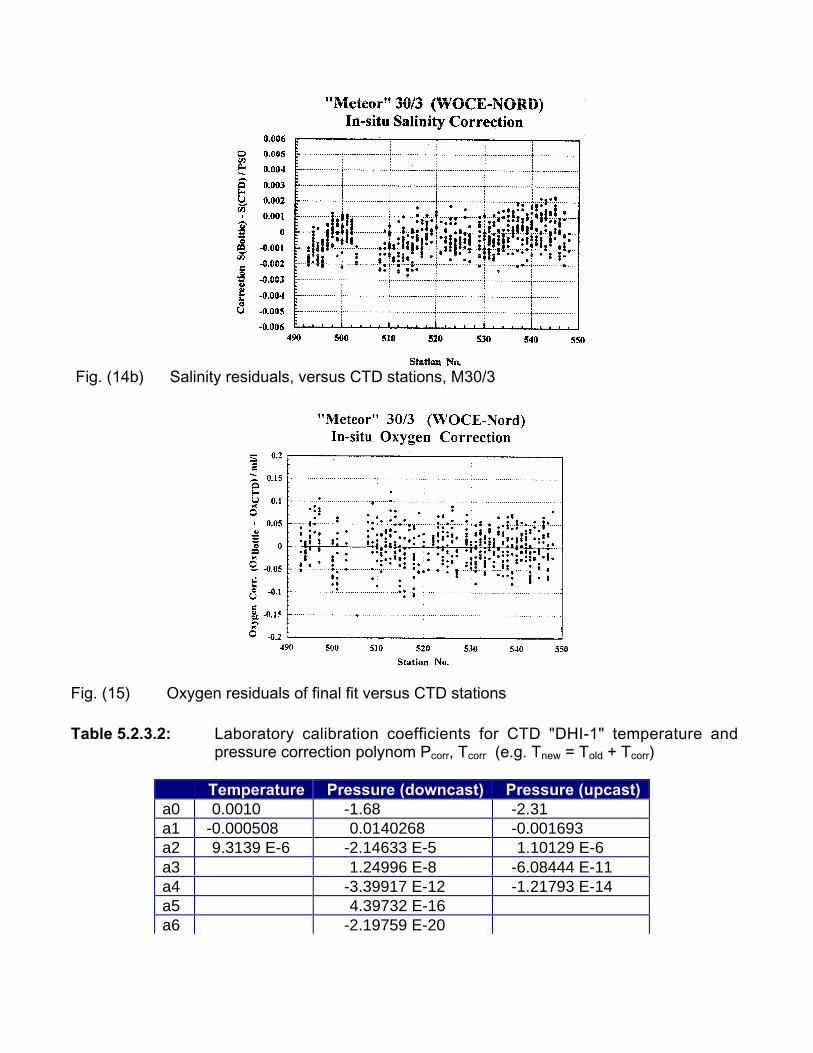
Fig. (14b) Salinity residuals, versus CTD stations, M30/3
Fig. (15) Oxygen residuals of final fit versus CTD stations
Table 5.2.3.2: Laboratory calibration coefficients for CTD "DHI-1" temperature andpressure correction polynom Pcorr, Tcorr (e.g. Tnew = Told + Tcorr)
Temperature Pressure (downcast) Pressure (upcast)a0 0.0010 -1.68 -2.31a1 -0.000508 0.0140268 -0.001693a2 9.3139 E-6 -2.14633 E-5 1.10129 E-6a3 1.24996 E-8 -6.08444 E-11a4 -3.39917 E-12 -1.21793 E-14a5 4.39732 E-16a6 -2.19759 E-20
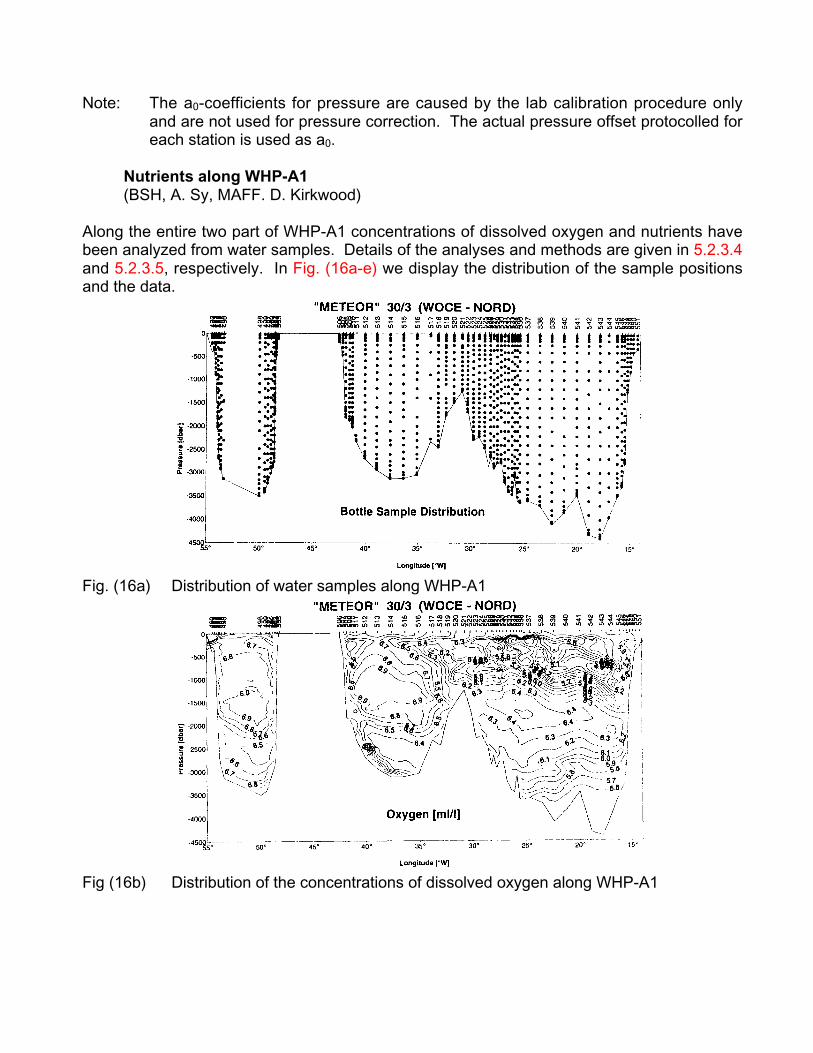
Note: The a0-coefficients for pressure are caused by the lab calibration procedure onlyand are not used for pressure correction. The actual pressure offset protocolled foreach station is used as a0.
Nutrients along WHP-A1(BSH, A. Sy, MAFF. D. Kirkwood)
Along the entire two part of WHP-A1 concentrations of dissolved oxygen and nutrients havebeen analyzed from water samples. Details of the analyses and methods are given in 5.2.3.4and 5.2.3.5, respectively. In Fig. (16a-e) we display the distribution of the sample positionsand the data.
Fig. (16a) Distribution of water samples along WHP-A1
Fig (16b) Distribution of the concentrations of dissolved oxygen along WHP-A1
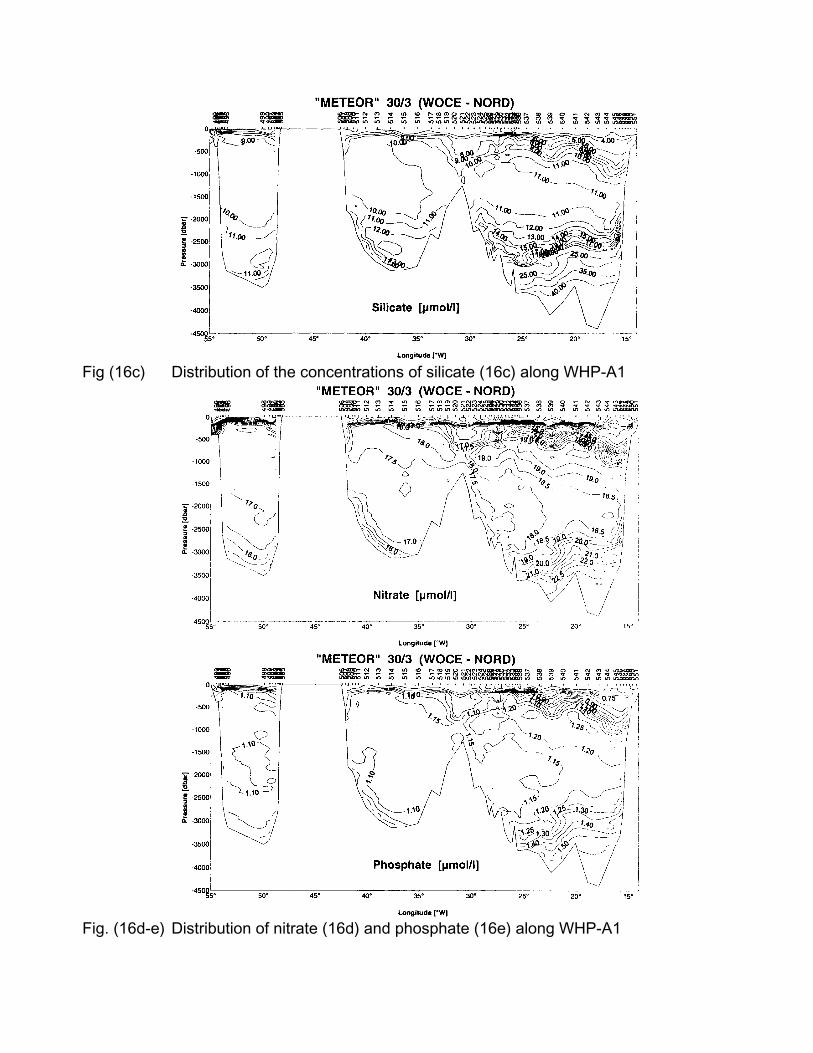
Fig (16c) Distribution of the concentrations of silicate (16c) along WHP-A1
Fig. (16d-e) Distribution of nitrate (16d) and phosphate (16e) along WHP-A1
• Spreading of Newly Formed Labrador Sea Water(BSH, A. Sy)
As an outstanding event, comparable to the "Great Salinity Anomaly" of the mid 1970s(Dickson et al., 1988), a rapid cooling of the intermediate layer is taking place in the subpolarNorth Atlantic and in the transition zone between the subpolar and subtropical gyres duringthe last years (Koltermann and Sy, 1994). This cooling is attributable to a relatively fastspreading of new modes of LSW.
The comparison of the LSW core temperatures along section A1 for the years 1991, 1992 and1994 (Fig. 17) reveals a clear cooling event in the Irminger Sea in the order of -0.23°C in 3years. It looks as though every year a new mode of LSW arrives in the Irminger Sea ("LSWcascade"). Cooling in the Iceland Basin of -0.1°C also indicates the arrival of renewed LSW.The 3-year cooling rate from the Rockall Trough area was found to show the same value. Butthe arrival of the LSW cascade is probably 1 to 2 years later than that in the Iceland Basin.
For the other parameters we find an increase in density of the LSW of 0.018 kg/m3 for theIrminger Sea and 0.012 kg/m3 for the area east of the MAR (Fig. 18), and a deepening ofLSW which is greatest in the Irminger Sea (250 dbar) and Rockall Trough area (200 dbar)(Fig. 19). However, there is no significant signal in salinity (Fig. 20).
The characteristic property change of the cascade of new LSW modes are cooling anddeepening and only little or no freshening. Another striking but not surprising feature is theseparation, by the Reykjanes Ridge, into two different hydrographic regimes, the Irminger Seaand the Iceland Basin. The erosion of the LSW core east of the central Iceland Basin (27°W)reflects the longer pathway with mixing and enhanced mixing over topography.
These results correspond well with observations of newly formed LSW in the central LabradorSea reported by Lazier (1995). According to his findings, the recent period of LSW formationstarted in 1988. He showed that the characteristic signal of the new LSW period in its sourceregion is the temperature decrease rather than a salinity decrease, and also a distinct densityincrease and deepening.
Becau se of th e similar it y of th e LSW ch ar act er ist ics fo u nd in the La br ad o r an d I rm in ge r Sea s,L azie r et al. ( 1995 ) e st ima te d a cir culatio n t im e o f 8 to 20 mo nths fr om th e ce n tr al La brad o r Se a t o th e cen tr a l I rm in ge r Sea , or a spe ed of 1 to 3 cm /s. Th e pa t hway to the ea st er n Nor t hAtlan tic is much lo n ge r and the ar rival of the LSW sign a l will be ye ar s lat er . If th e circu la tio nsch em e pro po sed by T alle y and M cCar tn e y (1 9 82 ) is ad op t ed , th e n th e wat er in th e Icela nd Basin sh ou ld be o f mor e recen t origin t ha n tha t sou th o f t he Ro ckall T ro u gh . T h e er o sion o f t he L SW cor e e ast o f th e cen t ra l Ice la nd Ba sin is also in dicat ive o f a lon ge r p at hwa y (se e Fig. 20 ).
It is assumed that the LSW observed in December 1994 south of the Rockall Trough is aproduct of the beginning of the cascade of new LSW modes because in 1991 and 1992 nosignificant change was detectable. That was not the case in the Iceland Basin where newLSW arrived earlier.
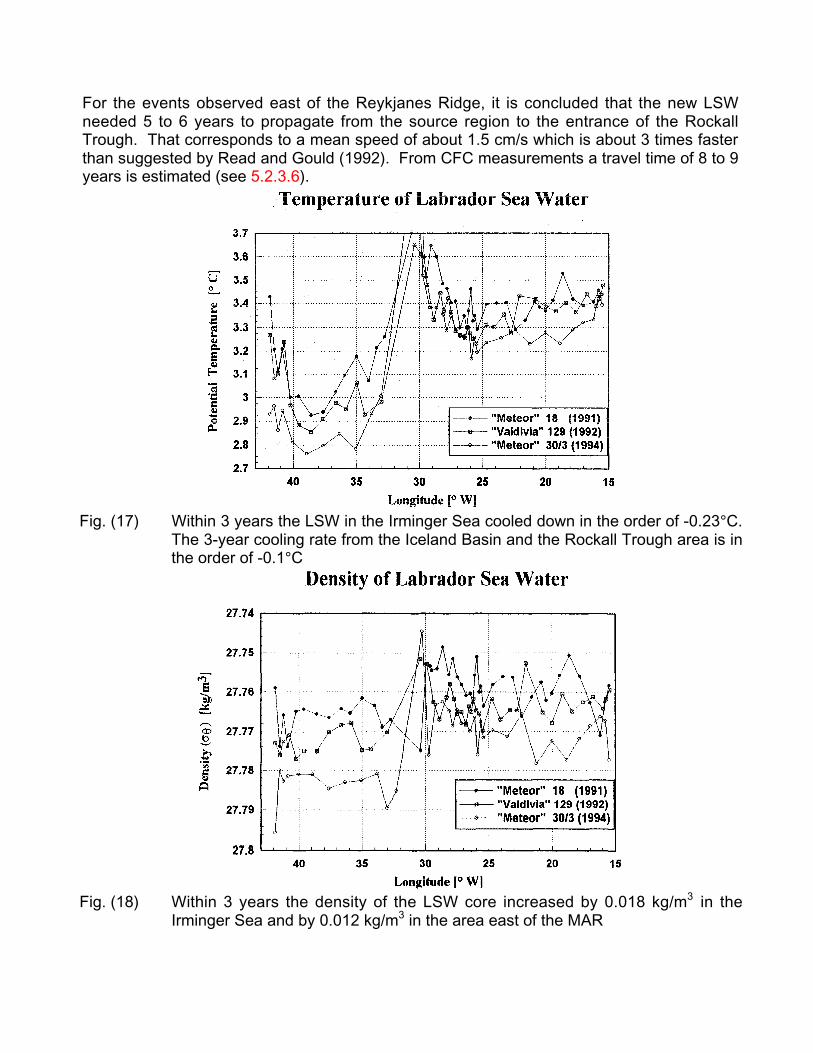
For the events observed east of the Reykjanes Ridge, it is concluded that the new LSWneeded 5 to 6 years to propagate from the source region to the entrance of the RockallTrough. That corresponds to a mean speed of about 1.5 cm/s which is about 3 times fasterthan suggested by Read and Gould (1992). From CFC measurements a travel time of 8 to 9years is estimated (see 5.2.3.6).
Fig. (17) Within 3 years the LSW in the Irminger Sea cooled down in the order of -0.23°C.The 3-year cooling rate from the Iceland Basin and the Rockall Trough area is inthe order of -0.1°C
Fig. (18) Within 3 years the density of the LSW core increased by 0.018 kg/m3 in theIrminger Sea and by 0.012 kg/m3 in the area east of the MAR
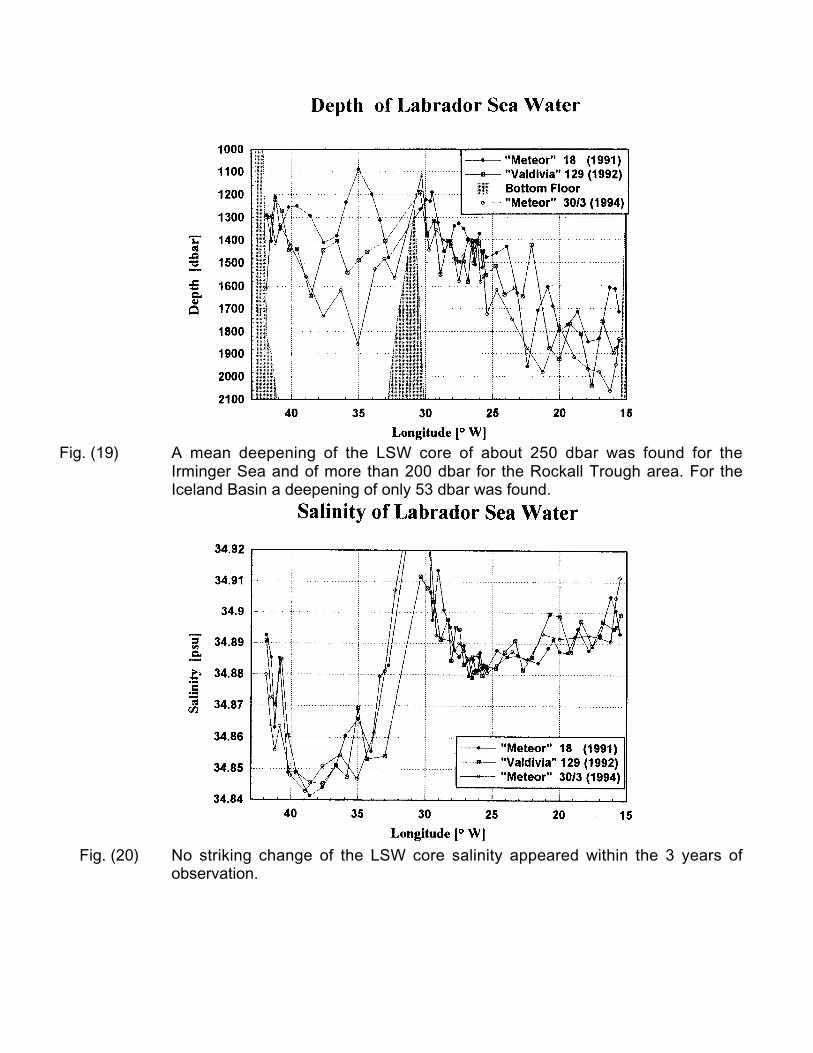
Fig. (19) A mean deepening of the LSW core of about 250 dbar was found for theIrminger Sea and of more than 200 dbar for the Rockall Trough area. For theIceland Basin a deepening of only 53 dbar was found.
Fig. (20) No striking change of the LSW core salinity appeared within the 3 years ofobservation.
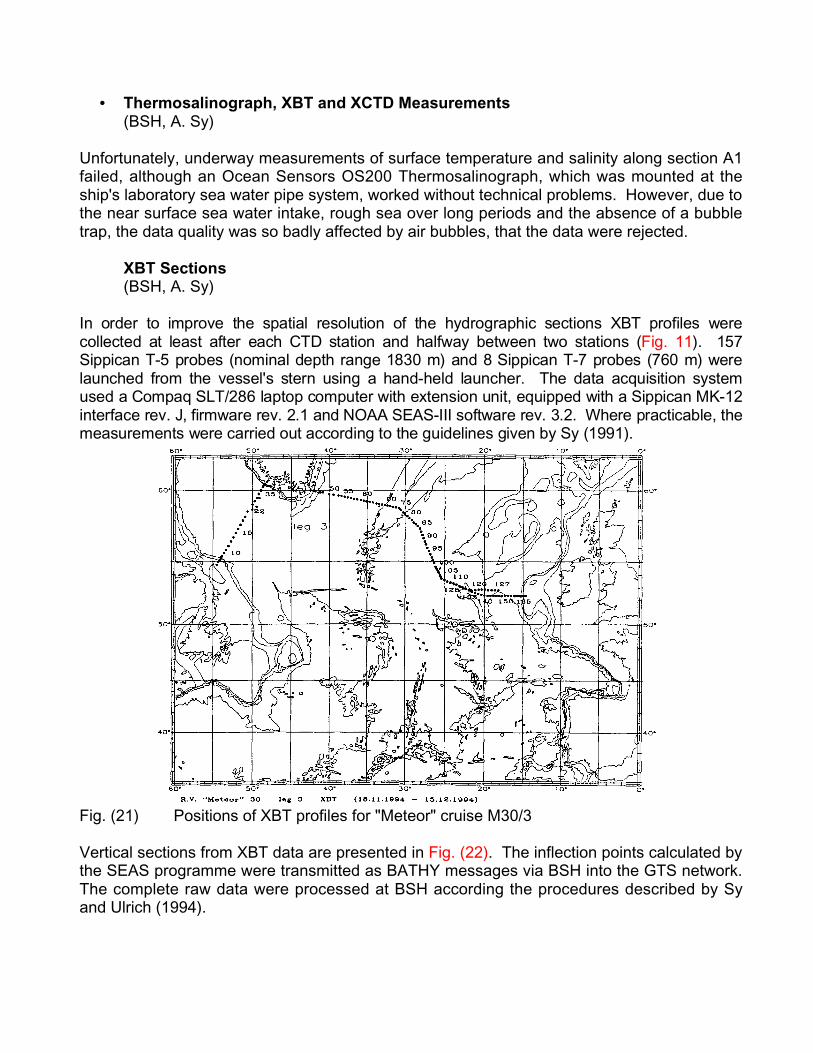
• Thermosalinograph, XBT and XCTD Measurements(BSH, A. Sy)
Unfortunately, underway measurements of surface temperature and salinity along section A1failed, although an Ocean Sensors OS200 Thermosalinograph, which was mounted at theship's laboratory sea water pipe system, worked without technical problems. However, due tothe near surface sea water intake, rough sea over long periods and the absence of a bubbletrap, the data quality was so badly affected by air bubbles, that the data were rejected.
XBT Sections(BSH, A. Sy)
I n or de r to imp ro ve th e spa tial re so lut io n of th e hyd ro g ra ph ic se ct ion s XBT pro f iles we re colle ct e d at le ast aft er ea ch CT D st a tion an d ha lfway be twee n two st at io n s (F ig . 11) . 15 7Sip pica n T-5 pr ob es (n om ina l de p th ra ng e 18 3 0 m) an d 8 Sip pica n T-7 pr ob es (7 60 m) wer e lau nche d fro m the ve ssel' s st er n usin g a ha n d- he ld la un che r. The da ta acqu isit ion syst em u se d a Com pa q SLT /2 8 6 la p to p co m pu te r wit h ext en sio n un it, eq uipp ed with a Sip pica n M K- 1 2int er fa ce re v. J, f irm wa r e re v. 2. 1 and NOAA SEAS-I II so ftwa r e re v. 3. 2. Where pr act icab le , t he m ea su re m en ts we re ca rr ie d o ut a cco rd ing t o the g u id elin e s given b y Sy (1 99 1 ).
Fig. (21) Positions of XBT profiles for "Meteor" cruise M30/3
Vertical sections from XBT data are presented in Fig. (22). The inflection points calculated bythe SEAS programme were transmitted as BATHY messages via BSH into the GTS network.The complete raw data were processed at BSH according the procedures described by Syand Ulrich (1994).
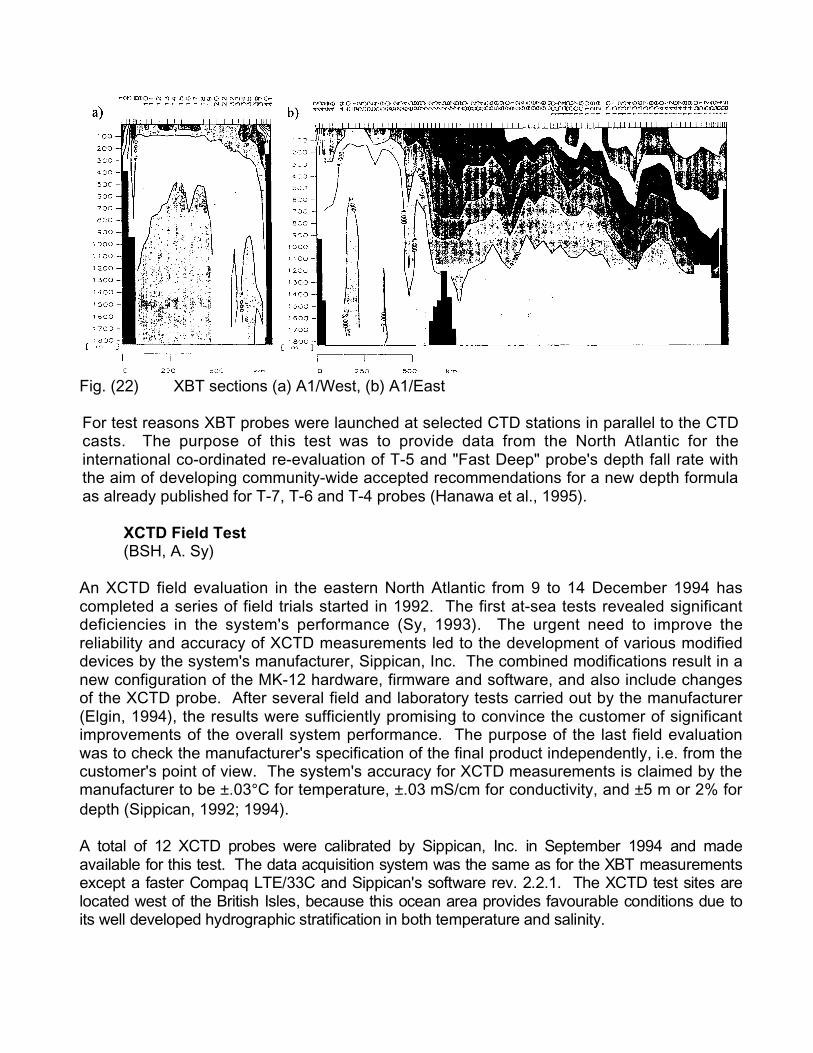
Fig. (22) XBT sections (a) A1/West, (b) A1/East
For test reasons XBT probes were launched at selected CTD stations in parallel to the CTDcasts. The purpose of this test was to provide data from the North Atlantic for theinternational co-ordinated re-evaluation of T-5 and "Fast Deep" probe's depth fall rate withthe aim of developing community-wide accepted recommendations for a new depth formulaas already published for T-7, T-6 and T-4 probes (Hanawa et al., 1995).
XCTD Field Test(BSH, A. Sy)
An XCTD field evaluation in the eastern North Atlantic from 9 to 14 December 1994 hascompleted a series of field trials started in 1992. The first at-sea tests revealed significantdeficiencies in the system's performance (Sy, 1993). The urgent need to improve thereliability and accuracy of XCTD measurements led to the development of various modifieddevices by the system's manufacturer, Sippican, Inc. The combined modifications result in anew configuration of the MK-12 hardware, firmware and software, and also include changesof the XCTD probe. After several field and laboratory tests carried out by the manufacturer(Elgin, 1994), the results were sufficiently promising to convince the customer of significantimprovements of the overall system performance. The purpose of the last field evaluationwas to check the manufacturer's specification of the final product independently, i.e. from thecustomer's point of view. The system's accuracy for XCTD measurements is claimed by themanufacturer to be ±.03°C for temperature, ±.03 mS/cm for conductivity, and ±5 m or 2% fordepth (Sippican, 1992; 1994).
A total of 12 XCTD pr obes were ca librat ed by Sip pican, Inc. in Sep tember 1994 and ma deava ilable for this te st. T he dat a acqu isitio n syst em was the same as for the XBT measu rement sexcept a faster Compa q LTE/ 33C an d Sip pican' s soft ware rev. 2. 2.1. The XCTD test site s arelocated west of the British Isles, beca use th is oce an are a provides favoura ble co nditio ns due toits well develo ped hydrogra phic stratif icatio n in b oth te mperat ure an d salinity.
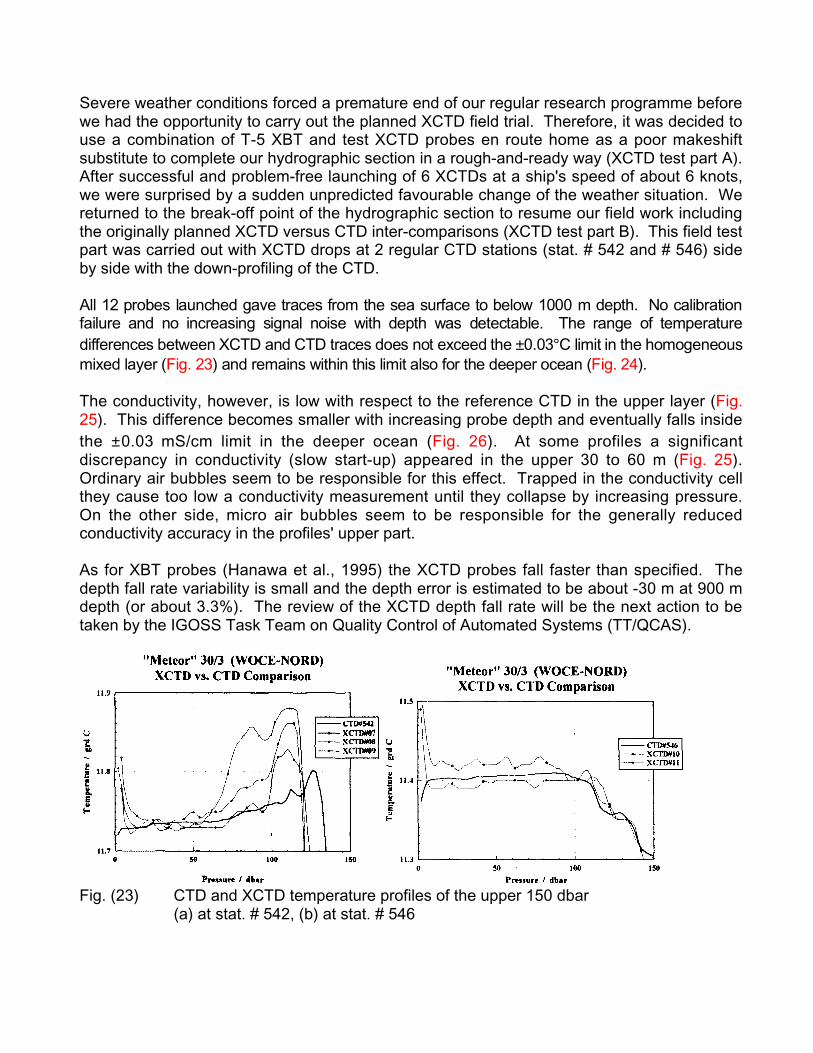
Severe weather conditions forced a premature end of our regular research programme beforewe had the opportunity to carry out the planned XCTD field trial. Therefore, it was decided touse a combination of T-5 XBT and test XCTD probes en route home as a poor makeshiftsubstitute to complete our hydrographic section in a rough-and-ready way (XCTD test part A).After successful and problem-free launching of 6 XCTDs at a ship's speed of about 6 knots,we were surprised by a sudden unpredicted favourable change of the weather situation. Wereturned to the break-off point of the hydrographic section to resume our field work includingthe originally planned XCTD versus CTD inter-comparisons (XCTD test part B). This field testpart was carried out with XCTD drops at 2 regular CTD stations (stat. # 542 and # 546) sideby side with the down-profiling of the CTD.
All 12 probes launched gave traces from the sea surface to below 1000 m depth. No calibrationfailure and no increasing signal noise with depth was detectable. The range of temperaturedifferences between XCTD and CTD traces does not exceed the ±0.03°C limit in the homogeneousmixed layer (Fig. 23) and remains within this limit also for the deeper ocean (Fig. 24).
The conductivity, however, is low with respect to the reference CTD in the upper layer (Fig.25). This difference becomes smaller with increasing probe depth and eventually falls insidethe ±0.03 mS/cm limit in the deeper ocean (Fig. 26). At some profiles a significantdiscrepancy in conductivity (slow start-up) appeared in the upper 30 to 60 m (Fig. 25).Ordinary air bubbles seem to be responsible for this effect. Trapped in the conductivity cellthey cause too low a conductivity measurement until they collapse by increasing pressure.On the other side, micro air bubbles seem to be responsible for the generally reducedconductivity accuracy in the profiles' upper part.
As for XBT probes (Hanawa et al., 1995) the XCTD probes fall faster than specified. Thedepth fall rate variability is small and the depth error is estimated to be about -30 m at 900 mdepth (or about 3.3%). The review of the XCTD depth fall rate will be the next action to betaken by the IGOSS Task Team on Quality Control of Automated Systems (TT/QCAS).
Fig. (23) CTD and XCTD temperature profiles of the upper 150 dbar(a) at stat. # 542, (b) at stat. # 546
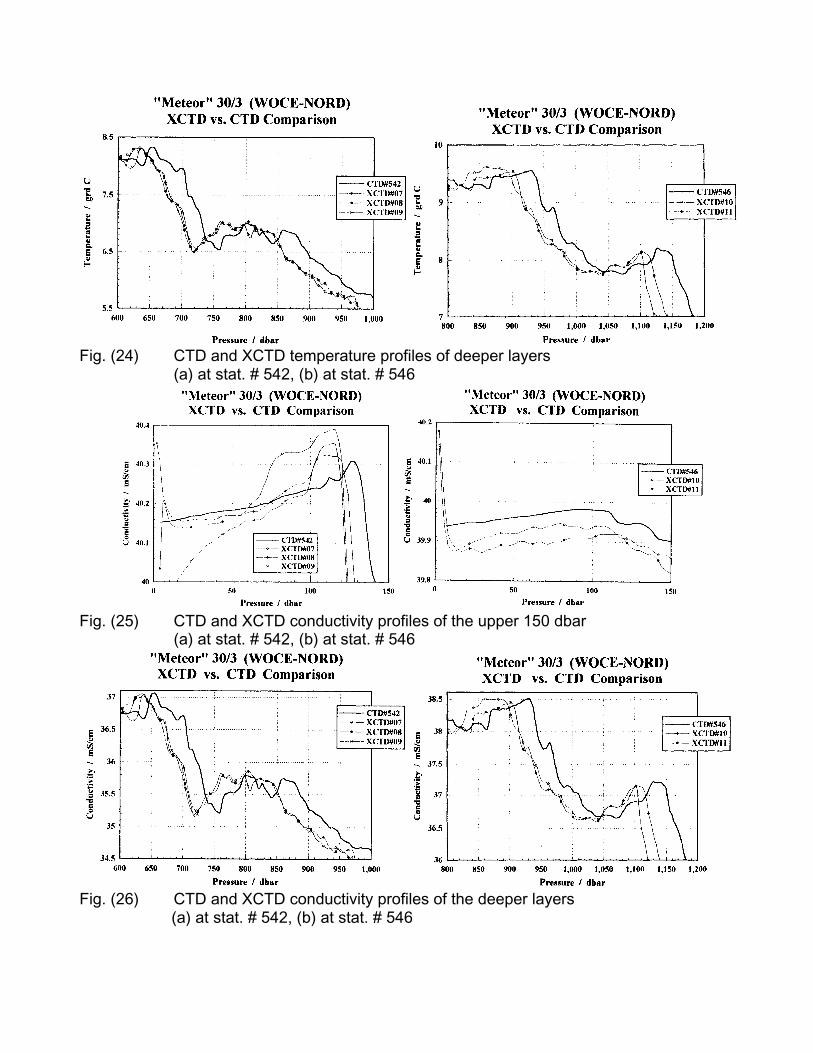
Fig. (24) CTD and XCTD temperature profiles of deeper layers(a) at stat. # 542, (b) at stat. # 546
Fig. (25) CTD and XCTD conductivity profiles of the upper 150 dbar(a) at stat. # 542, (b) at stat. # 546
Fig. (26) CTD and XCTD conductivity profiles of the deeper layers(a) at stat. # 542, (b) at stat. # 546
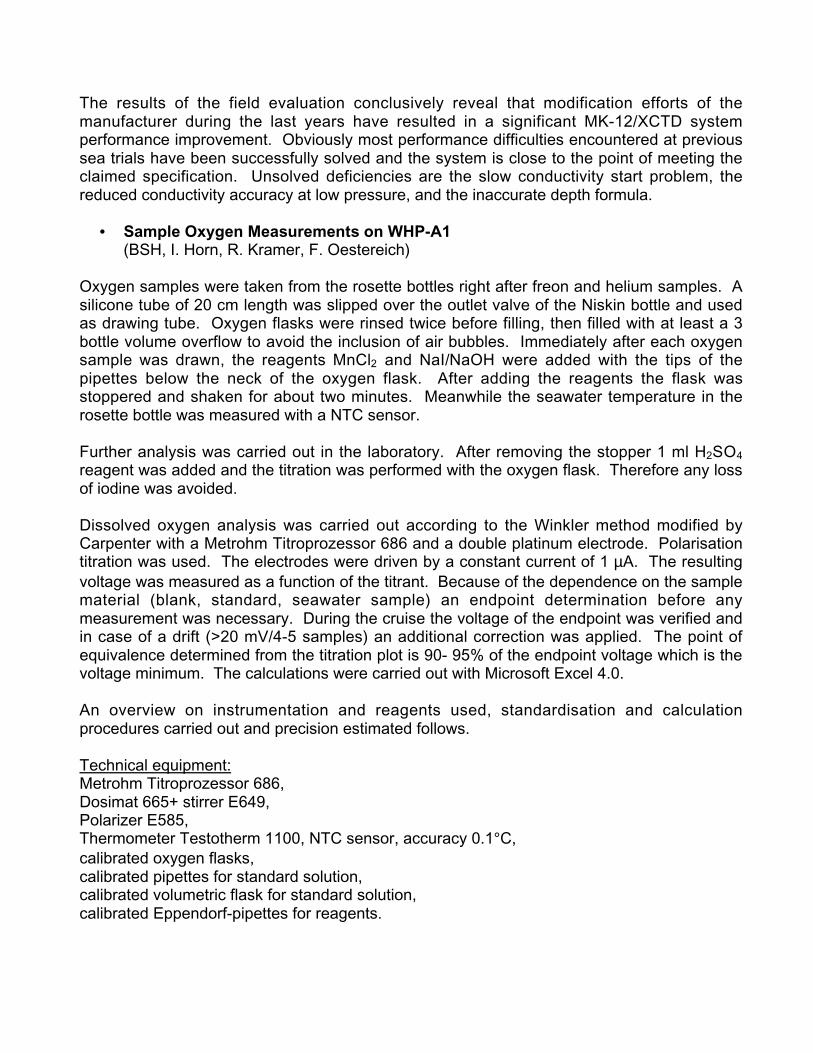
The results of the field evaluation conclusively reveal that modification efforts of themanufacturer during the last years have resulted in a significant MK-12/XCTD systemperformance improvement. Obviously most performance difficulties encountered at previoussea trials have been successfully solved and the system is close to the point of meeting theclaimed specification. Unsolved deficiencies are the slow conductivity start problem, thereduced conductivity accuracy at low pressure, and the inaccurate depth formula.
• Sample Oxygen Measurements on WHP-A1(BSH, I. Horn, R. Kramer, F. Oestereich)
Oxygen samples were taken from the rosette bottles right after freon and helium samples. Asilicone tube of 20 cm length was slipped over the outlet valve of the Niskin bottle and usedas drawing tube. Oxygen flasks were rinsed twice before filling, then filled with at least a 3bottle volume overflow to avoid the inclusion of air bubbles. Immediately after each oxygensample was drawn, the reagents MnCl2 and NaI/NaOH were added with the tips of thepipettes below the neck of the oxygen flask. After adding the reagents the flask wasstoppered and shaken for about two minutes. Meanwhile the seawater temperature in therosette bottle was measured with a NTC sensor.
Further analysis was carried out in the laboratory. After removing the stopper 1 ml H2SO4
reagent was added and the titration was performed with the oxygen flask. Therefore any lossof iodine was avoided.
Dissolved oxygen analysis was carried out according to the Winkler method modified byCarpenter with a Metrohm Titroprozessor 686 and a double platinum electrode. Polarisationtitration was used. The electrodes were driven by a constant current of 1 µA. The resultingvoltage was measured as a function of the titrant. Because of the dependence on the samplematerial (blank, standard, seawater sample) an endpoint determination before anymeasurement was necessary. During the cruise the voltage of the endpoint was verified andin case of a drift (>20 mV/4-5 samples) an additional correction was applied. The point ofequivalence determined from the titration plot is 90- 95% of the endpoint voltage which is thevoltage minimum. The calculations were carried out with Microsoft Excel 4.0.
An overview on instrumentation and reagents used, standardisation and calculationprocedures carried out and precision estimated follows.
Technical equipment:Metrohm Titroprozessor 686,Dosimat 665+ stirrer E649,Polarizer E585,Thermometer Testotherm 1100, NTC sensor, accuracy 0.1°C,calibrated oxygen flasks,calibrated pipettes for standard solution,calibrated volumetric flask for standard solution,calibrated Eppendorf-pipettes for reagents.

Reagents:Potassium Iodate Stand.: 1 hour at 105°C in a dr yer, aliquot s of about 0.3567 g; each port ion
was disso lved in 1 lit er pur e wate r; wat er tem peratu re was measu redfor corre ction. The weight of KIO 3 wa s corr ected for air buoyancy.
Sodium Thiosulphate: Merck Titrisol ampoule, 0.01 mol/l; 2 ampoules within 1 liter, 0.02molar.
Alkaline Sodium Iodide: 600 g NaI/l, 4 molar; 320 g NaOH/l, 8 molar.Manganous Chloride: 600 g (MnCl2 x 4H2O)/l, 3 molar.Sulphuric Acid: 280 ml concentrated H2SO4/l, 5 molar.All reagents were dissolved into demineralized water.
Blank Determination:Blanks were determined in demineralized water weekly according the following procedure:
1 ml KIO3 + 100 ml H2O + 1 ml H2SO4 + 1 ml NaI/NaOH + 1 ml MnCl2
After titration another 1 ml KIO3 was added followed by a second titration. The difference ofthe thiosulphate volumes was regarded as reagent blank. Five blanks were determined andthe difference between them should be within 0.004 ml. The blank value (mean) is animportant part of the calculation of oxygen concentrations.
Standardization:Standards were determined in demineralized water daily according the following procedure:
10 ml KIO3 + 100 ml H2O + 1 ml H2SO4 + 1 ml NaI/NaOH + 1 ml MnCl2
The titration of the standard was repeated three times. The scatter of the thiosulphate titershould be less than 0.05% (0.002 ml). For further calculations the mean was used. Whilestandard determination the ambient temperature was measured and included in thecalculation.
Calculation of Oxygen Concentrations:
O2 =
−( )−( ) −
−( )
V V V N
V VDO
V V
x blk dw I I
std blk dwreg
bot reg
,
,
* * **03 03 5598
1000
Vx = thiosulfate titer of sampleVblk,dw = thiosulfate titer of pure water blank (cm3)Vstd = thiosulfate titer of standard (cm3)Vbot = volume of sample bottle (cm3) at sampling temperatureVreg = volume (2 cm3) of sample displaced by reagentsVIO3 = volume of iodate standard (cm3) at temperature of standardizationNIO3 = normality of iodate standard (= 6 molarity) at temperature of standardizationDOreg = absolute amount of oxygen added with reagents, 0.0017 ml (Murray et al, 1968)O2 = oxygen concentration in sample (ml/l)

Calculation of KIO3 Standard:
N tW F
V tI p
KI buoy KI
p
0303 03 6
214 001( ) = ( )
* *
* .,
V t V tp p( ) = ( ) + −( )[ ]20 1 20* ανNIO3(tp) = normality of iodate standard (= 6 molarity) at tp°CWKIO3 = weight of KIO3 in airFbuoy,KIO3 = buoyancy correction for solid KIO3 (=1.000159)214.001 = 1987 molecular weight KIO3
tp = preparation temperature of KIO3 solutionV(tp) = volume of volumetric flask at temperature, tp°CV(20) = volume of volumetric flask at 20 °C reference temperatureαv = cubial coefficient of thermal expansion 1.0*10-5 for borosilicate glass
Normality of KIO3 standard at reference temperature 20°C:
N N t p p tI I p w w p03 0320 20( ) = ( ) ( ) ( )[ ]* /
NIO3(20) = normality KIO3 at reference temperature 20°CNIO3(tp) = normality KIO3 at preparation temperaturepw(20) = density of pure water at reference time 20°Cpw(tp) = density of pure water at preparation temperature
Density of pure water:pw = 0.999842594 + 6.793952*10-5*t - 9.095290*10-6*t2 + 1.001685*10-7* t3 -
1.120083*10-9*t4 + 6.536332*10-12*t5
t = water temperature in °C
Normality of KIO3 standard at standardization temperature:N N p t pI I w std w03 03 20 20= ( ) ( ) ( )[ ]* /
NIO3(20) = normality of iodate standard at 20°Cpw(tstd) = density of pure water at standardization temperaturepw(20) = density of pure water at reference temperature 20°C
Precision:
With the three calibration stations (# 496, 517, 544) the overall error of oxygen measurementbetween 0.06% fs and 0.18% fc was determined. Between twelve to twenty rosette bottleswere released at the same depth to provide independent samples of the same water mass.The results are presented in Fig. (27).
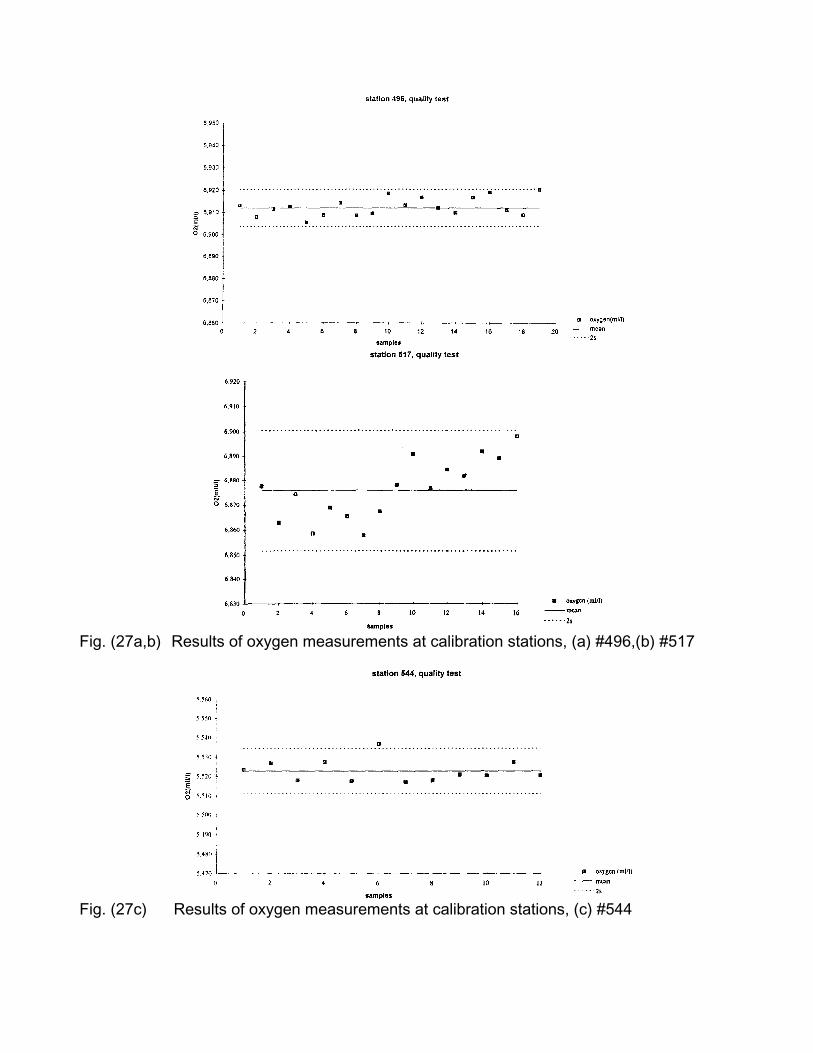
Fig. (27a,b) Results of oxygen measurements at calibration stations, (a) #496,(b) #517
Fig. (27c) Results of oxygen measurements at calibration stations, (c) #544
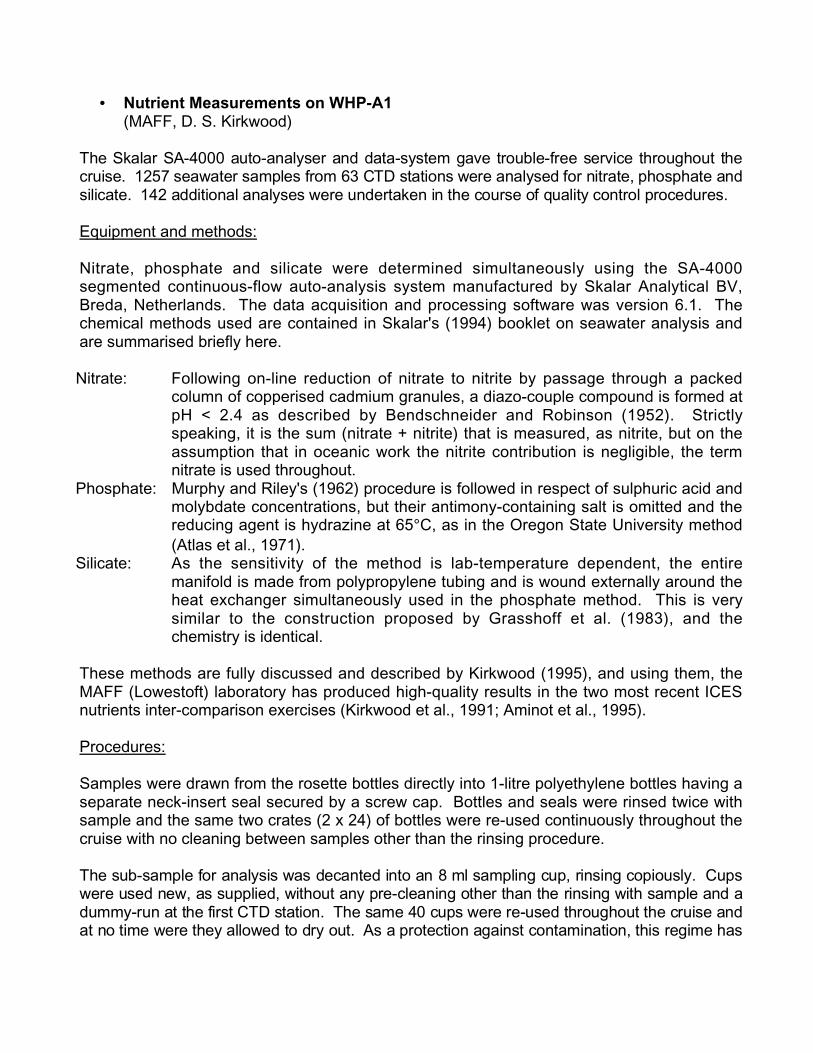
• Nutrient Measurements on WHP-A1(MAFF, D. S. Kirkwood)
T he Ska la r SA- 40 0 0 au to - an alyse r an d dat a -syste m gave tro ub le- fr e e se rvice th ro ug ho u t th e cru ise. 1 25 7 sea wa t er sa mple s fro m 63 CT D sta tio ns wer e a na lysed f o r nit ra te , p ho sp h at e an d silicat e . 1 4 2 ad dit io na l a na lyses we re u nd e rt ake n in t h e co u rse of qu ality con t ro l pro ce du r es.
Equipment and methods:
Nitrate, phosphate and silicate were determined simultaneously using the SA-4000segmented continuous-flow auto-analysis system manufactured by Skalar Analytical BV,Breda, Netherlands. The data acquisition and processing software was version 6.1. Thechemical methods used are contained in Skalar's (1994) booklet on seawater analysis andare summarised briefly here.
Nitrate: Following on-line reduction of nitrate to nitrite by passage through a packedcolumn of copperised cadmium granules, a diazo-couple compound is formed atpH < 2.4 as described by Bendschneider and Robinson (1952). Strictlyspeaking, it is the sum (nitrate + nitrite) that is measured, as nitrite, but on theassumption that in oceanic work the nitrite contribution is negligible, the termnitrate is used throughout.
Phosphate: Murphy and Riley's (1962) procedure is followed in respect of sulphuric acid andmolybdate concentrations, but their antimony-containing salt is omitted and thereducing agent is hydrazine at 65°C, as in the Oregon State University method(Atlas et al., 1971).
Silicate: As the sensitivity of the method is lab-temperature dependent, the entiremanifold is made from polypropylene tubing and is wound externally around theheat exchanger simultaneously used in the phosphate method. This is verysimilar to the construction proposed by Grasshoff et al. (1983), and thechemistry is identical.
These methods are fully discussed and described by Kirkwood (1995), and using them, theMAFF (Lowestoft) laboratory has produced high-quality results in the two most recent ICESnutrients inter-comparison exercises (Kirkwood et al., 1991; Aminot et al., 1995).
Procedures:
Samples were drawn from the rosette bottles directly into 1-litre polyethylene bottles having aseparate neck-insert seal secured by a screw cap. Bottles and seals were rinsed twice withsample and the same two crates (2 x 24) of bottles were re-used continuously throughout thecruise with no cleaning between samples other than the rinsing procedure.
T he sub - sa mp le fo r ana lysis was de ca n te d in t o an 8 ml sa mp lin g cu p, rinsing cop iou sly. Cup swer e use d ne w, as su pp lie d, wit h ou t any pre - clea n in g ot h er th an the rinsing wit h sam p le and ad um my-r u n at th e fir st CT D st ation . Th e sa m e 40 cu ps we re r e -u se d thr ou g ho ut t h e cr u ise an d a t no t ime we re t he y a llo we d to dr y out . As a p r ot ectio n ag a in st co nt am ina tion , t his reg im e h as
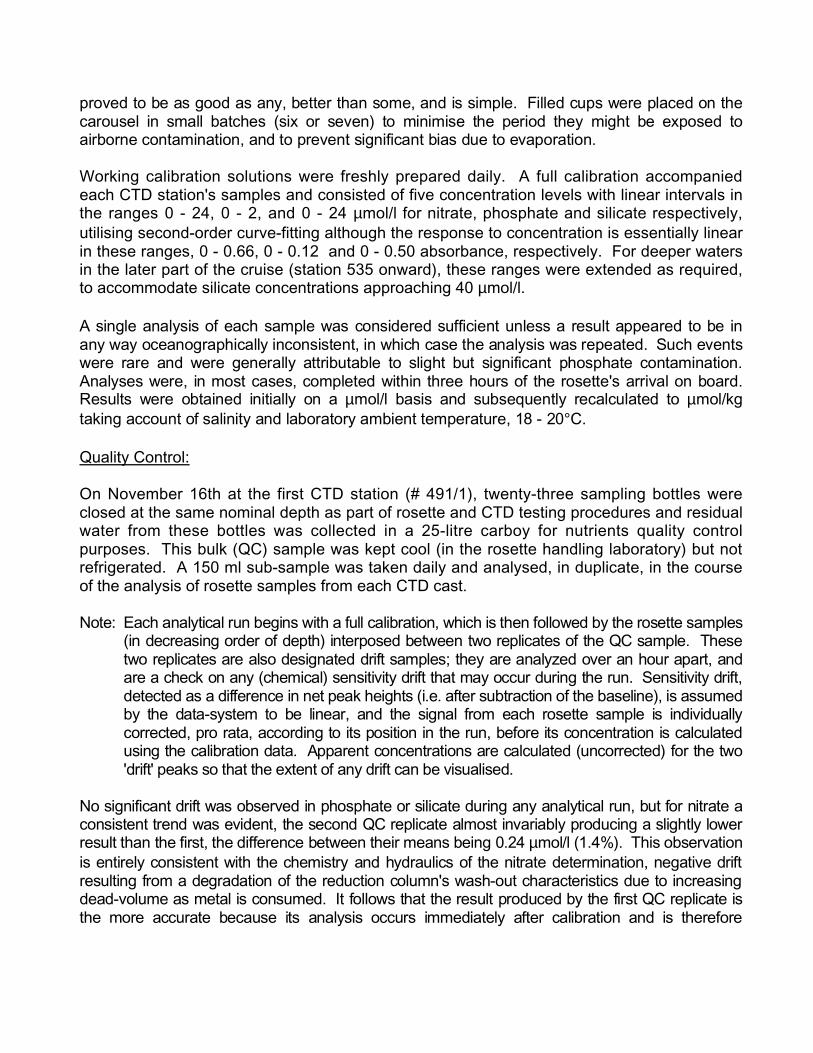
p ro ve d to be as goo d as any, be t te r tha n so m e, an d is simp le . Fille d cu p s we re place d on th ecar ou se l in sma ll ba tche s (six or se ven ) to minim ise th e per iod the y mig h t be expo se d toa ir bo rn e con t am in at ion , and t o pre ve n t sign ifica n t bias du e to evap o ra tio n.
Working calibration solutions were freshly prepared daily. A full calibration accompaniedeach CTD station's samples and consisted of five concentration levels with linear intervals inthe ranges 0 - 24, 0 - 2, and 0 - 24 µmol/l for nitrate, phosphate and silicate respectively,utilising second-order curve-fitting although the response to concentration is essentially linearin these ranges, 0 - 0.66, 0 - 0.12 and 0 - 0.50 absorbance, respectively. For deeper watersin the later part of the cruise (station 535 onward), these ranges were extended as required,to accommodate silicate concentrations approaching 40 µmol/l.
A sin gle ana lysis of each sam ple was co nsid e re d suf ficie nt un le ss a re su lt ap pe a re d to be in a ny way ocean og ra ph ica lly incon siste n t, in which ca se t h e an a lysis was r e pe at ed . Su ch even t swer e ra r e an d wer e gen er a lly at t ribu t ab le to slig ht but sign ifica nt ph osp ha te co nt am ina tion . Ana lyse s wer e , in mo st ca se s, co mp le t ed wit h in th re e ho u rs of the ro se tt e 's arr iva l on bo ar d .Results we re ob ta in e d in itially on a µ m ol/l ba sis and sub seq ue n tly re calcu lat ed to µ m ol/kgt akin g accou n t of sa linit y an d lab or a to ry a m bien t t em pe r at ur e , 18 - 20 ° C.
Quality Control:
On November 16th at the first CTD station (# 491/1), twenty-three sampling bottles wereclosed at the same nominal depth as part of rosette and CTD testing procedures and residualwater from these bottles was collected in a 25-litre carboy for nutrients quality controlpurposes. This bulk (QC) sample was kept cool (in the rosette handling laboratory) but notrefrigerated. A 150 ml sub-sample was taken daily and analysed, in duplicate, in the courseof the analysis of rosette samples from each CTD cast.
Note: Each analytical run begins with a full calibration, which is then followed by the rosette samples(in decreasing order of depth) interposed between two replicates of the QC sample. Thesetwo replicates are also designated drift samples; they are analyzed over an hour apart, andare a check on any (chemical) sensitivity drift that may occur during the run. Sensitivity drift,detected as a difference in net peak heights (i.e. after subtraction of the baseline), is assumedby the data-system to be linear, and the signal from each rosette sample is individuallycorrected, pro rata, according to its position in the run, before its concentration is calculatedusing the calibration data. Apparent concentrations are calculated (uncorrected) for the two'drift' peaks so that the extent of any drift can be visualised.
No significant drift was observed in phosphate or silicate during any analytical run, but for nitrate aconsistent trend was evident, the second QC replicate almost invariably producing a slightly lowerresult than the first, the difference between their means being 0.24 µmol/l (1.4%). This observationis entirely consistent with the chemistry and hydraulics of the nitrate determination, negative driftresulting from a degradation of the reduction column's wash-out characteristics due to increasingdead-volume as metal is consumed. It follows that the result produced by the first QC replicate isthe more accurate because its analysis occurs immediately after calibration and is therefore
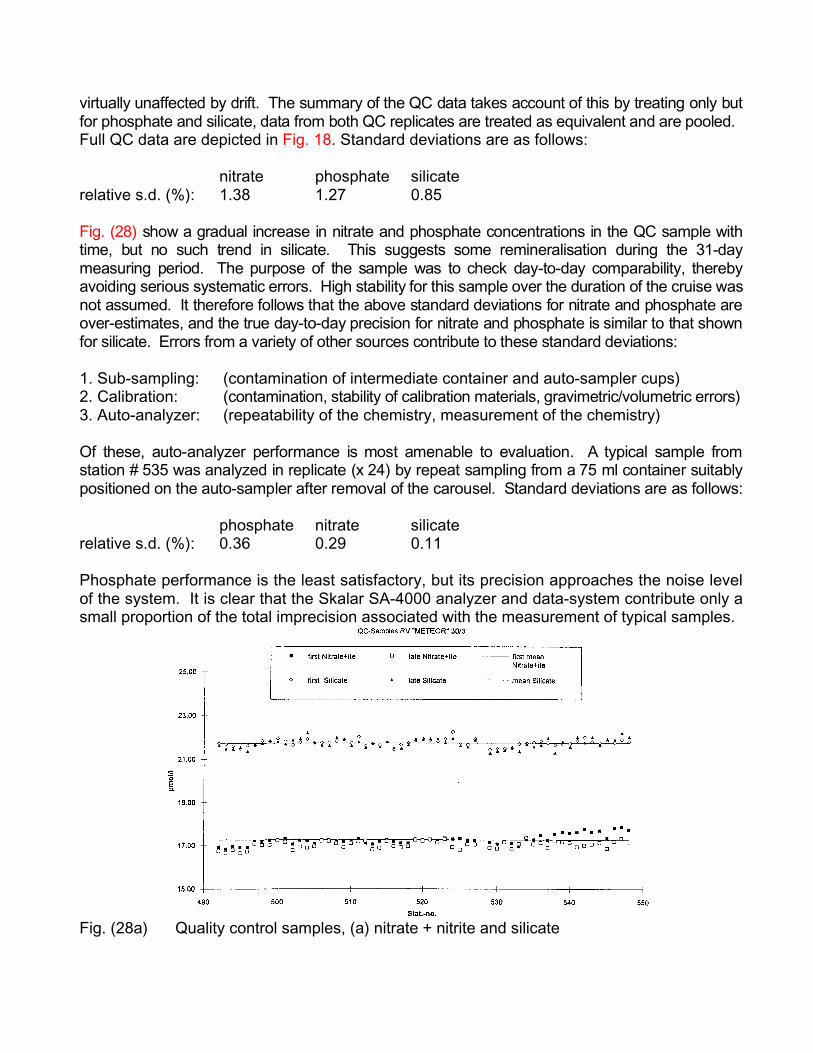
virtually unaffected by drift. The summary of the QC data takes account of this by treating only butfor phosphate and silicate, data from both QC replicates are treated as equivalent and are pooled.Full QC data are depicted in Fig. 18. Standard deviations are as follows:
nitrate phosphate silicaterelative s.d. (%): 1.38 1.27 0.85
Fig. (28) show a gradual increase in nitrate and phosphate concentrations in the QC sample withtime, but no such trend in silicate. This suggests some remineralisation during the 31-daymeasuring period. The purpose of the sample was to check day-to-day comparability, therebyavoiding serious systematic errors. High stability for this sample over the duration of the cruise wasnot assumed. It therefore follows that the above standard deviations for nitrate and phosphate areover-estimates, and the true day-to-day precision for nitrate and phosphate is similar to that shownfor silicate. Errors from a variety of other sources contribute to these standard deviations:
1. Sub-sampling: (contamination of intermediate container and auto-sampler cups)2. Calibration: (contamination, stability of calibration materials, gravimetric/volumetric errors)3. Auto-analyzer: (repeatability of the chemistry, measurement of the chemistry)
Of these, auto- ana lyzer perfor mance is most amen able to evaluation . A typical sample from sta tion # 535 was ana lyzed in rep licate (x 24 ) by repeat sampling fro m a 75 ml co ntaine r suit ablypositione d on t he aut o-samp ler af ter re moval of the carou sel. Standa rd deviation s are as follows:
phosphate nitrate silicaterelative s.d. (%): 0.36 0.29 0.11
Phosphate performance is the least satisfactory, but its precision approaches the noise levelof the system. It is clear that the Skalar SA-4000 analyzer and data-system contribute only asmall proportion of the total imprecision associated with the measurement of typical samples.
Fig. (28a) Quality control samples, (a) nitrate + nitrite and silicate
Fig. (28b) Quality control samples, phosphate
• Tracer Studies on WHP-A1(IUP-HD, R.Bayer and IfMK M.Rhein)
The experimental goal of the tracer programme is the collection and measurement of arepresentative data set for geochemical tracers along the WHP section A1. The data will beused to determine mixing rates and apparent ages of the water masses in the North Atlantic.Special focuses are on the North Atlantic overturning, the deep boundary currents asobserved along the continental margins and the Mid Atlantic Ridge and the formation andspreading of Labrador Sea Water.
The interpretation of the data will be done in close cooperation with all groups involved. Thetracer information will be compared with the 1972 GEOSECS data, the TTO/NAS data from1980/81 in the Northern Atlantic, the data obtained during the first occupation of WHP-A1/E in1991 and other data available from the region. The evaluation of the tracer fields yieldsfurther indication how much and how fast the invasion of the tracer signals from the surfaceinto the deep waters has proceeded. The observations will specifically give startingconcentrations for the North Atlantic Deep Water. Tracer concentrations within the overflowswill also yield information on the turnover of the water masses feeding the overflows.Moreover, all tracers studied have transient distributions and may be used to study thetemporal evolution further on.
Onboard measurements were carried out of the CFCs F11 and F12. Samples for 3He, tritiumand 14C (large volume programme) were taken for measurement at the tracer laboratory atHeidelberg. Additional 14C samples for Accelerator Mass Spectrometry (AMS) were obtainedand the subsequent analyses will be performed at the Eidgenössische TechnischeHochschule Zürich (ETH). Furthermore a new seagoing extraction line for 3He was tested.All measurements were designed to meet the WOCE quality standards.
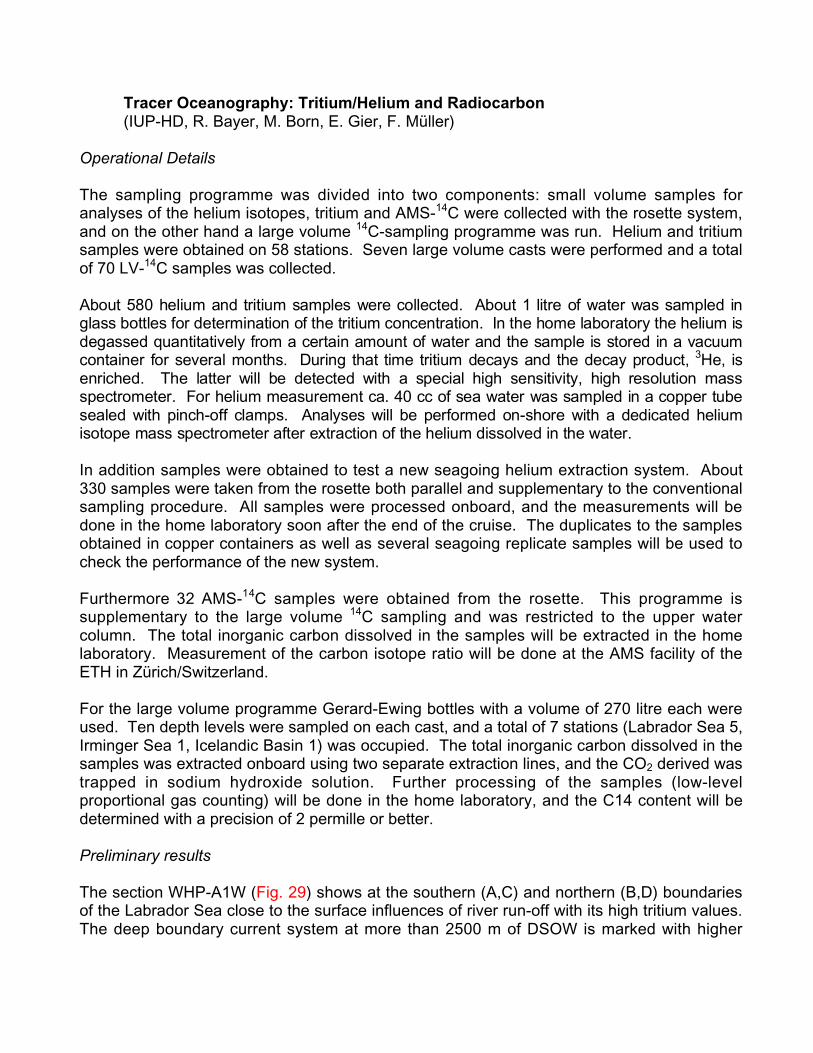
Tracer Oceanography: Tritium/Helium and Radiocarbon(IUP-HD, R. Bayer, M. Born, E. Gier, F. Müller)
Operational Details
The sampling programme was divided into two components: small volume samples foranalyses of the helium isotopes, tritium and AMS-14C were collected with the rosette system,and on the other hand a large volume 14C-sampling programme was run. Helium and tritiumsamples were obtained on 58 stations. Seven large volume casts were performed and a totalof 70 LV-14C samples was collected.
Abo ut 58 0 he liu m an d trit iu m sa m ples we re co llect ed . Ab ou t 1 lit re of wa te r wa s sam p le d in g la ss b o tt le s f or d e te rm ina tion of t h e tr it ium co ncen tr a tion . In t h e ho m e la bo r at or y t he h e lium isd eg asse d qua n tita tively fro m a cer ta in am ou n t of wa te r and th e sa mp le is st or ed in a va cu um con ta in e r fo r sever a l mo n th s. Dur in g tha t tim e tritium de ca ys an d the de ca y pr o du ct , 3He, ise nr iche d . Th e la tt e r will be de te ct e d with a sp e cial high se nsit ivity, hig h re solut ion massspe ct ro m et er . Fo r heliu m mea su r em en t ca. 40 cc of se a wat er wa s sa m pled in a co pp er tu be sea le d wit h pin ch -o f f cla mp s. Ana lyses will be per fo rm e d on - sh or e wit h a ded ica te d heliu miso to pe ma ss sp ectr o me te r a ft er extr a ct io n of th e h eliu m d issolve d in th e wat er .
In addition samples were obtained to test a new seagoing helium extraction system. About330 samples were taken from the rosette both parallel and supplementary to the conventionalsampling procedure. All samples were processed onboard, and the measurements will bedone in the home laboratory soon after the end of the cruise. The duplicates to the samplesobtained in copper containers as well as several seagoing replicate samples will be used tocheck the performance of the new system.
Furthermore 32 AMS-14C samples were obtained from the rosette. This programme issupplementary to the large volume 14C sampling and was restricted to the upper watercolumn. The total inorganic carbon dissolved in the samples will be extracted in the homelaboratory. Measurement of the carbon isotope ratio will be done at the AMS facility of theETH in Zürich/Switzerland.
For the large volume programme Gerard-Ewing bottles with a volume of 270 litre each wereused. Ten depth levels were sampled on each cast, and a total of 7 stations (Labrador Sea 5,Irminger Sea 1, Icelandic Basin 1) was occupied. The total inorganic carbon dissolved in thesamples was extracted onboard using two separate extraction lines, and the CO2 derived wastrapped in sodium hydroxide solution. Further processing of the samples (low-levelproportional gas counting) will be done in the home laboratory, and the C14 content will bedetermined with a precision of 2 permille or better.
Preliminary results
The section WHP-A1W (Fig. 29) shows at the southern (A,C) and northern (B,D) boundariesof the Labrador Sea close to the surface influences of river run-off with its high tritium values.The deep boundary current system at more than 2500 m of DSOW is marked with higher
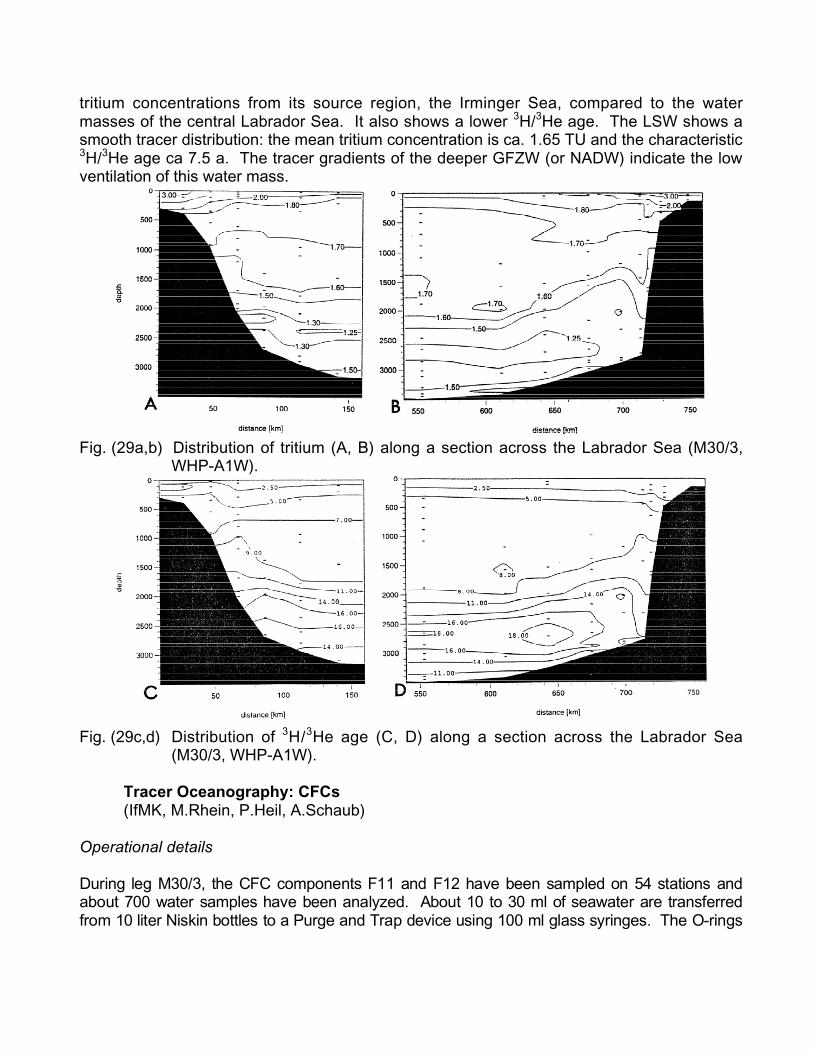
tritium concentrations from its source region, the Irminger Sea, compared to the watermasses of the central Labrador Sea. It also shows a lower 3H/3He age. The LSW shows asmooth tracer distribution: the mean tritium concentration is ca. 1.65 TU and the characteristic3H/3He age ca 7.5 a. The tracer gradients of the deeper GFZW (or NADW) indicate the lowventilation of this water mass.
Fig. (29a,b) Distribution of tritium (A, B) along a section across the Labrador Sea (M30/3,WHP-A1W).
Fig. (29c,d) Distribution of 3H/3He age (C, D) along a section across the Labrador Sea(M30/3, WHP-A1W).
Tracer Oceanography: CFCs(IfMK, M.Rhein, P.Heil, A.Schaub)
Operational details
Dur ing le g M30/ 3, the CFC compone nts F1 1 and F12 ha ve bee n samp led on 54 st ations andabo ut 700 water samples have been ana lyzed. Abou t 10 to 30 ml of seawate r are transf erredfro m 10 lit er Niskin bo ttles to a Purge and Tra p device using 100 ml glass syringes. The O-rin gs
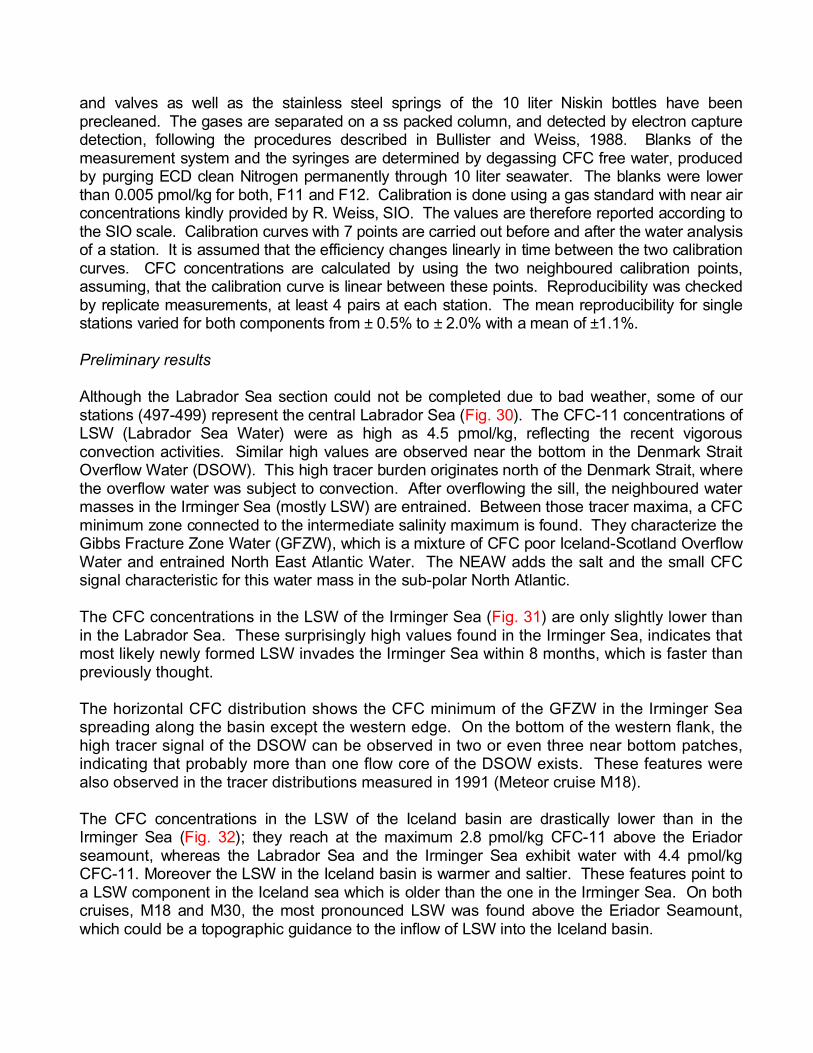
and valve s as well as the stainle ss ste el spr ings of the 10 lit er Niskin bo ttles have beenpre cleane d. Th e gase s are separa ted on a ss packed colum n, and detected by elect ron ca pturedet ection , following the pr ocedur es described in Bullister and Weiss, 1988. Blanks of themea sureme nt system an d the syring es are deter mined by deg assing CFC free wa ter, produce dby purgin g ECD clean Nitrog en per manent ly thr ough 10 lit er sea water. The blanks were lowertha n 0.00 5 pmo l/kg f or bot h, F11 and F 12. Calibra tion is done using a gas stand ard with nea r aircon centra tions kindly provided by R. We iss, SIO. The values ar e ther efore report ed according tothe SIO scale. Calib ration curve s with 7 points ar e carr ied ou t befo re and after the water a nalysisof a stat ion. It is assume d that the e fficie ncy ch anges linear ly in time b etween the t wo calibrationcur ves. CFC co ncentr ations are calcula ted by using the two neighbour ed calibration points,assuming, that the ca librat ion cu rve is linea r between th ese po ints. Repro ducibility was che ckedby replicate me asurem ents, at lea st 4 pairs at each station. The mea n repr oducib ility for singlesta tions varied for b oth co mponen ts fro m ± 0. 5% to ± 2.0% with a mean of ±1 .1%.
Preliminary results
Alt ho ug h the La br ad o r Se a sectio n co u ld not be co mp le te d due to bad we at h er , so m e of ou rsta tion s ( 49 7 -4 99 ) rep re sen t th e cen t ra l La b ra do r Sea ( F ig . 30). T h e CF C-1 1 co n ce nt r at io ns of L SW (La b ra do r Sea Wa te r) we re as hig h as 4. 5 p mo l/ kg , ref lecting th e recen t vig or o uscon ve ct ion activitie s. Sim ilar high va lu es ar e obser ve d nea r the bo tt om in the De nm a rk Str a it O ve rf lo w Wate r (DSO W). T his hig h tr a ce r bu r de n origina t es n o rt h of the Den ma rk Stra it, whe r et he ove r flow wa te r was su bject to co n ve ct io n . Af te r ove rf lo win g th e sill, th e neigh b ou re d wat er m asse s in th e I rm in ge r Sea (m ostly L SW) a re e ntr ain ed . Be twee n t ho se tr ace r m axim a, a CF Cm in im um zo ne co nn ect ed t o t he in te rm e diat e salin ity m aximu m is fo un d . T h ey cha ra ct e rize th eG ib bs F r actu r e Zo ne Wa te r ( GF ZW) , wh ich is a mixt ur e of CF C poo r Ice la nd - Scot la n d Ove rf lo wWat er an d en t ra in ed No rt h East Atlan t ic Wat e r. The NEAW add s the sa lt an d th e sma ll CF Csig na l cha ra cte rist ic fo r t his wat er ma ss in t he su b- po lar No rt h At lan tic.
The CFC concentrations in the LSW of the Irminger Sea (Fig. 31) are only slightly lower thanin the Labrador Sea. These surprisingly high values found in the Irminger Sea, indicates thatmost likely newly formed LSW invades the Irminger Sea within 8 months, which is faster thanpreviously thought.
The horizontal CFC distribution shows the CFC minimum of the GFZW in the Irminger Seaspreading along the basin except the western edge. On the bottom of the western flank, thehigh tracer signal of the DSOW can be observed in two or even three near bottom patches,indicating that probably more than one flow core of the DSOW exists. These features werealso observed in the tracer distributions measured in 1991 (Meteor cruise M18).
T he CFC co nce nt ra tio ns in the LSW of th e Ice la nd ba sin are dr astica lly lo we r th a n in th eI rm in ge r Sea (F ig . 32) ; the y re a ch at the ma ximu m 2.8 p mo l/ kg CF C- 1 1 ab ove the Eriad or sea mo un t , wh e re as th e La b ra do r Sea an d th e I rm in ge r Sea exhibit wat e r with 4. 4 p mo l/ kg CFC-1 1. Mo re o ve r th e L SW in the Icela nd basin is wa rm er an d saltier . Th e se fea t ur es po in t toa LSW co mp on e nt in the Icelan d sea wh ich is olde r tha n the on e in th e I rm in ge r Sea . On bo th cru ises, M18 an d M3 0 , th e most pro no u nced LSW wa s fou nd ab ove the Eriad or Sea mo un t ,which co uld be a to p og ra p hic gu ida nce t o th e inf low o f LSW in to t he Icela nd b asin.
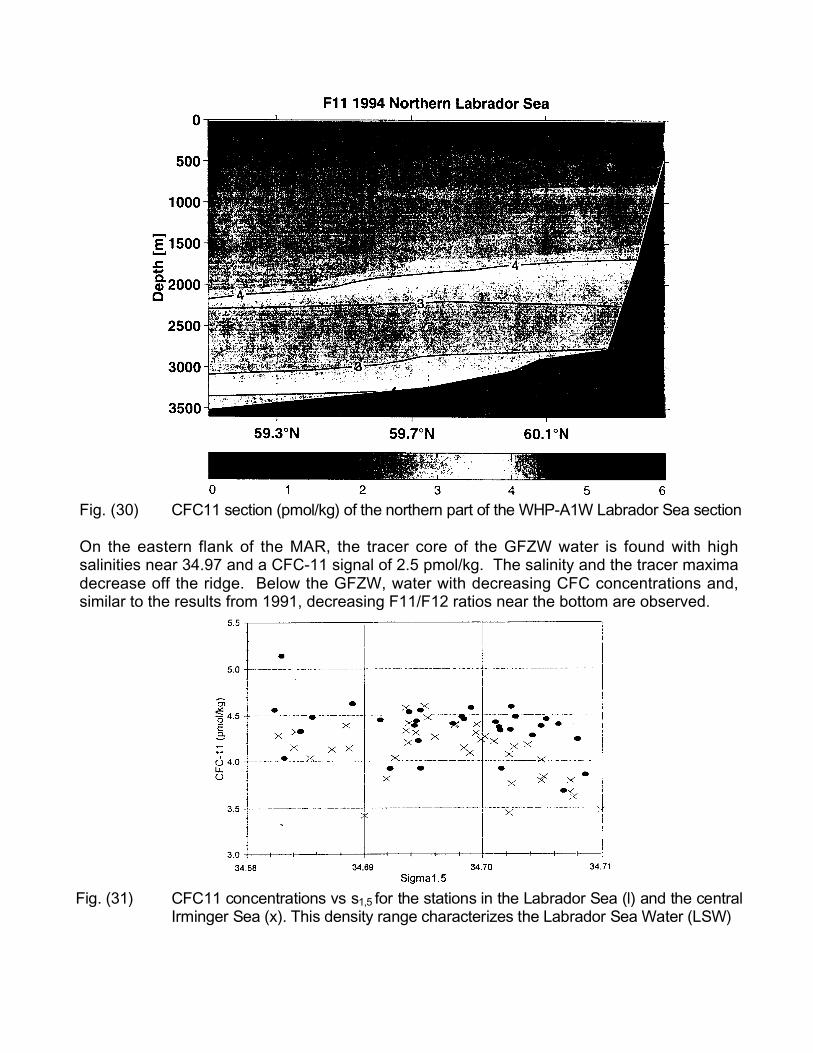
Fig. (30) CFC11 section (pmol/kg) of the northern part of the WHP-A1W Labrador Sea section
On the eastern flank of the MAR, the tracer core of the GFZW water is found with highsalinities near 34.97 and a CFC-11 signal of 2.5 pmol/kg. The salinity and the tracer maximadecrease off the ridge. Below the GFZW, water with decreasing CFC concentrations and,similar to the results from 1991, decreasing F11/F12 ratios near the bottom are observed.
Fig . (31) CFC11 con centra tions vs s1,5 for the station s in the Lab rador Sea (l) and the ce ntralIrm inger Sea (x). This density ra nge cha racter izes t he Lab rador Sea Wa ter (L SW)
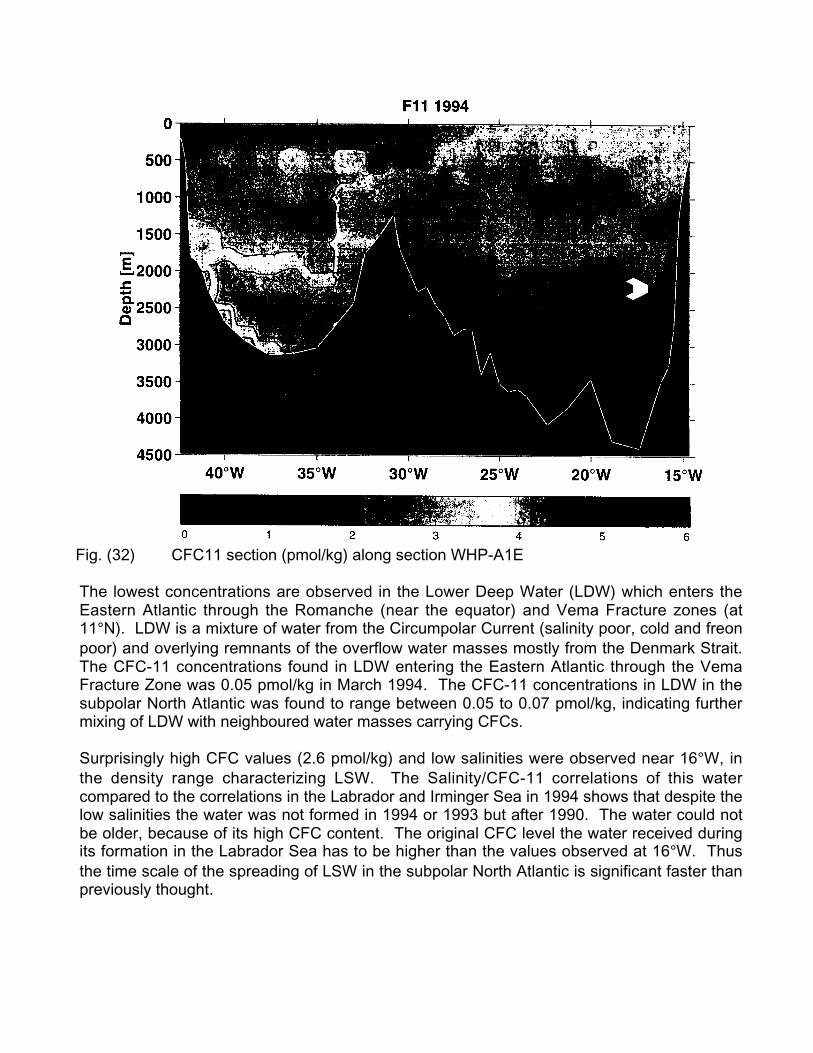
Fig. (32) CFC11 section (pmol/kg) along section WHP-A1E
The lowest concentrations are observed in the Lower Deep Water (LDW) which enters theEastern Atlantic through the Romanche (near the equator) and Vema Fracture zones (at11°N). LDW is a mixture of water from the Circumpolar Current (salinity poor, cold and freonpoor) and overlying remnants of the overflow water masses mostly from the Denmark Strait.The CFC-11 concentrations found in LDW entering the Eastern Atlantic through the VemaFracture Zone was 0.05 pmol/kg in March 1994. The CFC-11 concentrations in LDW in thesubpolar North Atlantic was found to range between 0.05 to 0.07 pmol/kg, indicating furthermixing of LDW with neighboured water masses carrying CFCs.
Surprisingly high CFC values (2.6 pmol/kg) and low salinities were observed near 16°W, inthe density range characterizing LSW. The Salinity/CFC-11 correlations of this watercompared to the correlations in the Labrador and Irminger Sea in 1994 shows that despite thelow salinities the water was not formed in 1994 or 1993 but after 1990. The water could notbe older, because of its high CFC content. The original CFC level the water received duringits formation in the Labrador Sea has to be higher than the values observed at 16°W. Thusthe time scale of the spreading of LSW in the subpolar North Atlantic is significant faster thanpreviously thought.
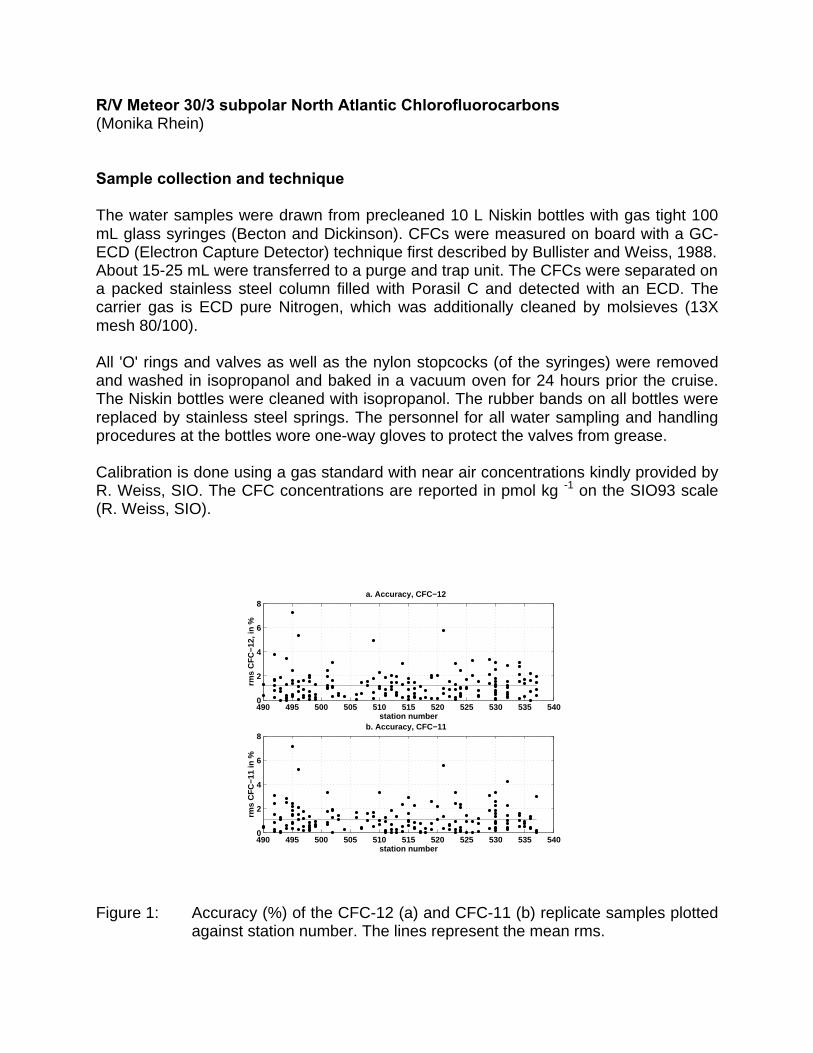
R/V Meteor 30/3 subpolar North Atlantic Chlorofluorocarbons(Monika Rhein)
Sample collection and technique
The water samples were drawn from precleaned 10 L Niskin bottles with gas tight 100mL glass syringes (Becton and Dickinson). CFCs were measured on board with a GC-ECD (Electron Capture Detector) technique first described by Bullister and Weiss, 1988.About 15-25 mL were transferred to a purge and trap unit. The CFCs were separated ona packed stainless steel column filled with Porasil C and detected with an ECD. Thecarrier gas is ECD pure Nitrogen, which was additionally cleaned by molsieves (13Xmesh 80/100).
All 'O' rings and valves as well as the nylon stopcocks (of the syringes) were removedand washed in isopropanol and baked in a vacuum oven for 24 hours prior the cruise.The Niskin bottles were cleaned with isopropanol. The rubber bands on all bottles werereplaced by stainless steel springs. The personnel for all water sampling and handlingprocedures at the bottles wore one-way gloves to protect the valves from grease.
Calibration is done using a gas standard with near air concentrations kindly provided byR. Weiss, SIO. The CFC concentrations are reported in pmol kg -1 on the SIO93 scale(R. Weiss, SIO).
Figure 1: Accuracy (%) of the CFC-12 (a) and CFC-11 (b) replicate samples plottedagainst station number. The lines represent the mean rms.
490 495 500 505 510 515 520 525 530 535 5400
2
4
6
8a. Accuracy, CFC−12
station number
rms
CF
C−1
2, in
%
490 495 500 505 510 515 520 525 530 535 5400
2
4
6
8
station number
rms
CF
C−1
1 in
%
b. Accuracy, CFC−11
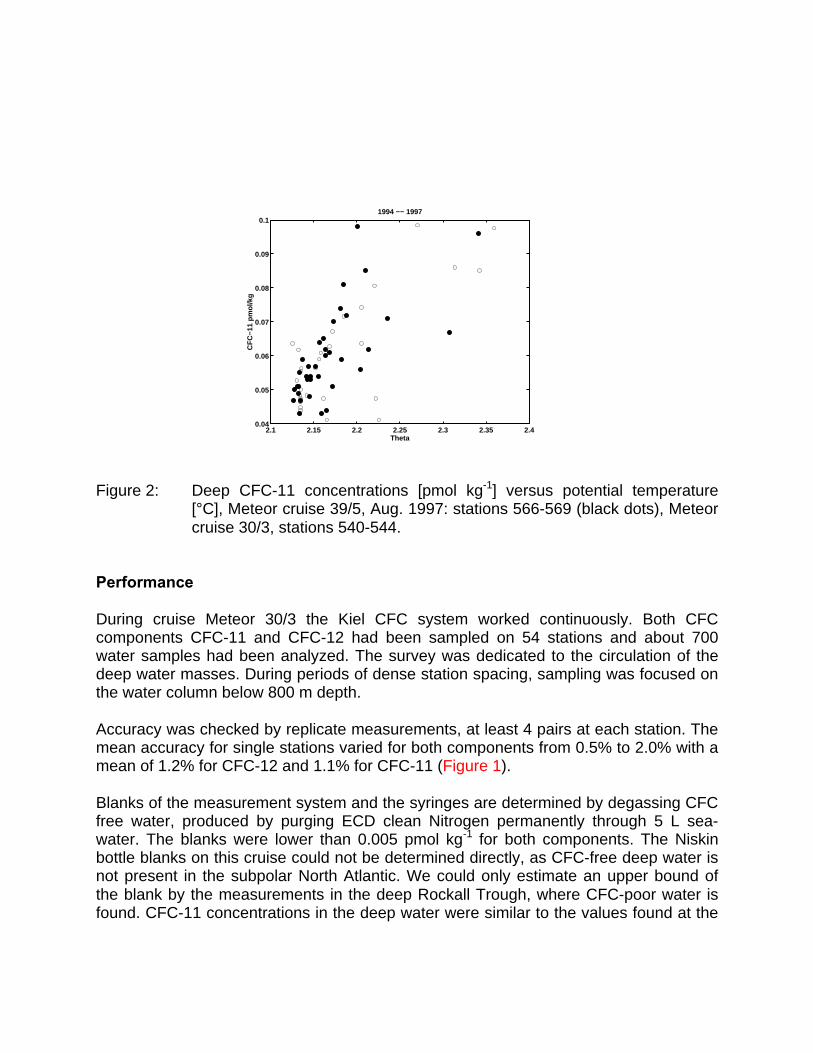
Figure 2: Deep CFC-11 concentrations [pmol kg-1] versus potential temperature[°C], Meteor cruise 39/5, Aug. 1997: stations 566-569 (black dots), Meteorcruise 30/3, stations 540-544.
Performance
During cruise Meteor 30/3 the Kiel CFC system worked continuously. Both CFCcomponents CFC-11 and CFC-12 had been sampled on 54 stations and about 700water samples had been analyzed. The survey was dedicated to the circulation of thedeep water masses. During periods of dense station spacing, sampling was focused onthe water column below 800 m depth.
Accuracy was checked by replicate measurements, at least 4 pairs at each station. Themean accuracy for single stations varied for both components from 0.5% to 2.0% with amean of 1.2% for CFC-12 and 1.1% for CFC-11 (Figure 1).
Blanks of the measurement system and the syringes are determined by degassing CFCfree water, produced by purging ECD clean Nitrogen permanently through 5 L sea-water. The blanks were lower than 0.005 pmol kg-1 for both components. The Niskinbottle blanks on this cruise could not be determined directly, as CFC-free deep water isnot present in the subpolar North Atlantic. We could only estimate an upper bound ofthe blank by the measurements in the deep Rockall Trough, where CFC-poor water isfound. CFC-11 concentrations in the deep water were similar to the values found at the
2.1 2.15 2.2 2.25 2.3 2.35 2.40.04
0.05
0.06
0.07
0.08
0.09
0.1
Theta
CF
C−1
1 p
mo
l/kg
1994 −− 1997
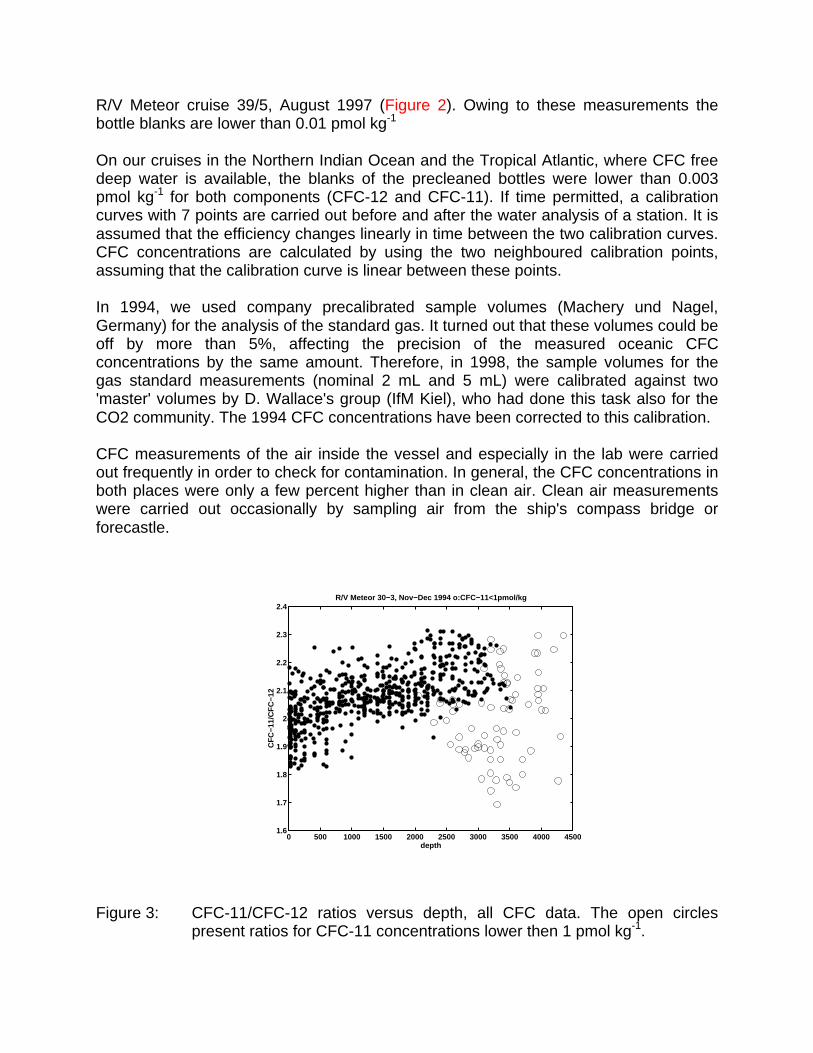
R/V Meteor cruise 39/5, August 1997 (Figure 2). Owing to these measurements thebottle blanks are lower than 0.01 pmol kg-1
On our cruises in the Northern Indian Ocean and the Tropical Atlantic, where CFC freedeep water is available, the blanks of the precleaned bottles were lower than 0.003pmol kg-1 for both components (CFC-12 and CFC-11). If time permitted, a calibrationcurves with 7 points are carried out before and after the water analysis of a station. It isassumed that the efficiency changes linearly in time between the two calibration curves.CFC concentrations are calculated by using the two neighboured calibration points,assuming that the calibration curve is linear between these points.
In 1994, we used company precalibrated sample volumes (Machery und Nagel,Germany) for the analysis of the standard gas. It turned out that these volumes could beoff by more than 5%, affecting the precision of the measured oceanic CFCconcentrations by the same amount. Therefore, in 1998, the sample volumes for thegas standard measurements (nominal 2 mL and 5 mL) were calibrated against two'master' volumes by D. Wallace's group (IfM Kiel), who had done this task also for theCO2 community. The 1994 CFC concentrations have been corrected to this calibration.
CFC measurements of the air inside the vessel and especially in the lab were carriedout frequently in order to check for contamination. In general, the CFC concentrations inboth places were only a few percent higher than in clean air. Clean air measurementswere carried out occasionally by sampling air from the ship's compass bridge orforecastle.
Figure 3: CFC-11/CFC-12 ratios versus depth, all CFC data. The open circlespresent ratios for CFC-11 concentrations lower then 1 pmol kg-1.
0 500 1000 1500 2000 2500 3000 3500 4000 45001.6
1.7
1.8
1.9
2
2.1
2.2
2.3
2.4
depth
CF
C−1
1/C
FC
−12
R/V Meteor 30−3, Nov−Dec 1994 o:CFC−11<1pmol/kg
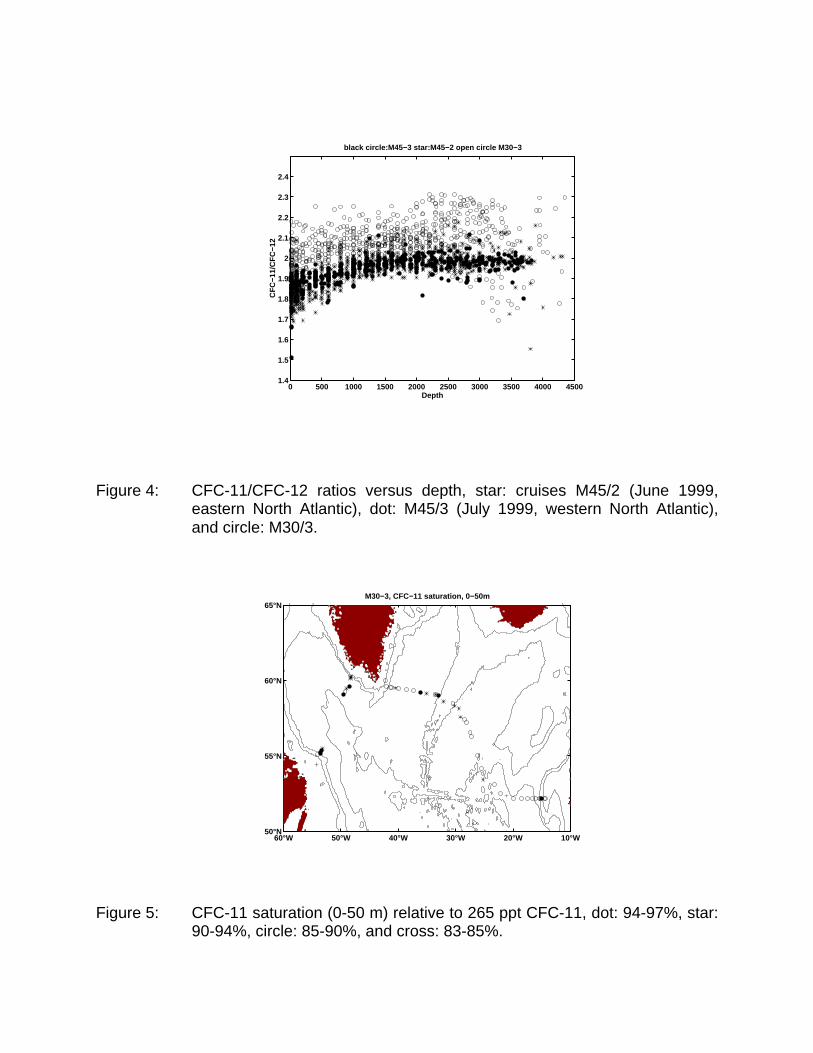
Figure 4: CFC-11/CFC-12 ratios versus depth, star: cruises M45/2 (June 1999,eastern North Atlantic), dot: M45/3 (July 1999, western North Atlantic),and circle: M30/3.
Figure 5: CFC-11 saturation (0-50 m) relative to 265 ppt CFC-11, dot: 94-97%, star:90-94%, circle: 85-90%, and cross: 83-85%.
0 500 1000 1500 2000 2500 3000 3500 4000 45001.4
1.5
1.6
1.7
1.8
1.9
2
2.1
2.2
2.3
2.4
Depth
CF
C−1
1/C
FC
−12
black circle:M45−3 star:M45−2 open circle M30−3
60°W 50°W 40°W 30°W 20°W 10°W50°N
55°N
60°N
65°NM30−3, CFC−11 saturation, 0−50m
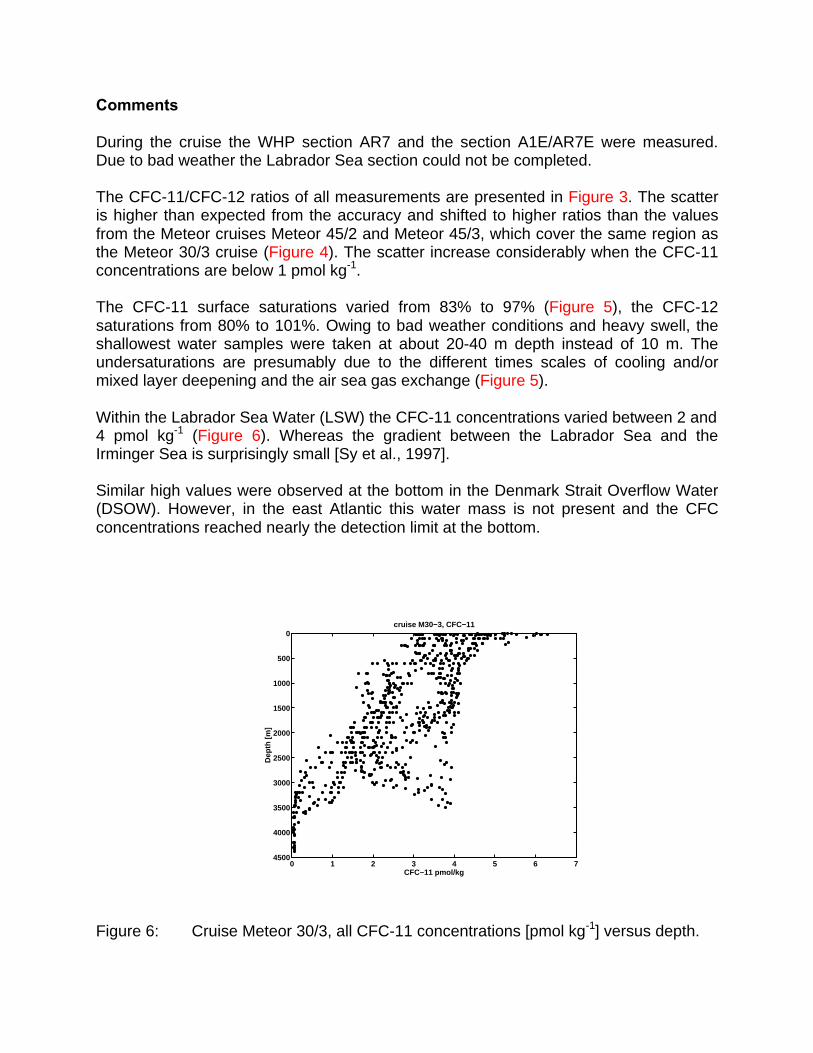
Comments
During the cruise the WHP section AR7 and the section A1E/AR7E were measured.Due to bad weather the Labrador Sea section could not be completed.
The CFC-11/CFC-12 ratios of all measurements are presented in Figure 3. The scatteris higher than expected from the accuracy and shifted to higher ratios than the valuesfrom the Meteor cruises Meteor 45/2 and Meteor 45/3, which cover the same region asthe Meteor 30/3 cruise (Figure 4). The scatter increase considerably when the CFC-11concentrations are below 1 pmol kg-1.
The CFC-11 surface saturations varied from 83% to 97% (Figure 5), the CFC-12saturations from 80% to 101%. Owing to bad weather conditions and heavy swell, theshallowest water samples were taken at about 20-40 m depth instead of 10 m. Theundersaturations are presumably due to the different times scales of cooling and/ormixed layer deepening and the air sea gas exchange (Figure 5).
Within the Labrador Sea Water (LSW) the CFC-11 concentrations varied between 2 and4 pmol kg-1 (Figure 6). Whereas the gradient between the Labrador Sea and theIrminger Sea is surprisingly small [Sy et al., 1997].
Similar high values were observed at the bottom in the Denmark Strait Overflow Water(DSOW). However, in the east Atlantic this water mass is not present and the CFCconcentrations reached nearly the detection limit at the bottom.
Figure 6: Cruise Meteor 30/3, all CFC-11 concentrations [pmol kg-1] versus depth.
0 1 2 3 4 5 6 74500
4000
3500
3000
2500
2000
1500
1000
500
0
CFC−11 pmol/kg
Dep
th [
m]
cruise M30−3, CFC−11
References
Bullister, J.L. and R.F. Weiss (1988). Determination of CCL3 F and CCL2 F2 inseawater and air. Deep-Sea Res., 35, p. 839{853.
Sy, A., M. Rhein, J.R.N. Lazier, K.P. Koltermann, J. Meincke, A. Putzka, and M. Bersch(1997). Surprisingly rapid cooling of newly formed intermediate waters across theNorth Atlantic Ocean. Nature, 386, p. 675{679.
Appendix
the station file 'meteor303.sum' includes: the bottle file 'meteor303.sea' includes:1 station number 1 station number2 year 2 bottle number3 month 3 depth (dbar)4 day 4 in-situ temperature (°C)5 hour: minutes in decimal system 5 salinity (psu)6 latitude: minutes in decimals 6 CFC-12 (pmol kg-1)7 longitude: minutes in decimals 7 CFC-11 (pmol kg-1)8 water depth (m) 8 WOCE quality flag for CFC-12 and CFC-119 depth of CTD profile (m)
Technical information
Gas chromatograph Shimadzu GC 14GC column stainless steel, packed with Porasil CCooling trap with Porapak T and Porasil CTrap temperatures -30°C, 100°CColumn temperature 70°C, isothermalECD temperature 300°CElectron capture detector ShimadzuChromatogram analysis Shimadzu Integrator C-R4AStandard gas R. Weiss, SIOPrecision CFC-11: 3%, CFC-12: 3%Accuracy CFC-11: 1.1%, CFC-12: 1.2%Blanks negligible
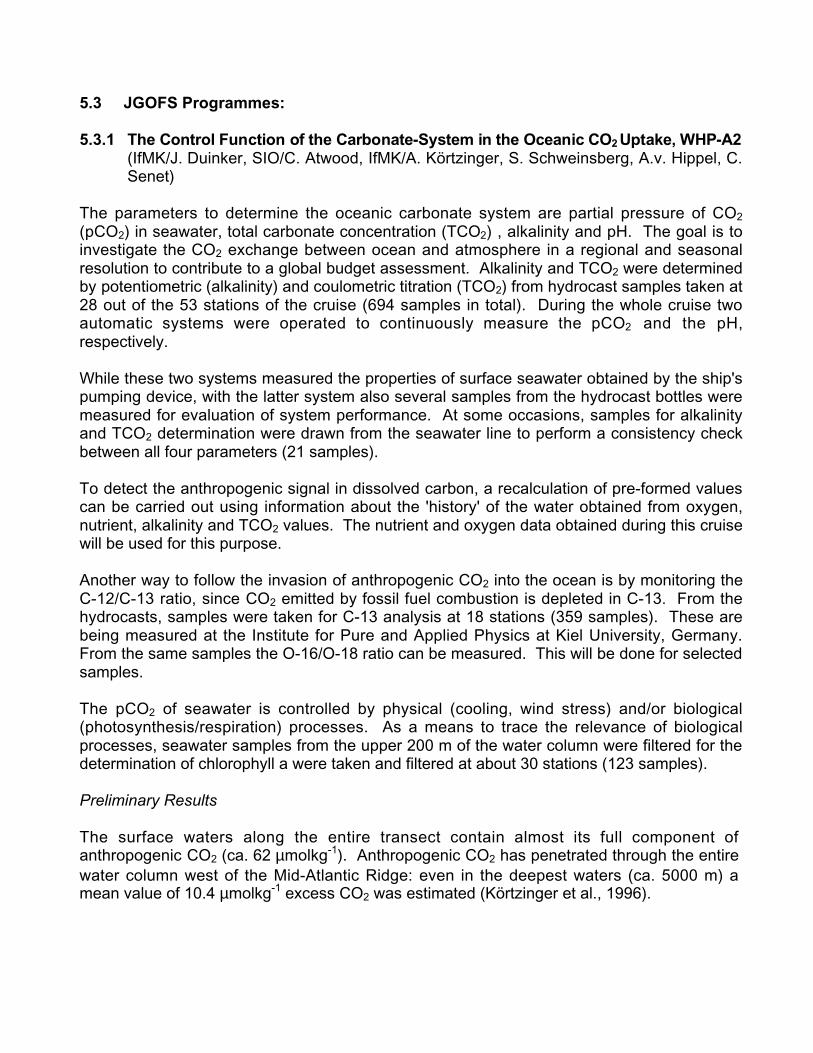
5.3 JGOFS Programmes:
5.3.1 The Control Fun ction of the Carbo nate-System in the Ocean ic CO2 Upt ake, WHP-A2(IfMK/J. Duinker, SIO/C. Atwood, IfMK/A. Körtzinger, S. Schweinsberg, A.v. Hippel, C.Senet)
The parameters to determine the oceanic carbonate system are partial pressure of CO2
(pCO2) in seawater, total carbonate concentration (TCO2) , alkalinity and pH. The goal is toinvestigate the CO2 exchange between ocean and atmosphere in a regional and seasonalresolution to contribute to a global budget assessment. Alkalinity and TCO2 were determinedby potentiometric (alkalinity) and coulometric titration (TCO2) from hydrocast samples taken at28 out of the 53 stations of the cruise (694 samples in total). During the whole cruise twoautomatic systems were operated to continuously measure the pCO2 and the pH,respectively.
While these two systems measured the properties of surface seawater obtained by the ship'spumping device, with the latter system also several samples from the hydrocast bottles weremeasured for evaluation of system performance. At some occasions, samples for alkalinityand TCO2 determination were drawn from the seawater line to perform a consistency checkbetween all four parameters (21 samples).
To detect the anthropogenic signal in dissolved carbon, a recalculation of pre-formed valuescan be carried out using information about the 'history' of the water obtained from oxygen,nutrient, alkalinity and TCO2 values. The nutrient and oxygen data obtained during this cruisewill be used for this purpose.
Another way to follow the invasion of anthropogenic CO2 into the ocean is by monitoring theC-12/C-13 ratio, since CO2 emitted by fossil fuel combustion is depleted in C-13. From thehydrocasts, samples were taken for C-13 analysis at 18 stations (359 samples). These arebeing measured at the Institute for Pure and Applied Physics at Kiel University, Germany.From the same samples the O-16/O-18 ratio can be measured. This will be done for selectedsamples.
The pCO2 of seawater is controlled by physical (cooling, wind stress) and/or biological(photosynthesis/respiration) processes. As a means to trace the relevance of biologicalprocesses, seawater samples from the upper 200 m of the water column were filtered for thedetermination of chlorophyll a were taken and filtered at about 30 stations (123 samples).
Preliminary Results
The surface waters along the entire transect contain almost its full component ofanthropogenic CO2 (ca. 62 µmolkg-1). Anthropogenic CO2 has penetrated through the entirewater column west of the Mid-Atlantic Ridge: even in the deepest waters (ca. 5000 m) amean value of 10.4 µmolkg-1 excess CO2 was estimated (Körtzinger et al., 1996).
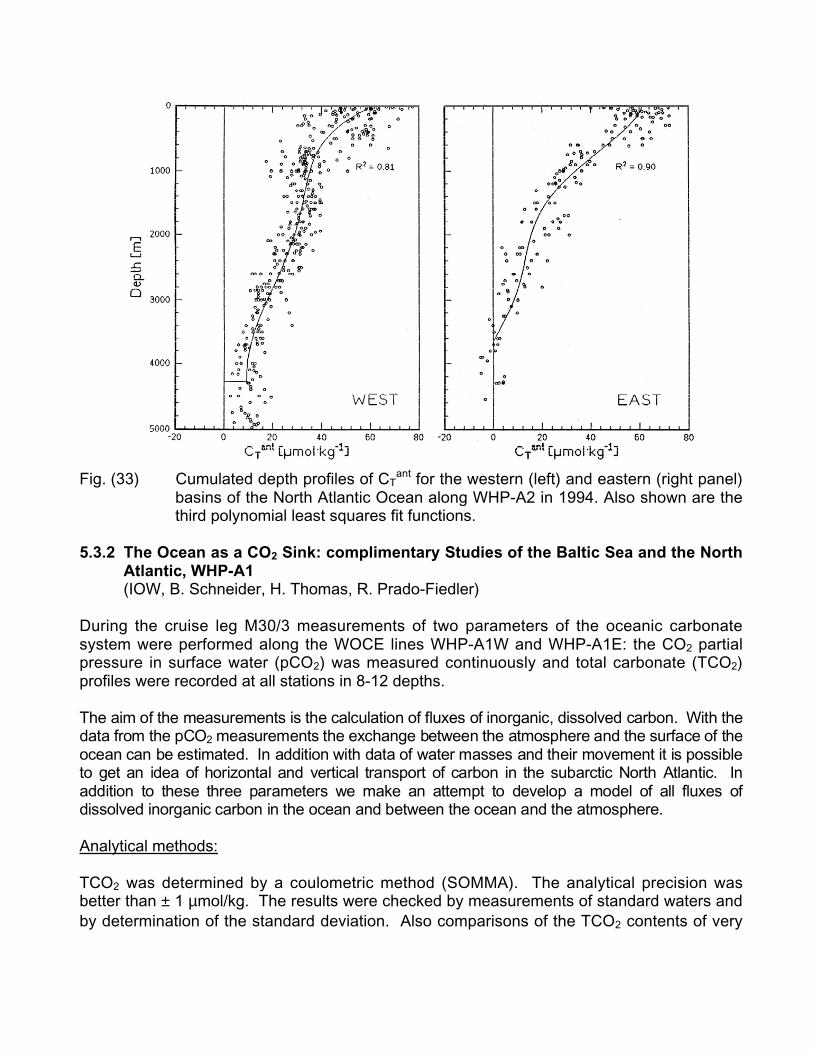
Fig. (33) Cumulated depth profiles of CTant for the western (left) and eastern (right panel)
basins of the North Atlantic Ocean along WHP-A2 in 1994. Also shown are thethird polynomial least squares fit functions.
5.3.2 The Ocean as a CO2 Sink: complimentary Studies of the Baltic Sea and the NorthAtlantic, WHP-A1(IOW, B. Schneider, H. Thomas, R. Prado-Fiedler)
During the cruise leg M30/3 measurements of two parameters of the oceanic carbonatesystem were performed along the WOCE lines WHP-A1W and WHP-A1E: the CO2 partialpressure in surface water (pCO2) was measured continuously and total carbonate (TCO2)profiles were recorded at all stations in 8-12 depths.
The aim o f the measur ements is th e calculatio n of f luxes of ino rganic, dissolved carbon . Wit h thedat a from the p CO2 me asurem ents t he exchange betwee n the atmosp here a nd the surfa ce of theoce an can be estimate d. In addit ion with dat a of water m asses and th eir mo vement it is possibleto get an idea of hor izonta l and vertical tra nsport of ca rbon in the sub arctic North Atlan tic. Inadd ition to the se thr ee par ameter s we make an attem pt to develo p a mo del of all fluxes ofdissolved inorg anic carbon in the ocean and b etween the o cean a nd the atmosphere.
Analytical methods:
TCO2 was determined by a coulometric method (SOMMA). The analytical precision wasbetter than ± 1 µmol/kg. The results were checked by measurements of standard waters andby determination of the standard deviation. Also comparisons of the TCO2 contents of very
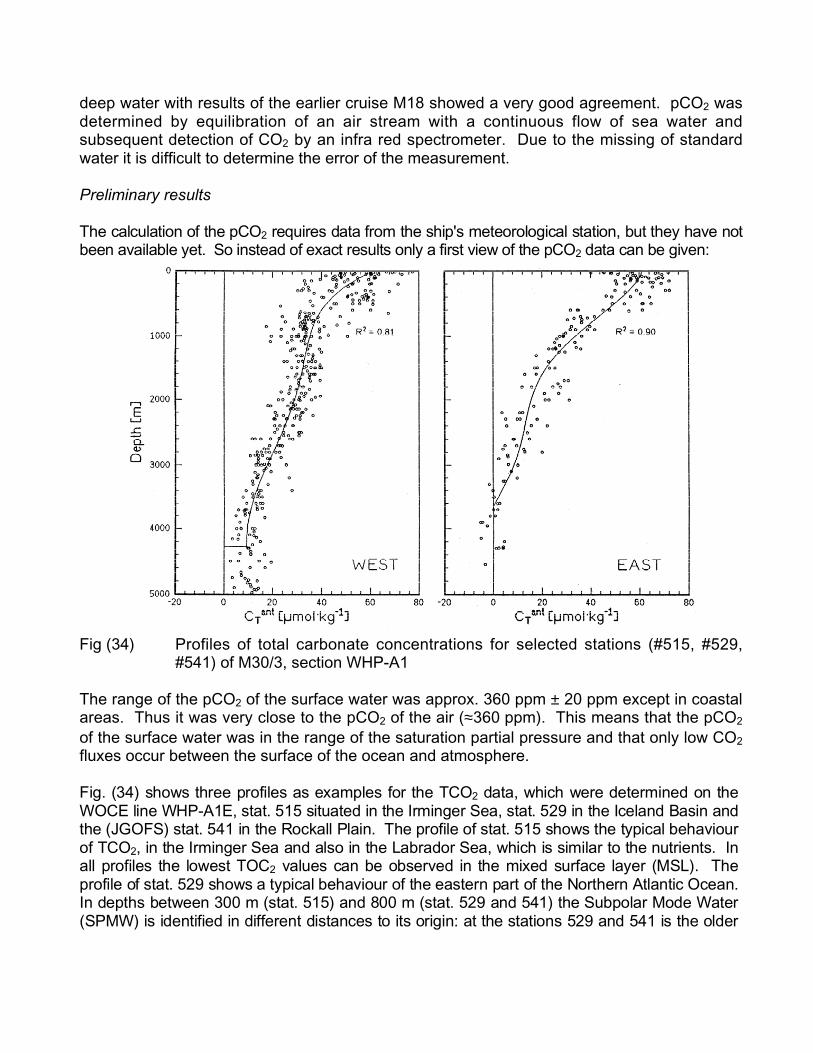
deep water with results of the earlier cruise M18 showed a very good agreement. pCO2 wasdetermined by equilibration of an air stream with a continuous flow of sea water andsubsequent detection of CO2 by an infra red spectrometer. Due to the missing of standardwater it is difficult to determine the error of the measurement.
Preliminary results
The calculation of the pCO2 requires data from the ship's meteorological station, but they have notbeen available yet. So instead of exact results only a first view of the pCO2 data can be given:
Fig (34) Profiles of total carbonate concentrations for selected stations (#515, #529,#541) of M30/3, section WHP-A1
The range of the pCO2 of the surface water was approx. 360 ppm ± 20 ppm except in coastalareas. Thus it was very close to the pCO2 of the air (≈360 ppm). This means that the pCO2
of the surface water was in the range of the saturation partial pressure and that only low CO2
fluxes occur between the surface of the ocean and atmosphere.
F ig . (3 4 ) sh o ws thr e e pr o file s as exa mp le s for th e TCO2 da ta , which we re de te rm ine d on th eWOCE lin e WHP-A1E, sta t. 5 1 5 situa te d in th e I rm in ge r Sea , sta t. 5 2 9 in th e Ice la nd Ba sin and t he ( JG O FS) sta t. 5 4 1 in th e Ro cka ll Plain. T he pr of ile o f sta t. 5 1 5 sh o ws t he typical b eh a viou r o f TCO2, in th e I rm in ge r Sea an d also in th e La b ra do r Sea , which is sim ila r to th e nut rie nt s. Ina ll pro f iles th e lo west TOC2 va lu es ca n be ob se r ve d in th e mixed su rf ace laye r (M SL ) . Th ep ro file of sta t. 52 9 sh o ws a t ypica l b eh aviour of th e e aste r n pa rt of t he No rt h ern Atlan tic O ce a n. I n de pt h s be t we en 30 0 m (sta t. 51 5) an d 80 0 m (sta t. 52 9 an d 541 ) the Sub po la r Mod e Wat er ( SPMW) is id e nt if ie d in dif fe re n t dista nces to it s or ig in: at the st at io n s 52 9 and 54 1 is th e old er
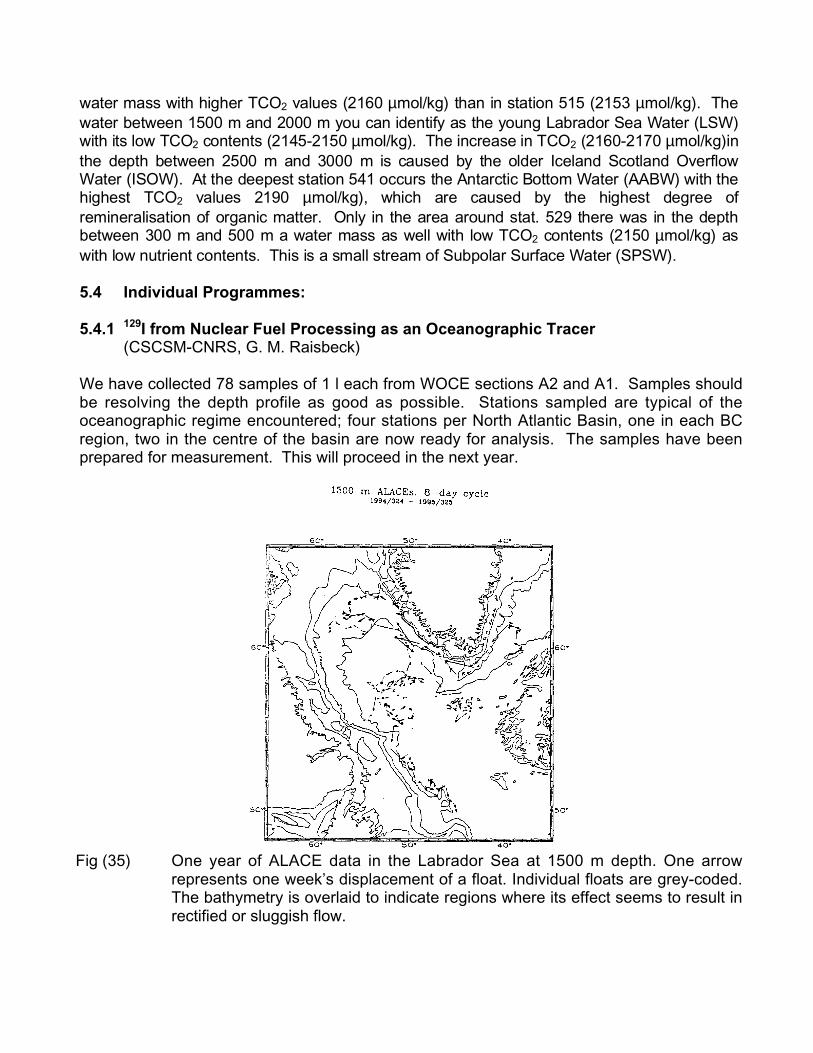
wat er ma ss with hig h er TCO2 va lu es (2 16 0 µ m ol/kg) th an in sta t io n 515 (21 5 3 µ m ol/kg) . Th e wat er be twee n 150 0 m and 20 00 m yo u can ide n tify as the yo un g Lab ra d or Se a Wa te r (LSW)wit h it s low TCO2 co nt en t s (2 1 45 -2 15 0 µ m ol/kg). Th e incre a se in T CO 2 (2 16 0-2 17 0 µ m ol/kg) int he dep t h be t we en 25 00 m an d 30 0 0 m is ca use d by th e old er Icelan d Sco tla nd Ove r flowWat er (I SO W) . At t h e de e pe st st at io n 5 41 o ccu rs th e An t ar ct ic Bo tt o m Wa t er (AABW) with t he h ig he st TCO2 va lu es 21 90 µ m ol/kg) , which ar e cau se d by th e hig h est de g re e ofr em in er a lisa t io n of or ga n ic mat t er . On ly in the ar ea ar ou nd sta t. 52 9 th e re was in th e de pt h b et we en 30 0 m and 50 0 m a wat er ma ss as well wit h low TCO2 co nt en t s (2 1 50 µ m ol/kg) aswit h lo w n ut r ie nt co nt en t s. Th is is a sm all str e am o f Sub po la r Sur f ace Wa t er ( SPSW) .
5.4 Individual Programmes:
5.4.1 129I from Nuclear Fuel Processing as an Oceanographic Tracer(CSCSM-CNRS, G. M. Raisbeck)
We have collected 78 samples of 1 l each from WOCE sections A2 and A1. Samples shouldbe resolving the depth profile as good as possible. Stations sampled are typical of theoceanographic regime encountered; four stations per North Atlantic Basin, one in each BCregion, two in the centre of the basin are now ready for analysis. The samples have beenprepared for measurement. This will proceed in the next year.
Fig (35) One year of ALACE data in the Labrador Sea at 1500 m depth. One arrowrepresents one week’s displacement of a float. Individual floats are grey-coded.The bathymetry is overlaid to indicate regions where its effect seems to result inrectified or sluggish flow.
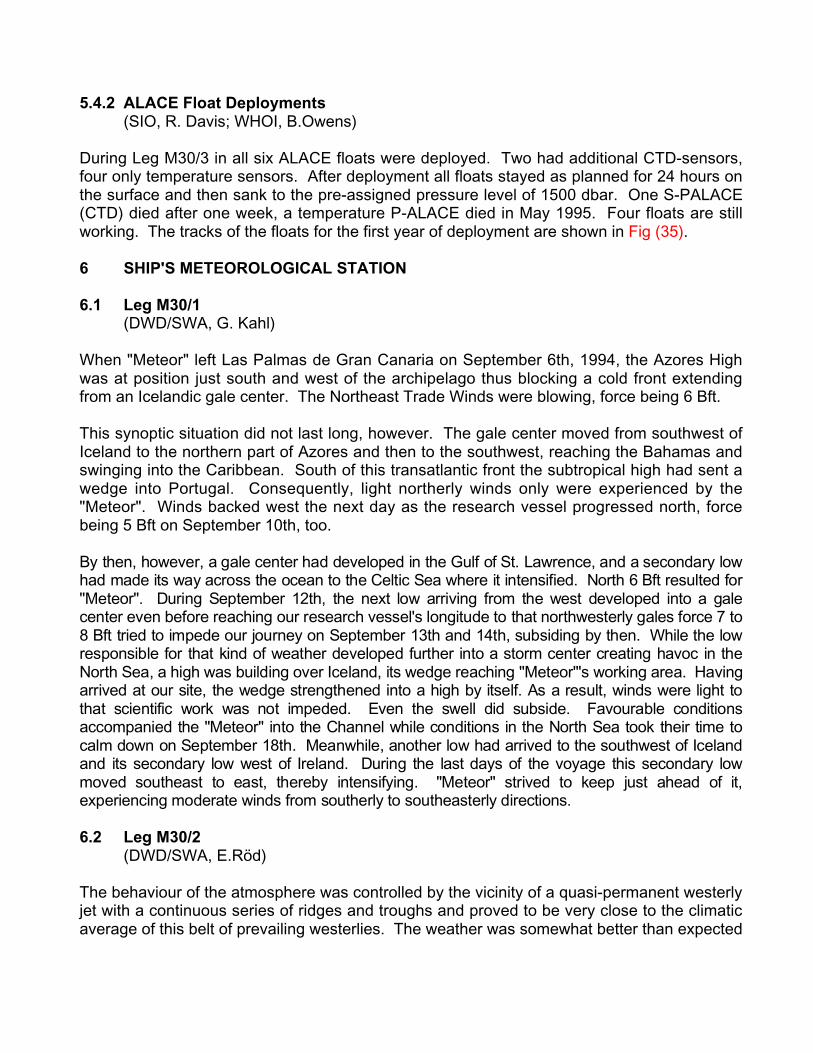
5.4.2 ALACE Float Deployments(SIO, R. Davis; WHOI, B.Owens)
During Leg M30/3 in all six ALACE floats were deployed. Two had additional CTD-sensors,four only temperature sensors. After deployment all floats stayed as planned for 24 hours onthe surface and then sank to the pre-assigned pressure level of 1500 dbar. One S-PALACE(CTD) died after one week, a temperature P-ALACE died in May 1995. Four floats are stillworking. The tracks of the floats for the first year of deployment are shown in Fig (35).
6 SHIP'S METEOROLOGICAL STATION
6.1 Leg M30/1(DWD/SWA, G. Kahl)
When "Meteor" left Las Palmas de Gran Canaria on September 6th, 1994, the Azores Highwas at position just south and west of the archipelago thus blocking a cold front extendingfrom an Icelandic gale center. The Northeast Trade Winds were blowing, force being 6 Bft.
This synoptic situation did not last long, however. The gale center moved from southwest ofIceland to the northern part of Azores and then to the southwest, reaching the Bahamas andswinging into the Caribbean. South of this transatlantic front the subtropical high had sent awedge into Portugal. Consequently, light northerly winds only were experienced by the"Meteor". Winds backed west the next day as the research vessel progressed north, forcebeing 5 Bft on September 10th, too.
By then, howeve r, a g ale cen ter ha d deve loped in the Gulf of St. Lawre nce, a nd a seconda ry lowhad made its wa y acro ss the ocean to th e Celt ic Sea where it in tensif ied. North 6 Bft resulted fo r"Me teor". During Sep tember 12th, the next lo w arriving from th e west developed into a galecen ter even bef ore re aching our r esearch vessel's longitu de to that nor thwest erly g ales f orce 7 to8 Bft tried to im pede our jou rney on Sept ember 13th and 14t h, sub siding by th en. While the lowresponsib le for that kind of weat her de velope d furt her in to a storm cen ter cr eating havoc in th eNor th Sea , a high was build ing over Ice land, its we dge re aching "Met eor"'s working are a. Ha vingarr ived at our site, the we dge st rength ened into a high by itse lf. As a result, winds were light to tha t scie ntific work was no t impe ded. Even the swe ll did subside. Favoura ble co nditio nsaccompanied the "Mete or" in to the Chann el while con dition s in the Nor th Sea took their time tocalm down on Se ptembe r 18th . Mea nwhile , anot her lo w had arrive d to the sou thwest of Icelandand its seconda ry low west of Ire land. Durin g the last days of the voyage this seconda ry lowmoved sou theast to ea st, th ereby intensifying . "Me teor" str ived to keep just ahead of it, exp eriencing mo derate winds from southe rly to sou theast erly d irections.
6.2 Leg M30/2(DWD/SWA, E.Röd)
The behaviour of the atmosphere was controlled by the vicinity of a quasi-permanent westerlyjet with a continuous series of ridges and troughs and proved to be very close to the climaticaverage of this belt of prevailing westerlies. The weather was somewhat better than expected
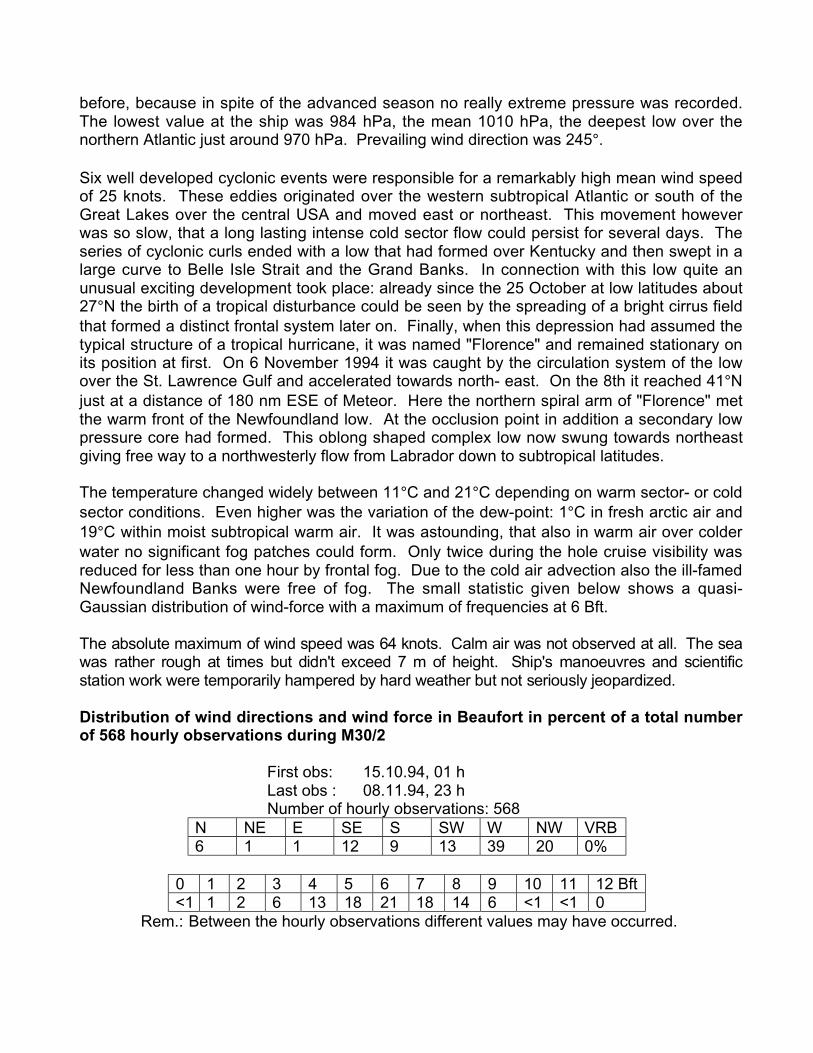
before, because in spite of the advanced season no really extreme pressure was recorded.The lowest value at the ship was 984 hPa, the mean 1010 hPa, the deepest low over thenorthern Atlantic just around 970 hPa. Prevailing wind direction was 245°.
Six well developed cyclonic events were responsible for a remarkably high mean wind speedof 25 knots. These eddies originated over the western subtropical Atlantic or south of theGreat Lakes over the central USA and moved east or northeast. This movement howeverwas so slow, that a long lasting intense cold sector flow could persist for several days. Theseries of cyclonic curls ended with a low that had formed over Kentucky and then swept in alarge curve to Belle Isle Strait and the Grand Banks. In connection with this low quite anunusual exciting development took place: already since the 25 October at low latitudes about27°N the birth of a tropical disturbance could be seen by the spreading of a bright cirrus fieldthat formed a distinct frontal system later on. Finally, when this depression had assumed thetypical structure of a tropical hurricane, it was named "Florence" and remained stationary onits position at first. On 6 November 1994 it was caught by the circulation system of the lowover the St. Lawrence Gulf and accelerated towards north- east. On the 8th it reached 41°Njust at a distance of 180 nm ESE of Meteor. Here the northern spiral arm of "Florence" metthe warm front of the Newfoundland low. At the occlusion point in addition a secondary lowpressure core had formed. This oblong shaped complex low now swung towards northeastgiving free way to a northwesterly flow from Labrador down to subtropical latitudes.
The temperature changed widely between 11°C and 21°C depending on warm sector- or coldsector conditions. Even higher was the variation of the dew-point: 1°C in fresh arctic air and19°C within moist subtropical warm air. It was astounding, that also in warm air over colderwater no significant fog patches could form. Only twice during the hole cruise visibility wasreduced for less than one hour by frontal fog. Due to the cold air advection also the ill-famedNewfoundland Banks were free of fog. The small statistic given below shows a quasi-Gaussian distribution of wind-force with a maximum of frequencies at 6 Bft.
The absolute ma ximum of win d spee d was 64 kno ts. Calm air was not ob served at all. Th e seawas rathe r roug h at times but did n't exceed 7 m of height . Ship's ma noeuvr es and scien tificsta tion work we re tem porarily ham pered by har d weat her bu t not seriou sly jeo pardized.
Distribution of wind directions and wind force in Beaufort in percent of a total numberof 568 hourly observations during M30/2
First obs: 15.10.94, 01 hLast obs : 08.11.94, 23 hNumber of hourly observations: 568
N NE E SE S SW W NW VRB6 1 1 12 9 13 39 20 0%
0 1 2 3 4 5 6 7 8 9 10 11 12 Bft<1 1 2 6 13 18 21 18 14 6 <1 <1 0
Rem.: Between the hourly observations different values may have occurred.
6.3 Leg M30/3(DWD/SWA, E. Röd)
The meteorological conditions during the operational phase of the cruise M30/3 betweenHamilton Bank and Porcupine Bank from the 16th of November to the 15th of December 1994.
Th is le g of the vo ya ge back to Eur op e was lo cat ed ap pro xim at ely 90 0 nm nort h of the pr ecedingon e fro m Eur ope to Newf oun dland an d the ref or e much closer or even directly unde rne at h theaxis of th e polar je t stre am . Ver y fre que nt ly in th e d aily rad io- so und ing s maximu m win ds ra ngingfr om 80 to 160 kt s cou ld be se en a few th ou san d fee t unde r the tr op opa use , which in po lar cold air cam e down as far as 7 to 8 km with tem pe rat ure s hig her than -5 0°C. Whe rea s hur rican e"F lo ren ce" could app roa ch th e rout e of "Me te or" du ring the preceding le g and jo in a str ong pola rfr on t low la te ron , t he se con d hur rican e " Gor do n" - e xt rao rdina rily lat e in t he se aso n - r ema in ed insu bt rop ica l lat itu de s f ar away in th e sout h and fa de d a way n ear Flor ida. In br ief , con dit io ns mig ht be su mm arized as a typical je tstre am we ath er with rap id ly alt er nat ing lows an d rid ges. Cyclonicre gime however was p revailin g, which ma y a lso be see n in the avera ge at mosph eric pre ssu re of 99 0 hPa. Corr espondin g to the se circumstan ces wind wa s rat her stro ng with a m ea n valu e of 28kt s, th at is by 17 % mor e t ha n on the so uth er n leg. Cycloge net ic pr oce sses wer e mostly inte nse ,bu t not extr eme . Th e most spectacular pre ssure fa ll re ach ed 17 hPa in 3 hou rs dee pe nin g afr on tal wa ve in to a vig oro us st orm cent re of 95 0 hPa in the Ir minge r Sea an d Den mar k Str ait .Th is vo rte x pro duced th e hea vie st st orm of the cru ise on the 26 th an d 27th of Nove mb er wit hne ar ly con st ant W 10 gu shing up fr eq uen tly into fu ll 12 Be au for t.
This stor m was followed by a less windy week which opened a lar ge "we ather window" for statio nwor k. Be tween the 5t h and the 11 th of Decemb er a new sto rmy pe riod made re search imp ossible: rap id pre ssure fall of near ly 5 hPa /h ann ounced the approach of a vorte x near lyequ ally intense (963 hPa ) as the pre ceding one. The sharp pressur e rise in it s cold secto roriginate d a lo ng lasting nor thwest erly to west erly flow. On the 6th of Dece mber hurrica ne-likegusts exceeding 100 knots m arked the ab solute wind maximu m of t he who le cru ise. Toward s theend of No vember at 59 °N/3 4°W as a co unterp art to subtr opical hurricanes a typical Po lar Lo wcou ld be observed nea r the ship. Under weak gradie nt con dition s, which geo stroph ically could have brou ght on ly 2 or 3 Bft , wind remained ne arly constan tly ab out 7 Bft . Exa mining close ly the sat ellite image the sub-sca le polar edd y with its charact eristic stru cture could be det ected.
On 9 December, 1994 dramatic numerical forecasts suggested to leave the ship's position assoon as possible heading towards the English Channel. Fortunately already on the followingday this prognosis was replaced by a quite optimistic one which proved to be correct when"Meteor" had returned to the working area. Under high pressure conditions the transect couldbe completed without any meteorological problems. This case was quite a good lesson aboutthe reliability of medium range forecasts. It was striking during this cruise that severaldepressions were born on the leeward side of the Rocky Mountains west of the Great Lakes,but even more originated over the area between the Caribbean Sea and the Bermuda. This isto be ascribed to the fact, that frequent Anticyclones over the North American continent drovearctic cold air far down into the south against subtropical warm air, whereas cyclogeneticprocesses in more or less uniform cold air masses over Canada remained rather weak.
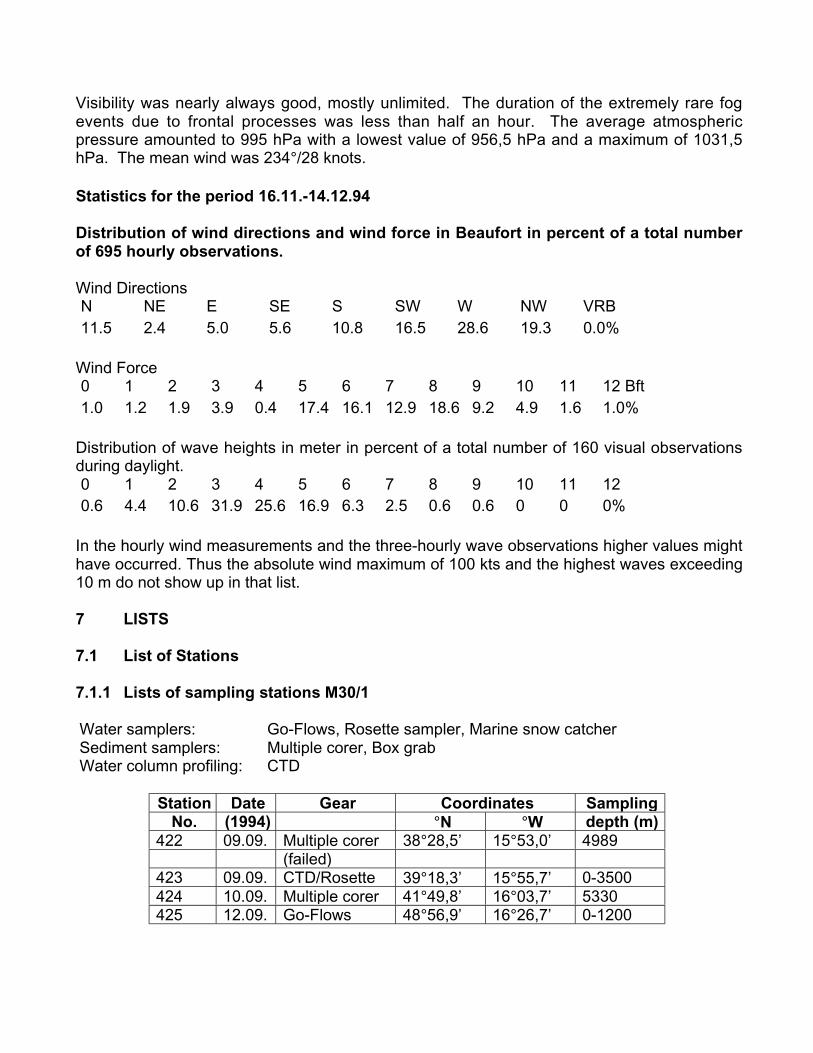
Visibility was nearly always good, mostly unlimited. The duration of the extremely rare fogevents due to frontal processes was less than half an hour. The average atmosphericpressure amounted to 995 hPa with a lowest value of 956,5 hPa and a maximum of 1031,5hPa. The mean wind was 234°/28 knots.
Statistics for the period 16.11.-14.12.94
Distribution of wind directions and wind force in Beaufort in percent of a total numberof 695 hourly observations.
Wind DirectionsN NE E SE S SW W NW VRB11.5 2.4 5.0 5.6 10.8 16.5 28.6 19.3 0.0%
Wind Force0 1 2 3 4 5 6 7 8 9 10 11 12 Bft1.0 1.2 1.9 3.9 0.4 17.4 16.1 12.9 18.6 9.2 4.9 1.6 1.0%
Distribution of wave heights in meter in percent of a total number of 160 visual observationsduring daylight.0 1 2 3 4 5 6 7 8 9 10 11 120.6 4.4 10.6 31.9 25.6 16.9 6.3 2.5 0.6 0.6 0 0 0%
In the hourly wind measurements and the three-hourly wave observations higher values mighthave occurred. Thus the absolute wind maximum of 100 kts and the highest waves exceeding10 m do not show up in that list.
7 LISTS
7.1 List of Stations
7.1.1 Lists of sampling stations M30/1
Water samplers: Go-Flows, Rosette sampler, Marine snow catcherSediment samplers: Multiple corer, Box grabWater column profiling: CTD
Station Date Gear Coordinates SamplingNo. (1994) °N °W depth (m)
422 09.09. Multiple corer 38°28,5’ 15°53,0’ 4989(failed)
423 09.09. CTD/Rosette 39°18,3’ 15°55,7’ 0-3500424 10.09. Multiple corer 41°49,8’ 16°03,7’ 5330425 12.09. Go-Flows 48°56,9’ 16°26,7’ 0-1200
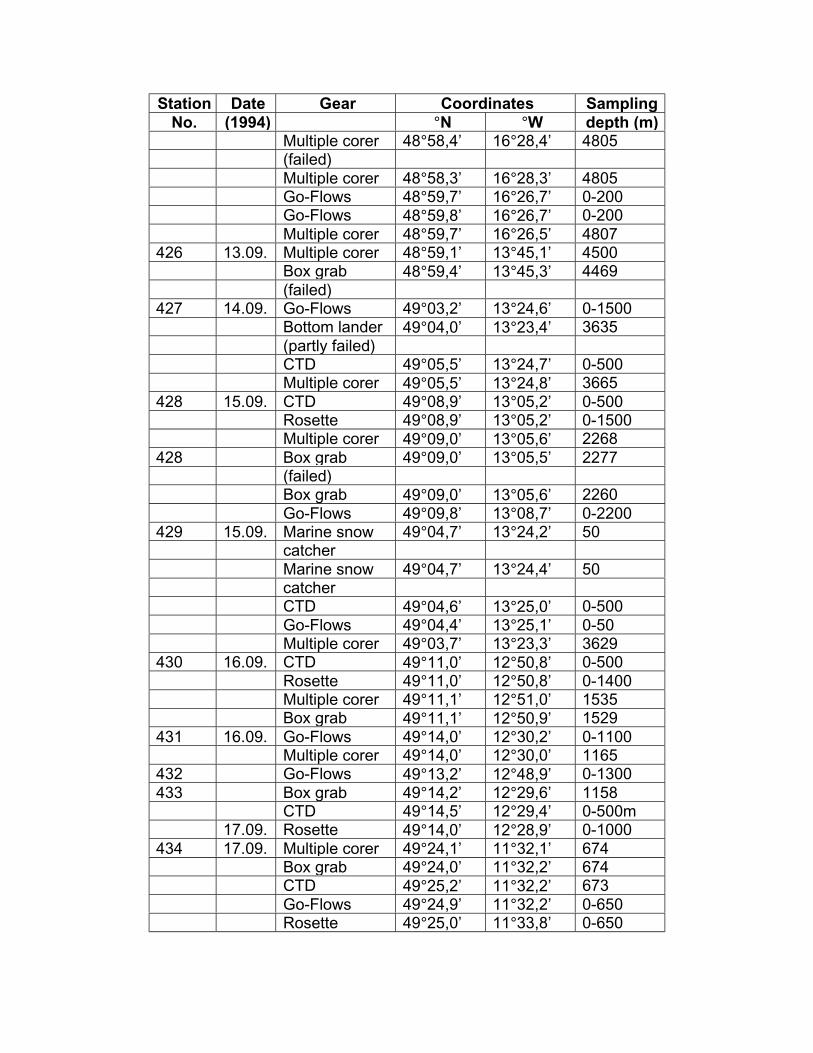
Station Date Gear Coordinates SamplingNo. (1994) °N °W depth (m)
Multiple corer 48°58,4’ 16°28,4’ 4805(failed)Multiple corer 48°58,3’ 16°28,3’ 4805Go-Flows 48°59,7’ 16°26,7’ 0-200Go-Flows 48°59,8’ 16°26,7’ 0-200Multiple corer 48°59,7’ 16°26,5’ 4807
426 13.09. Multiple corer 48°59,1’ 13°45,1’ 4500Box grab 48°59,4’ 13°45,3’ 4469(failed)
427 14.09. Go-Flows 49°03,2’ 13°24,6’ 0-1500Bottom lander 49°04,0’ 13°23,4’ 3635(partly failed)CTD 49°05,5’ 13°24,7’ 0-500Multiple corer 49°05,5’ 13°24,8’ 3665
428 15.09. CTD 49°08,9’ 13°05,2’ 0-500Rosette 49°08,9’ 13°05,2’ 0-1500Multiple corer 49°09,0’ 13°05,6’ 2268
428 Box grab 49°09,0’ 13°05,5’ 2277(failed)Box grab 49°09,0’ 13°05,6’ 2260Go-Flows 49°09,8’ 13°08,7’ 0-2200
429 15.09. Marine snow 49°04,7’ 13°24,2’ 50catcherMarine snow 49°04,7’ 13°24,4’ 50catcherCTD 49°04,6’ 13°25,0’ 0-500Go-Flows 49°04,4’ 13°25,1’ 0-50Multiple corer 49°03,7’ 13°23,3’ 3629
430 16.09. CTD 49°11,0’ 12°50,8’ 0-500Rosette 49°11,0’ 12°50,8’ 0-1400Multiple corer 49°11,1’ 12°51,0’ 1535Box grab 49°11,1’ 12°50,9’ 1529
431 16.09. Go-Flows 49°14,0’ 12°30,2’ 0-1100Multiple corer 49°14,0’ 12°30,0’ 1165
432 Go-Flows 49°13,2’ 12°48,9’ 0-1300433 Box grab 49°14,2’ 12°29,6’ 1158
CTD 49°14,5’ 12°29,4’ 0-500m17.09. Rosette 49°14,0’ 12°28,9’ 0-1000
434 17.09. Multiple corer 49°24,1’ 11°32,1’ 674Box grab 49°24,0’ 11°32,2’ 674CTD 49°25,2’ 11°32,2’ 673Go-Flows 49°24,9’ 11°32,2’ 0-650Rosette 49°25,0’ 11°33,8’ 0-650
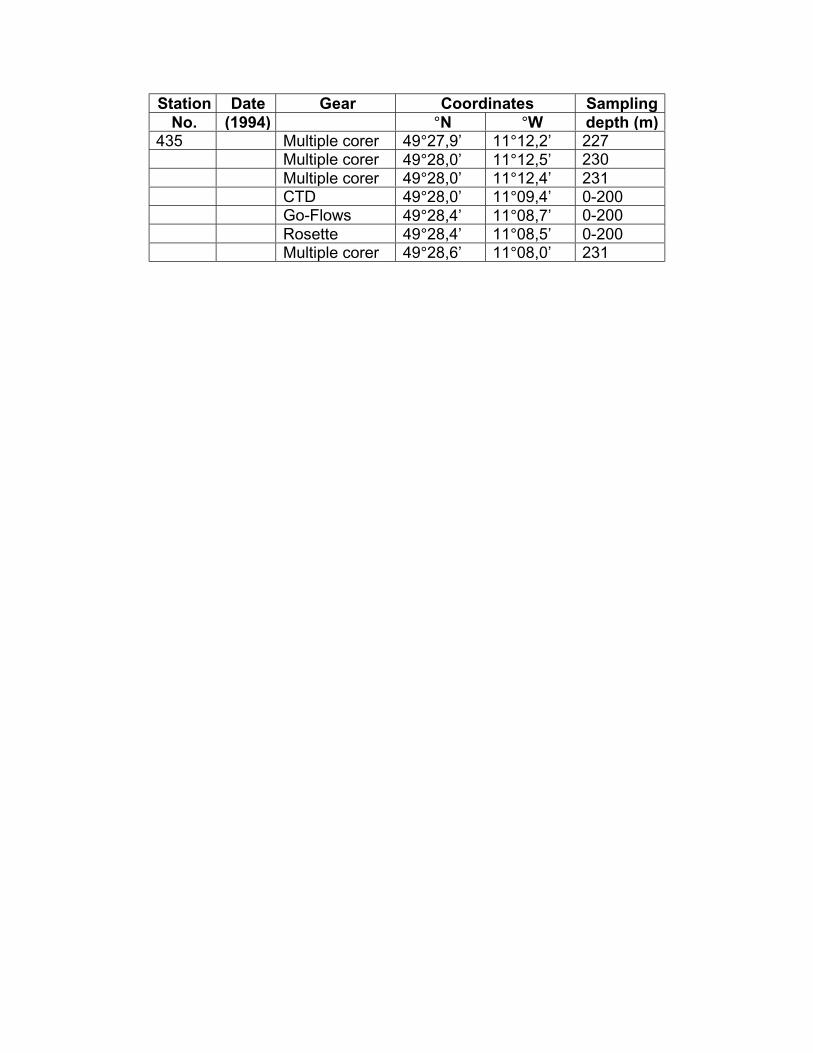
Station Date Gear Coordinates SamplingNo. (1994) °N °W depth (m)
435 Multiple corer 49°27,9’ 11°12,2’ 227Multiple corer 49°28,0’ 11°12,5’ 230Multiple corer 49°28,0’ 11°12,4’ 231CTD 49°28,0’ 11°09,4’ 0-200Go-Flows 49°28,4’ 11°08,7’ 0-200Rosette 49°28,4’ 11°08,5’ 0-200Multiple corer 49°28,6’ 11°08,0’ 231
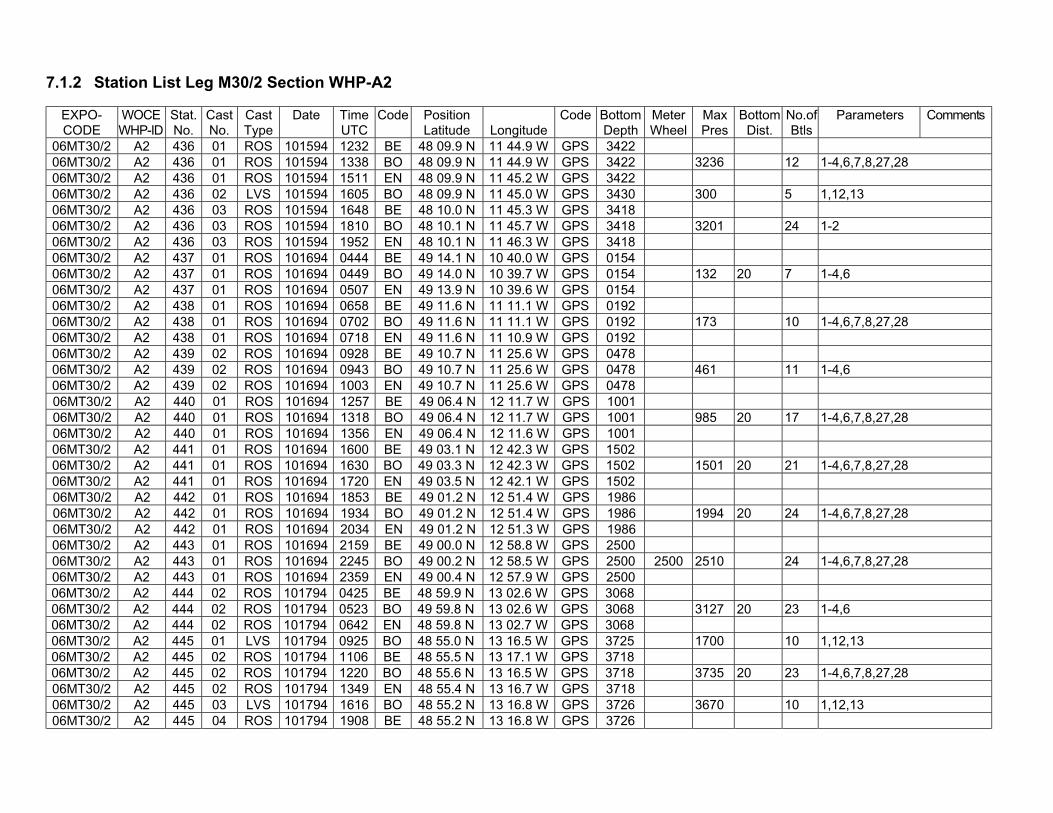
7.1.2 Station List Leg M30/2 Section WHP-A2
EXPO-CODE
WOCEWHP-ID
Stat.No.
CastNo.
CastType
Date TimeUTC
Code PositionLatitude Longitude
Code BottomDepth
MeterWheel
MaxPres
BottomDist.
No.ofBtls
Parameters Comments
06MT30/2 A2 436 01 ROS 101594 1232 BE 48 09.9 N 11 44.9 W GPS 342206MT30/2 A2 436 01 ROS 101594 1338 BO 48 09.9 N 11 44.9 W GPS 3422 3236 12 1-4,6,7,8,27,2806MT30/2 A2 436 01 ROS 101594 1511 EN 48 09.9 N 11 45.2 W GPS 342206MT30/2 A2 436 02 LVS 101594 1605 BO 48 09.9 N 11 45.0 W GPS 3430 300 5 1,12,1306MT30/2 A2 436 03 ROS 101594 1648 BE 48 10.0 N 11 45.3 W GPS 341806MT30/2 A2 436 03 ROS 101594 1810 BO 48 10.1 N 11 45.7 W GPS 3418 3201 24 1-206MT30/2 A2 436 03 ROS 101594 1952 EN 48 10.1 N 11 46.3 W GPS 341806MT30/2 A2 437 01 ROS 101694 0444 BE 49 14.1 N 10 40.0 W GPS 015406MT30/2 A2 437 01 ROS 101694 0449 BO 49 14.0 N 10 39.7 W GPS 0154 132 20 7 1-4,606MT30/2 A2 437 01 ROS 101694 0507 EN 49 13.9 N 10 39.6 W GPS 015406MT30/2 A2 438 01 ROS 101694 0658 BE 49 11.6 N 11 11.1 W GPS 019206MT30/2 A2 438 01 ROS 101694 0702 BO 49 11.6 N 11 11.1 W GPS 0192 173 10 1-4,6,7,8,27,2806MT30/2 A2 438 01 ROS 101694 0718 EN 49 11.6 N 11 10.9 W GPS 019206MT30/2 A2 439 02 ROS 101694 0928 BE 49 10.7 N 11 25.6 W GPS 047806MT30/2 A2 439 02 ROS 101694 0943 BO 49 10.7 N 11 25.6 W GPS 0478 461 11 1-4,606MT30/2 A2 439 02 ROS 101694 1003 EN 49 10.7 N 11 25.6 W GPS 047806MT30/2 A2 440 01 ROS 101694 1257 BE 49 06.4 N 12 11.7 W GPS 100106MT30/2 A2 440 01 ROS 101694 1318 BO 49 06.4 N 12 11.7 W GPS 1001 985 20 17 1-4,6,7,8,27,2806MT30/2 A2 440 01 ROS 101694 1356 EN 49 06.4 N 12 11.6 W GPS 100106MT30/2 A2 441 01 ROS 101694 1600 BE 49 03.1 N 12 42.3 W GPS 150206MT30/2 A2 441 01 ROS 101694 1630 BO 49 03.3 N 12 42.3 W GPS 1502 1501 20 21 1-4,6,7,8,27,2806MT30/2 A2 441 01 ROS 101694 1720 EN 49 03.5 N 12 42.1 W GPS 150206MT30/2 A2 442 01 ROS 101694 1853 BE 49 01.2 N 12 51.4 W GPS 198606MT30/2 A2 442 01 ROS 101694 1934 BO 49 01.2 N 12 51.4 W GPS 1986 1994 20 24 1-4,6,7,8,27,2806MT30/2 A2 442 01 ROS 101694 2034 EN 49 01.2 N 12 51.3 W GPS 198606MT30/2 A2 443 01 ROS 101694 2159 BE 49 00.0 N 12 58.8 W GPS 250006MT30/2 A2 443 01 ROS 101694 2245 BO 49 00.2 N 12 58.5 W GPS 2500 2500 2510 24 1-4,6,7,8,27,2806MT30/2 A2 443 01 ROS 101694 2359 EN 49 00.4 N 12 57.9 W GPS 250006MT30/2 A2 444 02 ROS 101794 0425 BE 48 59.9 N 13 02.6 W GPS 306806MT30/2 A2 444 02 ROS 101794 0523 BO 49 59.8 N 13 02.6 W GPS 3068 3127 20 23 1-4,606MT30/2 A2 444 02 ROS 101794 0642 EN 48 59.8 N 13 02.7 W GPS 306806MT30/2 A2 445 01 LVS 101794 0925 BO 48 55.0 N 13 16.5 W GPS 3725 1700 10 1,12,1306MT30/2 A2 445 02 ROS 101794 1106 BE 48 55.5 N 13 17.1 W GPS 371806MT30/2 A2 445 02 ROS 101794 1220 BO 48 55.6 N 13 16.5 W GPS 3718 3735 20 23 1-4,6,7,8,27,2806MT30/2 A2 445 02 ROS 101794 1349 EN 48 55.4 N 13 16.7 W GPS 371806MT30/2 A2 445 03 LVS 101794 1616 BO 48 55.2 N 13 16.8 W GPS 3726 3670 10 1,12,1306MT30/2 A2 445 04 ROS 101794 1908 BE 48 55.2 N 13 16.8 W GPS 3726
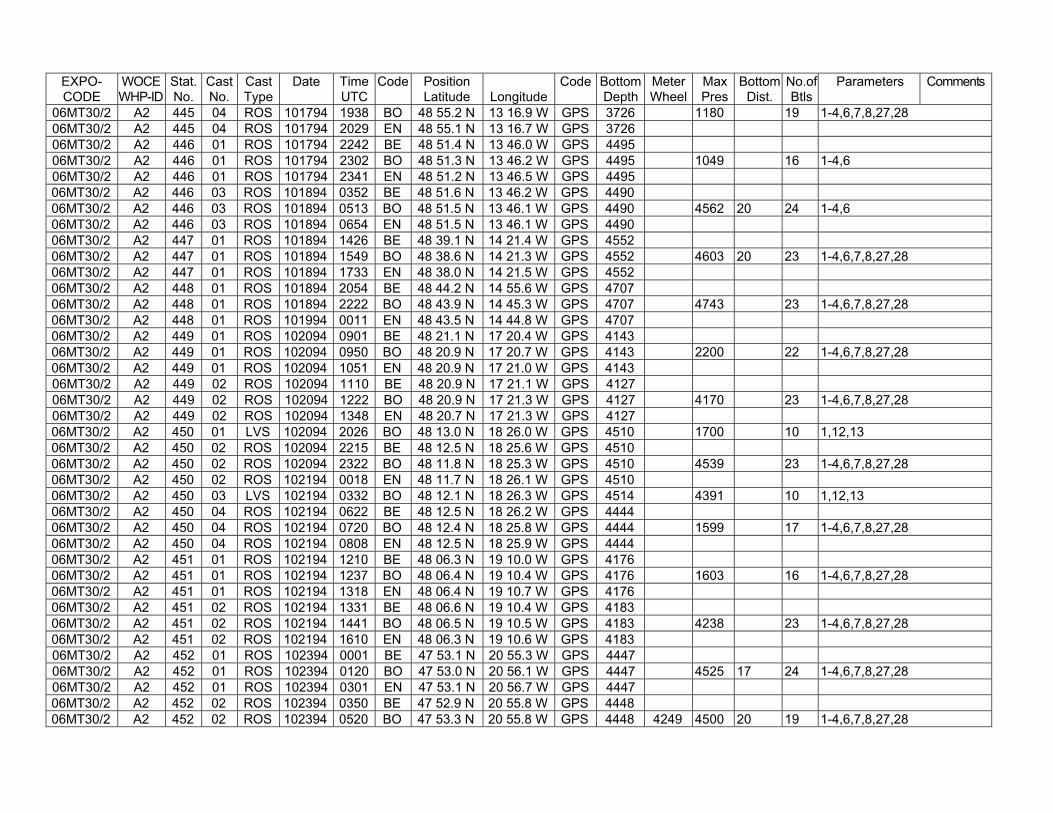
EXPO-CODE
WOCEWHP-ID
Stat.No.
CastNo.
CastType
Date TimeUTC
Code PositionLatitude Longitude
Code BottomDepth
MeterWheel
MaxPres
BottomDist.
No.ofBtls
Parameters Comments
06MT30/2 A2 445 04 ROS 101794 1938 BO 48 55.2 N 13 16.9 W GPS 3726 1180 19 1-4,6,7,8,27,2806MT30/2 A2 445 04 ROS 101794 2029 EN 48 55.1 N 13 16.7 W GPS 372606MT30/2 A2 446 01 ROS 101794 2242 BE 48 51.4 N 13 46.0 W GPS 449506MT30/2 A2 446 01 ROS 101794 2302 BO 48 51.3 N 13 46.2 W GPS 4495 1049 16 1-4,606MT30/2 A2 446 01 ROS 101794 2341 EN 48 51.2 N 13 46.5 W GPS 449506MT30/2 A2 446 03 ROS 101894 0352 BE 48 51.6 N 13 46.2 W GPS 449006MT30/2 A2 446 03 ROS 101894 0513 BO 48 51.5 N 13 46.1 W GPS 4490 4562 20 24 1-4,606MT30/2 A2 446 03 ROS 101894 0654 EN 48 51.5 N 13 46.1 W GPS 449006MT30/2 A2 447 01 ROS 101894 1426 BE 48 39.1 N 14 21.4 W GPS 455206MT30/2 A2 447 01 ROS 101894 1549 BO 48 38.6 N 14 21.3 W GPS 4552 4603 20 23 1-4,6,7,8,27,2806MT30/2 A2 447 01 ROS 101894 1733 EN 48 38.0 N 14 21.5 W GPS 455206MT30/2 A2 448 01 ROS 101894 2054 BE 48 44.2 N 14 55.6 W GPS 470706MT30/2 A2 448 01 ROS 101894 2222 BO 48 43.9 N 14 45.3 W GPS 4707 4743 23 1-4,6,7,8,27,2806MT30/2 A2 448 01 ROS 101994 0011 EN 48 43.5 N 14 44.8 W GPS 470706MT30/2 A2 449 01 ROS 102094 0901 BE 48 21.1 N 17 20.4 W GPS 414306MT30/2 A2 449 01 ROS 102094 0950 BO 48 20.9 N 17 20.7 W GPS 4143 2200 22 1-4,6,7,8,27,2806MT30/2 A2 449 01 ROS 102094 1051 EN 48 20.9 N 17 21.0 W GPS 414306MT30/2 A2 449 02 ROS 102094 1110 BE 48 20.9 N 17 21.1 W GPS 412706MT30/2 A2 449 02 ROS 102094 1222 BO 48 20.9 N 17 21.3 W GPS 4127 4170 23 1-4,6,7,8,27,2806MT30/2 A2 449 02 ROS 102094 1348 EN 48 20.7 N 17 21.3 W GPS 412706MT30/2 A2 450 01 LVS 102094 2026 BO 48 13.0 N 18 26.0 W GPS 4510 1700 10 1,12,1306MT30/2 A2 450 02 ROS 102094 2215 BE 48 12.5 N 18 25.6 W GPS 451006MT30/2 A2 450 02 ROS 102094 2322 BO 48 11.8 N 18 25.3 W GPS 4510 4539 23 1-4,6,7,8,27,2806MT30/2 A2 450 02 ROS 102194 0018 EN 48 11.7 N 18 26.1 W GPS 451006MT30/2 A2 450 03 LVS 102194 0332 BO 48 12.1 N 18 26.3 W GPS 4514 4391 10 1,12,1306MT30/2 A2 450 04 ROS 102194 0622 BE 48 12.5 N 18 26.2 W GPS 444406MT30/2 A2 450 04 ROS 102194 0720 BO 48 12.4 N 18 25.8 W GPS 4444 1599 17 1-4,6,7,8,27,2806MT30/2 A2 450 04 ROS 102194 0808 EN 48 12.5 N 18 25.9 W GPS 444406MT30/2 A2 451 01 ROS 102194 1210 BE 48 06.3 N 19 10.0 W GPS 417606MT30/2 A2 451 01 ROS 102194 1237 BO 48 06.4 N 19 10.4 W GPS 4176 1603 16 1-4,6,7,8,27,2806MT30/2 A2 451 01 ROS 102194 1318 EN 48 06.4 N 19 10.7 W GPS 417606MT30/2 A2 451 02 ROS 102194 1331 BE 48 06.6 N 19 10.4 W GPS 418306MT30/2 A2 451 02 ROS 102194 1441 BO 48 06.5 N 19 10.5 W GPS 4183 4238 23 1-4,6,7,8,27,2806MT30/2 A2 451 02 ROS 102194 1610 EN 48 06.3 N 19 10.6 W GPS 418306MT30/2 A2 452 01 ROS 102394 0001 BE 47 53.1 N 20 55.3 W GPS 444706MT30/2 A2 452 01 ROS 102394 0120 BO 47 53.0 N 20 56.1 W GPS 4447 4525 17 24 1-4,6,7,8,27,2806MT30/2 A2 452 01 ROS 102394 0301 EN 47 53.1 N 20 56.7 W GPS 444706MT30/2 A2 452 02 ROS 102394 0350 BE 47 52.9 N 20 55.8 W GPS 444806MT30/2 A2 452 02 ROS 102394 0520 BO 47 53.3 N 20 55.8 W GPS 4448 4249 4500 20 19 1-4,6,7,8,27,28
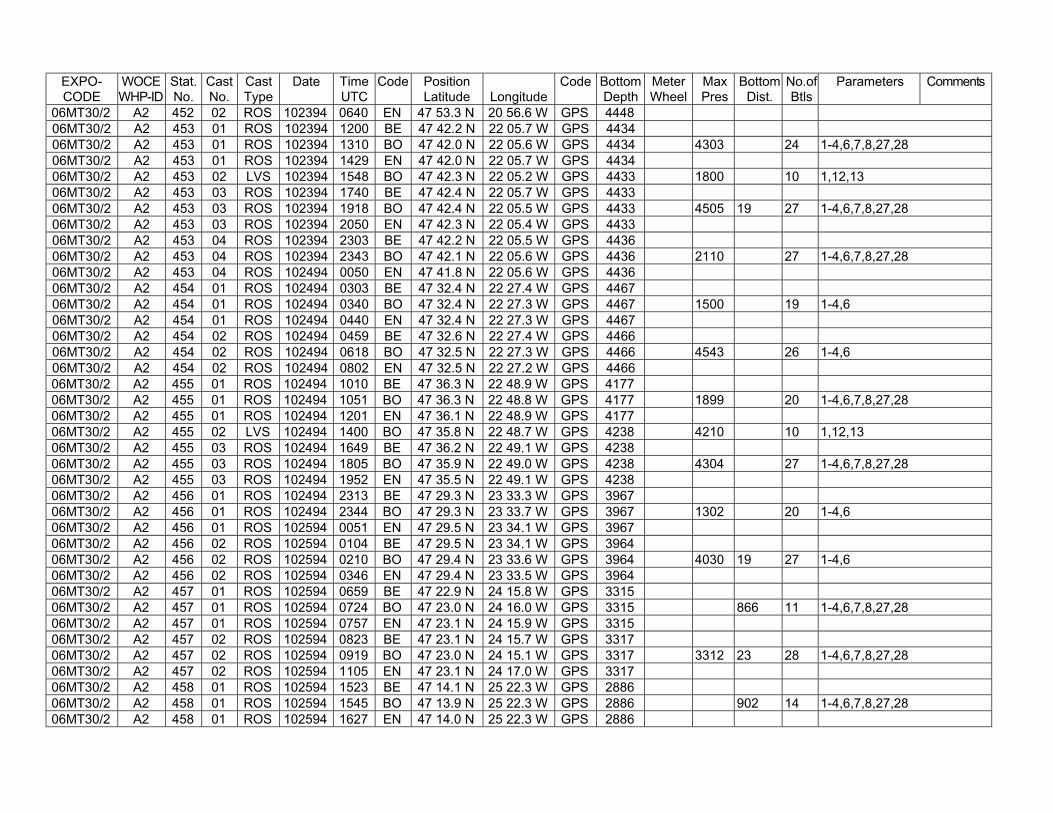
EXPO-CODE
WOCEWHP-ID
Stat.No.
CastNo.
CastType
Date TimeUTC
Code PositionLatitude Longitude
Code BottomDepth
MeterWheel
MaxPres
BottomDist.
No.ofBtls
Parameters Comments
06MT30/2 A2 452 02 ROS 102394 0640 EN 47 53.3 N 20 56.6 W GPS 444806MT30/2 A2 453 01 ROS 102394 1200 BE 47 42.2 N 22 05.7 W GPS 443406MT30/2 A2 453 01 ROS 102394 1310 BO 47 42.0 N 22 05.6 W GPS 4434 4303 24 1-4,6,7,8,27,2806MT30/2 A2 453 01 ROS 102394 1429 EN 47 42.0 N 22 05.7 W GPS 443406MT30/2 A2 453 02 LVS 102394 1548 BO 47 42.3 N 22 05.2 W GPS 4433 1800 10 1,12,1306MT30/2 A2 453 03 ROS 102394 1740 BE 47 42.4 N 22 05.7 W GPS 443306MT30/2 A2 453 03 ROS 102394 1918 BO 47 42.4 N 22 05.5 W GPS 4433 4505 19 27 1-4,6,7,8,27,2806MT30/2 A2 453 03 ROS 102394 2050 EN 47 42.3 N 22 05.4 W GPS 443306MT30/2 A2 453 04 ROS 102394 2303 BE 47 42.2 N 22 05.5 W GPS 443606MT30/2 A2 453 04 ROS 102394 2343 BO 47 42.1 N 22 05.6 W GPS 4436 2110 27 1-4,6,7,8,27,2806MT30/2 A2 453 04 ROS 102494 0050 EN 47 41.8 N 22 05.6 W GPS 443606MT30/2 A2 454 01 ROS 102494 0303 BE 47 32.4 N 22 27.4 W GPS 446706MT30/2 A2 454 01 ROS 102494 0340 BO 47 32.4 N 22 27.3 W GPS 4467 1500 19 1-4,606MT30/2 A2 454 01 ROS 102494 0440 EN 47 32.4 N 22 27.3 W GPS 446706MT30/2 A2 454 02 ROS 102494 0459 BE 47 32.6 N 22 27.4 W GPS 446606MT30/2 A2 454 02 ROS 102494 0618 BO 47 32.5 N 22 27.3 W GPS 4466 4543 26 1-4,606MT30/2 A2 454 02 ROS 102494 0802 EN 47 32.5 N 22 27.2 W GPS 446606MT30/2 A2 455 01 ROS 102494 1010 BE 47 36.3 N 22 48.9 W GPS 417706MT30/2 A2 455 01 ROS 102494 1051 BO 47 36.3 N 22 48.8 W GPS 4177 1899 20 1-4,6,7,8,27,2806MT30/2 A2 455 01 ROS 102494 1201 EN 47 36.1 N 22 48.9 W GPS 417706MT30/2 A2 455 02 LVS 102494 1400 BO 47 35.8 N 22 48.7 W GPS 4238 4210 10 1,12,1306MT30/2 A2 455 03 ROS 102494 1649 BE 47 36.2 N 22 49.1 W GPS 423806MT30/2 A2 455 03 ROS 102494 1805 BO 47 35.9 N 22 49.0 W GPS 4238 4304 27 1-4,6,7,8,27,2806MT30/2 A2 455 03 ROS 102494 1952 EN 47 35.5 N 22 49.1 W GPS 423806MT30/2 A2 456 01 ROS 102494 2313 BE 47 29.3 N 23 33.3 W GPS 396706MT30/2 A2 456 01 ROS 102494 2344 BO 47 29.3 N 23 33.7 W GPS 3967 1302 20 1-4,606MT30/2 A2 456 01 ROS 102594 0051 EN 47 29.5 N 23 34.1 W GPS 396706MT30/2 A2 456 02 ROS 102594 0104 BE 47 29.5 N 23 34.1 W GPS 396406MT30/2 A2 456 02 ROS 102594 0210 BO 47 29.4 N 23 33.6 W GPS 3964 4030 19 27 1-4,606MT30/2 A2 456 02 ROS 102594 0346 EN 47 29.4 N 23 33.5 W GPS 396406MT30/2 A2 457 01 ROS 102594 0659 BE 47 22.9 N 24 15.8 W GPS 331506MT30/2 A2 457 01 ROS 102594 0724 BO 47 23.0 N 24 16.0 W GPS 3315 866 11 1-4,6,7,8,27,2806MT30/2 A2 457 01 ROS 102594 0757 EN 47 23.1 N 24 15.9 W GPS 331506MT30/2 A2 457 02 ROS 102594 0823 BE 47 23.1 N 24 15.7 W GPS 331706MT30/2 A2 457 02 ROS 102594 0919 BO 47 23.0 N 24 15.1 W GPS 3317 3312 23 28 1-4,6,7,8,27,2806MT30/2 A2 457 02 ROS 102594 1105 EN 47 23.1 N 24 17.0 W GPS 331706MT30/2 A2 458 01 ROS 102594 1523 BE 47 14.1 N 25 22.3 W GPS 288606MT30/2 A2 458 01 ROS 102594 1545 BO 47 13.9 N 25 22.3 W GPS 2886 902 14 1-4,6,7,8,27,2806MT30/2 A2 458 01 ROS 102594 1627 EN 47 14.0 N 25 22.3 W GPS 2886
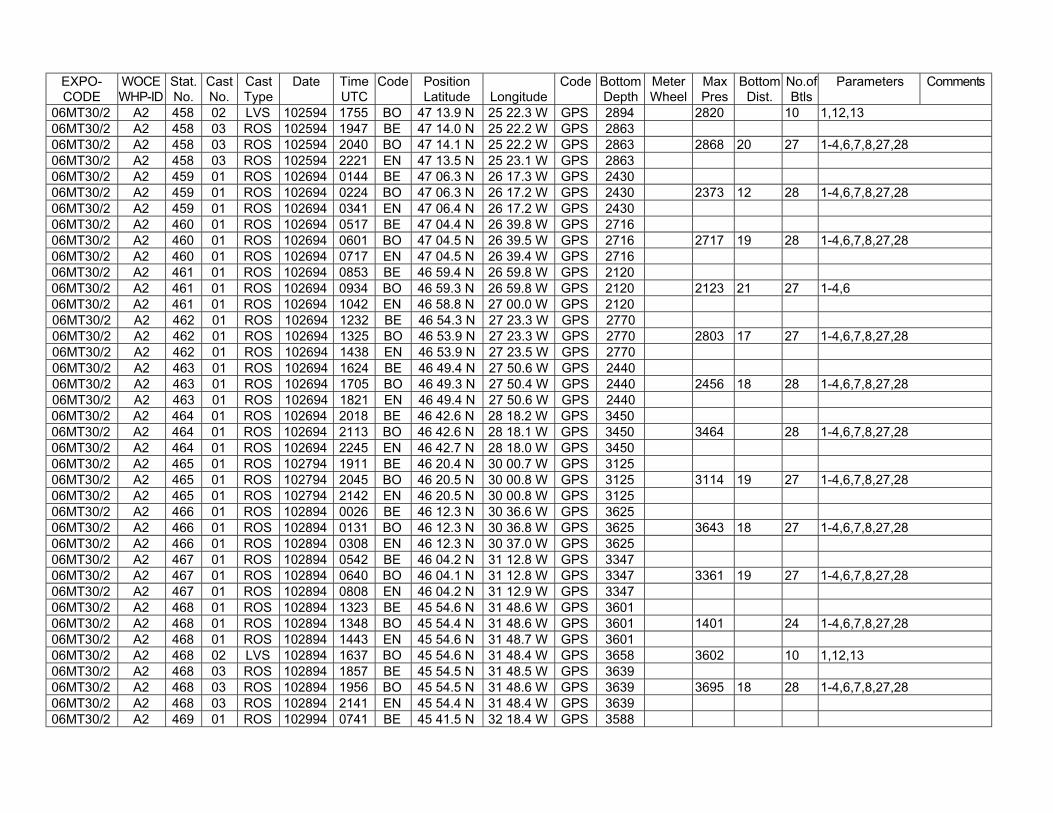
EXPO-CODE
WOCEWHP-ID
Stat.No.
CastNo.
CastType
Date TimeUTC
Code PositionLatitude Longitude
Code BottomDepth
MeterWheel
MaxPres
BottomDist.
No.ofBtls
Parameters Comments
06MT30/2 A2 458 02 LVS 102594 1755 BO 47 13.9 N 25 22.3 W GPS 2894 2820 10 1,12,1306MT30/2 A2 458 03 ROS 102594 1947 BE 47 14.0 N 25 22.2 W GPS 286306MT30/2 A2 458 03 ROS 102594 2040 BO 47 14.1 N 25 22.2 W GPS 2863 2868 20 27 1-4,6,7,8,27,2806MT30/2 A2 458 03 ROS 102594 2221 EN 47 13.5 N 25 23.1 W GPS 286306MT30/2 A2 459 01 ROS 102694 0144 BE 47 06.3 N 26 17.3 W GPS 243006MT30/2 A2 459 01 ROS 102694 0224 BO 47 06.3 N 26 17.2 W GPS 2430 2373 12 28 1-4,6,7,8,27,2806MT30/2 A2 459 01 ROS 102694 0341 EN 47 06.4 N 26 17.2 W GPS 243006MT30/2 A2 460 01 ROS 102694 0517 BE 47 04.4 N 26 39.8 W GPS 271606MT30/2 A2 460 01 ROS 102694 0601 BO 47 04.5 N 26 39.5 W GPS 2716 2717 19 28 1-4,6,7,8,27,2806MT30/2 A2 460 01 ROS 102694 0717 EN 47 04.5 N 26 39.4 W GPS 271606MT30/2 A2 461 01 ROS 102694 0853 BE 46 59.4 N 26 59.8 W GPS 212006MT30/2 A2 461 01 ROS 102694 0934 BO 46 59.3 N 26 59.8 W GPS 2120 2123 21 27 1-4,606MT30/2 A2 461 01 ROS 102694 1042 EN 46 58.8 N 27 00.0 W GPS 212006MT30/2 A2 462 01 ROS 102694 1232 BE 46 54.3 N 27 23.3 W GPS 277006MT30/2 A2 462 01 ROS 102694 1325 BO 46 53.9 N 27 23.3 W GPS 2770 2803 17 27 1-4,6,7,8,27,2806MT30/2 A2 462 01 ROS 102694 1438 EN 46 53.9 N 27 23.5 W GPS 277006MT30/2 A2 463 01 ROS 102694 1624 BE 46 49.4 N 27 50.6 W GPS 244006MT30/2 A2 463 01 ROS 102694 1705 BO 46 49.3 N 27 50.4 W GPS 2440 2456 18 28 1-4,6,7,8,27,2806MT30/2 A2 463 01 ROS 102694 1821 EN 46 49.4 N 27 50.6 W GPS 244006MT30/2 A2 464 01 ROS 102694 2018 BE 46 42.6 N 28 18.2 W GPS 345006MT30/2 A2 464 01 ROS 102694 2113 BO 46 42.6 N 28 18.1 W GPS 3450 3464 28 1-4,6,7,8,27,2806MT30/2 A2 464 01 ROS 102694 2245 EN 46 42.7 N 28 18.0 W GPS 345006MT30/2 A2 465 01 ROS 102794 1911 BE 46 20.4 N 30 00.7 W GPS 312506MT30/2 A2 465 01 ROS 102794 2045 BO 46 20.5 N 30 00.8 W GPS 3125 3114 19 27 1-4,6,7,8,27,2806MT30/2 A2 465 01 ROS 102794 2142 EN 46 20.5 N 30 00.8 W GPS 312506MT30/2 A2 466 01 ROS 102894 0026 BE 46 12.3 N 30 36.6 W GPS 362506MT30/2 A2 466 01 ROS 102894 0131 BO 46 12.3 N 30 36.8 W GPS 3625 3643 18 27 1-4,6,7,8,27,2806MT30/2 A2 466 01 ROS 102894 0308 EN 46 12.3 N 30 37.0 W GPS 362506MT30/2 A2 467 01 ROS 102894 0542 BE 46 04.2 N 31 12.8 W GPS 334706MT30/2 A2 467 01 ROS 102894 0640 BO 46 04.1 N 31 12.8 W GPS 3347 3361 19 27 1-4,6,7,8,27,2806MT30/2 A2 467 01 ROS 102894 0808 EN 46 04.2 N 31 12.9 W GPS 334706MT30/2 A2 468 01 ROS 102894 1323 BE 45 54.6 N 31 48.6 W GPS 360106MT30/2 A2 468 01 ROS 102894 1348 BO 45 54.4 N 31 48.6 W GPS 3601 1401 24 1-4,6,7,8,27,2806MT30/2 A2 468 01 ROS 102894 1443 EN 45 54.6 N 31 48.7 W GPS 360106MT30/2 A2 468 02 LVS 102894 1637 BO 45 54.6 N 31 48.4 W GPS 3658 3602 10 1,12,1306MT30/2 A2 468 03 ROS 102894 1857 BE 45 54.5 N 31 48.5 W GPS 363906MT30/2 A2 468 03 ROS 102894 1956 BO 45 54.5 N 31 48.6 W GPS 3639 3695 18 28 1-4,6,7,8,27,2806MT30/2 A2 468 03 ROS 102894 2141 EN 45 54.4 N 31 48.4 W GPS 363906MT30/2 A2 469 01 ROS 102994 0741 BE 45 41.5 N 32 18.4 W GPS 3588
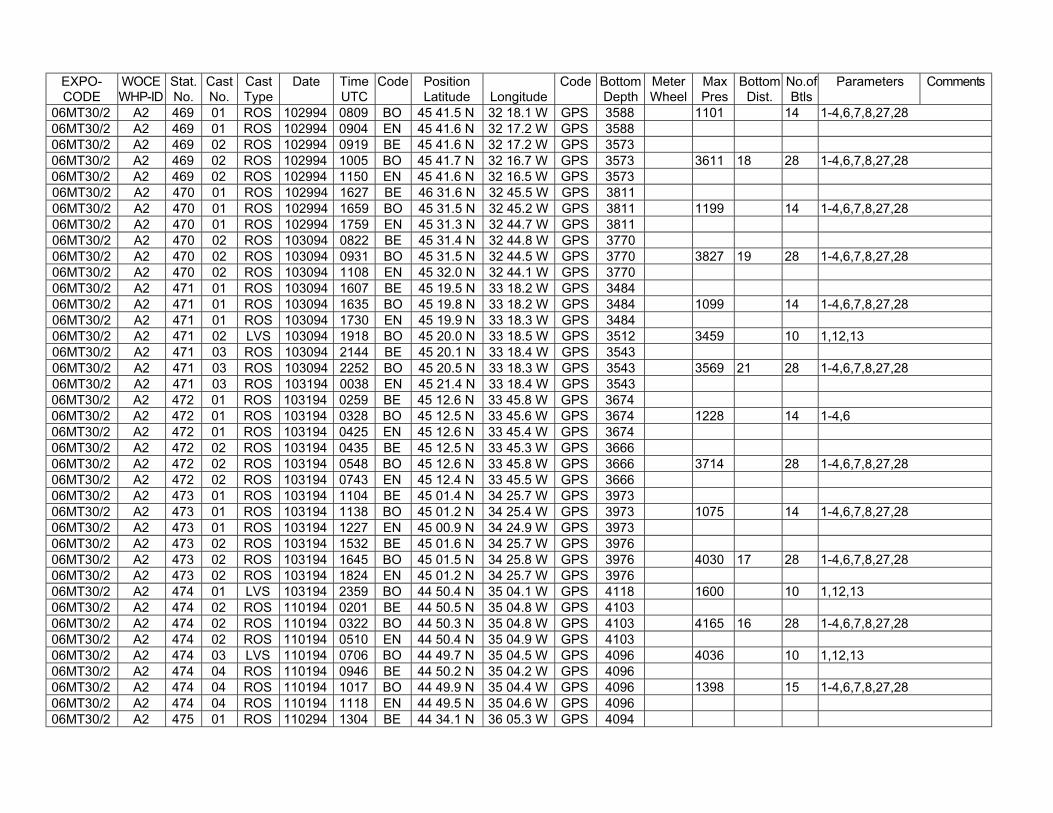
EXPO-CODE
WOCEWHP-ID
Stat.No.
CastNo.
CastType
Date TimeUTC
Code PositionLatitude Longitude
Code BottomDepth
MeterWheel
MaxPres
BottomDist.
No.ofBtls
Parameters Comments
06MT30/2 A2 469 01 ROS 102994 0809 BO 45 41.5 N 32 18.1 W GPS 3588 1101 14 1-4,6,7,8,27,2806MT30/2 A2 469 01 ROS 102994 0904 EN 45 41.6 N 32 17.2 W GPS 358806MT30/2 A2 469 02 ROS 102994 0919 BE 45 41.6 N 32 17.2 W GPS 357306MT30/2 A2 469 02 ROS 102994 1005 BO 45 41.7 N 32 16.7 W GPS 3573 3611 18 28 1-4,6,7,8,27,2806MT30/2 A2 469 02 ROS 102994 1150 EN 45 41.6 N 32 16.5 W GPS 357306MT30/2 A2 470 01 ROS 102994 1627 BE 46 31.6 N 32 45.5 W GPS 381106MT30/2 A2 470 01 ROS 102994 1659 BO 45 31.5 N 32 45.2 W GPS 3811 1199 14 1-4,6,7,8,27,2806MT30/2 A2 470 01 ROS 102994 1759 EN 45 31.3 N 32 44.7 W GPS 381106MT30/2 A2 470 02 ROS 103094 0822 BE 45 31.4 N 32 44.8 W GPS 377006MT30/2 A2 470 02 ROS 103094 0931 BO 45 31.5 N 32 44.5 W GPS 3770 3827 19 28 1-4,6,7,8,27,2806MT30/2 A2 470 02 ROS 103094 1108 EN 45 32.0 N 32 44.1 W GPS 377006MT30/2 A2 471 01 ROS 103094 1607 BE 45 19.5 N 33 18.2 W GPS 348406MT30/2 A2 471 01 ROS 103094 1635 BO 45 19.8 N 33 18.2 W GPS 3484 1099 14 1-4,6,7,8,27,2806MT30/2 A2 471 01 ROS 103094 1730 EN 45 19.9 N 33 18.3 W GPS 348406MT30/2 A2 471 02 LVS 103094 1918 BO 45 20.0 N 33 18.5 W GPS 3512 3459 10 1,12,1306MT30/2 A2 471 03 ROS 103094 2144 BE 45 20.1 N 33 18.4 W GPS 354306MT30/2 A2 471 03 ROS 103094 2252 BO 45 20.5 N 33 18.3 W GPS 3543 3569 21 28 1-4,6,7,8,27,2806MT30/2 A2 471 03 ROS 103194 0038 EN 45 21.4 N 33 18.4 W GPS 354306MT30/2 A2 472 01 ROS 103194 0259 BE 45 12.6 N 33 45.8 W GPS 367406MT30/2 A2 472 01 ROS 103194 0328 BO 45 12.5 N 33 45.6 W GPS 3674 1228 14 1-4,606MT30/2 A2 472 01 ROS 103194 0425 EN 45 12.6 N 33 45.4 W GPS 367406MT30/2 A2 472 02 ROS 103194 0435 BE 45 12.5 N 33 45.3 W GPS 366606MT30/2 A2 472 02 ROS 103194 0548 BO 45 12.6 N 33 45.8 W GPS 3666 3714 28 1-4,6,7,8,27,2806MT30/2 A2 472 02 ROS 103194 0743 EN 45 12.4 N 33 45.5 W GPS 366606MT30/2 A2 473 01 ROS 103194 1104 BE 45 01.4 N 34 25.7 W GPS 397306MT30/2 A2 473 01 ROS 103194 1138 BO 45 01.2 N 34 25.4 W GPS 3973 1075 14 1-4,6,7,8,27,2806MT30/2 A2 473 01 ROS 103194 1227 EN 45 00.9 N 34 24.9 W GPS 397306MT30/2 A2 473 02 ROS 103194 1532 BE 45 01.6 N 34 25.7 W GPS 397606MT30/2 A2 473 02 ROS 103194 1645 BO 45 01.5 N 34 25.8 W GPS 3976 4030 17 28 1-4,6,7,8,27,2806MT30/2 A2 473 02 ROS 103194 1824 EN 45 01.2 N 34 25.7 W GPS 397606MT30/2 A2 474 01 LVS 103194 2359 BO 44 50.4 N 35 04.1 W GPS 4118 1600 10 1,12,1306MT30/2 A2 474 02 ROS 110194 0201 BE 44 50.5 N 35 04.8 W GPS 410306MT30/2 A2 474 02 ROS 110194 0322 BO 44 50.3 N 35 04.8 W GPS 4103 4165 16 28 1-4,6,7,8,27,2806MT30/2 A2 474 02 ROS 110194 0510 EN 44 50.4 N 35 04.9 W GPS 410306MT30/2 A2 474 03 LVS 110194 0706 BO 44 49.7 N 35 04.5 W GPS 4096 4036 10 1,12,1306MT30/2 A2 474 04 ROS 110194 0946 BE 44 50.2 N 35 04.2 W GPS 409606MT30/2 A2 474 04 ROS 110194 1017 BO 44 49.9 N 35 04.4 W GPS 4096 1398 15 1-4,6,7,8,27,2806MT30/2 A2 474 04 ROS 110194 1118 EN 44 49.5 N 35 04.6 W GPS 409606MT30/2 A2 475 01 ROS 110294 1304 BE 44 34.1 N 36 05.3 W GPS 4094
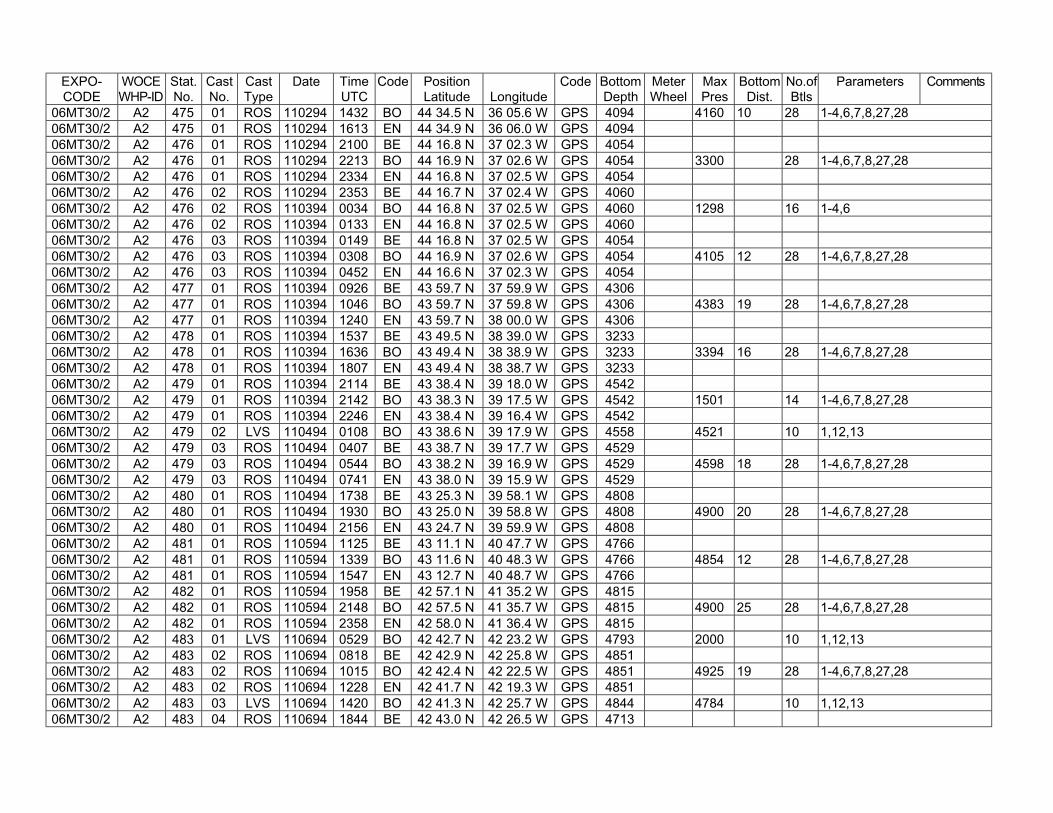
EXPO-CODE
WOCEWHP-ID
Stat.No.
CastNo.
CastType
Date TimeUTC
Code PositionLatitude Longitude
Code BottomDepth
MeterWheel
MaxPres
BottomDist.
No.ofBtls
Parameters Comments
06MT30/2 A2 475 01 ROS 110294 1432 BO 44 34.5 N 36 05.6 W GPS 4094 4160 10 28 1-4,6,7,8,27,2806MT30/2 A2 475 01 ROS 110294 1613 EN 44 34.9 N 36 06.0 W GPS 409406MT30/2 A2 476 01 ROS 110294 2100 BE 44 16.8 N 37 02.3 W GPS 405406MT30/2 A2 476 01 ROS 110294 2213 BO 44 16.9 N 37 02.6 W GPS 4054 3300 28 1-4,6,7,8,27,2806MT30/2 A2 476 01 ROS 110294 2334 EN 44 16.8 N 37 02.5 W GPS 405406MT30/2 A2 476 02 ROS 110294 2353 BE 44 16.7 N 37 02.4 W GPS 406006MT30/2 A2 476 02 ROS 110394 0034 BO 44 16.8 N 37 02.5 W GPS 4060 1298 16 1-4,606MT30/2 A2 476 02 ROS 110394 0133 EN 44 16.8 N 37 02.5 W GPS 406006MT30/2 A2 476 03 ROS 110394 0149 BE 44 16.8 N 37 02.5 W GPS 405406MT30/2 A2 476 03 ROS 110394 0308 BO 44 16.9 N 37 02.6 W GPS 4054 4105 12 28 1-4,6,7,8,27,2806MT30/2 A2 476 03 ROS 110394 0452 EN 44 16.6 N 37 02.3 W GPS 405406MT30/2 A2 477 01 ROS 110394 0926 BE 43 59.7 N 37 59.9 W GPS 430606MT30/2 A2 477 01 ROS 110394 1046 BO 43 59.7 N 37 59.8 W GPS 4306 4383 19 28 1-4,6,7,8,27,2806MT30/2 A2 477 01 ROS 110394 1240 EN 43 59.7 N 38 00.0 W GPS 430606MT30/2 A2 478 01 ROS 110394 1537 BE 43 49.5 N 38 39.0 W GPS 323306MT30/2 A2 478 01 ROS 110394 1636 BO 43 49.4 N 38 38.9 W GPS 3233 3394 16 28 1-4,6,7,8,27,2806MT30/2 A2 478 01 ROS 110394 1807 EN 43 49.4 N 38 38.7 W GPS 323306MT30/2 A2 479 01 ROS 110394 2114 BE 43 38.4 N 39 18.0 W GPS 454206MT30/2 A2 479 01 ROS 110394 2142 BO 43 38.3 N 39 17.5 W GPS 4542 1501 14 1-4,6,7,8,27,2806MT30/2 A2 479 01 ROS 110394 2246 EN 43 38.4 N 39 16.4 W GPS 454206MT30/2 A2 479 02 LVS 110494 0108 BO 43 38.6 N 39 17.9 W GPS 4558 4521 10 1,12,1306MT30/2 A2 479 03 ROS 110494 0407 BE 43 38.7 N 39 17.7 W GPS 452906MT30/2 A2 479 03 ROS 110494 0544 BO 43 38.2 N 39 16.9 W GPS 4529 4598 18 28 1-4,6,7,8,27,2806MT30/2 A2 479 03 ROS 110494 0741 EN 43 38.0 N 39 15.9 W GPS 452906MT30/2 A2 480 01 ROS 110494 1738 BE 43 25.3 N 39 58.1 W GPS 480806MT30/2 A2 480 01 ROS 110494 1930 BO 43 25.0 N 39 58.8 W GPS 4808 4900 20 28 1-4,6,7,8,27,2806MT30/2 A2 480 01 ROS 110494 2156 EN 43 24.7 N 39 59.9 W GPS 480806MT30/2 A2 481 01 ROS 110594 1125 BE 43 11.1 N 40 47.7 W GPS 476606MT30/2 A2 481 01 ROS 110594 1339 BO 43 11.6 N 40 48.3 W GPS 4766 4854 12 28 1-4,6,7,8,27,2806MT30/2 A2 481 01 ROS 110594 1547 EN 43 12.7 N 40 48.7 W GPS 476606MT30/2 A2 482 01 ROS 110594 1958 BE 42 57.1 N 41 35.2 W GPS 481506MT30/2 A2 482 01 ROS 110594 2148 BO 42 57.5 N 41 35.7 W GPS 4815 4900 25 28 1-4,6,7,8,27,2806MT30/2 A2 482 01 ROS 110594 2358 EN 42 58.0 N 41 36.4 W GPS 481506MT30/2 A2 483 01 LVS 110694 0529 BO 42 42.7 N 42 23.2 W GPS 4793 2000 10 1,12,1306MT30/2 A2 483 02 ROS 110694 0818 BE 42 42.9 N 42 25.8 W GPS 485106MT30/2 A2 483 02 ROS 110694 1015 BO 42 42.4 N 42 22.5 W GPS 4851 4925 19 28 1-4,6,7,8,27,2806MT30/2 A2 483 02 ROS 110694 1228 EN 42 41.7 N 42 19.3 W GPS 485106MT30/2 A2 483 03 LVS 110694 1420 BO 42 41.3 N 42 25.7 W GPS 4844 4784 10 1,12,1306MT30/2 A2 483 04 ROS 110694 1844 BE 42 43.0 N 42 26.5 W GPS 4713
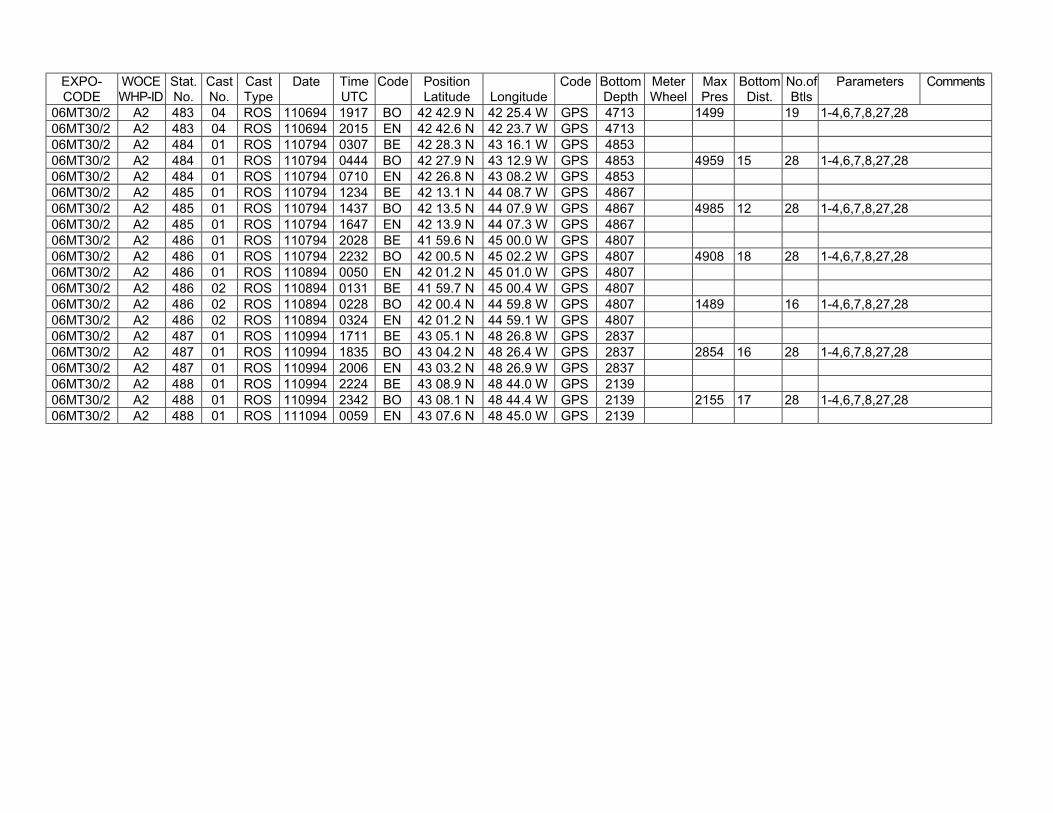
EXPO-CODE
WOCEWHP-ID
Stat.No.
CastNo.
CastType
Date TimeUTC
Code PositionLatitude Longitude
Code BottomDepth
MeterWheel
MaxPres
BottomDist.
No.ofBtls
Parameters Comments
06MT30/2 A2 483 04 ROS 110694 1917 BO 42 42.9 N 42 25.4 W GPS 4713 1499 19 1-4,6,7,8,27,2806MT30/2 A2 483 04 ROS 110694 2015 EN 42 42.6 N 42 23.7 W GPS 471306MT30/2 A2 484 01 ROS 110794 0307 BE 42 28.3 N 43 16.1 W GPS 485306MT30/2 A2 484 01 ROS 110794 0444 BO 42 27.9 N 43 12.9 W GPS 4853 4959 15 28 1-4,6,7,8,27,2806MT30/2 A2 484 01 ROS 110794 0710 EN 42 26.8 N 43 08.2 W GPS 485306MT30/2 A2 485 01 ROS 110794 1234 BE 42 13.1 N 44 08.7 W GPS 486706MT30/2 A2 485 01 ROS 110794 1437 BO 42 13.5 N 44 07.9 W GPS 4867 4985 12 28 1-4,6,7,8,27,2806MT30/2 A2 485 01 ROS 110794 1647 EN 42 13.9 N 44 07.3 W GPS 486706MT30/2 A2 486 01 ROS 110794 2028 BE 41 59.6 N 45 00.0 W GPS 480706MT30/2 A2 486 01 ROS 110794 2232 BO 42 00.5 N 45 02.2 W GPS 4807 4908 18 28 1-4,6,7,8,27,2806MT30/2 A2 486 01 ROS 110894 0050 EN 42 01.2 N 45 01.0 W GPS 480706MT30/2 A2 486 02 ROS 110894 0131 BE 41 59.7 N 45 00.4 W GPS 480706MT30/2 A2 486 02 ROS 110894 0228 BO 42 00.4 N 44 59.8 W GPS 4807 1489 16 1-4,6,7,8,27,2806MT30/2 A2 486 02 ROS 110894 0324 EN 42 01.2 N 44 59.1 W GPS 480706MT30/2 A2 487 01 ROS 110994 1711 BE 43 05.1 N 48 26.8 W GPS 283706MT30/2 A2 487 01 ROS 110994 1835 BO 43 04.2 N 48 26.4 W GPS 2837 2854 16 28 1-4,6,7,8,27,2806MT30/2 A2 487 01 ROS 110994 2006 EN 43 03.2 N 48 26.9 W GPS 283706MT30/2 A2 488 01 ROS 110994 2224 BE 43 08.9 N 48 44.0 W GPS 213906MT30/2 A2 488 01 ROS 110994 2342 BO 43 08.1 N 48 44.4 W GPS 2139 2155 17 28 1-4,6,7,8,27,2806MT30/2 A2 488 01 ROS 111094 0059 EN 43 07.6 N 48 45.0 W GPS 2139
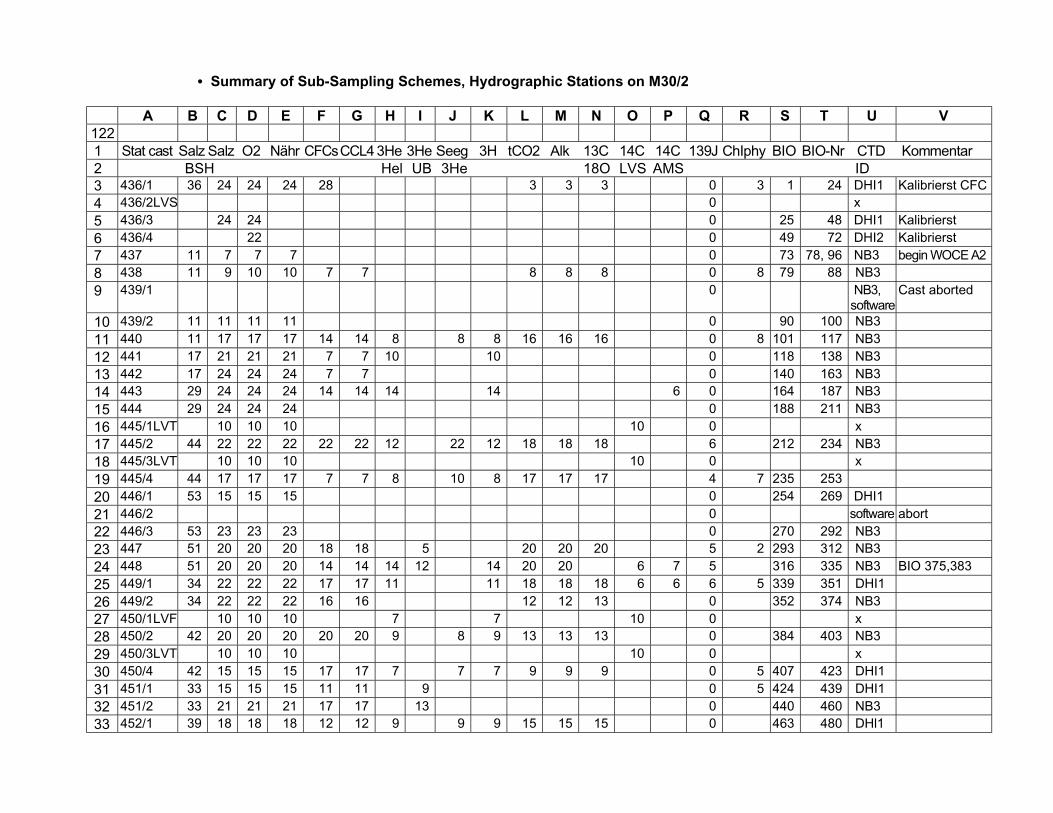
• Summary of Sub-Sampling Schemes, Hydrographic Stations on M30/2
A B C D E F G H I J K L M N O P Q R S T U V1221 Stat cast Salz Salz O2 Nähr CFCsCCL4 3He 3He Seeg 3H tCO2 Alk 13C 14C 14C 139J ChIphy BIO BIO-Nr CTD Kommentar2 BSH Hel UB 3He 18O LVS AMS ID3 436/1 36 24 24 24 28 3 3 3 0 3 1 24 DHI1 Kalibrierst CFC4 436/2LVS 0 x5 436/3 24 24 0 25 48 DHI1 Kalibrierst6 436/4 22 0 49 72 DHI2 Kalibrierst7 437 11 7 7 7 0 73 78, 96 NB3 begin WOCE A28 438 11 9 10 10 7 7 8 8 8 0 8 79 88 NB39 439/1 0 NB3,
softwareCast aborted
10 439/2 11 11 11 11 0 90 100 NB311 440 11 17 17 17 14 14 8 8 8 16 16 16 0 8 101 117 NB312 441 17 21 21 21 7 7 10 10 0 118 138 NB313 442 17 24 24 24 7 7 0 140 163 NB314 443 29 24 24 24 14 14 14 14 6 0 164 187 NB315 444 29 24 24 24 0 188 211 NB316 445/1LVT 10 10 10 10 0 x17 445/2 44 22 22 22 22 22 12 22 12 18 18 18 6 212 234 NB318 445/3LVT 10 10 10 10 0 x19 445/4 44 17 17 17 7 7 8 10 8 17 17 17 4 7 235 25320 446/1 53 15 15 15 0 254 269 DHI121 446/2 0 software abort22 446/3 53 23 23 23 0 270 292 NB323 447 51 20 20 20 18 18 5 20 20 20 5 2 293 312 NB324 448 51 20 20 20 14 14 14 12 14 20 20 6 7 5 316 335 NB3 BIO 375,38325 449/1 34 22 22 22 17 17 11 11 18 18 18 6 6 6 5 339 351 DHI126 449/2 34 22 22 22 16 16 12 12 13 0 352 374 NB327 450/1LVF 10 10 10 7 7 10 0 x28 450/2 42 20 20 20 20 20 9 8 9 13 13 13 0 384 403 NB329 450/3LVT 10 10 10 10 0 x30 450/4 42 15 15 15 17 17 7 7 7 9 9 9 0 5 407 423 DHI131 451/1 33 15 15 15 11 11 9 0 5 424 439 DHI132 451/2 33 21 21 21 17 17 13 0 440 460 NB333 452/1 39 18 18 18 12 12 9 9 9 15 15 15 0 463 480 DHl1
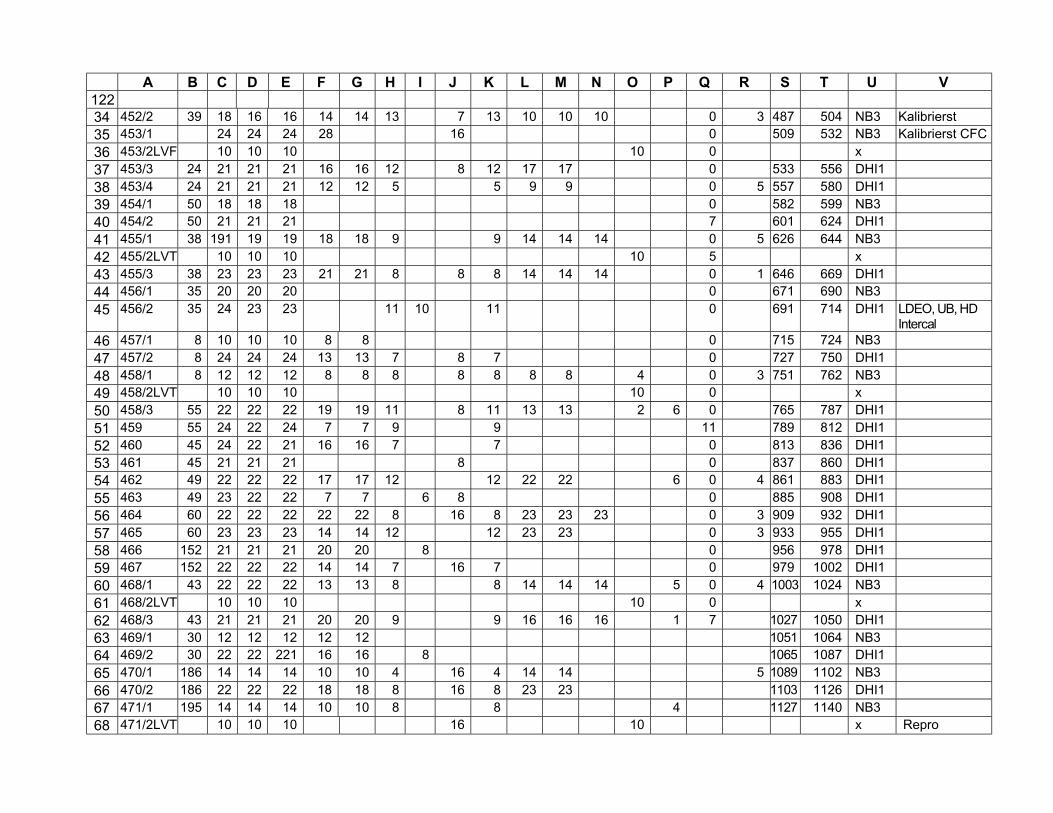
A B C D E F G H I J K L M N O P Q R S T U V12234 452/2 39 18 16 16 14 14 13 7 13 10 10 10 0 3 487 504 NB3 Kalibrierst35 453/1 24 24 24 28 16 0 509 532 NB3 Kalibrierst CFC36 453/2LVF 10 10 10 10 0 x37 453/3 24 21 21 21 16 16 12 8 12 17 17 0 533 556 DHI138 453/4 24 21 21 21 12 12 5 5 9 9 0 5 557 580 DHI139 454/1 50 18 18 18 0 582 599 NB340 454/2 50 21 21 21 7 601 624 DHI141 455/1 38 191 19 19 18 18 9 9 14 14 14 0 5 626 644 NB342 455/2LVT 10 10 10 10 5 x43 455/3 38 23 23 23 21 21 8 8 8 14 14 14 0 1 646 669 DHI144 456/1 35 20 20 20 0 671 690 NB345 456/2 35 24 23 23 11 10 11 0 691 714 DHI1 LDEO, UB, HD
Intercal46 457/1 8 10 10 10 8 8 0 715 724 NB347 457/2 8 24 24 24 13 13 7 8 7 0 727 750 DHI148 458/1 8 12 12 12 8 8 8 8 8 8 8 4 0 3 751 762 NB349 458/2LVT 10 10 10 10 0 x50 458/3 55 22 22 22 19 19 11 8 11 13 13 2 6 0 765 787 DHI151 459 55 24 22 24 7 7 9 9 11 789 812 DHI152 460 45 24 22 21 16 16 7 7 0 813 836 DHI153 461 45 21 21 21 8 0 837 860 DHI154 462 49 22 22 22 17 17 12 12 22 22 6 0 4 861 883 DHI155 463 49 23 22 22 7 7 6 8 0 885 908 DHI156 464 60 22 22 22 22 22 8 16 8 23 23 23 0 3 909 932 DHI157 465 60 23 23 23 14 14 12 12 23 23 0 3 933 955 DHI158 466 152 21 21 21 20 20 8 0 956 978 DHI159 467 152 22 22 22 14 14 7 16 7 0 979 1002 DHI160 468/1 43 22 22 22 13 13 8 8 14 14 14 5 0 4 1003 1024 NB361 468/2LVT 10 10 10 10 0 x62 468/3 43 21 21 21 20 20 9 9 16 16 16 1 7 1027 1050 DHI163 469/1 30 12 12 12 12 12 1051 1064 NB364 469/2 30 22 22 221 16 16 8 1065 1087 DHI165 470/1 186 14 14 14 10 10 4 16 4 14 14 5 1089 1102 NB366 470/2 186 22 22 22 18 18 8 16 8 23 23 1103 1126 DHI167 471/1 195 14 14 14 10 10 8 8 4 1127 1140 NB368 471/2LVT 10 10 10 16 10 x Repro
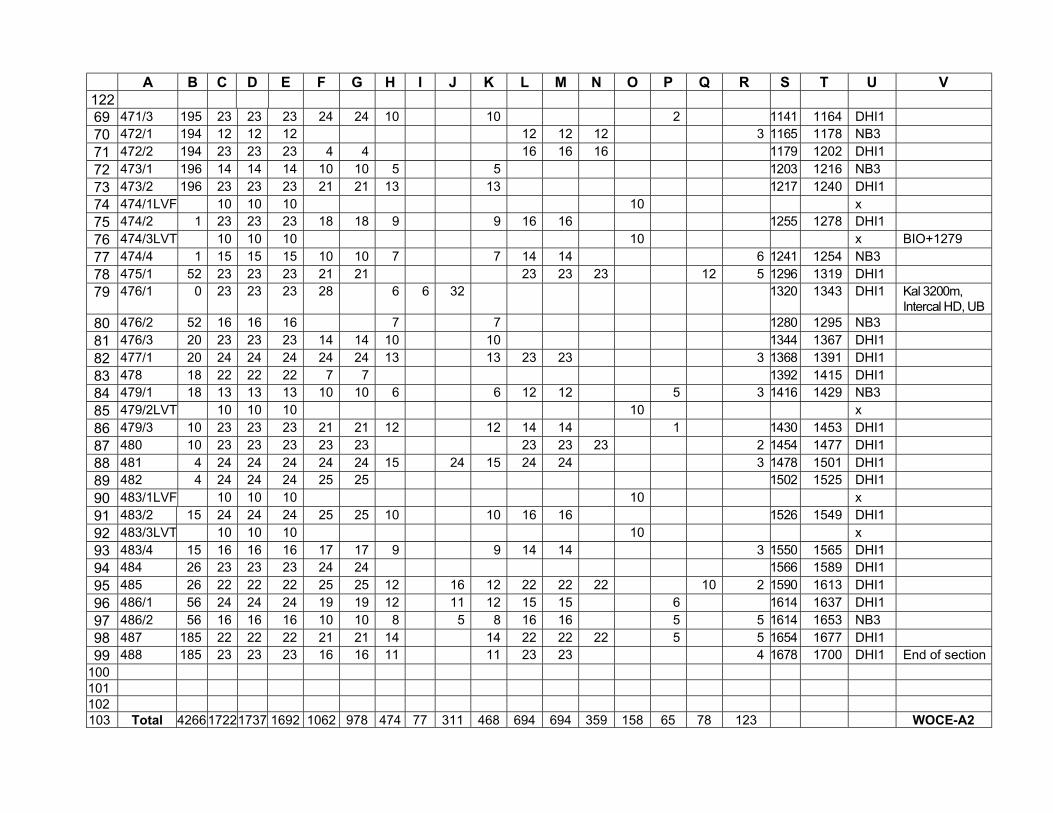
A B C D E F G H I J K L M N O P Q R S T U V12269 471/3 195 23 23 23 24 24 10 10 2 1141 1164 DHI170 472/1 194 12 12 12 12 12 12 3 1165 1178 NB371 472/2 194 23 23 23 4 4 16 16 16 1179 1202 DHI172 473/1 196 14 14 14 10 10 5 5 1203 1216 NB373 473/2 196 23 23 23 21 21 13 13 1217 1240 DHI174 474/1LVF 10 10 10 10 x75 474/2 1 23 23 23 18 18 9 9 16 16 1255 1278 DHI176 474/3LVT 10 10 10 10 x BIO+127977 474/4 1 15 15 15 10 10 7 7 14 14 6 1241 1254 NB378 475/1 52 23 23 23 21 21 23 23 23 12 5 1296 1319 DHI179 476/1 0 23 23 23 28 6 6 32 1320 1343 DHI1 Kal 3200m,
Intercal HD, UB80 476/2 52 16 16 16 7 7 1280 1295 NB381 476/3 20 23 23 23 14 14 10 10 1344 1367 DHI182 477/1 20 24 24 24 24 24 13 13 23 23 3 1368 1391 DHI183 478 18 22 22 22 7 7 1392 1415 DHI184 479/1 18 13 13 13 10 10 6 6 12 12 5 3 1416 1429 NB385 479/2LVT 10 10 10 10 x86 479/3 10 23 23 23 21 21 12 12 14 14 1 1430 1453 DHI187 480 10 23 23 23 23 23 23 23 23 2 1454 1477 DHI188 481 4 24 24 24 24 24 15 24 15 24 24 3 1478 1501 DHI189 482 4 24 24 24 25 25 1502 1525 DHI190 483/1LVF 10 10 10 10 x91 483/2 15 24 24 24 25 25 10 10 16 16 1526 1549 DHI192 483/3LVT 10 10 10 10 x93 483/4 15 16 16 16 17 17 9 9 14 14 3 1550 1565 DHI194 484 26 23 23 23 24 24 1566 1589 DHI195 485 26 22 22 22 25 25 12 16 12 22 22 22 10 2 1590 1613 DHI196 486/1 56 24 24 24 19 19 12 11 12 15 15 6 1614 1637 DHI197 486/2 56 16 16 16 10 10 8 5 8 16 16 5 5 1614 1653 NB398 487 185 22 22 22 21 21 14 14 22 22 22 5 5 1654 1677 DHI199 488 185 23 23 23 16 16 11 11 23 23 4 1678 1700 DHI1 End of section
100101102103 Total 426617221737 1692 1062 978 474 77 311 468 694 694 359 158 65 78 123 WOCE-A2
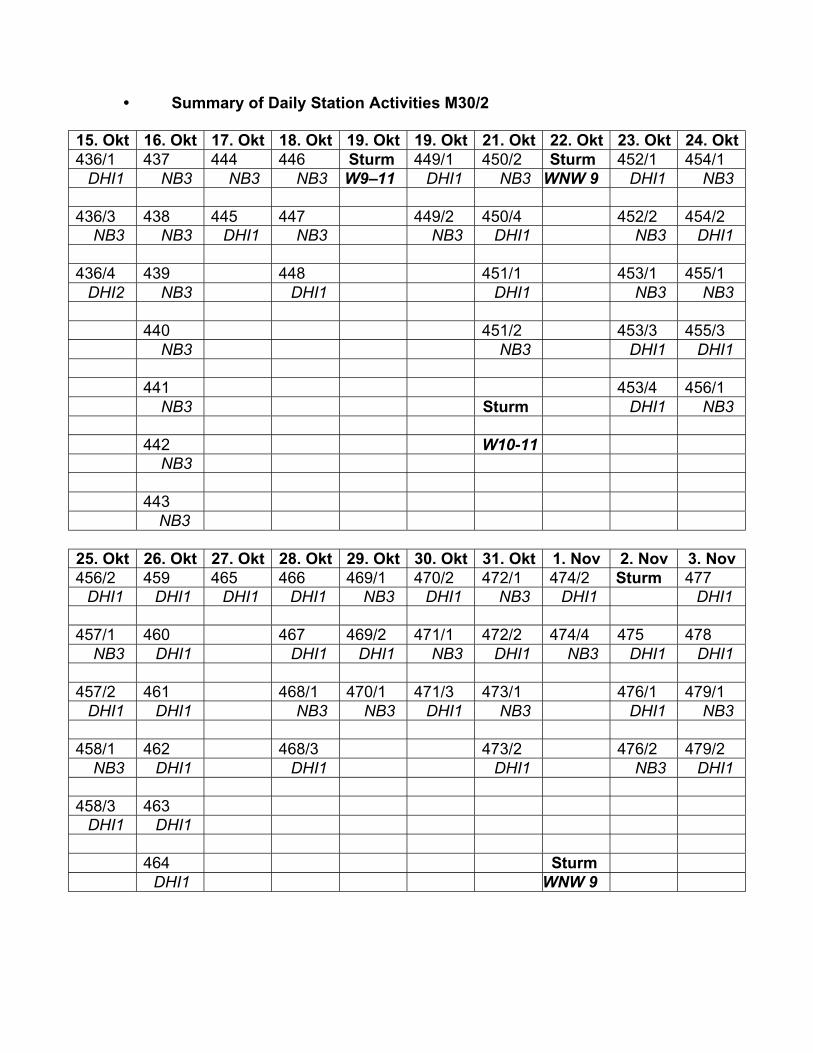
• Summary of Daily Station Activities M30/2
15. Okt 16. Okt 17. Okt 18. Okt 19. Okt 19. Okt 21. Okt 22. Okt 23. Okt 24. Okt436/1 437 444 446 Sturm 449/1 450/2 Sturm 452/1 454/1
DHI1 NB3 NB3 NB3 W9–11 DHI1 NB3 WNW 9 DHI1 NB3
436/3 438 445 447 449/2 450/4 452/2 454/2NB3 NB3 DHI1 NB3 NB3 DHI1 NB3 DHI1
436/4 439 448 451/1 453/1 455/1DHI2 NB3 DHI1 DHI1 NB3 NB3
440 451/2 453/3 455/3NB3 NB3 DHI1 DHI1
441 453/4 456/1NB3 Sturm DHI1 NB3
442 W10-11NB3
443NB3
25. Okt 26. Okt 27. Okt 28. Okt 29. Okt 30. Okt 31. Okt 1. Nov 2. Nov 3. Nov456/2 459 465 466 469/1 470/2 472/1 474/2 Sturm 477
DHI1 DHI1 DHI1 DHI1 NB3 DHI1 NB3 DHI1 DHI1
457/1 460 467 469/2 471/1 472/2 474/4 475 478NB3 DHI1 DHI1 DHI1 NB3 DHI1 NB3 DHI1 DHI1
457/2 461 468/1 470/1 471/3 473/1 476/1 479/1DHI1 DHI1 NB3 NB3 DHI1 NB3 DHI1 NB3
458/1 462 468/3 473/2 476/2 479/2NB3 DHI1 DHI1 DHI1 NB3 DHI1
458/3 463DHI1 DHI1
464 SturmDHI1 WNW 9
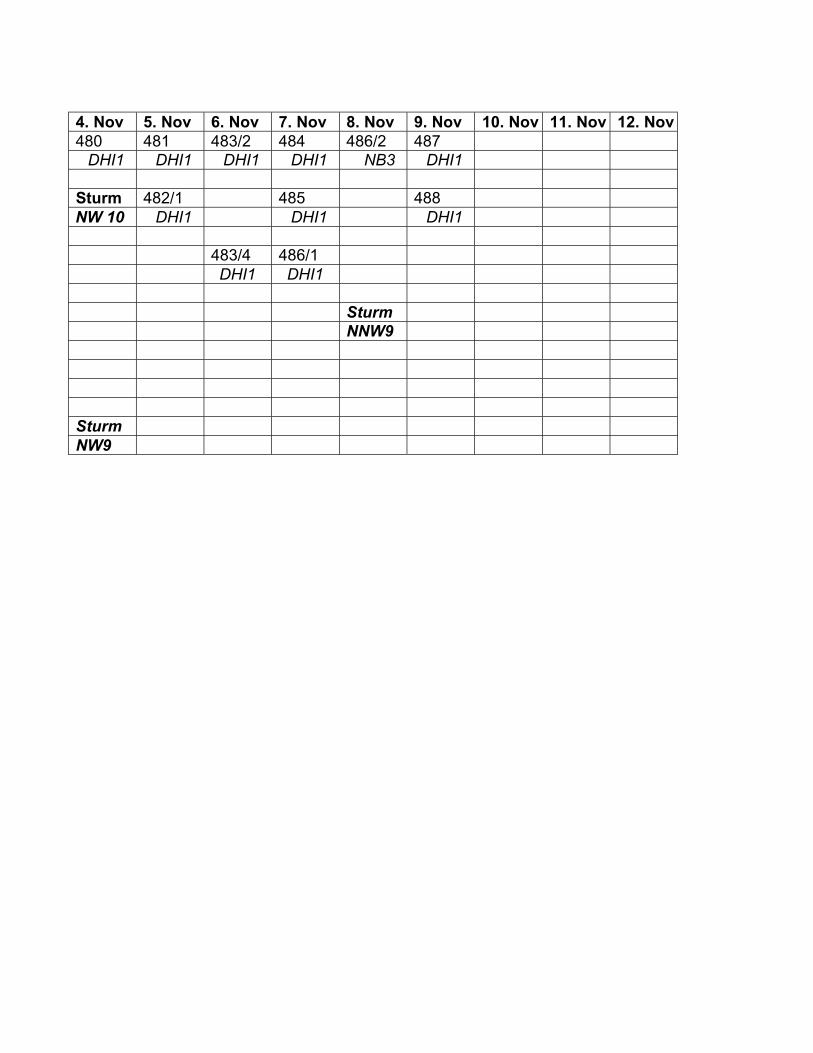
4. Nov 5. Nov 6. Nov 7. Nov 8. Nov 9. Nov 10. Nov 11. Nov 12. Nov480 481 483/2 484 486/2 487
DHI1 DHI1 DHI1 DHI1 NB3 DHI1
Sturm 482/1 485 488NW 10 DHI1 DHI1 DHI1
483/4 486/1DHI1 DHI1
SturmNNW9
SturmNW9
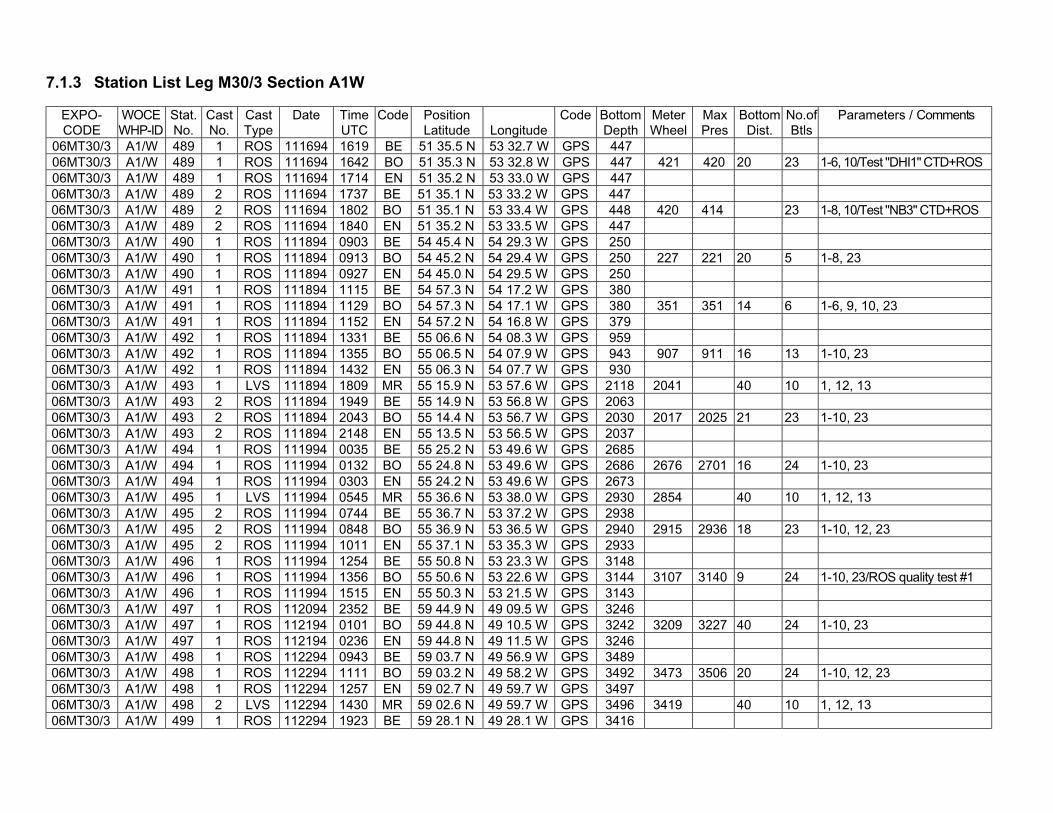
7.1.3 Station List Leg M30/3 Section A1W
EXPO-CODE
WOCEWHP-ID
Stat.No.
CastNo.
CastType
Date TimeUTC
Code PositionLatitude Longitude
Code BottomDepth
MeterWheel
MaxPres
BottomDist.
No.ofBtls
Parameters / Comments
06MT30/3 A1/W 489 1 ROS 111694 1619 BE 51 35.5 N 53 32.7 W GPS 44706MT30/3 A1/W 489 1 ROS 111694 1642 BO 51 35.3 N 53 32.8 W GPS 447 421 420 20 23 1-6, 10/Test "DHI1" CTD+ROS06MT30/3 A1/W 489 1 ROS 111694 1714 EN 51 35.2 N 53 33.0 W GPS 44706MT30/3 A1/W 489 2 ROS 111694 1737 BE 51 35.1 N 53 33.2 W GPS 44706MT30/3 A1/W 489 2 ROS 111694 1802 BO 51 35.1 N 53 33.4 W GPS 448 420 414 23 1-8, 10/Test "NB3" CTD+ROS06MT30/3 A1/W 489 2 ROS 111694 1840 EN 51 35.2 N 53 33.5 W GPS 44706MT30/3 A1/W 490 1 ROS 111894 0903 BE 54 45.4 N 54 29.3 W GPS 25006MT30/3 A1/W 490 1 ROS 111894 0913 BO 54 45.2 N 54 29.4 W GPS 250 227 221 20 5 1-8, 2306MT30/3 A1/W 490 1 ROS 111894 0927 EN 54 45.0 N 54 29.5 W GPS 25006MT30/3 A1/W 491 1 ROS 111894 1115 BE 54 57.3 N 54 17.2 W GPS 38006MT30/3 A1/W 491 1 ROS 111894 1129 BO 54 57.3 N 54 17.1 W GPS 380 351 351 14 6 1-6, 9, 10, 2306MT30/3 A1/W 491 1 ROS 111894 1152 EN 54 57.2 N 54 16.8 W GPS 37906MT30/3 A1/W 492 1 ROS 111894 1331 BE 55 06.6 N 54 08.3 W GPS 95906MT30/3 A1/W 492 1 ROS 111894 1355 BO 55 06.5 N 54 07.9 W GPS 943 907 911 16 13 1-10, 2306MT30/3 A1/W 492 1 ROS 111894 1432 EN 55 06.3 N 54 07.7 W GPS 93006MT30/3 A1/W 493 1 LVS 111894 1809 MR 55 15.9 N 53 57.6 W GPS 2118 2041 40 10 1, 12, 1306MT30/3 A1/W 493 2 ROS 111894 1949 BE 55 14.9 N 53 56.8 W GPS 206306MT30/3 A1/W 493 2 ROS 111894 2043 BO 55 14.4 N 53 56.7 W GPS 2030 2017 2025 21 23 1-10, 2306MT30/3 A1/W 493 2 ROS 111894 2148 EN 55 13.5 N 53 56.5 W GPS 203706MT30/3 A1/W 494 1 ROS 111994 0035 BE 55 25.2 N 53 49.6 W GPS 268506MT30/3 A1/W 494 1 ROS 111994 0132 BO 55 24.8 N 53 49.6 W GPS 2686 2676 2701 16 24 1-10, 2306MT30/3 A1/W 494 1 ROS 111994 0303 EN 55 24.2 N 53 49.6 W GPS 267306MT30/3 A1/W 495 1 LVS 111994 0545 MR 55 36.6 N 53 38.0 W GPS 2930 2854 40 10 1, 12, 1306MT30/3 A1/W 495 2 ROS 111994 0744 BE 55 36.7 N 53 37.2 W GPS 293806MT30/3 A1/W 495 2 ROS 111994 0848 BO 55 36.9 N 53 36.5 W GPS 2940 2915 2936 18 23 1-10, 12, 2306MT30/3 A1/W 495 2 ROS 111994 1011 EN 55 37.1 N 53 35.3 W GPS 293306MT30/3 A1/W 496 1 ROS 111994 1254 BE 55 50.8 N 53 23.3 W GPS 314806MT30/3 A1/W 496 1 ROS 111994 1356 BO 55 50.6 N 53 22.6 W GPS 3144 3107 3140 9 24 1-10, 23/ROS quality test #106MT30/3 A1/W 496 1 ROS 111994 1515 EN 55 50.3 N 53 21.5 W GPS 314306MT30/3 A1/W 497 1 ROS 112094 2352 BE 59 44.9 N 49 09.5 W GPS 324606MT30/3 A1/W 497 1 ROS 112194 0101 BO 59 44.8 N 49 10.5 W GPS 3242 3209 3227 40 24 1-10, 2306MT30/3 A1/W 497 1 ROS 112194 0236 EN 59 44.8 N 49 11.5 W GPS 324606MT30/3 A1/W 498 1 ROS 112294 0943 BE 59 03.7 N 49 56.9 W GPS 348906MT30/3 A1/W 498 1 ROS 112294 1111 BO 59 03.2 N 49 58.2 W GPS 3492 3473 3506 20 24 1-10, 12, 2306MT30/3 A1/W 498 1 ROS 112294 1257 EN 59 02.7 N 49 59.7 W GPS 349706MT30/3 A1/W 498 2 LVS 112294 1430 MR 59 02.6 N 49 59.7 W GPS 3496 3419 40 10 1, 12, 1306MT30/3 A1/W 499 1 ROS 112294 1923 BE 59 28.1 N 49 28.1 W GPS 3416
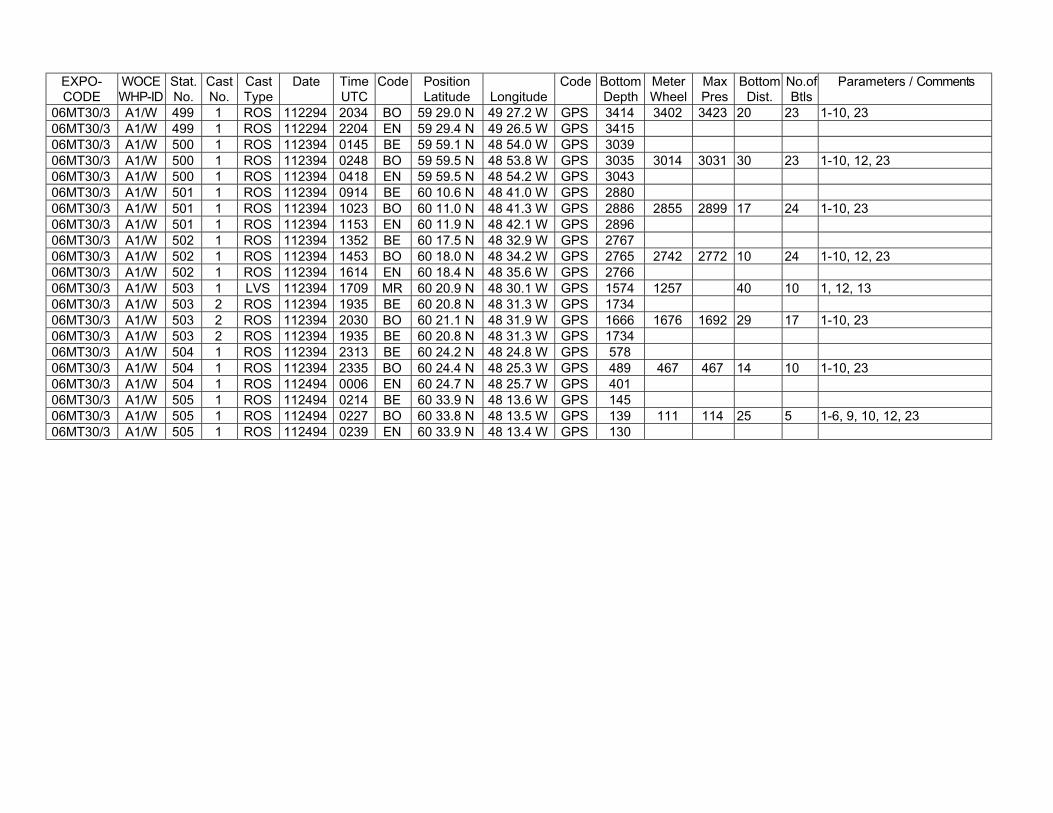
EXPO-CODE
WOCEWHP-ID
Stat.No.
CastNo.
CastType
Date TimeUTC
Code PositionLatitude Longitude
Code BottomDepth
MeterWheel
MaxPres
BottomDist.
No.ofBtls
Parameters / Comments
06MT30/3 A1/W 499 1 ROS 112294 2034 BO 59 29.0 N 49 27.2 W GPS 3414 3402 3423 20 23 1-10, 2306MT30/3 A1/W 499 1 ROS 112294 2204 EN 59 29.4 N 49 26.5 W GPS 341506MT30/3 A1/W 500 1 ROS 112394 0145 BE 59 59.1 N 48 54.0 W GPS 303906MT30/3 A1/W 500 1 ROS 112394 0248 BO 59 59.5 N 48 53.8 W GPS 3035 3014 3031 30 23 1-10, 12, 2306MT30/3 A1/W 500 1 ROS 112394 0418 EN 59 59.5 N 48 54.2 W GPS 304306MT30/3 A1/W 501 1 ROS 112394 0914 BE 60 10.6 N 48 41.0 W GPS 288006MT30/3 A1/W 501 1 ROS 112394 1023 BO 60 11.0 N 48 41.3 W GPS 2886 2855 2899 17 24 1-10, 2306MT30/3 A1/W 501 1 ROS 112394 1153 EN 60 11.9 N 48 42.1 W GPS 289606MT30/3 A1/W 502 1 ROS 112394 1352 BE 60 17.5 N 48 32.9 W GPS 276706MT30/3 A1/W 502 1 ROS 112394 1453 BO 60 18.0 N 48 34.2 W GPS 2765 2742 2772 10 24 1-10, 12, 2306MT30/3 A1/W 502 1 ROS 112394 1614 EN 60 18.4 N 48 35.6 W GPS 276606MT30/3 A1/W 503 1 LVS 112394 1709 MR 60 20.9 N 48 30.1 W GPS 1574 1257 40 10 1, 12, 1306MT30/3 A1/W 503 2 ROS 112394 1935 BE 60 20.8 N 48 31.3 W GPS 173406MT30/3 A1/W 503 2 ROS 112394 2030 BO 60 21.1 N 48 31.9 W GPS 1666 1676 1692 29 17 1-10, 2306MT30/3 A1/W 503 2 ROS 112394 1935 BE 60 20.8 N 48 31.3 W GPS 173406MT30/3 A1/W 504 1 ROS 112394 2313 BE 60 24.2 N 48 24.8 W GPS 57806MT30/3 A1/W 504 1 ROS 112394 2335 BO 60 24.4 N 48 25.3 W GPS 489 467 467 14 10 1-10, 2306MT30/3 A1/W 504 1 ROS 112494 0006 EN 60 24.7 N 48 25.7 W GPS 40106MT30/3 A1/W 505 1 ROS 112494 0214 BE 60 33.9 N 48 13.6 W GPS 14506MT30/3 A1/W 505 1 ROS 112494 0227 BO 60 33.8 N 48 13.5 W GPS 139 111 114 25 5 1-6, 9, 10, 12, 2306MT30/3 A1/W 505 1 ROS 112494 0239 EN 60 33.9 N 48 13.4 W GPS 130
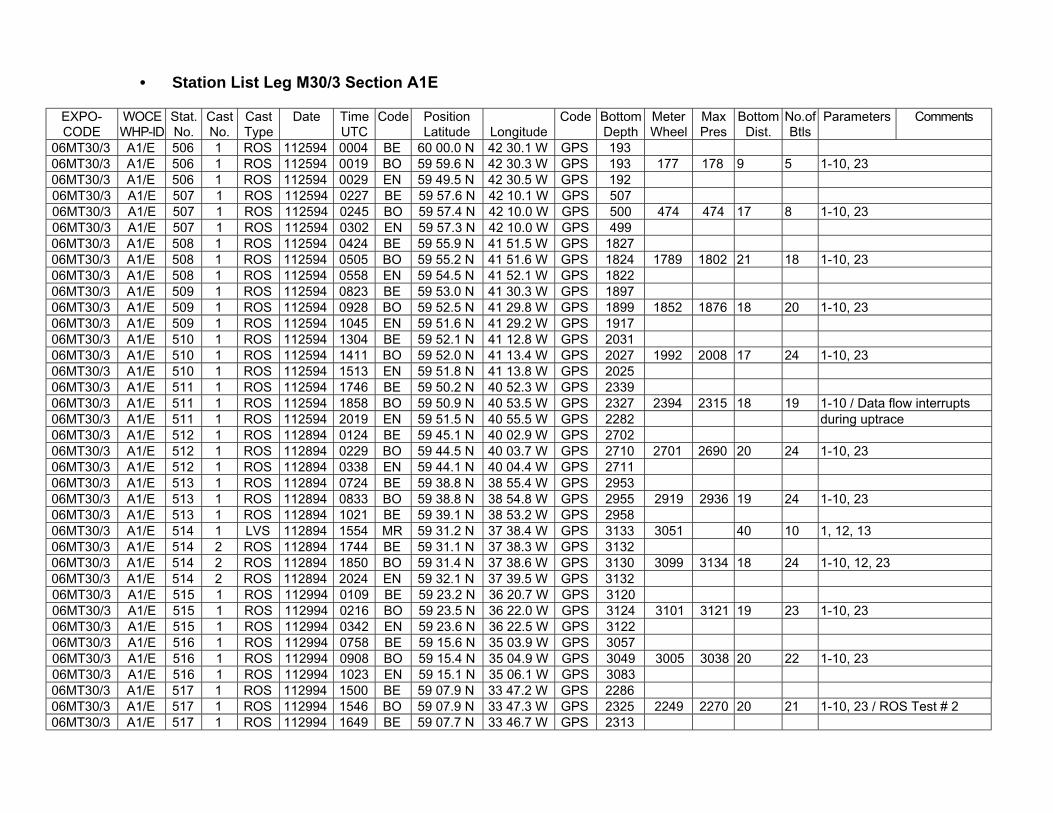
• Station List Leg M30/3 Section A1E
EXPO-CODE
WOCEWHP-ID
Stat.No.
CastNo.
CastType
Date TimeUTC
Code PositionLatitude Longitude
Code BottomDepth
MeterWheel
MaxPres
BottomDist.
No.ofBtls
Parameters Comments
06MT30/3 A1/E 506 1 ROS 112594 0004 BE 60 00.0 N 42 30.1 W GPS 19306MT30/3 A1/E 506 1 ROS 112594 0019 BO 59 59.6 N 42 30.3 W GPS 193 177 178 9 5 1-10, 2306MT30/3 A1/E 506 1 ROS 112594 0029 EN 59 49.5 N 42 30.5 W GPS 19206MT30/3 A1/E 507 1 ROS 112594 0227 BE 59 57.6 N 42 10.1 W GPS 50706MT30/3 A1/E 507 1 ROS 112594 0245 BO 59 57.4 N 42 10.0 W GPS 500 474 474 17 8 1-10, 2306MT30/3 A1/E 507 1 ROS 112594 0302 EN 59 57.3 N 42 10.0 W GPS 49906MT30/3 A1/E 508 1 ROS 112594 0424 BE 59 55.9 N 41 51.5 W GPS 182706MT30/3 A1/E 508 1 ROS 112594 0505 BO 59 55.2 N 41 51.6 W GPS 1824 1789 1802 21 18 1-10, 2306MT30/3 A1/E 508 1 ROS 112594 0558 EN 59 54.5 N 41 52.1 W GPS 182206MT30/3 A1/E 509 1 ROS 112594 0823 BE 59 53.0 N 41 30.3 W GPS 189706MT30/3 A1/E 509 1 ROS 112594 0928 BO 59 52.5 N 41 29.8 W GPS 1899 1852 1876 18 20 1-10, 2306MT30/3 A1/E 509 1 ROS 112594 1045 EN 59 51.6 N 41 29.2 W GPS 191706MT30/3 A1/E 510 1 ROS 112594 1304 BE 59 52.1 N 41 12.8 W GPS 203106MT30/3 A1/E 510 1 ROS 112594 1411 BO 59 52.0 N 41 13.4 W GPS 2027 1992 2008 17 24 1-10, 2306MT30/3 A1/E 510 1 ROS 112594 1513 EN 59 51.8 N 41 13.8 W GPS 202506MT30/3 A1/E 511 1 ROS 112594 1746 BE 59 50.2 N 40 52.3 W GPS 233906MT30/3 A1/E 511 1 ROS 112594 1858 BO 59 50.9 N 40 53.5 W GPS 2327 2394 2315 18 19 1-10 / Data flow interrupts06MT30/3 A1/E 511 1 ROS 112594 2019 EN 59 51.5 N 40 55.5 W GPS 2282 during uptrace06MT30/3 A1/E 512 1 ROS 112894 0124 BE 59 45.1 N 40 02.9 W GPS 270206MT30/3 A1/E 512 1 ROS 112894 0229 BO 59 44.5 N 40 03.7 W GPS 2710 2701 2690 20 24 1-10, 2306MT30/3 A1/E 512 1 ROS 112894 0338 EN 59 44.1 N 40 04.4 W GPS 271106MT30/3 A1/E 513 1 ROS 112894 0724 BE 59 38.8 N 38 55.4 W GPS 295306MT30/3 A1/E 513 1 ROS 112894 0833 BO 59 38.8 N 38 54.8 W GPS 2955 2919 2936 19 24 1-10, 2306MT30/3 A1/E 513 1 ROS 112894 1021 BE 59 39.1 N 38 53.2 W GPS 295806MT30/3 A1/E 514 1 LVS 112894 1554 MR 59 31.2 N 37 38.4 W GPS 3133 3051 40 10 1, 12, 1306MT30/3 A1/E 514 2 ROS 112894 1744 BE 59 31.1 N 37 38.3 W GPS 313206MT30/3 A1/E 514 2 ROS 112894 1850 BO 59 31.4 N 37 38.6 W GPS 3130 3099 3134 18 24 1-10, 12, 2306MT30/3 A1/E 514 2 ROS 112894 2024 EN 59 32.1 N 37 39.5 W GPS 313206MT30/3 A1/E 515 1 ROS 112994 0109 BE 59 23.2 N 36 20.7 W GPS 312006MT30/3 A1/E 515 1 ROS 112994 0216 BO 59 23.5 N 36 22.0 W GPS 3124 3101 3121 19 23 1-10, 2306MT30/3 A1/E 515 1 ROS 112994 0342 EN 59 23.6 N 36 22.5 W GPS 312206MT30/3 A1/E 516 1 ROS 112994 0758 BE 59 15.6 N 35 03.9 W GPS 305706MT30/3 A1/E 516 1 ROS 112994 0908 BO 59 15.4 N 35 04.9 W GPS 3049 3005 3038 20 22 1-10, 2306MT30/3 A1/E 516 1 ROS 112994 1023 EN 59 15.1 N 35 06.1 W GPS 308306MT30/3 A1/E 517 1 ROS 112994 1500 BE 59 07.9 N 33 47.2 W GPS 228606MT30/3 A1/E 517 1 ROS 112994 1546 BO 59 07.9 N 33 47.3 W GPS 2325 2249 2270 20 21 1-10, 23 / ROS Test # 206MT30/3 A1/E 517 1 ROS 112994 1649 BE 59 07.7 N 33 46.7 W GPS 2313
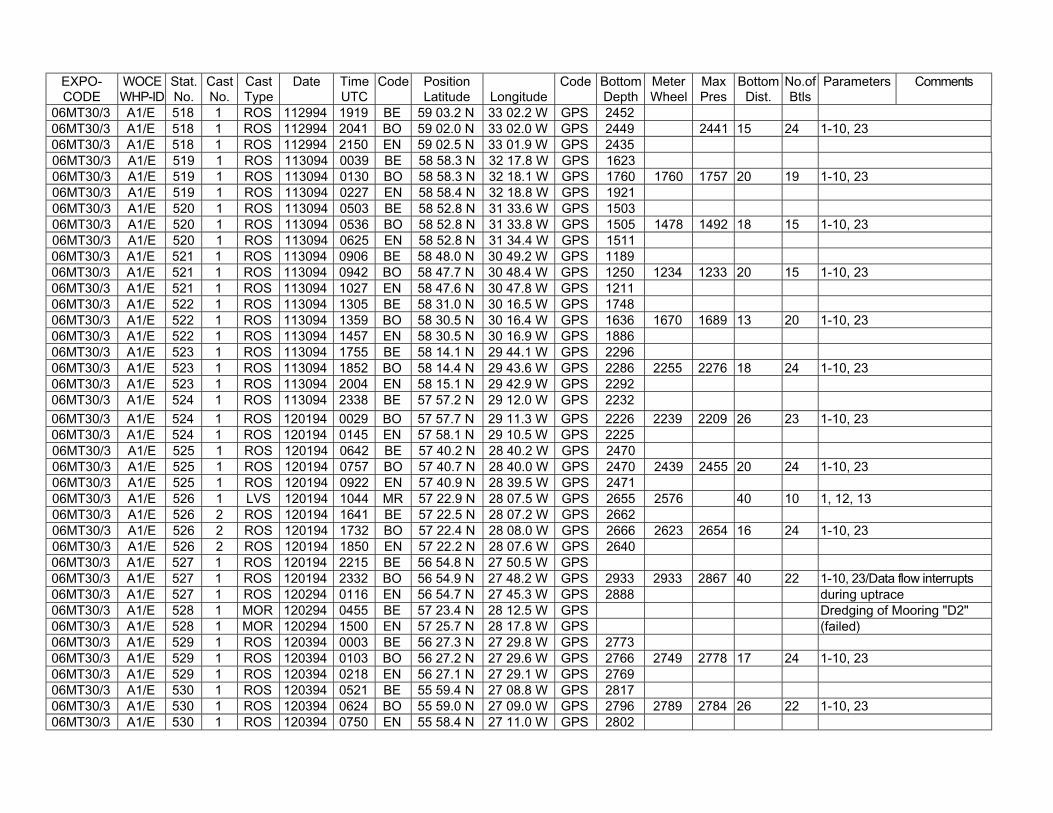
EXPO-CODE
WOCEWHP-ID
Stat.No.
CastNo.
CastType
Date TimeUTC
Code PositionLatitude Longitude
Code BottomDepth
MeterWheel
MaxPres
BottomDist.
No.ofBtls
Parameters Comments
06MT30/3 A1/E 518 1 ROS 112994 1919 BE 59 03.2 N 33 02.2 W GPS 245206MT30/3 A1/E 518 1 ROS 112994 2041 BO 59 02.0 N 33 02.0 W GPS 2449 2441 15 24 1-10, 2306MT30/3 A1/E 518 1 ROS 112994 2150 EN 59 02.5 N 33 01.9 W GPS 243506MT30/3 A1/E 519 1 ROS 113094 0039 BE 58 58.3 N 32 17.8 W GPS 162306MT30/3 A1/E 519 1 ROS 113094 0130 BO 58 58.3 N 32 18.1 W GPS 1760 1760 1757 20 19 1-10, 2306MT30/3 A1/E 519 1 ROS 113094 0227 EN 58 58.4 N 32 18.8 W GPS 192106MT30/3 A1/E 520 1 ROS 113094 0503 BE 58 52.8 N 31 33.6 W GPS 150306MT30/3 A1/E 520 1 ROS 113094 0536 BO 58 52.8 N 31 33.8 W GPS 1505 1478 1492 18 15 1-10, 2306MT30/3 A1/E 520 1 ROS 113094 0625 EN 58 52.8 N 31 34.4 W GPS 151106MT30/3 A1/E 521 1 ROS 113094 0906 BE 58 48.0 N 30 49.2 W GPS 118906MT30/3 A1/E 521 1 ROS 113094 0942 BO 58 47.7 N 30 48.4 W GPS 1250 1234 1233 20 15 1-10, 2306MT30/3 A1/E 521 1 ROS 113094 1027 EN 58 47.6 N 30 47.8 W GPS 121106MT30/3 A1/E 522 1 ROS 113094 1305 BE 58 31.0 N 30 16.5 W GPS 174806MT30/3 A1/E 522 1 ROS 113094 1359 BO 58 30.5 N 30 16.4 W GPS 1636 1670 1689 13 20 1-10, 2306MT30/3 A1/E 522 1 ROS 113094 1457 EN 58 30.5 N 30 16.9 W GPS 188606MT30/3 A1/E 523 1 ROS 113094 1755 BE 58 14.1 N 29 44.1 W GPS 229606MT30/3 A1/E 523 1 ROS 113094 1852 BO 58 14.4 N 29 43.6 W GPS 2286 2255 2276 18 24 1-10, 2306MT30/3 A1/E 523 1 ROS 113094 2004 EN 58 15.1 N 29 42.9 W GPS 229206MT30/3 A1/E 524 1 ROS 113094 2338 BE 57 57.2 N 29 12.0 W GPS 223206MT30/3 A1/E 524 1 ROS 120194 0029 BO 57 57.7 N 29 11.3 W GPS 2226 2239 2209 26 23 1-10, 2306MT30/3 A1/E 524 1 ROS 120194 0145 EN 57 58.1 N 29 10.5 W GPS 222506MT30/3 A1/E 525 1 ROS 120194 0642 BE 57 40.2 N 28 40.2 W GPS 247006MT30/3 A1/E 525 1 ROS 120194 0757 BO 57 40.7 N 28 40.0 W GPS 2470 2439 2455 20 24 1-10, 2306MT30/3 A1/E 525 1 ROS 120194 0922 EN 57 40.9 N 28 39.5 W GPS 247106MT30/3 A1/E 526 1 LVS 120194 1044 MR 57 22.9 N 28 07.5 W GPS 2655 2576 40 10 1, 12, 1306MT30/3 A1/E 526 2 ROS 120194 1641 BE 57 22.5 N 28 07.2 W GPS 266206MT30/3 A1/E 526 2 ROS 120194 1732 BO 57 22.4 N 28 08.0 W GPS 2666 2623 2654 16 24 1-10, 2306MT30/3 A1/E 526 2 ROS 120194 1850 EN 57 22.2 N 28 07.6 W GPS 264006MT30/3 A1/E 527 1 ROS 120194 2215 BE 56 54.8 N 27 50.5 W GPS06MT30/3 A1/E 527 1 ROS 120194 2332 BO 56 54.9 N 27 48.2 W GPS 2933 2933 2867 40 22 1-10, 23/Data flow interrupts06MT30/3 A1/E 527 1 ROS 120294 0116 EN 56 54.7 N 27 45.3 W GPS 2888 during uptrace06MT30/3 A1/E 528 1 MOR 120294 0455 BE 57 23.4 N 28 12.5 W GPS Dredging of Mooring "D2"06MT30/3 A1/E 528 1 MOR 120294 1500 EN 57 25.7 N 28 17.8 W GPS (failed)06MT30/3 A1/E 529 1 ROS 120394 0003 BE 56 27.3 N 27 29.8 W GPS 277306MT30/3 A1/E 529 1 ROS 120394 0103 BO 56 27.2 N 27 29.6 W GPS 2766 2749 2778 17 24 1-10, 2306MT30/3 A1/E 529 1 ROS 120394 0218 EN 56 27.1 N 27 29.1 W GPS 276906MT30/3 A1/E 530 1 ROS 120394 0521 BE 55 59.4 N 27 08.8 W GPS 281706MT30/3 A1/E 530 1 ROS 120394 0624 BO 55 59.0 N 27 09.0 W GPS 2796 2789 2784 26 22 1-10, 2306MT30/3 A1/E 530 1 ROS 120394 0750 EN 55 58.4 N 27 11.0 W GPS 2802
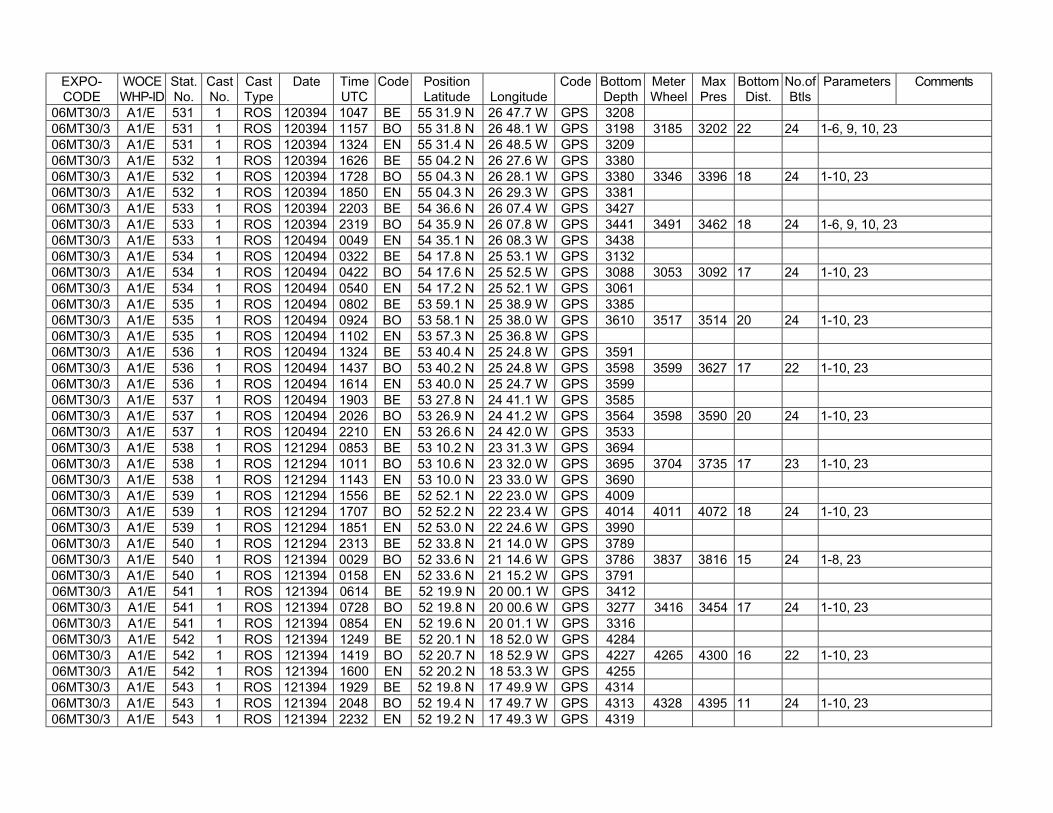
EXPO-CODE
WOCEWHP-ID
Stat.No.
CastNo.
CastType
Date TimeUTC
Code PositionLatitude Longitude
Code BottomDepth
MeterWheel
MaxPres
BottomDist.
No.ofBtls
Parameters Comments
06MT30/3 A1/E 531 1 ROS 120394 1047 BE 55 31.9 N 26 47.7 W GPS 320806MT30/3 A1/E 531 1 ROS 120394 1157 BO 55 31.8 N 26 48.1 W GPS 3198 3185 3202 22 24 1-6, 9, 10, 2306MT30/3 A1/E 531 1 ROS 120394 1324 EN 55 31.4 N 26 48.5 W GPS 320906MT30/3 A1/E 532 1 ROS 120394 1626 BE 55 04.2 N 26 27.6 W GPS 338006MT30/3 A1/E 532 1 ROS 120394 1728 BO 55 04.3 N 26 28.1 W GPS 3380 3346 3396 18 24 1-10, 2306MT30/3 A1/E 532 1 ROS 120394 1850 EN 55 04.3 N 26 29.3 W GPS 338106MT30/3 A1/E 533 1 ROS 120394 2203 BE 54 36.6 N 26 07.4 W GPS 342706MT30/3 A1/E 533 1 ROS 120394 2319 BO 54 35.9 N 26 07.8 W GPS 3441 3491 3462 18 24 1-6, 9, 10, 2306MT30/3 A1/E 533 1 ROS 120494 0049 EN 54 35.1 N 26 08.3 W GPS 343806MT30/3 A1/E 534 1 ROS 120494 0322 BE 54 17.8 N 25 53.1 W GPS 313206MT30/3 A1/E 534 1 ROS 120494 0422 BO 54 17.6 N 25 52.5 W GPS 3088 3053 3092 17 24 1-10, 2306MT30/3 A1/E 534 1 ROS 120494 0540 EN 54 17.2 N 25 52.1 W GPS 306106MT30/3 A1/E 535 1 ROS 120494 0802 BE 53 59.1 N 25 38.9 W GPS 338506MT30/3 A1/E 535 1 ROS 120494 0924 BO 53 58.1 N 25 38.0 W GPS 3610 3517 3514 20 24 1-10, 2306MT30/3 A1/E 535 1 ROS 120494 1102 EN 53 57.3 N 25 36.8 W GPS06MT30/3 A1/E 536 1 ROS 120494 1324 BE 53 40.4 N 25 24.8 W GPS 359106MT30/3 A1/E 536 1 ROS 120494 1437 BO 53 40.2 N 25 24.8 W GPS 3598 3599 3627 17 22 1-10, 2306MT30/3 A1/E 536 1 ROS 120494 1614 EN 53 40.0 N 25 24.7 W GPS 359906MT30/3 A1/E 537 1 ROS 120494 1903 BE 53 27.8 N 24 41.1 W GPS 358506MT30/3 A1/E 537 1 ROS 120494 2026 BO 53 26.9 N 24 41.2 W GPS 3564 3598 3590 20 24 1-10, 2306MT30/3 A1/E 537 1 ROS 120494 2210 EN 53 26.6 N 24 42.0 W GPS 353306MT30/3 A1/E 538 1 ROS 121294 0853 BE 53 10.2 N 23 31.3 W GPS 369406MT30/3 A1/E 538 1 ROS 121294 1011 BO 53 10.6 N 23 32.0 W GPS 3695 3704 3735 17 23 1-10, 2306MT30/3 A1/E 538 1 ROS 121294 1143 EN 53 10.0 N 23 33.0 W GPS 369006MT30/3 A1/E 539 1 ROS 121294 1556 BE 52 52.1 N 22 23.0 W GPS 400906MT30/3 A1/E 539 1 ROS 121294 1707 BO 52 52.2 N 22 23.4 W GPS 4014 4011 4072 18 24 1-10, 2306MT30/3 A1/E 539 1 ROS 121294 1851 EN 52 53.0 N 22 24.6 W GPS 399006MT30/3 A1/E 540 1 ROS 121294 2313 BE 52 33.8 N 21 14.0 W GPS 378906MT30/3 A1/E 540 1 ROS 121394 0029 BO 52 33.6 N 21 14.6 W GPS 3786 3837 3816 15 24 1-8, 2306MT30/3 A1/E 540 1 ROS 121394 0158 EN 52 33.6 N 21 15.2 W GPS 379106MT30/3 A1/E 541 1 ROS 121394 0614 BE 52 19.9 N 20 00.1 W GPS 341206MT30/3 A1/E 541 1 ROS 121394 0728 BO 52 19.8 N 20 00.6 W GPS 3277 3416 3454 17 24 1-10, 2306MT30/3 A1/E 541 1 ROS 121394 0854 EN 52 19.6 N 20 01.1 W GPS 331606MT30/3 A1/E 542 1 ROS 121394 1249 BE 52 20.1 N 18 52.0 W GPS 428406MT30/3 A1/E 542 1 ROS 121394 1419 BO 52 20.7 N 18 52.9 W GPS 4227 4265 4300 16 22 1-10, 2306MT30/3 A1/E 542 1 ROS 121394 1600 EN 52 20.2 N 18 53.3 W GPS 425506MT30/3 A1/E 543 1 ROS 121394 1929 BE 52 19.8 N 17 49.9 W GPS 431406MT30/3 A1/E 543 1 ROS 121394 2048 BO 52 19.4 N 17 49.7 W GPS 4313 4328 4395 11 24 1-10, 2306MT30/3 A1/E 543 1 ROS 121394 2232 EN 52 19.2 N 17 49.3 W GPS 4319
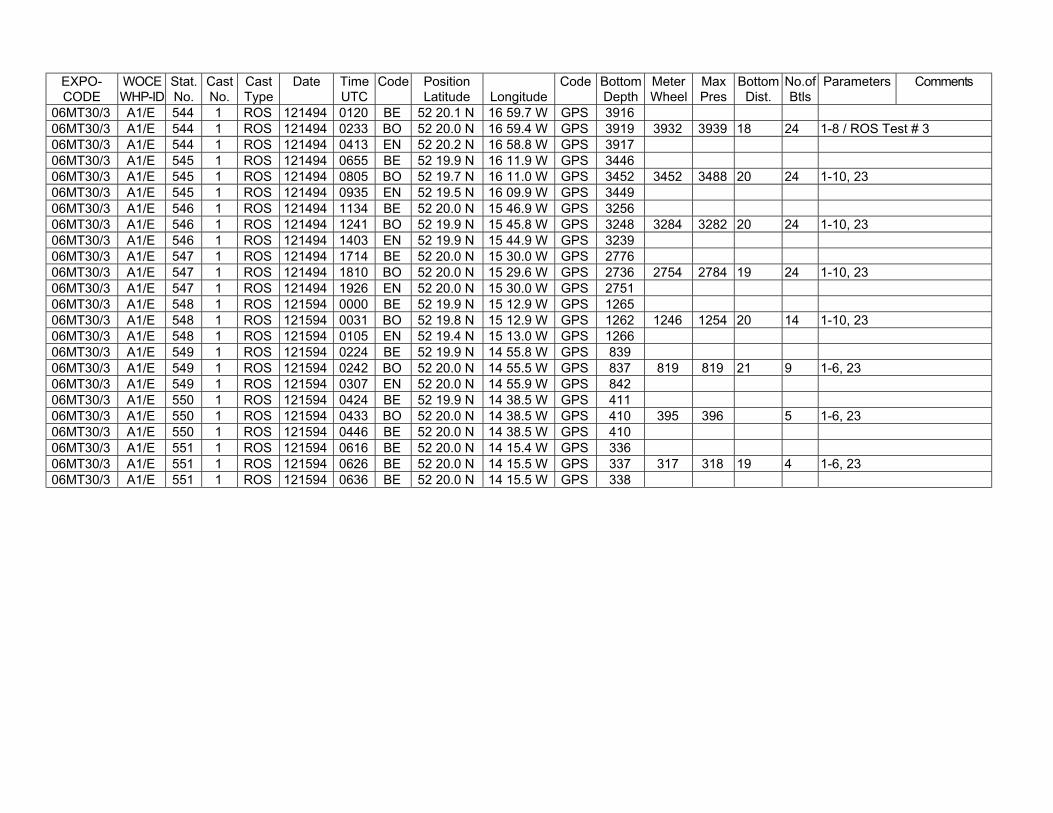
EXPO-CODE
WOCEWHP-ID
Stat.No.
CastNo.
CastType
Date TimeUTC
Code PositionLatitude Longitude
Code BottomDepth
MeterWheel
MaxPres
BottomDist.
No.ofBtls
Parameters Comments
06MT30/3 A1/E 544 1 ROS 121494 0120 BE 52 20.1 N 16 59.7 W GPS 391606MT30/3 A1/E 544 1 ROS 121494 0233 BO 52 20.0 N 16 59.4 W GPS 3919 3932 3939 18 24 1-8 / ROS Test # 306MT30/3 A1/E 544 1 ROS 121494 0413 EN 52 20.2 N 16 58.8 W GPS 391706MT30/3 A1/E 545 1 ROS 121494 0655 BE 52 19.9 N 16 11.9 W GPS 344606MT30/3 A1/E 545 1 ROS 121494 0805 BO 52 19.7 N 16 11.0 W GPS 3452 3452 3488 20 24 1-10, 2306MT30/3 A1/E 545 1 ROS 121494 0935 EN 52 19.5 N 16 09.9 W GPS 344906MT30/3 A1/E 546 1 ROS 121494 1134 BE 52 20.0 N 15 46.9 W GPS 325606MT30/3 A1/E 546 1 ROS 121494 1241 BO 52 19.9 N 15 45.8 W GPS 3248 3284 3282 20 24 1-10, 2306MT30/3 A1/E 546 1 ROS 121494 1403 EN 52 19.9 N 15 44.9 W GPS 323906MT30/3 A1/E 547 1 ROS 121494 1714 BE 52 20.0 N 15 30.0 W GPS 277606MT30/3 A1/E 547 1 ROS 121494 1810 BO 52 20.0 N 15 29.6 W GPS 2736 2754 2784 19 24 1-10, 2306MT30/3 A1/E 547 1 ROS 121494 1926 EN 52 20.0 N 15 30.0 W GPS 275106MT30/3 A1/E 548 1 ROS 121594 0000 BE 52 19.9 N 15 12.9 W GPS 126506MT30/3 A1/E 548 1 ROS 121594 0031 BO 52 19.8 N 15 12.9 W GPS 1262 1246 1254 20 14 1-10, 2306MT30/3 A1/E 548 1 ROS 121594 0105 EN 52 19.4 N 15 13.0 W GPS 126606MT30/3 A1/E 549 1 ROS 121594 0224 BE 52 19.9 N 14 55.8 W GPS 83906MT30/3 A1/E 549 1 ROS 121594 0242 BO 52 20.0 N 14 55.5 W GPS 837 819 819 21 9 1-6, 2306MT30/3 A1/E 549 1 ROS 121594 0307 EN 52 20.0 N 14 55.9 W GPS 84206MT30/3 A1/E 550 1 ROS 121594 0424 BE 52 19.9 N 14 38.5 W GPS 41106MT30/3 A1/E 550 1 ROS 121594 0433 BO 52 20.0 N 14 38.5 W GPS 410 395 396 5 1-6, 2306MT30/3 A1/E 550 1 ROS 121594 0446 BE 52 20.0 N 14 38.5 W GPS 41006MT30/3 A1/E 551 1 ROS 121594 0616 BE 52 20.0 N 14 15.4 W GPS 33606MT30/3 A1/E 551 1 ROS 121594 0626 BE 52 20.0 N 14 15.5 W GPS 337 317 318 19 4 1-6, 2306MT30/3 A1/E 551 1 ROS 121594 0636 BE 52 20.0 N 14 15.5 W GPS 338
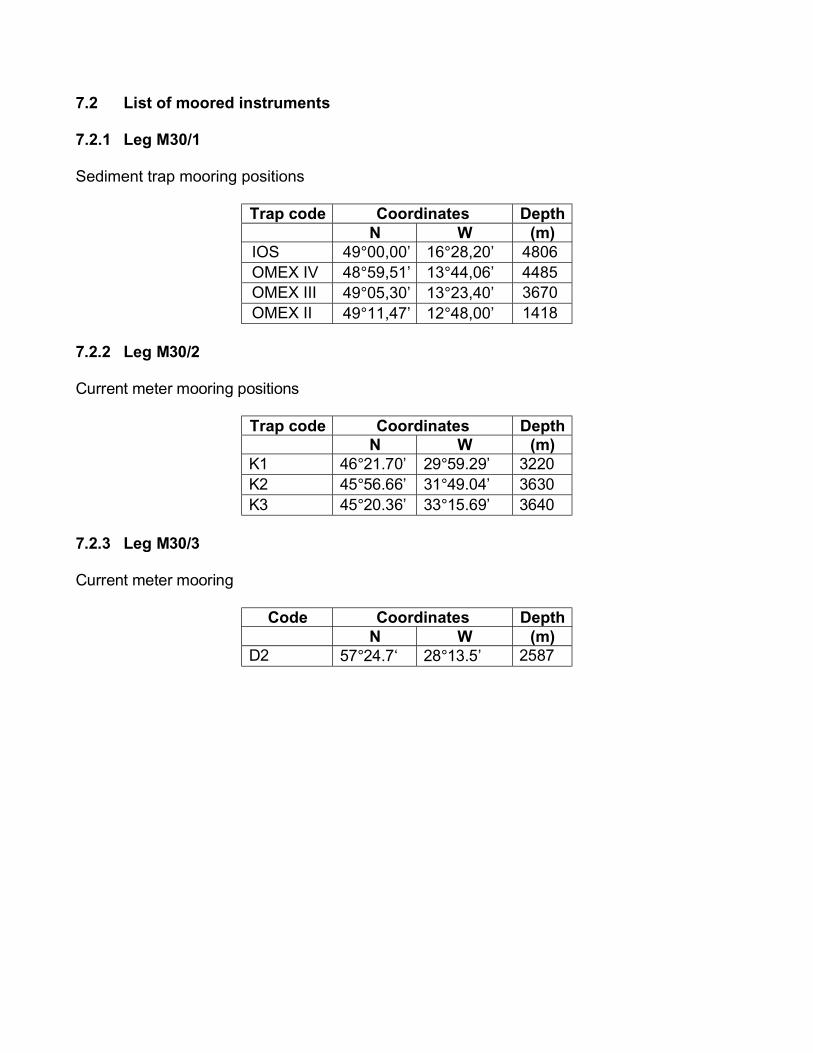
7.2 List of moored instruments
7.2.1 Leg M30/1
Sediment trap mooring positions
Trap code Coordinates DepthN W (m)
IOS 49°00,00’ 16°28,20’ 4806OMEX IV 48°59,51’ 13°44,06’ 4485OMEX III 49°05,30’ 13°23,40’ 3670OMEX II 49°11,47’ 12°48,00’ 1418
7. 2. 2 Le g M30 /2
Cu rr ent me te r m oor in g p ositions
Trap code Coordinates DepthN W (m)
K1 46 °21 .7 0’ 29 °59 .2 9’ 32 20 K2 45 °56 .6 6’ 31 °49 .0 4’ 36 30 K3 45 °20 .3 6’ 33 °15 .6 9’ 36 40
7. 2. 3 Le g M30 /3
Cu rr ent me te r m oor in g
Code Coordinates DepthN W (m)
D2 57 °24 .7 ‘ 28 °13 .5 ’ 25 87
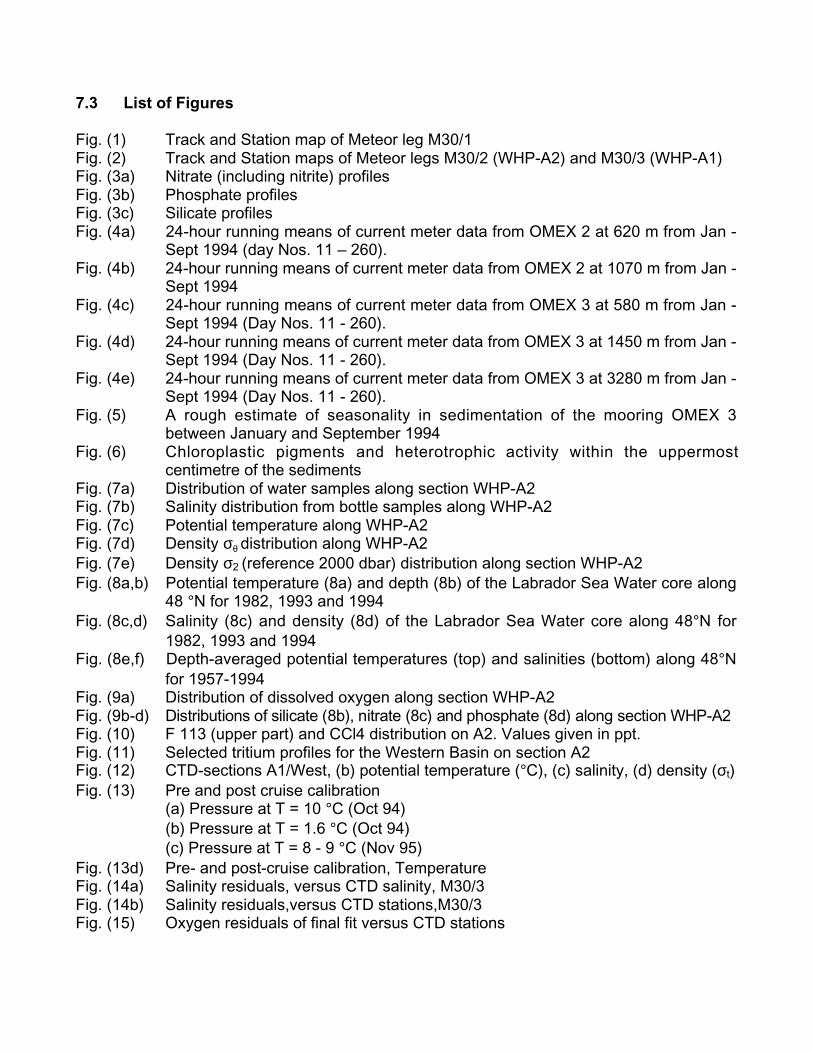
7.3 List of Figures
Fig. (1) Track and Station map of Meteor leg M30/1Fig. (2) Track and Station maps of Meteor legs M30/2 (WHP-A2) and M30/3 (WHP-A1)Fig. (3a) Nitrate (including nitrite) profilesFig. (3b) Phosphate profilesFig. (3c) Silicate profilesFig. (4a) 24-hour running means of current meter data from OMEX 2 at 620 m from Jan -
Sept 1994 (day Nos. 11 – 260).Fig. (4b) 24-hour running means of current meter data from OMEX 2 at 1070 m from Jan -
Sept 1994Fig. (4c) 24-hour running means of current meter data from OMEX 3 at 580 m from Jan -
Sept 1994 (Day Nos. 11 - 260).Fig. (4d) 24-hour running means of current meter data from OMEX 3 at 1450 m from Jan -
Sept 1994 (Day Nos. 11 - 260).Fig. (4e) 24-hour running means of current meter data from OMEX 3 at 3280 m from Jan -
Sept 1994 (Day Nos. 11 - 260).Fig. (5) A rough estimate of seasonality in sedimentation of the mooring OMEX 3
between January and September 1994Fig. (6) Chloroplastic pigments and heterotrophic activity within the uppermost
centimetre of the sedimentsFig. (7a) Distribution of water samples along section WHP-A2Fig. (7b) Salinity distribution from bottle samples along WHP-A2Fig. (7c) Potential temperature along WHP-A2Fig. (7d) Density σθ distribution along WHP-A2Fig. (7e) Density σ2 (reference 2000 dbar) distribution along section WHP-A2Fig. (8a,b) Potential temperature (8a) and depth (8b) of the Labrador Sea Water core along
48 °N for 1982, 1993 and 1994Fig. (8c,d) Salinity (8c) and density (8d) of the Labrador Sea Water core along 48°N for
1982, 1993 and 1994Fig. (8e,f) Depth-averaged potential temperatures (top) and salinities (bottom) along 48°N
for 1957-1994Fig. (9a) Distribution of dissolved oxygen along section WHP-A2Fig. (9b-d) Distribut ions o f silicate ( 8b), n itrate (8c) and ph osphat e (8d) along section WHP-A2Fig. (10) F 113 (upper part) and CCl4 distribution on A2. Values given in ppt.Fig. (11) Selected tritium profiles for the Western Basin on section A2Fig. (12) CTD-sections A1/West, (b) potential temperature (°C), (c) salinity, (d) density (σt)Fig. (13) Pre and post cruise calibration
(a) Pressure at T = 10 °C (Oct 94)(b) Pressure at T = 1.6 °C (Oct 94)(c) Pressure at T = 8 - 9 °C (Nov 95)
Fig. (13d) Pre- and post-cruise calibration, TemperatureFig. (14a) Salinity residuals, versus CTD salinity, M30/3Fig. (14b) Salinity residuals,versus CTD stations,M30/3Fig. (15) Oxygen residuals of final fit versus CTD stations
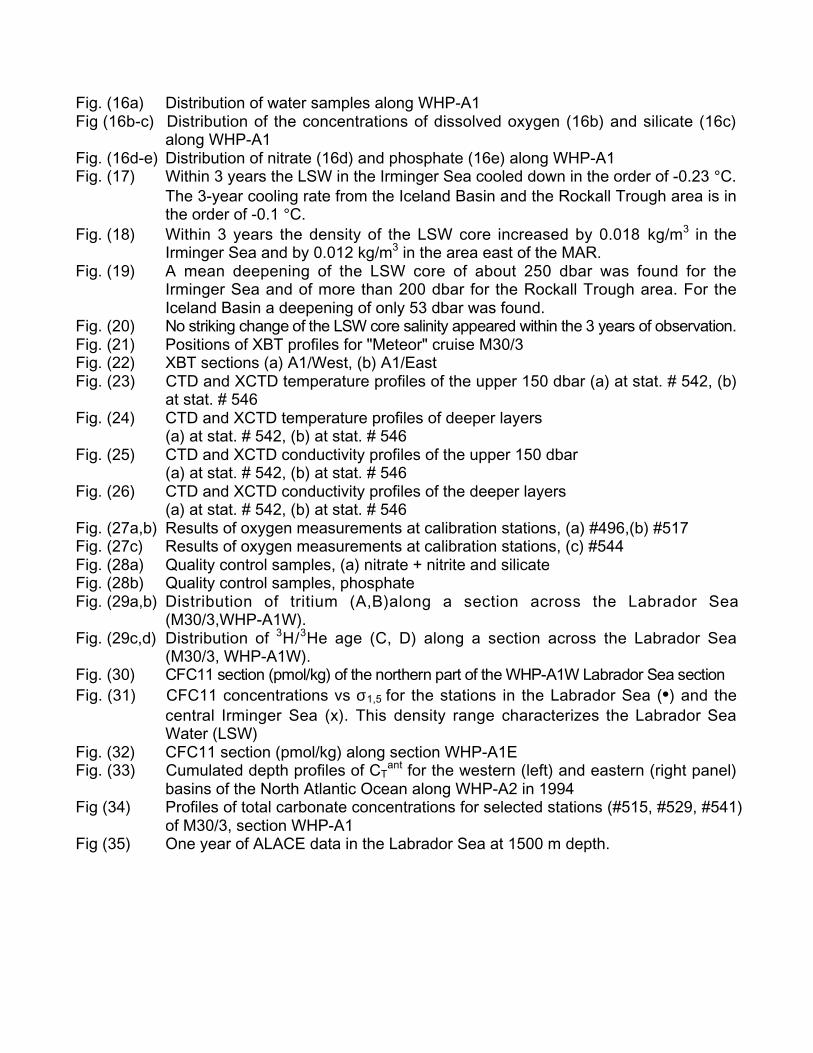
Fig. (16a) Distribution of water samples along WHP-A1Fig (16b-c) Distribution of the concentrations of dissolved oxygen (16b) and silicate (16c)
along WHP-A1Fig. (16d-e) Distribution of nitrate (16d) and phosphate (16e) along WHP-A1Fig. (17) Within 3 years the LSW in the Irminger Sea cooled down in the order of -0.23 °C.
The 3-year cooling rate from the Iceland Basin and the Rockall Trough area is inthe order of -0.1 °C.
Fig. (18) Within 3 years the density of the LSW core increased by 0.018 kg/m3 in theIrminger Sea and by 0.012 kg/m3 in the area east of the MAR.
Fig. (19) A mean deepening of the LSW core of about 250 dbar was found for theIrminger Sea and of more than 200 dbar for the Rockall Trough area. For theIceland Basin a deepening of only 53 dbar was found.
Fig. (20) No striking change of the LSW core salinity appeared within the 3 years of observation.Fig. (21) Positions of XBT profiles for "Meteor" cruise M30/3Fig. (22) XBT sections (a) A1/West, (b) A1/EastFig. (23) CTD and XCTD temperature profiles of the upper 150 dbar (a) at stat. # 542, (b)
at stat. # 546Fig. (24) CTD and XCTD temperature profiles of deeper layers
(a) at stat. # 542, (b) at stat. # 546Fig. (25) CTD and XCTD conductivity profiles of the upper 150 dbar
(a) at stat. # 542, (b) at stat. # 546Fig. (26) CTD and XCTD conductivity profiles of the deeper layers
(a) at stat. # 542, (b) at stat. # 546Fig. (27a,b) Results of oxygen measurements at calibration stations, (a) #496,(b) #517Fig. (27c) Results of oxygen measurements at calibration stations, (c) #544Fig. (28a) Quality control samples, (a) nitrate + nitrite and silicateFig. (28b) Quality control samples, phosphateFig. (29a,b) Distribution of tritium (A,B)along a section across the Labrador Sea
(M30/3,WHP-A1W).Fig. (29c,d) Distribution of 3H/3He age (C, D) along a section across the Labrador Sea
(M30/3, WHP-A1W).Fig. (30) CFC11 section (pmol/kg) of the northern part of the WHP-A1W Labrador Sea sectionFig. (31) CFC11 concentrations vs σ1,5 for the stations in the Labrador Sea (•) and the
central Irminger Sea (x). This density range characterizes the Labrador SeaWater (LSW)
Fig. (32) CFC11 section (pmol/kg) along section WHP-A1EFig. (33) Cumulated depth profiles of CT
ant for the western (left) and eastern (right panel)basins of the North Atlantic Ocean along WHP-A2 in 1994
Fig (34) Profiles of total carbonate concentrations for selected stations (#515, #529, #541)of M30/3, section WHP-A1
Fig (35) One year of ALACE data in the Labrador Sea at 1500 m depth.
8 CONCLUDING REMARKS
The scientific complements of all three legs of this Meteor cruise takes pleasures inexpressing their appreciation to Captains Kull and Bruns and their crews for the excellent andpatient support and encouragement during our work at sea. FS Meteor proved again a veryhospitable and productive floating laboratory. We also would like to thank the "MeteorLeitstelle", "Deutsche Forschungsgemeinschaft", the "Bundesministerium für Forschung undTechnologie" and "Auswärtiges Amt" for the help, support and their contribution towards thesuccess of this cruise. The support of many people in our home laboratories ensured ourwork at sea; they might not have liked to work in the North Atlantic in autumn at conditions weencountered but they nevertheless were essential to the outcome of this cruise.
All three chief scientists are pleased with the outcome of these German contributions toglobal programmes that after a long time of planning finally came to fruition in aninternational, productive and pleasant collaboration both at sea and ashore.
The goals of this cruise were supported by grants to individual research groups within theframe-work of the German contributions to OMEX, WOCE and JGOFS and by grants of theDeutsche Forschungsgemeinschaft (Ko900/3-1 and Ko900/4-1) for the cruise. This supportis gratefully acknowledged.
9 REFERENCES
AMINOT, A., and KIRKWOOD, D.S. (1995):ICES (fifth) Intercomparison Exercise for Nutrients in Seawater, ICES Copenhagen, (inpress).
ATLAS, E.L., GORDON L.I., HAGER S.W., and P.K. PARK (1971):A practical manual for use of the Technicon AutoAnalyser in seawater analyses,Revised Tech. Rep. 215, Ref. 71-22, Oregon State Univ., 47 pp.
BENDSCHNEIDER, K. and R.J. ROBINSON (1952):A new spectrophotometric method for the determination of nitrite in seawater, J. Mar.Res., (11) 1, p. 87-96.
CULBERSON, D.H. (1991):Dissolved Oxygen. In: WHP Operations and Methods, WHP Office Report WHPO 91-1,15 pp.
DICKSON, R.R., J. MEINCKE, S.-A. MALMBERG and A.J. LEE (1988):The "Great Salinity Anomaly" in the Northern North Atlantic 1968-1982. Prog.Oceanogr., 20, p. 103-151.
ELGIN, R. H. (1994):An Evaluation of XCTD Performance with Design Improvements. Sippican, Inc.,Marion, Mass., USA, unpublished, 6 pp.
GRASSHOFF, K., EHRHARDT, M., and K. KREMLING (1983):Methods of Seawater Analysis, Verlag Chemie, Second Edition.
HANAWA, K., P. RUAL, R. BAILEY, A. SY and M. SZABADOS (1995):A new depth-time equation for Sippican or TSK T-7, T-6 and T-4 expendablebathythermographs (XBT). Deep-Sea Res., 42, p. 1423-1451.
KIRKWOOD, D.S. (1995):Nutrients: Practical notes on their determination in seawater, Techniques In MarineEnvironmental Science, (TIMES series), ICES, Copenhagen, (in press).
KIRKWOOD D. S. and A. R. FOLKARD (1986):Results of the ICES salinity sample-bottle intercomparison. ICES C.M., 16 pp.
KIRKWOOD, D.S., A. AMINOT and M. PERTILLÖ (1991):ICES (fourth) Intercomparison Exercise for Nutrients in Seawater, CooperativeResearch Report No. 174. ICES Copenhagen, 83 pp.
KOLTERMANN, K.P. and A. SY (1994):Western North Atlantic cools at intermediate depths. International WOCE Newsletter,15, p. 5-6.
KÖRTZINGER, A., L. MINTROP, J.C. DUINKER (1996)On the penetration depth and the inventory of anthropogenic CO2 in the north AtlanticOcean (submitted to JGR)
LAZIER, J. (1995):The salinity decrease in the Labrador Sea over the past thirty years. In: Climate ondecade-to-century time scales, National Academy of Sciences Press. Washington,D.C. (in press).
LAZIER, J., M. RHEIN, A. SY and J. MEINCKE (in preparation):Surprisingly rapid renewal of Labrador Sea Water in the Irminger Sea.
MILLARD, R. C. (1993):CTD oxygen calibration procedure. WHP Operations and Methods, WHP Office ReportWHPO 91-1, Revision 1, 29 pp.
MURPHY, J. and J.P. RILEY (1962):A modified single solution method for the determination of phosphate in natural waters,Anal. Chim. Acta, 27, p. 31-36.
MURRAY, C.N., J.P. RILEY and T.R.S. WILSON (1968):The solubility of oxygen in Winkler reagents used for the determination of dissolvedoxygen. Deep-Sea Res., 15, p. 237-238.
PINGREE, R.D. and B. LeCANN . (1989):Celtic and Amorican slope and shelf residual currents. Prog. Oceanog. 23: 303-338.
PINGREE, R.D. and B. LeCANN (1990):Structure, Strength and Seasonality of the slope currents in the Bay of Biscay region.J.mar.biol.Ass.U.K. 70: 857-885.
PFANNKUCHE, O. (1993):Benthic response to the sedimentation of particulate organic matter at the BIOTRANSstation, 47°N, 20°W. - Deep-Sea Res. II, 40: 135-149.
READ, J.F. and W.J. GOULD (1992):Cooling and freshening of the subpolar North Atlantic Ocean since the 1960s. Nature,360, 55-57.
SIPPICAN, Inc. (1992):MK-12 Oceanographic Data Acquisition System, User's Manual. Sippican, Inc., Marion,Mass.
SIPPICAN, Inc. (1994):XCTD: Expendable Conductivity, Temperature, Depth Profiling System. Documentpresented at Oceanology International 94, Brighton, 8-11 March 1994.
SY, A. (1991):XBT measurements. In: WHP Operations and Methods, WHP Office Report WHPO 91-1, 19 pp.
SY, A. (1993):Field Evaluation of XCTD Performance. WOCE Newsletter, No. 14, pp. 33-37.
SY, A. and H.-H. HINRICHSEN (1986):The influence of long-term storage on the salinity of bottled seawater samples. Dt.Hydr. Z., 39, p. 35-40.
SY, A. and J.ULRICH (1994):North Atlantic Ship-of-Opportunity XBT Programme 1990, Ber. BSH, 1, 134 pp.
TALLEY, L.D. and M.S. McCARTNEY (1982):Distribution and circulation of Labrador Sea Water. J. of Physical Oceanography, 12,1189-1205.
WOCE Operations Manual, WHP Operations and Methods (1994),Part 3.1.3 : WHP Office Report WHPO91-1, WOCE Report No. 68/91, rev. 1
WOCE Operations Manual, WHP Operations and Methods (1994),Part 3.1.2 : Requirements for WHP Data Reporting, Report WHPO90-1, WOCE ReportNo. 67/91, rev. 2
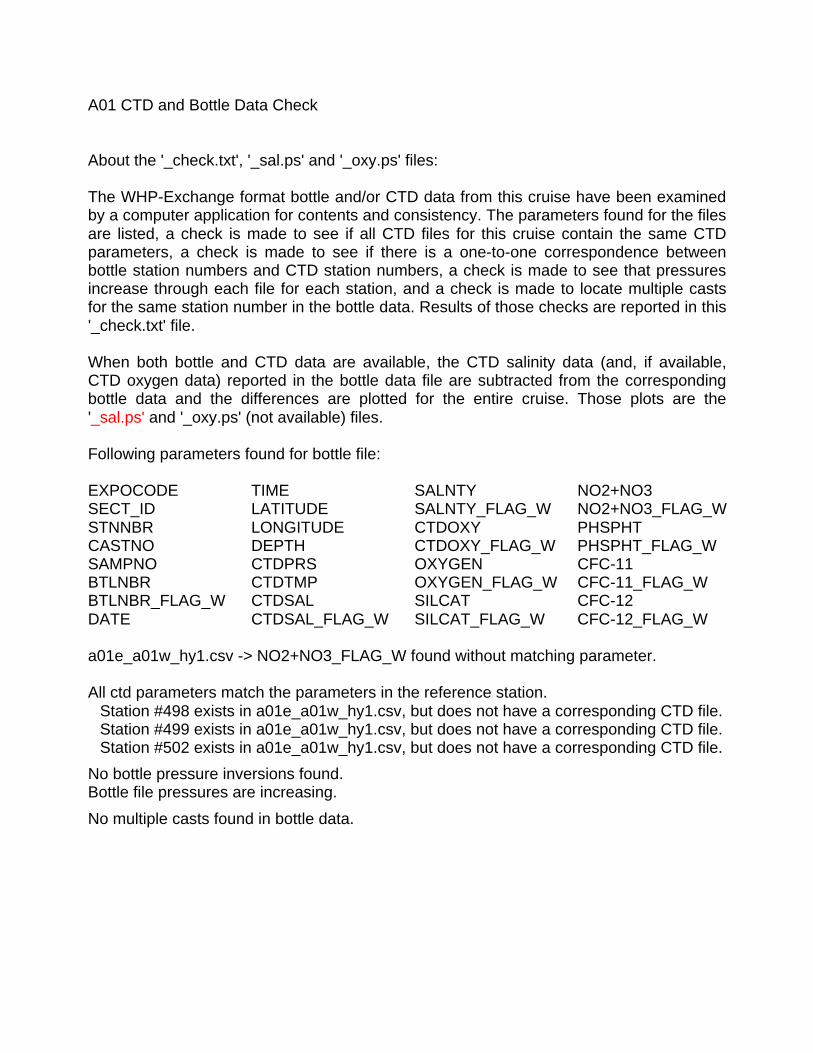
A01 CTD and Bottle Data Check
About the '_check.txt', '_sal.ps' and '_oxy.ps' files:
The WHP-Exchange format bottle and/or CTD data from this cruise have been examinedby a computer application for contents and consistency. The parameters found for the filesare listed, a check is made to see if all CTD files for this cruise contain the same CTDparameters, a check is made to see if there is a one-to-one correspondence betweenbottle station numbers and CTD station numbers, a check is made to see that pressuresincrease through each file for each station, and a check is made to locate multiple castsfor the same station number in the bottle data. Results of those checks are reported in this'_check.txt' file.
When both bottle and CTD data are available, the CTD salinity data (and, if available,CTD oxygen data) reported in the bottle data file are subtracted from the correspondingbottle data and the differences are plotted for the entire cruise. Those plots are the'_sal.ps' and '_oxy.ps' (not available) files.
Following parameters found for bottle file:
EXPOCODE TIME SALNTY NO2+NO3SECT_ID LATITUDE SALNTY_FLAG_W NO2+NO3_FLAG_WSTNNBR LONGITUDE CTDOXY PHSPHTCASTNO DEPTH CTDOXY_FLAG_W PHSPHT_FLAG_WSAMPNO CTDPRS OXYGEN CFC-11BTLNBR CTDTMP OXYGEN_FLAG_W CFC-11_FLAG_WBTLNBR_FLAG_W CTDSAL SILCAT CFC-12DATE CTDSAL_FLAG_W SILCAT_FLAG_W CFC-12_FLAG_W
a01e_a01w_hy1.csv -> NO2+NO3_FLAG_W found without matching parameter.
All ctd parameters match the parameters in the reference station.Station #498 exists in a01e_a01w_hy1.csv, but does not have a corresponding CTD file.Station #499 exists in a01e_a01w_hy1.csv, but does not have a corresponding CTD file.Station #502 exists in a01e_a01w_hy1.csv, but does not have a corresponding CTD file.
No bottle pressure inversions found.Bottle file pressures are increasing.
No multiple casts found in bottle data.
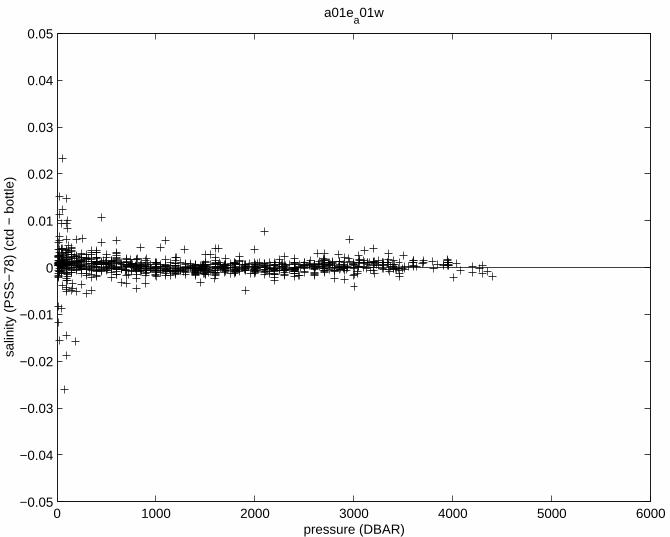
0 1000 2000 3000 4000 5000 6000−0.05
−0.04
−0.03
−0.02
−0.01
0
0.01
0.02
0.03
0.04
0.05
a01ea01w
pressure (DBAR)
salin
ity (
PS
S−
78)
(ctd
− b
ottle
)
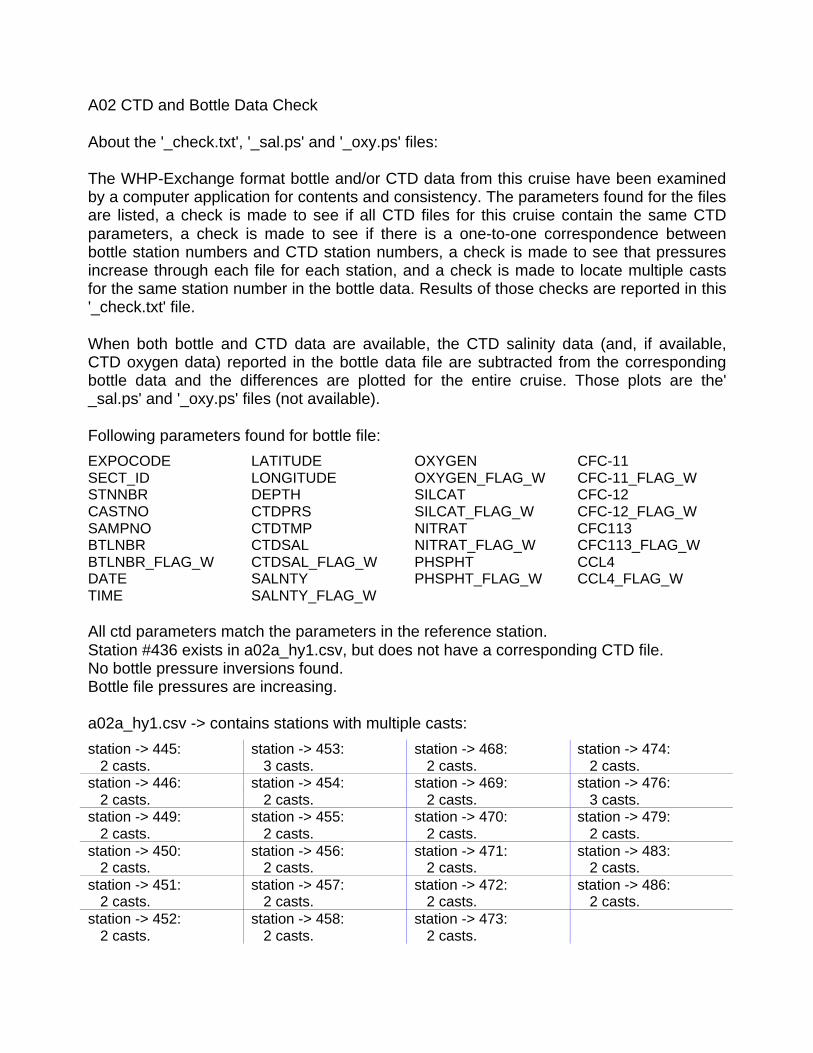
A02 CTD and Bottle Data Check
About the '_check.txt', '_sal.ps' and '_oxy.ps' files:
The WHP-Exchange format bottle and/or CTD data from this cruise have been examinedby a computer application for contents and consistency. The parameters found for the filesare listed, a check is made to see if all CTD files for this cruise contain the same CTDparameters, a check is made to see if there is a one-to-one correspondence betweenbottle station numbers and CTD station numbers, a check is made to see that pressuresincrease through each file for each station, and a check is made to locate multiple castsfor the same station number in the bottle data. Results of those checks are reported in this'_check.txt' file.
When both bottle and CTD data are available, the CTD salinity data (and, if available,CTD oxygen data) reported in the bottle data file are subtracted from the correspondingbottle data and the differences are plotted for the entire cruise. Those plots are the'_sal.ps' and '_oxy.ps' files (not available).
Following parameters found for bottle file:
EXPOCODE LATITUDE OXYGEN CFC-11SECT_ID LONGITUDE OXYGEN_FLAG_W CFC-11_FLAG_WSTNNBR DEPTH SILCAT CFC-12CASTNO CTDPRS SILCAT_FLAG_W CFC-12_FLAG_WSAMPNO CTDTMP NITRAT CFC113BTLNBR CTDSAL NITRAT_FLAG_W CFC113_FLAG_WBTLNBR_FLAG_W CTDSAL_FLAG_W PHSPHT CCL4DATE SALNTY PHSPHT_FLAG_W CCL4_FLAG_WTIME SALNTY_FLAG_W
All ctd parameters match the parameters in the reference station.Station #436 exists in a02a_hy1.csv, but does not have a corresponding CTD file.No bottle pressure inversions found.Bottle file pressures are increasing.
a02a_hy1.csv -> contains stations with multiple casts:
station -> 445: station -> 453: station -> 468: station -> 474: 2 casts. 3 casts. 2 casts. 2 casts.station -> 446: station -> 454: station -> 469: station -> 476: 2 casts. 2 casts. 2 casts. 3 casts.station -> 449: station -> 455: station -> 470: station -> 479: 2 casts. 2 casts. 2 casts. 2 casts.station -> 450: station -> 456: station -> 471: station -> 483: 2 casts. 2 casts. 2 casts. 2 casts.station -> 451: station -> 457: station -> 472: station -> 486: 2 casts. 2 casts. 2 casts. 2 casts.station -> 452: station -> 458: station -> 473: 2 casts. 2 casts. 2 casts.
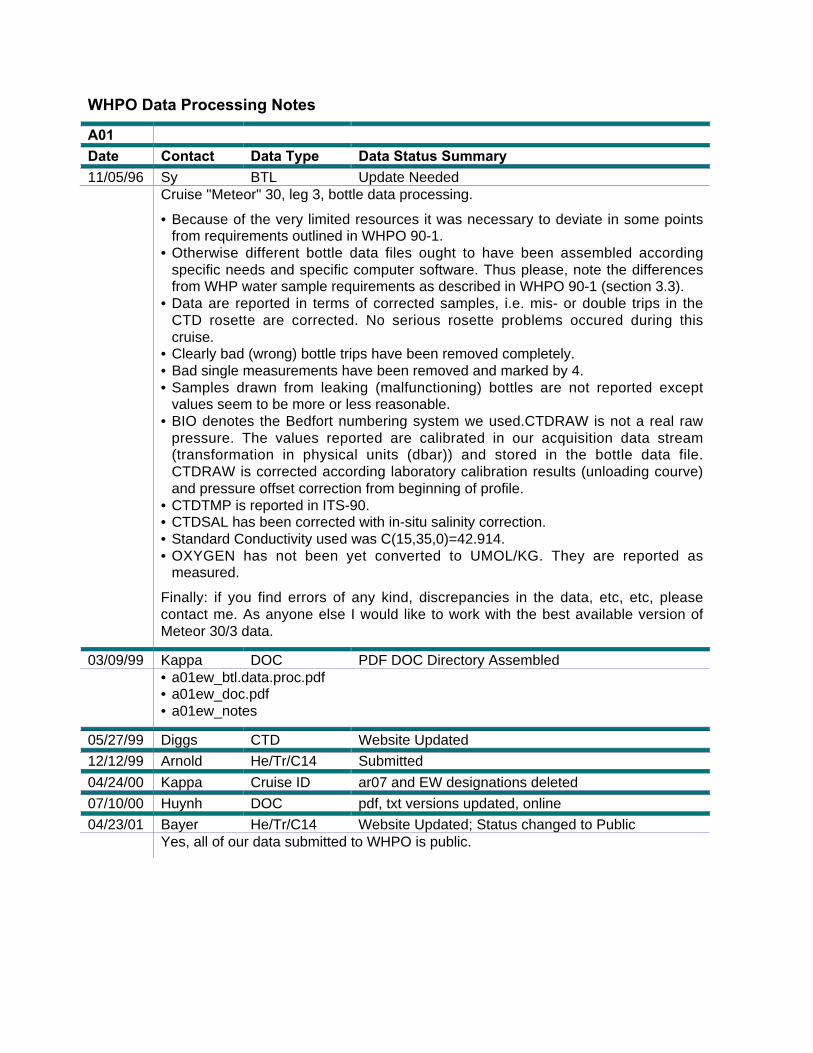
WHPO Data Processing Notes
A01Date Contact Data Type Data Status Summary11/05/96 Sy BTL Update Needed
Cruise "Meteor" 30, leg 3, bottle data processing.
• Because of the very limited resources it was necessary to deviate in some pointsfrom requirements outlined in WHPO 90-1.
• Otherwise different bottle data files ought to have been assembled accordingspecific needs and specific computer software. Thus please, note the differencesfrom WHP water sample requirements as described in WHPO 90-1 (section 3.3).
• Data are reported in terms of corrected samples, i.e. mis- or double trips in theCTD rosette are corrected. No serious rosette problems occured during thiscruise.
• Clearly bad (wrong) bottle trips have been removed completely.• Bad single measurements have been removed and marked by 4.• Samples drawn from leaking (malfunctioning) bottles are not reported except
values seem to be more or less reasonable.• BIO denotes the Bedfort numbering system we used.CTDRAW is not a real raw
pressure. The values reported are calibrated in our acquisition data stream(transformation in physical units (dbar)) and stored in the bottle data file.CTDRAW is corrected according laboratory calibration results (unloading courve)and pressure offset correction from beginning of profile.
• CTDTMP is reported in ITS-90.• CTDSAL has been corrected with in-situ salinity correction.• Standard Conductivity used was C(15,35,0)=42.914.• OXYGEN has not been yet converted to UMOL/KG. They are reported as
measured.
Finally: if you find errors of any kind, discrepancies in the data, etc, etc, pleasecontact me. As anyone else I would like to work with the best available version ofMeteor 30/3 data.
03/09/99 Kappa DOC PDF DOC Directory Assembled• a01ew_btl.data.proc.pdf• a01ew_doc.pdf• a01ew_notes
05/27/99 Diggs CTD Website Updated
12/12/99 Arnold He/Tr/C14 Submitted
04/24/00 Kappa Cruise ID ar07 and EW designations deleted
07/10/00 Huynh DOC pdf, txt versions updated, online
04/23/01 Bayer He/Tr/C14 Website Updated; Status changed to PublicYes, all of our data submitted to WHPO is public.
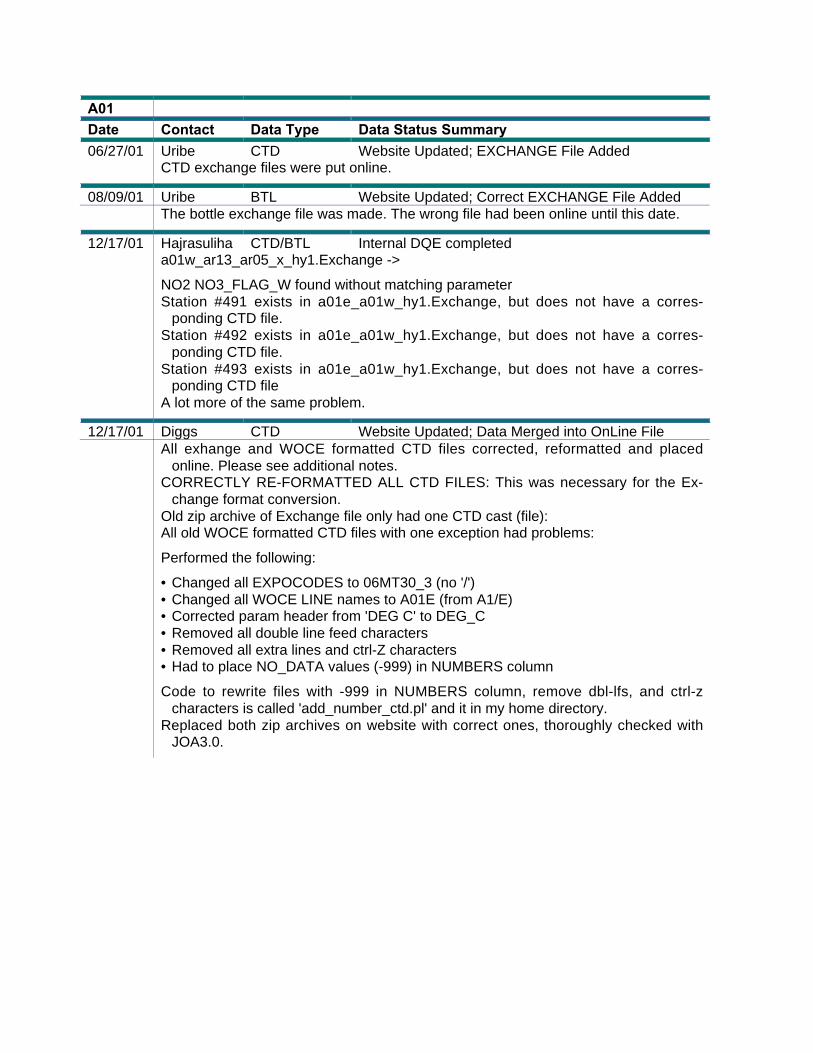
A01Date Contact Data Type Data Status Summary06/27/01 Uribe CTD Website Updated; EXCHANGE File Added
CTD exchange files were put online.
08/09/01 Uribe BTL Website Updated; Correct EXCHANGE File AddedThe bottle exchange file was made. The wrong file had been online until this date.
12/17/01 Hajrasuliha CTD/BTL Internal DQE completeda01w_ar13_ar05_x_hy1.Exchange ->
NO2 NO3_FLAG_W found without matching parameterStation #491 exists in a01e_a01w_hy1.Exchange, but does not have a corres-
ponding CTD file.Station #492 exists in a01e_a01w_hy1.Exchange, but does not have a corres-
ponding CTD file.Station #493 exists in a01e_a01w_hy1.Exchange, but does not have a corres-
ponding CTD fileA lot more of the same problem.
12/17/01 Diggs CTD Website Updated; Data Merged into OnLine FileAll exhange and WOCE formatted CTD files corrected, reformatted and placed
online. Please see additional notes.CORRECTLY RE-FORMATTED ALL CTD FILES: This was necessary for the Ex-
change format conversion.Old zip archive of Exchange file only had one CTD cast (file):All old WOCE formatted CTD files with one exception had problems:
Performed the following:
• Changed all EXPOCODES to 06MT30_3 (no '/')• Changed all WOCE LINE names to A01E (from A1/E)• Corrected param header from 'DEG C' to DEG_C• Removed all double line feed characters• Removed all extra lines and ctrl-Z characters• Had to place NO_DATA values (-999) in NUMBERS column
Code to rewrite files with -999 in NUMBERS column, remove dbl-lfs, and ctrl-zcharacters is called 'add_number_ctd.pl' and it in my home directory.
Replaced both zip archives on website with correct ones, thoroughly checked withJOA3.0.
A01Date Contact Data Type Data Status Summary03/07/03 Anderson BTL Website Updated; Data remerged into BTL file
• missing data changed.• Remerger updated CFCs,• merged TRITUM, HELIUM, DELHE3, DELC14, TRITER, HELIER, DELHER, and
C14ERR.• Copied QUALT1 flags to QUALT2 flags.• Changed missing data from -9.0 to -999.0 for DELHE3 and DELC14.• Put file online, made new exchange file,• sent notes to Jerry.
March 7, 2003
EXPOCODE 06mt30_3, WHP-ID a01ew
a01ew (06mt30_3) notes:
• Remerged updated CFC11 and CFC12 from file meteor303.searand addedTRITUM, HELIUM, DELHE3, DELC14, TRITER, HELIER, DELHER, and C14ERRfrom file 06mt303.sea found ina01/a01ew/original/1999.12.12_A01EW_TRACER_RHEIN_ARNOLD to online file19990723WHPOSIOSCD.
• Changed missing values for DELHE3 and DELC14 from -9.0 to -999.0• Copied QUALT1 flags to QUALT2• Put new file online, made new exchange file.
Sarilee Anderson
03/02/06 Key TCARBN DQE Qs Resolved I'll do the merge giving the surface samples a bottle number of zero. Back in the old
TTO/SAVE days we used 99 as the bottle for such, but 99 was a Gerard value (before Neptune claimed them on P10) during WOCE. For those samples we'll have P,T,S,TCO2. I'll assign flags to the TCO2 and the new salt values. Hopefully, I can get this to you today. If not, it may be a couple of weeks
As I mentioned, credit for these data goes to Helmuth Thomas and associated publications using this data are:
Thomas, H. (2002). Remineralisation Ratios of Carbon, Nutrients and Oxygen in the North Atlantic Ocean - a field data based assessment. Global Biogeochemical Cycles,16 DOI 10.1029/2001GB001452.
Thomas, H. and V. Ittekkot (2001). Determination of anthropogenic CO2 in the North Atlantic Ocean using water mass ages and CO2 equilibrium chemistry. J. Mar. Sys., 27, 325-336.
03/22/06 Anderson TCARBN Website updated; Key's 3/06 TCARBN values Bottle: (tcarbn, qualt1, qualt2)
Merged the TCARBN with surface values sent by Bob Key on March 1, 2006 into the online file 20030304WHPOSIOSA. Made new exchange and netcdf files. All files put online.
Merged the TCARBN that Bob Key sent on March 1, 2006. The surface values for stas. 506-509,511-527, 529-543, and 545-551 had to be hand edited into the file. The salinities had 9 for quality, I changed to 2 and one 3 re Bob Key.
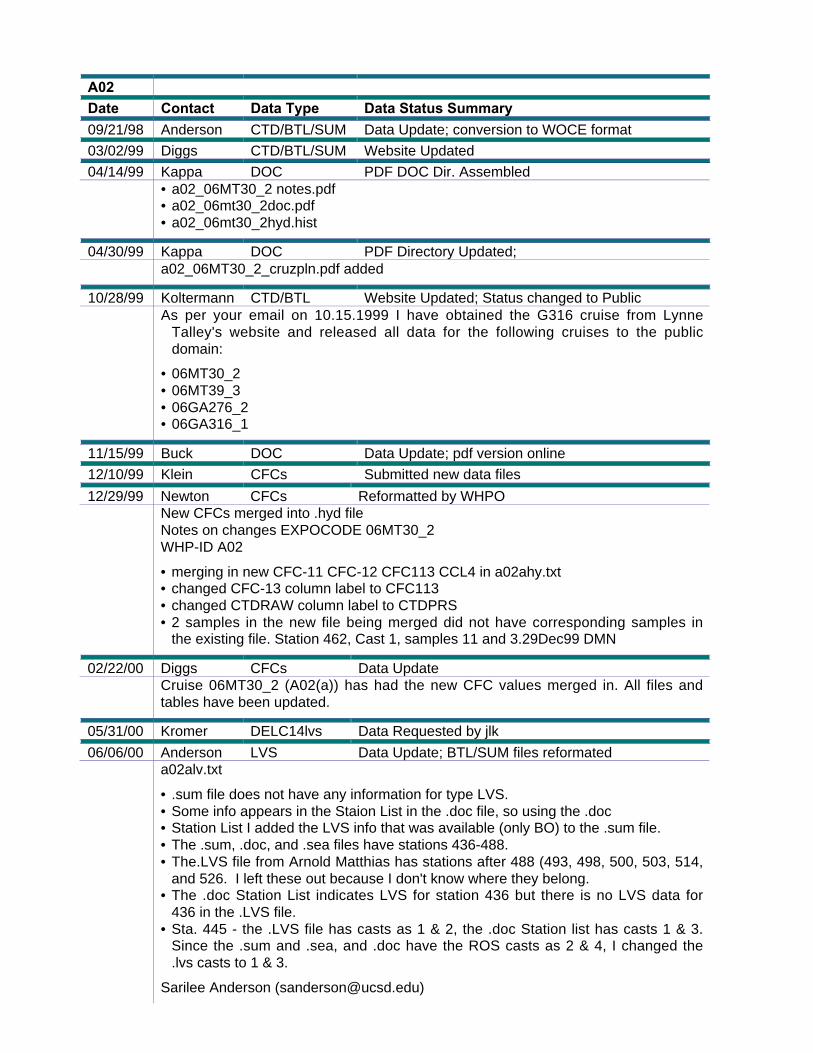
A02Date Contact Data Type Data Status Summary09/21/98 Anderson CTD/BTL/SUM Data Update; conversion to WOCE format
03/02/99 Diggs CTD/BTL/SUM Website Updated
04/14/99 Kappa DOC PDF DOC Dir. Assembled• a02_06MT30_2 notes.pdf• a02_06mt30_2doc.pdf• a02_06mt30_2hyd.hist
04/30/99 Kappa DOC PDF Directory Updated;a02_06MT30_2_cruzpln.pdf added
10/28/99 Koltermann CTD/BTL Website Updated; Status changed to PublicAs per your email on 10.15.1999 I have obtained the G316 cruise from Lynne
Talley's website and released all data for the following cruises to the publicdomain:
• 06MT30_2• 06MT39_3• 06GA276_2• 06GA316_1
11/15/99 Buck DOC Data Update; pdf version online
12/10/99 Klein CFCs Submitted new data files
12/29/99 Newton CFCs Reformatted by WHPONew CFCs merged into .hyd fileNotes on changes EXPOCODE 06MT30_2WHP-ID A02
• merging in new CFC-11 CFC-12 CFC113 CCL4 in a02ahy.txt• changed CFC-13 column label to CFC113• changed CTDRAW column label to CTDPRS• 2 samples in the new file being merged did not have corresponding samples in
the existing file. Station 462, Cast 1, samples 11 and 3.29Dec99 DMN
02/22/00 Diggs CFCs Data UpdateCruise 06MT30_2 (A02(a)) has had the new CFC values merged in. All files andtables have been updated.
05/31/00 Kromer DELC14lvs Data Requested by jlk
06/06/00 Anderson LVS Data Update; BTL/SUM files reformateda02alv.txt
• .sum file does not have any information for type LVS.• Some info appears in the Staion List in the .doc file, so using the .doc• Station List I added the LVS info that was available (only BO) to the .sum file.• The .sum, .doc, and .sea files have stations 436-488.• The.LVS file from Arnold Matthias has stations after 488 (493, 498, 500, 503, 514,
and 526. I left these out because I don't know where they belong.• The .doc Station List indicates LVS for station 436 but there is no LVS data for
436 in the .LVS file.• Sta. 445 - the .LVS file has casts as 1 & 2, the .doc Station list has casts 1 & 3.
Since the .sum and .sea, and .doc have the ROS casts as 2 & 4, I changed the.lvs casts to 1 & 3.
Sarilee Anderson ([email protected])
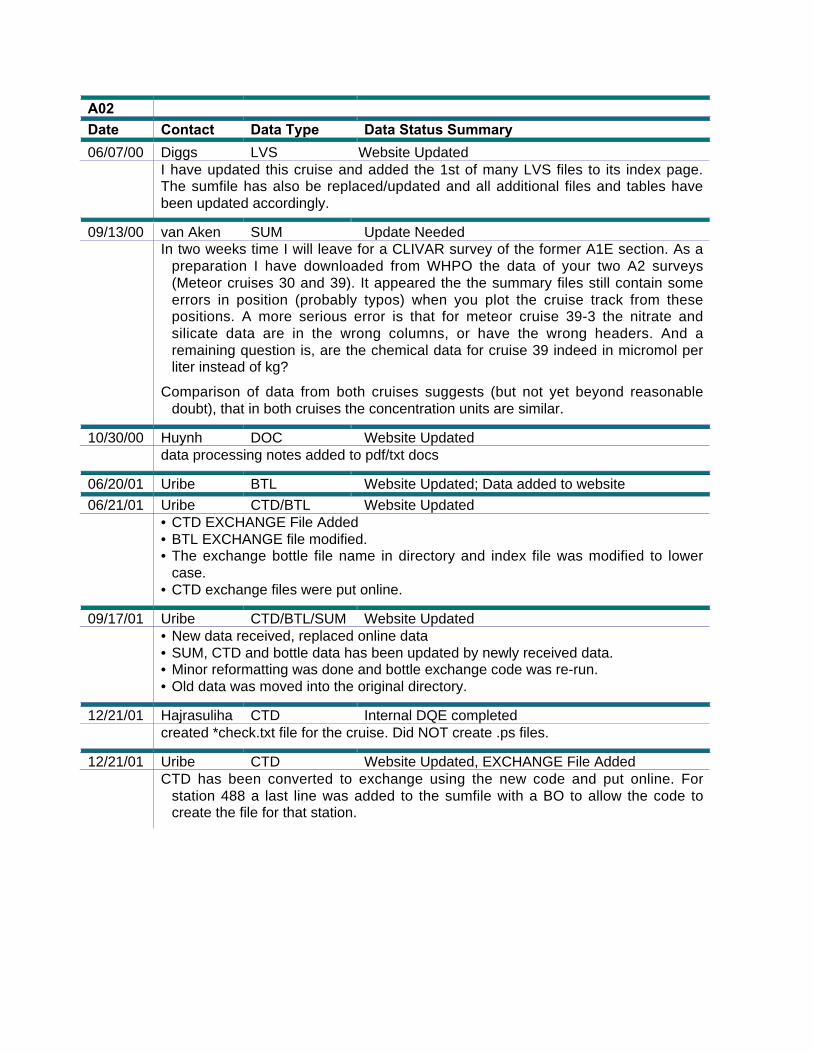
A02Date Contact Data Type Data Status Summary
09/13/00 van Aken SUM Update NeededIn two weeks time I will leave for a CLIVAR survey of the former A1E section. As a
preparation I have downloaded from WHPO the data of your two A2 surveys(Meteor cruises 30 and 39). It appeared the the summary files still contain someerrors in position (probably typos) when you plot the cruise track from thesepositions. A more serious error is that for meteor cruise 39-3 the nitrate andsilicate data are in the wrong columns, or have the wrong headers. And aremaining question is, are the chemical data for cruise 39 indeed in micromol perliter instead of kg?
Comparison of data from both cruises suggests (but not yet beyond reasonabledoubt), that in both cruises the concentration units are similar.
10/30/00 Huynh DOC Website Updateddata processing notes added to pdf/txt docs
06/20/01 Uribe BTL Website Updated; Data added to website
06/21/01 Uribe CTD/BTL Website Updated• CTD EXCHANGE File Added• BTL EXCHANGE file modified.• The exchange bottle file name in directory and index file was modified to lower
case.• CTD exchange files were put online.
09/17/01 Uribe CTD/BTL/SUM Website Updated• New data received, replaced online data• SUM, CTD and bottle data has been updated by newly received data.• Minor reformatting was done and bottle exchange code was re-run.• Old data was moved into the original directory.
12/21/01 Hajrasuliha CTD Internal DQE completedcreated *check.txt file for the cruise. Did NOT create .ps files.
12/21/01 Uribe CTD Website Updated, EXCHANGE File AddedCTD has been converted to exchange using the new code and put online. For
station 488 a last line was added to the sumfile with a BO to allow the code tocreate the file for that station.
06/07/00 Diggs LVS Website UpdatedI have updated this cruise and added the 1st of many LVS files to its index page.The sumfile has also be replaced/updated and all additional files and tables havebeen updated accordingly.