Embed Size (px)
Citation preview

Cryptomining:Energy use and local impact
Matteo Benetton1, Giovanni Compiani1, Adair Morse1,2
1University of California, Berkeley2NBER
BFI Blockchain ConferenceChicago - November 22, 2019
Preliminary - Comments Welcome

Bitcoin Price
020
4060
80TW
h pe
r yea
r
050
0010
000
1500
020
000
Bitc
oin
pric
e ($
)
01jan2017 01jul2017 01jan2018 01jul2018 01jan2019 01jul2019
BTC price

Bitcoin Price and World Energy Consumption
020
4060
80TW
h pe
r yea
r
050
0010
000
1500
020
000
Bitc
oin
pric
e ($
)
01jan2017 01jul2017 01jan2018 01jul2018 01jan2019 01jul2019
BTC priceEst. TWhMin. TWh

From the World to Local Economies in China

From the World to Local Economies in China and the US

Bitcoin Price

Bitcoin Price and Local Energy Consumption

Research Questions
I How much (and which type of) energy does cryptomininguses? Bottom-up approach
I Why do local governments allow (and even incentivize)crytominers to use establish mining farms in theirjurisdictions?
I E.g. tax revenues, positive spillovers
I What are the local economic consequences of cryptominingfor households and firms?
I E.g. electricity prices, jobs, wages, investment, pollution

This PaperI Approach
I Hand-collected new dataset on Cryptomining location in China andNY State
I Empirical analysis of the local effects of cryptominingI Location choice model for crytominers (data quality check)I Difference-in-difference identification strategy for several outcome
variables (energy consumption, prices, taxes, wages, investment)
I FindingsI In China cryptomining is associated to higher energy consumption
and taxes, but no differences in wages and investmentsI In NY state cryptomining is associated to higher energy
consumption and electricity prices for other companies andhouseholds→ Monthly electricity bill for households increase by about 9%

Data and location of cryptominers

Data
I Hand-collected data on Cryptomining locationI Search in Google and Baidu for local news about crytomining:
"Crypto" & "Mining" & "Erdos City" & "Inner Mongolia"I Macroeconomic data at the province- and city-level for
China from China Statistical Yearbook 2005-2017I GDP, wages, fixed assets investments, energy consumption
electricity pricesI Electricity consumption data at the city-month level from
NYSERDA, and Electricity prices data from US EIA.I Electricity consumption and prices by provider and user type
(residential, business)I Power plant information from global power plant database
I Location, capacity, fuel type (coal, hydro, wind)

Cryptomining in China

Cryptomining in NY State
E1E0

Location Choice Checklist
“On the way to Bitmain’s Ordos mine, I ask Su what he looks forwhen he surveys new locations. He’s like Bitmain’s real estatedeveloper, scoping out places that fill the right criteria for a mine.It’s not quite “location, location, location” but there is a roughchecklist: climate, cost of electricity, distance to a powerstation , and lastly, whether or not there are opportunities topartner with the local government.”
— Tech in Asia, August 22, 2017
→ City has mining = f(Cold climate, Cheap electricity,
Proximity to power stations)

Graphical “First Stage”: China

Graphical “First Stage”: US
Evidence of MiningNo Evidence of Mining
Mining Counties
(49.0,52.2](47.7,49.0](46.1,47.7][40.9,46.1]No data
Average Temperature
(0.11,0.12](0.10,0.11](0.10,0.10][0.09,0.10]No data
Average Electricity price
(9.0,38.0](5.0,9.0](2.0,5.0][1.0,2.0]No data - No plant
Number of Power Plants
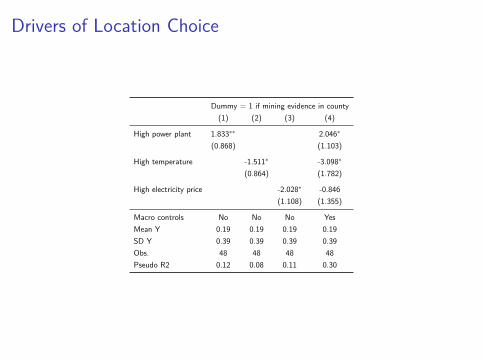
Drivers of Location Choice
Dummy = 1 if mining evidence in county(1) (2) (3) (4)
High power plant 1.833∗∗ 2.046∗
(0.868) (1.103)
High temperature -1.511∗ -3.098∗
(0.864) (1.782)
High electricity price -2.028∗ -0.846(1.108) (1.355)
Macro controls No No No YesMean Y 0.19 0.19 0.19 0.19SD Y 0.39 0.39 0.39 0.39Obs. 48 48 48 48Pseudo R2 0.12 0.08 0.11 0.30

Analysis in China(Fixed price regime)

Local Government Motivation...I Tax Revenues
In Inner Mongolia ... Bitmain is partnering with the local government toaccess electricity from the State Grid for about four cents per kilowatt hour.In exchange, the profit from Bitmain’s Ordos mine is taxed.
The local government has attracted Bitmain...to the park by offering them a30% discount on the electricity price, said Su Jiahai, who deals with localgovernments to build mining farms for Bitmain. (The mining farm) paysroughly $39,000 a day for its electricity bill, even with the discount.
I Job, economic spillovers“The digital currency may represent an opportunity for China to push intonew technologies. Now the mine has about 50 employees,” said Wang Wei,the manager of Bitmain China’s Dalad Banner facility. “I feel in the future itmight bring hundreds or even thousands of jobs, like the big factories.”

... and (Unintended) Consequences
I Energy consumptionThe bitcoin mine and the industrial firms have one thing in common:They use a lot of electricity. ... The mining farm uses 40 megawatts ofelectricity per hour, about equivalent to the amount used by 12,000homes during the same period.
I PollutionThe electricity in Ordos mostly comes from nearby coal-fired powerplants, which provide a stable and constant source of electricity -although at a price to the environment.

Limited Variation over Time in Electricity Prices
400
450
500
550
600
650
Elec
trici
ty p
rice
2007 2009 2011 2013 2015Year
Heilongjiang Inner Mongol SichuanGuangxi Jilin Shaanxi
I Lower increases in electricity prices in mining provinces (lowerdemand? higher subsidies?)

Framework: Electricity Market with Fixed Prices
0
1
2
3
4
5
6
7
8
9
10
11
Community Demand
Price of Electricity
Quantity of Electricity
Dcommunity
Supply Capacity
E1E0
+ : Taxes, positive spillovers (jobs, investments)− : Pollution,

Framework: Electricity Market with Fixed Prices
0
1
2
3
4
5
6
7
8
9
10
11
Total Demand
Community Demand
Cryptomining Demand
Price of Electricity
Quantity of Electricity
Dcommunity
Supply Capacity
DTotal
Dcrypto
E1E0
+ : Taxes, positive spillovers (jobs, investments)− : Pollution,

Framework: Electricity Market with Fixed Prices
0
1
2
3
4
5
6
7
8
9
10
11
Total Demand
Community Demand
Cryptomining Demand
Price of Electricity
Quantity of Electricity
Dcommunity
Supply Capacity
DTotal
Dcrypto
E1E0
+ : Taxes, positive spillovers (jobs, investments)− : Pollution, negative spillover (rationing, crowding out)

Empirical Strategy: Difference in DifferenceI Difference in difference baseline specification: outcome Y in
city c in time t
Yc,t = αMiningc × Postt + δXct + γc + γt + εct
I Miningc: dummy equal to one if evidence of mining in cityI Postt: dummy for 2015-2017I Xct: controls (population, GDP)
I Add heterogeneity by source of energy:
Yc,t = αMiningc × Sourcec × Postt + δXct + γc + γt + εct
I Sourcec: dummy identifying energy type of closest power plantI Remaining concern: endogenous selection of locations

Empirical Strategy: DinD + Inverse Probability WeightingI Difference in difference with inverse probability weighting(IPW):1. Logit model for mining location:
Miningc = f(average temperature, electricity price,
Distance to closest power stations) + ξc
2. DinD weighted by normalized IPW of being treated:
Yc,t = αMiningc × Postt + δXct + γc + γt + εct
I Remaining concern: Unobservable related to trend in outcomesI Cities A and B same observable, but A is a declining
manufacturing city cutting deals to attract cryptominers

Empirical Strategy: DinD + IPW + Control FunctionI Difference in difference with inverse probability weighting (IPW)
and control function:1. Logit model for mining location:
Miningc = f(average temperature, electricity price,
Distance to closest power stations) + ξc
2. DinD weighted by normalized IPW of being treated and estimatedresiduals:
Yc,t = αM̂iningc × Postt + βξ̂c × Postt + δXct + γc + γt + εct
I By including residual, lower concern about selectionI Remaining concern for omitted variable causing selection and
outcome → sign the bias
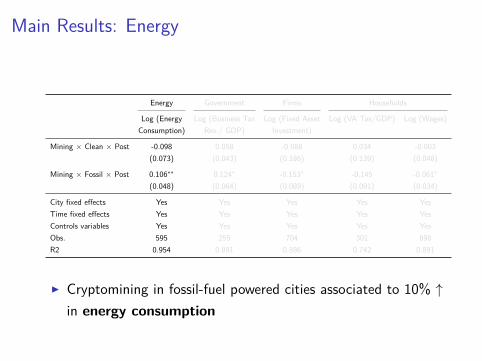
Main Results: Energy
Energy Government Firms Households
Log (Energy Log (Business Tax Log (Fixed Asset Log (VA Tax/GDP) Log (Wages)Consumption) Rev./ GDP) Investment)
Mining × Clean × Post -0.098 0.058 -0.088 0.034 -0.003(0.073) (0.043) (0.186) (0.139) (0.046)
Mining × Fossil × Post 0.106∗∗ 0.124∗ -0.153∗ -0.145 -0.061∗
(0.048) (0.064) (0.089) (0.091) (0.034)
City fixed effects Yes Yes Yes Yes YesTime fixed effects Yes Yes Yes Yes YesControls variables Yes Yes Yes Yes YesObs. 595 255 704 301 698R2 0.954 0.891 0.886 0.742 0.891
I Cryptomining in fossil-fuel powered cities associated to 10% ↑in energy consumption

Main Results: Government
Energy Government Firms Households
Log (Energy Log (Business Tax Log (Fixed Asset Log (VA Tax/GDP) Log (Wages)Consumption) Rev./ GDP) Investment)
Mining × Clean × Post -0.098 0.058 -0.088 0.034 -0.003(0.073) (0.043) (0.186) (0.139) (0.046)
Mining × Fossil × Post 0.106∗∗ 0.124∗ -0.153∗ -0.145 -0.061∗
(0.048) (0.064) (0.089) (0.091) (0.034)
City fixed effects Yes Yes Yes Yes YesTime fixed effects Yes Yes Yes Yes YesControls variables Yes Yes Yes Yes YesObs. 595 255 704 301 698R2 0.954 0.891 0.886 0.742 0.891
I Cryptomining in fossil-fuel powered cities associated to 12% ↑in business taxes relative to GDP

Main Results: Firms
Energy Government Firms Households
Log (Energy Log (Business Tax Log (Fixed Asset Log (VA Tax/GDP) Log (Wages)Consumption) Rev./ GDP) Investment)
Mining × Clean × Post -0.098 0.058 -0.088 0.034 -0.003(0.073) (0.043) (0.186) (0.139) (0.046)
Mining × Fossil × Post 0.106∗∗ 0.124∗ -0.153∗ -0.145 -0.061∗
(0.048) (0.064) (0.089) (0.091) (0.034)
City fixed effects Yes Yes Yes Yes YesTime fixed effects Yes Yes Yes Yes YesControls variables Yes Yes Yes Yes YesObs. 595 255 704 301 698R2 0.954 0.891 0.886 0.742 0.891
I Cryptomining in fossil-fuel powered cities associated to 15% ↓in fixed asset investment

Main Results: Households
Energy Government Firms Households
Log (Energy Log (Business Tax Log (Fixed Asset Log (VA Tax/GDP) Log (Wages)Consumption) Rev./ GDP) Investment)
Mining × Clean × Post -0.098 0.058 -0.088 0.034 -0.003(0.073) (0.043) (0.186) (0.139) (0.046)
Mining × Fossil × Post 0.106∗∗ 0.124∗ -0.153∗ -0.145 -0.061∗
(0.048) (0.064) (0.089) (0.091) (0.034)
City fixed effects Yes Yes Yes Yes YesTime fixed effects Yes Yes Yes Yes YesControls variables Yes Yes Yes Yes YesObs. 595 255 704 301 698R2 0.954 0.891 0.886 0.742 0.891
I Cryptomining in fossil-fuel powered cities no effect on localconsumption (proxied by VAT), slight decrease in wages

Analysis in NY State(Floating price regime)

From China to NY State
I Chinese cities:I Pros: Major cryptomining location, clean VS fossilI Cons: Yearly data until 2017, fixed electricity prices
I NY State towns:I Pros: Detailed panel data at the city-month level by provider
and user type on electricity prices and consumption, 2016-2019(Bitcoin boom), “flexible” electricity prices
I Cons: Less mining activity than in China, but still some...
I Similar trade-offs in China and the US!

Local Government Motivation...
I Tax Revenues“It’s good for the economy. We’re seeing (bitcoing mining) reallydiversifying our economy. There are millions of dollars being invested inthe economy. It’s going to help our tax base...”.
I Job, economic spilloversIf Coinmint fulfilled its promise, “that’s 150 more people that are going tobe working,” Mrs. Fletcher said. “The area needs jobs. Anything that’sgoing to bring some would be good”.
In addition, these customers (server farms) do not bring with them theeconomic development traditionally associated with similar load sizes.These customers have few to no associated jobs, and little if any capitalinvestment into the local community.

... and (Unintended) ConsequencesI Energy consumption
In recent months, NYMPA members have experienced a dramatic increase inrequests for new service for disproportionately large amounts of power. Mostsuch requests come from similar types of potential customers: server farms,generally devoted to data processing for cryptocurrencies.
I Additional spillovers (through price effects)The city council unanimously approved an 18 month moratorium on cryptomining activities in Plattsburgh. The idea of a moratorium was firstintroduced by mayor Colin Read in January after residents reported inflatedelectricity bills.
Mr. Recny said his company’s electric bills were about $60,000 higher thannormal for January and February, an unforeseen increase of about 30 percent.Mr. Recny asked why an enterprise that required only a few people to run itshould be able to drive up the operating costs of a company that employedabout 500.

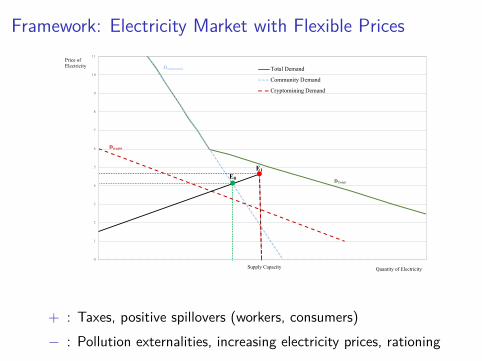
Framework: Electricity Market with Flexible Prices
0
1
2
3
4
5
6
7
8
9
10
11
Community Demand
Price of Electricity
Quantity of Electricity
Dcommunity
Supply Capacity
E0
+ : Taxes, positive spillovers (workers, consumers)− : Pollution externalities, increasing electricity prices,

Framework: Electricity Market with Flexible Prices
0
1
2
3
4
5
6
7
8
9
10
11
Total Demand
Community Demand
Cryptomining Demand
Price of Electricity
Quantity of Electricity
Dcommunity
Supply Capacity
DTotal
Dcrypto
E1
E0
+ : Taxes, positive spillovers (workers, consumers)− : Pollution externalities, increasing electricity prices,
Framework: Electricity Market with Flexible Prices
0
1
2
3
4
5
6
7
8
9
10
11
Total Demand
Community Demand
Cryptomining Demand
Price of Electricity
Quantity of Electricity
Dcommunity
Supply Capacity
DTotal
Dcrypto
E1E0
+ : Taxes, positive spillovers (workers, consumers)− : Pollution externalities, increasing electricity prices, rationing

Empirical Strategy: Electricity Demand Model (IV)I Users: Business, residentialI Electricity demand q by user u in city c for provider p in period t:
OLS: log qucpt = αu log pu
cpt + δuXcpt + γuc + γu
p + εcpt
I pucpt: electricity price
I Xcpt: controls (temperature)
I Variation in Bitcoin price to identify the elasticity of electricitydemand to electricity prices (αu)
I Higher Bitcoin price increase electricity prices in affected cities(through increase in electricity use for cryptomining):
FS: log pucpt = βu log pBT C
t + δuXcpt + γuc + γu
p + εcpt
IV: log qucpt = αu ̂log pu
cpt + δuXcpt + γuc + γu
p + εcpt

Main ResultFirst Stage Second Stage
Electricity Price (log) Electricity Consumption (log)
Business Residential Business Residential
BTC Price (log) 0.038∗∗∗ 0.019∗∗∗
(0.003) (0.002)
Electricity price (log) -0.201∗ -0.063(0.111) (0.325)
Temperature (log) -0.141 -0.208∗∗∗ -0.417∗∗∗ -0.247∗
(0.104) (0.031) (0.143) (0.133)
Month, City, Provider f.e. Yes Yes Yes YesF excluded 117.25 35.79Obs. 183 252 181 192R2adj 0.65 0.4 0.99 0.99
Mean city monthly bill ($,000) 940.05∆ BTC price June-Dec 2017 ($,000) 12.65∆ city monthly bill ($,000) 85.73∆ city monthly bill (%) 9.12
I Higher bitcoin price associated to higher electricity prices inmining cities, stronger effects for businesses

Main ResultFirst Stage Second Stage
Electricity Price (log) Electricity Consumption (log)
Business Residential Business Residential
BTC Price (log) 0.038∗∗∗ 0.019∗∗∗
(0.003) (0.002)
Electricity price (log) -0.201∗ -0.063(0.111) (0.325)
Temperature (log) -0.141 -0.208∗∗∗ -0.417∗∗∗ -0.247∗
(0.104) (0.031) (0.143) (0.133)
Month, City, Provider f.e. Yes Yes Yes YesF excluded 117.25 35.79Obs. 183 252 181 192R2adj 0.65 0.4 0.99 0.99
Mean city monthly bill ($,000) 940.05∆ BTC price June-Dec 2017 ($,000) 12.65∆ city monthly bill ($,000) 85.73∆ city monthly bill (%) 9.12
I Reasonable demand elasticities: businesses more elastic,households not very elastic (∼ to previous studies)

Main ResultFirst Stage Second Stage
Electricity Price (log) Electricity Consumption (log)
Business Residential Business Residential
BTC Price (log) 0.038∗∗∗ 0.019∗∗∗
(0.003) (0.002)
Electricity price (log) -0.201∗ -0.063(0.111) (0.325)
Temperature (log) -0.141 -0.208∗∗∗ -0.417∗∗∗ -0.247∗
(0.104) (0.031) (0.143) (0.133)
Month, City, Provider f.e. Yes Yes Yes YesF excluded 117.25 35.79Obs. 183 252 181 192R2adj 0.65 0.4 0.99 0.99
Mean city monthly bill ($,000) 940.05∆ BTC price June-Dec 2017 ($,000) 12.65∆ city monthly bill ($,000) 85.73∆ city monthly bill (%) 9.12
I Run up of Bitcoin price in second half of 2017 → 9% increasein electricity bill for consumers

Conclusions
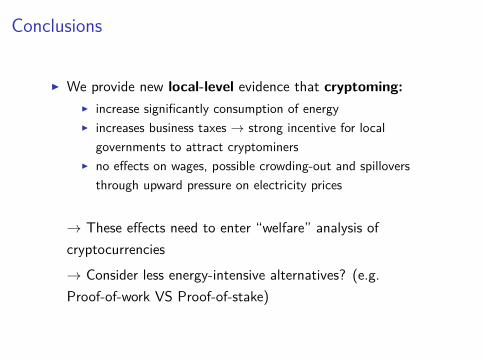
Conclusions
I We provide new local-level evidence that cryptoming:I increase significantly consumption of energyI increases business taxes → strong incentive for local
governments to attract cryptominersI no effects on wages, possible crowding-out and spillovers
through upward pressure on electricity prices
→ These effects need to enter “welfare” analysis ofcryptocurrencies
→ Consider less energy-intensive alternatives? (e.g.Proof-of-work VS Proof-of-stake)

Appendix