Embed Size (px)
Citation preview
Biochemistry 1993,32, 1345 1-1 3462 13451
Crystal Structures of True Enzymatic Reaction Intermediates: Aspartate and Glutamate Ketimines in Aspartate Aminotransferase+,$
Vladimir N. Malashkevich, Michael D. Toney,! and Johan N. Jansonius. Department of Structural Biology, Biocenter of the University of Basel,
Klingelbergstrasse 70, CH-4056 Basel, Switzerland
Received July 6, 1993; Revised Manuscript Received September 24, 1993’
ABSTRACT: The crystal structures of the stable, closed complexes of chicken mitochondrial aspartate aminotransferase with the natural substrates L-aspartate and L-glutamate have been solved and refined at 2.4- and 2.3-A resolution, respectively. In both cases, clear electron density a t the substrate-coenzyme binding site unequivocally indicates the presence of a covalent intermediate. The crystallographically identical environments of the two subunits of the a2 dimer allow a simple, direct correlation of the coenzyme absorption spectra of the crystalline enzyme with the diffraction results. Deconvolution of the spectra of the crystalline complexes using lognormal curves indicates that the ketimine intermediates constitute 76% and 83% of the total enzyme populations with L-aspartate and L-glutamate, respectively. The electron density maps accommodate the ketimine structures best in agreement with the independent spectral data. Crystalline enzyme has a much higher affinity for keto acid substrates compared to enzyme in solution. The increased affinity is interpreted in terms of a perturbation of the open/closed conformational equilibrium by the crystal lattice, with the closed form having greater affinity for substrate. The crystal lattice contacts provide energy required for domain closure normally supplied by the excess binding energy of the substrate. In solution, enzyme saturated with amino/keto acid substrate pairs has a greater total fraction of intermediates in the aldehyde oxidation state compared to crystalline enzyme. Assuming the only difference between the solution and crystalline enzymes is in conformational freedom, this difference suggests that one or more substantially populated, aldehydic intermediates in solution exist in the open conformation. Quantitative analyses of the spectra indicate that the value of the equilibrium constant for the open-closed conformational transition of the liganded, aldehydic enzyme in solution is near 1. The C4’ p r o 3 proton in the ketimine models is oriented nearly perpendicularly to the plane of the pyridine ring, suggesting that the enzyme facilitates its removal by maximizing 6-7 orbital overlap. The absence of a localized water molecule near Lys258 dictates that ketimine hydrolysis occurs via a transiently bound water molecule or from an alternative, possibly more open, structure in which water is appropriately bound. A prominent mechanistic role for flexibility of the Lys258 side chain is suggested by the absence of hydrogen bonds to the amino group in the aspartate structure and the relatively high temperature factors for these atoms in both structures.
Aspartate aminotransferase (AATase;’ EC 2.6.1.1) is an a2 dimeric enzyme with approximately 400 amino acid residues per subunit, depending on the isozyme. It catalyzes the reversible interconversion of dicarboxylic amino and keto acids:
L-aspartate + 2-oxoglutarate ;t oxalacetate + L-glutamate Its catalytic activity is dependent on tightly bound pyridoxal 5’-phosphate (PLP) as coenzyme, which alternates between aldehyde and amine forms in the two half-reactions that constitute a catalytic cycle. The two independent active sites are situated at the subunit interface and comprise residues from both subunits (Christen & Metzler, 1985).
+This study was supported in part by the Swiss National Science Foundation (Grant 31-25713.88 to J.N.J.) and the National Institutes of Health (Fellowship GM13854 to M.D.T.).
t The coordinates of the refined structures have been deposited under Filenames lMAP for the mAATase-L-aspartate ketimine complex and lMAQ for the mAATase-L-glutamate ketimine complex with the Brookhaven Protein Data Bank, Chemistry Department, Brookhaven National Laboratory, Upton, NY, from which copies are available.
* Author to whom correspondence should be addressed. Present address: Department of Chemistry, University of California,
Berkeley, CA 94720. e Abstract published in Aduance ACS Abstracts, November 15,1993.
Abbreviations: PLP, pyridoxal 5’-phosphate; PMP, pyridoxamine 5’-phosphate; AATase, aspartate aminotransferase; E-PLP and E-PMP, PLP and PMP forms of AATase, respectively; cAATase and mAATase, cytosolic and mitochondrial isozymes of AATase; Fo and F,, observed and calculated structure factors.
0006-2960/93/0432-13451$04.00/0
The reaction mechanism is complex, with eight distinct kinetic steps per half-reaction being spectroscopically de- tectable in rapid reaction studies (Fasella & Hammes, 1967). An outline of the chemical mechanism showing the principal intermediates is given in Scheme I. The coenzyme forms a Schiff base with the active site Lys258 in the unliganded aldehyde form of the enzyme. Upon binding an amino acid substrate, the Michaelis complex is rapidly converted to the external aldimine intermediate via a transimination reaction. Proton abstraction from C, of the substrate moiety by Lys258 (Kirsch et al., 1984) produces the carbanionic quinonoid intermediate from the external aldimine. Reprotonation at C4t of the coenzyme gives the ketimine intermediate. Hy- drolysis of the ketimine leads to the keto acid Michaelis complex, which dissociates into E-PMP and product.
AATase is presently one of the best understood enzymes, despite the complexity of the reaction mechanism, owing greatly to the wealth of crystallographic information accu- mulated todate (Jansonius & Vincent, 1987). High-resolution structures of c- and mAATase from chicken (Harutyunyan et al., 1985; Malashkevich et al., 1991; Ford et al., 1980; McPhalen et al., 1992a) and pig heart (Arnone et al., 1985; Izard, 1990) and of Escherichia coli AATase (Smith et al., 1989; Kamitori et al., 1990; Jager, 1991) are available. Additionally, the structures of several inhibitor complexes have been solved, providing models for the structures of virtually all of the obligatory intermediates (Kirsch et al.,
0 1993 American Chemical Society
13452
Scheme I: Principal Intermediates in the Aspartate Aminotransferase Reaction
Biochemistry, Vol. 32. No. 49, 1993 Malashkevich et al.
of substrate and product for bound inhibitor in the crystalline enzyme, one obtains a mixture of the enzyme-bound species in the closed conformation. The present analysis is augmented by the suitability of the coenzyme as a spectroscopic probe of the various possible reaction intermediates, which enables independent measures of their populations. The spectroscopic data corroborate the crystallographic ones, allowing the description of the structures of the oxalacetate and 2-oxo- glutarate ketimine intermediates (produced by soaking in solutions containing aspartate and glutamate, respectively) at nominal resolutions of 2.4 and 2.3 A, respectively.
EXPERIMENTAL PROCEDURES
Crystallization and Soaking Experiments. Orthorhombic crystals of chicken mitochondrial aspartate aminotransferase were grown in the presence of maleate as described (Picot et ai., 1991). Immediately prior to spectral or diffraction data collection, the crystals were soaked at 4 OC in a solution containing the appropriate substrate or substrate pair at enzymesaturating concentrations (listed in Table 111) in 20% poly(ethyleneglyco1) 4000,50 mM potassium phosphate, pH 7.5. Approximately 1 h is required for the crystals to become colorless (indicating the loss of maleate from the active site). This is significantly slower than the ligand-exchange reaction at room temperature, which requires less than 1 mina2 Maleate was completely removed from the crystals by several exchanges of the soaking solution. Soaking of the crystals causes a small increase in the unit cell parameters (a = 70.2 A, b = 9 1.6 A, c = 129.8 A and a = 70.0 %L, b = 92.1 A, c = 128.9 A, for the L-aspartate and L-glutamate complexes, respectively) as compared to those for the 2-methylaspartate complex (a = 69.7 A, b = 91.3 A, c = 128.5 A) and a slight decrease in the diffraction power of the crystals (evidenced as a diminished completeness of the data in the resolution shell from 2.4 to 2.3 R).
Spectral Analyses. The crystal absorption spectra were obtained with a single-beam Zeiss microspectrophotometer controlled by LAMBDA-SCAN (Zeiss) software. Sample preparation and spectral measurements were performed as described previously (Delbaere et ai., 1989). Absorbances A,, Ab, and A, (Le., anisotropic absorbances with the electric vector oriented along the three orthogonal crystal axes) were measured in a crystal with plane-polarized light using the crystal faces (001) and (010). These were scaled together by normalization based on the crystal thickness (normalizing with protein absorption at 280 nm was not possible due to the very highabsorptions at this wavelength). Theisotropiccrystal absorption spectra were approximated using the equation Ai, = (A, 4- Ab + Ae)/3 (Metzler et ai., 1985) and merged data from several crystals of the same crystallization batch.
The solution spectra were recorded on a Kontron Uvikon 860 double-beam spectrophotometer. Enzyme concentrations were 15-20 pM. Prior to spectral measurements, the enzyme was treated with 1 mM oxalacetate in order to convert any E-PMP into E-PLP. The amino and keto acids were removed from the enzyme by buffer exchange using Centricon-30 ultrafiltration cells (at least 104-fold dilution). Lognormal distribution curves (Metzler & Metzler, 1987) were used to deconvolute the spectra using the program LOGNORM written in this laboratory by Dr. P. Stalder. Metzler et ai.
* In the closed conformation, the ligand is completely buried in the active site (McPhalen et al., 1992b). Neverthelas, substrate exchange in a 2 2 1 crystals occurs at a reasonable rate without destroying crystal order (Picot, 1987).
R*o- \co*-
H+
Xichaelin Complex External Aldimine
Quinonoid Ketimino
R = CH20P0:
1984; Jansonius &Vincent, 1987; Jlger, 1991; J. N. Jansonius et ai., unpublished results). In addition to a long history of classical solution studies [for a review see Christen and Metzler (1985)], recent site-directed mutagenesis analyses, capitalizing on the X-ray crystallographic successes, have delineated the mechanistic role of virtually every active-site residue (Malcolm & Kirsch, 1985; Cronin & Kirsch, 1988; Toney & Kirsch, 1991; Goldberg et ai., 1991; Kuramitsu et ai., 1991; Hayashi etai., 1991;Inoueet ai., 1991;Ziaketal., 1993). Thepresent study and others in progress aim to extend the current understanding of the mechanism, as well as provide prepa- rations for theoretical studies, by determining high-resolution structures of true catalytic intermediates.
In principle, three currently available techniques allow crystallographic analyses of true enzyme-substrate complex- es: (1) synchrotron-based Lauediffraction (Hajdu & Johnson, 1990), (2) cryocrystallography (Douzou & Petsko, 1991), and, for reversible reactions, (3) observation of intermediate mixtures by conventional techniques after saturation with both substrate and product. The first two methods have yielded unique and invaluable results, but their technically demanding nature limits their application at the present time. The third, simpler option-and the one employed here-is limited to the observation of the thermodynamically most stable interme- diate(s). It has been previously applied, but not widely. For example, intermediates in the reactions of aconitase (Lauble et ai., 1992), tyrosyl-tRNA synthetase (Brick et ai., 1988), and D-xylose isomerase (Collyer & Blow, 1990) were amenable to crystallographic analyses.
AATase exists in an open and a closed conformation (Kirsch et ai., 1984; Borisov et ai., 1985; Harutyunyan et ai., 1985; Arnone et ai., 1985; Picot et al., 1991). The closed confor- mation of the enzyme sequesters the substrate from solvent and facilitates the chemical transformations, while the open conformation simplifies association and dissociation of ligands. The existence of a crystal form (space group C2221) of chicken mAATase that maintains the closed conformation through crystal lattice contacts (Picot et ai., 1991) enables the present straightforward study of catalytically competent complexes of this isozyme with its natural substrates. By ligand exchange
Aspartate Aminotransferase Ketimine Structures
(1973) have shown that the concentration of an absorbing substance is proportional to the area under the band. Making use of this approach, we calculated the fractions of different intermediates for solution and isotropic crystal spectra from the band areas (obtained by integration of the absorbance as a function of wavenumber) and molar area estimates calculated for different absorbing species by Metzler and Metzler (1 987). The lognormal deconvolution method does not give an unambiguous solution in the case of strongly overlapping absorption bands. Error estimates for thevalues of band areas (obtained by calculating deconvolutions with a variety of band shape parameters that give a reasonable fit to the observed spectra) are 2% for the well-separated bands (330 and 430 nm) and 4% for the buried band (360 nm). Additional errors can be introduced by the inaccurate scaling of A,, Ab, and A, used in calculating Ah. More liberal estimates of the precision of the calculated band areas and the percentages of inter- mediates derived from them would thus be approximately 4% for the species absorbing at 330 and 430 nm and 8% for the species absorbing at 360 nm.
X-ray Data Collection and Refinement. Diffraction data for the L-aspartate and L-glutamate complexes were collected using a FAST (Enraf-Nonius) area-detector diffractometer and processed using the MADNES software package (Mess- erschmidt & Pflugrath, 1987). Data collection statistics are given in Table I.
The structure of the 2-methylaspartate complex of mAATase (excluding the coenzyme and ligand), refined to 2.3-8L resolution (Jansonius & Vincent, 1987), was used as the initial model for calculating difference Fourier maps as well as for refinement. Examination of electron density maps and model-building experiments were done on an Evans & Sutherland PS300 graphics station using the program FRODO (Jones, 1978) as modified by Pflugrath et ai. (1984). The structures of the L-aspartate and L-glutamate complexes were refined using the programs PROLSQ (Hendrickson, 1985) and TNT (Tronrud et ai., 1987). Most of the other calculations were done using the CCP4 program suite supplied by the SERC Daresbury Laboratory.
RESULTS
W- Visible Absorption Spectra
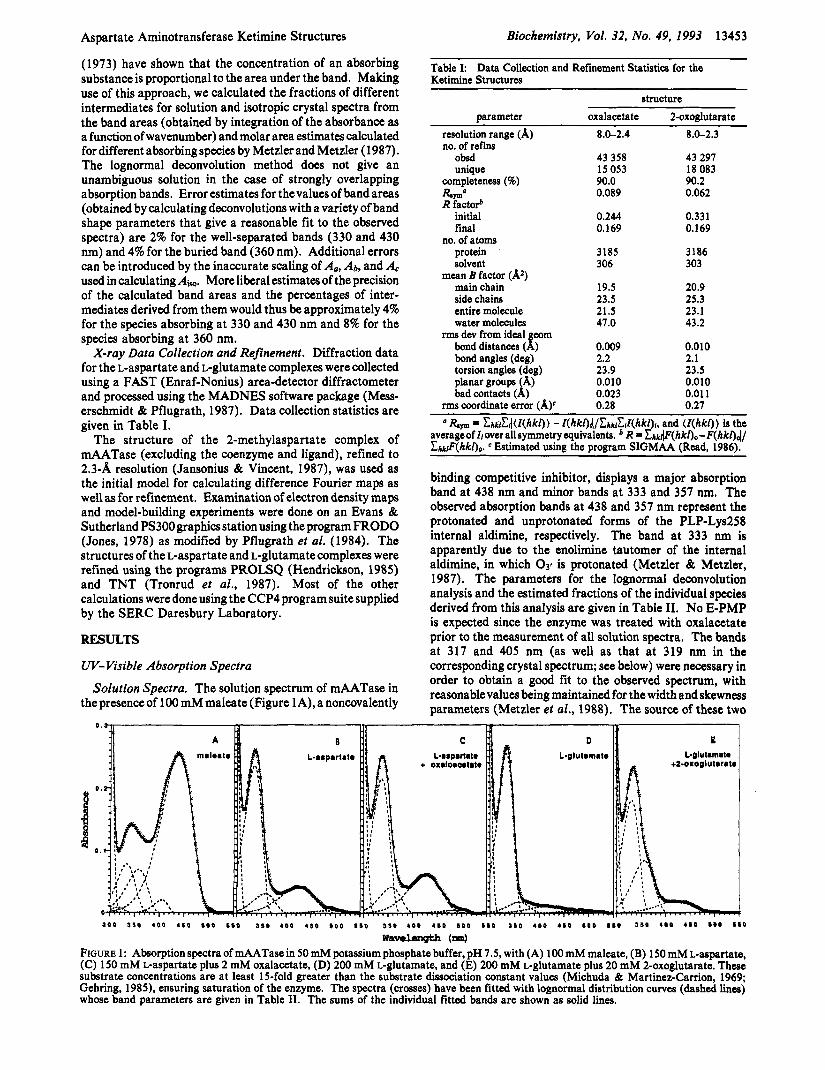
Solution Spectra. The solution spectrum of mAATase in the presence of 100 mM maleate (Figure 1 A), a noncovalently
Biochemistry, Vol. 32, No. 49, 1993 13453
Table I Data Collection and Refinement Statistics for the Ketimine Structures
structure parameter oxalacctate 2-oxoglutarate
resolution range (A) no. of reflns
ObSd unique
completeness (5%)
R facto# initial final
no. of atom protein solvent
mean B factor (A*) main chain side chains entire molecule water molecules
rm dev from ideal eom bond distances (1) bond angles (deg) torsion angles (deg) planar groups A)
r m s coordinate error (A)c
RSP"
bad contacts ( d )
8 . i 2 . 4
43 358 15 053 90.0 0.089
0.244 0.169
3185 306
19.5 23.5 21.5 47.0
0.009 2.2 23.9 0.010 0.023 0.28
8.0-2.3
43 297 18 083 90.2 0.062
0.331 0.169
3186 303
20.9 25.3 23.1 43.2
0.010 2.1 23.5 0.010 0.01 1 0.27 . .
a R , ~ = &,&r((l(hkl) } - I(hkl)r(/&l&l(hkl)h and ( [ (hkl ) ) is the averageof Zlover allsymmetry equivalents. R = zh&@(hkl)o-F(hkl)d/ E * k ~ F ( h k l ) ~ Estimated using the program SIGMAA (Read, 1986).
binding competitive inhibitor, displays a major absorption band at 438 nm and minor bands at 333 and 357 nm. The observed absorption bands at 438 and 357 nm represent the protonated and unprotonated forms of the PLP-Lys258 internal aldimine, respectively. The band at 333 nm is apparently due to the enolimine tautomer of the internal aldimine, in which OS! is protonated (Metzler & Metzler, 1987). The parameters for the lognormal deconvolution analysis and the estimated fractions of the individual species derived from this analysis are given in Table 11. No E-PMP is expected since the enzyme was treated with oxalacetate prior to the measurement of all solution spectra. The bands at 317 and 405 nm (as well as that at 319 nm in the corresponding crystal spectrum; see below) were necessary in order to obtain a good fit to the observed spectrum, with reasonablevalues being maintained for the width and skewness parameters (Metzler et al., 1988). The source of these two
a 0 0 ¶ E O 4 0 0 4 6 0 8 0 0 6 6 0 ¶ S O 4 0 0 4 6 0 6 0 0 5 6 0 ¶ S O 4 0 0 4 8 0 6 0 0 6 5 0 ¶ S O 4 0 0 4 6 0 6 0 0 5 5 0 3 6 0 4 0 0 4 8 0 *go 5 5 0
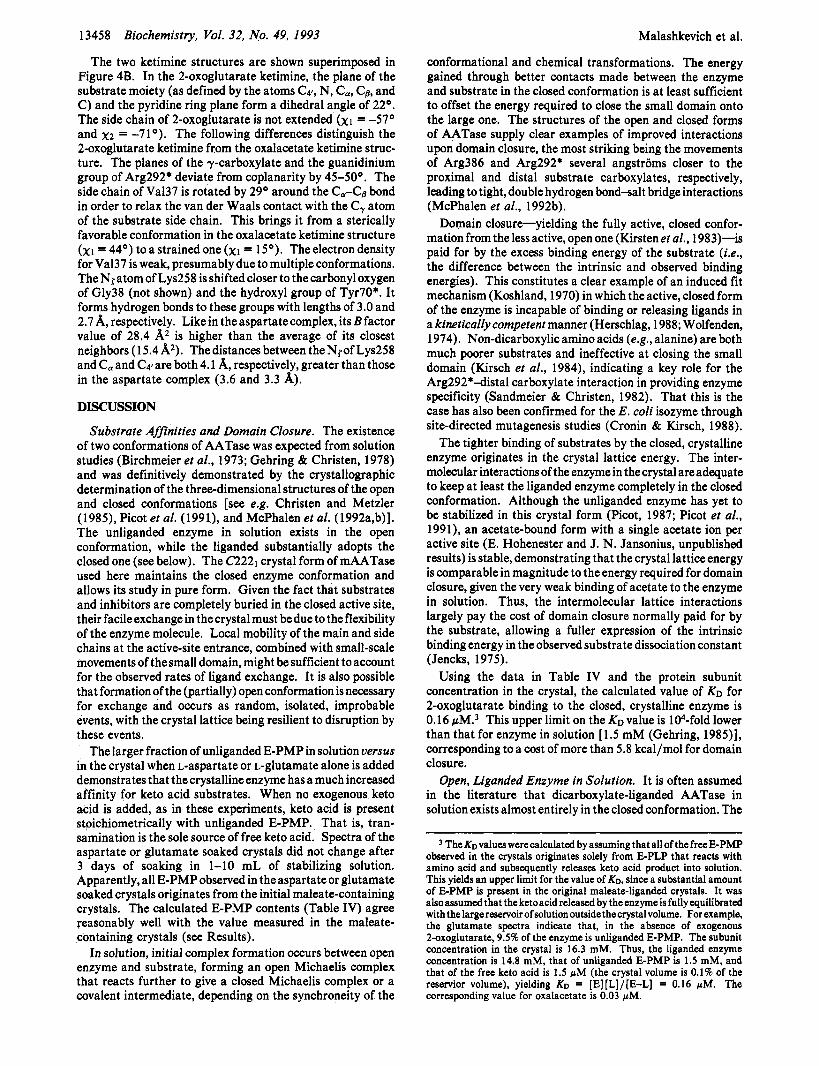
(rmr) FIGURE 1: Absorption spectra of mAATase in 50 mM potassium phosphate buffer, pH 7.5, with (A) 100 mM maleate, (B) 150 mM L-aspartate, (C) 150 mM L-aspartate plus 2 mM oxalacetate, (D) 200 mM L-glutamate, and (E) 200 mM L-glutamate plus 20 mM 2-oxoglutarate. These substrate concentrations are at least 15-fold greater than the substrate dissociation constant values (Michuda & Martinez-Carrion, 1969; Gehring, 1985), ensuring saturation of the enzyme. The spectra (crosses) have been fitted with lognormal distribution curve8 (dashed lines) whose band parameters are given in Table 11. The sums of the individual fitted bands are shown as solid lines.

13454 Biochemistry, Vol. 32, No. 49, 1993 Malashkevich et al.
Table 11: Absorption Band Parameters for Solution Spectra of mAATase in the Presence of Maleate and Natural Substrates substrate added peak position (nm) abs (re1 units) width (cm-I) skewness band area (re1 units) 46 of totalu
(A) 100 mM maleate 317 0.009 3000 1.5 28 2 333 0.082 4050 1.4 347 24 357 0.076 4050 1.6 316 17 405 0.022 2000 1.5 46 2 438 0.276 4000 1.6 1133 55
(B) 150 mM L-aspartate 335 0.258 3900 1.6 1024 79 357 0.034 4200 1.5 148 9 424 0.044 4750 1.5 217 12 490 0.005 3000 1.5 16 <1
(C) 150 mM L-aspartate + 2.0 mM oxalacetate 338 0.235 3900 1.6 933 72 357 0.045 4200 1.5 196 12 427 0.065 4450 1.5 300 16 490 0.005 3000 1.5 16 <1
(D) 200 mM L-glutamate 334 0.279 3500 1.6 995 90 360 0.0 19 4200 1.5 83 6 417 0.012 4750 1.6 59 4 490 0.005 3000 1.5 16 <1
(E) 200 mM L-glutamate + 20 mM 2-oxoglutarate 331 0.197 3900 1.6 78 1 68 356 0.089 4200 1.5 387 26 424 0.021 4750 1.6 102 6 490 0.001 3000 1.5 3 <1
0 Percents of total intermediates were obtained with the molar area estimates of Metzler and Metzler (1987).
a o o a s 0 4 0 0 4 8 0 so0 s e a a 6 0 4 0 0 4 1 0 e 0 0 e e o a t 0 4 0 0 4 # 0 t o o s e o a s 0 400 4 6 0 so0 t e o a 6 0 4 0 0 4 6 0 6 0 0 e 6 0
FIGURE 2: Isotropic absorption spectra calculated from polarized absorption spectra of crystalline mAATase in 25% PEG-4000, 50 mM potassium phosphate buffer, pH 7.5, with (A) 100 mM maleate, (B) 150 mM L-aspartate, (C) 150 mM L-aspartate plus 2 mM oxalacetate, (D) 150 mM L-glutamate, and (E) 150 mM L-glutamate plus 20 mM 2-oxoglutarate. The spectra were calculated from individual polarized spectra using A h = (A. + Ab + &)/3. Individual lognormal absorption bands were fitted to the data and are displayed as described in Figure 1 .
wa-l=xm (=I
bands is not clear, but may have some significance (Clark et al., 1993).
When 150 mM L-aspartate is added instead of maleate, the spectrum (Figure 1B) displays a major band at 335 nm and minor ones at 424,357, and 490 nm. The observed absorption band at 335 nm is expected to be a convolution of the very similar bands of E-PMP, the carbinolamine, the geminal diamine, and the ketimine intermediates. The bands at 357 and 424 nm represent the unprotonated and protonated forms, respectively, of either the internal or the external aldimine (which cannot be distinguished from one another in isotropic absorption spectra). A small peak at 490 nm, which is present in all other spectra with amino acids added, is due to trace amounts of the quinonoid intermediate.
Inclusion of 2.0 mM oxalacetate with aspartate results in the 335-nm band being converted to one at 338 nm that is somewhat reduced in height (Figure 1C). The lognormal deconvolution indicates that E-PMP is eliminated and the populations of the liganded species are enhanced. While the absorption band parameters for the unprotonated aldimine remain unaltered, the protonated aldimine band shifts slightly from 424 to 427 nm and increases in amplitude.
The spectrum observed in the presence of 200 mM L-glutamate (Figure 1D) has a major absorption band at 334 nm and minor ones at 41 7,360, and 490 nm. Upon inclusion of 20 mM 2-oxoglutarate with L-glutamate, the 334-nm band is converted to one at 33 1 nm with decreased intensity (Figure 1E). Concomitantly, a large increase in the intensity of the 357-nm band occurs.
CrystalSpectra. Orthorhombic crystals of the mAATase- maleate complex display a major absorption band at 440 nm and minor ones at 319, 336, 360, and 490 nm (Figure 2A). Absorption at 336 nm varies between crystals from different batches and can be as much as 25% of the total enzyme absorption. This peak is a convolution of the minor enolimine tautomer band and the E-PMP band (no effort was made to maintain pure E-PLP during enzyme purification and crys- tallization). It can be decreased by about 50% upon treatment of the crystals with a keto acid substrate, but this procedure substantially decreases the order of the crystals. All exper- iments have thus been performed with a fresh batch of crystals containing a uniform amount of E-PMP (approximately 6%).
After exchange of L-aspartate (1 50 mM) for maleate, the crystals show a major peak at 327 nm and minor ones at 360,
Aspartate Aminotransferase Ketimine Structures Biochemistry, Vol. 32, No. 49, 1993 13455
Table 111: Absordion Band Parameters for Crystal Spectra of mAATase in the Presence of Maleate and Natural Substrates ~ ~ ~ ~~~
substrate added peak position (nm) abs (re1 units) width (cm-I) skewness band area (re1 units) % of total"
(A) 100 mM maleate 319 0.018 4150 1.6 77 8 336 0.030 4050 1.5 117 12 360 0.028 4050 1.5 126 9 440 0.273 3690 1.6 1039 71
(B) 150 mM L-aspartate 334 0.259 4400 1.6 1163 77 360 0.032 4050 1.5 134 7 426 0.075 4190 1.5 326 15 490 0.007 3650 1.5 26 1
(C) 150 mM L-aspartate + 2.0 mM oxalacetate 33 1 0.253 4400 1 .5 1155 76 360 0.032 4050 1.5 134 7 427 0.081 4190 1.5 352 16 490 0.007 3650 1.5 26 1
(D) 150 mM L-glutamate 331 0.259 3850 1.6 1026 85 362 0.031 4050 1.5 130 9 424 0.022 4090 1.6 92 5 490 0.01 1 3650 1.5 41 1
(E) 150 mM L-glutamate + 20 mM 2-oxoglutarate 331 0.260 3850 1.5 1035 83 360 0.030 4050 1.5 126 8 425 0.031 4190 1.6 133 8 490 0.012 3650 1.5 45 1
a Percents of total intermediates were obtained with the molar area estimates of Metzler & Metzler (19871.
Table IV: Estimated Percentages of mAATase Reaction Intermediates in a221 Crystals
substrate added intermediate % of total" (A) 150 mM L-aspartate protonated aldimine 156
unprotonated aldimine 7 E-PMP 4c ketimined 73 quinonoid 1
(B) 150 mM L-aspartate + protonated aldimine 16 2.0 mM oxalacetate unprotonated aldimine 7
E-PMP 0 ketimine 76 quinonoid 1
(C) 150 mM L-glutamate protonated aldimine 5 unprotonated aldimine 9 E-PMP 1Oe ketimine 75 quinonoid 1
(D) 150 mM L-glutamate + protonated aldimine 8 20.0 mM 2-oxoglutarate unprotonated aldimine 8
E-PMP 0 ketimine 83 auinonoid 1
~ ~~~
" The assignment of the absorption bands to specific intermediates is least secure for the two aldimine species. bThe estimated errors are approximately 4% of the given values for the protonated aldimine and ketimine and approximately 8% for the unprotonated aldimine. See Experimental Procedures. Value calculated by assuming that all E-PMP is eliminated on addition of keto acid substrate. The ratios between the external aldimine, the ketimine, and the quinonoid in crystals with both substrates present areassumed to beindependent ofthedegreeof saturation and were used to estimate the amount of E-PMP absorption in the 330- nm band by subtracting the calculated absorbance of the ketimine intermediate. These values have large errors. The carbinolamine and geminal diamine intermediates may make minor contributions to the 330-nm absorDtion band. which is assiened to the ketimine.
428, and 490 nm (Figure 2B), qualitatively similar to the solution spectrum. When 2 mM oxalacetate is added with aspartate, only a minor redistribution between the various species occurs (Figure 2C, Table 111). The intermediate populations were calculated using the band areas and the appropriate molar areas for each intermediate (see Experi- mental Procedures) and are listed in Table IV.
Under the experimental conditions, the external aldimine and the Michaelis complex are expected to contribute significantly to the absorption bands at 360 and 430 nm. Differences in the 430-nm-band polarization ratios, A,/Ab, observed with the model Michaelis complex with maleate and
~ ~~
the external aldimine with 2-methylaspartate (Picot, 1987) allow one to estimate the contributions of the external aldimine and Michaelis complex to this absorption band. This procedure yields an external a1dimine:Michaelis complex ratio of 20: 1 both in the L-aspartate and in the L-aspartate/oxalacetate soaked crystals. The E-PMP content of the crystals was estimated from the decrease in the 330-nm band and from the relative increase in the 360- and 430-nm bands after addition of oxalacetate.
Treatment of the mAATase crystals with L-glutamate produces a spectrum (Figure 2D) qualitatively similar to that obtained in solution. When 2-oxoglutarate is added with the glutamate, the decrease in the height of the 330-nm band is slightly more pronounced than in the case of the baspartatel oxalacetate substrate pair (Figure 2E; Table 111). The assignments of the absorption bands to intermediates and calculations of their approximate populations were carried out as described above (Table IV). Using the polarization ratios of the model complexes as above, the calculated external a1dimine:Michaelis complex ratio is 1.3:l for both the L-glutamate and ~-glutamate/2-oxoglutarate soaked crystals.
X-ray Analysis
Structure of the L-Aspartate Complex. The coordinates of the 2-methylaspartate complex (Jansonius & Vincent, 1987; McPhalen et al., 1992b) with the coenzymeinhibitor adduct removed were used to calculate an initial (F, - FJ, aC electron density map. Clear, continuous density at the position of the substratecoenzyme binding site was observed in this map, indicating a covalent coenzymesubstrate adduct with high occupancy. The intermediates that need to be considered are the Michaelis complex, the geminal diamine, the external aldimine, the ketimine, and the carbinolamine. The Michaelis complex and the geminal diamine were eliminated from consideration by the absence of continuous density between Lys258 and the cofactor-substrate adduct while the carbinol- amine intermediate could be excluded by the absence of density for an a-hydroxyl group, even at very low a-cutoff. This leaves the external aldimine and ketimine intermediates as the only candidates.
Although the crystal spectrum suggests that no more than 22% of the aspartate external aldimine (360- and 430-nm
13456 Biochemistry, Vol. 32, No. 49, I993 Malashkevich et al.
,N194
Y I
. N194
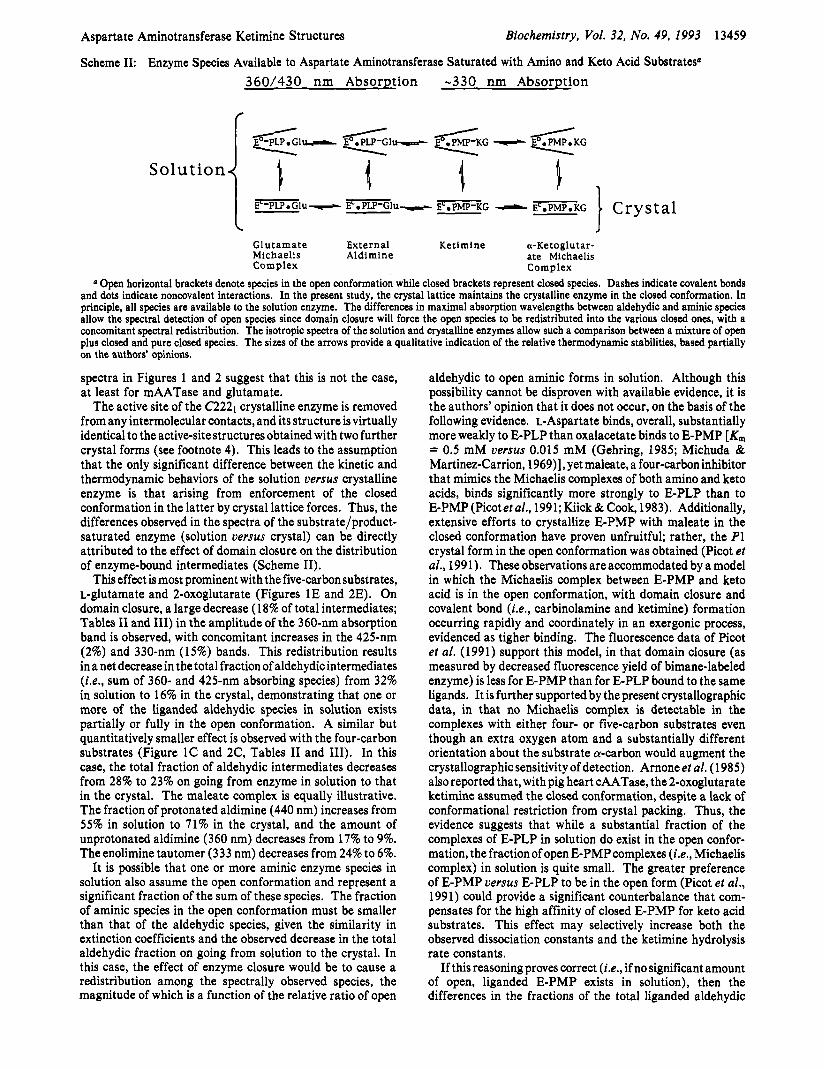
FIGURE 3: Stereoviews of the refined ketimine structures superimposed onto "omit" maps calculated with (Fo - F,) coefficients and calculated phases: (A, top) oxalacetate ketimine model; (B, bottom) 2-oxoglutarate ketimine model. The maps are contoured at 5u, Both ketimine models fit the electron density better than the corresponding aldimine models. chain of Lys-258 are well defined by the density.
The conformations of the substratemenzyme adducts and the side
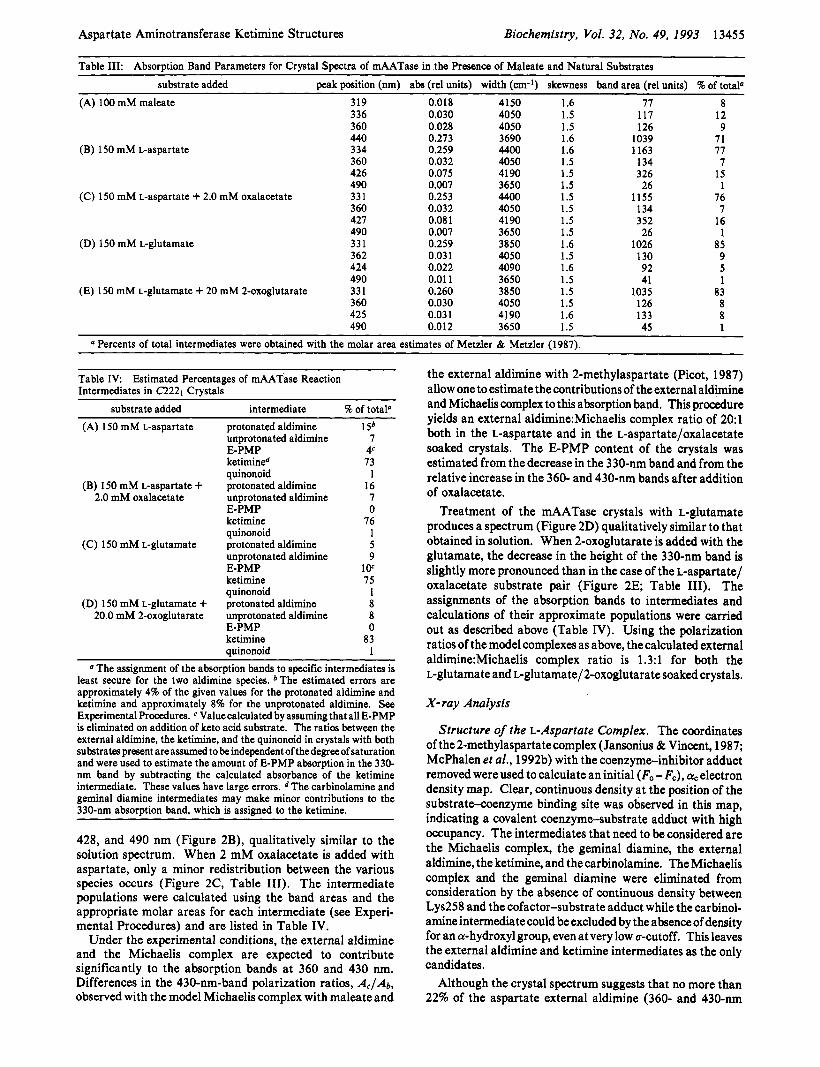
bands) is present in addition to 73% of the ketimine, models of both were built into the density and refined independently to convergence. The refinement statistics for the ketimine model are summarized in Table I. Therms deviation between main-chain atoms for these refined modeL and the starting model is 0.12 A. Additionally, the initial model without coenzyme-substrate adduct was independently refined against the observed data. The final electron density in the coenzyme region was indistinguishable in all three cases, eliminating the possibility of significant model bias in this region. Simultaneous refinement of the occupancies of both the external aldimine and ketimine models (Le., the inclusion of both models with complementary occupancies in a single refinement procedure) was not attempted due to the strong similarity of the final models; the maximal deviation between them is lower than the estimated coordinate error of 0.28 A. The density from an omit map in which the coenzyme- substrate adduct and Lys258 were omitted from the final refined ketimine structure is shown in Figure 3A with the final model of the ketimine intermediate superimposed.
A direct comparison of the relative goodness of fit of the external aldimine uersus the ketimine model is provided by the crystallographic R factors. For this comparison, both intermediate models ( B factors set to 20 Az) were placed in the protein portion of the model obtained from the refinement without coenzyme present. The R factor so obtained for the external aldimine model is 0.02% higher than that for the ketimine model. This difference in R value is very small. However, a model calculation in which the a-carbon of the ketimine model was completely removed gave an increase in R factor of only 0.03%. Considering the high degree of spatial overlap between the models, this result suggests that the
observed difference of 0.02% is meaningful. Thus, the lower R factor for the ketimine model supports the conclusion that this is the dominant species present. Corroborating the conclusion based on the R factors (F, - Fc), a, maps show significant residual density (above 3a) near the coenzyme only when the external aldimine model is used.
In the ketimine structure, the principal plane of the substrate moiety, defined by C4!, N, C,, Cg, and C, is not coplanar with the cofactor pyridine ring but rotated out of the plane by approximately 20° around an axis through Cq and C4!. This brings the c4 -H~ bond into an orientation close to normal to the pyridine ring. Similar to the 2-methylaspartate complex, the @-carboxylate is nearly coplanar with the guanidinium group of Arg292* and forms strong ion pair-hydrogen bond interactions with it. This "end-on symmetric" type of interaction is one of the seven with lowest energy found in proteins (Mitchell et al., 1992). The a-carboxylate makes similar interactions with the side chain of Arg386. The XI torsion angle of the substrate moiety is -8 1 O , corresponding to a gauche conformation.
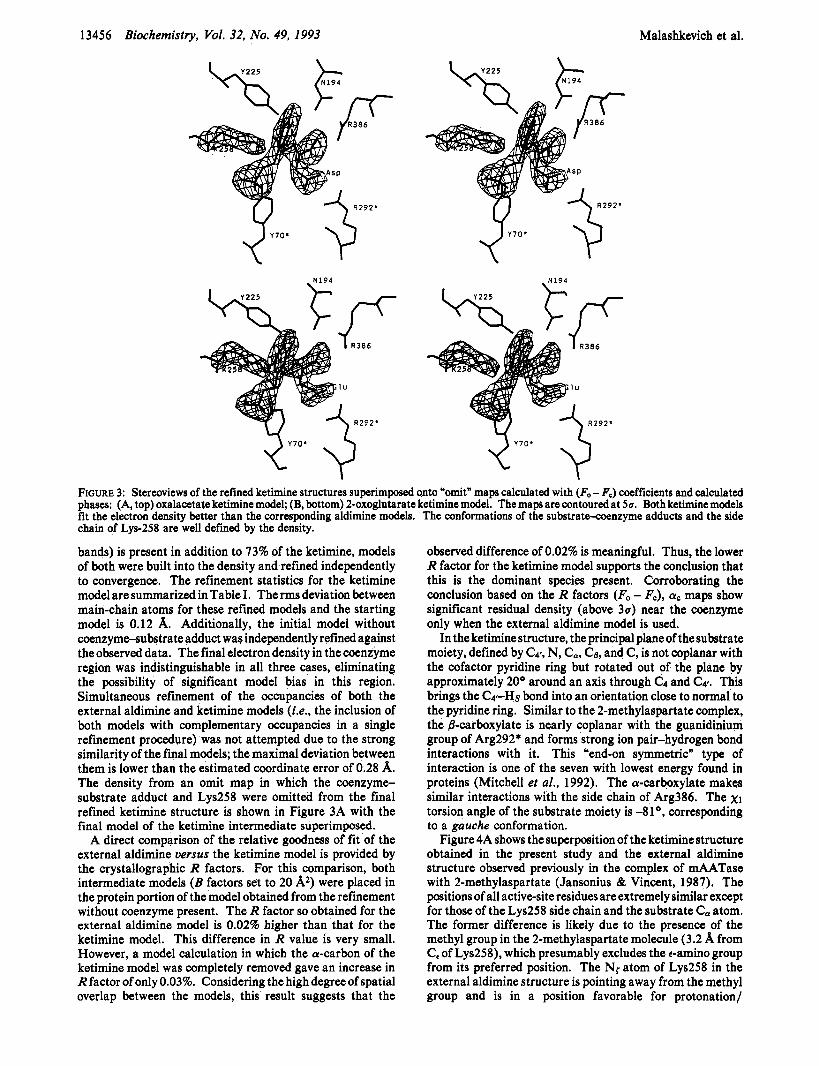
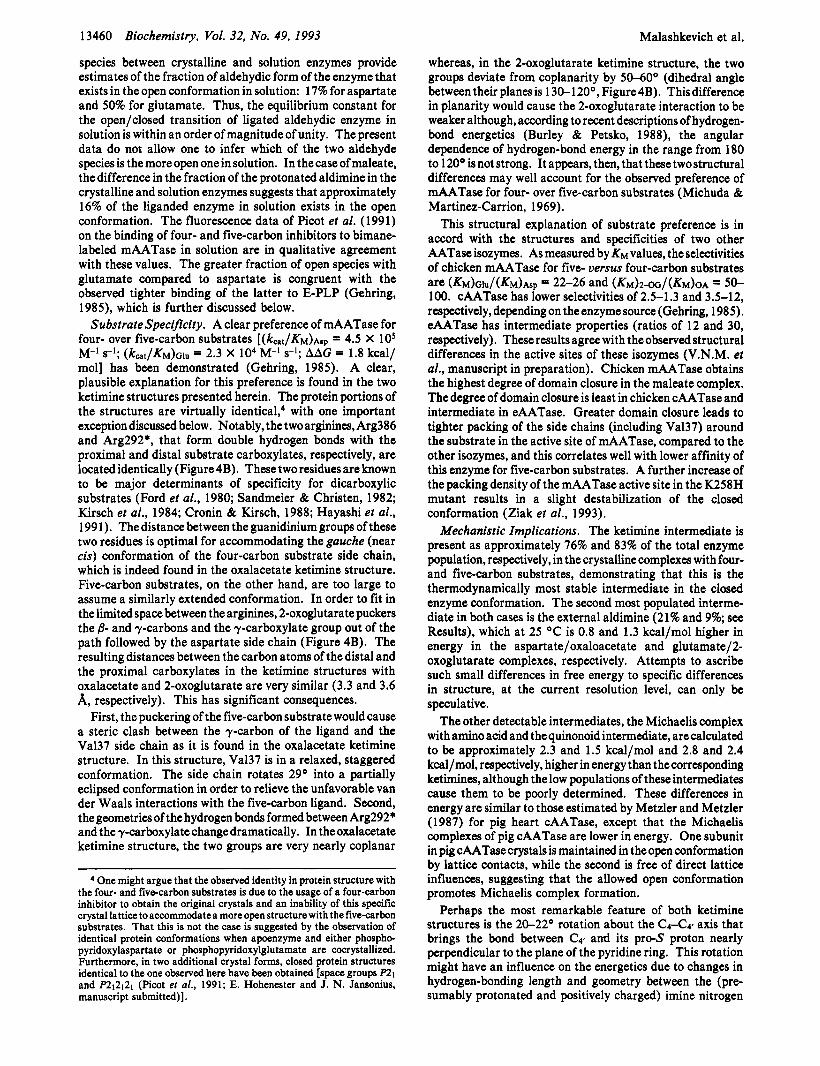
Figure 4A shows the superposition of the ketimine structure obtained in the present study and the external aldimine structure observed previously in the complex of mAATase with 2-methylaspartate (Jansonius & Vincent, 1987). The positions of all active-site residues are extremely similar except for those of the Lys258 side chain and the substrate C, atom. The former difference is likely due to the presence of the methyl group in the 2-methylaspartate molecule (3.2 A from C, of Lys258), which presumably excludes the t-amino group from its preferred position. The Nr atom of Lys258 in the external aldimine structure is pointing away from the methyl group and is in a position favorable for protonation/
Aspartate Aminotransferase Ketimine Structures Biochemistry, Vol. 32, No. 49, 1993 13457
t K258
K258 K258
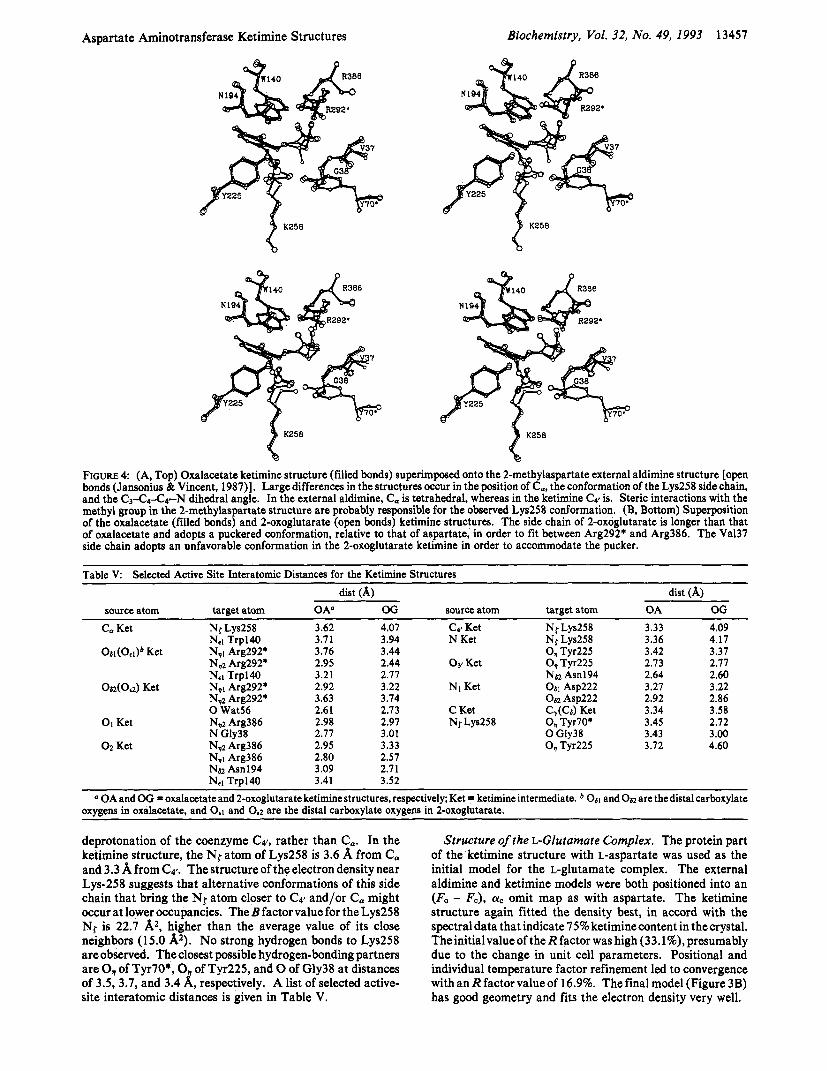
FIGURE 4 (A, Top) Oxalacetate ketimine structure (filled bonds) superimposed onto the 2-methylaspartate external aldimine structure [open bonds (Jansonius & Vincent, 1987)]. Large differences in the structures occur in the position of C,, the conformation of the Lys258 side chain, and the C3-C4-C4-N dihedral angle. In the external aldimine, C, is tetrahedral, whereas in the ketimine C4’ is. Steric interactions with the methyl group in the 2-methylaspartate structure are probably responsible for the observed Lys258 conformation. (B, Bottom) Superposition of the oxalacetate (filled bonds) and 2-oxoglutarate (open bonds) ketimine structures. The side chain of 2-oxoglutarate is longer than that of oxalacetate and adopts a puckered conformation, relative to that of aspartate, in order to fit between Arg292* and Arg386. The Val37 side chain adopts an unfavorable conformation in the 2-oxoglutarate ketimine in order to accommodate the pucker.
Table V: Selected Active Site Interatomic Distances for the Ketimine Structures dist (A) dist (A)
source atom target atom OAa OG source atom target atom OA OG C, Ket Ny Ly~258 3.62 4.07 C41 Ket Ny Ly~258 3.33 4.09
N,I Trpl40 3.71 3.94 N Ket Ny Ly~258 3.36 4.17
N,2 Arg292* 2.95 2.44 O3t Ket 0, Tyr225 2.73 2.77 N,I Trpl40 3.21 2.77 N62 Asnl94 2.64 2.60
062(Oe2) Ket N,I Arg292’ 2.92 3.22 N1 Ket 0 6 1 Asp222 3.27 3.22 N,2 Arg292* 3.63 3.74 0 6 2 Asp222 2.92 2.86 0 Wat56 2.61 2.73 C Ket C&) Ket 3.34 3.58
01 Ket N,,2 Arg386 2.98 2.97 NfLys258 0, Tyr70* 3.45 2.72 N Gly38 2.77 3.01 3.43 3.00 0 Gly38
0 2 Ket N,z Arg386 2.95 3.33 0, Tyr225 3.72 4.60 N,1 Arg386 2.80 2.57 Na2 Asn 194 3.09 2.71 N.1 Trul40 3.41 3.52
OSI(O,I)~ Ket N,I Arg292* 3.76 3.44 0, Tyr225 3.42 3.37
~~
a OA and0G-S oxalacetate and 2-oxoglutarate ketimine structures, respectively; Ket = ketimine intermediate. 061 and 0 6 2 are the distal carboxylate oxygens in oxalacetate, and Oe1 and 0,2 are the distal carboxylate oxygens in 2-oxoglutarate.
deprotonation of the coenzyme C4!, rather than C,. In the ketimine structure, the Nr atom of Lys258 is 3.6 A from C, and 3.3 A from (24’. The structure of the electron density near Lys-258 suggests tha t alternative conformations of this side chain that bring the Nr atom closer to C4’ and/or C, might occur at lower occupancies. The B factor value for the Lys258 Nf is 22.7 A2, higher than the average value of its close neighbors (15.0 Az). No strong hydrogen bonds to Lys258 are observed. The closest possible hydrogen-bonding partners are 0, of Tyr70*, 0, of Tyr225, and 0 of Gly38 at distances of 3.5,3.7, and 3.4 A, respectively. A list of selected active- site interatomic distances is given in Table V.
S t ruc ture of the L-Glutamate Complex. The protein part of the ketimine structure with L-aspartate was used as the initial model for the L-glutamate complex. The external aldimine and ketimine models were both positioned into an (Fo - Fc), aC omit map as with aspartate. The ketimine structure again fitted the density best, in accord with the spectral data that indicate 75% ketiminecontent in thecrystal. Theini t ia lvalueofthe Rfactorwas high (33.1%),presumably due to the change in unit cell parameters. Positional and individual temperature factor refinement led to convergence with an R factor value of 16.9%. The final model (Figure 3B) has good geometry and fits the electron density very well.
13458 Biochemistry, Vol. 32, No. 49, 1993
The two ketimine structures are shown superimposed in Figure 4B. In the 2-oxoglutarate ketimine, the plane of the substrate moiety (as defined by the atoms C4!, N, C,, Cg, and C) and the pyridine ring plane form a dihedral angle of 22O. The side chain of 2-oxoglutarate is not extended (XI = -57O and x2 = -71O). The following differences distinguish the 2-oxoglutarate ketimine from the oxalacetate ketimine struc- ture. The planes of the y-carboxylate and the guanidinium group of Arg292* deviate from coplanarity by 45-50'. The side chain of Val37 is rotated by 29' around the C,-Cg bond in order to relax the van der Waals contact with the C, atom of the substrate side chain. This brings it from a sterically favorable conformation in the oxalacetate ketimine structure (XI = 44O) to a strained one (XI = 15O). The electron density for Val37 is weak, presumably due to multiple conformations. The Nratom of Lys258 is shifted closer to the carbonyl oxygen of Gly38 (not shown) and the hydroxyl group of Tyr70*. It forms hydrogen bonds to these groups with lengths of 3.0 and 2.7 A, respectively. Like in the aspartatecomplex, its B factor value of 28.4 A2 is higher than the average of its closest neighbors (1 5.4 A2). The distances between the Nrof Lys258 and C, and C4' are both 4.1 A, respectively, greater than those in the aspartate complex (3.6 and 3.3 A).
Malashkevich et al.
conformational and chemical transformations. The energy gained through better contacts made between the enzyme and substrate in the closed conformation is at least sufficient to offset the energy required to close the small domain onto the large one. The structures of the open and closed forms of AATase supply clear examples of improved interactions upon domain closure, the most striking being the movements of Arg386 and Arg292* several angstroms closer to the proximal and distal substrate carboxylates, respectively, leading to tight, double hydrogen bond-salt bridge interactions (McPhalen et al., 1992b).
Domain closure-yielding the fully active, closed confor- mation from the less active, open one (Kirsten et al., 1983)-is paid for by the excess binding energy of the substrate (i.e., the difference between the intrinsic and observed binding energies). This constitutes a clear example of an induced fit mechanism (Koshland, 1970) in which the active, closed form of the enzyme is incapable of binding or releasing ligands in a kinetically competent manner (Herschlag, 1988; Wolfenden, 1974). Non-dicarboxylic amino acids (e.g., alanine) are both much poorer substrates and ineffective at closing the small domain (Kirsch et al., 1984), indicating a key role for the Arg292*4istal carboxylate interaction in providing enzyme specificity (Sandmeier C Christen, 1982). That this is the case has also been confirmed for the E. coli isozyme through site-directed mutagenesis studies (Cronin C Kirsch, 1988).
The tighter binding of substrates by the closed, crystalline enzyme originates in the crystal lattice energy. The inter- molecular interactions of the enzyme in the crystal are adequate to keep at least the liganded enzyme completely in the closed conformation. Although the unliganded enzyme has yet to be stabilized in this crystal form (Picot, 1987; Picot et al., 1991), an acetate-bound form with a single acetate ion per active site (E. Hohenester and J. N. Jansonius, unpublished results) is stable, demonstrating that the crystal lattice energy is comparable in magnitude to the energy required for domain closure, given the very weak binding of acetate to the enzyme in solution. Thus, the intermolecular lattice interactions largely pay the cost of domain closure normally paid for by the substrate, allowing a fuller expression of the intrinsic binding energy in the observed substrate dissociation constant (Jencks, 1975).
Using the data in Table IV and the protein subunit concentration in the crystal, the calculated value of KD for 2-oxoglutarate binding to the closed, crystalline enzyme is 0.16 P M . ~ This upper limit on the KD value is 104-fold lower than that for enzyme in solution [1.5 mM (Gehring, 1985)], corresponding to a cost of more than 5.8 kcal/mol for domain closure.
Open, Liganded Enzyme in Solution. It is often assumed in the literature that dicarboxylate-liganded AATase in solution exists almost entirely in the closed conformation. The
DISCUSSION
Substrate Affinities and Domain Closure. The existence of two conformations of AATase was expected from solution studies (Birchmeier et al., 1973; Gehring C Christen, 1978) and was definitively demonstrated by the crystallographic determination of the three-dimensional structures of the open and closed conformations [see e.g. Christen and Metzler (1985), Picot et al. (1991), and McPhalen et al. (1992a,b)]. The unliganded enzyme in solution exists in the open conformation, while the liganded substantially adopts the closed one (see below). The a 2 2 1 crystal form of mAATase used here maintains the closed enzyme conformation and allows its study in pure form. Given the fact that substrates and inhibitors are completely buried in the closed active site, their facile exchange in the crystal must bedue to the flexibility of the enzyme molecule. Local mobility of the main and side chains at the active-site entrance, combined with small-scale movements of the small domain, might be sufficient to account for the observed rates of ligand exchange. It is also possible that formation of the (partially) open conformation is necessary for exchange and occurs as random, isolated, improbable events, with the crystal lattice being resilient to disruption by these events.
The larger fraction of unliganded E-PMP in solution uersus in the crystal when L-aspartate or L-glutamate alone is added demonstrates that the crystallineenzyme has a much increased affinity for keto acid substrates. When no exogenous keto acid is added, as in these experiments, keto acid is present stoichiometrically with unliganded E-PMP. That is, tran- samination is the sole source of free keto acid. Spectra of the aspartate or glutamate soaked crystals did not change after 3 days of soaking in 1-10 mL of stabilizing solution. Apparently, all E-PMP observed in the aspartateor glutamate soaked crystals originates from the initial maleate-containing crystals. The calculated E-PMP contents (Table IV) agree reasonably well with the value measured in the maleate- containing crystals (see Results).
In solution, initial complex formation occurs between open enzyme and substrate, forming an open Michaelis complex that reacts further to give a closed Michaelis complex or a covalent intermediate, depending on the synchroneity of the
The KDvalues were calculated by assuming that all of the free E-PMP observed in the crystals originates solely from E-PLP that reacts with amino acid and subsequently releases keto acid product into solution. This yields an upper limit for the value of KD, since a substantial amount of E-PMP is present in the original maleate-liganded crystals. It was also assumed that the keto acid released by the enzyme is fully equilibrated with thelargereservoir ofsolutionoutside thecrystalvolume. For example, the glutamate spectra indicate that, in the absence of exogenous 2-oxoglutarate, 9.5% of the enzyme is unliganded E-PMP. The subunit concentration in the crystal is 16.3 mM. Thus, the liganded enzyme concentration is 14.8 mM, that of unliganded E-PMP is 1.5 mM, and that of the free keto acid is 1.5 pM (the crystal volume is 0.1% of the reservior volume), yielding KD = [E][L]/[EL] = 0.16 pM. The corresponding value for oxalacetate is 0.03 rM.
Aspartate Aminotransferase Ketimine Structures Biochemistry, Vol. 32, No. 49, 1993
Scheme 11: Enzyme Species Available to Aspartate Aminotransferase Saturated with Amino and Keto Acid Substratesa
13459
360/430 nm Absorption -330 nm Absorption
f
Cry s t a1
Glutamate External Ketimine a-Ketoglutar- Michaelis Aldimine ate Michaelis Complex Complex
Open horizontal brackets denote species in the open conformation while closed brackets represent closed species. Dashes indicate covalent bonds and dots indicate noncovalent interactions. In the present study, the crystal lattice maintains the crystalline enzyme in the closed conformation. In principle, all species are available to the solution enzyme. The differences in maximal absorption wavelengths between aldehydic and aminic species allow the spectral detection of open species since domain closure will force the open species to be redistributed into the various closed ones, with a concomitant spectral redistribution. The isotropic spectra of the solution and crystalline enzymes allow such a comparison between a mixture of open plus closed and pure closed species. The sizes of the arrows provide a qualitative indication of the relative thermodynamic stabilities, based partially i n the authors’ opinions.
spectra in Figures 1 and 2 suggest that this is not the case, at least for mAATase and glutamate.
The active site of the e2221 crystalline enzyme is removed from any intermolecular contacts, and its structure is virtually identical to the active-site structures obtained with two further crystal forms (see footnote 4). This leads to the assumption that the only significant difference between the kinetic and thermodynamic behaviors of the solution versus crystalline enzyme is that arising from enforcement of the closed conformation in the latter by crystal lattice forces. Thus, the differences observed in the spectra of the substrate/product- saturated enzyme (solution uersus crystal) can be directly attributed to the effect of domain closure on the distribution of enzyme-bound intermediates (Scheme 11).
This effect is most prominent with the five-carbon substrates, L-glutamate and 2-oxoglutarate (Figures 1E and 2E). On domain closure, a large decrease (18% of total intermediates; Tables I1 and 111) in the amplitude of the 360-nm absorption band is observed, with concomitant increases in the 425-nm (2%) and 330-nm (15%) bands. This redistribution results in a net decrease in the total fraction of aldehydic intermediates (Le., sum of 360- and 425-nm absorbing species) from 32% in solution to 16% in the crystal, demonstrating that one or more of the liganded aldehydic species in solution exists partially or fully in the open conformation. A similar but quantitatively smaller effect is observed with the four-carbon substrates (Figure 1C and 2C, Tables I1 and 111). In this case, the total fraction of aldehydic intermediates decreases from 28% to 23% on going from enzyme in solution to that in the crystal. The maleate complex is equally illustrative. The fraction of protonated aldimine (440 nm) increases from 55% in solution to 71% in the crystal, and the amount of unprotonated aldimine (360 nm) decreases from 17% to 9%. The enolimine tautomer (333 nm) decreases from 24% to 6%.
It is possible that one or more aminic enzyme species in solution also assume the open conformation and represent a significant fraction of the sum of these species. The fraction of aminic species in the open conformation must be smaller than that of the aldehydic species, given the similarity in extinction coefficients and the observed decrease in the total aldehydic fraction on going from solution to the crystal. In this case, the effect of enzyme closure would be to cause a redistribution among the spectrally observed species, the magnitude of which is a function of the relative ratio of open
aldehydic to open aminic forms in solution. Although this possibility cannot be disproven with available evidence, it is the authors’ opinion that it does not occur, on the basis of the following evidence. L-Aspartate binds, overall, substantially more weakly to E-PLP than oxalacetate binds to E-PMP [Km = 0.5 mM versus 0.015 mM (Gehring, 1985; Michuda & Martinez-Carrion, 1969)], yet maleate, a four-carbon inhibitor that mimics the Michaelis complexes of both amino and keto acids, binds significantly more strongly to E-PLP than to E-PMP (Picotetal., 1991;Kiick & Cook, 1983). Additionally, extensive efforts to crystallize E-PMP with maleate in the closed conformation have proven unfruitful; rather, the P1 crystal form in the open conformation was obtained (Picot et al., 1991). These observations are accommodated by a model in which the Michaelis complex between E-PMP and keto acid is in the open conformation, with domain closure and covalent bond (i.e., carbinolamine and ketimine) formation occurring rapidly and coordinately in an exergonic process, evidenced as tigher binding. The fluorescence data of Picot et al. (1991) support this model, in that domain closure (as measured by decreased fluorescence yield of bimane-labeled enzyme) is less for E-PMP than for E-PLP bound to the same ligands. It is further supported by the present crystallographic data, in that no Michaelis complex is detectable in the complexes with either four- or five-carbon substrates even though an extra oxygen atom and a substantially different orientation about the substrate a-carbon would augment the crystallographic sensitivity of detection. Arnone et al. (1985) also reported that, with pig heart cAATase, the 2-oxoglutarate ketimine assumed the closed conformation, despite a lack of conformational restriction from crystal packing. Thus, the evidence suggests that while a substantial fraction of the complexes of E-PLP in solution do exist in the open confor- mation, the fraction of open E-PMP complexes (i.e., Michaelis complex) in solution is quite small. The greater preference of E-PMP uersus E-PLP to be in the open form (Picot et al., 1991) could provide a significant counterbalance that com- pensates for the high affinity of closed E-PMP for keto acid substrates. This effect may selectively increase both the observed dissociation constants and the ketimine hydrolysis rate constants.
If this reasoning proves correct (i.e., if no significant amount of open, liganded E-PMP exists in solution), then the differences in the fractions of the total liganded aldehydic
13460 Biochemistry, Vol. 32, No. 49, 1993
species between crystalline and solution enzymes provide estimates of the fraction of aldehydic form of the enzyme that exists in the open conformation in solution: 17% for aspartate and 50% for glutamate. Thus, the equilibrium constant for the open/closed transition of ligated aldehydic enzyme in solution is within an order of magnitude of unity. The present data do not allow one to infer which of the two aldehyde species is the more open one in solution. In the case of maleate, thedifference in the fraction of the protonated aldimine in the crystalline and solution enzymes suggests that approximately 16% of the liganded enzyme in solution exists in the open conformation. The fluorescence data of Picot et al. (1991) on the binding of four- and five-carbon inhibitors to bimane- labeled mAATase in solution are in qualitative agreement with these values. The greater fraction of open species with glutamate compared to aspartate is congruent with the observed tighter binding of the latter to E-PLP (Gehring, 1985), which is further discussed below.
Substrate Specificity. A clear preference of mAATase for four- over five-carbon substrates [(kcat/KM)Asp = 4.5 X 10⁵
mol] has been demonstrated (Gehring, 1985). A clear, plausible explanation for this preference is found in the two ketimine structures presented herein. The protein portions of the structures are virtually identical: with one important exception discussed below. Notably, the twoarginines,Arg386 and Arg292*, that form double hydrogen bonds with the proximal and distal substrate carboxylates, respectively, are located identically (Figure 4B). These two residues are known to be major determinants of specificity for dicarboxylic substrates (Ford et al., 1980; Sandmeier & Christen, 1982; Kirsch et al., 1984; Cronin & Kirsch, 1988; Hayashi et al., 1991). The distance between the guanidinium groups of these two residues is optimal for accommodating the gauche (near cis) conformation of the four-carbon substrate side chain, which is indeed found in the oxalacetate ketimine structure. Five-carbon substrates, on the other hand, are too large to assume a similarly extended conformation. In order to fit in the limited space between the arginines, 2-oxoglutarate puckers the 8- and y-carbons and the y-carboxylate group out of the path followed by the aspartate side chain (Figure 4B). The resulting distances between the carbon atoms of the distal and the proximal carboxylates in the ketimine structures with oxalacetate and 2-oxoglutarate are very similar (3.3 and 3.6 A, respectively). This has significant consequences.
First, the puckering of the five-carbon substrate would cause a steric clash between the y-carbon of the ligand and the Val37 side chain as it is found in the oxalacetate ketimine structure. In this structure, Val37 is in a relaxed, staggered conformation. The side chain rotates 29O into a partially eclipsed conformation in order to relieve the unfavorable van der Waals interactions with the five-carbon ligand. Second, the geometries of the hydrogen bonds formed between Arg292* and the y-carboxylate change dramatically. In the oxalacetate ketimine structure, the two groups are very nearly coplanar
M-'S-'; ( k a t / K M ) G l u 2.3 X lo4 M-'S-'; AAG = 1.8 kcal/
Malashkevich et al.
whereas, in the 2-oxoglutarate ketimine structure, the two groups deviate from coplanarity by 5 M O o (dihedral angle between their planes is 1 30-120°, Figure 4B). This difference in planarity would cause the 2-oxoglutarate interaction to be weaker although, according to recent descriptions of hydrogen- bond energetics (Burley & Petsko, 1988), the angular dependence of hydrogen-bond energy in the range from 180 to 1 20° is not strong. It appears, then, that these two structural differences may well account for the observed preference of mAATase for four- over five-carbon substrates (Michuda & Martinez-Carrion, 1969).
This structural explanation of substrate preference is in accord with the structures and specificities of two other AATase isozymes. As measured by KM values, the selectivities of chicken mAATase for five- versus four-carbon substrates are (KM)GI~/(KM)A~~ = 22-26 and (KM)Z-OG/(KM)OA = 50- 100. cAATase has lower selectivities of 2.5-1.3 and 3.5-12, respectively, depending on the enzymesource (Gehring, 1985). eAATase has intermediate properties (ratios of 12 and 30, respectively). These results agree with the observed structural differences in the active sites of these isozymes (V.N.M. et al., manuscript in preparation). Chicken mAATase obtains the highest degree of domain closure in the maleate complex. The degree of domain closure is least in chicken cAATase and intermediate in eAATase. Greater domain closure leads to tighter packing of the side chains (including Va137) around the substrate in the active site of mAATase, compared to the other isozymes, and this correlates well with lower affinity of this enzyme for five-carbon substrates. A further increase of the packing density of the mAATase active site in the K258H mutant results in a slight destabilization of the closed conformation (Ziak et al., 1993).
Mechanistic Implications. The ketimine intermediate is present as approximately 76% and 83% of the total enzyme population, respectively, in the crystalline complexes with four- and five-carbon substrates, demonstrating that this is the thermodynamically most stable intermediate in the closed enzyme conformation. The second most populated interme- diate in both cases is the external aldimine (21% and 9%; see Results), which at 25 OC is 0.8 and 1.3 kcal/mol higher in energy in the aspartate/oxaloacetate and glutamate/2- oxoglutarate complexes, respectively. Attempts to ascribe such small differences in free energy to specific differences in structure, at the current resolution level, can only be speculative.
The other detectable intermediates, the Michaelis complex with amino acid and the quinonoid intermediate, are calculated to be approximately 2.3 and 1.5 kcal/mol and 2.8 and 2.4 kcal/mol, respectively, higher in energy than thecorresponding ketimines, although the low populations of these intermediates cause them to be poorly determined. These differences in energy are similar to those estimated by Metzler and Metzler (1987) for pig heart cAATase, except that the Michaelis complexes of pig cAATase are lower in energy. One subunit in pig cAATase crystals is maintained in the open conformation by lattice contacts, while the second is free of direct lattice influences, suggesting that the allowed open conformation promotes Michaelis complex formation.
Perhaps the most remarkable feature of both ketimine structures is the 20-22O rotation about the C 4 4 ) axis that brings the bond between C4' and its p r o 4 proton nearly perpendicular to the plane of the pyridine ring. This rotation might have an influence on the energetics due to changes in hydrogen-bonding length and geometry between the (pre- sumably protonated and positively charged) imine nitrogen
One might argue that the observed identity in protein structure with the four- and five-carbon substrates is due to the usage of a four-carbon inhibitor to obtain the original crystals and an inability of this specific crystal lattice to accommodate a more open structure with the five-carbon substrates. That this is not the case is suggested by the observation of identical protein conformations when apoenzyme and either phospho- pyridoxylaspartate or phosphopyridoxylglutamate are cocrystallized. Furthermore, in two additional crystal forms, closed protein structures identical to the one observed here have been obtained [space groups P21 and P212121 (Picot et al., 1991; E. Hohenester and J. N. Jansonius, manuscript submitted)].
Aspartate Aminotransferase Ketimine Structures
and the phenolic 03’. The structure of the 2-methylaspartate external aldimine (Figure 4A, McPhalen et ai., 1992b; Jansonius & Vincent, 1987) lends support to the proposal of Dunathan (1966) that the C, bond undergoing cleavage is most labile, due to maximal u+r orbital overlap in the transition state, when it is oriented perpendicularly to the pyridine ring plane. This proposal was based on earlier studies of ketone enolization reactions and provides an attractive explanation of how PLP-dependent enzymes may control reaction spec- ificity. The present ketimine structures suggest that this labilization effect is also in play for the C4. pro-S proton of the amine form of the coenzyme (Tobler et al., 1987), which, when removed, yields the central, quinonoid intermediate.
The absence of significant unaccounted for density in the active-site region of (Fo - Fc), ac difference maps allows one to confidently exclude the presence of a localized water molecule in the active site near Lys258, which could be used in the hydrolysis of the imine bond (thought to be general- base-catalyzed by Lys258). It may be either that the water molecule necessary for hydrolysis gains fleeting access to the reaction center if the transformation is initiated in the observed closed conformation or that water is readily available to a nascent (more) open ketimine with rapid hydrolysis ensuing, in accord with the discussion above.
Deprotonation of the ketimine intermediate at C4’ by Lys258 in the normal sequence of events must occur from a different Lys258 conformation than that shown in Figure 4B, given distances between the amino group and C4t greater than those of hydrogen bonds (3.3 and 4.1 A, respectively, in the oxalacetate and 2-oxoglutarate ketimine structures). The structureof the electron density near the Lys258 amino group in (Fo - Fc), cyc difference maps suggests that a second conformation of this side chain,5 in which the amino group is pointed toward and closer to C4!, may be populated, although this secondconformation was not crystallographically refined. Model building shows that the Lys258 amino group can be brought to within 2.2 or 2.6 A of C4p in the oxalacetate and 2-oxoglutarate ketimine structures, respectively, if the Lys258 side chain is extended, well within the limits of strong hydrogen- bonding distances. Furthermore, the observed absence of hydrogen bonds to the amino group (at least in the oxalacetate ketimine structure) and the high B factors of the Lys258 side chain suggests conformational flexibility, which must be necessary to achieve the 1,3-prototropic shift central to the transamination reaction.
ACKNOWLEDGMENTS
We are grateful to Andrea Suter-Kunz for expert technical assistance and to Drs. J. Kirsch and H. Gehring for critically reading the manuscript and valuable remarks. This work is part of a joint project with Dr. P. Christen and colleagues, University of Ziirich, on the structure and function of chicken mitochondrial aspartate aminotransferase.
REFERENCES
Arnone, A., Rogers, P. H., Hyde, C. C., Briley, P. D., Metzler, C. M., & Metzler, D. E. (1985) in Transaminases (Christen, P., & Metzler, D. E., Eds.) pp 138-155, John Wiley & Sons, New York.
Birchmeier, W., Wilson, K. J., & Christen, P. (1973) J. Biol. Chem. 248, 1751-1759.
The density mentioned here near the Lys258 amino group could not accommodate a water molecule, as it would make unacceptable steric clashes with the side chain.
Biochemistry, Vol. 32. No. 49. 1993 13461
Borisov, V. V., Borisova, S. N., Kachalova, G. S., Sosfenov, N. I., Vainshtein, B. K. (1985) in Transaminases (Christen, P., & Metzler, D. E., Eds.) pp 155-164, John Wiley & Sons, New York.
Burley, S. K. & Petsko, G. A. (1988) Adv. Protein Chem. 39,
Christen, P., & Metzler, D. E. (1985) Transaminases, John Wiley and Sons, New York.
Clark, P. A., Jansonius, J. N., & Mehler, E. L. (1993) J . Am. Chem. SOC. 115, 1894-1902.
Cronin, C. N., & Kirsch, J. F. (1988) Biochemistry 27, 4572- 4579.
Delbaere, L. T. J., Kallen, J., Markovic-Housley, Z., Khomutov, A. R., Khomutov, R. M., Karpeisky, M. Y., & Jansonius, J. N. (1989) Biochimie 71, 449459.
DOUZOU, P., & Petsko, G. A. (1991) Adv. Protein Chem. 36,
Dunathan, H. C. (1966) Proc. Natl. Acad. Sci. U.S.A. 55,712- 716.
Gehring, H. (1985) in Transaminases (Christen, P., & Metzler, D. E., Eds.) pp 373-375, John Wiley & Sons, New York.
Gehring, H., & Christen, P. (1978) J. Biol. Chem. 253, 3158- 3163.
Goldberg, J. M., Swanson, R. V., Goodman, H. S., & Kirsch, J. F. (1991) Biochemistry 30, 305-312.
Hajdu, J., & Johnson, L. N. (1990) Biochemistry 29, 1669- 1678.
Harutyunyan, E. G., Malashkevich, V. N., Kochkina, V. M., & Torchinsky, Y. M. (1985) in Transaminases (Christen, P., & Metzler, D. E., Eds.) pp 164-173, John Wiley & Sons, New York.
Hayashi,H.,Inoue,Y.,Kuramitsu,S., &Kagamiyama,H. (1991) in Enzymes dependent on pyridoxal phosphate and other carbonyl compounds as cofactors (Fukui, T., Kagamiyama, H., Soda, K., & Wada, H., Eds.) pp 183-1 86, Pergamon Press, Oxford, U.K.
Hendrickson, W. A. (1985) Methods Enzymol. 115,252-270. Herschlag, D. (1988) Bioorg. Chem. 16, 62-96. Inoue, K., Kuramitsu, S., Okamoto, A., Hirotsu, K., Higuchi, T.,
Morino, Y., & Kagamiyama, H. (1991) J. Biochem. 109,570- 576.
125-189.
245-3 58.
Izard, T. (1990) Diploma Thesis, University of Basel. Jlger, J. (1991) Ph.D. Thesis, University of Basel. Jansonius, J. N., & Vincent, M. G. (1987) in Biological
Macromolecules and Assemblies (Jurnak, F. A,, & McPherson, A., Eds.) Vol. 3, pp 187-285, John Wiley & Sons, New York.
Jencks, W. P. (1975) Adv. Enzymol. 43, 219-410. Jones, T. A. (1978) J . Appl. Crystallogr. 11, 268-272. Kamitori,S., Okamoto, A., Hirotsu, K., Higuchi,T., Kuramitsu, S., Kagamiyama, H., Matsuura, Y., & Katsube, Y. (1990) J . Biochem. (Tokyo) 108, 175-184.
Kiick, P. M., & Cook, P. E. (1983) Biochemistry 22, 375-382. Kirsch, J. F., Eichele, G., Ford, G. C., Vincent, M. G., Jansonius,
J. N., Gehring, H., & Christen, P. (1984) J. Mol. Biol. 174,
Kirsten, H., Gehring, H., & Christen, P. (1983) Proc. Narl. Acad. Sci. U.S.A. 80, 1807-1810.
Koshland, D. E., Jr. (1970) in The Enzymes (Boyer, P. D., Ed.) Vol. 1, pp 341-396, Academic Press, New York.
Kuramitsu, S., Yano, T., Inoue, K., Hiromi, K., Tanase, S., Morino, Y ., & Kagamiyama, H. (199 1) in Enzymes dependent on pyridoxal phosphate and other carbonyl compounds as cofactors (Fukui, T., Kagamiyama, H., Soda, K., & Wada, H., Eds.) pp 179-181, Pergamon Press, Oxford, U.K.
Malashkevich, V. N., & Sinitzina, N. I. (1991) J. Mol. Biol. 221, 61-63.
Malcolm, B. A., & Kirsch, J. F. (1985) Biochem. Biophys. Res. Commun. 132, 9 15-921.
McPhalen, C., Vincent, M. G., & Jansonius, J. N. (1992a) J. Mol. Biol. 225, 495-517.
McPhalen, C., Vincent, M. G., Picot, D., Jansonius, J. N., Lesk, A. M., & Chothia, C. (1992b) J. Mol. Biol. 227, 197-213.
497-525.
13462 Biochemistry, Vol. 32, No. 49, 1993
Messerschmidt, A., & Pflugrath, J. W. (1987) J. Appl. Crys-
Metzler, C. M., & Metzler, D. E. (1987) Anal. Biochem. 166,
Metzler, C. M., Mitra, J., Metzler, D. E., Makinen, M. W., Hyde, C. C., Rogers, P. H., & Arnone, A. (1988) J. Mol. Biol.
Metzler, D. E., Harris, C. M., Johnson, R. J., Siano, D. B., &
Michuda, C. M., & Martinez-Carrion, M. (1969) J. Biol. Chem.
Mitchell, B. O., Thornton, J. M., Singh, J., & Price, S. L. (1992)
Pflugrath, J. W., Saper, M. A., & Quiocho, F. A. (1984) in Methods and applications in crystallographic computing (Hall, S. , & Ashida, T., Eds.) pp 4 0 4 4 0 7 , Clarendon Press, Oxford, U.K.
tallogr. 20, 306-3 15.
313-327.
203, 197-220.
Thompson, J. A. (1973) Biochemistry 12, 5377-5392.
244,5920-5927.
J . Mol. Biol. 226, 25 1-262.
Picot, D. (1987) Ph.D. Thesis, University of Basel. Picot, D., Sandmeier, E., Thaller, C., Vincent, M. G., Christen,
P., & Jansonius, J. N. (1991) Eur. J. Biochem. 196,329-341.
Malashkevich et al.
Read, R. J. (1986) Acta Crystallogr. A42, 14&149. Sandmeier, E., & Christen, P. (1982) J. Biol. Chem. 257,6745-
Smith, D. L., Almo, S. C., Toney, M. D., & Ringe, D. (1989)
Sterk, M., & Gehring, H. (1991) Eur. J. Biochem. 201, 703-
Tobler, H. P., Gehring, H., & Christen, P. (1987) J. Biol. Chem.
Toney, M. D., & Kirsch, J. F. (1987) J. Biol. Chem. 262,12403-
Toney, M. D., & Kirsch, J. F. (1991) J. Biol. Chem. 266,23900-
Tronrud, D. E., Ten Eyck, L. F., & Matthews, B. W . (1987) Acta
Wolfenden, R. (1974) Mol. Cell. Biochem. 3, 207-211. Ziak, M., JBger, J., Malashkevich, V. N., Gehring, H., Jaussi,
R., Jansonius, J. N., & Christen, P. (1993) Eur. J . Biochem. 21 1,475-484.
6750.
Biochemistry 28, 8161-8167.
707.
262, 8985-8989.
12405.
23903.
Crystallogr. A43, 489-501.