Embed Size (px)
Citation preview

CSE431 L04 Understanding Performance.1 Irwin, PSU, 2005
CSE 431 Computer Architecture
Fall 2005
Lecture 04: Understanding Performance
Mary Jane Irwin ( www.cse.psu.edu/~mji )
www.cse.psu.edu/~cg431
[Adapted from Computer Organization and Design,
Patterson & Hennessy, © 2005, UCB]

CSE431 L04 Understanding Performance.2 Irwin, PSU, 2005
Indeed, the cost-performance ratio of the product will depend most heavily on the implementer, just as ease of use depends most heavily on the architect.
The Mythical Man-Month, Brooks, pg 46

CSE431 L04 Understanding Performance.3 Irwin, PSU, 2005
Performance Metrics Purchasing perspective
given a collection of machines, which has the - best performance ?- least cost ?- best cost/performance?
Design perspective faced with design options, which has the
- best performance improvement ?- least cost ?- best cost/performance?
Both require basis for comparison metric for evaluation
Our goal is to understand what factors in the architecture contribute to overall system performance and the relative importance (and cost) of these factors

CSE431 L04 Understanding Performance.4 Irwin, PSU, 2005
Defining (Speed) Performance
Normally interested in reducing Response time (aka execution time) – the time between the start
and the completion of a task- Important to individual users
Thus, to maximize performance, need to minimize execution time
Throughput – the total amount of work done in a given time- Important to data center managers
Decreasing response time almost always improves throughput
performanceX = 1 / execution_timeX
If X is n times faster than Y, then
performanceX execution_timeY -------------------- = --------------------- = nperformanceY execution_timeX

CSE431 L04 Understanding Performance.5 Irwin, PSU, 2005
Performance Factors Want to distinguish elapsed time and the time spent on
our task
CPU execution time (CPU time) – time the CPU spends working on a task
Does not include time waiting for I/O or running other programs
CPU execution time # CPU clock cycles for a program for a program = x clock cycle
time
CPU execution time # CPU clock cycles for a program for a program clock rate = -------------------------------------------
Can improve performance by reducing either the length of the clock cycle or the number of clock cycles required for a program
or
CSE431 L04 Understanding Performance.6 Irwin, PSU, 2005
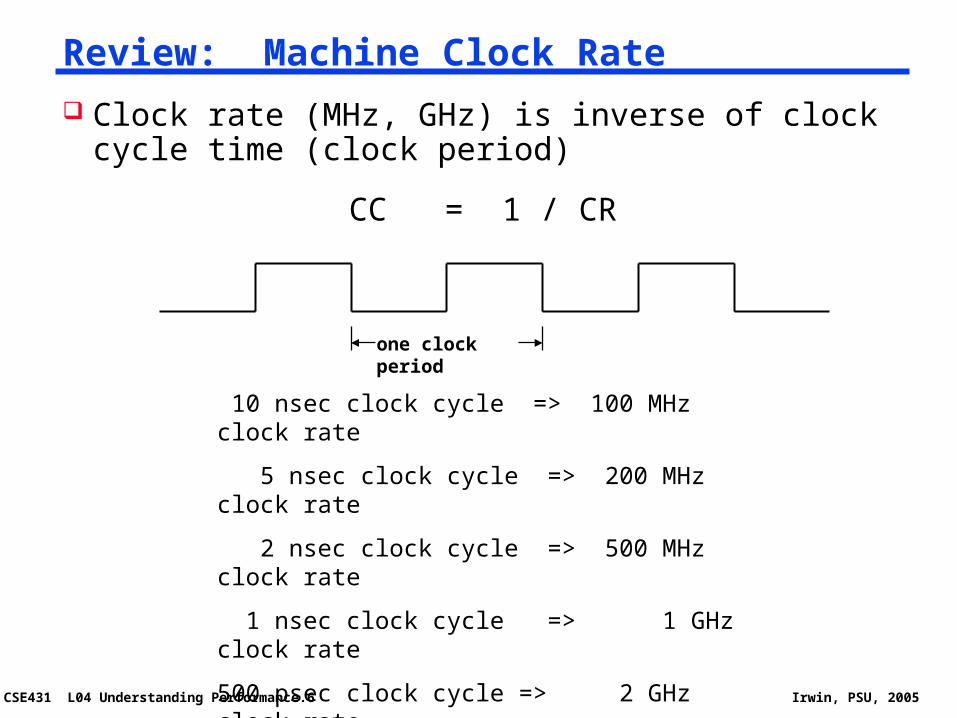
Review: Machine Clock Rate
Clock rate (MHz, GHz) is inverse of clock cycle time (clock period)
CC = 1 / CR
one clock period
10 nsec clock cycle => 100 MHz clock rate
5 nsec clock cycle => 200 MHz clock rate
2 nsec clock cycle => 500 MHz clock rate
1 nsec clock cycle => 1 GHz clock rate
500 psec clock cycle => 2 GHz clock rate
250 psec clock cycle => 4 GHz clock rate
200 psec clock cycle => 5 GHz clock rate

CSE431 L04 Understanding Performance.7 Irwin, PSU, 2005
Clock Cycles per Instruction Not all instructions take the same amount of time to
execute One way to think about execution time is that it equals the
number of instructions executed multiplied by the average time per instruction
Clock cycles per instruction (CPI) – the average number of clock cycles each instruction takes to execute
A way to compare two different implementations of the same ISA
# CPU clock cycles # Instructions Average clock cycles for a program for a program per instruction = x
CPI for this instruction class
A B C
CPI 1 2 3

CSE431 L04 Understanding Performance.8 Irwin, PSU, 2005
Effective CPI
Computing the overall effective CPI is done by looking at the different types of instructions and their individual cycle counts and averaging
Overall effective CPI = (CPIi x ICi)i = 1
n
Where ICi is the count (percentage) of the number of instructions of class i executed
CPIi is the (average) number of clock cycles per instruction for that instruction class
n is the number of instruction classes
The overall effective CPI varies by instruction mix – a measure of the dynamic frequency of instructions across one or many programs

CSE431 L04 Understanding Performance.9 Irwin, PSU, 2005
THE Performance Equation Our basic performance equation is then
CPU time = Instruction_count x CPI x clock_cycle
Instruction_count x CPI
clock_rate CPU time = -----------------------------------------------
or
These equations separate the three key factors that affect performance
Can measure the CPU execution time by running the program The clock rate is usually given Can measure overall instruction count by using profilers/
simulators without knowing all of the implementation details CPI varies by instruction type and ISA implementation for which
we must know the implementation details
CSE431 L04 Understanding Performance.11 Irwin, PSU, 2005
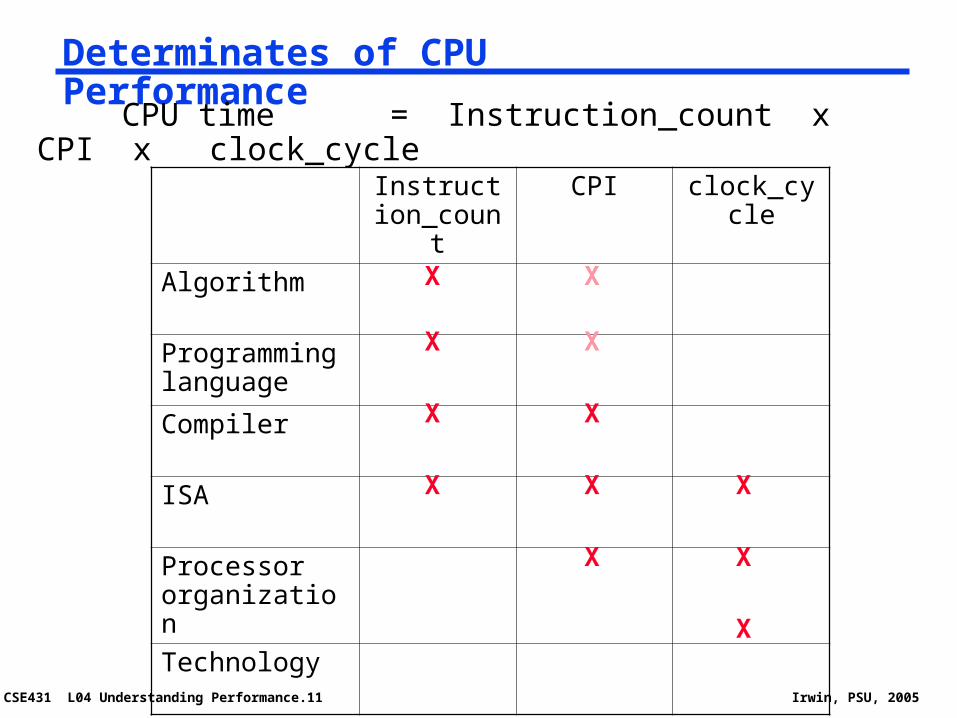
Determinates of CPU Performance
CPU time = Instruction_count x CPI x clock_cycle
Instruction_count
CPI clock_cycle
Algorithm
Programming language
Compiler
ISA
Processor organization
TechnologyX
XX
XX
X X
X
X
X
X
X

CSE431 L04 Understanding Performance.13 Irwin, PSU, 2005
A Simple Example
How much faster would the machine be if a better data cache reduced the average load time to 2 cycles?
How does this compare with using branch prediction to shave a cycle off the branch time?
What if two ALU instructions could be executed at once?
Op Freq CPIi Freq x CPIi
ALU 50% 1
Load 20% 5
Store 10% 3
Branch 20% 2
=
.5
1.0
.3
.4
2.2
CPU time new = 1.6 x IC x CC so 2.2/1.6 means 37.5% faster
1.6
.5
.4
.3
.4
.5
1.0
.3
.2
2.0
CPU time new = 2.0 x IC x CC so 2.2/2.0 means 10% faster
.25
1.0
.3
.4
1.95
CPU time new = 1.95 x IC x CC so 2.2/1.95 means 12.8% faster

CSE431 L04 Understanding Performance.14 Irwin, PSU, 2005
Comparing and Summarizing Performance
Guiding principle in reporting performance measurements is reproducibility – list everything another experimenter would need to duplicate the experiment (version of the operating system, compiler settings, input set used, specific computer configuration (clock rate, cache sizes and speed, memory size and speed, etc.))
How do we summarize the performance for benchmark set with a single number?
The average of execution times that is directly proportional to total execution time is the arithmetic mean (AM)
AM = 1/n Timeii = 1
n
Where Timei is the execution time for the ith program of a total of n programs in the workload
A smaller mean indicates a smaller average execution time and thus improved performance

CSE431 L04 Understanding Performance.15 Irwin, PSU, 2005
SPEC Benchmarks www.spec.org
Integer benchmarks FP benchmarks
gzip compression wupwise Quantum chromodynamics
vpr FPGA place & route swim Shallow water model
gcc GNU C compiler mgrid Multigrid solver in 3D fields
mcf Combinatorial optimization applu Parabolic/elliptic pde
crafty Chess program mesa 3D graphics library
parser Word processing program galgel Computational fluid dynamics
eon Computer visualization art Image recognition (NN)
perlbmk perl application equake Seismic wave propagation simulation
gap Group theory interpreter facerec Facial image recognition
vortex Object oriented database ammp Computational chemistry
bzip2 compression lucas Primality testing
twolf Circuit place & route fma3d Crash simulation fem
sixtrack Nuclear physics accel
apsi Pollutant distribution

CSE431 L04 Understanding Performance.16 Irwin, PSU, 2005
Example SPEC Ratings

CSE431 L04 Understanding Performance.17 Irwin, PSU, 2005
Other Performance Metrics Power consumption – especially in the embedded market
where battery life is important (and passive cooling) For power-limited applications, the most important metric is
energy efficiency

CSE431 L04 Understanding Performance.18 Irwin, PSU, 2005
Summary: Evaluating ISAs Design-time metrics:
Can it be implemented, in how long, at what cost? Can it be programmed? Ease of compilation?
Static Metrics: How many bytes does the program occupy in memory?
Dynamic Metrics: How many instructions are executed? How many bytes does the
processor fetch to execute the program? How many clocks are required per instruction? How "lean" a clock is practical?
Best Metric: Time to execute the program!
CPI
Inst. Count Cycle Timedepends on the instructions set, the processor organization, and compilation techniques.

CSE431 L04 Understanding Performance.19 Irwin, PSU, 2005
Next Lecture and Reminders Next lecture
MIPS non-pipelined datapath/control path review- Reading assignment – PH, Chapter 5
Reminders HW1 due September 13th Evening midterm exam scheduled
- Tuesday, October 18th , 20:15 to 22:15, Location 113 IST
- Please let me know via email ASAP if you have a conflict