Embed Size (px)
Citation preview
CSPBankability Project Report
Draft for an
Appendix L – Local Site Conditions
to the SolarPACES Guideline for
Bankable STE Yield Assessment
Document prepared by the project CSPBankability funded by the German Federal Ministry Economic Affairs and Energy under contract No. 0325293
CSPBankability Project Report Draft for an Appendix L –Local Site Conditions to the SolarPACES Guideline for Bankable STE Yield Assessment
Page: 2
Document properties
Title CSPBankability Project Report Draft for an Appendix L – Local Site Conditions
Editor Tobias Hirsch (DLR)
Author Richard Meyer (Suntrace)
Contributing authors
Thomas Schmitt (Fichtner) Martin Alber (Fichtner) Thomas Grieser Fichtner) Enver Yildiz (Fichtner) Olaf Goebel (University of applied Science Hamm-Lippstadt) Marko Schwandt (Suntrace) Jana Müller (Suntrace)
Date January 9, 2017
CSPBankability Project Report Draft for an Appendix L –Local Site Conditions to the SolarPACES Guideline for Bankable STE Yield Assessment
Page: 3
Index of contents
Document properties ..................................................................................................................... 2
L. Local conditions ....................................................................................................................... 4 L.1. Natural hazards ........................................................................................................................ 4 L.1.1. Precipitation and floodings .................................................................................................... 5 L.1.2. Hail and snow ......................................................................................................................... 7 L.1.3. Wind . .............................................................................................................................. 7 L.1.4. Lightning . ....................................................................................................................... 8 L.1.5. Earthquakes . .................................................................................................................. 8 L.1.6. Volcanic eruptions ............................................................................................................... 10 L.1.7. Wild fires .............................................................................................................................. 11 L.1.8. Sand storms ......................................................................................................................... 11 L.2. Further environmental site conditions .................................................................................. 12 L.2.1. Soiling conditions ................................................................................................................. 12 L.2.2. Topography .......................................................................................................................... 13 L.2.3. Geotechnical subsoil conditions .......................................................................................... 14 L.2.4. Corrosive conditions ............................................................................................................ 16 L.2.5. Environmental and social Impacts ....................................................................................... 17 L.3. Infrastructure ......................................................................................................................... 17 L.3.1. Transportation infrastructure/Road connection ................................................................. 17 L.3.2. Fuel supply ........................................................................................................................... 18
L.3.2.1. Fuel unloading ...................................................................................................... 18 L.3.2.2. Fuel storage .......................................................................................................... 19 L.3.2.3. Fuel distribution ................................................................................................... 19
L.3.3. Chemicals, lubricants and technical gases ........................................................................... 19 L.3.4. Security issues ...................................................................................................................... 20 L.3.5. Housing compound .............................................................................................................. 21 L.4. References ............................................................................................................................. 22
List of figures ............................................................................................................................... 23
CSPBankability Project Report Draft for an Appendix L –Local Site Conditions to the SolarPACES Guideline for Bankable STE Yield Assessment
Page: 4
L. Local conditions
This appendix includes a compilation of local conditions that do have impact on the economic evaluation of a project. Most of them are not directly relevant for a technical yield calculation but influence the CAPEX and OPEX of the plant. The intention of this document is to make the reader sensitive for impacts of unfavorable local side conditions that cause extraordinary installation or operation costs. If available, approaches to assess possible risks and to estimate extra costs are provided in the respective sections. We distinguish between natural hazards, other environmental site conditions and infrastructure aspects.
L.1. Natural hazards
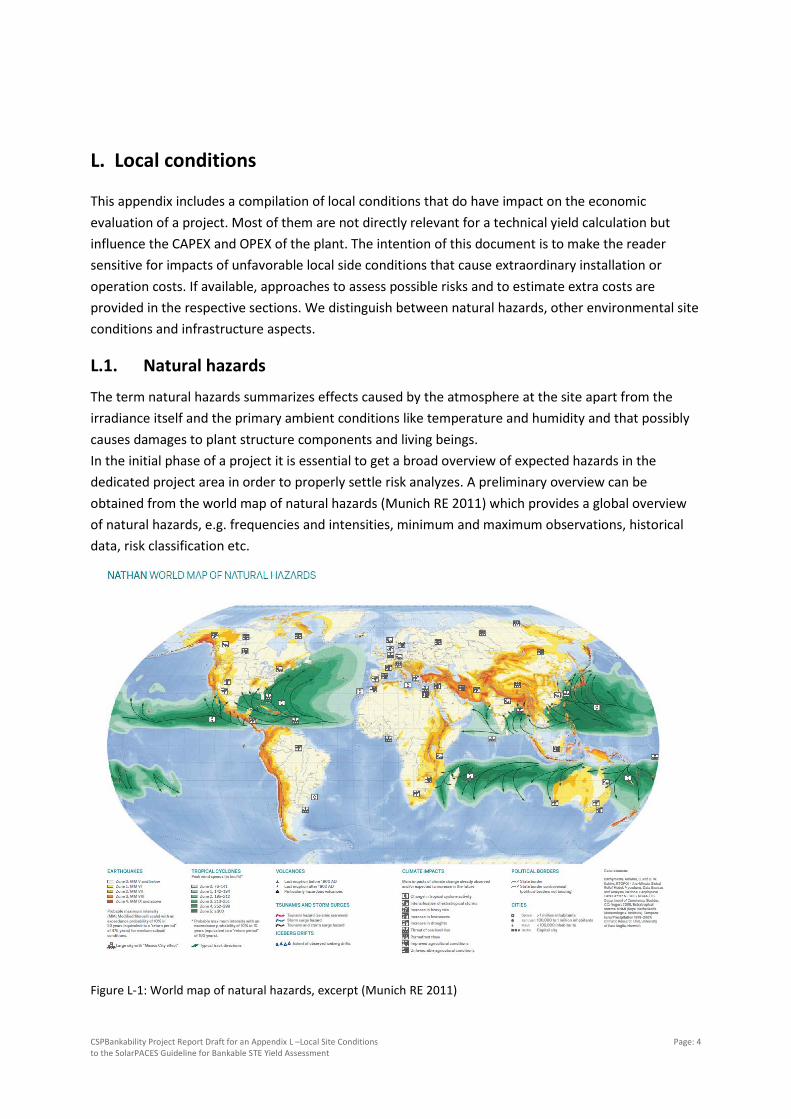
The term natural hazards summarizes effects caused by the atmosphere at the site apart from the irradiance itself and the primary ambient conditions like temperature and humidity and that possibly causes damages to plant structure components and living beings. In the initial phase of a project it is essential to get a broad overview of expected hazards in the dedicated project area in order to properly settle risk analyzes. A preliminary overview can be obtained from the world map of natural hazards (Munich RE 2011) which provides a global overview of natural hazards, e.g. frequencies and intensities, minimum and maximum observations, historical data, risk classification etc.
Figure L-1: World map of natural hazards, excerpt (Munich RE 2011)
CSPBankability Project Report Draft for an Appendix L –Local Site Conditions to the SolarPACES Guideline for Bankable STE Yield Assessment
Page: 5
Identified types of natural hazards should be carefully classified and quantified according to international standards and practices as part of the project specifications. Based on the climate and reference site conditions all the engineering and pricing will be done, which means that any failures in the statement of reference design conditions can lead to immense technical, commercial and legal issues.
L.1.1. Precipitation and floodings
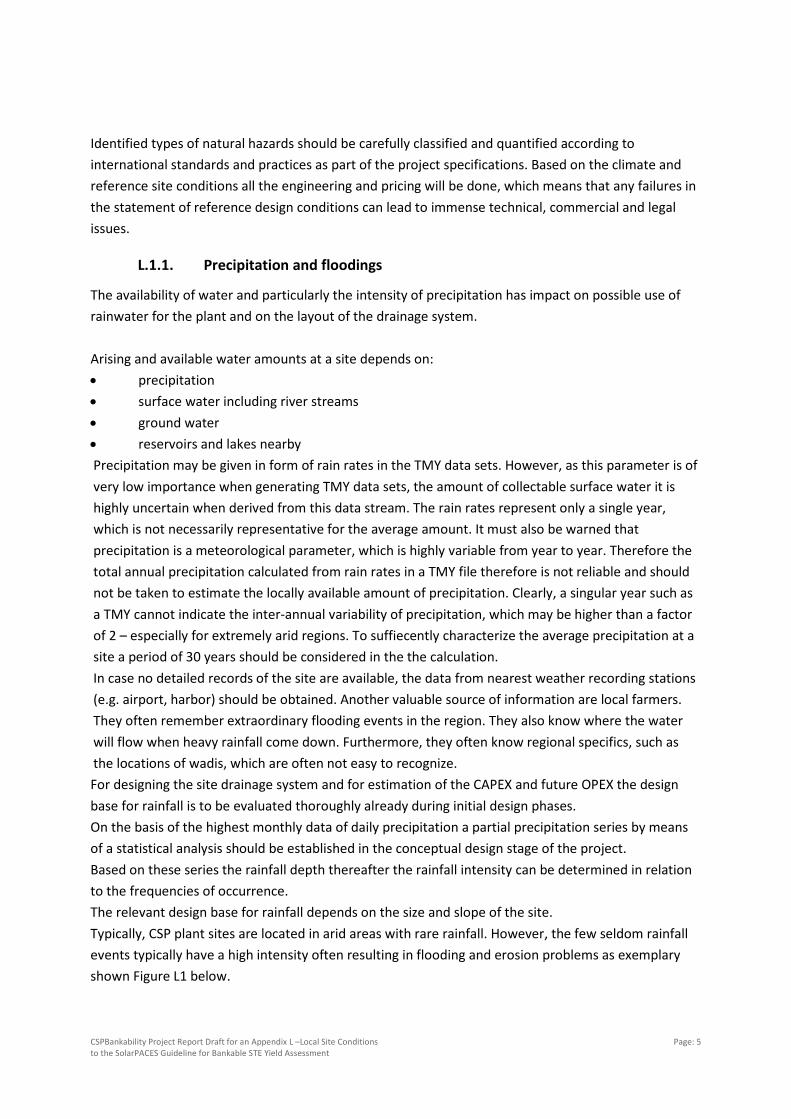
The availability of water and particularly the intensity of precipitation has impact on possible use of rainwater for the plant and on the layout of the drainage system. Arising and available water amounts at a site depends on: • precipitation • surface water including river streams • ground water • reservoirs and lakes nearby Precipitation may be given in form of rain rates in the TMY data sets. However, as this parameter is of very low importance when generating TMY data sets, the amount of collectable surface water it is highly uncertain when derived from this data stream. The rain rates represent only a single year, which is not necessarily representative for the average amount. It must also be warned that precipitation is a meteorological parameter, which is highly variable from year to year. Therefore the total annual precipitation calculated from rain rates in a TMY file therefore is not reliable and should not be taken to estimate the locally available amount of precipitation. Clearly, a singular year such as a TMY cannot indicate the inter-annual variability of precipitation, which may be higher than a factor of 2 – especially for extremely arid regions. To suffiecently characterize the average precipitation at a site a period of 30 years should be considered in the the calculation. In case no detailed records of the site are available, the data from nearest weather recording stations (e.g. airport, harbor) should be obtained. Another valuable source of information are local farmers. They often remember extraordinary flooding events in the region. They also know where the water will flow when heavy rainfall come down. Furthermore, they often know regional specifics, such as the locations of wadis, which are often not easy to recognize. For designing the site drainage system and for estimation of the CAPEX and future OPEX the design base for rainfall is to be evaluated thoroughly already during initial design phases. On the basis of the highest monthly data of daily precipitation a partial precipitation series by means of a statistical analysis should be established in the conceptual design stage of the project. Based on these series the rainfall depth thereafter the rainfall intensity can be determined in relation to the frequencies of occurrence. The relevant design base for rainfall depends on the size and slope of the site. Typically, CSP plant sites are located in arid areas with rare rainfall. However, the few seldom rainfall events typically have a high intensity often resulting in flooding and erosion problems as exemplary shown Figure L1 below.
CSPBankability Project Report Draft for an Appendix L –Local Site Conditions to the SolarPACES Guideline for Bankable STE Yield Assessment
Page: 6
Figure L-2: Flooding of power plant construction site on Arabian Peninsula in November 2013 (Source: Fichtner).
To avoid capital losses or worse endangering health or physical conditions, the drainage system is to be designed adequately to cope with the expected rainfall. The intensity of the rainfall and the slope of the site have a major influence on the costs. The higher the rainfall intensity the more the drainage system costs increase. For the slope it is vice versa. In case of a gentle slope of the whole site, the drainage ducts do not require to be buried too deep but can follow the natural slope and therefore are less expensive. For a completely flat site, the drainage ducts need to be built with an appropriate slope which in turn can cause additional costs. The operational expenditures can vary significantly depending on the required drainage system. In sandy and dusty areas with few but intense rainfall events, for example, the drainage system is to be kept free of obstacles to ensure proper drainage system function. This requires a considerable amount of manpower and flushing water. In case the flatness of the terrain requires lifting stations to dispose the storm water, both the investment costs and operational expenditures will increase. Basically, the drainage system is designed to compensate the precipitation within the site. In case of dedicated storm water conveyed from areas outside the site, the main ducts need to be increased. Flooding can either occur due to storm water falling within the plant area, which can be tackled with a proper designed, executed and maintained drainage system, or from external areas. Possible sources of flooding from external areas are: • rising sea water (temporary by storm or tsunami or permanent due to global warming), • rising river levels or
CSPBankability Project Report Draft for an Appendix L –Local Site Conditions to the SolarPACES Guideline for Bankable STE Yield Assessment
Page: 7
• sudden rising water levels in normally dry river beds (Wadi). The latter one, Wadi flooding, is the most probable external flooding threat. In case of possible Wadi flooding a hydrologic and hydraulic analysis should be performed to assess the flooding risk. The initial costs for hydrologic and hydraulic analysis is around 100,000 to 200,000 EUR and the preparation takes approx. a quarter up to half a year. At least the following data are required for such a study: • measured flow data series in and nearby Wadis • measured rainfall data series in the drainage area in and nearby Wadis • historical hydrological studies of the area, if available • topographical data of the project area including drainage area of the concerned Wadis, if available • if ground survey data are not available, then satellite data (e.g. from GeoEYE satellite) should be
purchased to extract the topographical information of the area. The accuracy of the data should be increased by means of available ground survey data, if applicable.
The outcome of the analysis will indicate the location and magnitude of possible Wadis. Protective measures such as dikes to detour the Wadi or embankments to safely route the Wadi through the site can be applied. Normally, the costs for such measures are in the range between 100,000 up to single digit million EUR, depending on the involved efforts.
L.1.2. Hail and snow
In case of a CSP plant, hail can affect the solar collectors due to the breakage of mirrors. As it is the case for other already described environmental conditions, an assessment of available data is recommendable. If the frequency of occurrence and intensity of hail storms is known, the capability of the mirrors must be reviewed with regard to hail survival parameters such as bearable hail diameters and speed. For this purpose some specifications and standards are available, originally for PV and CPV modules but also applicable to a certain extent for the hail survival testing of mirrors for CSP (e.g. EN 62108, CEC specification 503 etc.). On some CSP sites, especially in high altitude locations, occasional snow is observed. In the past, snow events occured for example on CSP plants located in Spain. Besides performance and thereby profit losses due to covering of mirror panels, significant loads can arise from snow deposited on the system structure. Frequency, intensity and duration of snow events should be assessed beforehand by evaluating meteorogical data sets in order to consider possible impacts in the performance estimation and in an appropriate structure design.
L.1.3. Wind .
Depending on the wind observations at the site location and region where the site will be located, different protective measures can be required, especially for the solar field components which are
CSPBankability Project Report Draft for an Appendix L –Local Site Conditions to the SolarPACES Guideline for Bankable STE Yield Assessment
Page: 8
mostly affected by high winds. To ensure safety and adequate availability of the collectors, wind measurements need to be carefully assessed and if needed, further measurements should be performed. Major components which are determining the wind load durability of the solar field are: • wind breaker/fence • collector structures • collector foundations • collector tracking system (positioning into stow position) In different projects it has been observed that underestimating wind conditions can lead to extensive rework of collectors and project delays due to damage and accidence which result in additional costs and further consequences. As soon as wind measurement assessments have been performed, the design criteria must be clearly defined in the specifications, e.g. collector survival wind speed, to ensure that the basis of design from the bidders(s)/contractor(s) takes these criteria into account.
L.1.4. Lightning .
Lightning potentially causes damage to a structure (including all incoming electrical overhead and buried lines connected to the structure) or damage to a service (part of telecommunications, data, power, water, gas and fuel distribution networks). Damage to a structure can be injury of living beings due to step and touch voltages, physical damage (explosion, fire, mechanical destruction, chemical release), or failure of internal systems due to Lightning Electromagnetic Impulse (LEMP). To control this risk resulting from lightning strokes, a risk analysis according to IEC 62305 is necessary, which takes general but also project specific parameters like lightning flash density at project site and plant layout into consideration. Result of this risk assessment are the lightning protection measures necessary to achieve a previously defined tolerable risk. Apart from the technical point of view, other stakeholders like banks, developers and also insurance companies might have their own, additional requirements in this regard. If required by the project specific risk analysis or by an involved party as mentioned before, the plant has to be protected by an external (air terminations, down conductors etc.) and internal (equipotential bonding, surge protective devices etc.) lightning protection system, which would consequently increase both investment and operation and maintenance costs of the project.
L.1.5. Earthquakes .
In order to assess the expected costs for earthquake-safe design of the CSP plant, the seismic design base must be defined.
CSPBankability Project Report Draft for an Appendix L –Local Site Conditions to the SolarPACES Guideline for Bankable STE Yield Assessment
Page: 9
In general, several parameters are used to characterize seismicity: • intensity and magnitude • ground acceleration and response spectrum at the site • design base acceleration for foundations/structures and for equipment The intensity describes the effect of an earthquake at the surface and is classified/categorized with several different scales, e.g. Mercalli scale with 12 grades (I-XII). Basically, the intensity depends on the depth of and distance to the epicenter. The magnitude, on the other hand, represents the released energy and is derived from seismograph records. The Richter scale defines the dimension of the magnitude. Both intensity and magnitude cannot be used for the design directly. The maximum ground acceleration at a site depends on: • Geographical location and/or local building code requirements • Subsoil conditions/soil profile category • Weighing and importance factor • Owner specific defined requirements The design base acceleration for foundations/structures and equipment is determined by: • Ground acceleration and response spectrum at the site • Type of used structures and material • Type of equipment and elevation • National building code requirements • Owner specific defined requirements It is to be noted that the national building and seismic codes specify safety and protection of life and physical condition, not the protection measures for capital investment. In addition to the national building and seismic codes, following information must be assessed for the determination of relevant earthquake zones: • World Map of Natural Hazards (Munich RE 2011) • Uniform Building Code (UBC)
Includes seismic zones for various cities and regions worldwide, however only for initial rough classification
• Geotechnical soil investigation report Final and binding earthquake zone/ground acceleration to be defined
CSPBankability Project Report Draft for an Appendix L –Local Site Conditions to the SolarPACES Guideline for Bankable STE Yield Assessment
Page: 10
The major issue to be taken into account with regard to seismic design is the possible horizontal force on the structure. The vertical effect must mainly be considered in higher earthquake zones. In lower earthquake zones, e.g. zones 0 to 1 and partly zone 2, the effective horizontal forces to be respected are less than the effective horizontal forces resulting from high wind loads. Soil liquefaction is another risk to be considered with regard to plant design. In the event of soil liquefaction, stresses caused by earthquakes or other forces lead to quasi-liquid movement of saturated soil which in turn results in structural strength and stiffness losses. A soil liquefaction safe design in case of a CSP plant to be located in a possibly affected area requires expensive soil exchange or deeply piled foundations. Observations on natural ground in earthquake regions of different countries showed that in most areas suffering liquefaction hazard, the groundwater table is not deeper than 3m. A few hazards occurred in case of groundwater table of 3 to 4 m below surface. Almost no liquefaction has been observed for areas with water table deeper than 5 m from the surface (Soil Manual Chapter 7/ Civil Engineering).
L.1.6. Volcanic eruptions
Hazards related to the eruption of volcanos can damage the structures of a plant or can affect the solar collectors due to breakage of mirrors by fragments of volcanic rock carried up by hot gasses. Today, there are about 1500 potentially active vulcanos wordwide, but only 500 have erupted in historical time and less are currently active and may affect a plant directly. The hazards associated with eruptions that can endanger nearby sites with ground-based and atmospheric hazards are:
• Debris flows – slurries of muddy debris and water • Tephra – ash, fragments and rocks blown apart by gas explosions • Pyroclastic surges – turbulent and hot clouds • Gas release during interruptions • Earthquakes
The geographical coverage and the danger of local eruptions to a plant are strongly depending on the strength and type of an imminent eruption. Powerful explosive eruption can drastically alter the environment and damage buildings around a volcano, but small eruptions that emit ash or sulphur aerosols can change the atmospheric conditions temporarily. Differentiating the danger of local eruptions, which directly may affect the plant and very large volcanic eruptions, which have a Volcanic Explosivity Index (VEI) of at least 5 to relevant show worldwide effects. Only very few VEI ≥ 5 events are usually observed. Based on the time-series of Sato (1993) only about 1 to 2 VEI ≥ 5 events occur within a century. A large volcanic eruption like the pinatubo eruption in June 1991 may decrease, over a large portion of the earth, the direct beam solar
CSPBankability Project Report Draft for an Appendix L –Local Site Conditions to the SolarPACES Guideline for Bankable STE Yield Assessment
Page: 11
radiation by 25% and the global solar radiation by nearly 10% for 6 months to 2 years. As the volcanic ash falls out of the atmosphere, the effect is diminished, but complete removal of the volcanic ash may take several years. However, as there can be more intense volcanic periods such as the 20th century when there occurred a total of 10 such VEI ≥ 5 events:
• Santa Maria (1903-1904) • Shtyubelya (1907) • Katmai (1912) • Quizapou (1932) • Tambora (1967) • Gunung Agung (1963) • St. Helens (1980) • El Chichon (1982) • Pinatubo (1991) • Hudson (1991)
Information about current volcanic activities worldwide can be obtained from The Michigan Technological University, who aims to provide scientific and educational information that can lead to hazard mitigation: http://www.geo.mtu.edu/volcanoes/world.html
L.1.7. Wild fires
CSP plants usually are built in dry areas. If this is not in very arid regions, which hardly show relevant amounts of biomass, CSP areas can be situated within regions where wild fires can occur. As wild fires are caused by a combination of factors such as high temperatures, drought conditions after a period of vegetation growth and triggered by human interaction or lightning, they can occur on every continent. It should be considered that wild fires have a high influence on the direct normal irradiance at a site and can lower the performance of a plant for many days. The daily total direct direct normal irradiance was estimated to be only 63% of that on a clear day [Hulstrom 1990] To estimate the risk for such fires it is recommended to first study the local historical documents, which might give indications on the repetition rate of severe bush fires in the region. If such historic sources are not available over a long time period, which should be at least cover one century, the alternate approach could be to estimate the biomass index based on remote sensing data.
L.1.8. Sand storms
Considering the fact that today more and more CSP plants are being implemented in desert or very dry regions such as in the MENA region, it is to be noted that in some of the regions severe sand storms may occur. Accordingly the potential impact of sand storms must be taken into account at an early
CSPBankability Project Report Draft for an Appendix L –Local Site Conditions to the SolarPACES Guideline for Bankable STE Yield Assessment
Page: 12
stage when implementing the project. It has been observed that e.g. on the Arabian Peninsula in the summer period a sand storm can last up to one month. Besides the negative impact on the DNI level, the consequences for structures, components and especially collectors may be significant if not properly assessed during the engineering, design and procurement stage. Equipment damages andwear of mentioned components can lead to loss of profit, threaten health and safety, reduce component lifetimes and cause high maintenance costs, particularly for the solar field due to potential mirror replacement and cleaning.
L.2. Further environmental site conditions
L.2.1. Soiling conditions
The soiling conditions of a site are basically determining the performance and cleaning water demand of the solar field (see also Appendix I ) by decreasing the cleanliness of the collector mirrors and absorber tubes. As this decrease has a direct impact on the thermal system performance and thus in the performance of the CSP plant, the soiling conditions must be carefully assessed. For quantification purposes, the soiling rate at a site, i.e. degree of cleanliness decrease, is expressed as a percentage with reference to the actual cleanliness of the mirrors which can be assumed as approx. 97% for a new and clean mirror. The factors mainly influencing the soiling rate can be summarized as follows: • Time of the year
Soiling conditions can vary in the course of the year due to changing seasonal effects. • Frequency of rainfall
In principle, rainfall can be considered as natural washing mechanism for the collectors. However, rain can also lead to higher soiling when washing aerosols out of the atmosphere, especially in dusty areas with high aerosol load in the atmosphere and with low rainfall frequency. The frequency of rainfall also directly influences the dust in the air.
• Dust in the air The dustiness of a site is mostly driven by the proximity of the solar collectors to: • Roads
The proximity to highly frequented roads leads to higher soiling due to exhaust gases and whirled up dust.
• Other sources of airborne particulates such as conventional power plants, factories, etc. • Power block equipment within the CSP plant such as auxiliary heaters, ACCs or cooling towers
etc. • Cleaning strategy (see Appendix H for further information) As an example, the soiling rate in Spain amounts in average to 0.40%/day. This would mean that the cleanliness, considering a reference mirror cleanliness factor of 97%, after two (2) days would
CSPBankability Project Report Draft for an Appendix L –Local Site Conditions to the SolarPACES Guideline for Bankable STE Yield Assessment
Page: 13
decrease to approx. 0.97*(1-0.0040)²*100%=96.22%. For other regions, such as the Arabian Peninsula, higher soiling rates can be expected.
L.2.2. Topography
The topography of the site has a major impact on the project development. A topographic survey is required to develop the plant layout, as well as to design all activities in relation with the site, such as rain and sewage drain-off of the site, excavation and site leveling etc. In addition to the site analysis, the survey must also cover the surrounding area, e.g. temporary laydown area for construction, main access road from nearest public road, water pipe routing to terminal point, high voltage underground cable and/or overhead transmission line routing to terminal point and other close facilities to which an interface with the plant must be developed. The topographic survey map shall comprise the existing site levels for all areas of the plant on a ten (10) to twenty (20) meter grid and resulting contour lines at around 0.50 m vertical intervals. The results of the survey shall be made available in CAD format in order to allow assessment of leveling / terracing efforts. A plant site with a flat terrain having a gentle slope between 0.5 and 2% can be considered as ideal case of topology since it eases drainage. Any increase in the overall slope and/or unevenness (small valleys and hills) will increase the degree of leveling / cut-and-fill required and thus will increase the site preparation costs. Amongst others, the overall leveling/cut and fill costs of the site depend on the following: • overall slope of site • unevenness of site • different spacing requirements for different CSP technologies (depending on the slope and the
shadowing effect of neighboring elements, the distances between collectors have to be increased and thus the overall required area for the plant will increase).
• subsoil conditions (e.g. the more solid the subsoil, the more expensive the leveling) • usability of the cut soil for filling purposes ( e.g. in case of disposal of the cut soil, the cut-and-fill
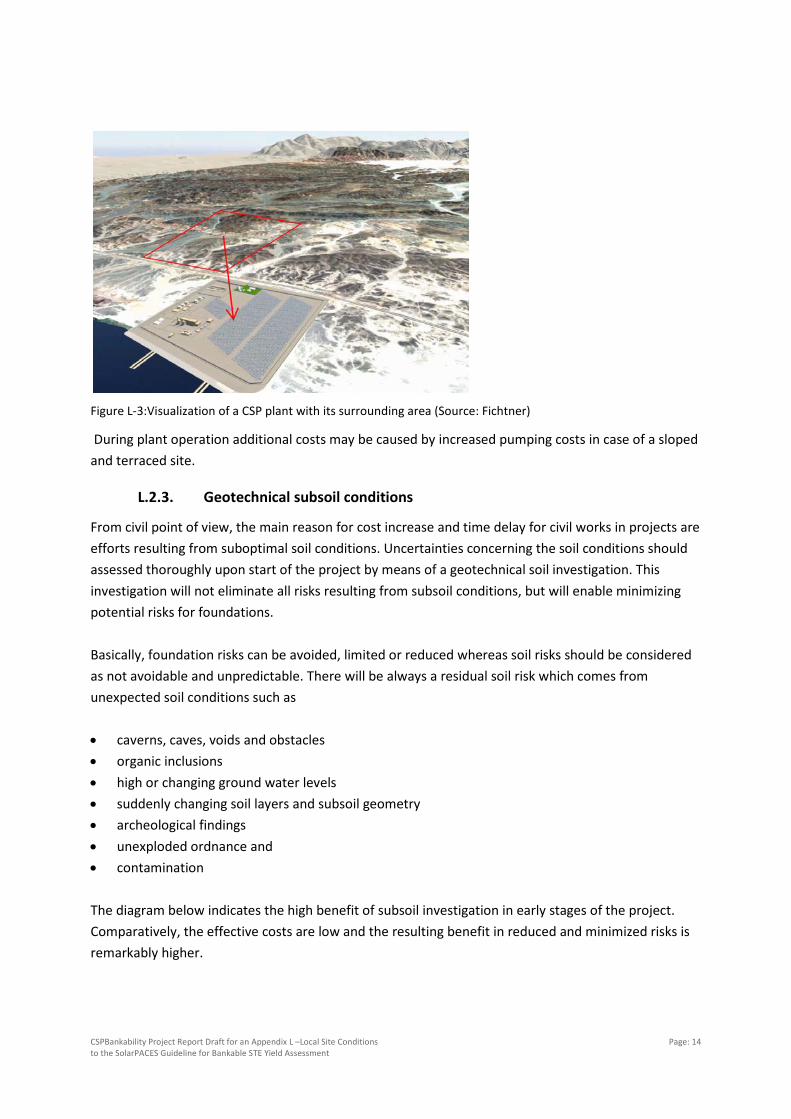
price have to be multiplied) In addition to the above, the effect of flooding risk due to nearby Wadi or waters and potential rock fall / slide from neighboring mountains must be taken into account. The picture below shows an example of a CSP plant site planning. The plant site was shifted to the foreground due to unevenness/hilly areas in the background, where the plant location was initially planned.
CSPBankability Project Report Draft for an Appendix L –Local Site Conditions to the SolarPACES Guideline for Bankable STE Yield Assessment
Page: 14
Figure L-3:Visualization of a CSP plant with its surrounding area (Source: Fichtner)
During plant operation additional costs may be caused by increased pumping costs in case of a sloped and terraced site.
L.2.3. Geotechnical subsoil conditions
From civil point of view, the main reason for cost increase and time delay for civil works in projects are efforts resulting from suboptimal soil conditions. Uncertainties concerning the soil conditions should assessed thoroughly upon start of the project by means of a geotechnical soil investigation. This investigation will not eliminate all risks resulting from subsoil conditions, but will enable minimizing potential risks for foundations. Basically, foundation risks can be avoided, limited or reduced whereas soil risks should be considered as not avoidable and unpredictable. There will be always a residual soil risk which comes from unexpected soil conditions such as • caverns, caves, voids and obstacles • organic inclusions • high or changing ground water levels • suddenly changing soil layers and subsoil geometry • archeological findings • unexploded ordnance and • contamination The diagram below indicates the high benefit of subsoil investigation in early stages of the project. Comparatively, the effective costs are low and the resulting benefit in reduced and minimized risks is remarkably higher.

CSPBankability Project Report Draft for an Appendix L –Local Site Conditions to the SolarPACES Guideline for Bankable STE Yield Assessment
Page: 15
Figure L-4: Exemplary cost-risk-benefit analysis for soil investigations
The geotechnical soil investigation report is an essential part of the contract. This report defines the risks to be taken by the contractor(s). Normally, the contractor(s) bear at least the foundation risks. In some cases, the complete soil risks are transferred to the contractor(s). For project development purposes it is recommended to execute detailed geotechnical soil investigations in order to allow the contractor(s)/bidder(s) to estimate the costs and risks accurately. As a result, the owner(s)/developer(s) will have the following advantages: • reduced bid price because risk surcharges can be reduced by the bidder • transfer of the soil and/or foundation risk(s) to the contractor(s) • avoiding potential claims from the contractor(s) at a later project stage and • ensure comparability of bids For the overall foundation costs of the whole CSP plant, the foundation costs of the solar collectors are the governing ones. In case of less allowable soil bearing capacity, the costs will increase remarkably. Further, for cost estimation purposes, the soil category/rock class for excavation works must be considered, e.g. the higher the rock classification is the more expenditures need to be expected for drilling etc. It is therefore important to have sound information about the first few meters of the subject subsoil. The geotechnical soil investigation report shall include at least • all methods and systems used • all works carried out (field investigation and laboratory tests) • conclusions and recommendations
• position of the bearing layers, as well as the bearing capacity and the depth of the groundwater level
Foundation Caverns / Caves Contamination
Cost - Risk - Benefit Analysis
cost for investigations minimizing riskCAPEX
CSPBankability Project Report Draft for an Appendix L –Local Site Conditions to the SolarPACES Guideline for Bankable STE Yield Assessment
Page: 16
• admissible bearing pressures of different types and dimensions of single and raft foundations • type and engineering values of proposed pile foundations • recommendations for soil improvement methods including necessary explanations for
execution of these works • geotechnical restrictions of earth works (cut-and-fill, slopes, etc.) • clear recommendations for the design of foundations and foundation types to be used on the
basis of results of in-situ investigations and from laboratory tests • layout location plan of soil investigation • logs and tables and • soil profiles
L.2.4. Corrosive conditions
Steel structures exposed to sea water, sea water spray or other high corrosive atmospheres suffer high corrosion. This in turn reduces drastically the lifetime of the steelwork. If the environment is additionally hot and humid, the corrosion effect will increase remarkably. Considering a large solar field with its numerous collectors, this aspect is of high importance and must therefore be carefully assessed in the course of the project development stage so that it can be taken into consideration in the proposal, engineering and procurement stages. This would reduce the risk of future corrosion problems, thus reduce the loss of performance and profits over the lifetime of the plant. Depending on the exposure category, the steelwork is either to be made of stainless steel, equipped with cathodic protection, has to be hot-dip galvanized and/or epoxy coated. These measures will significantly increase both the investment and operation and maintenance costs (e.g. re-coating every 5 to 10 years). In regions with highly corrosive soil conditions, e.g. Sabkha areas, there is a risk of corrosion to r.c. foundations due to high chloride content of the soil and consequently increased measures are required to prevent corrosion, e.g. by means of tanking of all underground structures, applying high-quality concrete mixes, using coated rebars etc. As an example, at almost all shoreline sites of the Arabian Peninsula the above mentioned measures are required. As a consequence of the poor and corrosive soil conditions, in most cases soil must be exchanged or soil and foundation improvement methods must be applied for proper foundation design and work execution. Such conditions may be acceptable for conventional power plants with limited site dimensions. However, for CSP plants with large solar fields, sites with such corrosive and poor soil conditions should be excluded as potential sites upon thorough investigations.
CSPBankability Project Report Draft for an Appendix L –Local Site Conditions to the SolarPACES Guideline for Bankable STE Yield Assessment
Page: 17
L.2.5. Environmental and social Impacts
Potential environmental and social effects of power plant projects need to be systematically identified and assessed as part of the Environmental and Social Impact Assessment (E&SIA) process. In case potential negative impacts are identified at early project development stages, preventive measures can be initiated. This would allow project developers/investors to reduce subject environmental and social risks as well as additional future costs, project delays or cancellation. The E&SIA process is a means of ensuring efficient project implementation with regard to both financial and economical aspects. It must be taken into account that the preparation of the E&SIA can take several months. The same applies to the permitting/licensing process which comprises also the E&IA. Accordingly, the corresponding time, manpower and license fees etc. need to be included in the project planning. Guidelines and rules for E&SIAs are made available through institutions such as the World Bank, Kreditanstalt für Wiederaufbau (KfW) or the European Community. Local regulations should be thoroughly checked as well when performing E&SIAs as in some countries further requirements can apply.
L.3. Infrastructure
L.3.1. Transportation infrastructure/Road connection
Very often, CSP plants are located in remote areas, wherefore both the road condition from the closest unloading facility for heavy as well as sensitive equipment to the site and from the CSP plant to the closest residential area are of high importance. As a minimum, following conditions should be thoroughly investigated: • nearest unloading facility, unloading capacity and possible seasonal restrictions • road length from unloading facility to site • load bearing capacity of transportation route for heavy equipment, especially of existing bridges • clear width and height of transportation road for large equipment • restrictions of road usage (e.g. no transportation during night, required permits, flooding danger
either during rainy season or blockage by Wadi flooding, military restriction, tribal area, escort services etc.)
In case one or more of the conditions above are insufficient, an increase in the investment costs and a delay in project implementation schedule will be caused, e.g. for rehabilitation of bridges, building of new or modification of existing roads. As an initial rough estimation, the investment costs for road works (without bridge construction) can be assumed in the range between 0.5 to 1 million EUR per kilometer.
CSPBankability Project Report Draft for an Appendix L –Local Site Conditions to the SolarPACES Guideline for Bankable STE Yield Assessment
Page: 18
L.3.2. Fuel supply
CSP plants as well as all other conventional power plants will have to use fossil fuel resources for operational purposes and/or power generation. The purpose of the following descriptions is to provide an overview of fuel-related aspects which need to be taken into account with regard to project development and potential investment costs. In case of CSP plants the use of fuels is limited to • freeze protection of heat transfer fluid (HTF), e.g. synthetic oil, molten salt etc. • generation of emergency power, e.g. diesel generator, diesel driven fire fighting pums • generation of heat/power during plant outages (night-time operation, annual overhaul of
components, plant outages etc.) • partly generation of live steam for turbine operation The fuel used for these applications can be either liquid (Diesel Oil, Gas Oil etc.) or gas (Natural Gas, LNG, special gases etc.). Solid fuels like coal etc. are at present not favored in existing CSP plants. With regard to possible environmental impacts, gaseous fuels will have a smaller impact on emission whereas liquid or even solid fuels may imply special treatment to suit the local rules and regulations. The fuel system will comprise the take-over at the boundary of the CSP plant, the storage within the plant, the distribution within the plant and the professional disposal of any residues. The local as well as the international codes and standards with respect to operation, safety and environmental regulations have to be strictly observed and followed during the concept and design of the fuel supply system. With respect to fire fighting the minimum requirements shall be as per NFPA 850.
L.3.2.1. Fuel unloading
The take-over of the fuel at the boundary line of the CSP plant has to be determined in the concept phase considering either gas, liquid fuels or solid fuels possible media. Gas is mostly supplied by pipelines, a metering station is highly recommended as well as a gas treatment plant (cleaning, scrubber, heating etc.). The battery limits have to be clearly agreed with the local supplier with respect to pipe connection (e.g. flange dimension, make and class as well as x/y/z-coordinates). Also the supply conditions (e.g. chemical composition, physical properties, calorific value etc.) have to be agreed and guaranteed. To access the connecting point and/or metering station a service road is required. Liquid fuels may also be supplied by pipeline; however also road tankers may be used. For pipeline supply also a metering and treatment plant is applicable similar to the above mentioned fuel gas. If road tankers (or railway) are used, an appropriate parking area, an unloading station with space for
CSPBankability Project Report Draft for an Appendix L –Local Site Conditions to the SolarPACES Guideline for Bankable STE Yield Assessment
Page: 19
the tankers and appropriate docking station (weighing system, fuel header and I&C for communication) are necessary. Unloading pumps and sludge tanks shall also be provided as well as sampling equipment.
L.3.2.2. Fuel storage
Following the above mentioned differences in the applicable resources, the following storage requirements shall be respected: • Gas is mostly supplied by pipelines, a storage is possible (but expensive) by pipelength and/or
pressure tanks. LNG is supplied by road tanker to a special LNG plant with appropriate liquid storage facilities.
• Liquid fuels may be stored preferably in tank farms with atmospheric flat bottom tanks. • Solid fuels are preferably stored in outdoor coal stockyard with necessary stacker-reclaimer
systems. Access to the storage areas shall be enabled by service roads. The needs for possible fire fighting shall be satisfied.
L.3.2.3. Fuel distribution
The fuel shall be distributed to the possible consumers in suitable conditions; booster equipment may be necessary to match the needs of the specific equipment such as: • main firing (gas turbine, HRSG in case of an ISCC etc.) • emergency diesel generator • fire fighting pumps • freeze protection (heaters) • auxiliary steam generator • supplementary firing
L.3.3. Chemicals, lubricants and technical gases
In CSP plants various types of media are used such as • solvents, acids and alkalis • lubricants, e.g. oils and greases • technical gases like CO2, hydrogen and oxygen • laboratory gases such as propane etc. The fields of application comprise, but are not limited to the following systems: • chemical fuel treatment
CSPBankability Project Report Draft for an Appendix L –Local Site Conditions to the SolarPACES Guideline for Bankable STE Yield Assessment
Page: 20
• flue gas treatment (if applicable) • water treatment • lubrication of machines • condensate treatment • laboratory (chemical analysis) etc. Local as well as international codes and standards with respect to operation, safety and environmental regulations have to be strictly followed taking also into account manufacturer’s safety data sheets.
L.3.4. Security issues
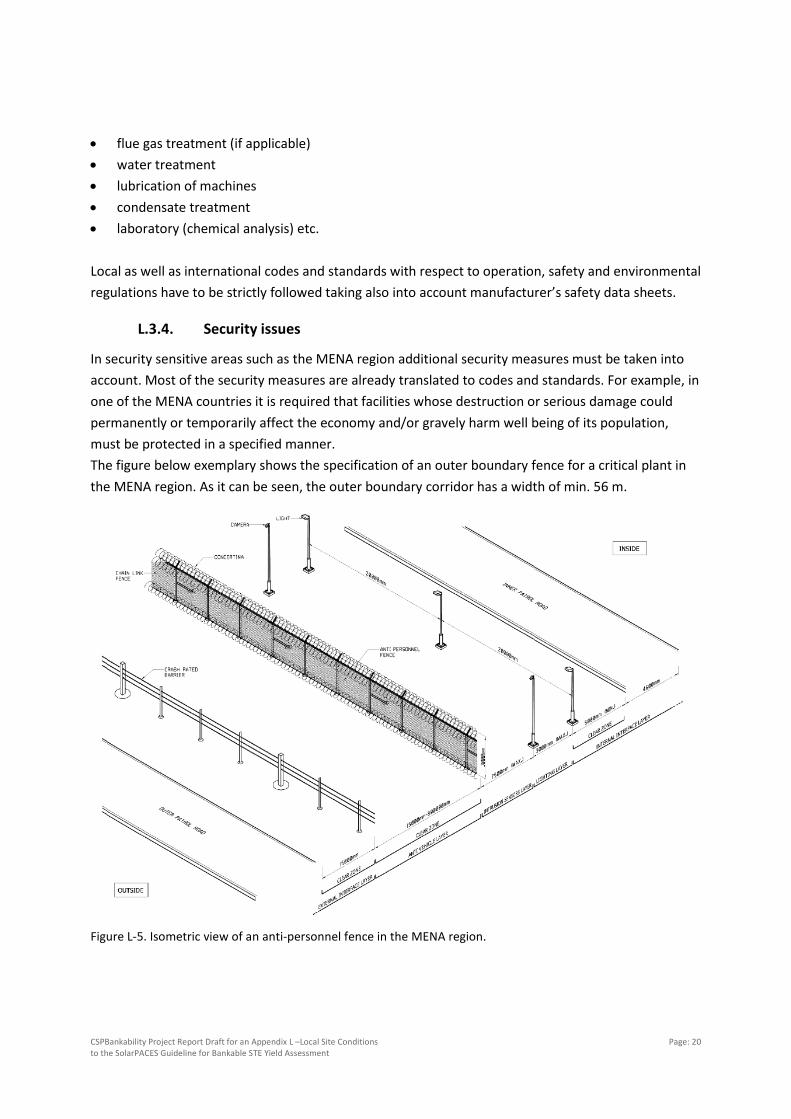
In security sensitive areas such as the MENA region additional security measures must be taken into account. Most of the security measures are already translated to codes and standards. For example, in one of the MENA countries it is required that facilities whose destruction or serious damage could permanently or temporarily affect the economy and/or gravely harm well being of its population, must be protected in a specified manner. The figure below exemplary shows the specification of an outer boundary fence for a critical plant in the MENA region. As it can be seen, the outer boundary corridor has a width of min. 56 m.
Figure L-5. Isometric view of an anti-personnel fence in the MENA region.
CSPBankability Project Report Draft for an Appendix L –Local Site Conditions to the SolarPACES Guideline for Bankable STE Yield Assessment
Page: 21
For plant designs which have to comply with such requirements, additional costs need be planned. As an example, for the above shown reference plant a 15%-increase in the land use and additional 20 million EUR for the fence had to be included in the pricing. Apart from the boundary corridor, further requirements for the gate system can be applied which in turn result in further cost increases.
L.3.5. Housing compound
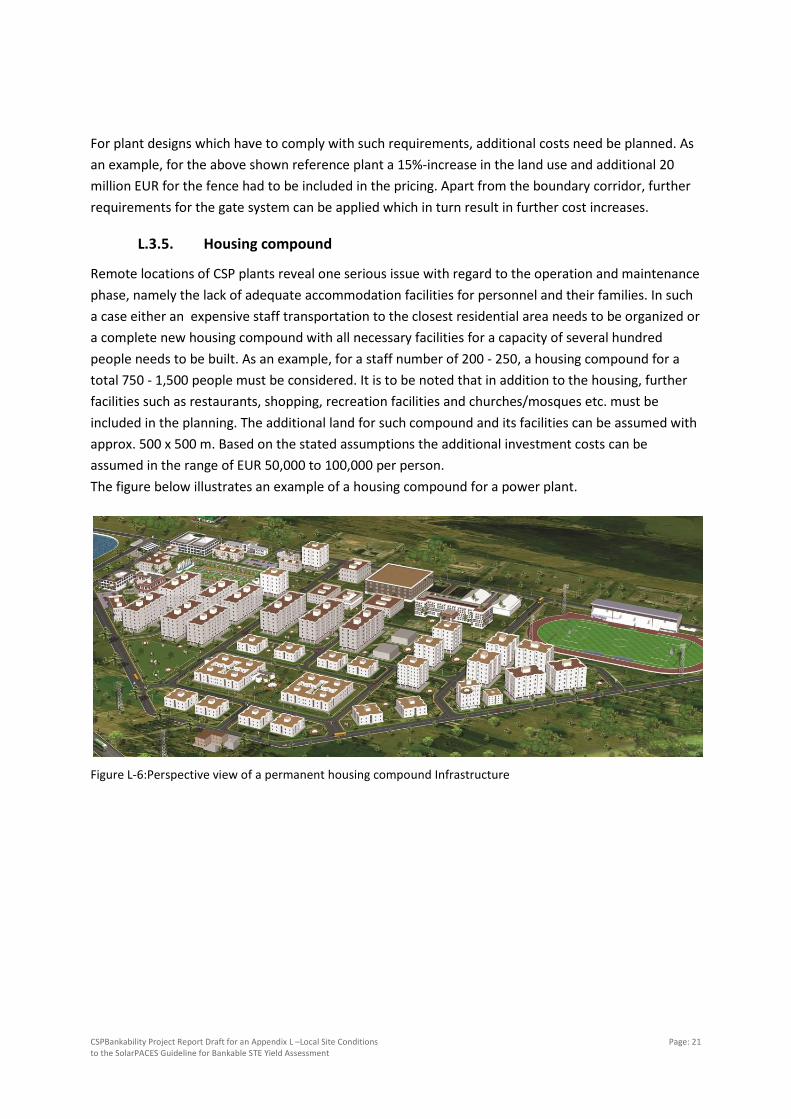
Remote locations of CSP plants reveal one serious issue with regard to the operation and maintenance phase, namely the lack of adequate accommodation facilities for personnel and their families. In such a case either an expensive staff transportation to the closest residential area needs to be organized or a complete new housing compound with all necessary facilities for a capacity of several hundred people needs to be built. As an example, for a staff number of 200 - 250, a housing compound for a total 750 - 1,500 people must be considered. It is to be noted that in addition to the housing, further facilities such as restaurants, shopping, recreation facilities and churches/mosques etc. must be included in the planning. The additional land for such compound and its facilities can be assumed with approx. 500 x 500 m. Based on the stated assumptions the additional investment costs can be assumed in the range of EUR 50,000 to 100,000 per person. The figure below illustrates an example of a housing compound for a power plant.
Figure L-6:Perspective view of a permanent housing compound Infrastructure
CSPBankability Project Report Draft for an Appendix L –Local Site Conditions to the SolarPACES Guideline for Bankable STE Yield Assessment
Page: 22
L.4. References
[Munich RE 2011] www.munichre.com, Münchener Rückversicherungs-Gesellschaft, 2011,
“NATHAN World Map of Natural Hazards”. [Burkholder 2009] Burkholder, F., and Kutscher, C., 2009, "Heat loss testing of Schott's 2008
PTR70 Parabolic Trough Receiver," Technical Report NREL/TP-550-45633, National Renewable Energy Laboratory, Golden, Colorado, USA.
[Cohen 1999] Cohen Gilbert E. ; Kearney, D. W. K., Gregory J. , 1999, "Operation and Maintenance Improvement Program for Concentrating Solar Power Plants," Technical Report SAND99-1290, Sandia National Laboratories, Albuquerque, New Mexico, USA.
[Herrmann 2008] Herrmann, U. and Nava, P., 2008, "Performance of the SKAL-ET collectors of the Andasol power plants," 14th SolarPACES Symposium, Las Vegas, USA, March 4-7, 2008.
[Hulstrom 1990] Hulstrom, R. L. and Stoffel, Thomas L., 1990, „Some Effects of the Yellowstone Fire Smoke Cloud on Incident Solar Irradiance“, J. Climate, 3, 1485–1490.
[Novatec Solar 2011] Novatec Solar, 2011, "Nova-1 - Turnkey solar boiler, mass produced in industrial precision - with performance guarantee," 2011, Karlsruhe, Germany.
[Novatec Solar 2014] Novatec Solar, 2014, "Concentrated Solar Power by Novatec Solar," 2014, Karlsruhe, Germany.
[Sato et al. 1993] Sato, M., J.E. Hansen, M.P. McCormick, and J.B. Pollack, 1993, „Stratospheric aerosol optical depths“, 1850-1990. J. Geophys. Res., 98, 22987-22994, doi:10.1029/93JD02553.
[Solar Millenium 2006] Solar Millenium AG, Flagsol GmbH, sbp GmbH, Deutsches Zentrum für Luft- und Raumfahrt, and Fraunhofer-Institut für Materialfluss und Logistik, 2006, "Abschlussbericht - Erforschung und Entwicklung der Parabolrinnentechnik "Anda F&E"," Technical Report BMU, Stuttgart.
CSPBankability Project Report Draft for an Appendix L –Local Site Conditions to the SolarPACES Guideline for Bankable STE Yield Assessment
Page: 23
List of figures
Figure L-1: World map of natural hazards, excerpt (Munich RE 2011) ..................................................... 4 Figure L-2: Flooding of power plant construction site on Arabian Peninsula in November 2013 (Source: Fichtner). ................................................................................................................................................... 6 Figure L-3:Visualization of a CSP plant with its surrounding area (Source: Fichtner) ............................. 14 Figure L-4: Exemplary cost-risk-benefit analysis for soil investigations .................................................. 15 Figure L-5. Isometric view of an anti-personnel fence in the MENA region. .......................................... 20 Figure L-6:Perspective view of a permanent housing compound Infrastructure ................................... 21