Embed Size (px)
Citation preview
CSSE463: Image Recognition Day 2 Roll call Announcements:
Moodle has drop box for Lab 1 Next class: lots more Matlab how-to (bring your
laptop) Last class we discussed:
Today: Color and color features Do questions 1-2 about ICME sunset paper now
Questions?
Q1-2
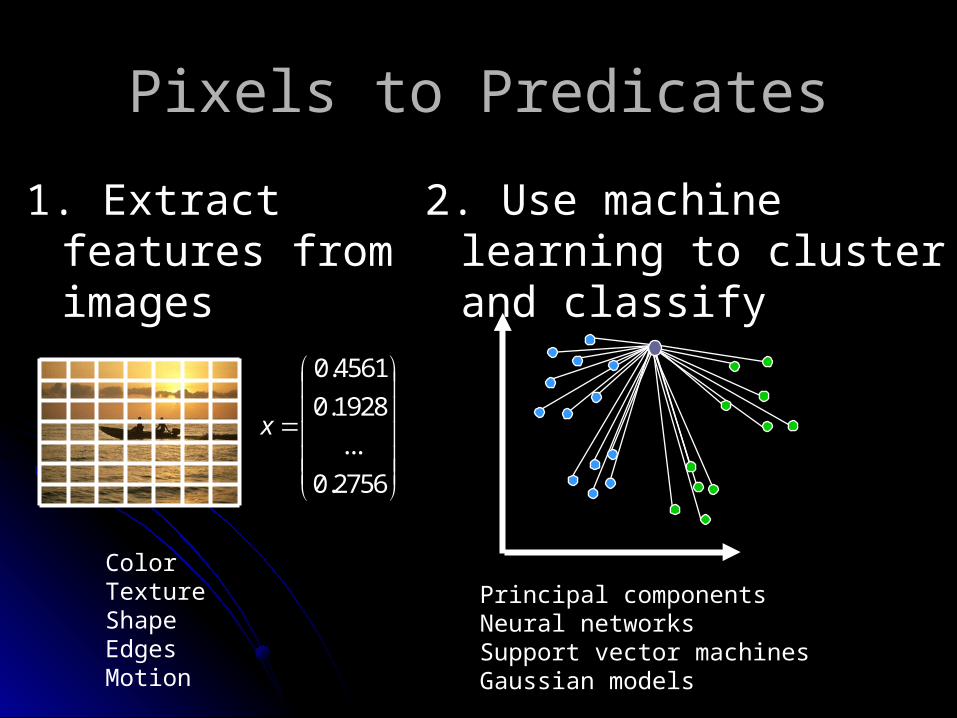
Pixels to Predicates
1. Extract features from images
2. Use machine learning to cluster and classify
ColorTextureShapeEdgesMotion
Principal componentsNeural networksSupport vector machinesGaussian models
2756.0
...
1928.0
4561.0
x
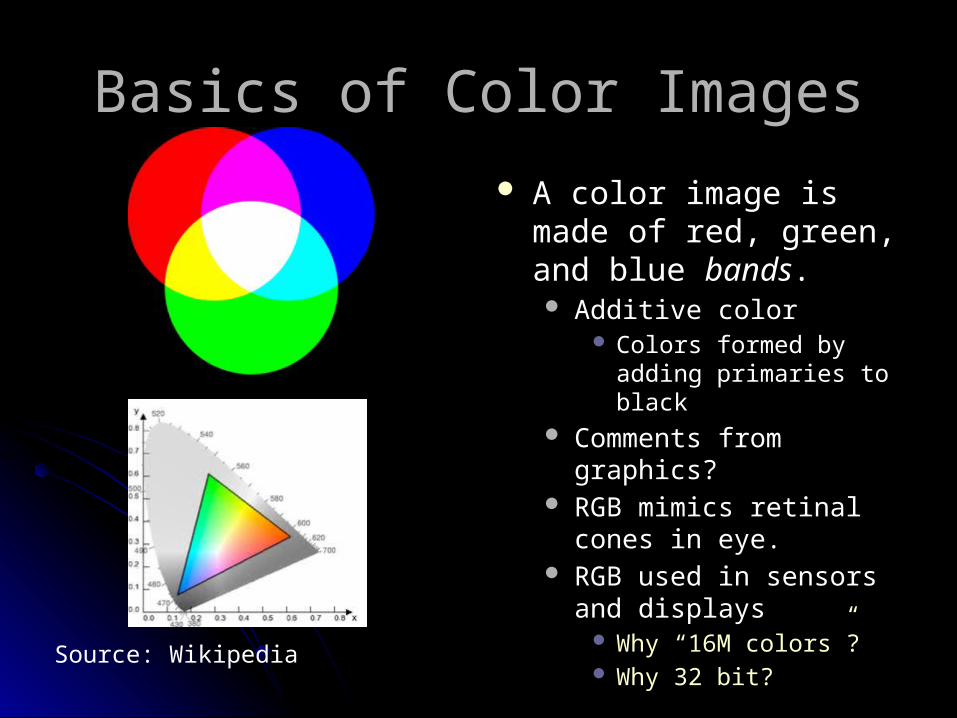
Basics of Color Images
A color image is made of red, green, and blue bands. Additive color
Colors formed by adding primaries to black
Comments from graphics? RGB mimics retinal cones
in eye. RGB used in sensors and
displays Why “16M colors”? Why 32 bit?
Source: Wikipedia
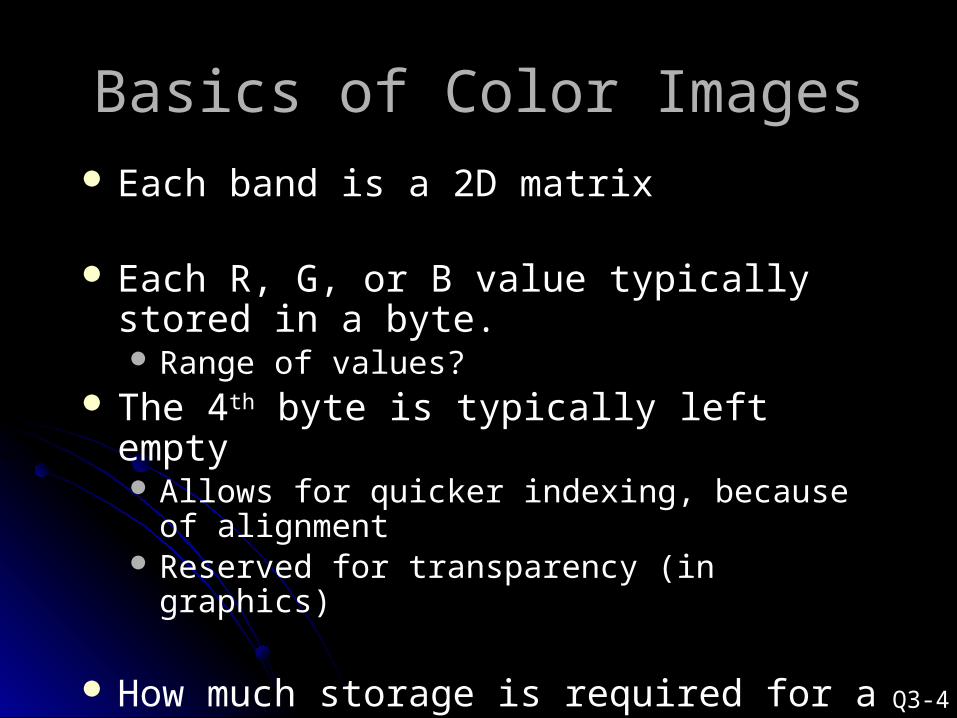
Basics of Color Images Each band is a 2D matrix
Each R, G, or B value typically stored in a byte. Range of values?
The 4th byte is typically left empty Allows for quicker indexing, because of alignment Reserved for transparency (in graphics)
How much storage is required for a 4 megapixel color image (uncompressed)?
Q3-4
http://abstrusegoose.com/221
We can extract different types of color features (statistics) from images
1. Color histograms2. Color moments3. Color coherence vectors
Related considerations:Some color spaces “work better”Spatial components can help
Q5
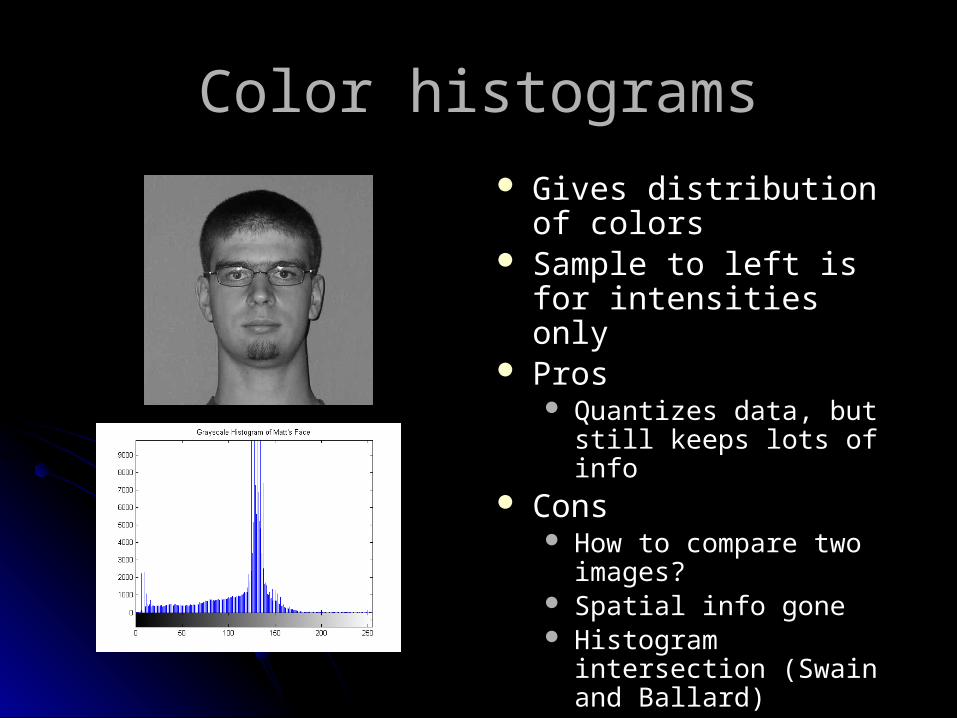
Color histograms Gives distribution of
colors Sample to left is for
intensities only Pros
Quantizes data, but still keeps lots of info
Cons How to compare two
images? Spatial info gone Histogram intersection
(Swain and Ballard)
Color moments
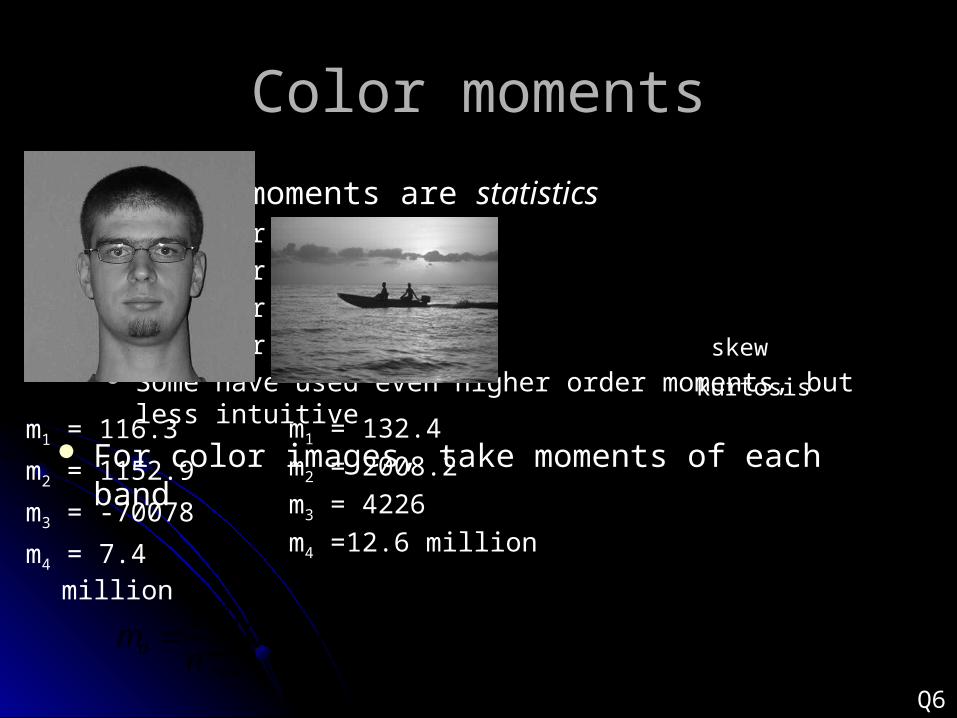
m1 = 116.3
m2 = 1152.9
m3 = -70078
m4 = 7.4 million
Central moments are statistics 1st order = mean 2nd order = variance 3rd order = ____ 4th order = ____ Some have used even higher order moments, but less intuitive
For color images, take moments of each bandm1 = 132.4
m2 = 2008.2
m3 = 4226
m4 =12.6 million
Q6
skew
kurtosis
n
i
did x
nm
1
1
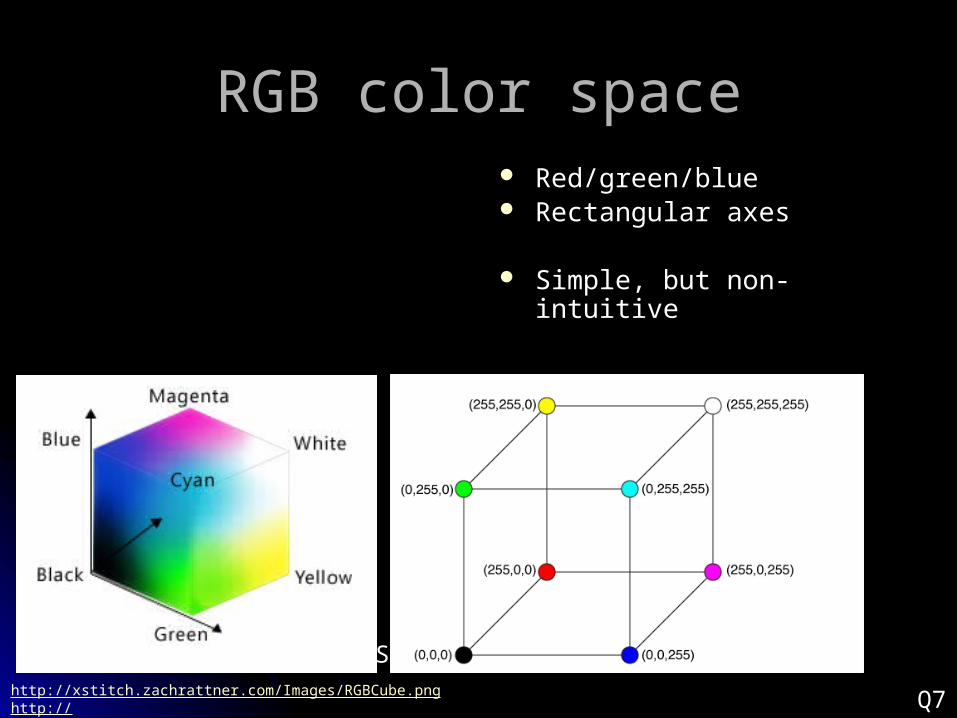
RGB color space Red/green/blue Rectangular axes
Simple, but non-intuitive
Source: Wikipedia
Q7http://xstitch.zachrattner.com/Images/RGBCube.pnghttp://dev.bowdenweb.com/css/colors/i/rgb-color-space-visualized-as-a-cube-msdn.png
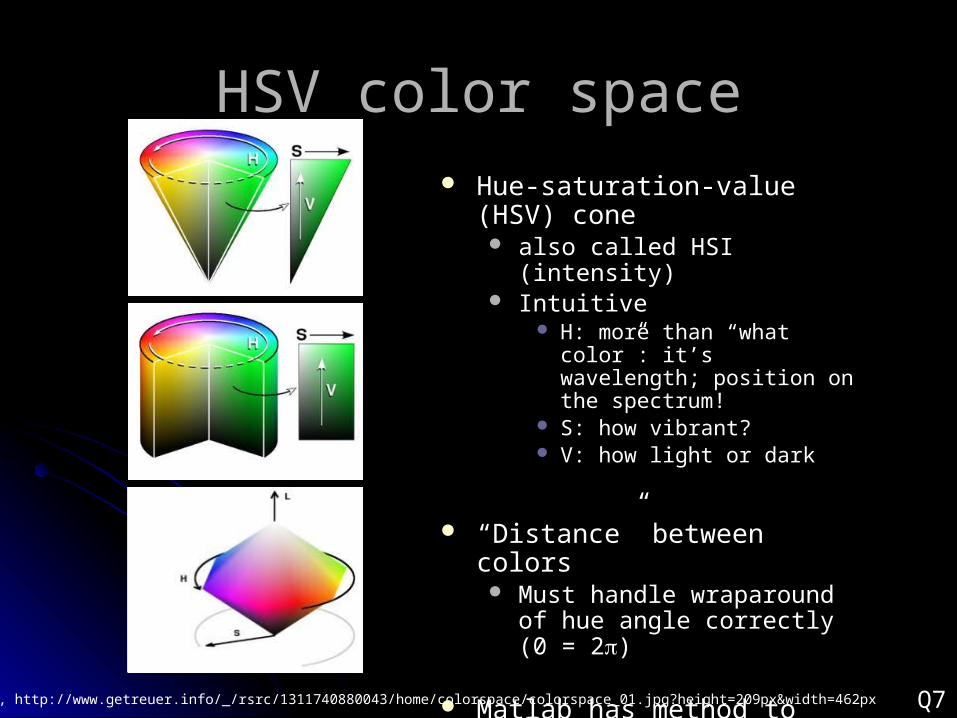
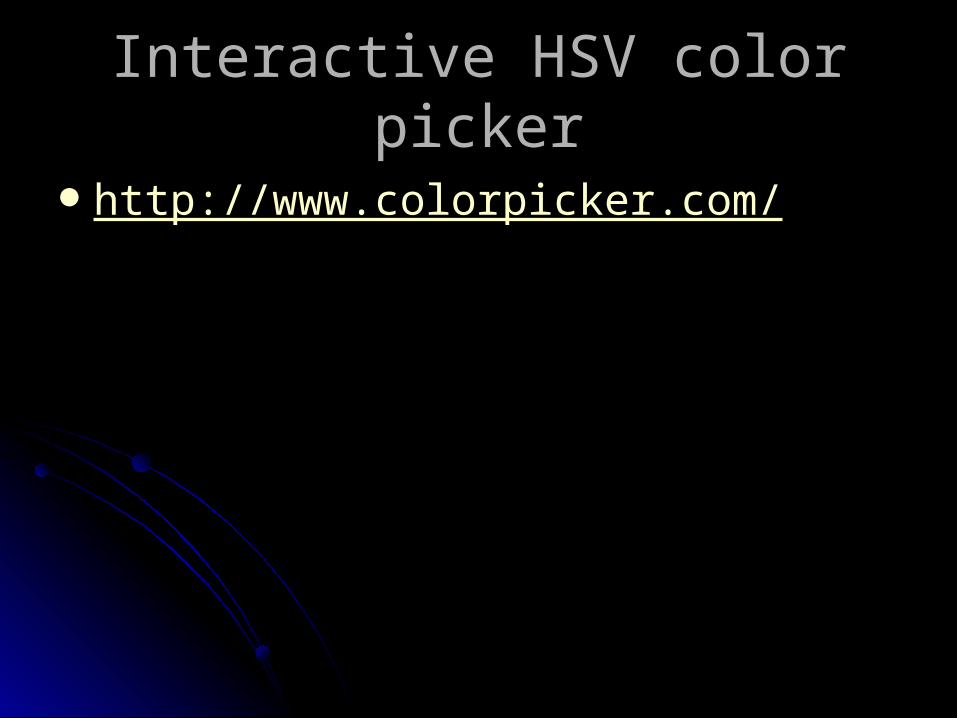
HSV color space Hue-saturation-value (HSV)
cone also called HSI (intensity) Intuitive
H: more than “what color”: it’s wavelength; position on the spectrum!
S: how vibrant? V: how light or dark
“Distance” between colors Must handle wraparound of hue
angle correctly (0 = 2p)
Matlab has method to convert from rgb to hsv, can find formula online.
Wikipedia, http://www.getreuer.info/_/rsrc/1311740880043/home/colorspace/colorspace_01.jpg?height=209px&width=462px Q7
Other color spaces LST (Ohta)1
L = luminance: L = (R + G + B)/sqrt(3) S and T are chroma bands.
S: red vs. blue: S = (R – B) / sqrt(2) T: green vs. magenta: T = (R – 2G + B) / sqrt(6)
These 3 are the principal components of the RGB space (PCA and eigenvectors later in course)
Slightly less intuitive than HSV No problem with wraparound
Others YIQ (TV signals), QUV, Lab, LUV http://www.scarse.org/docs/color_faq.html#graybw
Q8Y. I. Ohta, T. Kanade, and T. Sakai, Color information for region segmentation, Computer Graphics and Image Processing, Vol. 13, pp. 222-241, 1980. http://www.ri.cmu.edu/pub_files/pub4/ohta_y_1980_1/ohta_y_1980_1.pdf
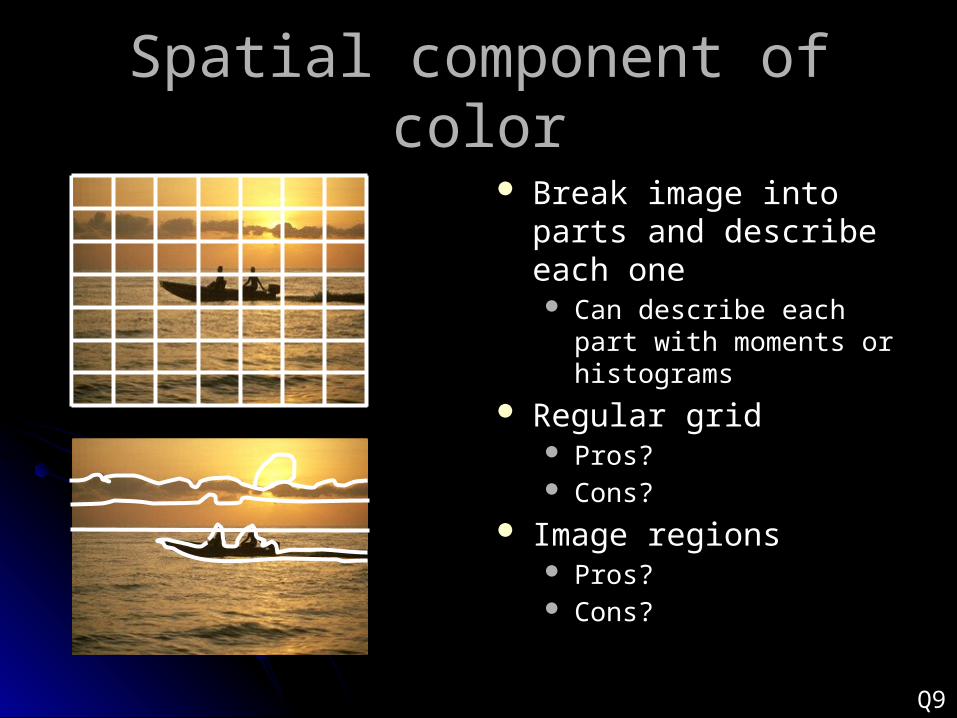
Spatial component of color
Break image into parts and describe each one Can describe each part
with moments or histograms
Regular grid Pros? Cons?
Image regions Pros? Cons?
Q9
Additional reading
Color gamuts http://en.wikipedia.org/wiki/Gamut
Color coherence vectors Extension of color histograms within local
neighborhoods Used in:
A. Vailaya, H-J Zhang, and A. Jain. On image classification: City images vs. landscapes. Pattern Recognition 31:1921-1936, Dec 1998.
Defined in: G Pass, R Zabih, and J Miller. Comparing images using color coherence
vectors. 4th ACM Conf. Multimedia, pp 65-73, Boston, 1996.
Q10