Embed Size (px)
Citation preview
TKP4105/TKP4110
CSTR study:The reaction of t-butyl chloride and water
Øyvind Eraker, Kjetil Sonerud and Ove ØyåsGroup B04
Supervisor: Miroslav Surma
November 5, 2011
Abstract
The reaction of t-butyl chloride (tBC) and water was investigated in a CSTRreactor. While varying the temperature and residence time of the reactor, pHmeasurements were used to monitor the conversion level as a function of time. In allcases, the concentration of tBC in the feedstock and the molar feed ratio of waterwere held constant and the system was allowed to reach steady state conditions.Knowing that the rate-determining step of the reaction is the formation of thecarbocation, an expression for the rate constant was derived from the mass balanceof the system with the assumption of steady state conditions and zero accumulation.The conversion level, X, and the rate constant, k, was calculated each time steadystate was reached.
From Arrhenius’ equation, a linear expression was derived with the activationenergy, Ea, as the slope. Plotting the natural logarithm of the rate constant, ln kas a function of temperature and applying linear regression, the activation energywas determined to 148,5 kJ/mol.
Contents1 Introduction 3
2 Theory 3
3 Experimental 63.1 Experimental setup . . . . . . . . . . . . . . . . . . . . . . . . . . . . . . 63.2 Making the solutions . . . . . . . . . . . . . . . . . . . . . . . . . . . . . 63.3 Experimental procedure . . . . . . . . . . . . . . . . . . . . . . . . . . . 6
4 Results 8
5 Discussion 12
6 References 14
A Calculations 15
2
1 Introduction
In this laboratory exercise, the reaction of t-butyl chloride (tBC) and water in a CSTRreactor is investigated under various reaction conditions. Both reactants are dilutedin methanol. The temperature and residence time of the reactor are varied, and pHmeasurements are used to monitor the level of conversion as a function of time. Theconcentration of tBC in the feedstock and the molar feed ratio of water are both heldconstant. In all cases, the system is monitored until the system can be assumed to havereached steady state conditions.
The forward rate constant of the hydrolysis of tBC is determined at all reaction conditions,assuming that the reaction is irreversible. The activation energy is also determined. Thegoal of the experiment is to achieve a fundamental understanding of the reaction kineticsby observing the changes induced by variations in temperature and residence time. Thisunderstanding may later be applied to large scale industrial processes involving similarreaction systems.
2 Theory
Formation of the carbocation is the rate-determining step in the hydrolysis of t-butylchloride, as seen in Fig. 1.
The rate law of the reaction can then be expressed as
− r = kCtBC (2.1)
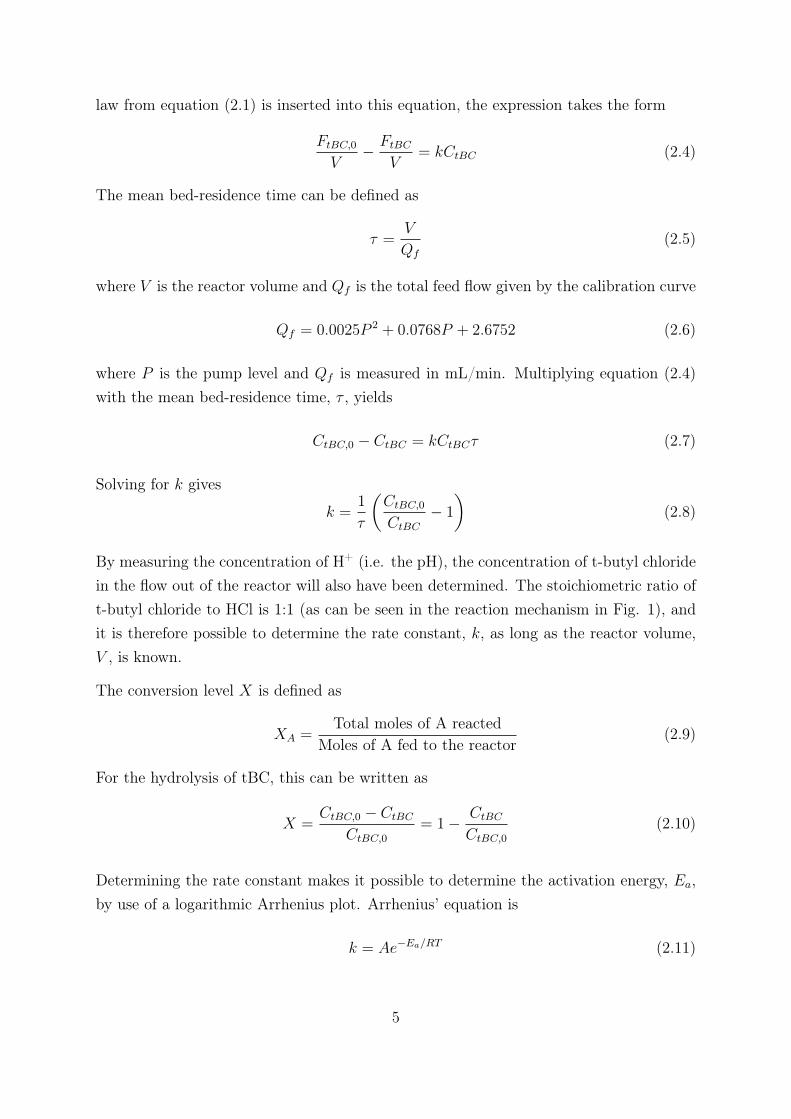
where −r is the rate of disappearance of t-butyl chloride, k is the rate constant of thereaction and CtBC is the concentration of t-butyl chloride. The reaction is carried out ina CSTR, as shown in Fig. 2. From the mass-balance of this system it is obvious that
In - Out + Reacted = Accumulated (2.2)
Since this is a steady-state system with no accumulation, the equation takes the form
FtBC,0 − FtBC = −rV (2.3)
where FtBC,0 is the rate of flow of t-butyl chloride into the reactor, FtBC is the rate offlow of t-butyl chloride out of the reactor and V is the volume of the reactor. If the rate
3
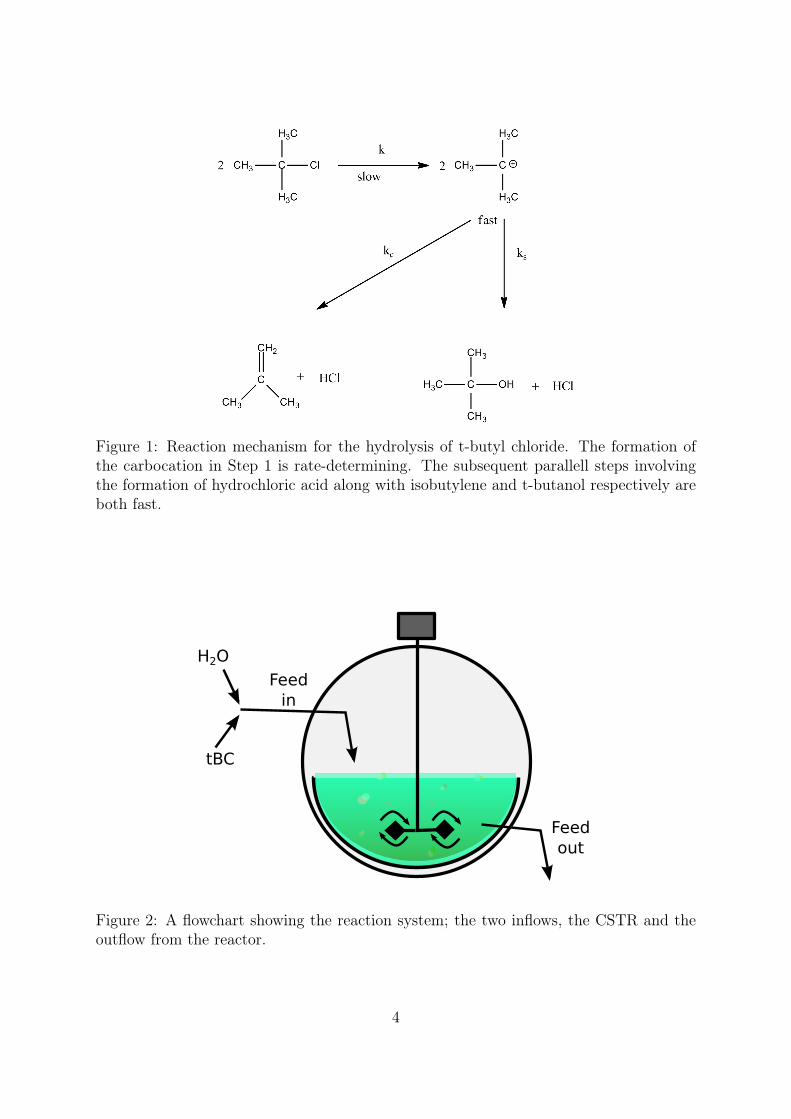
Figure 1: Reaction mechanism for the hydrolysis of t-butyl chloride. The formation ofthe carbocation in Step 1 is rate-determining. The subsequent parallell steps involvingthe formation of hydrochloric acid along with isobutylene and t-butanol respectively areboth fast.
Figure 2: A flowchart showing the reaction system; the two inflows, the CSTR and theoutflow from the reactor.
4
law from equation (2.1) is inserted into this equation, the expression takes the form
FtBC,0
V− FtBC
V= kCtBC (2.4)
The mean bed-residence time can be defined as
τ =V
Qf
(2.5)
where V is the reactor volume and Qf is the total feed flow given by the calibration curve
Qf = 0.0025P 2 + 0.0768P + 2.6752 (2.6)
where P is the pump level and Qf is measured in mL/min. Multiplying equation (2.4)with the mean bed-residence time, τ , yields
CtBC,0 − CtBC = kCtBCτ (2.7)
Solving for k gives
k =1
τ
(CtBC,0
CtBC
− 1
)(2.8)
By measuring the concentration of H+ (i.e. the pH), the concentration of t-butyl chloridein the flow out of the reactor will also have been determined. The stoichiometric ratio oft-butyl chloride to HCl is 1:1 (as can be seen in the reaction mechanism in Fig. 1), andit is therefore possible to determine the rate constant, k, as long as the reactor volume,V , is known.
The conversion level X is defined as
XA =Total moles of A reacted
Moles of A fed to the reactor(2.9)
For the hydrolysis of tBC, this can be written as
X =CtBC,0 − CtBC
CtBC,0
= 1− CtBC
CtBC,0
(2.10)
Determining the rate constant makes it possible to determine the activation energy, Ea,by use of a logarithmic Arrhenius plot. Arrhenius’ equation is
k = Ae−Ea/RT (2.11)
5
where A is a constant preexponential factor, R is the universal gas constant and T is thetemperature. Taking the logarithm of equation (2.11) gives
ln k = lnA− Ea
RT(2.12)
By plotting ln k against − 1RT
in a linear plot and applying linear regression, Ea and lnA
can be determined from the slope of the resulting curve and the intersection with thevertical axis respectively.
3 Experimental
3.1 Experimental setup
The experimental setup is shown and explained in Fig. 3.
3.2 Making the solutions
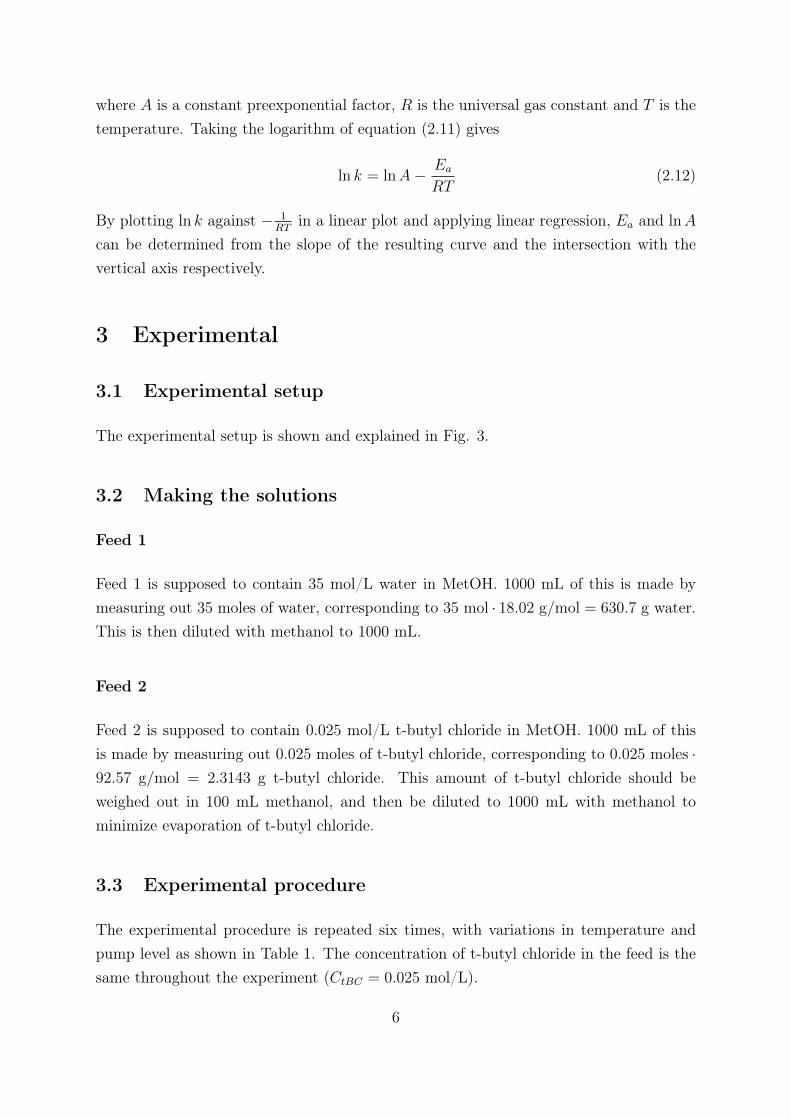
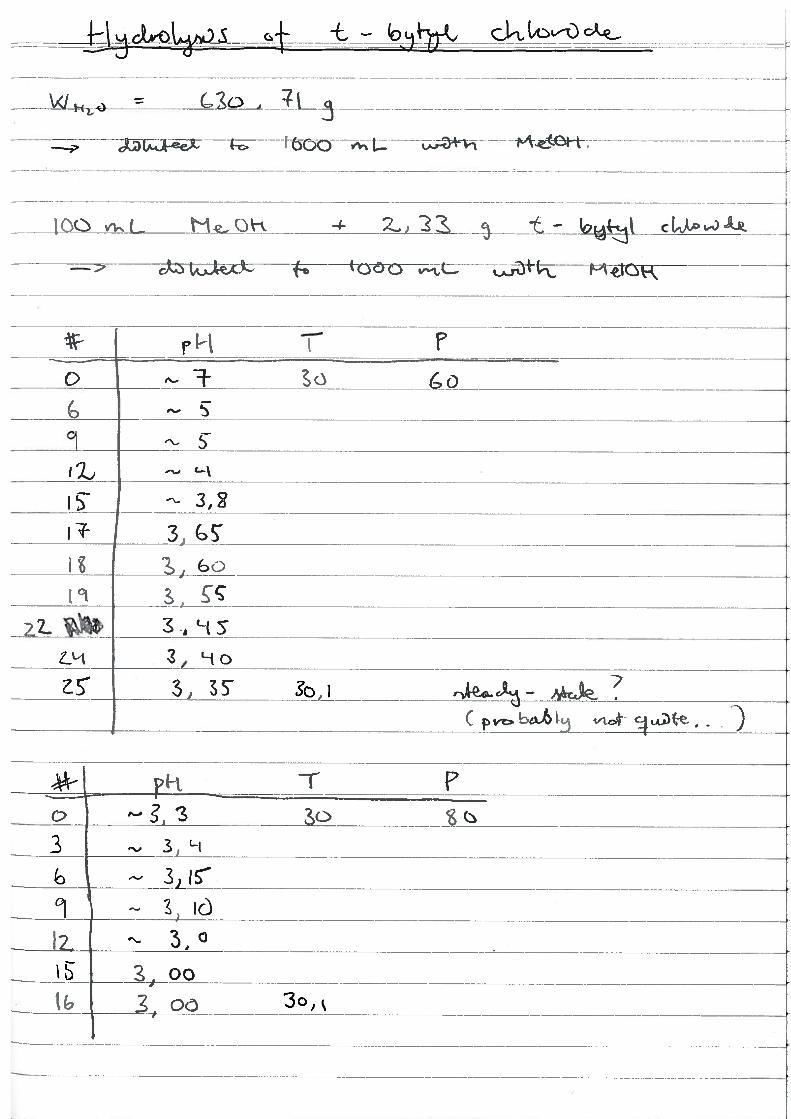
Feed 1
Feed 1 is supposed to contain 35 mol/L water in MetOH. 1000 mL of this is made bymeasuring out 35 moles of water, corresponding to 35 mol · 18.02 g/mol = 630.7 g water.This is then diluted with methanol to 1000 mL.
Feed 2
Feed 2 is supposed to contain 0.025 mol/L t-butyl chloride in MetOH. 1000 mL of thisis made by measuring out 0.025 moles of t-butyl chloride, corresponding to 0.025 moles ·92.57 g/mol = 2.3143 g t-butyl chloride. This amount of t-butyl chloride should beweighed out in 100 mL methanol, and then be diluted to 1000 mL with methanol tominimize evaporation of t-butyl chloride.
3.3 Experimental procedure
The experimental procedure is repeated six times, with variations in temperature andpump level as shown in Table 1. The concentration of t-butyl chloride in the feed is thesame throughout the experiment (CtBC = 0.025 mol/L).
6
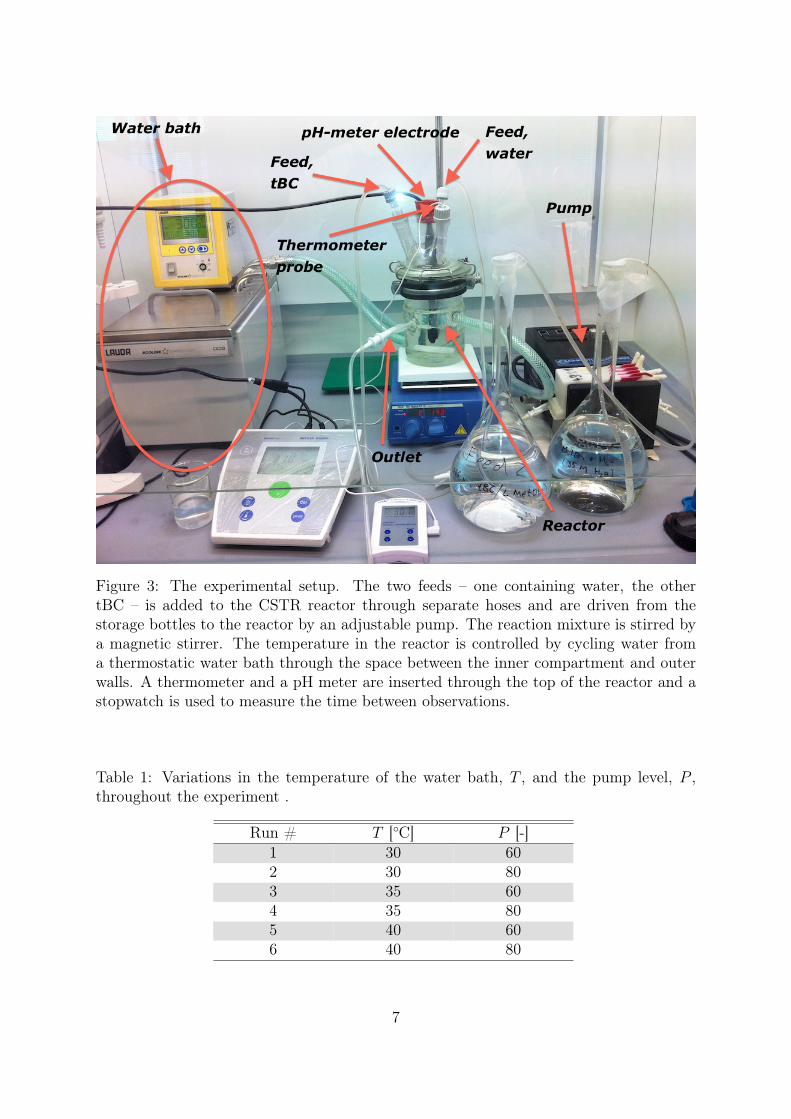
Figure 3: The experimental setup. The two feeds – one containing water, the othertBC – is added to the CSTR reactor through separate hoses and are driven from thestorage bottles to the reactor by an adjustable pump. The reaction mixture is stirred bya magnetic stirrer. The temperature in the reactor is controlled by cycling water froma thermostatic water bath through the space between the inner compartment and outerwalls. A thermometer and a pH meter are inserted through the top of the reactor and astopwatch is used to measure the time between observations.
Table 1: Variations in the temperature of the water bath, T , and the pump level, P ,throughout the experiment .
Run # T [◦C] P [-]1 30 602 30 803 35 604 35 805 40 606 40 80
7
First, the water bath temperature is set. The reactor is then filled with reactants inorder to save time. The feed-hoses are connected to the reactant solutions and the cleanpH-electrode, in/out-hoses and the product container are connected to the reactor. Thestirring is turned on, and the pump is turned on and set to the required level. The pHvalue, temperature and elapsed time is noted every 3 minutes during the reaction, so thatit is possible to know when the system approaches steady-state.
Between subsequent runs, it is only necessary to adjust the temperature and/or pumplevel, and note the same parameters as mentioned above. When all the experimentsare done, the electrical equipment is shut off, the reactor emptied and the equipmentcleaned.
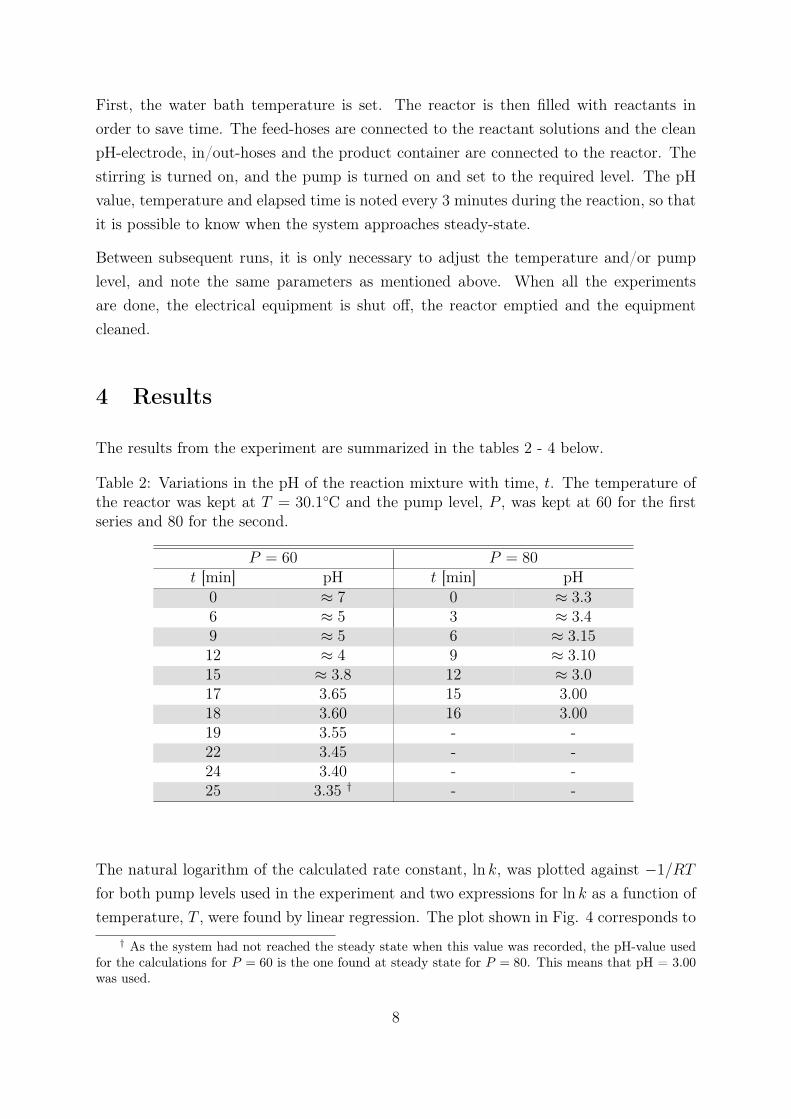
4 Results
The results from the experiment are summarized in the tables 2 - 4 below.
Table 2: Variations in the pH of the reaction mixture with time, t. The temperature ofthe reactor was kept at T = 30.1◦C and the pump level, P , was kept at 60 for the firstseries and 80 for the second.
P = 60 P = 80t [min] pH t [min] pH
0 ≈ 7 0 ≈ 3.36 ≈ 5 3 ≈ 3.49 ≈ 5 6 ≈ 3.1512 ≈ 4 9 ≈ 3.1015 ≈ 3.8 12 ≈ 3.017 3.65 15 3.0018 3.60 16 3.0019 3.55 - -22 3.45 - -24 3.40 - -25 3.35 † - -
The natural logarithm of the calculated rate constant, ln k, was plotted against −1/RT
for both pump levels used in the experiment and two expressions for ln k as a function oftemperature, T , were found by linear regression. The plot shown in Fig. 4 corresponds to
† As the system had not reached the steady state when this value was recorded, the pH-value usedfor the calculations for P = 60 is the one found at steady state for P = 80. This means that pH = 3.00was used.
8
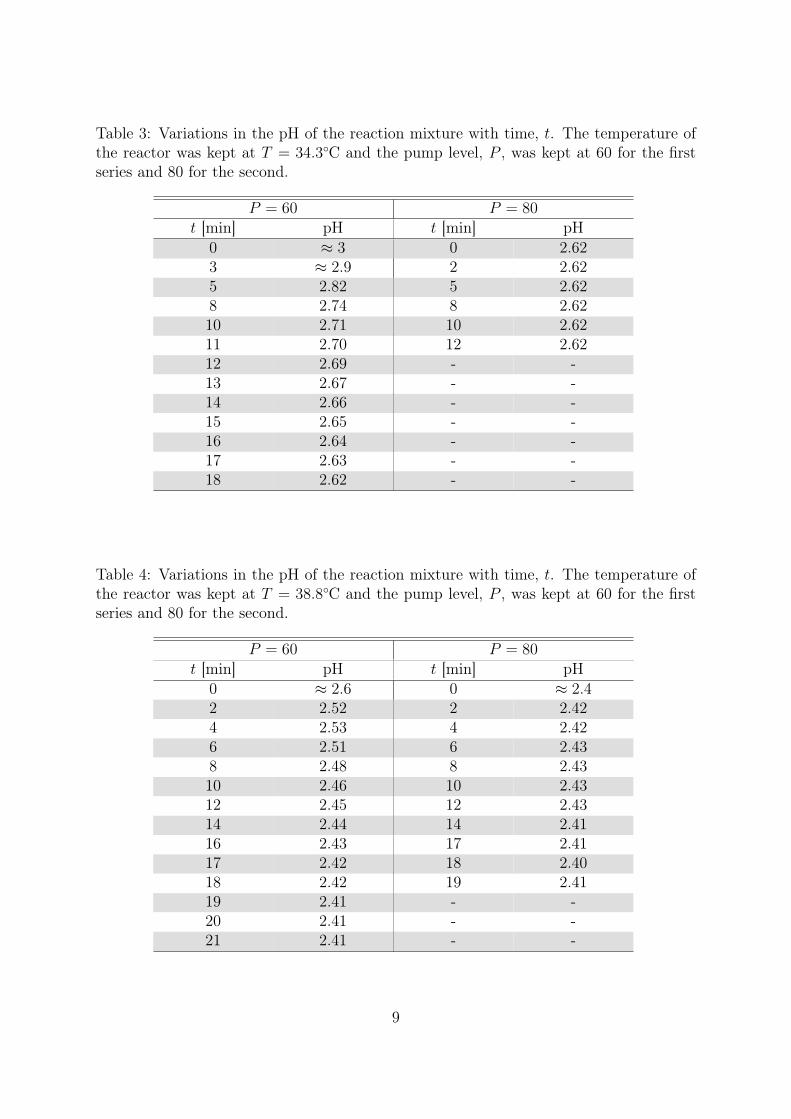
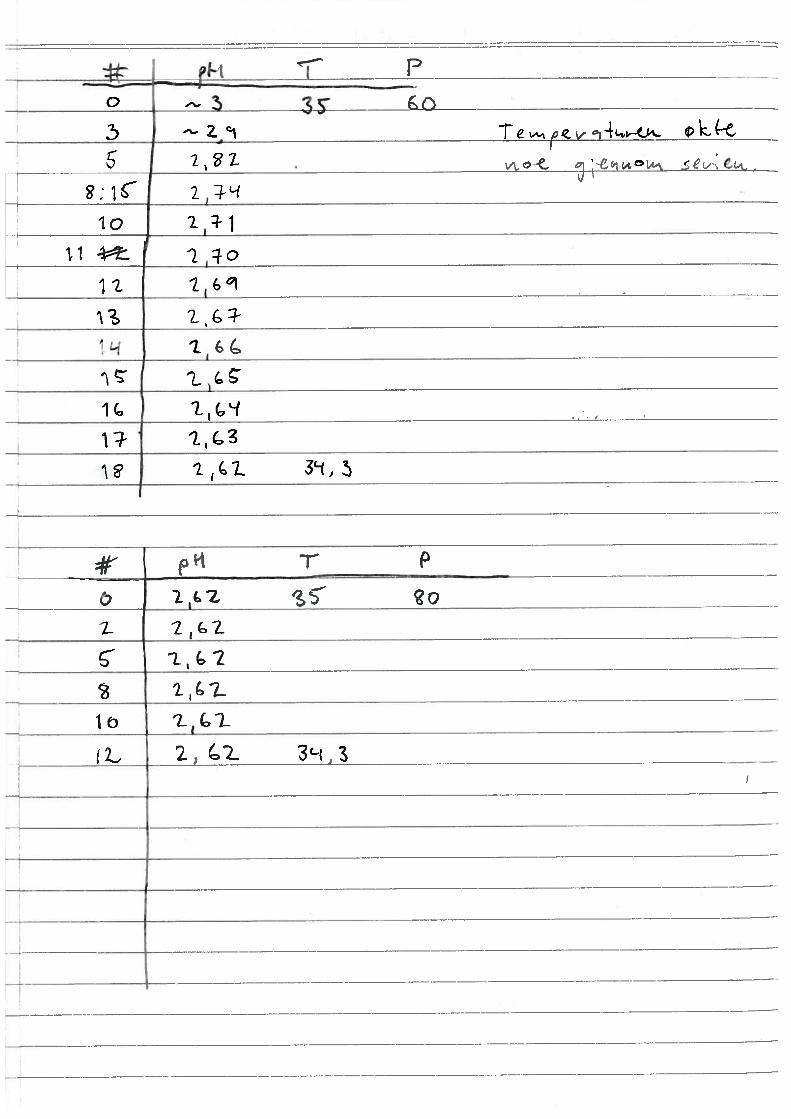
Table 3: Variations in the pH of the reaction mixture with time, t. The temperature ofthe reactor was kept at T = 34.3◦C and the pump level, P , was kept at 60 for the firstseries and 80 for the second.
P = 60 P = 80t [min] pH t [min] pH
0 ≈ 3 0 2.623 ≈ 2.9 2 2.625 2.82 5 2.628 2.74 8 2.6210 2.71 10 2.6211 2.70 12 2.6212 2.69 - -13 2.67 - -14 2.66 - -15 2.65 - -16 2.64 - -17 2.63 - -18 2.62 - -
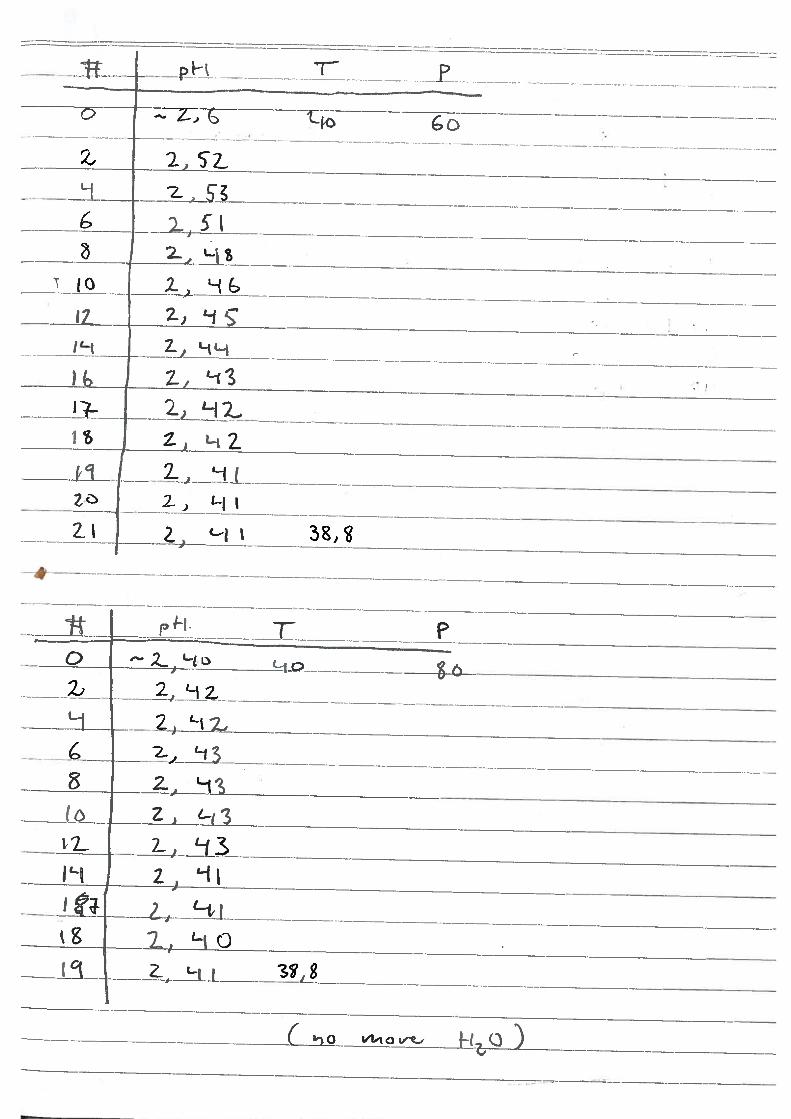
Table 4: Variations in the pH of the reaction mixture with time, t. The temperature ofthe reactor was kept at T = 38.8◦C and the pump level, P , was kept at 60 for the firstseries and 80 for the second.
P = 60 P = 80t [min] pH t [min] pH
0 ≈ 2.6 0 ≈ 2.42 2.52 2 2.424 2.53 4 2.426 2.51 6 2.438 2.48 8 2.4310 2.46 10 2.4312 2.45 12 2.4314 2.44 14 2.4116 2.43 17 2.4117 2.42 18 2.4018 2.42 19 2.4119 2.41 - -20 2.41 - -21 2.41 - -
9
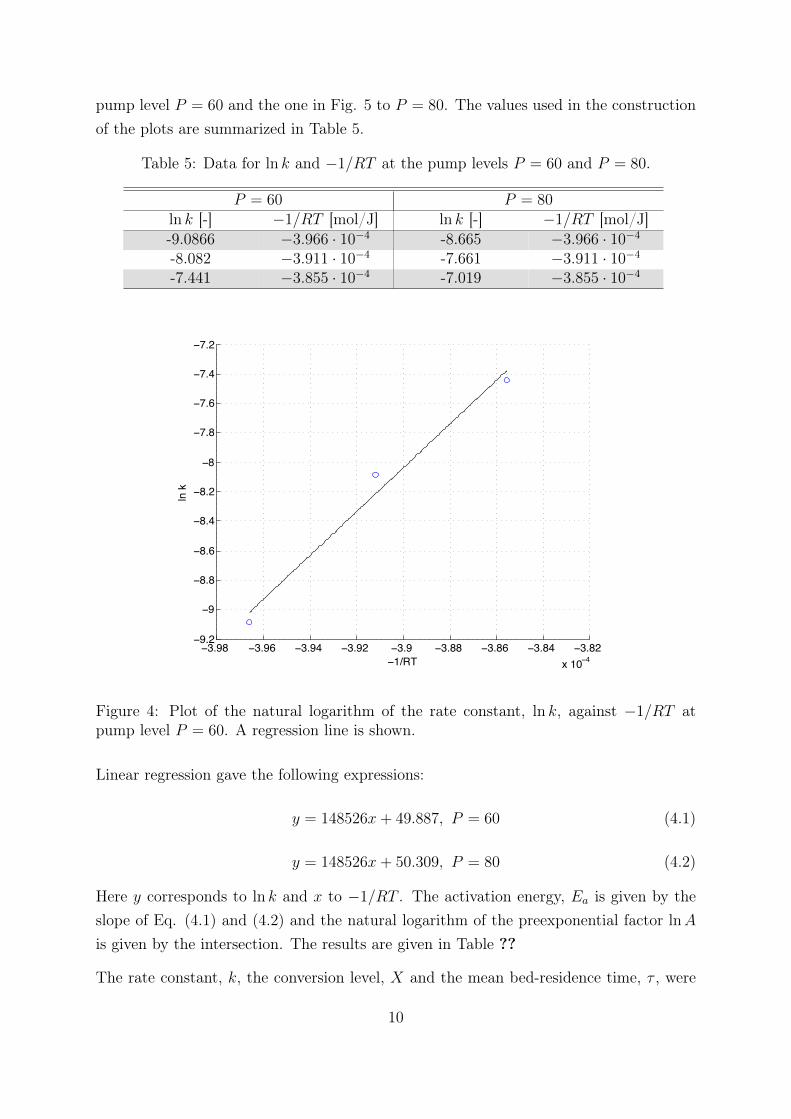
pump level P = 60 and the one in Fig. 5 to P = 80. The values used in the constructionof the plots are summarized in Table 5.
Table 5: Data for ln k and −1/RT at the pump levels P = 60 and P = 80.
P = 60 P = 80ln k [-] −1/RT [mol/J] ln k [-] −1/RT [mol/J]-9.0866 −3.966 · 10−4 -8.665 −3.966 · 10−4-8.082 −3.911 · 10−4 -7.661 −3.911 · 10−4-7.441 −3.855 · 10−4 -7.019 −3.855 · 10−4
−3.98 −3.96 −3.94 −3.92 −3.9 −3.88 −3.86 −3.84 −3.82x 10⁻⁴
−9.2
−9
−8.8
−8.6
−8.4
−8.2
−8
−7.8
−7.6
−7.4
−7.2
−1/RT
ln k
Figure 4: Plot of the natural logarithm of the rate constant, ln k, against −1/RT atpump level P = 60. A regression line is shown.
Linear regression gave the following expressions:
y = 148526x+ 49.887, P = 60 (4.1)
y = 148526x+ 50.309, P = 80 (4.2)
Here y corresponds to ln k and x to −1/RT . The activation energy, Ea is given by theslope of Eq. (4.1) and (4.2) and the natural logarithm of the preexponential factor lnAis given by the intersection. The results are given in Table ??
The rate constant, k, the conversion level, X and the mean bed-residence time, τ , were
10

−3.98 −3.96 −3.94 −3.92 −3.9 −3.88 −3.86 −3.84 −3.82x 10⁻⁴
−8.8
−8.6
−8.4
−8.2
−8
−7.8
−7.6
−7.4
−7.2
−7
−6.8
−1/RT
ln k
Figure 5: Plot of the natural logarithm of the rate constant, ln k, against −1/RT atpump level P = 80. A regression line is shown.
Table 6: The activation energy, Ea, and the natural logarithm of the preexponentialfactor, A, at the pump levels P = 60 and P = 80 found by linear regression.
P [-] Ea [kJ/mol] lnA [-]60 148.526 49.88780 148.526 50.309
11
calculated at steady state for all combinations of temperature and pump level. The resultsare summarized in Table 7.
Table 7: The activation energy, Ea, and the natural logarithm of the preexponentialfactor, A, at the pump levels P = 60 andP = 80 found by linear regression.
P [-] τ [s] T [◦C] k [s−1] X [-]60 12.71 30.1 1.13 · 10−4 0.07960 12.71 34.3 3.09 · 10−4 0.19160 12.71 38.8 5.87 · 10−4 0.30980 8.34 30.1 1.72 · 10−4 0.07980 8.34 34.3 4.71 · 10−4 0.19180 8.34 38.8 8.94 · 10−4 0.309
5 Discussion
It is observed that the pump level, P , does not affect the pH, and therefore not theconversion X. This can be seen from the definition of X, Eq. (2.10). As the initialconcentration of tBC, CtBC,0 is constant throughout the experiment, and the final con-centration of tBC, CtBC , is given by the pH, the conversion, X, will remain constant aslong as the pH does so.
It is also observed that the conversion increases with increasing temperature, which isexpected. The amount of tBC that reacts in the given mean bed-residence time willincrease as the temperature increases because of the increase in reaction rate. The factthat the reaction rate increases with temperature follows from the fact that the reactionis assumed to follows Arrhenius kinetics, as in Eq. (2.11). The equation clearly showsthat an increase in the temperature, T , leads to an increase in the rate constant, assumingthat the activation energy, Ea, is positive.
As expected, the activation energy found from the experimental data with P = 60 andP = 80 is equal. The value of the activation energy stems from the chemical propertiesof the atoms that take part in the reaction, as well as the interactions between these andthe solvent molecules. It is not affected by the flow rate, as this does not change any ofthese properties.
The experiment shows that the reaction rate, k, increases as the pump level, P , increases.This is in accordance with the theory for the experiment, as an increase in P is the sameas a decrease in the mean bed-residence time, τ . As Eq. (2.8) shows, k is inverselyproportional to τ . This can also be understood from a logic argument; if the conversion
12
is to remain constant, and the time the reactants have to react goes down (τ decreases),the value of the rate constant has to increase.
The activation energy is determined from the Arrhenius plots given in Fig. 4 and Fig.5 using linear regression. As shown in Table 6, the result is Ea = 148, 5 kJ/mol forboth pump levels. This result does not seem to comply with the values found in theliterature [3]. However, the experimental conditions in the cited experiment differ are notidentical to the ones used in the current experiment, so the value should only be viewedas an indication. The reasons for the deviation, apart from the sources of error discussedbelow, are unknown.
There are several sources of error in this laboratory exercise. The volume of liquid in thereactor is not known accurately, but is approximated to be 207 mL. The reason for theuncertainty in the volume is caused by extensive stirring used to approach ideal mixing,which result in a conical shape of the liquid surface. Depending on the stirring speed,the volume may be either larger or smaller than the given value.
The pump seemed to pump the H2O faster than the tBC, as there was about 50 mL moreof the tBC-solution at the end of the experiment (the experiment lasted approximately3 hours). This difference in flow of the two feed solutions will have caused the actualconcentration of tBC to be lower than the theoretical value used in the calculations. Thisdeviation will introduce an error that will propagate through all the results, leading to adecreased value for k and a consequently increased value for Ea.
Furthermore, the reactor is approximated as a CSTR, and ideal stirring is assumed. Thiswill obviously introduce some degree of error, as the mixing in reality is not ideal. Theremight also be an error resulting from the fact that air bubbles in the hoses did cause theflow of the two reactants to be rather unsteady. Both these deviations may have affectedthe results.
The temperature readings might be inaccurate, as the three thermometers all showeddifferent temperatures.
Twb < Tthermo < TpH−meter (5.1)
where Twb is the temperature of the water bath, Tthermo is the temperature of the ther-mometer in the reactor, and TpH−meter is the temperature reading from the pH-meter. Itis assumed that Tthermo is the most accurate, and this is used in the calculations.
13
Trondheim, November 5, 2011.
Øyvind Eraker Kjetil Sonerud Ove Øyås
6 References
[1] CSTR study: The reaction of t-butyl chloride and water, 2011. Viewed 3 Novem-ber 2011. http://www.nt.ntnu.no/users/preisig/Repository/TKP_4110_
Felles_Lab/experiment%20descriptions/3_CSTR_study_hydrolysis_t-butyl_
chloride_2010-08-20.pdf.
[2] Fogler, S., 2006. Elements of Chemical Reaction Engineering. 4th ed. Pearson Educa-tion pp. 38-39
[3] Landgrebe, J.A., 1964. A simple kinetic investigation of an organic reaction mecha-nism. Journal of Chemical Education, Vol. 41 (10).
[4] Aylward, G. and Findlay, T., 2008. SI Chemical Data. 6th ed. John Wiley & SonsAustralia.
14
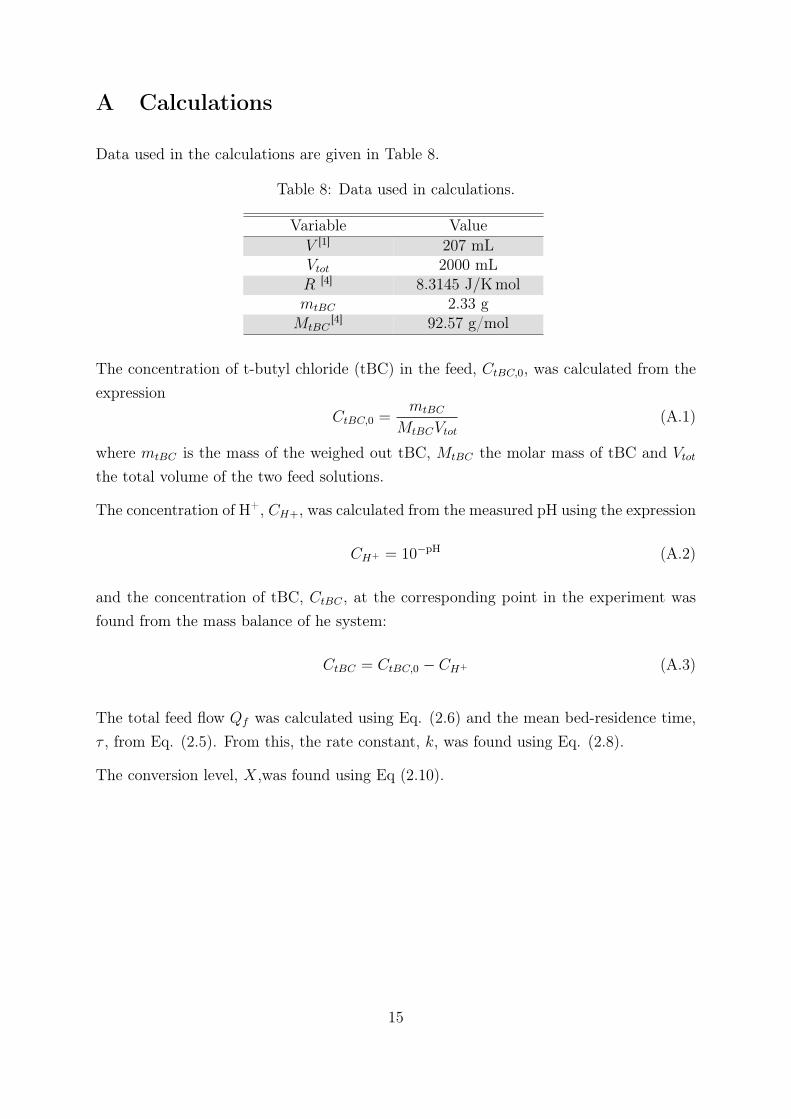
A Calculations
Data used in the calculations are given in Table 8.
Table 8: Data used in calculations.
Variable ValueV [1] 207 mLVtot 2000 mLR [4] 8.3145 J/KmolmtBC 2.33 gMtBC
[4] 92.57 g/mol
The concentration of t-butyl chloride (tBC) in the feed, CtBC,0, was calculated from theexpression
CtBC,0 =mtBC
MtBCVtot(A.1)
where mtBC is the mass of the weighed out tBC, MtBC the molar mass of tBC and Vtotthe total volume of the two feed solutions.
The concentration of H+, CH+, was calculated from the measured pH using the expression
CH+ = 10−pH (A.2)
and the concentration of tBC, CtBC , at the corresponding point in the experiment wasfound from the mass balance of he system:
CtBC = CtBC,0 − CH+ (A.3)
The total feed flow Qf was calculated using Eq. (2.6) and the mean bed-residence time,τ , from Eq. (2.5). From this, the rate constant, k, was found using Eq. (2.8).
The conversion level, X,was found using Eq (2.10).
15
NTNU
Norges teknisk-naturvitenskapelige
universitet
Kjemikaliekort
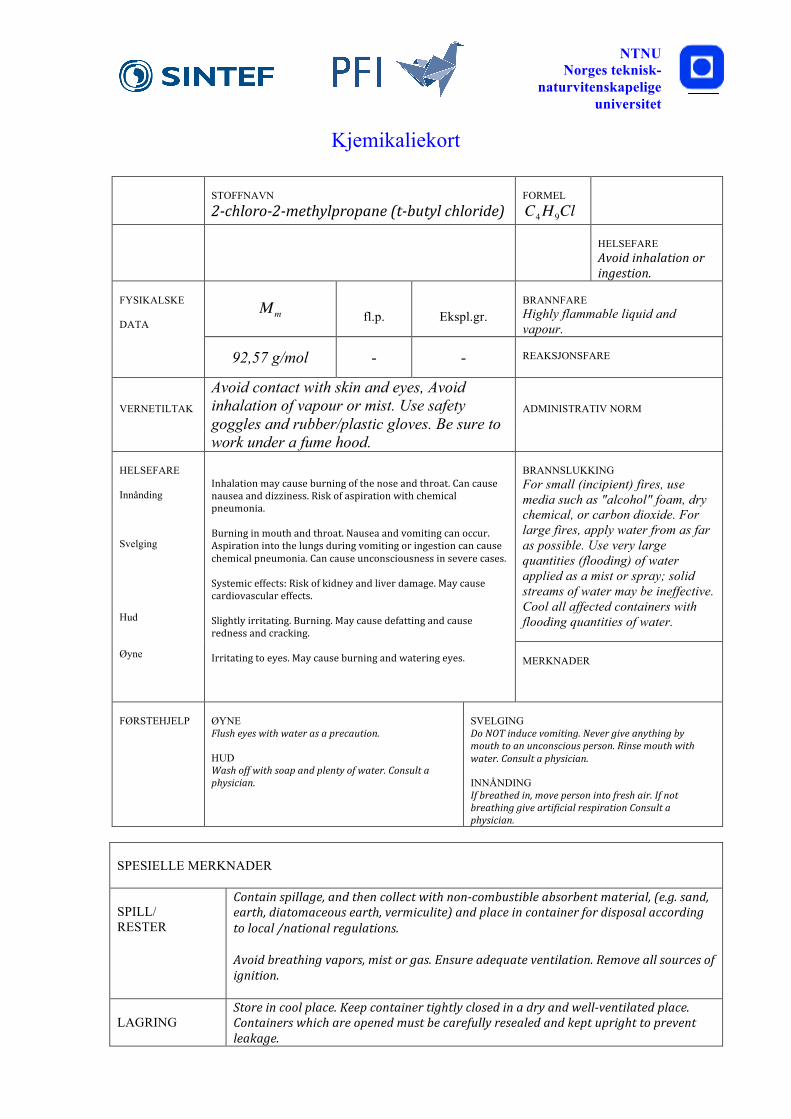
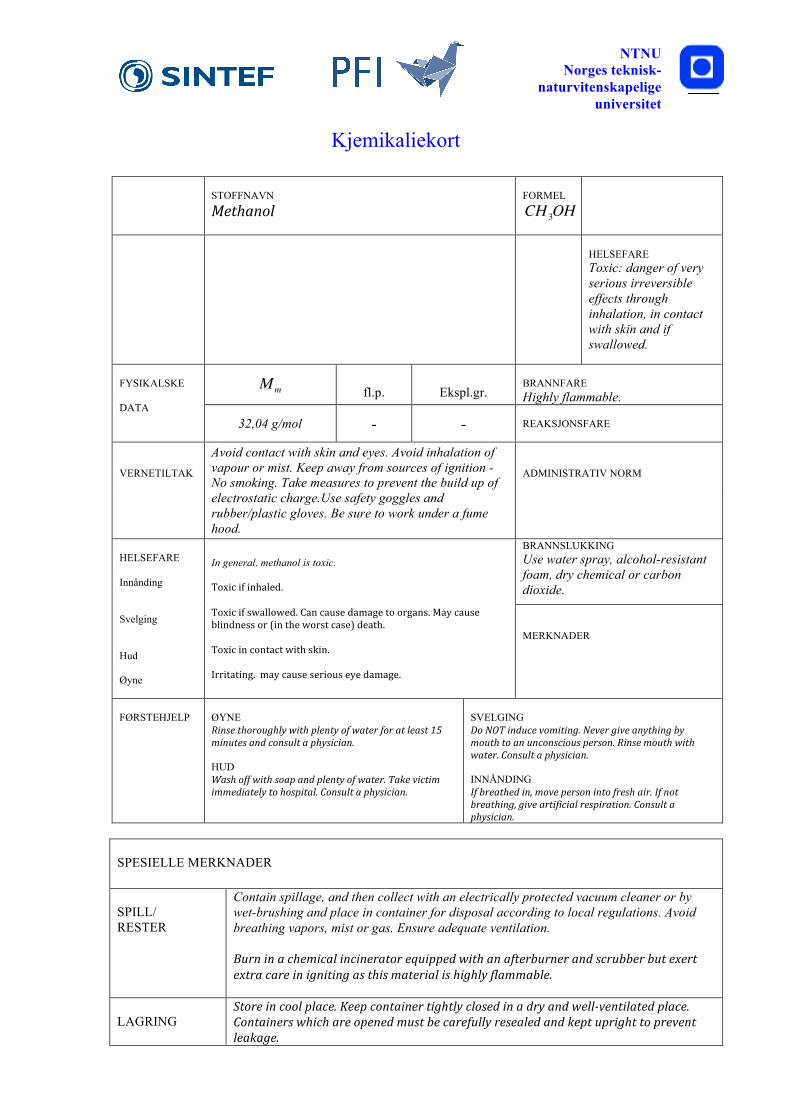
STOFFNAVN 2-chloro-2-methylpropane (t-butyl chloride)
FORMEL C4H9Cl
HELSEFARE Avoid inhalation or ingestion.
Mm
fl.p.
Ekspl.gr.
BRANNFARE Highly flammable liquid and vapour.
FYSIKALSKE DATA
92,57 g/mol - - REAKSJONSFARE
VERNETILTAK
Avoid contact with skin and eyes, Avoid inhalation of vapour or mist. Use safety goggles and rubber/plastic gloves. Be sure to work under a fume hood.
ADMINISTRATIV NORM
BRANNSLUKKING For small (incipient) fires, use media such as "alcohol" foam, dry chemical, or carbon dioxide. For large fires, apply water from as far as possible. Use very large quantities (flooding) of water applied as a mist or spray; solid streams of water may be ineffective. Cool all affected containers with flooding quantities of water.
HELSEFARE Innånding Svelging Hud Øyne
Inhalation may cause burning of the nose and throat. Can cause nausea and dizziness. Risk of aspiration with chemical pneumonia. Burning in mouth and throat. Nausea and vomiting can occur. Aspiration into the lungs during vomiting or ingestion can cause chemical pneumonia. Can cause unconsciousness in severe cases. Systemic effects: Risk of kidney and liver damage. May cause cardiovascular effects. Slightly irritating. Burning. May cause defatting and cause redness and cracking. Irritating to eyes. May cause burning and watering eyes.
MERKNADER
FØRSTEHJELP
ØYNE Flush eyes with water as a precaution. HUD Wash off with soap and plenty of water. Consult a physician.
SVELGING Do NOT induce vomiting. Never give anything by mouth to an unconscious person. Rinse mouth with water. Consult a physician. INNÅNDING If breathed in, move person into fresh air. If not breathing give artificial respiration Consult a physician.
SPESIELLE MERKNADER
SPILL/ RESTER
Contain spillage, and then collect with non-combustible absorbent material, (e.g. sand, earth, diatomaceous earth, vermiculite) and place in container for disposal according to local /national regulations. Avoid breathing vapors, mist or gas. Ensure adequate ventilation. Remove all sources of ignition.
LAGRING
Store in cool place. Keep container tightly closed in a dry and well-ventilated place. Containers which are opened must be carefully resealed and kept upright to prevent leakage.
NTNU
Norges teknisk-naturvitenskapelige
universitet
Kjemikaliekort
STOFFNAVN Methanol
FORMEL CH 3OH
HELSEFARE Toxic: danger of very serious irreversible effects through inhalation, in contact with skin and if swallowed.
Mm
fl.p.
Ekspl.gr.
BRANNFARE Highly flammable.
FYSIKALSKE DATA
32,04 g/mol - - REAKSJONSFARE
VERNETILTAK
Avoid contact with skin and eyes. Avoid inhalation of vapour or mist. Keep away from sources of ignition - No smoking. Take measures to prevent the build up of electrostatic charge.Use safety goggles and rubber/plastic gloves. Be sure to work under a fume hood.
ADMINISTRATIV NORM
BRANNSLUKKING Use water spray, alcohol-resistant foam, dry chemical or carbon dioxide.
HELSEFARE Innånding Svelging Hud Øyne
In general, methanol is toxic. Toxic if inhaled. Toxic if swallowed. Can cause damage to organs. May cause blindness or (in the worst case) death. Toxic in contact with skin. Irritating. may cause serious eye damage.
MERKNADER
FØRSTEHJELP
ØYNE Rinse thoroughly with plenty of water for at least 15 minutes and consult a physician. HUD Wash off with soap and plenty of water. Take victim immediately to hospital. Consult a physician.
SVELGING Do NOT induce vomiting. Never give anything by mouth to an unconscious person. Rinse mouth with water. Consult a physician. INNÅNDING If breathed in, move person into fresh air. If not breathing, give artificial respiration. Consult a physician.
SPESIELLE MERKNADER SPILL/ RESTER
Contain spillage, and then collect with an electrically protected vacuum cleaner or by wet-brushing and place in container for disposal according to local regulations. Avoid breathing vapors, mist or gas. Ensure adequate ventilation. Burn in a chemical incinerator equipped with an afterburner and scrubber but exert extra care in igniting as this material is highly flammable.
LAGRING
Store in cool place. Keep container tightly closed in a dry and well-ventilated place. Containers which are opened must be carefully resealed and kept upright to prevent leakage.
2 EL:’: q
1 -1 V
F CI
.4
-ftcr
1
0 0
rrL’-
ar
U’
-rI 0 (‘3 0
r 0r
()
C;
0
( C
C
C
—
Li
L;I
C.. c5
N 4
II
S C
Hi
-r
ii I
1HJC)
•1


![dcmep4q5dgnih.cloudfront.net · A Tin-chloride 'PI gives following reaction (unbalanced reaction) X [Monoanion pyramidal geometry] p + Me3N p + CuC12 z + (B) X is sp3 hybridised](https://img.pdfslide.net/doc/110x75/5e78e233d3ff0a43357d0f2c/a-tin-chloride-pi-gives-following-reaction-unbalanced-reaction-x-monoanion-pyramidal.jpg)