Embed Size (px)
Citation preview
CSUG/SPE 148886
Geomechanical Simulation of Caprock Performance for A Proposed, Low Pressure, Steam-Assisted Gravity Drainage Pilot Pro ject M.M.E. Uwiera-Gartner, RPS Energy Canada Ltd., M. R. Carlson, RPS Energy Canada Ltd., D. Walters, Taurus Reservoir Solutions Ltd., and C.T.S. Palmgren, Alberta Oilsands Inc.
Copyright 2011, Society of Petroleum Engineers This paper was prepared for presentation at the Canadian Unconventional Resources Conference held in Calgary, Alberta, Canada, 15–17 November 2011. This paper was selected for presentation by a CSUG/SPE program committee following review of information contained in an abstract submitted by the author(s). Contents of the paper have not been reviewed by the Society of Petroleum Engineers and are subject to correction by the author(s). The material does not necessarily reflect any position of the Society of Petroleum Engineers, its officers, or members. Electronic reproduction, distribution, or storage of any part of this paper without the written consent of the Society of Petroleum Engineers is prohibited. Permission to reproduce in print is restricted to an abstract of not more than 300 words; illustrations may not be copied. The abstract must contain conspicuous acknowledgment of SPE copyright.
Abstract For oil sands assets having bitumen resources located near the ground surface, geomechanical assessments of caprock performance during steam-assisted gravity drainage (SAGD) operations have become increasingly important. These assessments need to determine and demonstrate whether the caprock can effectively withstand the induced stress and strain loadings from the SAGD operation throughout the life of the development. The importance of caprock integrity for SAGD developments was realized following the loss of caprock containment at the Total E&P Canada Ltd., Joslyn Creek SAGD project in 2006. In light of this failure, the Alberta Energy Resources Conservation Board (ERCB) stipulated a series of response activities to address caprock integrity, including the requirement that pilot and commercial SAGD projects in Alberta need to conduct a geomechanical assessment of caprock integrity as part of the application process. The authors completed a geomechanical simulation study of the Clearwater Formation caprock performance at a proposed, shallow, low pressure, SAGD (LP-SAGD) pilot project located southeast of Fort McMurray, Alberta, Canada. For this investigation, a 3D, coupled, reservoir and geomechanical simulation was conducted forecasting 10 years of asset response to the maximum operating pressure of 1,000 kPaa. The geomechanical response of the caprock to temperature changes, increased pore pressure and the induced stress and strain fields from the steam chamber was simulated as part of the caprock integrity assessment for the pilot project. This paper presents the results of this simulation study and the uncertainties and risks associated with evaluating caprock containment of SAGD operations using numerical methods. The results of key geomechanical parameters, such as minimum principal effective stress, shear stress level, factor of safety and surface displacement are presented. A summary of the post-failure analyses of caprock containment at the Joslyn Creek SAGD project is presented. INTRODUCTION In northeast Alberta, bitumen resources of the Athabasca Oil Sands are relatively shallow, with about one-fifth of these shallow enough for surface mining. The remaining resources are anticipated to be exploited using steam-assisted gravity drainage (SAGD) or alternative in situ processes. As bitumen exploitation continues, shallow bitumen resources located about 100 m below ground surface (bgs) and with caprock thicknesses of about 50 m are being considered for development. These SAGD projects with less confining caprock and/or overburden thickness when compared to their deeper counterparts, require a more careful determination of maximum operating pressure (MOP). A geomechanical simulation study was completed for the Alberta Oilsands Inc.’s, (AOS’) proposed, Clearwater West Phase I Pilot Project (the “Pilot Project”) located 8 km southeast of Fort McMurray, Alberta. This asset will be developed using expanding solvent, low pressure SAGD (LP-SAGD) at the MOP of 1,000 kPaa, determined from this geomechanical study (AOS, 2010). A 10 year forecast period was simulated, investigating the geomechanical response of the Clearwater Formation caprock to the induced loadings of the LP-SAGD operation. A 3D numerical model was constructed using a quarter element of symmetry about the midpoint of the six wellpairs. A conservative approach was adopted for this study, with a simplified geological system and conservative elastic and shear strength parameters assigned to the model grid. The key geomechanical parameters,
2
evaluated in this study were Pilot Project performance, surface heave, fluid pressure, shear stress level, factor of safety (FoS), minimum principal effective stress and volumetric strain.
GEOMECHANICAL PROCESSES IN SAGDThere are numerous processes that occur in a SAGD operation processes include thermal expansion, pore pressure changes, dilation, shearingthe influence of the SAGD operation on the and mechanical properties of the strata also influence these processes.
Figure 1 - Geomechanical Processes Caused by the Heated Zone Thermal expansion of reservoir oil sands is an important aspect of SAGD oil sands to move vertically and laterally, transferring strain and deformation to the caprock and underburden strata. The tthermal expansion in the oil sands is comprised ofboundary conditions, heating of the oil sandincrease of the pore space of the rock. Typically, the trock matrix thereby causing an increase in reservoir pore pressure. with coupled models. The dissipation of viscosity. Thermal expansion of the oil sands also generates the lateral stresses in the heated zone, which may induce shearshoulders of the steam chamber’s region of influence. Heave which can extend to the ground surface, though Pore pressure changes resulting from steam chamber development impacts the effective and shear stresses of a geosystem. As the SAGD operation progresses, reducing the shear strength of the soil matrix. the Mohr-Coloumb shear failure criteria. Shear and associated deformation are expected in the McMurray Formation as these promote sand dilation and increases reservoir permeability. The caprock shear strength, however, must withstand the shear stresses developed by the SAGD operation in order to sustain asset integrity throughout the duration of the development. Thelow permeability of the caprock shales impedes the transmission of increased pore pressures from the reservoir thereby making it more resistant to shear failure. CLEARWATER WEST PHASE 1 PILOT PROJECTThe Pilot Project, which is owned and operated by AOS, is located about 8 km southeast of Fort McMurray, Alberta, Canada (Figure 2). The Pilot Project will initially consist of high quality, bitumen resources of the McMurray Formation. The Pilot Project is constrained by the maximum injection rate and MOP of 1,113 m3/d coldwater equivalent (CWE) steam and 1,000 kPaa, respectively. The codesigned at 86% CWE steam and 14% solvent. Once in operation, the Pilot Project is expected to produce up to 695 mbitumen and 165 m3/d solvent. Project startal., 2011).
performance, surface heave, fluid pressure, shear stress level, factor of safety (FoS), stress and volumetric strain.
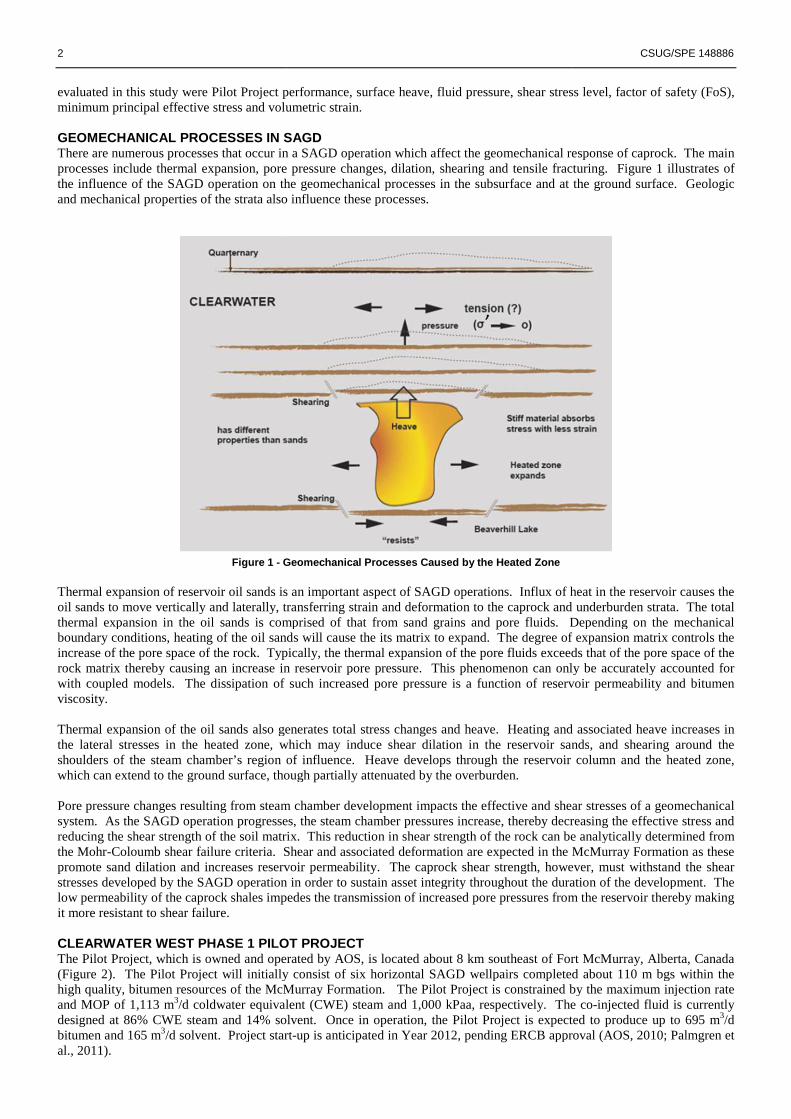
GEOMECHANICAL PROCESSES IN SAGD in a SAGD operation which affect the geomechanical response e pressure changes, dilation, shearing and tensile fracturing. Figure 1 illustrates of
the influence of the SAGD operation on the geomechanical processes in the subsurface and at the ground surface. Geologic also influence these processes.
Geomechanical Processes Caused by the Heated Zone
Thermal expansion of reservoir oil sands is an important aspect of SAGD operations. Influx of heat in the reservoir causes the oil sands to move vertically and laterally, transferring strain and deformation to the caprock and underburden strata. The tthermal expansion in the oil sands is comprised of that from sand grains and pore fluids. Depending on the mechanical boundary conditions, heating of the oil sands will cause the its matrix to expand. The degree of expansion increase of the pore space of the rock. Typically, the thermal expansion of the pore fluids exceeds that of the rock matrix thereby causing an increase in reservoir pore pressure. This phenomenon can only be accurately accounted for
issipation of such increased pore pressure is a function of reservoir permeability and bitumen
Thermal expansion of the oil sands also generates total stress changes and heave. Heating and associated heave increases, which may induce shear dilation in the reservoir sands
region of influence. Heave develops through the reservoir column and the heated zone, can extend to the ground surface, though partially attenuated by the overburden.
ressure changes resulting from steam chamber development impacts the effective and shear stresses of a geosystem. As the SAGD operation progresses, the steam chamber pressures increase, thereby decreasing the effective stres
the soil matrix. This reduction in shear strength of the rock can be analytically determined from failure criteria. Shear and associated deformation are expected in the McMurray Formation as these
tion and increases reservoir permeability. The caprock shear strength, however, must withstand the shear stresses developed by the SAGD operation in order to sustain asset integrity throughout the duration of the development. The
caprock shales impedes the transmission of increased pore pressures from the reservoir thereby making
CLEARWATER WEST PHASE 1 PILOT PROJECT The Pilot Project, which is owned and operated by AOS, is located about 8 km southeast of Fort McMurray, Alberta, Canada (Figure 2). The Pilot Project will initially consist of six horizontal SAGD wellpairs completed about 110 m bgs within the
y, bitumen resources of the McMurray Formation. The Pilot Project is constrained by the maximum injection rate /d coldwater equivalent (CWE) steam and 1,000 kPaa, respectively. The co
eam and 14% solvent. Once in operation, the Pilot Project is expected to produce up to 695 m/d solvent. Project start-up is anticipated in Year 2012, pending ERCB approval (AOS,
CSUG/SPE 148886
performance, surface heave, fluid pressure, shear stress level, factor of safety (FoS),
geomechanical response of caprock. The main and tensile fracturing. Figure 1 illustrates of
e and at the ground surface. Geologic
operations. Influx of heat in the reservoir causes the oil sands to move vertically and laterally, transferring strain and deformation to the caprock and underburden strata. The total
Depending on the mechanical matrix to expand. The degree of expansion matrix controls the
e pore fluids exceeds that of the pore space of the can only be accurately accounted for
n of reservoir permeability and bitumen
eating and associated heave increases in reservoir sands, and shearing around the
through the reservoir column and the heated zone,
ressure changes resulting from steam chamber development impacts the effective and shear stresses of a geomechanical decreasing the effective stress and
can be analytically determined from failure criteria. Shear and associated deformation are expected in the McMurray Formation as these
tion and increases reservoir permeability. The caprock shear strength, however, must withstand the shear stresses developed by the SAGD operation in order to sustain asset integrity throughout the duration of the development. The
caprock shales impedes the transmission of increased pore pressures from the reservoir thereby making
The Pilot Project, which is owned and operated by AOS, is located about 8 km southeast of Fort McMurray, Alberta, Canada horizontal SAGD wellpairs completed about 110 m bgs within the
y, bitumen resources of the McMurray Formation. The Pilot Project is constrained by the maximum injection rate /d coldwater equivalent (CWE) steam and 1,000 kPaa, respectively. The co-injected fluid is currently
eam and 14% solvent. Once in operation, the Pilot Project is expected to produce up to 695 m3/d approval (AOS, 2010; Palmgren et
CSUG/SPE 148886
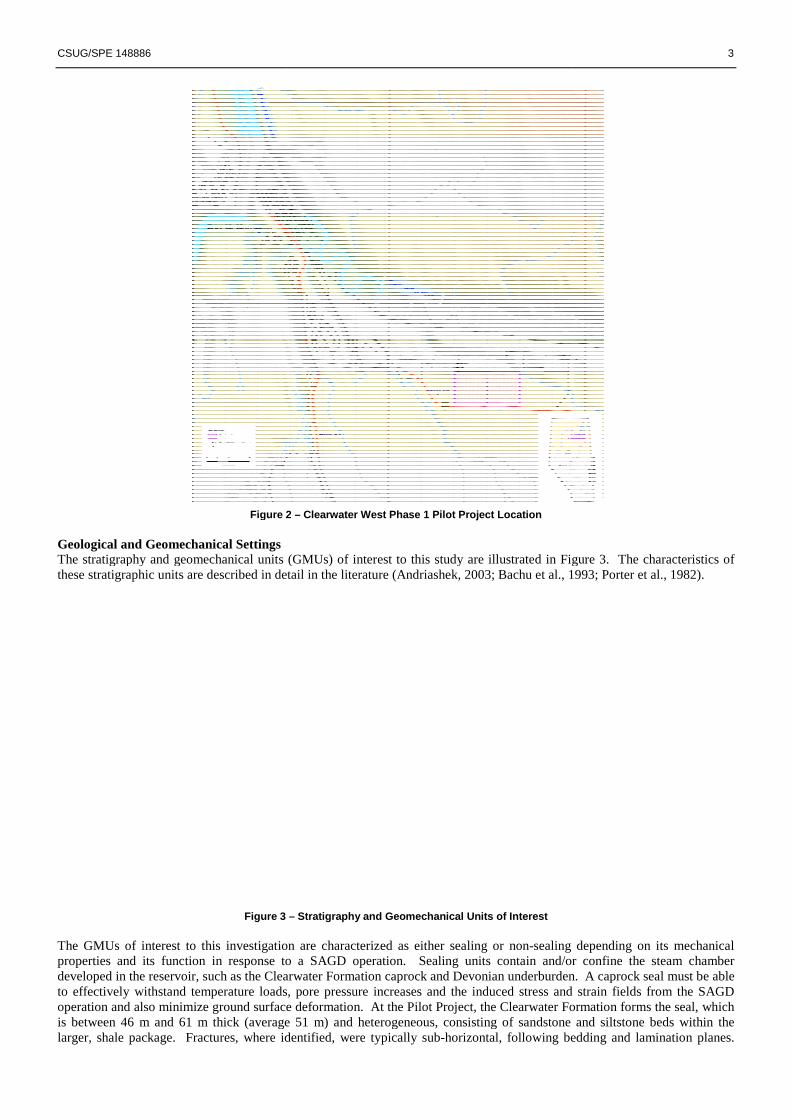
Figure 2 Geological and Geomechanical Settings The stratigraphy and geomechanical units (GMUs) of interest to this study are illustrated in Figure 3. The characteristics othese stratigraphic units are described in detail in t
Figure 3 The GMUs of interest to this investigation are characterized as either sealing or nonproperties and its function in response to a SAGD operation. Sealing units contain and/or confine the steam chamber developed in the reservoir, such as the Clearwater Formation caprock and Devonian underburden. A caprock seal must be able to effectively withstand temperature loads, pore pressure increases and the induced stress and strain fields from the SAGD operation and also minimize ground surface defis between 46 m and 61 m thick (average 51 m) and heterogeneous, consisting of sandstone and siltstone beds within the larger, shale package. Fractures, where identified, were
Figure 2 – Clearwater West Phase 1 Pilot Project Location
The stratigraphy and geomechanical units (GMUs) of interest to this study are illustrated in Figure 3. The characteristics othese stratigraphic units are described in detail in the literature (Andriashek, 2003; Bachu et al., 1993;
– Stratigraphy and Geomechanical Units of Interest
to this investigation are characterized as either sealing or non-sealing depending on its mechanical properties and its function in response to a SAGD operation. Sealing units contain and/or confine the steam chamber
he Clearwater Formation caprock and Devonian underburden. A caprock seal must be able to effectively withstand temperature loads, pore pressure increases and the induced stress and strain fields from the SAGD operation and also minimize ground surface deformation. At the Pilot Project, the Clearwater Formation forms the seal, which is between 46 m and 61 m thick (average 51 m) and heterogeneous, consisting of sandstone and siltstone beds within the larger, shale package. Fractures, where identified, were typically sub-horizontal, following bedding and lamination planes.
3
The stratigraphy and geomechanical units (GMUs) of interest to this study are illustrated in Figure 3. The characteristics of k, 2003; Bachu et al., 1993; Porter et al., 1982).
sealing depending on its mechanical properties and its function in response to a SAGD operation. Sealing units contain and/or confine the steam chamber
he Clearwater Formation caprock and Devonian underburden. A caprock seal must be able to effectively withstand temperature loads, pore pressure increases and the induced stress and strain fields from the SAGD
ormation. At the Pilot Project, the Clearwater Formation forms the seal, which is between 46 m and 61 m thick (average 51 m) and heterogeneous, consisting of sandstone and siltstone beds within the
tal, following bedding and lamination planes.
4 CSUG/SPE 148886
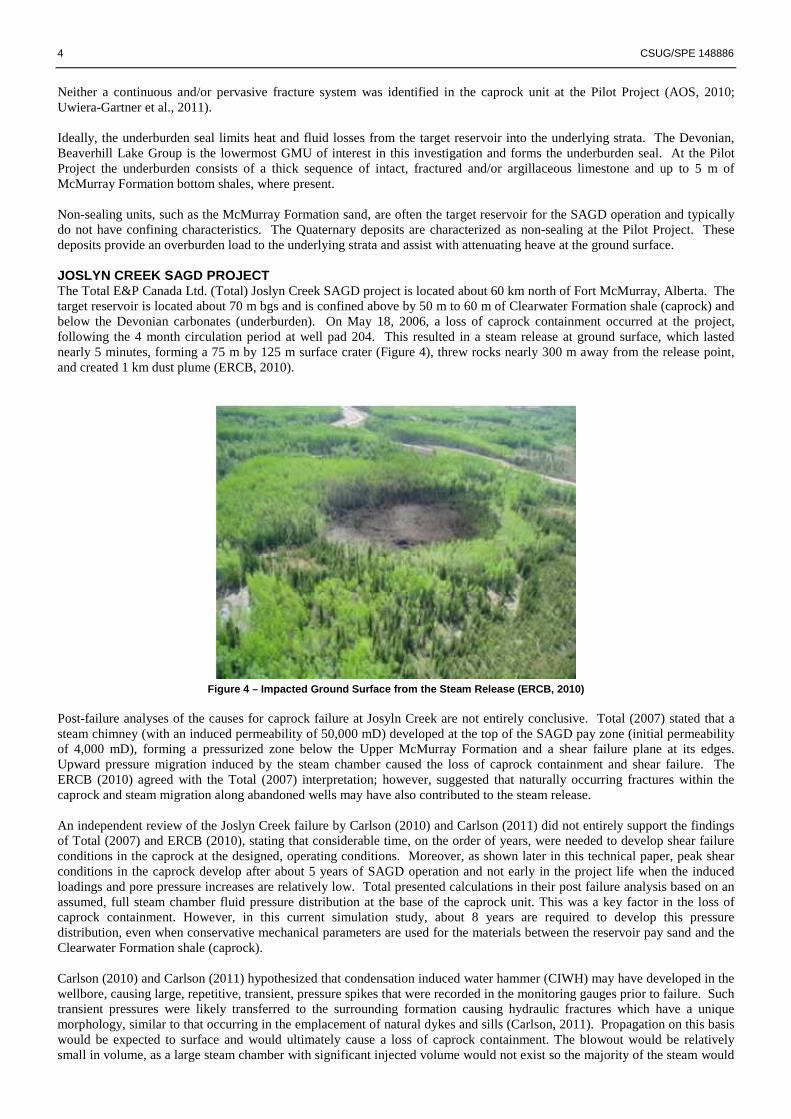
Neither a continuous and/or pervasive fracture system was identified in the caprock unit at the Pilot Project (AOS, 2010; Uwiera-Gartner et al., 2011). Ideally, the underburden seal limits heat and fluid losses from the target reservoir into the underlying strata. The Devonian, Beaverhill Lake Group is the lowermost GMU of interest in this investigation and forms the underburden seal. At the Pilot Project the underburden consists of a thick sequence of intact, fractured and/or argillaceous limestone and up to 5 m of McMurray Formation bottom shales, where present. Non-sealing units, such as the McMurray Formation sand, are often the target reservoir for the SAGD operation and typically do not have confining characteristics. The Quaternary deposits are characterized as non-sealing at the Pilot Project. These deposits provide an overburden load to the underlying strata and assist with attenuating heave at the ground surface. JOSLYN CREEK SAGD PROJECT The Total E&P Canada Ltd. (Total) Joslyn Creek SAGD project is located about 60 km north of Fort McMurray, Alberta. The target reservoir is located about 70 m bgs and is confined above by 50 m to 60 m of Clearwater Formation shale (caprock) and below the Devonian carbonates (underburden). On May 18, 2006, a loss of caprock containment occurred at the project, following the 4 month circulation period at well pad 204. This resulted in a steam release at ground surface, which lasted nearly 5 minutes, forming a 75 m by 125 m surface crater (Figure 4), threw rocks nearly 300 m away from the release point, and created 1 km dust plume (ERCB, 2010).
Figure 4 – Impacted Ground Surface from the Steam R elease (ERCB, 2010)
Post-failure analyses of the causes for caprock failure at Josyln Creek are not entirely conclusive. Total (2007) stated that a steam chimney (with an induced permeability of 50,000 mD) developed at the top of the SAGD pay zone (initial permeability of 4,000 mD), forming a pressurized zone below the Upper McMurray Formation and a shear failure plane at its edges. Upward pressure migration induced by the steam chamber caused the loss of caprock containment and shear failure. The ERCB (2010) agreed with the Total (2007) interpretation; however, suggested that naturally occurring fractures within the caprock and steam migration along abandoned wells may have also contributed to the steam release.
An independent review of the Joslyn Creek failure by Carlson (2010) and Carlson (2011) did not entirely support the findings of Total (2007) and ERCB (2010), stating that considerable time, on the order of years, were needed to develop shear failure conditions in the caprock at the designed, operating conditions. Moreover, as shown later in this technical paper, peak shear conditions in the caprock develop after about 5 years of SAGD operation and not early in the project life when the induced loadings and pore pressure increases are relatively low. Total presented calculations in their post failure analysis based on an assumed, full steam chamber fluid pressure distribution at the base of the caprock unit. This was a key factor in the loss of caprock containment. However, in this current simulation study, about 8 years are required to develop this pressure distribution, even when conservative mechanical parameters are used for the materials between the reservoir pay sand and the Clearwater Formation shale (caprock). Carlson (2010) and Carlson (2011) hypothesized that condensation induced water hammer (CIWH) may have developed in the wellbore, causing large, repetitive, transient, pressure spikes that were recorded in the monitoring gauges prior to failure. Such transient pressures were likely transferred to the surrounding formation causing hydraulic fractures which have a unique morphology, similar to that occurring in the emplacement of natural dykes and sills (Carlson, 2011). Propagation on this basis would be expected to surface and would ultimately cause a loss of caprock containment. The blowout would be relatively small in volume, as a large steam chamber with significant injected volume would not exist so the majority of the steam would
CSUG/SPE 148886 5
be in the fracture. Note that no significant steam chamber development would be expected in the few weeks after the completion of circulation.
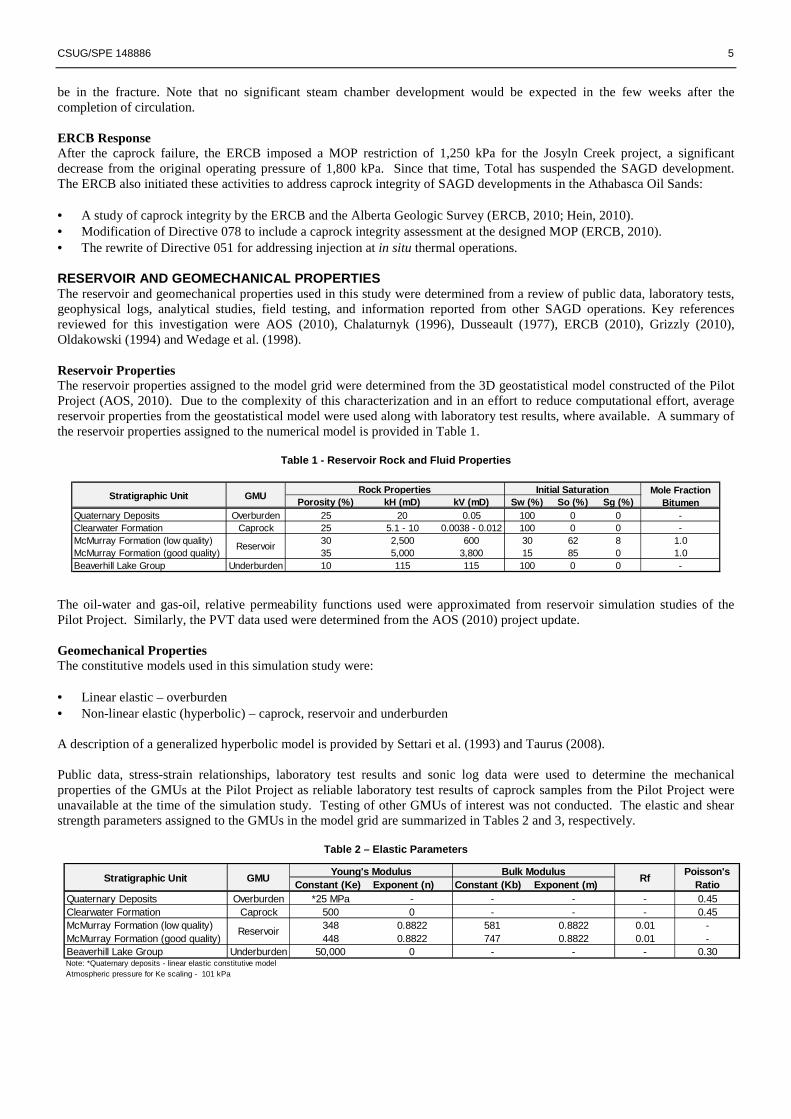
ERCB Response After the caprock failure, the ERCB imposed a MOP restriction of 1,250 kPa for the Josyln Creek project, a significant decrease from the original operating pressure of 1,800 kPa. Since that time, Total has suspended the SAGD development. The ERCB also initiated these activities to address caprock integrity of SAGD developments in the Athabasca Oil Sands: • A study of caprock integrity by the ERCB and the Alberta Geologic Survey (ERCB, 2010; Hein, 2010). • Modification of Directive 078 to include a caprock integrity assessment at the designed MOP (ERCB, 2010). • The rewrite of Directive 051 for addressing injection at in situ thermal operations. RESERVOIR AND GEOMECHANICAL PROPERTIES The reservoir and geomechanical properties used in this study were determined from a review of public data, laboratory tests, geophysical logs, analytical studies, field testing, and information reported from other SAGD operations. Key references reviewed for this investigation were AOS (2010), Chalaturnyk (1996), Dusseault (1977), ERCB (2010), Grizzly (2010), Oldakowski (1994) and Wedage et al. (1998). Reservoir Properties The reservoir properties assigned to the model grid were determined from the 3D geostatistical model constructed of the Pilot Project (AOS, 2010). Due to the complexity of this characterization and in an effort to reduce computational effort, average reservoir properties from the geostatistical model were used along with laboratory test results, where available. A summary of the reservoir properties assigned to the numerical model is provided in Table 1.
Table 1 - Reservoir Rock and Fluid Properties
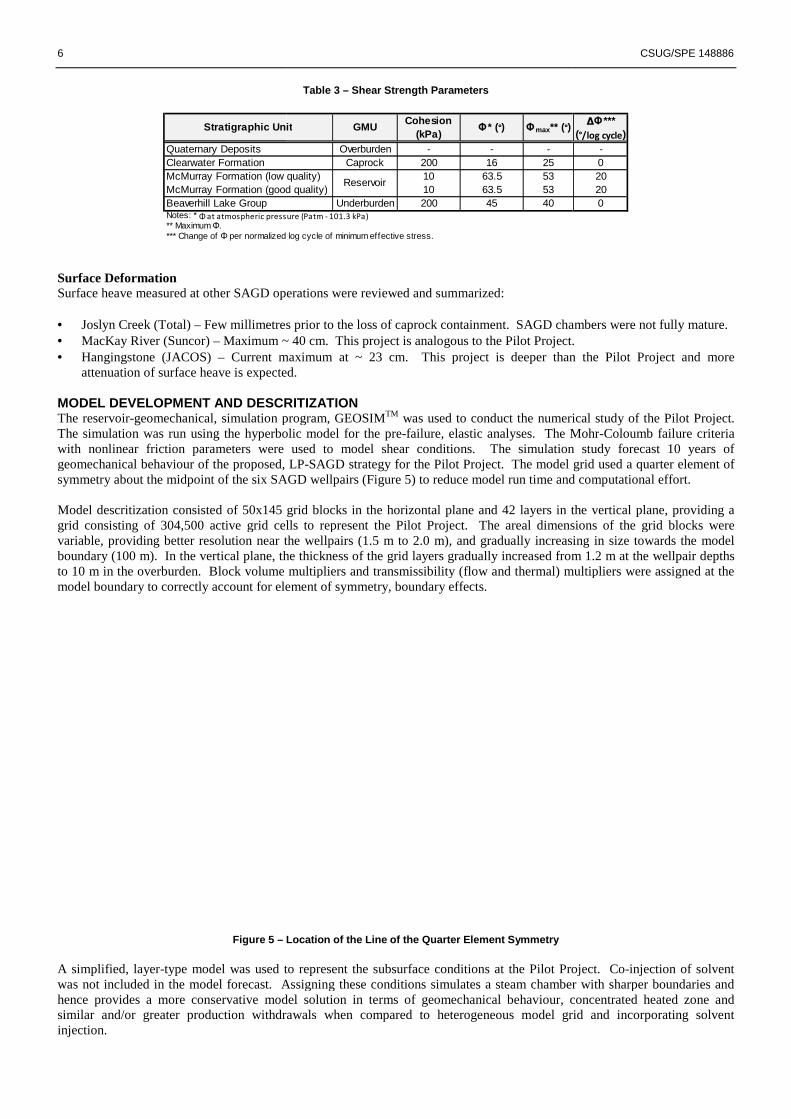
The oil-water and gas-oil, relative permeability functions used were approximated from reservoir simulation studies of the Pilot Project. Similarly, the PVT data used were determined from the AOS (2010) project update. Geomechanical Properties The constitutive models used in this simulation study were: • Linear elastic – overburden • Non-linear elastic (hyperbolic) – caprock, reservoir and underburden A description of a generalized hyperbolic model is provided by Settari et al. (1993) and Taurus (2008). Public data, stress-strain relationships, laboratory test results and sonic log data were used to determine the mechanical properties of the GMUs at the Pilot Project as reliable laboratory test results of caprock samples from the Pilot Project were unavailable at the time of the simulation study. Testing of other GMUs of interest was not conducted. The elastic and shear strength parameters assigned to the GMUs in the model grid are summarized in Tables 2 and 3, respectively.
Table 2 – Elastic Parameters
Porosity (%) kH (mD) kV (mD) Sw (%) So (%) Sg (%)Quaternary Deposits Overburden 25 20 0.05 100 0 0 -Clearwater Formation Caprock 25 5.1 - 10 0.0038 - 0.012 100 0 0 -McMurray Formation (low quality) 30 2,500 600 30 62 8 1.0McMurray Formation (good quality) 35 5,000 3,800 15 85 0 1.0Beaverhill Lake Group Underburden 10 115 115 100 0 0 -
Mole Fraction Bitumen
Rock Properties Initial SaturationStratigraphic Unit GMU
Reservoir
Constant (Ke) Exponent (n) Constant (Kb) Exponent (m)Quaternary Deposits Overburden *25 MPa - - - - 0.45Clearwater Formation Caprock 500 0 - - - 0.45McMurray Formation (low quality) 348 0.8822 581 0.8822 0.01 -McMurray Formation (good quality) 448 0.8822 747 0.8822 0.01 -Beaverhill Lake Group Underburden 50,000 0 - - - 0.30Note: *Quaternary deposits - linear elastic constitutive modelAtmospheric pressure for Ke scaling - 101 kPa
Reservoir
Poisson's Ratio
RfStratigraphic Unit GMUYoung's Modulus Bulk Modulus
6
Surface Deformation Surface heave measured at other SAGD operations were reviewed and summarized: • Joslyn Creek (Total) – Few millimetres prior to the loss of caprock containment. SAGD chambers were not fully mature.• MacKay River (Suncor) – Maximum ~ 40 cm. This project is• Hangingstone (JACOS) – Current maximum at ~ 23 cm. This project is deeper th
attenuation of surface heave is expected. MODEL DEVELOPMENT AND DESCRITIZATIONThe reservoir-geomechanical, simulation program, GEOSIMThe simulation was run using the hyperbolic model for the prewith nonlinear friction parameters were used to model shear conditions. The simulation study forecast 10 years of geomechanical behaviour of the proposed, LPsymmetry about the midpoint of the six SAGD well
Model descritization consisted of 50x145 grid blocks in the horizontal plane and 42 layers in the vertical plane, grid consisting of 304,500 active grid cells to represent the Pilvariable, providing better resolution near the boundary (100 m). In the vertical plane, theto 10 m in the overburden. Block volume multipliermodel boundary to correctly account for element of symmetry,
Figure 5 – Location of the A simplified, layer-type model was used to represent the subsurface conditions at the Pilot Project. Cowas not included in the model forecast. Assigning thesehence provides a more conservative model solution in terms ofsimilar and/or greater production withdrawalsinjection.
Quaternary DepositsClearwater FormationMcMurray Formation (low quality)McMurray Formation (good quality)Beaverhill Lake GroupNotes: * Φ at atmospheric pressure (Patm - 101.3 kPa)** Maximum Φ.*** Change of Φ per normalized log cycle of minimum effective stress.
Stratigraphic Unit
Table 3 – Shear Strength Parameters
Surface heave measured at other SAGD operations were reviewed and summarized:
Few millimetres prior to the loss of caprock containment. SAGD chambers were not fully mature.Maximum ~ 40 cm. This project is analogous to the Pilot Project.
Current maximum at ~ 23 cm. This project is deeper than the Pilot Project and more attenuation of surface heave is expected.
MODEL DEVELOPMENT AND DESCRITIZATION program, GEOSIMTM was used to conduct the numerical
was run using the hyperbolic model for the pre-failure, elastic analyses. The Mohrwere used to model shear conditions. The simulation study forecast 10 years of
geomechanical behaviour of the proposed, LP-SAGD strategy for the Pilot Project. The model SAGD wellpairs (Figure 5) to reduce model run time and computational effort.
scritization consisted of 50x145 grid blocks in the horizontal plane and 42 layers in the vertical plane, grid cells to represent the Pilot Project. The areal dimensions of the grid blocks
the wellpairs (1.5 m to 2.0 m), and gradually increasing(100 m). In the vertical plane, the thickness of the grid layers gradually increased from 1.2 m at the wellpair depths
lock volume multipliers and transmissibility (flow and thermal) multipliers werecorrectly account for element of symmetry, boundary effects.
Location of the Line of the Quarter Element Symmetry
was used to represent the subsurface conditions at the Pilot Project. Cowas not included in the model forecast. Assigning these conditions simulates a steam chamber with sharper boundaries
conservative model solution in terms of geomechanical behaviour, concentrated heated zone and withdrawals when compared to heterogeneous model grid and incorporating solvent
Overburden - - -Caprock 200 16 25
McMurray Formation (low quality) 10 63.5 53McMurray Formation (good quality) 10 63.5 53
Underburden 200 45 40Φ at atmospheric pressure (Patm - 101.3 kPa)
per normalized log cycle of minimum effective stress.
Stratigraphic Unit GMU
Reservoir
Cohesion (kPa)
Φ* (°) Φmax** (°)
CSUG/SPE 148886
Few millimetres prior to the loss of caprock containment. SAGD chambers were not fully mature. analogous to the Pilot Project.
n the Pilot Project and more
numerical study of the Pilot Project. Mohr-Coloumb failure criteria
were used to model shear conditions. The simulation study forecast 10 years of model grid used a quarter element of
(Figure 5) to reduce model run time and computational effort.
scritization consisted of 50x145 grid blocks in the horizontal plane and 42 layers in the vertical plane, providing a The areal dimensions of the grid blocks were
(1.5 m to 2.0 m), and gradually increasing in size towards the model gradually increased from 1.2 m at the wellpair depths
s and transmissibility (flow and thermal) multipliers were assigned at the
was used to represent the subsurface conditions at the Pilot Project. Co-injection of solvent a steam chamber with sharper boundaries and
geomechanical behaviour, concentrated heated zone and us model grid and incorporating solvent
-020200
∆Φ*** (°/log cycle)
CSUG/SPE 148886
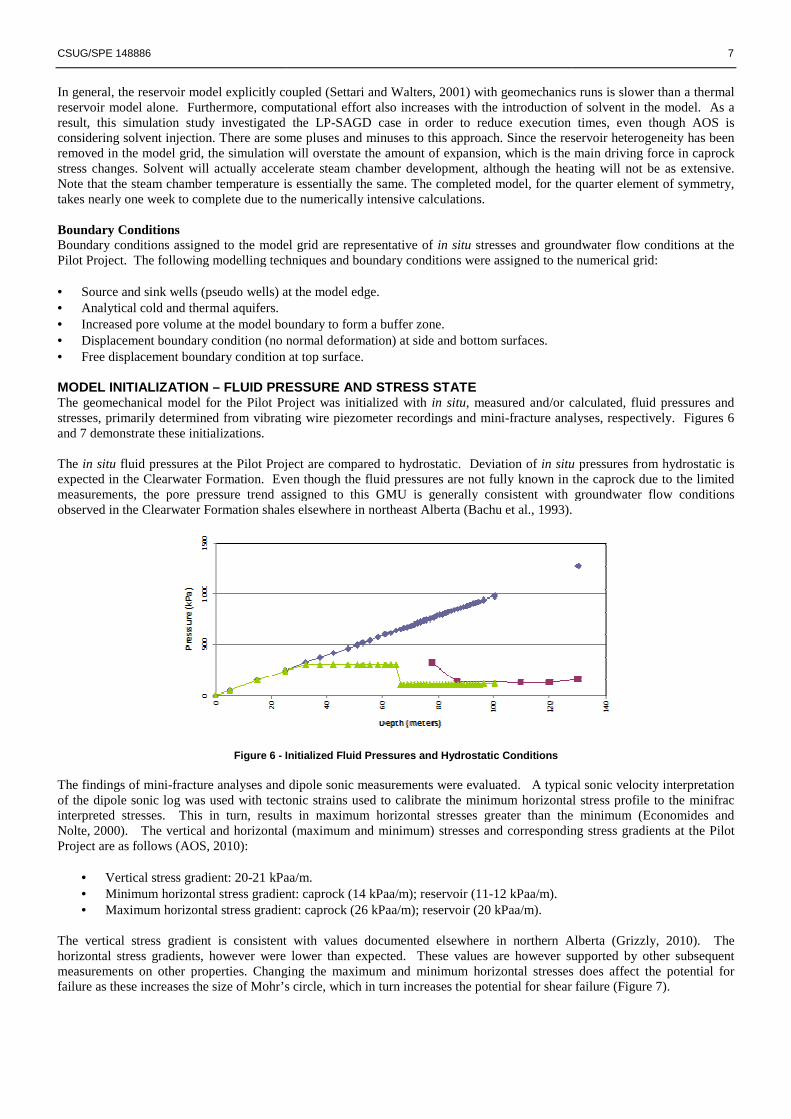
In general, the reservoir model explicitly coupled reservoir model alone. Furthermore, computational effort also increases withresult, this simulation study investigated the LPconsidering solvent injection. There are some pluses and minuses to this approach. Since theremoved in the model grid, the simulation will overstate the amount of expansion, which is the main driving force stress changes. Solvent will actually accelerate steam chamber development, although the heating Note that the steam chamber temperature is essentially the same. The completed model, for the quarter element of takes nearly one week to complete due to the numerically intensive calculations. Boundary Conditions Boundary conditions assigned to the model grid are represenPilot Project. The following modelling techniques and boundary conditions were assigned to the numerical grid: • Source and sink wells (pseudo wells) at the model edge.• Analytical cold and thermal aquifers. • Increased pore volume at the model boundary to form a buffer zone.• Displacement boundary condition (no normal deformation) at side and bottom surfaces.• Free displacement boundary condition at top surface. MODEL INITIALIZATION – FLUID PRESSURE AND STRESS STATEThe geomechanical model for the Pilot Project was initialized withstresses, primarily determined from vibrating wire piezometer recordings and miniand 7 demonstrate these initializations. The in situ fluid pressures at the Pilot Project are compared to hydrostatic. Deviation expected in the Clearwater Formation. Even though the fluid pressures are not fully known in the caprock measurements, the pore pressure trend assigned to this GMU is generally consistent with groundwater flow conditions observed in the Clearwater Formation shales elsewhere in northeast Alberta
Figure 6 - Initialized
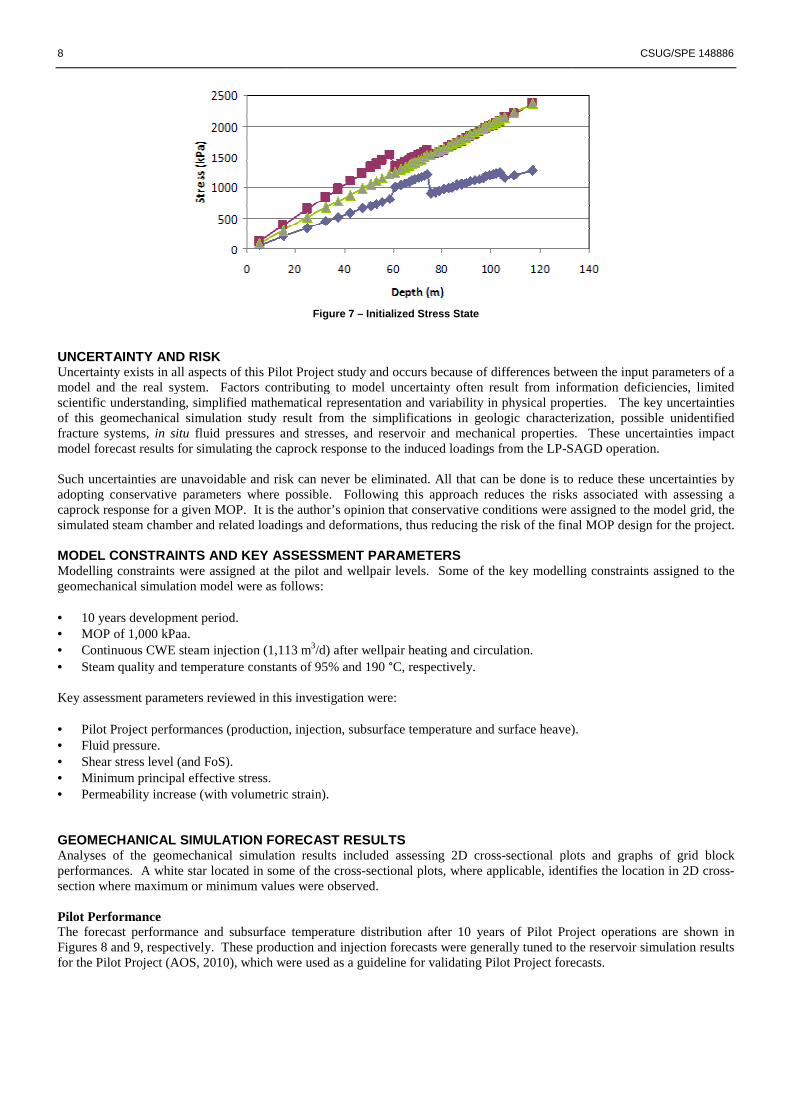
The findings of mini-fracture analyses and dipole sonic measurements were evaluatedof the dipole sonic log was used with tectonic strains used to calibrate the minimum horizontal stress profile to the minifrainterpreted stresses. This in turn, results in maximum horizontal strNolte, 2000). The vertical and horizontal (maximum and minimum) stresses and corresponding stress gProject are as follows (AOS, 2010):
• Vertical stress gradient: 20-21 kPaa/m• Minimum horizontal stress gradient: caprock (14• Maximum horizontal stress gradient: caprock (26 kPaa/m); reservoir (20 kPaa/m)
The vertical stress gradient is consistent horizontal stress gradients, however were lower than expected. These values are however supported by other subsequent measurements on other properties. Changing the maximum and minfailure as these increases the size of Mohr’s circle,
coupled (Settari and Walters, 2001) with geomechanics reservoir model alone. Furthermore, computational effort also increases with the introduction of solvent in the model. As a
y investigated the LP-SAGD case in order to reduce execution times, even though AOS is considering solvent injection. There are some pluses and minuses to this approach. Since the reservoir heterogeneity has been removed in the model grid, the simulation will overstate the amount of expansion, which is the main driving force
olvent will actually accelerate steam chamber development, although the heating Note that the steam chamber temperature is essentially the same. The completed model, for the quarter element of takes nearly one week to complete due to the numerically intensive calculations.
ary conditions assigned to the model grid are representative of in situ stresses and groundwater flow conditions at the Pilot Project. The following modelling techniques and boundary conditions were assigned to the numerical grid:
pseudo wells) at the model edge.
at the model boundary to form a buffer zone. Displacement boundary condition (no normal deformation) at side and bottom surfaces.
condition at top surface.
FLUID PRESSURE AND STRESS STATE Project was initialized with in situ, measured and/or calculated, fluid pressures and
stresses, primarily determined from vibrating wire piezometer recordings and mini-fracture analyses, respectively. Figures 6
lot Project are compared to hydrostatic. Deviation of in siturmation. Even though the fluid pressures are not fully known in the caprock
assigned to this GMU is generally consistent with groundwater flow conditions observed in the Clearwater Formation shales elsewhere in northeast Alberta (Bachu et al., 1993).
Initialized Fluid Pressures and Hydrostatic Conditions
fracture analyses and dipole sonic measurements were evaluated. A typical sonic velocity interpretation of the dipole sonic log was used with tectonic strains used to calibrate the minimum horizontal stress profile to the minifra
results in maximum horizontal stresses greater than the minimum vertical and horizontal (maximum and minimum) stresses and corresponding stress g
21 kPaa/m. horizontal stress gradient: caprock (14 kPaa/m); reservoir (11-12 kPaa/m).
Maximum horizontal stress gradient: caprock (26 kPaa/m); reservoir (20 kPaa/m).
The vertical stress gradient is consistent with values documented elsewhere in northern Alberta (Grizzly, 2010). The were lower than expected. These values are however supported by other subsequent
measurements on other properties. Changing the maximum and minimum horizontal stresses does afses the size of Mohr’s circle, which in turn increases the potential for shear
7
) with geomechanics runs is slower than a thermal the introduction of solvent in the model. As a
in order to reduce execution times, even though AOS is reservoir heterogeneity has been
removed in the model grid, the simulation will overstate the amount of expansion, which is the main driving force in caprock olvent will actually accelerate steam chamber development, although the heating will not be as extensive.
Note that the steam chamber temperature is essentially the same. The completed model, for the quarter element of symmetry,
stresses and groundwater flow conditions at the Pilot Project. The following modelling techniques and boundary conditions were assigned to the numerical grid:
, measured and/or calculated, fluid pressures and fracture analyses, respectively. Figures 6
in situ pressures from hydrostatic is rmation. Even though the fluid pressures are not fully known in the caprock due to the limited
assigned to this GMU is generally consistent with groundwater flow conditions (Bachu et al., 1993).
A typical sonic velocity interpretation of the dipole sonic log was used with tectonic strains used to calibrate the minimum horizontal stress profile to the minifrac
esses greater than the minimum (Economides and vertical and horizontal (maximum and minimum) stresses and corresponding stress gradients at the Pilot
with values documented elsewhere in northern Alberta (Grizzly, 2010). The were lower than expected. These values are however supported by other subsequent
imum horizontal stresses does affect the potential for which in turn increases the potential for shear failure (Figure 7).
8
UNCERTAINTY AND RISK Uncertainty exists in all aspects of this Pilot Project study and occurs because of differences between the input parameters of a model and the real system. Factors contributing to model uncertainty often result from information deficiencies, limited scientific understanding, simplified mathematical representation and variability in physical properties. The key uncertainties of this geomechanical simulation study result from the simplifications fracture systems, in situ fluid pressures and smodel forecast results for simulating the caprock response to the induced loadings from the LP
Such uncertainties are unavoidable and risk can never be eliminated. All that can be done is to adopting conservative parameters where possible. Following this approach reduces the risks associated caprock response for a given MOP. It is the simulated steam chamber and related loadings and deformations,
MODEL CONSTRAINTS AND KEY ASSESSMENT PARAMETEModelling constraints were assigned at the pilot and wellpair levels. Some of the key modelling constraints assigned to the geomechanical simulation model were as follows • 10 years development period. • MOP of 1,000 kPaa. • Continuous CWE steam injection (1,113 m• Steam quality and temperature constants of 95% and 190 Key assessment parameters reviewed in this investigation were: • Pilot Project performances (production, injection, subsurface te• Fluid pressure. • Shear stress level (and FoS). • Minimum principal effective stress. • Permeability increase (with volumetric strain) GEOMECHANICAL SIMULATION FORECAST RESULTSAnalyses of the geomechanical simulation results performances. A white star located in some of the crosssection where maximum or minimum values were observed Pilot Performance The forecast performance and subsurface temperature distribution after 10 years of Pilot Project operations are shown in Figures 8 and 9, respectively. These production and injection forecasts were generally tuned to the reservoir simulatifor the Pilot Project (AOS, 2010), which were used as a guideline for validating Pilot Project forecasts.
Figure 7 – Initialized Stress State
exists in all aspects of this Pilot Project study and occurs because of differences between the input parameters of a model and the real system. Factors contributing to model uncertainty often result from information deficiencies, limited
ed mathematical representation and variability in physical properties. The key uncertainties of this geomechanical simulation study result from the simplifications in geologic characterization, possible unidentified
fluid pressures and stresses, and reservoir and mechanical properties. These model forecast results for simulating the caprock response to the induced loadings from the LP-SAGD operation.
risk can never be eliminated. All that can be done is to adopting conservative parameters where possible. Following this approach reduces the risks associated
the author’s opinion that conservative conditions were assigned to the model grid, theloadings and deformations, thus reducing the risk of the final MOP design for the project.
ASSESSMENT PARAMETE RS Modelling constraints were assigned at the pilot and wellpair levels. Some of the key modelling constraints assigned to the
as follows:
(1,113 m3/d) after wellpair heating and circulation. Steam quality and temperature constants of 95% and 190 °C, respectively.
Key assessment parameters reviewed in this investigation were:
Pilot Project performances (production, injection, subsurface temperature and surface heave)
volumetric strain).
GEOMECHANICAL SIMULATION FORECAST RESULTS Analyses of the geomechanical simulation results included assessing 2D cross-sectional plots and graphs
A white star located in some of the cross-sectional plots, where applicable, identifies the location in 2D crossor minimum values were observed.
The forecast performance and subsurface temperature distribution after 10 years of Pilot Project operations are shown in Figures 8 and 9, respectively. These production and injection forecasts were generally tuned to the reservoir simulatifor the Pilot Project (AOS, 2010), which were used as a guideline for validating Pilot Project forecasts.
CSUG/SPE 148886
exists in all aspects of this Pilot Project study and occurs because of differences between the input parameters of a model and the real system. Factors contributing to model uncertainty often result from information deficiencies, limited
ed mathematical representation and variability in physical properties. The key uncertainties geologic characterization, possible unidentified
mechanical properties. These uncertainties impact SAGD operation.
risk can never be eliminated. All that can be done is to reduce these uncertainties by adopting conservative parameters where possible. Following this approach reduces the risks associated with assessing a
that conservative conditions were assigned to the model grid, the thus reducing the risk of the final MOP design for the project.
Modelling constraints were assigned at the pilot and wellpair levels. Some of the key modelling constraints assigned to the
mperature and surface heave).
sectional plots and graphs of grid block sectional plots, where applicable, identifies the location in 2D cross-
The forecast performance and subsurface temperature distribution after 10 years of Pilot Project operations are shown in Figures 8 and 9, respectively. These production and injection forecasts were generally tuned to the reservoir simulation results for the Pilot Project (AOS, 2010), which were used as a guideline for validating Pilot Project forecasts.
CSUG/SPE 148886
Figure
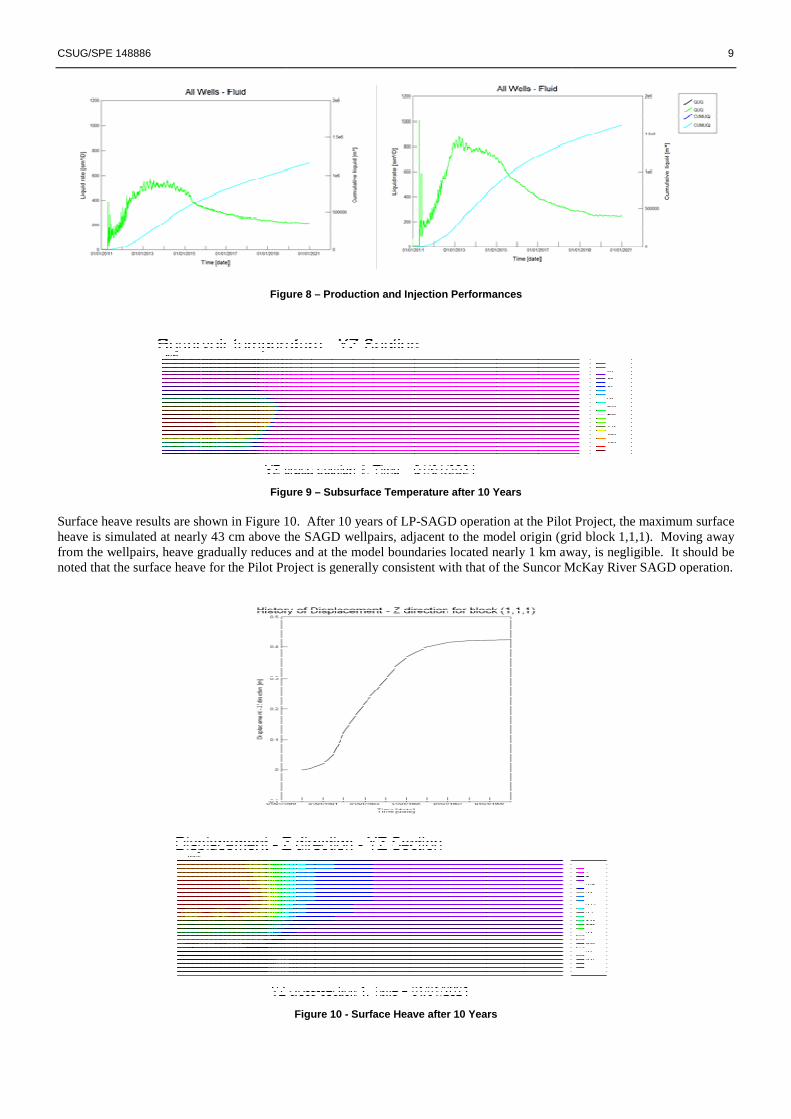
Figure Surface heave results are shown in Figure 10. After 10 years of LPheave is simulated at nearly 43 cm above the SAGD wellpairs, adjacent to the model origin (grid blockfrom the wellpairs, heave gradually reduces and at the model boundaries located nearly 1 km away, is negligible. It should be noted that the surface heave for the Pilot Project is generally consistent with that of the Suncor McKay River SAGD operation
Figure 8 – Production and Injection Performances
Figure 9 – Subsurface Temperature after 10 Years
in Figure 10. After 10 years of LP-SAGD operation at the Pilot Project, the maximum surface heave is simulated at nearly 43 cm above the SAGD wellpairs, adjacent to the model origin (grid block
ces and at the model boundaries located nearly 1 km away, is negligible. It should be noted that the surface heave for the Pilot Project is generally consistent with that of the Suncor McKay River SAGD operation
Figure 10 - Surface Heave after 10 Years
9
SAGD operation at the Pilot Project, the maximum surface heave is simulated at nearly 43 cm above the SAGD wellpairs, adjacent to the model origin (grid block 1,1,1). Moving away
ces and at the model boundaries located nearly 1 km away, is negligible. It should be noted that the surface heave for the Pilot Project is generally consistent with that of the Suncor McKay River SAGD operation.
10
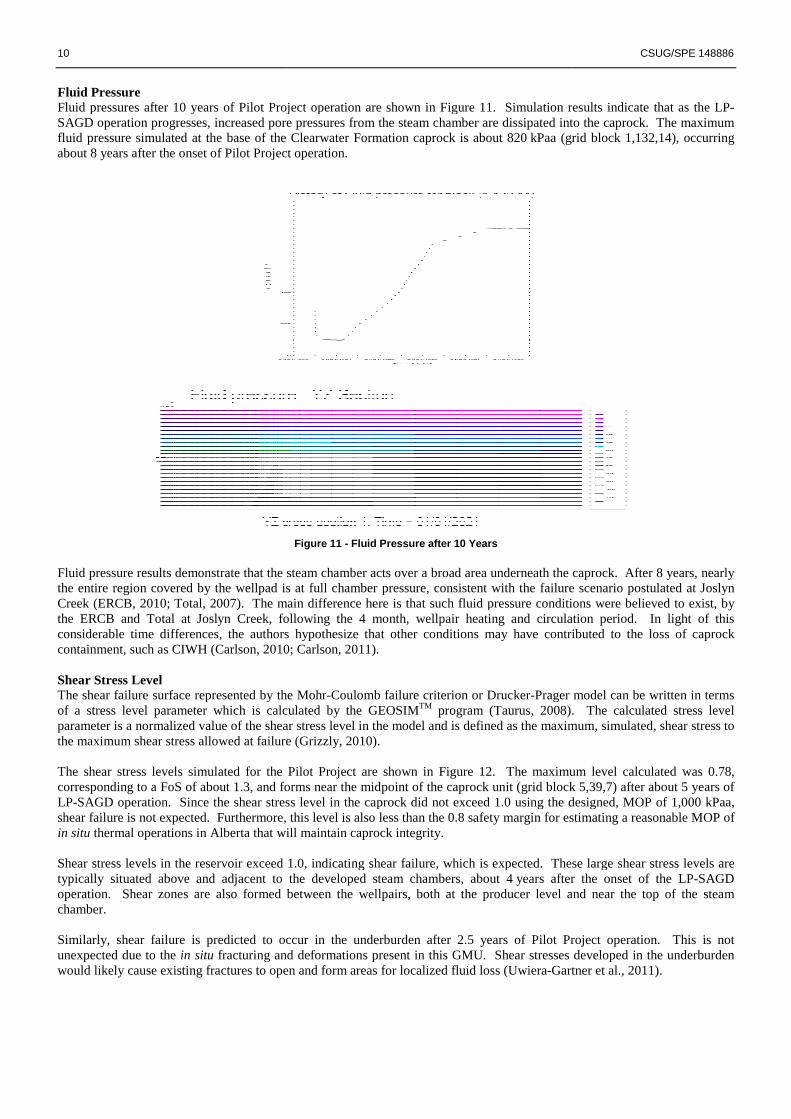
Fluid Pressure Fluid pressures after 10 years of Pilot Project operation are shown in Figure 11. Simulation results indicate that as the LPSAGD operation progresses, increased pore pressures from the steam chamber are dissipated into the caprock. Tfluid pressure simulated at the base of the Clearwater Formation caprock is about 820about 8 years after the onset of Pilot Project operation.
Fluid pressure results demonstrate that the steam chamber acts over a broad area the entire region covered by the wellpad is at full chamber pressure, consistent with the failure scenario postulated at Joslyn Creek (ERCB, 2010; Total, 2007). The main difference here is that such fluid pressure conditions the ERCB and Total at Joslyn Creek, following the 4 month, wellpair heating and circulation period. In light of this considerable time differences, the authors hypothesize that other conditions may have contributed to the loss of caprock containment, such as CIWH (Carlson, 2010; Carlson, 2011). Shear Stress Level The shear failure surface represented by the Mohrof a stress level parameter which is calculated by the GEOSIMparameter is a normalized value of the shear stress level in the model and is definedthe maximum shear stress allowed at failure (Grizzly, 2010). The shear stress levels simulated for the Pilot Project are shown in Figure 12. The maximum level calculated was 0.78, corresponding to a FoS of about 1.3, and forms near the midpoint of the caprock unit (grid block 5,39,7) after about 5 years of LP-SAGD operation. Since the shear stress level in the caprock did not exceed 1.0 using the designed, MOP of 1,000 kPaa, shear failure is not expected. Furthermore, this level is also less than the 0.8 safety margin for estimating a reasonable MOP of in situ thermal operations in Alberta that will maintain caprock integrity. Shear stress levels in the reservoir exceed 1.0, indicating shear failure, which is typically situated above and adjacent to the developed steam chambers, about 4operation. Shear zones are also formed between the wellpairs, both at the producer level andchamber. Similarly, shear failure is predicted to occur in the underburden after 2.5 years of Pilot Project operation. This is not unexpected due to the in situ fracturing and deformations present in this GMU. Shear stresses developed in the underburden would likely cause existing fractures to open and form areas for localized fluid loss (Uwiera
Fluid pressures after 10 years of Pilot Project operation are shown in Figure 11. Simulation results indicate that as the LPSAGD operation progresses, increased pore pressures from the steam chamber are dissipated into the caprock. Tfluid pressure simulated at the base of the Clearwater Formation caprock is about 820 kPaa (grid block 1,132,14), oc
onset of Pilot Project operation.
Figure 11 - Fluid Pressure after 10 Years
that the steam chamber acts over a broad area underneath the caprockentire region covered by the wellpad is at full chamber pressure, consistent with the failure scenario postulated at Joslyn
Creek (ERCB, 2010; Total, 2007). The main difference here is that such fluid pressure conditions following the 4 month, wellpair heating and circulation period. In light of this
, the authors hypothesize that other conditions may have contributed to the loss of caprock containment, such as CIWH (Carlson, 2010; Carlson, 2011).
The shear failure surface represented by the Mohr-Coulomb failure criterion or Drucker-Prager model can be written in terms of a stress level parameter which is calculated by the GEOSIMTM program (Taurus, 2008). parameter is a normalized value of the shear stress level in the model and is defined as the maximum, simulated
owed at failure (Grizzly, 2010).
The shear stress levels simulated for the Pilot Project are shown in Figure 12. The maximum level calculated was 0.78, forms near the midpoint of the caprock unit (grid block 5,39,7) after about 5 years of
SAGD operation. Since the shear stress level in the caprock did not exceed 1.0 using the designed, MOP of 1,000 kPaa, hermore, this level is also less than the 0.8 safety margin for estimating a reasonable MOP of
thermal operations in Alberta that will maintain caprock integrity.
Shear stress levels in the reservoir exceed 1.0, indicating shear failure, which is expected. These large shear stress levels are typically situated above and adjacent to the developed steam chambers, about 4 years after the onset of the LPoperation. Shear zones are also formed between the wellpairs, both at the producer level and
Similarly, shear failure is predicted to occur in the underburden after 2.5 years of Pilot Project operation. This is not fracturing and deformations present in this GMU. Shear stresses developed in the underburden
would likely cause existing fractures to open and form areas for localized fluid loss (Uwiera-Gartner et al., 2011).
CSUG/SPE 148886
Fluid pressures after 10 years of Pilot Project operation are shown in Figure 11. Simulation results indicate that as the LP-SAGD operation progresses, increased pore pressures from the steam chamber are dissipated into the caprock. The maximum
kPaa (grid block 1,132,14), occurring
underneath the caprock. After 8 years, nearly entire region covered by the wellpad is at full chamber pressure, consistent with the failure scenario postulated at Joslyn
Creek (ERCB, 2010; Total, 2007). The main difference here is that such fluid pressure conditions were believed to exist, by following the 4 month, wellpair heating and circulation period. In light of this
, the authors hypothesize that other conditions may have contributed to the loss of caprock
Prager model can be written in terms . The calculated stress level
as the maximum, simulated, shear stress to
The shear stress levels simulated for the Pilot Project are shown in Figure 12. The maximum level calculated was 0.78, forms near the midpoint of the caprock unit (grid block 5,39,7) after about 5 years of
SAGD operation. Since the shear stress level in the caprock did not exceed 1.0 using the designed, MOP of 1,000 kPaa, hermore, this level is also less than the 0.8 safety margin for estimating a reasonable MOP of
expected. These large shear stress levels are years after the onset of the LP-SAGD
operation. Shear zones are also formed between the wellpairs, both at the producer level and near the top of the steam
Similarly, shear failure is predicted to occur in the underburden after 2.5 years of Pilot Project operation. This is not fracturing and deformations present in this GMU. Shear stresses developed in the underburden
Gartner et al., 2011).
CSUG/SPE 148886
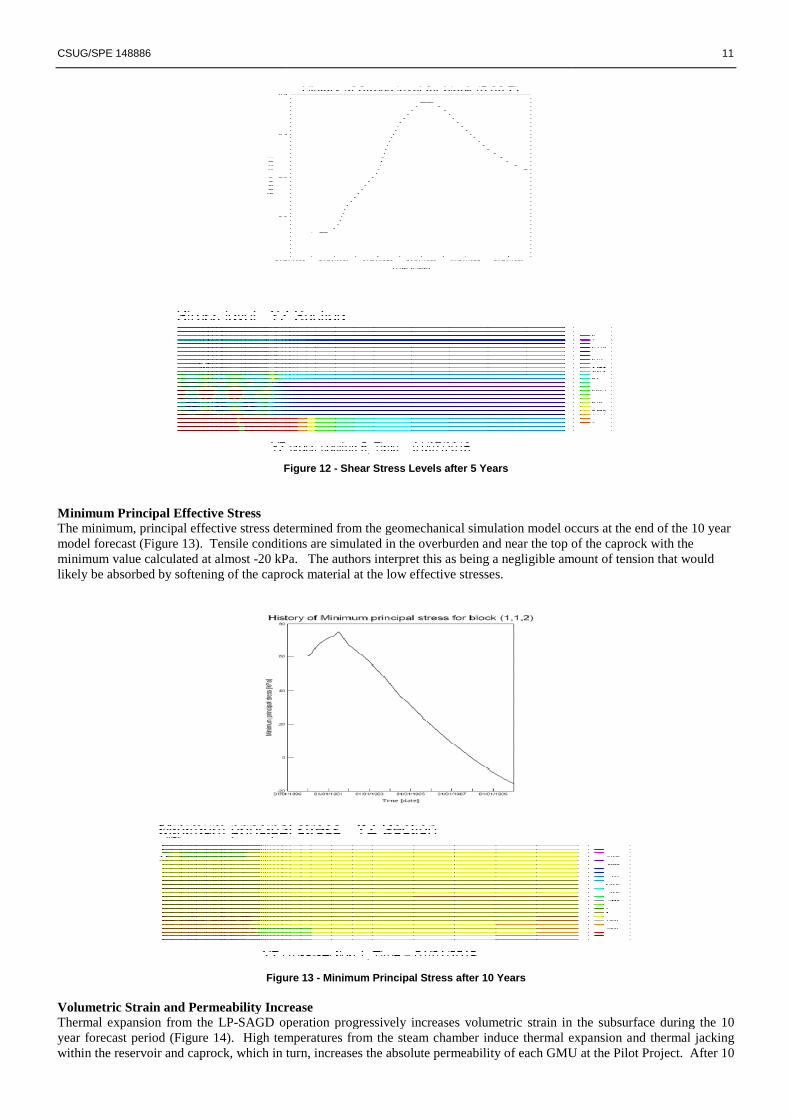
Figure Minimum Principal Effective Stress The minimum, principal effective stress determined from the geomechanical simulation model occurs at the end of the 10 year model forecast (Figure 13). Tensile conditions are simulated in the overburden and near the top of the caprock with the minimum value calculated at almost -20 kPa. likely be absorbed by softening of the caprock
Figure Volumetric Strain and Permeability IncreaseThermal expansion from the LP-SAGD operation progressively increases volumetric strain in the subsurface during the 10 year forecast period (Figure 14). High temperatures from the steam chamber induce thermal expansion and thermal jawithin the reservoir and caprock, which in turn, increases the ab
Figure 12 - Shear Stress Levels after 5 Years
stress determined from the geomechanical simulation model occurs at the end of the 10 year model forecast (Figure 13). Tensile conditions are simulated in the overburden and near the top of the caprock with the
20 kPa. The authors interpret this as being a negligible amount of tensionlikely be absorbed by softening of the caprock material at the low effective stresses.
Figure 13 - Minimum Principal Stress after 10 Years
Permeability Increase SAGD operation progressively increases volumetric strain in the subsurface during the 10
year forecast period (Figure 14). High temperatures from the steam chamber induce thermal expansion and thermal jawithin the reservoir and caprock, which in turn, increases the absolute permeability of each GMU
11
stress determined from the geomechanical simulation model occurs at the end of the 10 year model forecast (Figure 13). Tensile conditions are simulated in the overburden and near the top of the caprock with the
negligible amount of tension that would
SAGD operation progressively increases volumetric strain in the subsurface during the 10 year forecast period (Figure 14). High temperatures from the steam chamber induce thermal expansion and thermal jacking
solute permeability of each GMU at the Pilot Project. After 10
12
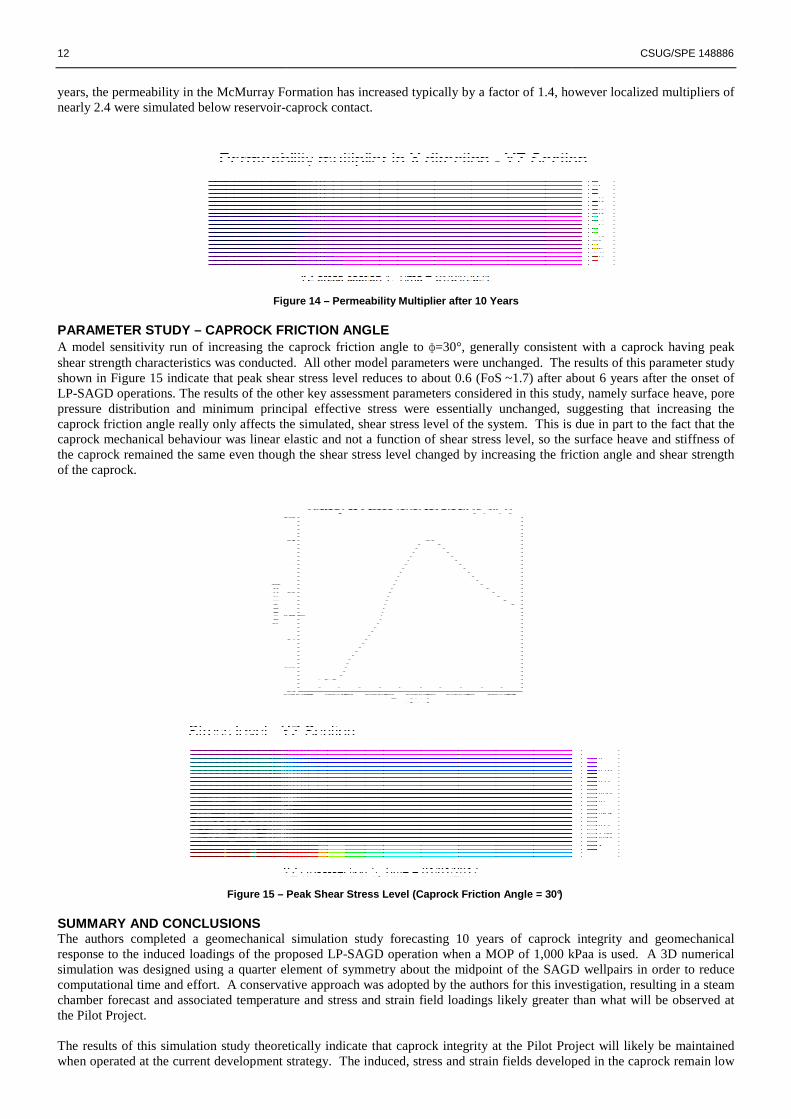
years, the permeability in the McMurray Formationnearly 2.4 were simulated below reservoir-caprock contact.
Figure PARAMETER STUDY – CAPROCK FRICTION ANGLEA model sensitivity run of increasing the caprock friction angle to shear strength characteristics was conducted. All other model parameters were unchanged. The results of this parameter studshown in Figure 15 indicate that peak shear stLP-SAGD operations. The results of the other key assessment parameters considered in this study, namely surface heave, pore pressure distribution and minimum principal effective stress were essentially unchanged, suggesting thatcaprock friction angle really only affects the simulated, shear stress level of the system. This is due in part to the fact caprock mechanical behaviour was linear elastic and not a function of shear stress level, so the surface hthe caprock remained the same even though the shear stress level changed by increasing the friction angle and shear strength of the caprock.
Figure 15 – SUMMARY AND CONCLUSIONS The authors completed a geomechanical simulation study forecasting 10 years of caprock integrity and geomechanical response to the induced loadings of the proposed LPsimulation was designed using a quarter element of symmetry about the midpoint of the SAGD wellpairs in order to reduce computational time and effort. A conservative approach was achamber forecast and associated temperature and stress and strain field loadings likely greater than what will be observed at the Pilot Project. The results of this simulation study theoreticallywhen operated at the current development strategy. The induced, stress and strain fields developed in the caprock
McMurray Formation has increased typically by a factor of 1.4, however localized multipliecaprock contact.
Figure 14 – Permeability Multiplier after 10 Years
CAPROCK FRICTION ANGLE A model sensitivity run of increasing the caprock friction angle to ɸ=30°, generally consistenshear strength characteristics was conducted. All other model parameters were unchanged. The results of this parameter studshown in Figure 15 indicate that peak shear stress level reduces to about 0.6 (FoS ~1.7) after about
The results of the other key assessment parameters considered in this study, namely surface heave, pore pressure distribution and minimum principal effective stress were essentially unchanged, suggesting thatcaprock friction angle really only affects the simulated, shear stress level of the system. This is due in part to the fact caprock mechanical behaviour was linear elastic and not a function of shear stress level, so the surface hthe caprock remained the same even though the shear stress level changed by increasing the friction angle and shear strength
Peak Shear Stress Level (Caprock Friction Angle = 3 0°)
The authors completed a geomechanical simulation study forecasting 10 years of caprock integrity and geomechanical response to the induced loadings of the proposed LP-SAGD operation when a MOP of 1,000 kPaa is used. A 3D numerical
designed using a quarter element of symmetry about the midpoint of the SAGD wellpairs in order to reduce computational time and effort. A conservative approach was adopted by the authors for this investigation, resulting in a steam
associated temperature and stress and strain field loadings likely greater than what will be observed at
theoretically indicate that caprock integrity at the Pilot Project will likely be maintainedwhen operated at the current development strategy. The induced, stress and strain fields developed in the caprock
CSUG/SPE 148886
typically by a factor of 1.4, however localized multipliers of
, generally consistent with a caprock having peak shear strength characteristics was conducted. All other model parameters were unchanged. The results of this parameter study
about 6 years after the onset of The results of the other key assessment parameters considered in this study, namely surface heave, pore
pressure distribution and minimum principal effective stress were essentially unchanged, suggesting that increasing the caprock friction angle really only affects the simulated, shear stress level of the system. This is due in part to the fact that the caprock mechanical behaviour was linear elastic and not a function of shear stress level, so the surface heave and stiffness of the caprock remained the same even though the shear stress level changed by increasing the friction angle and shear strength
The authors completed a geomechanical simulation study forecasting 10 years of caprock integrity and geomechanical SAGD operation when a MOP of 1,000 kPaa is used. A 3D numerical
designed using a quarter element of symmetry about the midpoint of the SAGD wellpairs in order to reduce investigation, resulting in a steam
associated temperature and stress and strain field loadings likely greater than what will be observed at
indicate that caprock integrity at the Pilot Project will likely be maintained when operated at the current development strategy. The induced, stress and strain fields developed in the caprock remain low
CSUG/SPE 148886 13
throughout the duration of the 10 year period. The peak shear stress levels within the caprock were 0.78, less than the 0.8 safety margin often used to assess MOPs of thermal projects in Alberta. Minor tensile conditions were simulated to develop in the Quaternary and in the upper region of the caprock near the end of the forecast period. The maximum surface heave simulated after 10 years was nearly 43 cm above the SAGD wellpairs. ACKNOWLEGMENTS The authors of this paper would like to thank Alberta Oilsands Inc. and RPS Energy Ltd. for permission to present these results. The information referenced in this paper was obtained primarily from the technical work documented by AOS (2010). The authors would like to thank Ms. Karen Lausen of RPS Energy Ltd. for her assistance with document formatting and reviewing. NOMECLATURE AOS = Alberta Oilsands Inc. bgs = below ground surface CIWH = Condensation induced water hammer CWE = Coldwater equivalent ERCB = Energy Resources Conservation Board FoS = Factor of Safety GMU = Geomechanical unit LP-SAGD = Low pressure, steam-assisted gravity drainage MOP = Maximum operating pressure SAGD = Steam-assisted gravity drainage Total = Total E&P Canada Ltd. REFERENCES Alberta Energy Resources Conservation Board (ERCB), 2010. Total E&P Canada Ltd. Surface Steam Release of May 18, 2006 Joslyn
Creek SAGD Thermal Operation. ERCB Staff Review and Analysis. Document submitted February 11, 2010. Alberta Oilsands Inc. (AOS), 2010. Project Update for Clearwater West LP-SAGD Pilot Project, December 22, 2010. Project update
prepared for Alberta Energy Resources Conservation Board (ERCB). Website: http://www.aboilsands.ca. Andrianshek, L.D., 2003. Quaternary geologic setting of the Athabasca oil sands (in situ) area, Northeast Alberta. EUB/AGS Earth
Sciences Report 2002-03. Bachu, S., Underschultz, J.R., Hitchon, B., and Cotterill, D., 1993. Regional-scale subsurface hydrogeology in Northeast Alberta. Bulletin
No. 61, Alberta Geological Survey (AGS), Alberta Research Council (ARC). Carlson, M.R., 2011. And Now for Something Completely Different: Condensation Induced Water Hammer and Steam-Assisted Gravity
Drainage in the Athabasca Oil Sands. 14th International Topical Meeting on Nuclear Reactor Thermalhydraulics, NURETH-14. September 25-30, 2011, Toronto, Ontario, Canada. Paper in press.
Carlson, M.R., 2010, SPE. What Every SAGD Engineer Should Know About Condensation Induced Water Hammer. Presentation at the
SPE Technical Luncheon, Calgary Section. Website: http://speca.ca/PDF/SPE_WhatSAGDknow.pdf. Chalaturnyk, R.J., 1996. Geomechanics of the Steam Assissted Gravity Drainage Process in Heavy Oil Reservoirs. Ph.D. thesis,
Department of Civil Engineering, University of Alberta. 576 pgs. Economides, M.J., and Nolte, K.G., 2000. Reservoir Simulation. 3rd Edition. John Wiley & Sons, 865 pgs. Grizzly Oil Sands (Grizzly), 2010. Applications for the Grizzly Oil Sands ULC Algar Lake SAGD Project. Application prepared for
Alberta Energy Resources and Conservation Board (ERCB) and Alberta Environment (AENV). Submitted March 2010. 865 pgs. Oldakowski, K., 1994. “Stress Induced Permeability Changes of Athabasca Oil Sands”. Master of Science Thesis in Geotechnical
Engineering. Department of Civil Engineering, University of Alberta. 227 pp. Palmgren, C.T.S., and Walker, I., Alberta Oilsands Inc., Carlson, M.R., and Uwiera, M., RPS Energy Canada Ltd., and Torlak, M.,
SIEMENS, 2011. Reservoir design of a shallow LP-SAGD project for in situ extraction of Athabasca Bitumen. World Heavy Oil Congress, WHOC11-520, Edmonton, Alberta, Canada. Paper in press.
Porter, I.W., Price, R.A., and McCrossan, R.G., 1982. The Western Canadian Sedimentary Basin: Philosophical transactions of the Royal
Society of London, Series A, v. 305, p.169-182. Settari, A., Ito, Y., Fukushima, N., and Vaziri, H., 1993. Geotechnical aspects of recovery processes in oil sand. Canadian Geotechnical
Journal. Vol. 30, No. 1, pp. 22-33.

14 CSUG/SPE 148886
Settari, A., and Walters, D.A., 2001. Advances in Coupled Geomechanical and Reservoir Modeling With Applications to Reservoir Compaction, SPE Journal, Vol. 6, No. 3, Sept. 2001, pp. 334-342.
Taurus Reservoir Solutions Ltd. (Taurus), 2008. GEOSIM System. FEM3D Three-Dimensional, Thermal Consolidation Finite Element
Program for Geomechanical Analysis Coupled with Reservoir Simulators. GEOINT Interface between Stress and Reservoir Simulators. User Manual. Version 3.2, Rev.3. Calgary, Alberta, Canada. October 2008.
Total E&P Canada Ltd. (Total), 2007. Summary of Investigations into the Joslyn May 18th 2006 Steam Release. Issued December 2007. Uwiera-Gartner, M.M.E., Carlson, M.R., and Palmgren, C.T.S., 2011. Evaluation of the Clearwater Formation caprock for a proposed, low
pressure, steam-assisted gravity-drainage pilot project in northeast Alberta. SPE #147302. SPE Annual Technical Conference and Exhibition, Denver, Colorado, USA, 30 October-2 November, 2011. Paper in press.
Wedage, A.M.P., Morgenstern, N.R., and Chan, D.H., 1998. Simulation of time-dependent movements in Syncrude tailings dyke
foundation. Canadian Geotechnical Journal 35:284-298.