Embed Size (px)
Citation preview
Daunt· Edwards Milford· Yaqub
(Part A)
II • e , " U e
:
cu
LTg
INTERNATIONAL CRYOGENICS MONOGRAPH SERIES Under the editorship of Dr. K. Mendelssohn and Dr. K. D. Thnmerhaus
This series of monographs on individual areas in cryogenics, written by internationally known authorities, presents the latest theoretical and applied developments in cryogenics.
Publi3hed :
THERMOELECTRIC REFRIGERATION By H. J. GoldBmid
This volwne covers both the physical and engineering aspects of thermoelectric refrigeration from the basic principles through the physics of thermoelectric materials to' the engineering of thermoelectric cooling units. It is the first book devoted to the practical problems encountered in research and development laboratories, e.g., the measurement of thermoelectric parameters, the optimization of materials, and the design of cooling units in real rather than ideal situations. In addition, the new and important related subject of Ettingshausen (thermomagnetic) refrigeration js covered, particularly with reference to cooling a t very low temperatures. Bismuth-antimony alloys are also discussed.
240 pages 1964 $11.50
Forthcoming in the series:
ELECTRICAL RESISTANCE OF METALS By G. T. Meaden 218 pages 1965 $11.50
SPECIFIC HEATS AT LOW TEMPERATURE 8y E. S. Raja Gopal Approx. 250 pages 1966 $11 .50
SUPERCONDUCTIVITY IN ELEMENTS, ALLOYS, AND COMPOUNDS By G. K. Gaula
VERY HIGH MAGNETIC FIELDS By David H. Parkinson and B. Mulhall
SUPERCONDUCTIVITY FOR ENGINEERS By J. L Olsen and S. Gygax
LOW-TEMPERATURE PHASE EQUILIBRIA By F. B. Canfield
CRYOGENIC LABORATORY EQUIPMENT By A. J. Croft and P. V. E. McClintock
LOW-TEMPERATURE CRYSTALLOGRAPHY By S. Ramaseshan
CRYOGENIC SAFETY By M. G. Zabetakis
HELlUM-3 AND HELlUM-4 By W. E. Keller
CRYOGENIC INSULATION SYSTEMS By P. Glaser and A. Wechsler
~ PLENUM PRESS 227 West 17th Street, New York, N. Y. 10011
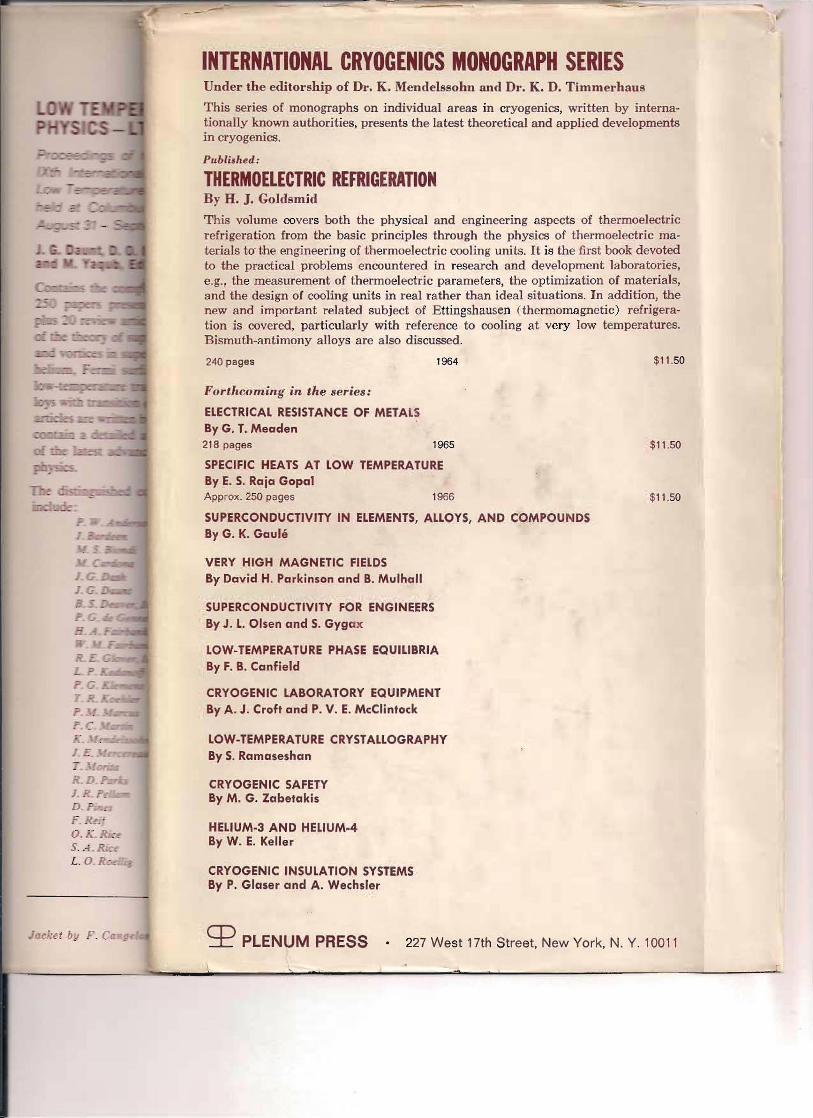
THE MELTING CURVE SLOPE OF 4He AND 3He-4He MIXTURES*
George o. Zimmermant
Yale University N ew Haven, Connecticut
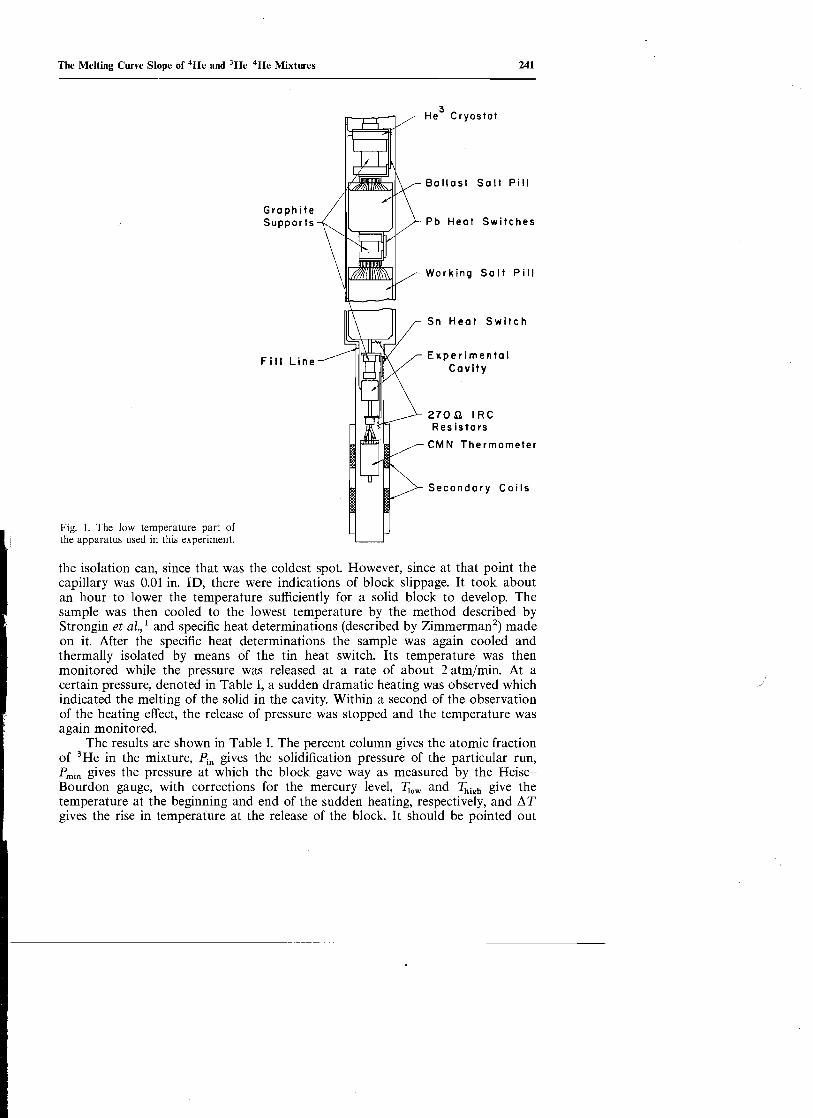
Since the apparatus and experimental procedure are important in establishing the validity of these data, a detailed description of the technique follows. The apparatus used in this measurement was similar to that of Strongin et aL, l with the low temperature section shown in Fig. 1. Temperatures below 10 K were obtained by adiabatic demagnetization from a 3He cryostat, and the temperature was monitored by means of a 200 n i W IRe carbon resistor which had been previously calibrated against a cerium magnesium nitrate thermometer salt. The experimental cavity contained 10,000 0.003-in.-OD copper wires which were silver soldered to it for good thermal contact between it and the helium. The cavity contained no pressuresensing element.
The pressure apparatus consisted of a V-tube containing mercury. One arm of the V-tube contained a reservoir of 500 cm3 in volume located 2 m above the bottom of the V-tube. This reservoir served as a helium container and was connected to the experimental cavity by means of a capillary tube. The other arm had a reservoir of 1000 cm3 in volume about 30 cm above the bottom of the V-tube. This reservoir served as a mercury container which could be pressurized by means of a compressed nitrogen tank. It also contained a provision for pressure release, and a HeiseBourdon gauge to monitor the pressure. The pressure read on the Heise-Bourdon gauge corrected for the hydrostatic pressure of the mercury whose level could be constantly monitored, gave the pressure in the helium container and also the experimental cavity when the helium was in gaseous or liquid state. Once the capillary line was blocked, the pressure inside the cavity could not be determined.
The following procedure was used to grow the solid: The helium gas was condensed under pressure into the experimental cavity, while the cavity was held at a temperature of to above the solidification temperature of pure 4He at the particular pressure by holding the temperature of the liquid 4He bath constant. Since exchange gas was used only for temperature calibration purposes, thermal contact between the liquid 4He bath and the apparatus inside the isolation can (which is shown in Fig. 1) was effected by means of a 3He gas column inside the 3He cryostat. Once condensation, evident by the stabilization of pressure, occurred within the experimental cavity, the temperature of the 4He bath was lowered gradually, care being taken that the pressure on the experimental helium mixture was constant. As further helium condensed into the cavity, the level of the mercury in the pressure apparatus changed. The formation of a block in the capillary was indicated by the stabilization of the mercury level. The block developed first in the capillary above
* Work supported by the U.S. Office of Army Research, Durham, N.C. t Present address: Department of Physics, Boston University.
240
241 The Melting Curve Slope of 4He and 3He-4He Mixtures
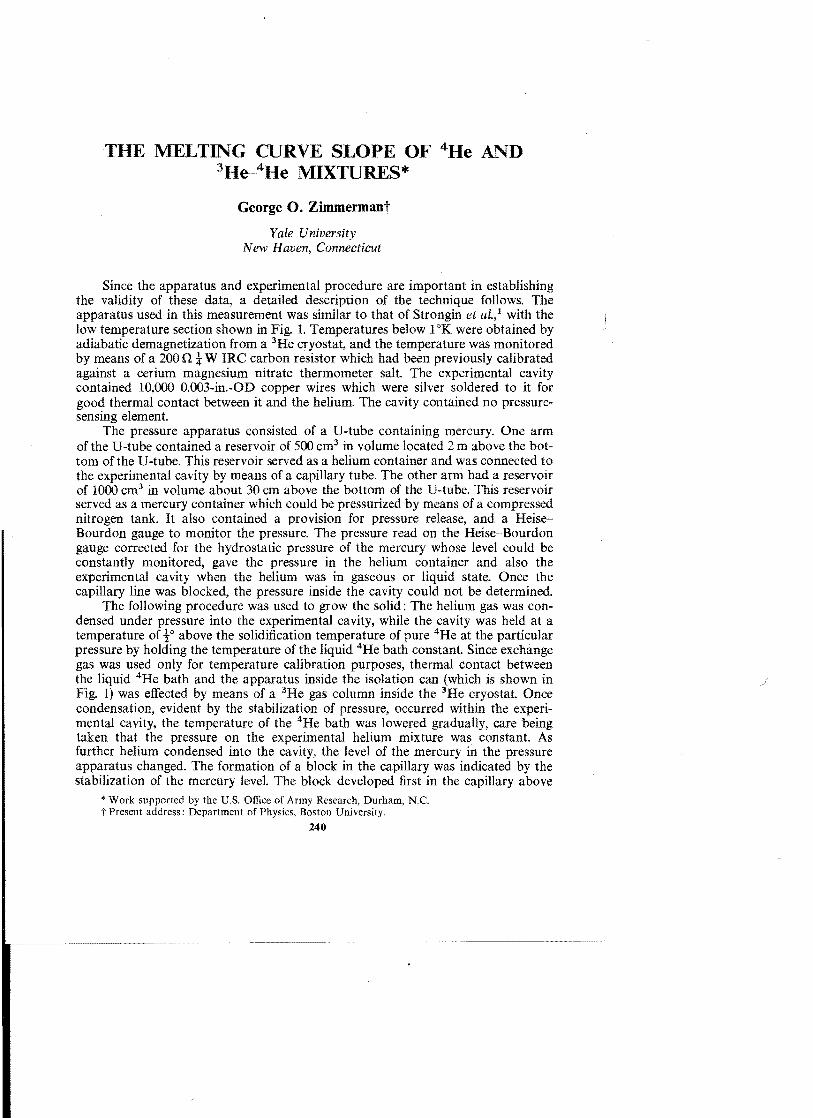
:3He Cryos tat
Ballast Salt Pill
Graphite Supports Pb Heat Switches
Working Salt Pill
Sn Heat Switch
ExperimentalFill Line
Cavity
270.0. IRC Res istars
CMN Thermometer
Secondary Coils
Fig. 1. The low temperature part of the apparatus used in this experiment.
the isolation can, since that was the coldest spot. However, since at that point the capillary was 0.01 in. ID, there were indications of block slippage. It took about an hour to lower the temperature sufficiently for a solid block to develop. The sample was then cooled to the lowest temperature by the method described by Strongin et al.,l and specific heat determinations (described by Zimmerman2
) made on it. After the specific heat determinations the sample was again cooled and thermally isolated by means of the tin heat switch. Its temperature was then monitored while the pressure was released at a rate of about 2 atm/min. At a certain pressure, denoted in Table I, a sudden dramatic heating was observed which indicated the melting of the solid in the cavity. Within a second of the observation of the heating effect, the release of pressure was stopped and the temperature was again monitored.
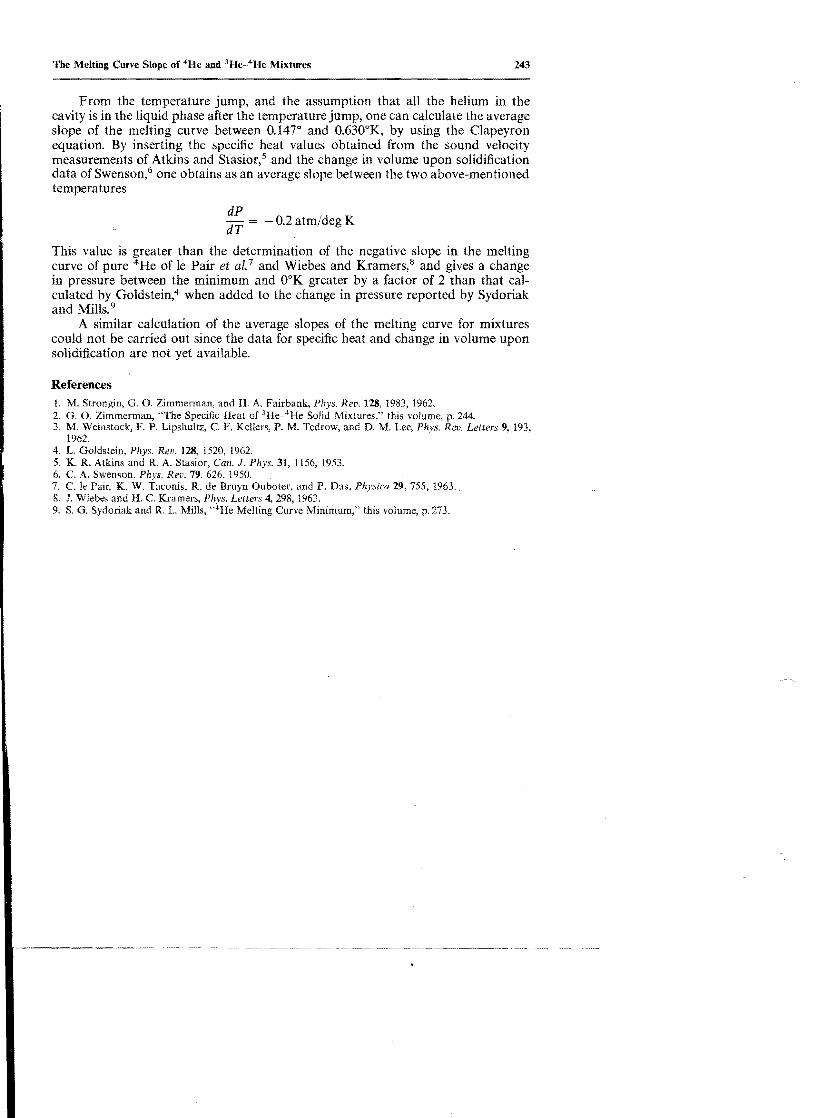
The results are shown in Table I. The percent column gives the atomic fraction of 3He in the mixture, Fin gives the solidification pressure of the particular run, Pmin gives the pressure at which the block gave way as measured by the HeiseBourdon gauge, with corrections for the mercury level, 1Jow and Thigh give the temperature at the beginning and end of the sudden heating, respectively, and L1 T gives the rise in temperature at the release of the block. It should be pointed out
242
"\.
George O. Zimmerman
Table I
%'He Pin, atm Pmin , atm ~ow, oK Thigh, oK !J.T
3.2 48 25 0.613 0.855 0.242 3.2 63.2 0,435 0.942 0.507
Positive slope above 1.6°K* 2.6 48 24.6 0.145 0.300 0.155 2.6 26.5 0.320 0.625 0.305
Positive slope above 1.4C K*
1.2 48 24.5 0.145 0.425 0.280 1.2 48 24.75 0.382 0.891 0.509
Positive slope above 0.9°K*
0.58 48 25.1 0.100 0.308 0.208 0.58 48 24.75 0.534 1.25 0.716 0.58 26.6 0.650 1.100 0.450
0 48 25.4 0.147 0.630 0.483
* These were the temperatures at which positive slopes were actually observed. This does not preclude a positive slope below tbese temperatures.
that there is no apparent correlation between the temperature jump and the initial pressure. This would indicate a negligible contribution due to irreversible heating. These results are in qualitative agreement with the measurements of Weinstock et ai.,3 who showed the existence of a negative slope in the melting curve of 3He-4He mixtures.
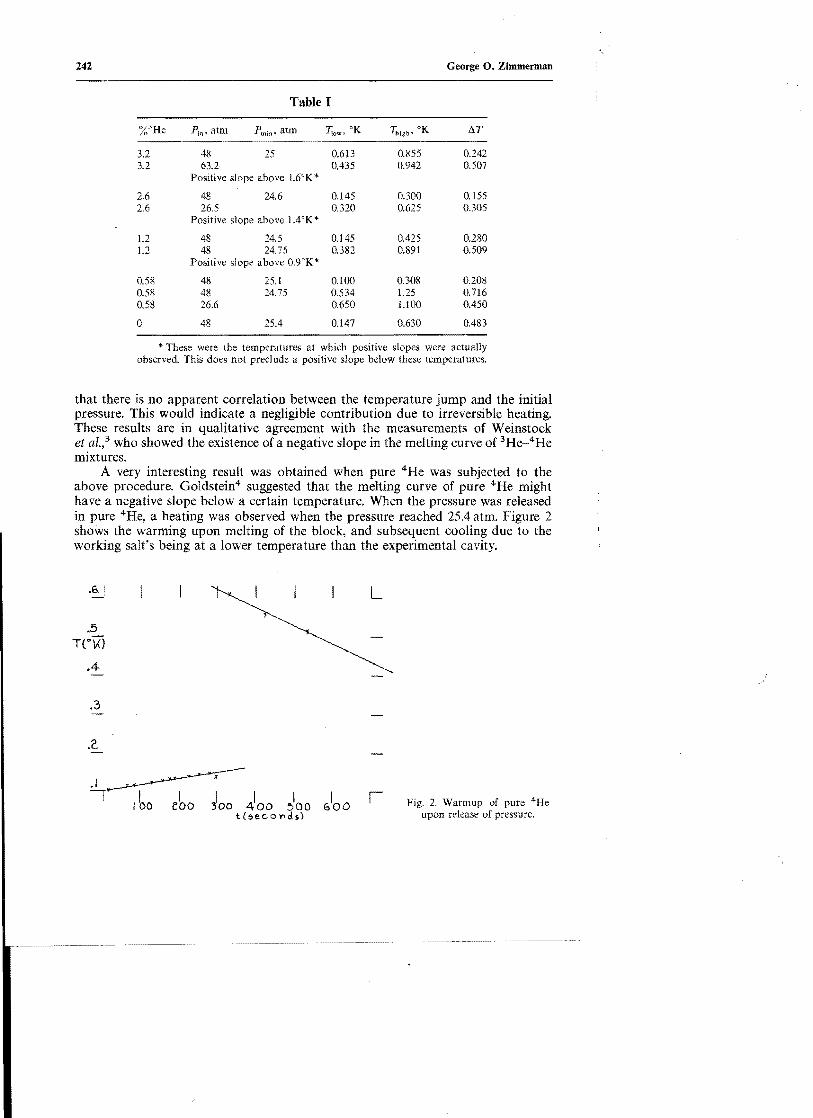
A very interesting result was obtained when pure 4He was subjected to the above procedure. Goldstein4 suggested that the melting curve of pure 4He might have a negative slope below a certain temperature. When the pressure was released in pure 4He, a heating was observed when the pressure reached 25.4 atm. Figure 2 shows the warming upon melting of the block, and subsequent cooling due to the working salt's being at a lower temperature than the experimental cavity .
. 6. L
.3
.2.
Fig. 2. Warmup of pure 4He upon release of pressure.
243 The Melting Curve Slope of 4He and 3He-4 He Mixtures
From the temperature jump, and the assumption that all the helium in the cavity is in the liquid phase after the temperature jump, one can calculate the average slope of the melting curve between 0.147° and 0.630oK, by using the Clapeyron equation. By inserting the specific heat values obtained from the sound velocity measurements of Atkins and Stasior,5 and the change in volume upon solidification data of Swenson,6 one obtains as an average slope between the two above-mentioned temperatures
dP -0.2 atm/deg K
dT
This value is greater than the determination of the negative slope in the melting curve of pure ""He of Ie Pair et al. 7 and Wiebes and Kramers, 8 and gives a change in pressure between the minimum and OOK greater by a factor of 2 than that calculated by Goldstein," when added to the change in pressure reported by Sydoriak and Mills.9
. A similar calculation of the average slopes of the melting curve for mixtures could not be carried out since the data for specific heat and change in volume upon solidification are not yet available.
References I. M. Strongin, G. O. Zimmerman, and H. A. Fairbank, Phys. Rev. 128, 1983, 1962. 2. G. O. Zimmerman, "The Specific Heat of 3He-4 He Solid Mixtures," this volume, p. 244. 3. M. Weinstock, F. P. Lipshultz, C. F. Kellers, P. M. Tedrow, and D. M. Lee, Phys. Rei). Letters 9, 193,
1962. 4. L. Goldstein, Phys. Rev. 128, 1520, 1962. 5. K. R. Atkins and R. A. Stasior, Can. J. Phys. 31, 1156, 1953. 6. C. A. Swenson, Phys. Rev. 79, 626, 1950. 7. C. Ie Pair, K. W. Taconis, R. de Bruyn Ouboter, and P. Das, Physica 29, 755,1963.. 8. J. Wiebes and H. C. Kramers, Phys. Letters 4, 298, 1963. 9. S. G. Sydoriak and R. L. Mills, "4He Melting Curve Minimum," this volume, p. 273.