Embed Size (px)
Citation preview
Cultivating growthThe Deloitte South Island IndexA review of the performance of South Island listed companies during the quarter ending 31 December 2017
February 2018 40th Edition
2
The Deloitte South Island Index | 40th Edition
IntroductionWelcome to the 40th edition of the Deloitte South Island Index.
In this edition we reflect on the performance of South Island listed companies during the most recent quarter to 31 December 2017.
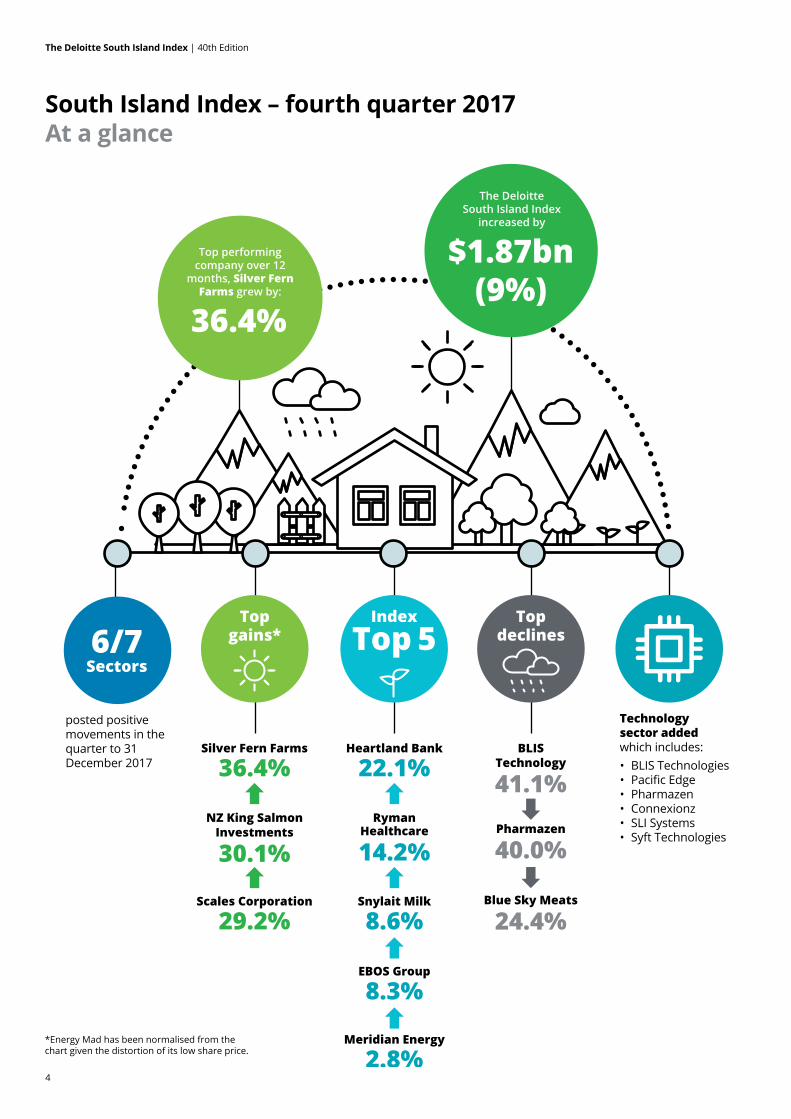
The December 2017 quarter continued the steady growth experienced in the prior three quarters, as the Deloitte South Island Index grew $1,874.5 million (9.0%), the strongest quarter of growth for the 2017 calendar year.
Movements in December 2017The Deloitte South Island Index increased by 2.4% for the month of December, with all other indices we track also increasing. The Index’s increase was only matched by the S&P/NZX 50 Capital Index which also recorded a 2.4% increase for the month of December. The ASX All Ords’ had it tougher than the rest, recording the lowest level of growth at 1.2%.
Quarterly movements – Q4 2017The Deloitte South Island Index increased its market capitalistion by $1,874.5 million (9.0%) in the last quarter of 2017. This result was driven by growth in the Aged Care (formerly reported as Property) and Primary sectors which grew by $777.7 million (15.4%) and $366.2 million (13.9%) respectively.
Annual movements – December 2016 to December 2017The Deloitte South Island Index grew by $4,242.6 million (22.8%) during the twelve months to 31 December 2017. Comparatively, it was only outperformed by the Dow Jones’ 25.2% growth. In the local Australasian markets, the Deloitte South Island Index outperformed the S&P/NZX 50 Capital Index and ASX All Ords, which gained 17.3% and 7.8% respectively over the year.
3
The Deloitte South Island Index | 40th Edition
Key points for the fourth quarter of 2017 include:
• The Deloitte South Island Index increased by $1,874.5 million (9.0%) during the quarter to 31 December 2017. All other indices tracked also recorded growth over the same period with the Dow Jones edging out the Deloitte South Island Index, increasing by an impressive 10.4%, the ASX All Ords market capitalisation increased by 7.4% and the S&P/NZX 50 Capital Index increased by 5.3%.
• Heartland Bank was the fifth company on the Deloitte South Island Index to achieve market capitalisation greater than $1,000.0 million. Heartland Bank finished the quarter with a market capitalisation of $1,158.8 million and growth of 22.1% for the quarter.
• The collective growth of the five companies whose market capitalisation is greater than $1,000.0 million (the Top Five companies) was $1,393.7 million (8.4%) which represented 74.4% of the total Index’s December quarter growth of $1,874.5 million.
• Ryman Healthcare was the leader in dollar terms of the Top Five companies gaining $660.0 million (14.2%), followed by Synlait Milk gaining $102.2 million (8.6%), EBOS Group increased by $216.6 million (8.3%) and Meridian Energy finished the December quarter with a gain of $205.1 million (2.8%).
• The smallest 10 companies pulled the overall Index’s performance down as they underwent a collective decline of 23.2% ($28.8 million).
• Outside of the Top Five, the Index’s best performers (in percentage terms) were Energy Mad whose market capitalisation increased 100% ($0.3 million) during the December quarter followed by Silver Fern Farms increasing their market capitalisation by 36.4% ($20.1 million).
• The Index declines were lead this quarter by BLIS Technology, who dropped 41.1% ($13.3 million), closely followed by Pharmazen who fell by a 40.0% ($6.4 million) and Blue Sky meats who dropped 24.4% ($5.2 million).
• During the quarter we have reviewed the sector compositions to reflect the evolving nature of the South Island Index participants. We have created a Technology sector, which includes; BLIS Technologies, Pacific Edge, Pharmazen, Connexionz, SLI Systems and Syft Technologies Limited. The Property sector (Ryman Healthcare and Arvida Group) has also been renamed to Aged Care.
• Six of the seven sectors posted positive movements in the quarter to 31 December 2017. The Aged Care sector lead the way with a gain of 15.4%, followed by the Primary sector increasing by 13.9%.
Key points for the 12 months to December 2017 include:
• Over the twelve months to 31 December 2017 the top performers, in percentage terms, were Synlait Milk (up 131.7%), New Zealand King Salmon Investments (up 80.9%), and Scott Technology (up 67.1%). In dollar terms the list looks different with Ryman Healthcare topping the table with growth of $1,240.0 million for the past twelve months, followed by Meridian Energy (up $833.0 million) and Synlait Milk (up $733.4 million).
• The largest declines over the 12 months in percentage terms were led by Energy Mad (down 78.3%), BLIS Technology (down 57.5%) and SLI Systems (down 55.6%). In dollar terms Pacific Edge fell by $43.4 million followed by BLIS Technology (down $25.5 million) and Marlborough Wine Estates Group falling $23.5 million.
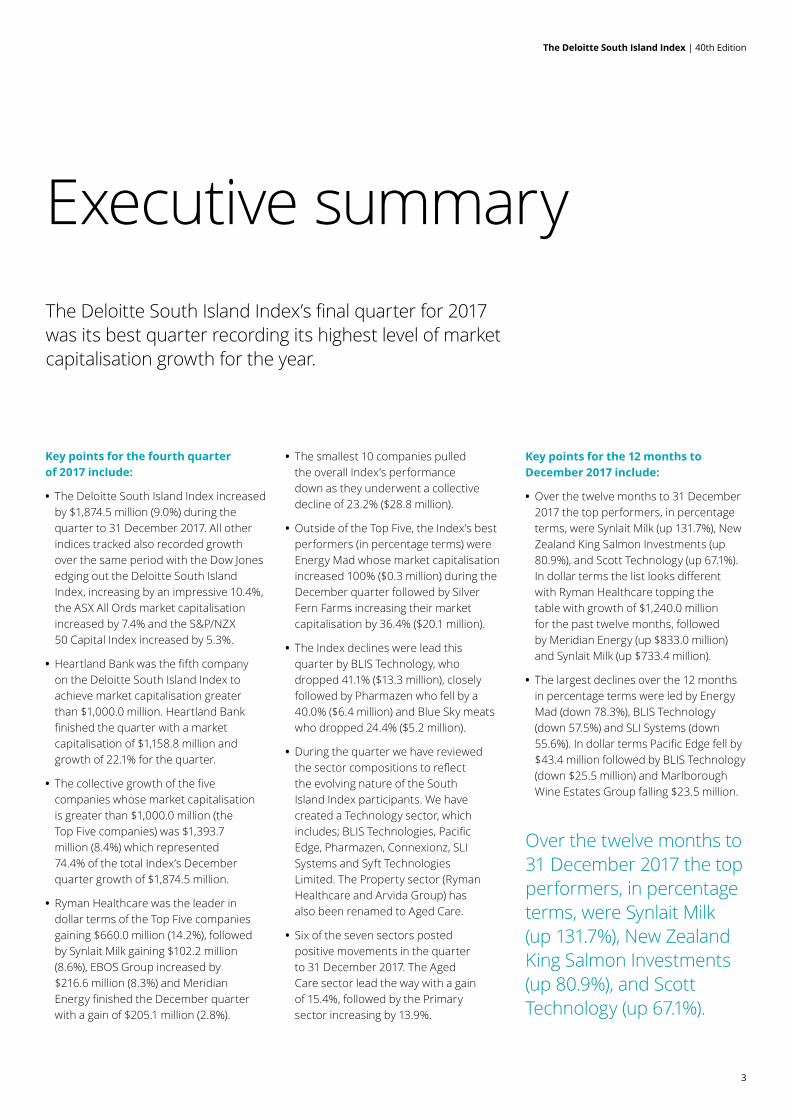
Executive summaryThe Deloitte South Island Index’s final quarter for 2017 was its best quarter recording its highest level of market capitalisation growth for the year.
Over the twelve months to 31 December 2017 the top performers, in percentage terms, were Synlait Milk (up 131.7%), New Zealand King Salmon Investments (up 80.9%), and Scott Technology (up 67.1%).
4
The Deloitte South Island Index | 40th Edition
$1.87bn(9%)
The DeloitteSouth Island Index
increased by
Top performing company over 12
months, Silver Fern Farms grew by:
Technology sector addedwhich includes: • BLIS Technologies• Pacific Edge• Pharmazen • Connexionz• SLI Systems • Syft Technologies
6/7Sectors
posted positive movements in the quarter to 31 December 2017
36.4%
IndexTop 5
Topgains*
Topdeclines
RymanHealthcare
14.2%
Silver Fern Farms
36.4%BLIS
Technology
41.1%NZ King Salmon
Investments
30.1%Pharmazen
40.0%
Blue Sky Meats
24.4%Scales Corporation
29.2%Snylait Milk
8.6%
EBOS Group
8.3%
Meridian Energy
2.8%
Heartland Bank
22.1%
South Island Index – fourth quarter 2017At a glance
*Energy Mad has been normalised from the chart given the distortion of its low share price.
5
The Deloitte South Island Index | 40th Edition
$1.87bn(9%)
The DeloitteSouth Island Index
increased by
Top performing company over 12
months, Silver Fern Farms grew by:
Technology sector addedwhich includes: • BLIS Technologies• Pacific Edge• Pharmazen • Connexionz• SLI Systems • Syft Technologies
6/7Sectors
posted positive movements in the quarter to 31 December 2017
36.4%
IndexTop 5
Topgains*
Topdeclines
RymanHealthcare
14.2%
Silver Fern Farms
36.4%BLIS
Technology
41.1%NZ King Salmon
Investments
30.1%Pharmazen
40.0%
Blue Sky Meats
24.4%Scales Corporation
29.2%Snylait Milk
8.6%
EBOS Group
8.3%
Meridian Energy
2.8%
Heartland Bank
22.1%
Quarter to 31 December 2017
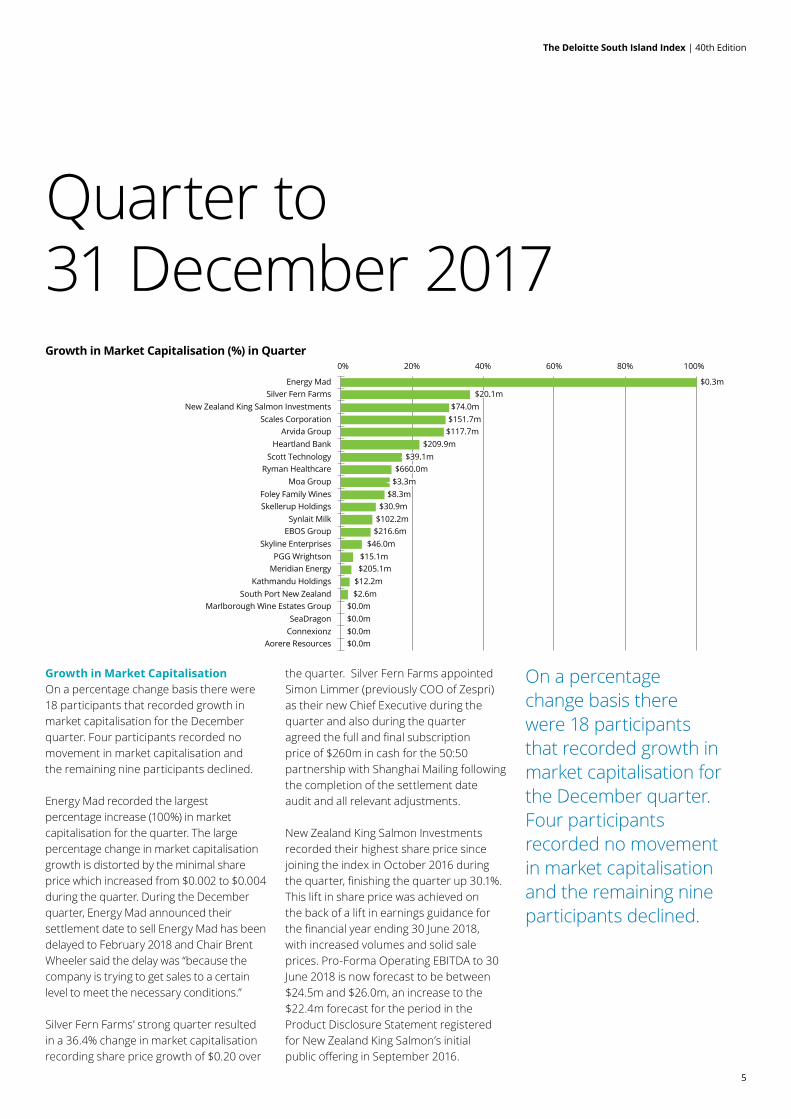
Growth in Market Capitalisation On a percentage change basis there were 18 participants that recorded growth in market capitalisation for the December quarter. Four participants recorded no movement in market capitalisation and the remaining nine participants declined.
Energy Mad recorded the largest percentage increase (100%) in market capitalisation for the quarter. The large percentage change in market capitalisation growth is distorted by the minimal share price which increased from $0.002 to $0.004 during the quarter. During the December quarter, Energy Mad announced their settlement date to sell Energy Mad has been delayed to February 2018 and Chair Brent Wheeler said the delay was “because the company is trying to get sales to a certain level to meet the necessary conditions.”
Silver Fern Farms’ strong quarter resulted in a 36.4% change in market capitalisation recording share price growth of $0.20 over
the quarter. Silver Fern Farms appointed Simon Limmer (previously COO of Zespri) as their new Chief Executive during the quarter and also during the quarter agreed the full and final subscription price of $260m in cash for the 50:50 partnership with Shanghai Mailing following the completion of the settlement date audit and all relevant adjustments.
New Zealand King Salmon Investments recorded their highest share price since joining the index in October 2016 during the quarter, finishing the quarter up 30.1%. This lift in share price was achieved on the back of a lift in earnings guidance for the financial year ending 30 June 2018, with increased volumes and solid sale prices. Pro-Forma Operating EBITDA to 30 June 2018 is now forecast to be between $24.5m and $26.0m, an increase to the $22.4m forecast for the period in the Product Disclosure Statement registered for New Zealand King Salmon’s initial public offering in September 2016.
On a percentage change basis there were 18 participants that recorded growth in market capitalisation for the December quarter. Four participants recorded no movement in market capitalisation and the remaining nine participants declined.
0% 20% 40% 60% 80% 100%
Energy MadSilver Fern Farms
New Zealand King Salmon InvestmentsScales Corporation
Arvida GroupHeartland Bank
Scott TechnologyRyman Healthcare
Moa GroupFoley Family WinesSkellerup Holdings
Synlait MilkEBOS Group
Skyline EnterprisesPGG Wrightson
Meridian EnergyKathmandu Holdings
South Port New ZealandMarlborough Wine Estates Group
SeaDragonConnexionz
Aorere Resources
Growth in Market Capitalisation (%) in Quarter
Decline in Market Capitalisation (%) in Quarter
(10%)
(5%)
0%
5%
10%
15%
20%
Technology Energy& Mining
Manufacturing& Distribution
Primary Aged Care Retail Other
% M
ovem
ent i
n In
dex
Sector
Movement in Sector Indices – Quarter to December 2017
$0.3m$20.1m$20.1m
$74.0m$151.7m
$117.7m$209.9m
$39.1m$660.0m
$39.1m$660.0m
$3.3m$3.3m$8.3m
$30.9m$102.2m$216.6m
$46.0m$15.1m$205.1m
$12.2m$2.6m
$0.0m$0.0m$0.0m
$0.0m
$(6.0)m
$(3.4)m
$(2.1)m
$(3.4)m
$(13.3)m
$(6.0)m
$(3.4)m
$(2.1)m
$(0.7)m
$(0.1)m
$(3.4)m
$(5.2)m
$(6.4)m
$(13.3)m
(50%) (45%) (40%) (35%) (30%) (25%) (20%) (15%) (10%) (5%) 0%
Pacific Edge
Syft Technologies
Smiths City Group
Chatham Rock Phosphate
Windflow Technology
SLI Systems
Blue Sky Meats
Pharmazen
BLIS Technologies
6
The Deloitte South Island Index | 40th Edition
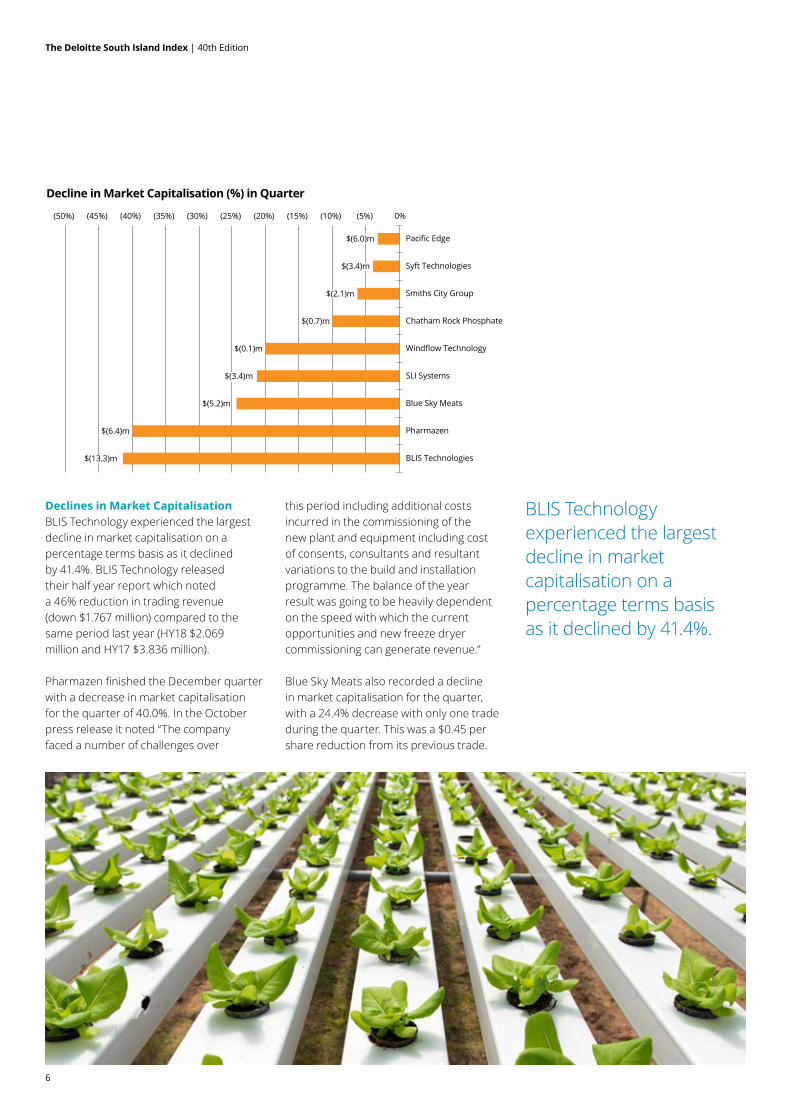
Declines in Market CapitalisationBLIS Technology experienced the largest decline in market capitalisation on a percentage terms basis as it declined by 41.4%. BLIS Technology released their half year report which noted a 46% reduction in trading revenue (down $1.767 million) compared to the same period last year (HY18 $2.069 million and HY17 $3.836 million).
Pharmazen finished the December quarter with a decrease in market capitalisation for the quarter of 40.0%. In the October press release it noted “The company faced a number of challenges over
this period including additional costs incurred in the commissioning of the new plant and equipment including cost of consents, consultants and resultant variations to the build and installation programme. The balance of the year result was going to be heavily dependent on the speed with which the current opportunities and new freeze dryer commissioning can generate revenue.”
Blue Sky Meats also recorded a decline in market capitalisation for the quarter, with a 24.4% decrease with only one trade during the quarter. This was a $0.45 per share reduction from its previous trade.
BLIS Technology experienced the largest decline in market capitalisation on a percentage terms basis as it declined by 41.4%.
0% 20% 40% 60% 80% 100%
Energy MadSilver Fern Farms
New Zealand King Salmon InvestmentsScales Corporation
Arvida GroupHeartland Bank
Scott TechnologyRyman Healthcare
Moa GroupFoley Family WinesSkellerup Holdings
Synlait MilkEBOS Group
Skyline EnterprisesPGG Wrightson
Meridian EnergyKathmandu Holdings
South Port New ZealandMarlborough Wine Estates Group
SeaDragonConnexionz
Aorere Resources
Growth in Market Capitalisation (%) in Quarter
Decline in Market Capitalisation (%) in Quarter
(10%)
(5%)
0%
5%
10%
15%
20%
Technology Energy& Mining
Manufacturing& Distribution
Primary Aged Care Retail Other
% M
ovem
ent i
n In
dex
Sector
Movement in Sector Indices – Quarter to December 2017
$0.3m$20.1m$20.1m
$74.0m$151.7m
$117.7m$209.9m
$39.1m$660.0m
$39.1m$660.0m
$3.3m$3.3m$8.3m
$30.9m$102.2m$216.6m
$46.0m$15.1m$205.1m
$12.2m$2.6m
$0.0m$0.0m$0.0m
$0.0m
$(6.0)m
$(3.4)m
$(2.1)m
$(3.4)m
$(13.3)m
$(6.0)m
$(3.4)m
$(2.1)m
$(0.7)m
$(0.1)m
$(3.4)m
$(5.2)m
$(6.4)m
$(13.3)m
(50%) (45%) (40%) (35%) (30%) (25%) (20%) (15%) (10%) (5%) 0%
Pacific Edge
Syft Technologies
Smiths City Group
Chatham Rock Phosphate
Windflow Technology
SLI Systems
Blue Sky Meats
Pharmazen
BLIS Technologies
7
The Deloitte South Island Index | 40th Edition
In percentage terms, the growth of the Index was led by the newly named Aged Care sector as it grew $777.7 million (15.4%) during the quarter as both participants achieved growth.
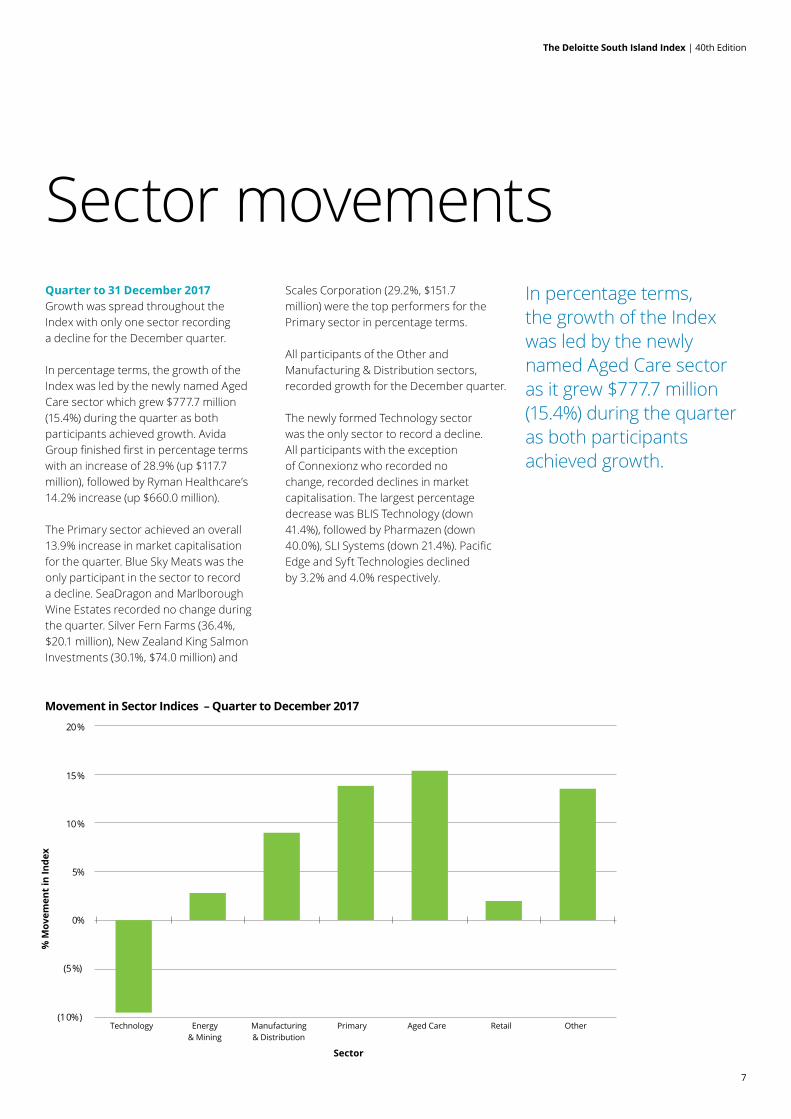
Sector movementsQuarter to 31 December 2017Growth was spread throughout the Index with only one sector recording a decline for the December quarter.
In percentage terms, the growth of the Index was led by the newly named Aged Care sector which grew $777.7 million (15.4%) during the quarter as both participants achieved growth. Avida Group finished first in percentage terms with an increase of 28.9% (up $117.7 million), followed by Ryman Healthcare’s 14.2% increase (up $660.0 million).
The Primary sector achieved an overall 13.9% increase in market capitalisation for the quarter. Blue Sky Meats was the only participant in the sector to record a decline. SeaDragon and Marlborough Wine Estates recorded no change during the quarter. Silver Fern Farms (36.4%, $20.1 million), New Zealand King Salmon Investments (30.1%, $74.0 million) and
Scales Corporation (29.2%, $151.7 million) were the top performers for the Primary sector in percentage terms.
All participants of the Other and Manufacturing & Distribution sectors, recorded growth for the December quarter.
The newly formed Technology sector was the only sector to record a decline. All participants with the exception of Connexionz who recorded no change, recorded declines in market capitalisation. The largest percentage decrease was BLIS Technology (down 41.4%), followed by Pharmazen (down 40.0%), SLI Systems (down 21.4%). Pacific Edge and Syft Technologies declined by 3.2% and 4.0% respectively.
0% 20% 40% 60% 80% 100%
Energy MadSilver Fern Farms
New Zealand King Salmon InvestmentsScales Corporation
Arvida GroupHeartland Bank
Scott TechnologyRyman Healthcare
Moa GroupFoley Family WinesSkellerup Holdings
Synlait MilkEBOS Group
Skyline EnterprisesPGG Wrightson
Meridian EnergyKathmandu Holdings
South Port New ZealandMarlborough Wine Estates Group
SeaDragonConnexionz
Aorere Resources
Growth in Market Capitalisation (%) in Quarter
Decline in Market Capitalisation (%) in Quarter
(10%)
(5%)
0%
5%
10%
15%
20%
Technology Energy& Mining
Manufacturing& Distribution
Primary Aged Care Retail Other
% M
ovem
ent i
n In
dex
Sector
Movement in Sector Indices – Quarter to December 2017
$0.3m$20.1m$20.1m
$74.0m$151.7m
$117.7m$209.9m
$39.1m$660.0m
$39.1m$660.0m
$3.3m$3.3m$8.3m
$30.9m$102.2m$216.6m
$46.0m$15.1m$205.1m
$12.2m$2.6m
$0.0m$0.0m$0.0m
$0.0m
$(6.0)m
$(3.4)m
$(2.1)m
$(3.4)m
$(13.3)m
$(6.0)m
$(3.4)m
$(2.1)m
$(0.7)m
$(0.1)m
$(3.4)m
$(5.2)m
$(6.4)m
$(13.3)m
(50%) (45%) (40%) (35%) (30%) (25%) (20%) (15%) (10%) (5%) 0%
Pacific Edge
Syft Technologies
Smiths City Group
Chatham Rock Phosphate
Windflow Technology
SLI Systems
Blue Sky Meats
Pharmazen
BLIS Technologies
8
The Deloitte South Island Index | 40th Edition
Industry Number of Companies
31 Dec 2017 $ million
30 Sept 2017 $ million
Mvmt in Quarter $ million
% change in Mkt Cap during
quarter
% of Index
Technology 6 $307.4 $339.9 $(32.5) (9.6)% 1.3%
Energy & Mining 4 $7,505.0 $7,300.7 $204.3 2.8% 32.9%
Manufacturing & Distribution 4 $3,455.3 $3,168.4 $286.9 9.1% 15.1%
Primary 9 $3,004.9 $2,638.7 $366.2 13.9% 13.2%
Aged Care 2 $5,820.5 $5,042.8 $777.7 15.4% 25.5%
Retail 2 $522.9 $512.8 $10.1 2.0% 2.3%
Other 4 $2,195.3 $1,933.5 $261.8 13.5% 9.6%
TOTAL 31 $22,811.3 $20,936.8 $1,874.5 9.0% 100.0%
9
The Deloitte South Island Index | 40th Edition
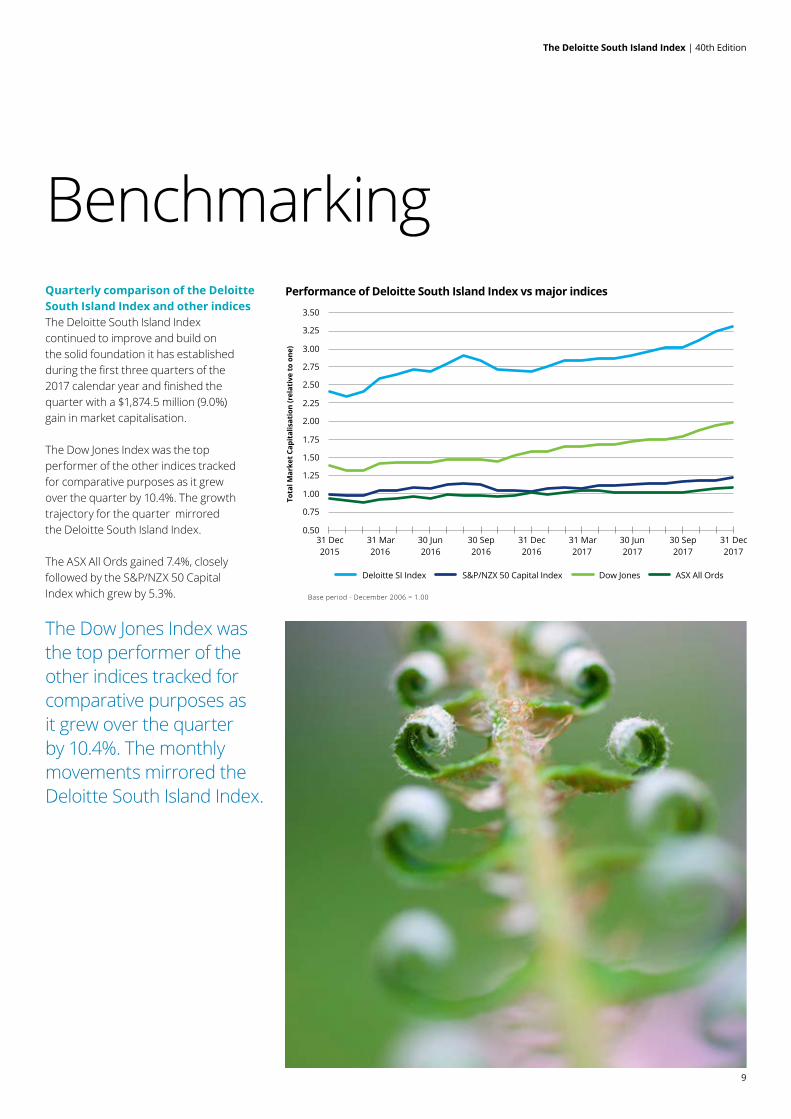
BenchmarkingQuarterly comparison of the Deloitte South Island Index and other indicesThe Deloitte South Island Index continued to improve and build on the solid foundation it has established during the first three quarters of the 2017 calendar year and finished the quarter with a $1,874.5 million (9.0%) gain in market capitalisation.
The Dow Jones Index was the top performer of the other indices tracked for comparative purposes as it grew over the quarter by 10.4%. The growth trajectory for the quarter mirrored the Deloitte South Island Index.
The ASX All Ords gained 7.4%, closely followed by the S&P/NZX 50 Capital Index which grew by 5.3%.
The Dow Jones Index was the top performer of the other indices tracked for comparative purposes as it grew over the quarter by 10.4%. The monthly movements mirrored the Deloitte South Island Index.
Performance of Deloitte South Island Index vs major indices
Deloitte SI Index S&P/NZX 50 Capital Index Dow Jones ASX All Ords
Base period - December 2006 = 1.00
0.50
0.75
1.00
1.25
1.50
1.75
2.00
2.25
2.50
2.75
3.00
3.25
3.50
31 Dec2015
31 Mar2016
30 Jun2016
30 Sep2016
31 Dec2016
31 Mar2017
30 Jun2017
30 Sep2017
31 Dec2017
Tota
l Mar
ket C
apit
alis
atio
n (r
elat
ive
to o
ne)
10
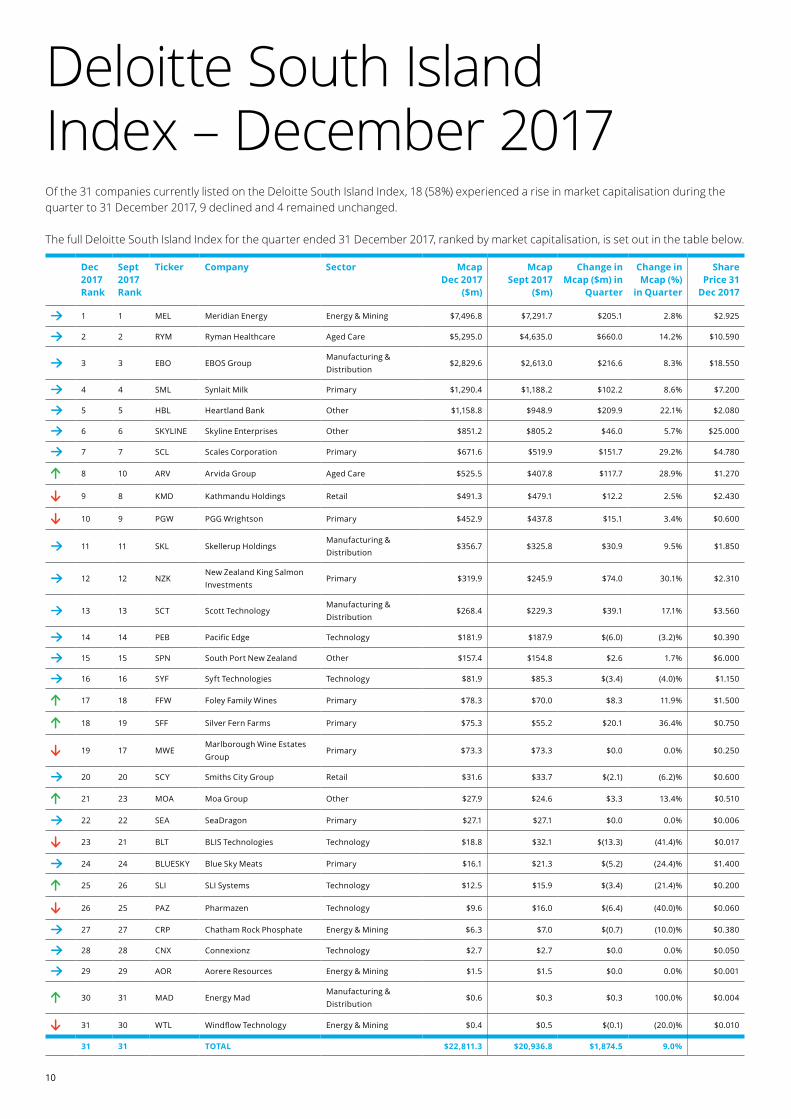
Of the 31 companies currently listed on the Deloitte South Island Index, 18 (58%) experienced a rise in market capitalisation during the quarter to 31 December 2017, 9 declined and 4 remained unchanged.
The full Deloitte South Island Index for the quarter ended 31 December 2017, ranked by market capitalisation, is set out in the table below.
Deloitte South Island Index – December 2017
Dec 2017 Rank
Sept 2017 Rank
Ticker Company Sector Mcap Dec 2017
($m)
Mcap Sept 2017
($m)
Change in Mcap ($m) in
Quarter
Change in Mcap (%)
in Quarter
Share Price 31
Dec 2017
1 1 MEL Meridian Energy Energy & Mining $7,496.8 $7,291.7 $205.1 2.8% $2.925
2 2 RYM Ryman Healthcare Aged Care $5,295.0 $4,635.0 $660.0 14.2% $10.590
3 3 EBO EBOS GroupManufacturing & Distribution
$2,829.6 $2,613.0 $216.6 8.3% $18.550
4 4 SML Synlait Milk Primary $1,290.4 $1,188.2 $102.2 8.6% $7.200
5 5 HBL Heartland Bank Other $1,158.8 $948.9 $209.9 22.1% $2.080
6 6 SKYLINE Skyline Enterprises Other $851.2 $805.2 $46.0 5.7% $25.000
7 7 SCL Scales Corporation Primary $671.6 $519.9 $151.7 29.2% $4.780
8 10 ARV Arvida Group Aged Care $525.5 $407.8 $117.7 28.9% $1.270
9 8 KMD Kathmandu Holdings Retail $491.3 $479.1 $12.2 2.5% $2.430
10 9 PGW PGG Wrightson Primary $452.9 $437.8 $15.1 3.4% $0.600
11 11 SKL Skellerup HoldingsManufacturing & Distribution
$356.7 $325.8 $30.9 9.5% $1.850
12 12 NZKNew Zealand King Salmon Investments
Primary $319.9 $245.9 $74.0 30.1% $2.310
13 13 SCT Scott Technology Manufacturing & Distribution
$268.4 $229.3 $39.1 17.1% $3.560
14 14 PEB Pacific Edge Technology $181.9 $187.9 $(6.0) (3.2)% $0.390
15 15 SPN South Port New Zealand Other $157.4 $154.8 $2.6 1.7% $6.000
16 16 SYF Syft Technologies Technology $81.9 $85.3 $(3.4) (4.0)% $1.150
17 18 FFW Foley Family Wines Primary $78.3 $70.0 $8.3 11.9% $1.500
18 19 SFF Silver Fern Farms Primary $75.3 $55.2 $20.1 36.4% $0.750
19 17 MWEMarlborough Wine Estates Group
Primary $73.3 $73.3 $0.0 0.0% $0.250
20 20 SCY Smiths City Group Retail $31.6 $33.7 $(2.1) (6.2)% $0.600
21 23 MOA Moa Group Other $27.9 $24.6 $3.3 13.4% $0.510
22 22 SEA SeaDragon Primary $27.1 $27.1 $0.0 0.0% $0.006
23 21 BLT BLIS Technologies Technology $18.8 $32.1 $(13.3) (41.4)% $0.017
24 24 BLUESKY Blue Sky Meats Primary $16.1 $21.3 $(5.2) (24.4)% $1.400
25 26 SLI SLI Systems Technology $12.5 $15.9 $(3.4) (21.4)% $0.200
26 25 PAZ Pharmazen Technology $9.6 $16.0 $(6.4) (40.0)% $0.060
27 27 CRP Chatham Rock Phosphate Energy & Mining $6.3 $7.0 $(0.7) (10.0)% $0.380
28 28 CNX Connexionz Technology $2.7 $2.7 $0.0 0.0% $0.050
29 29 AOR Aorere Resources Energy & Mining $1.5 $1.5 $0.0 0.0% $0.001
30 31 MAD Energy MadManufacturing & Distribution
$0.6 $0.3 $0.3 100.0% $0.004
31 30 WTL Windflow Technology Energy & Mining $0.4 $0.5 $(0.1) (20.0)% $0.010
31 31 TOTAL $22,811.3 $20,936.8 $1,874.5 9.0%
11
The Deloitte South Island Index | 40th EditionCompilation of the Deloitte South Island Index
Information
The Deloitte South Island Index (‘the Index’) is compiled from information provided by the NZX, and Unlisted on the market capitalisation of each South-Island based listed company. Broadly, a company is included in the Index where its registered office is in the South Island and/or a substantial portion of its operations are focused in the South Island. The information on South Island listed companies is extracted and totalled to provide a cumulative market capitalisation for all South Island listed companies.
The base period of the Deloitte South Island Index is 31 December 2006 and for the purposes of the Index this data is given a notional value of one. All subsequent quarterly cumulative market capitalisation totals are divided by the totals for the December 2006 quarter to obtain a relative movement. Market capitalisation will move as a result of capital injections, payments of dividends and capital returns. If a new South Island based company lists on the NZX or Unlisted they will be reflected in the Index as though they were present in the base period. Accordingly, the Index will only reflect changes in market capitalisation subsequent to listing. If a company is suspended or delisted during a quarter, no data will be included for the company, including any historical data, until the company is re-listed or the suspension lifted.
For the purposes of the sector analysis some sector segments have been grouped to provide a more meaningful analysis.
Deloitte Corporate Finance is the firm’s specialist corporate finance practice. For information regarding the Deloitte South Island Index or any of the services that we offer please contact any of our selected South Island based team below.
Christchurch
Scott McClayPartner | Corporate Finance+64 (03) 363 [email protected]
Aaron ThornPartner | Tax & Private+64 (03) 363 [email protected]
Steve LawPartner | ConsultingDirect : +64 (03) 363 [email protected]
Mike HawkenPartner | AuditDirect : +64 (03) 474 [email protected]
Daniel HellyerPartner | Tax & PrivateDirect : +64 (03) 901 [email protected]
Phil StevensonPartner | Tax & PrivateDirect : +64 (03) 474 [email protected]
Kyle CameronPartner | Tax & PrivateDirect : +64 (03) 474 [email protected]
Mike HornePartner | Tax & PrivateDirect : +64 (03) 474 [email protected]
Shari CarterPartner | Tax & PrivateDirect : +64 (03) 363 [email protected]
Mike HoshekPartner | AuditDirect : +64 (03) 363 [email protected]
Rob McDonaldDirector | Corporate Finance+64 (0) 3 363 [email protected]
Richard BaileyPartner | Corporate Finance+64 (0) 3 363 [email protected]
Dunedin Queenstown
Christchurch 151 Cambridge Terrance, Christchurch 8013PO Box 248, Christchurch 8140New ZealandTel: +64 (0) 3 379 7010Fax: +64 (0) 3 366 6539www.deloitte.co.nz
DunedinOtago House, 481 Moray Place, Dunedin 9016PO Box 1245, Dunedin 9054New ZealandTel: +64 (0) 3 474 8630 Fax: +64 (0) 3 474 8650www.deloitte.co.nz
QueenstownLevel 2, 10 Memorial StreetPO Box 794, Queenstown 9348New ZealandTel: +64 (0) 3 901 0570 Fax: +64 (0) 3 901 0571www.deloitte.co.nz
Deloitte refers to one or more of Deloitte Touche Tohmatsu Limited, a UK private company limited by guarantee (“DTTL”), its network of member firms, and their related entities. DTTL and each of its member firms are legally separate and independent entities. DTTL (also referred to as “Deloitte Global”) does not provide services to clients. Please see www.deloitte.com/about for a more detailed description of DTTL and its member firms.
Deloitte provides audit, consulting, financial advisory, risk management, tax and related services to public and private clients spanning multiple industries. Deloitte serves four out of five Fortune Global 500® companies through a globally connected network of member firms in more than 150 countries bringing world-class capabilities, insights, and high-quality service to address clients’ most complex business challenges. To learn more about how Deloitte’s approximately 245,000 professionals make an impact that matters, please connect with us on Facebook, LinkedIn, or Twitter.
Deloitte New Zealand brings together more than 1200 specialist professionals providing audit, tax, technology and systems, strategy and performance improvement, risk management, corporate finance, business recovery, forensic and accounting services. Our people are based in Auckland, Hamilton, Rotorua, Wellington, Christchurch and Dunedin, serving clients that range from New Zealand’s largest companies and public sector organisations to smaller businesses with ambition to grow. For more information about Deloitte in New Zealand, look to our website www.deloitte.co.nz.
This communication contains general information only, and none of Deloitte Touche Tohmatsu Limited, its member firms, or their related entities (collectively, the “Deloitte Network”) is, by means of this communication, rendering professional advice or services. Before making any decision or taking any action that may affect your finances or your business, you should consult a qualified professional adviser. No entity in the Deloitte Network shall be responsible for any loss whatsoever sustained by any person who relies on this communication.
© 2018. For information, contact Deloitte Touche Tohmatsu Limited.