Embed Size (px)
Citation preview
Current Directions in Networking and
Cloud ComputingP. Brighten Godfrey
University of Illinois at [email protected]
Imam University Futures in Information Technology Program
July 10, 2012
Cloud Computing
Cloud Computing: Computing as a utility
• Purchase however much you need, whenever you need it• Service ranges from access to raw (virtual) machines, to
higher level: distributed storage, web services
Implications
• Reduces barrier to entry to building large service- No need for up-front capital investment• No need to plan ahead• Reduces cost• Compute and storage becomes more centralized
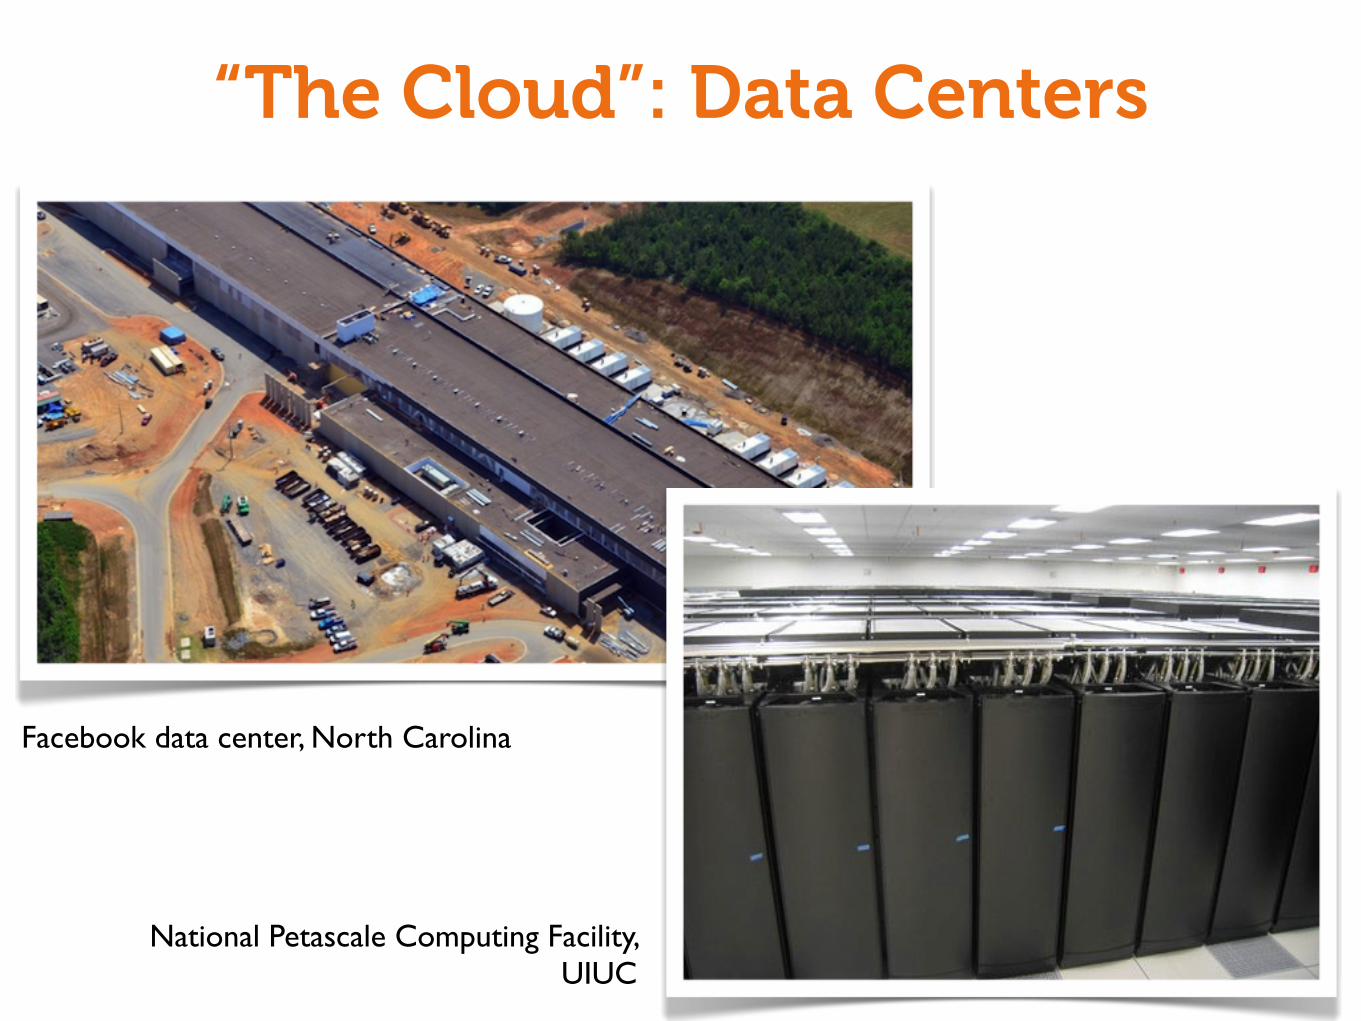
“The Cloud”: Data Centers
Facebook data center, North Carolina
National Petascale Computing Facility, UIUC
Key advantage: economy of scale
One technician for each 15,000 servers [Facebook]
Facility / power infrastructure operated in bulk
Ability to custom-design equipment
• Facebook (servers), Google (servers & networking gear)
Statistical multiplexing
• Must provision for peak load• Many users sharing a resource are unlikely to have their
peaks all at the same time
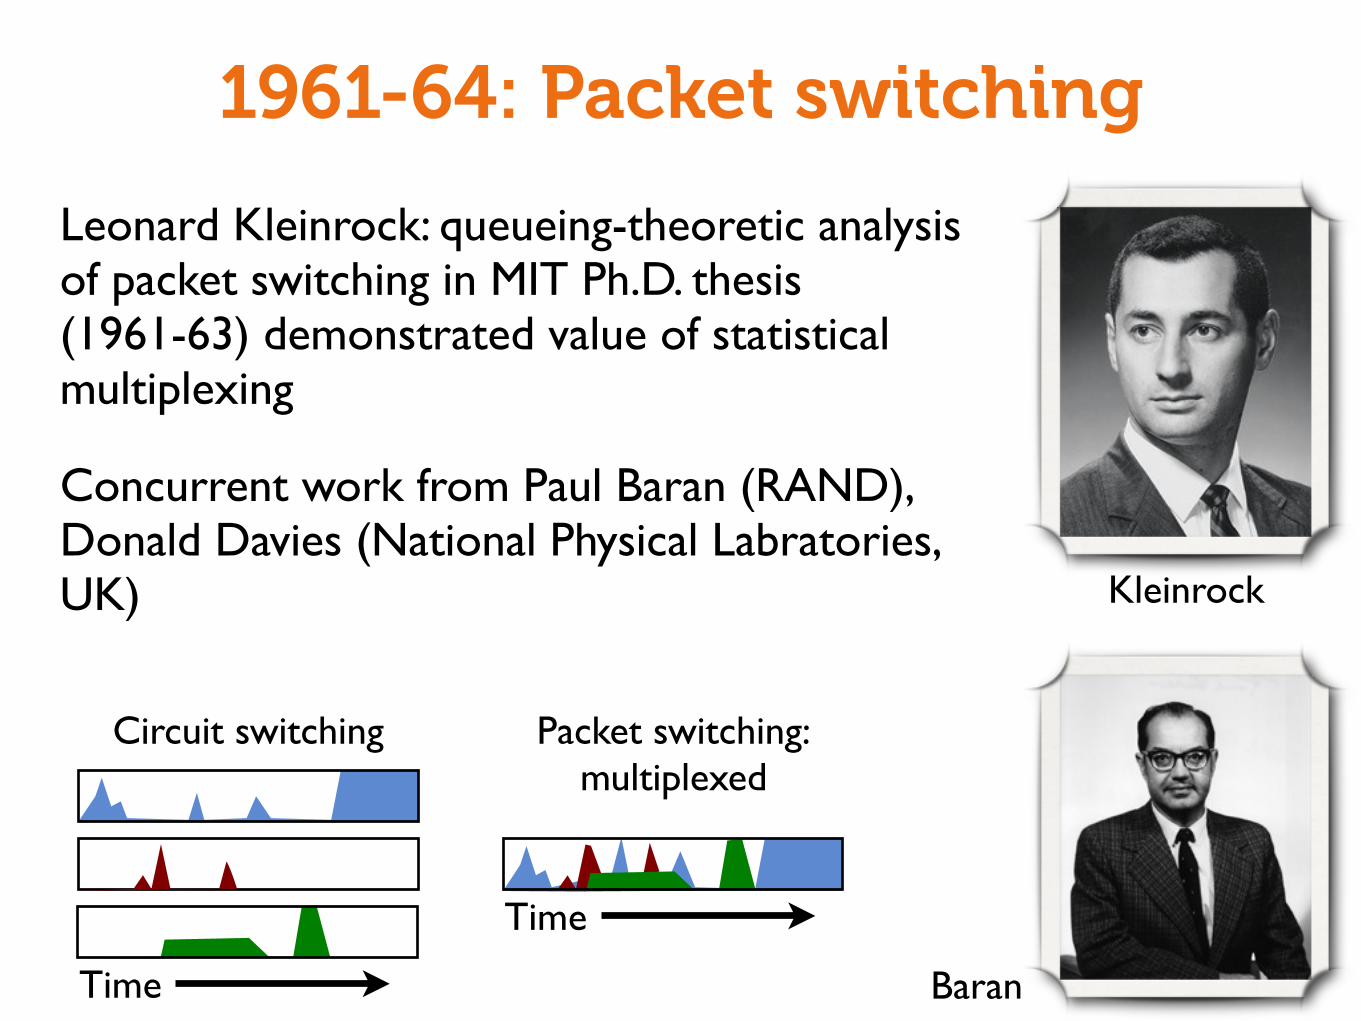
Leonard Kleinrock: queueing-theoretic analysis of packet switching in MIT Ph.D. thesis (1961-63) demonstrated value of statistical multiplexing
Concurrent work from Paul Baran (RAND), Donald Davies (National Physical Labratories, UK)
1961-64: Packet switching
Kleinrock
Baran
Circuit switching
Time
Packet switching:multiplexed
Time
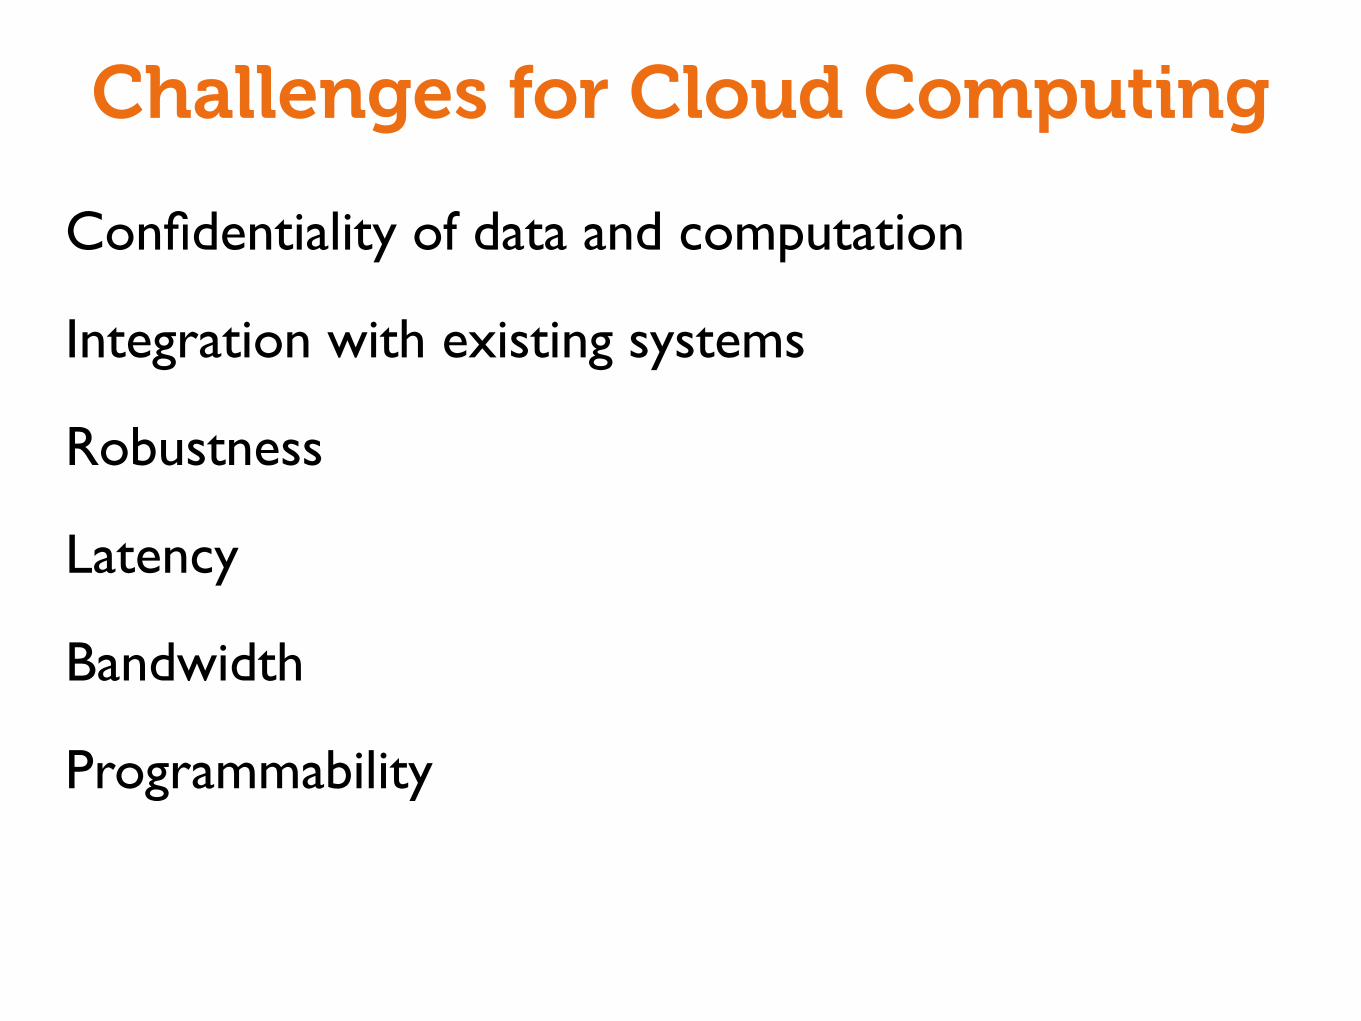
Challenges for Cloud Computing
Confidentiality of data and computation
Integration with existing systems
Robustness
Latency
Bandwidth
Programmability
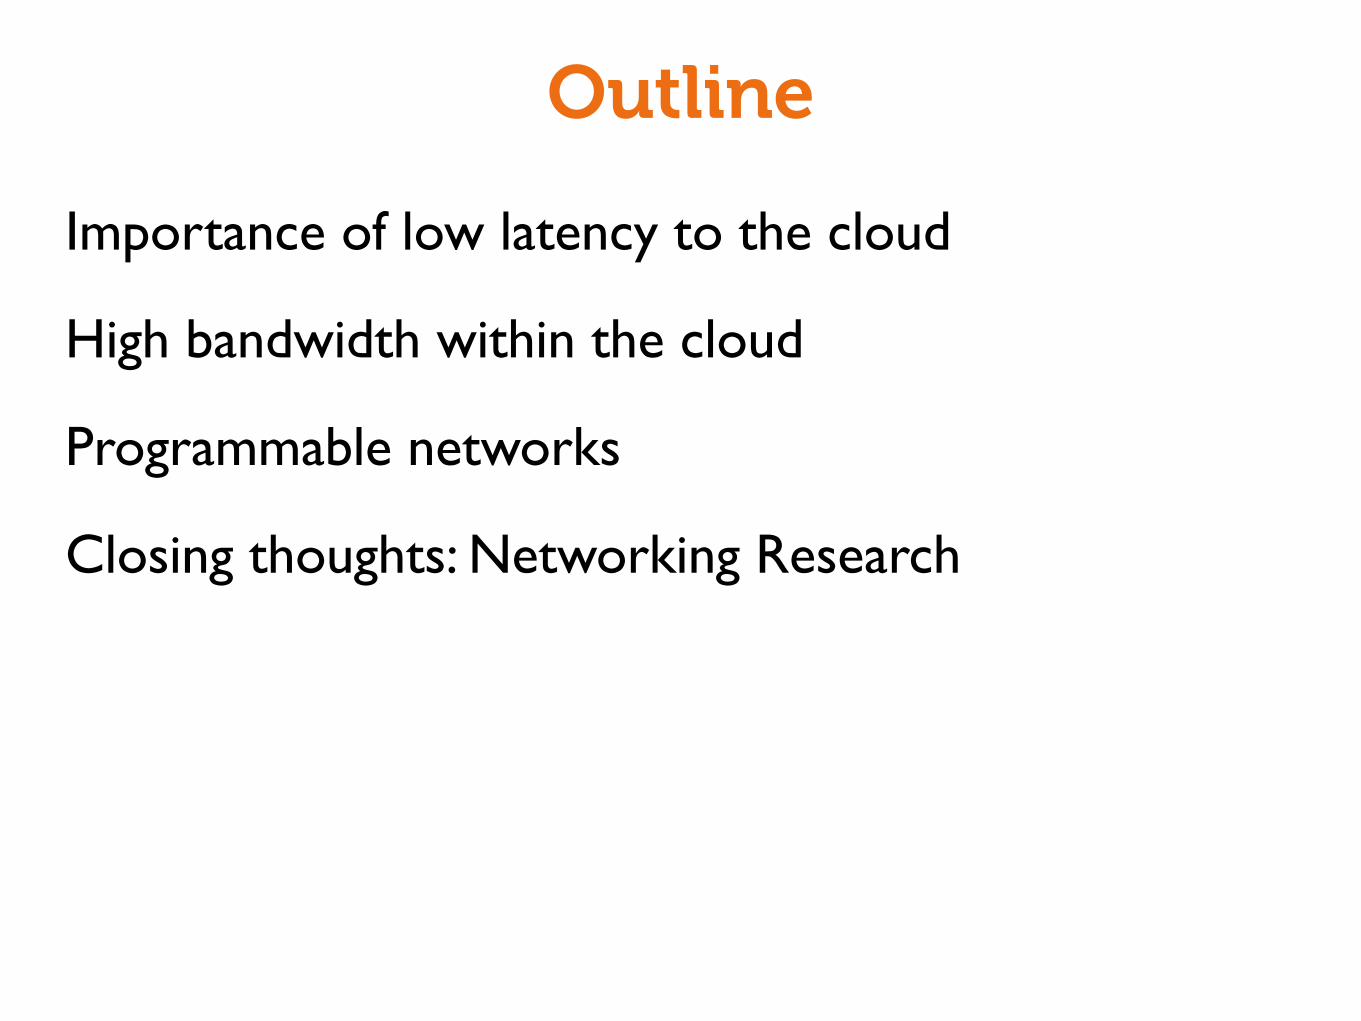
Outline
Importance of low latency to the cloud
High bandwidth within the cloud
Programmable networks
Closing thoughts: Networking Research
Low Latencyto the Cloud
Low latency to the cloud
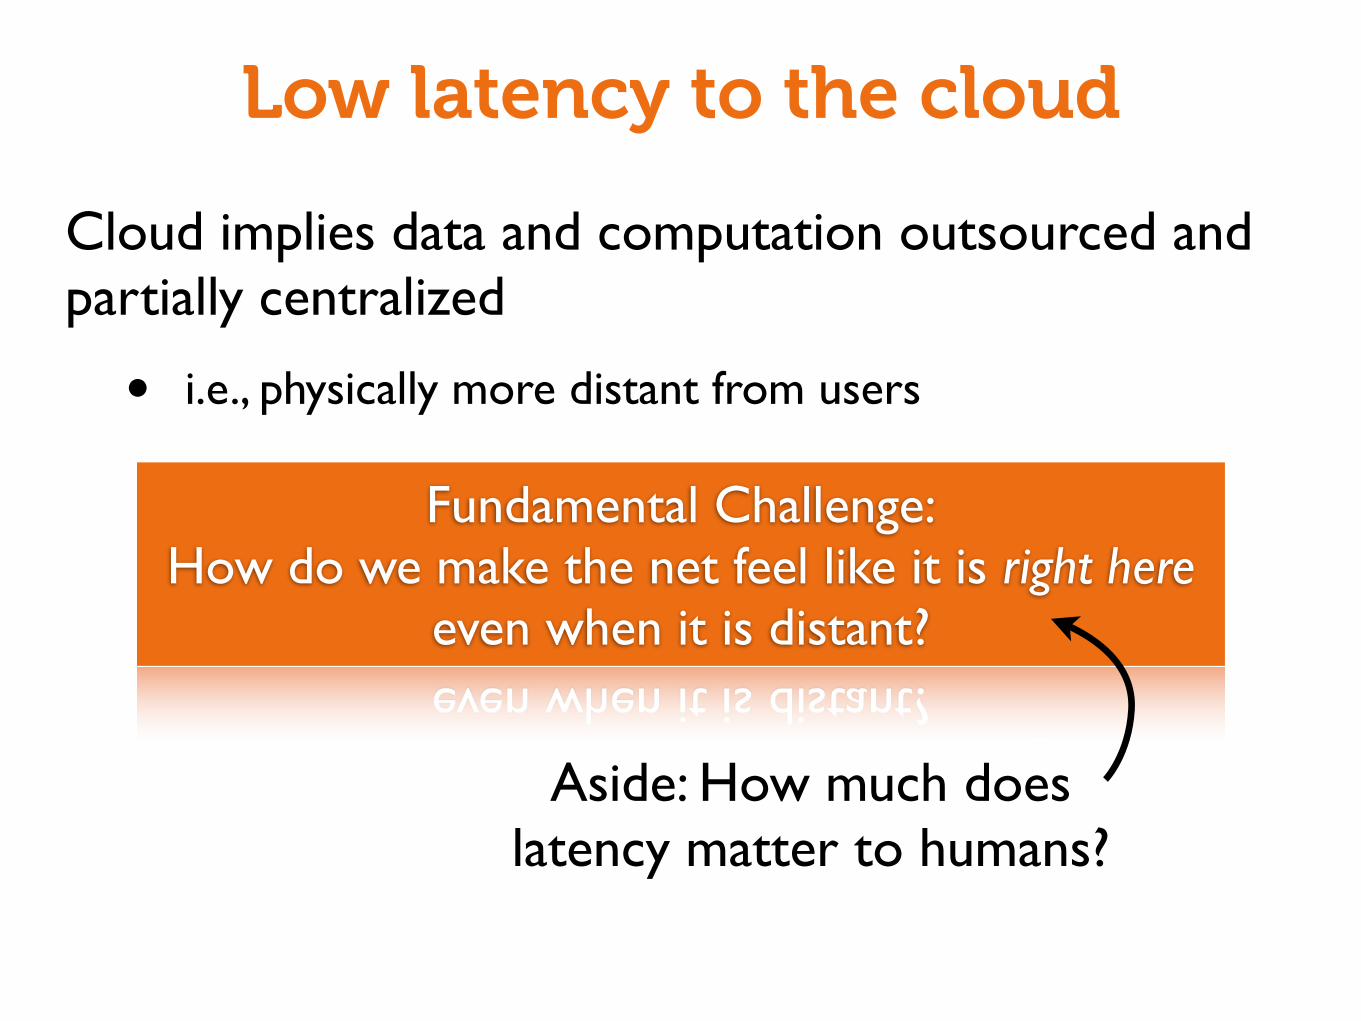
Cloud implies data and computation outsourced and partially centralized
• i.e., physically more distant from users
Fundamental Challenge:How do we make the net feel like it is right here
even when it is distant?
Aside: How much doeslatency matter to humans?
Milliseconds matter
Hiromi Uehara“Kung Fu World Champion”
88 msec per note
Milliseconds matter
Speed Matters for Google Web SearchJake Brutlag
Google, Inc.
June 22, 2009
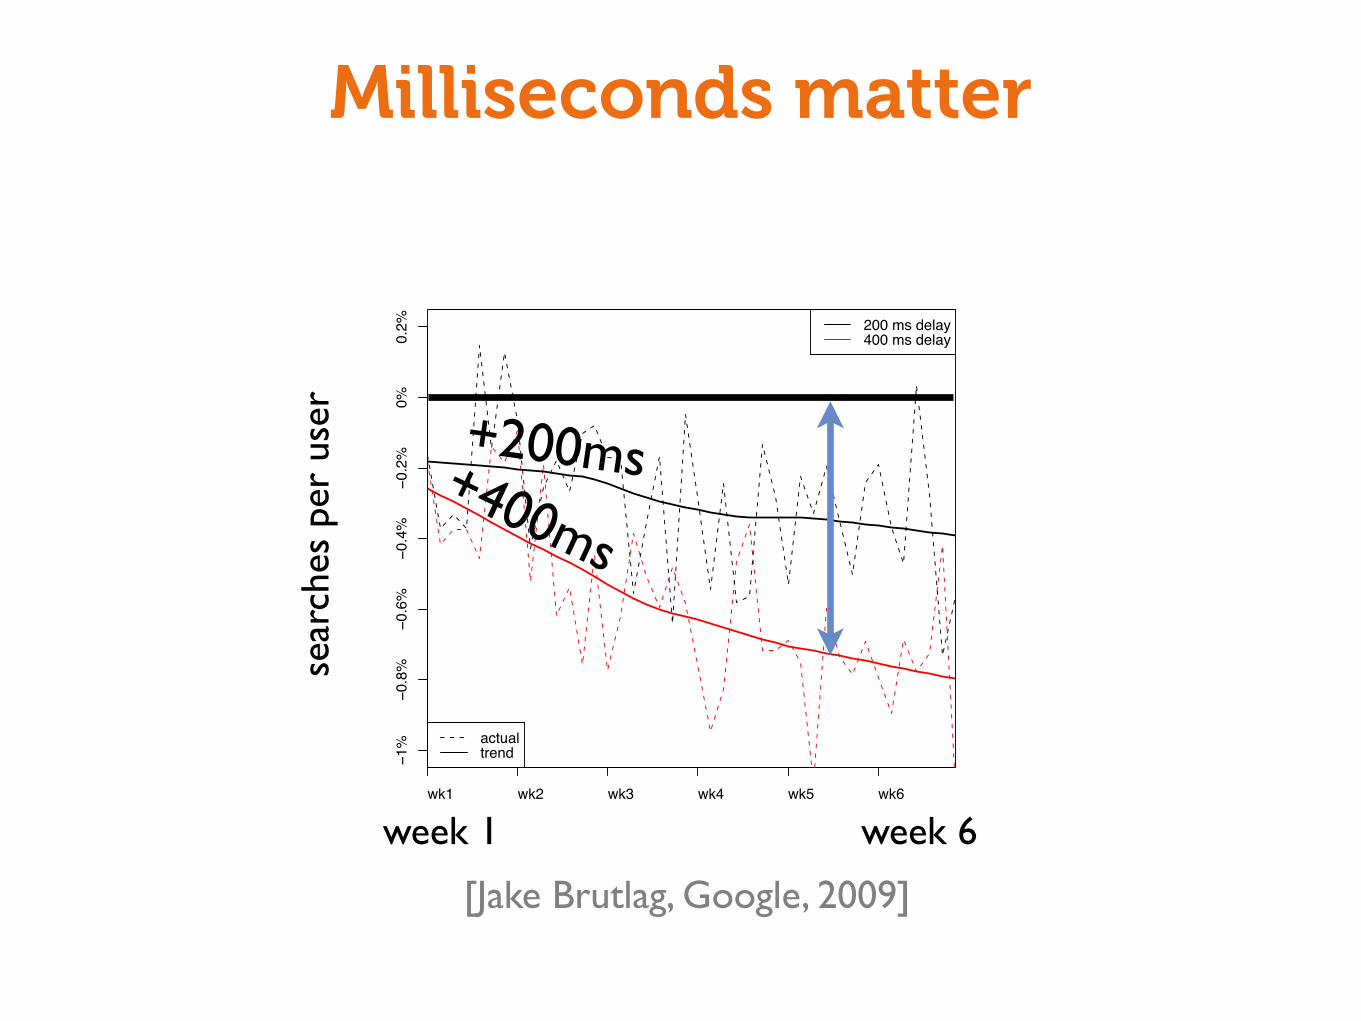
Abstract – Experiments demonstrate that increasing
web search latency 100 to 400 ms reduces the daily
number of searches per user by 0.2% to 0.6%. Fur-
thermore, users do fewer searches the longer they are
exposed. For longer delays, the loss of searches per-
sists for a time even after latency returns to previous
levels.
Google runs experiments on search traffic to understand
and improve the search experience. A series of such ex-
periments injected different types of server-side delay intothe search results page load in order to understand the
impact of latency on user behavior. In a given experiment,one group of users experienced the delay, while a second
group served as the control. Across the experiments, the
type of delay, the magnitude of the delay, and experimentduration (number of weeks users subject to delay) varied.
Speed as perceived by the end user is driven by multi-
ple factors. These experiments model only one of them:additional server processing time. Figure 1 illustrates the
three types of delay tested; the type of delay distinguisheswhen the delay occurs in the sequence of steps that con-
stitute a page load.
Figure 1: Injecting Server-Side Delay
In Figure 1, time flows from left to right and diago-
nal lines represent network communication between theclient and server. A user perceives load time as the du-
ration from start of navigation until page complete. The
page load may include optional activities (in blue), butevery search includes an HTTP request for the page
HTML, spanning the duration between GET and Last
Byte. Server processing commences upon receipt of theHTTP GET. Google search leverages HTTP chunking,
which means the page header can be transmitted (andperhaps rendered) even before the results are ready.
The different types of delay tested are:
pre-header pausing all server processing for X msimmediately upon receipt of the HTTP GET
post-header pausing for X ms after transmitting the
page header but before any further serverprocessing is done
post-ads pausing X ms mid-stream sending the results,after the sponsored links
Both the post-header and post-ads delay may be masked
by network conditions. That is, a slow or unreliable con-nection may mitigate any delay in server processing from
the user’s perspective. All three types of delay may be
perceived differently by users due to the degree of partial
rendering on the page.All other things being equal, more usage, as measured
by number of searches, reflects more satisfied users. Ta-ble 1 gives the average daily searches per user over the
experiment duration for the experiment group relative to
the control group.
Table 1: Experiment Impact on Daily Searches Per User
Type of Delay Magnitude Duration Impact
Pre-header 50 ms 4 weeks —
Pre-header 100 ms 4 weeks !0.20%Post-header 200 ms 6 weeks !0.29%
Post-header 400 ms 6 weeks !0.59%
Post-ads 200 ms 4 weeks !0.30%
Average impact over 4 or 6 weeks hides any trend overtime. By focusing on the subset of users who were part of
the experiment (or control group) from the beginning (asidentified by a browser cookie), one can determine if there
is such a trend. Figure 2 illustrates the trend for the two 6
week experiments.
Figure 2: Impact of Post-header Delays Over Time
da
ily s
ea
rch
es p
er
use
r re
lative
to
co
ntr
ol
wk1 wk2 wk3 wk4 wk5 wk6
−1
%−
0.8
%−
0.6
%−
0.4
%−
0.2
%0
%0
.2% 200 ms delay
400 ms delay
actualtrend
The change over time can be quantified by dividing the
6 week duration in half. The impact on daily searchesper user during the second half is !0.36% and !0.74%
for the 200 ms and 400 ms delay respectively, compared
to !0.22% and !0.44% for the first half. Users do fewersearches the longer they are exposed to delay.
Furthermore, observing these users for the 400 ms de-
lay after we stop subjecting them to the delay, the rate ofdaily searches per user for the experiment is still !0.21%
relative to the control (averaged over the 5 weeks af-ter removal of the delay). For longer delays, the loss of
searches persists for a time even after latency returns to
previous levels.
[Jake Brutlag, Google, 2009]
sear
ches
per
use
r
+200ms+400ms
week 1 week 6
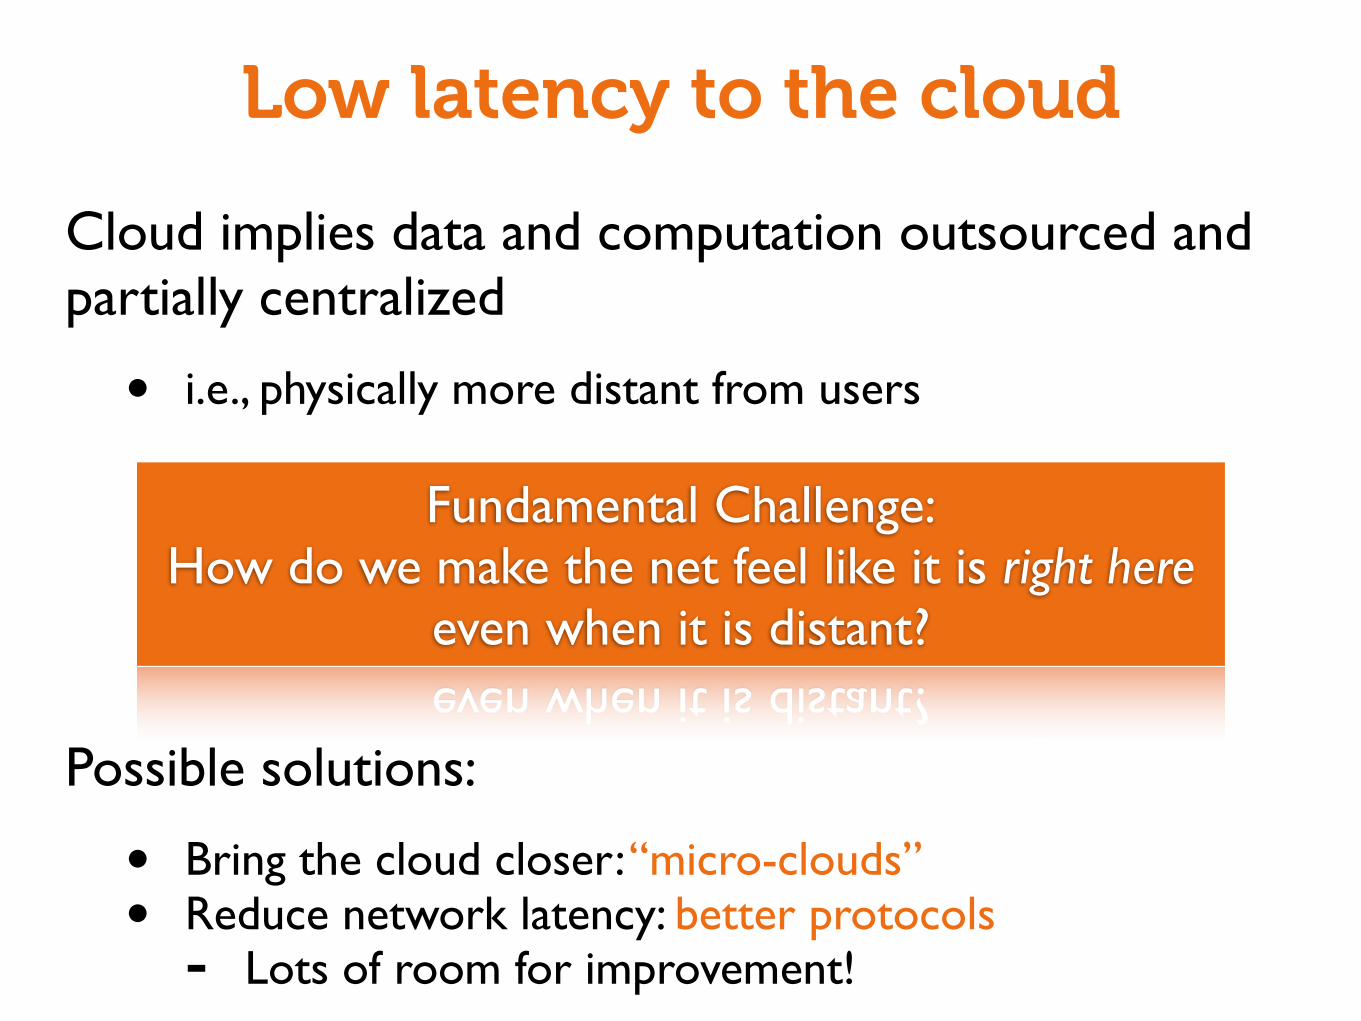
Cloud implies data and computation outsourced and partially centralized
• i.e., physically more distant from users
Possible solutions:
• Bring the cloud closer: “micro-clouds”• Reduce network latency: better protocols- Lots of room for improvement!
Low latency to the cloud
Fundamental Challenge:How do we make the net feel like it is right here
even when it is distant?
High BandwidthWithin the Cloud
Costs in a data center
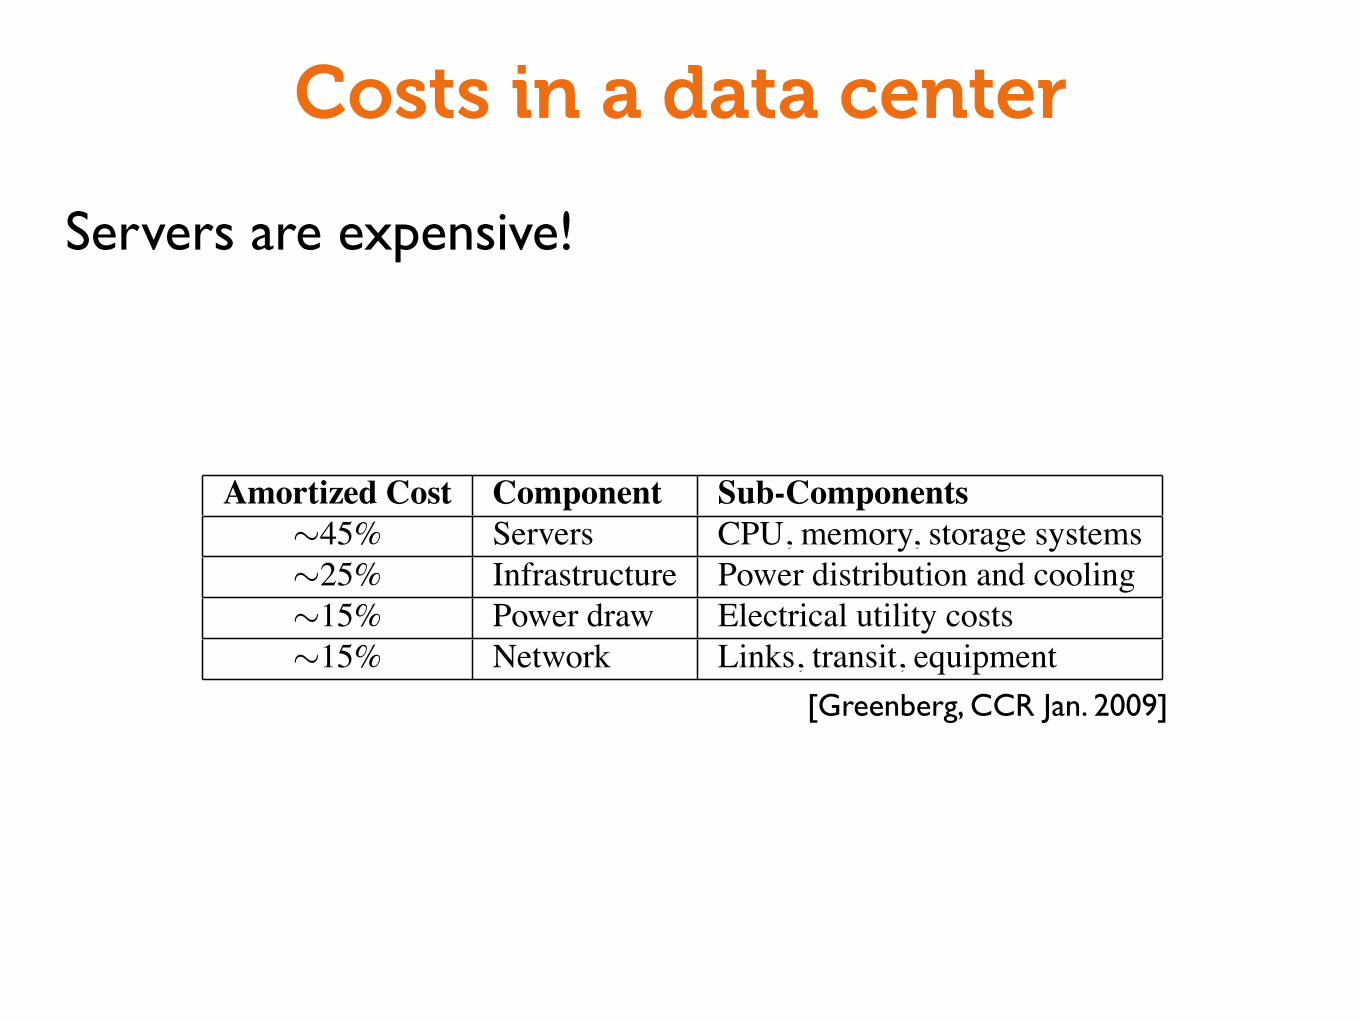
Servers are expensive!
The Cost of a Cloud:Research Problems in Data Center Networks
Albert Greenberg, James Hamilton, David A. Maltz, Parveen PatelMicrosoft Research, Redmond, WA, USA
This article is an editorial note submitted to CCR. It has NOT been peer reviewed.The author takes full responsibility for this article’s technical content. Comments can be posted through CCR Online.
AbstractThe data centers used to create cloud services represent a signifi-cant investment in capital outlay and ongoing costs. Accordingly,we first examine the costs of cloud service data centers today. Thecost breakdown reveals the importance of optimizing work com-pleted per dollar invested. Unfortunately, the resources inside thedata centers often operate at low utilization due to resource strand-ing and fragmentation. To attack this first problem, we propose (1)increasing network agility, and (2) providing appropriate incentivesto shape resource consumption. Second, we note that cloud serviceproviders are building out geo-distributed networks of data centers.Geo-diversity lowers latency to users and increases reliability in thepresence of an outage taking out an entire site. However, withoutappropriate design and management, these geo-diverse data centernetworks can raise the cost of providing service. Moreover, leverag-ing geo-diversity requires services be designed to benefit from it. Toattack this problem, we propose (1) joint optimization of networkand data center resources, and (2) new systems and mechanisms forgeo-distributing state.Categories and Subject Descriptors: C.2.1 Network ArchitectureGeneral Terms: Design, EconomicsKeywords: Cloud-service data centers, costs, network challenges
1. INTRODUCTIONIn recent years, large investments have been made in mas-
sive data centers supporting cloud services, by companies such aseBay, Facebook, Google, Microsoft, and Yahoo!. In this paper, weattempt to demystify the structure of these data centers, and to iden-tify areas of opportunity for R&D impact in data center networksand systems. We start our investigation with the question:
Where does the cost go in today’s cloud service data centers?
To quantify data center costs, we consider a data center hous-ing on the order of 50,000 servers that would be built based oncurrently well-understood techniques, using good quality, highlyavailable equipment. Table 1 provides a rough guide to associatedcosts. Costs are amortized, i.e., one time purchases are amortizedover reasonable lifetimes, assuming a 5% cost of money. By amor-tizing, we obtain a common cost run rate metric that we can applyto both one time purchases (e.g., for servers) and ongoing expenses(e.g., for power). We discuss each row in detail in Section 2.
Details may vary somewhat by site or by moment in time,but these are the major costs. While networking is not the largestcost category, this paper will argue that networking and systemsinnovation is the key to reducing costs and getting the most out ofeach dollar invested.
Amortized Cost Component Sub-Components⇠45% Servers CPU, memory, storage systems⇠25% Infrastructure Power distribution and cooling⇠15% Power draw Electrical utility costs⇠15% Network Links, transit, equipment
Table 1: Guide to where costs go in the data center.
1.1 Cloud Service Data Centers are DifferentIt is natural to ask why existing solutions for the enterprise
data center do not work for cloud service data centers.First and foremost, the leading cost in the enterprise is opera-
tional staff. In the data center, such costs are so small (under 5% dueto automation), that we safely omit them from Table 1. In a well-runenterprise, a typical ratio of IT staff members to servers is 1:100.Automation is partial [25], and human error is the cause of a largefraction of performance impacting problems [21]. In cloud servicedata centers, automation is a mandatory requirement of scale, andit is accordingly a foundational principle of design [20]. In a wellrun data center, a typical ratio of staff members to servers is 1:1000.Automated, recovery-oriented computing techniques cope success-fully with the vast majority of problems that arise [20, 12].
There are additional differences between the enterprise andthe cloud service data center environments including:
Large economies of scale. The size of cloud scale data cen-ters (some now approaching 100,000 severs) presents an opportu-nity to leverage economies of scale not present in the enterprisedata centers, though the up front costs are high.
Scale Out. Enterprises often optimize for physical space andnumber of devices, consolidating workload onto a small number ofhigh-price “scale-up” hardware devices and servers. Cloud servicedata centers “scale-out” — distributing workload over large num-bers of low cost servers and hardware.
That said, enterprises are also moving toward the cloud. Thus,we expect innovation in cloud service data centers to benefit theenterprise, through outsourcing of computing and storage to cloudservice providers [1, 8, 3], and/or adapting and scaling down tech-nologies and business models from cloud service providers.
1.2 Types of Cloud Service Data CentersMany cloud service data centers today may be termed mega
data centers, having on the order of tens of thousands or moreservers drawing tens of Mega-Watts of power at peak. Massivedata analysis applications (e.g., computing the web search index)are a natural fit for a mega data center, where some problems re-quire huge amounts of fast RAM, others require massive num-bers of CPU cycles, and still others require massive disk I/O band-width. These problems typically call for extensive communication
[Greenberg, CCR Jan. 2009]
Goal: Agility
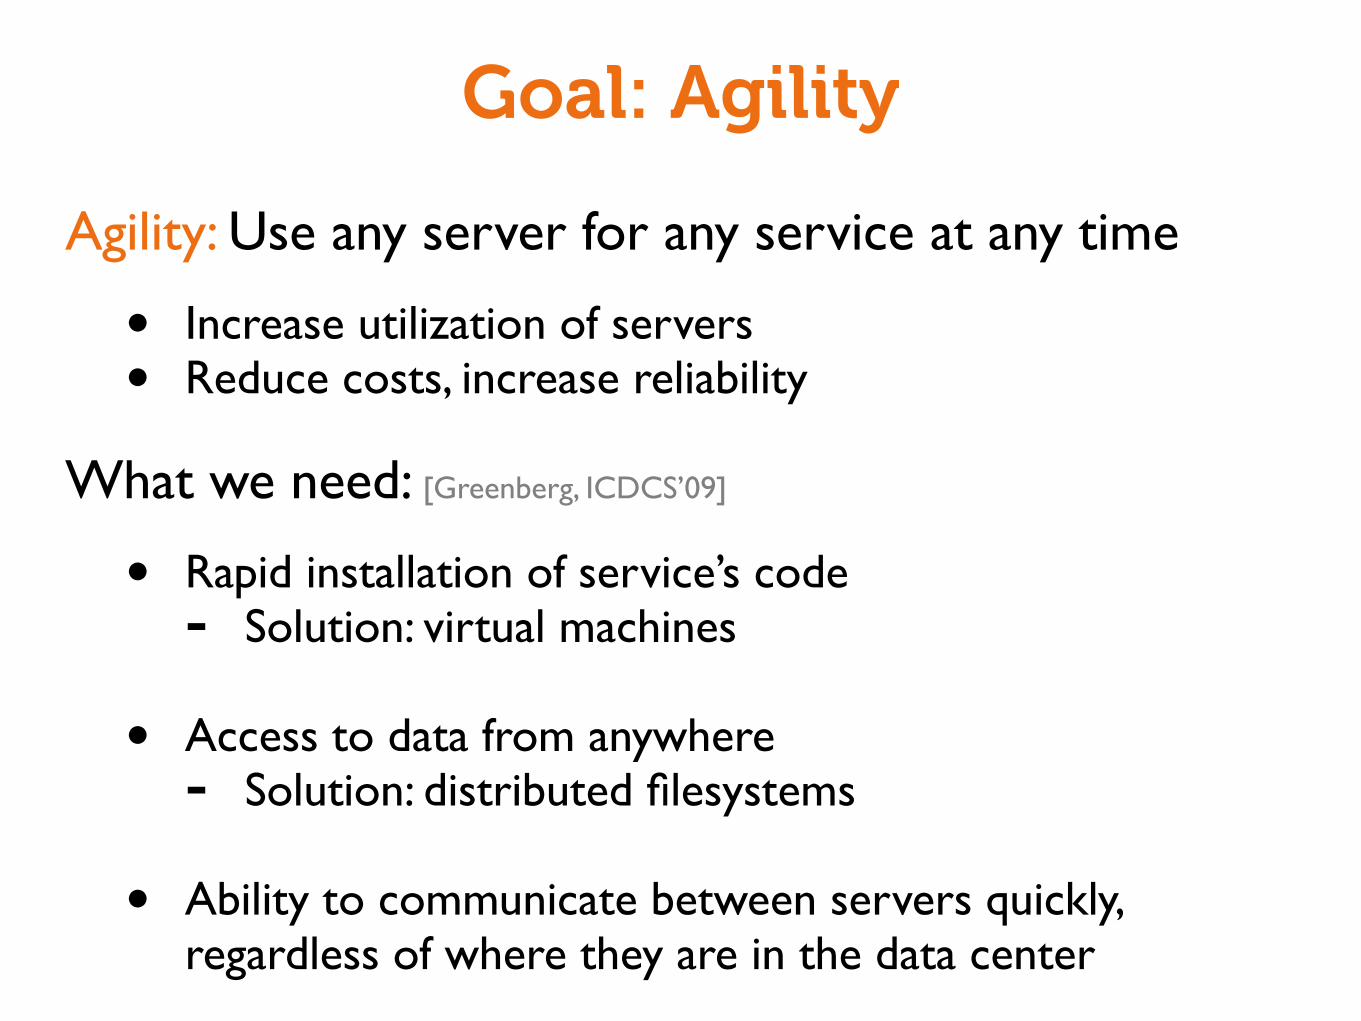
Agility: Use any server for any service at any time
• Increase utilization of servers• Reduce costs, increase reliability
What we need: [Greenberg, ICDCS’09]
• Rapid installation of service’s code- Solution: virtual machines
• Access to data from anywhere- Solution: distributed filesystems
• Ability to communicate between servers quickly, regardless of where they are in the data center
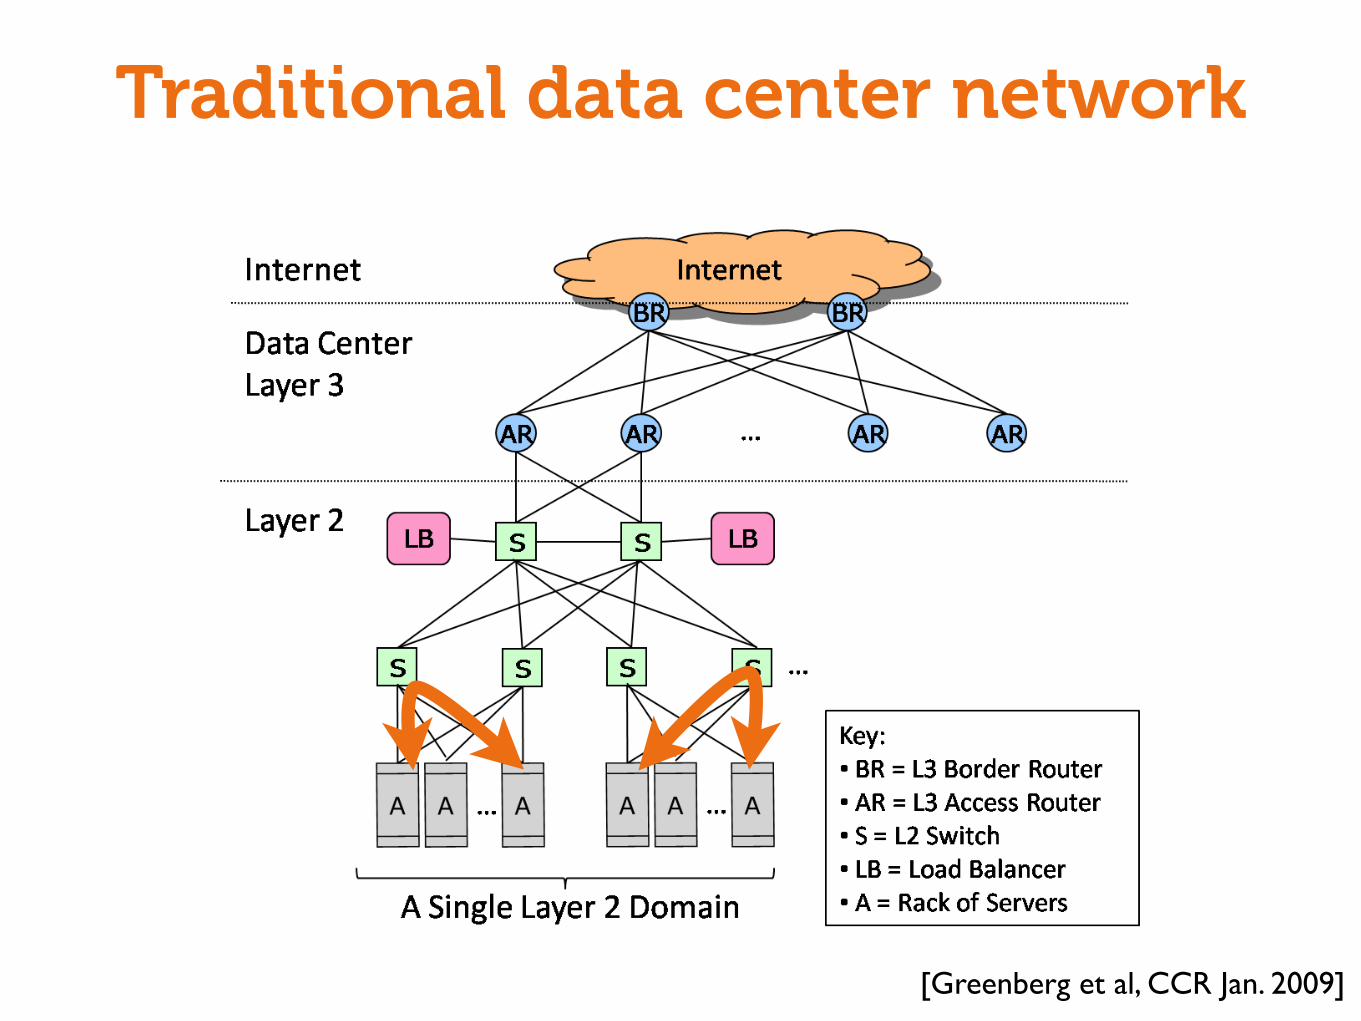
Traditional data center network
3. AGILITYWe define agility inside a single data center to mean that any
server can be dynamically assigned to any service anywhere inthe data center, while maintaining proper security and performanceisolation between services. Unfortunately, conventional data centernetwork designs work against agility - by their nature fragmentingboth network and server capacity, and limiting the dynamic grow-ing and shrinking of server pools. In this section, we first look atthe network within the data center as it exists today and then dis-cuss some desirable properties for a better solution.
3.1 Networking in Current Data CentersMultiple applications run inside a single data center, typically
with each application hosted on its own set of (potentially virtual)server machines. A single data center network supports two typesof traffic: (a) traffic flowing between external end systems and inter-nal servers, and (b) traffic flowing between internal servers. A givenapplication typically involves both of these traffic types. In Searchapplications, for example, internal traffic dominates – building andsynchronizing instances of the index. In Video download applica-tions, external traffic dominates.
To support external requests from the Internet, an applicationis associated with one or more publicly visible and routable IPaddresses to which clients in the Internet send their requests andfrom which they receive replies. Inside the data center, requests arespread among a pool of front-end servers that process the requests.This spreading is typically performed by a specialized hardwareload balancer [23]. Using conventional load-balancer terminology,the IP address to which requests are sent is called a virtual IP ad-dress (VIP) and the IP addresses of the servers over which the re-quests are spread are known as direct IP addresses (DIPs).
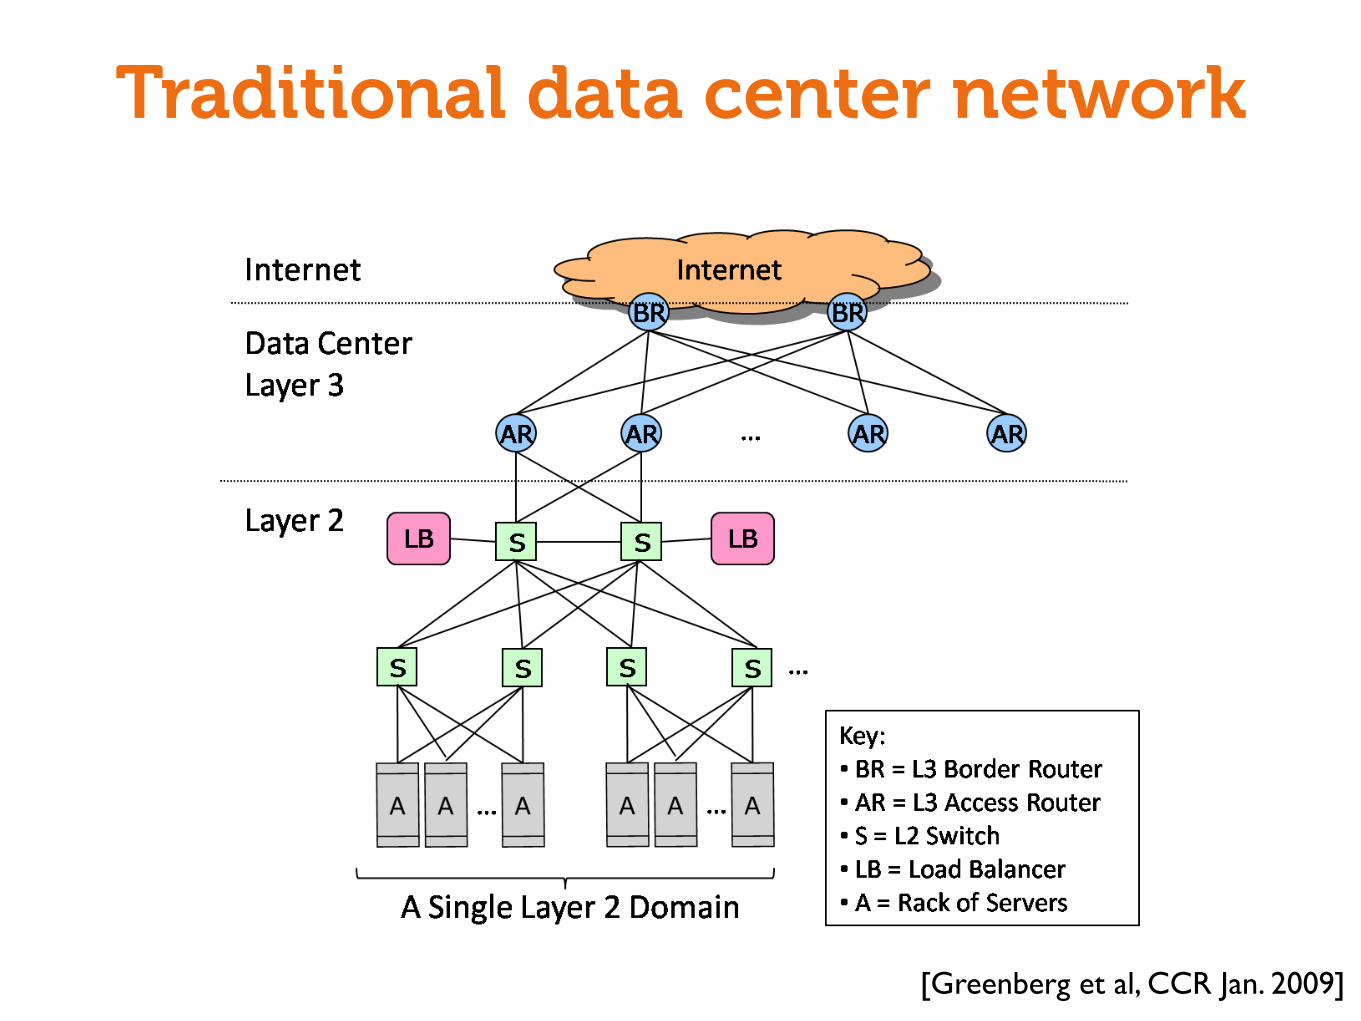
and DesignFigure 2: The conventional network architecture for data cen-ters (adapted from figure by Cisco [15]).
Figure 2 shows the conventional architecture for a data center,taken from a recommended source [15]. Requests arriving from theInternet are IP (layer 3) routed through border and access routersto a layer 2 domain based on the destination VIP address. TheVIP is configured onto the two load balancers connected to the topswitches, and complex mechanisms are used to ensure that if oneload balancer fails, the other picks up the traffic [24]. For each VIP,the load balancers are configured with a list of DIPs, internal IPaddresses over which they spread incoming requests.
As shown in the figure, all the servers that connect into a pairof access routers comprise a single layer 2 domain. With conven-tional network architectures and protocols, a single layer-2 domainis limited in size to about 4,000 servers in practice, driven by theneed for rapid reconvergence upon failure. Since the overhead ofbroadcast traffic (e.g., ARP) limits the size of an IP subnet to a few
hundred servers, the layer 2 domain is divided up into subnets usingVLANs configured on the Layer 2 switches, one subnet per VLAN.
The conventional approach has the following problems thatinhibit agility:
Static Network Assignment: To support internal traffic withinthe data center, individual applications are mapped to specific phys-ical switches and routers, relying heavily on VLANs and layer-3based VLAN spanning [19] to cover the servers dedicated to theapplication. While the extensive use of VLANs and direct phys-ical mapping of services to switches and routers provides a de-gree of performance and security isolation, these practices lead totwo problems that ossify the assignment and work against agility:(a) VLANs are often policy-overloaded, integrating traffic manage-ment, security, and performance isolation, and (b) VLAN spanning,and use of large server pools in general, concentrates traffic on linkshigh in the tree, where links and routers are highly overbooked.
Fragmentation of resources: Popular load balancing tech-niques, such as destination NAT (or half-NAT) and direct serverreturn, require that all DIPs in a VIP’s pool be in the same layer2 domain [23]. This constraint means that if an application growsand requires more front-end servers, it cannot use available serversin other layer 2 domains - ultimately resulting in fragmentation andunder-utilization of resources. Load balancing via Source NAT (orfull-NAT) does allow servers to be spread across layer 2 domains,but then the servers never see the client IP, which is often unac-ceptable because servers use the client IP for everything from datamining and response customization to regulatory compliance.
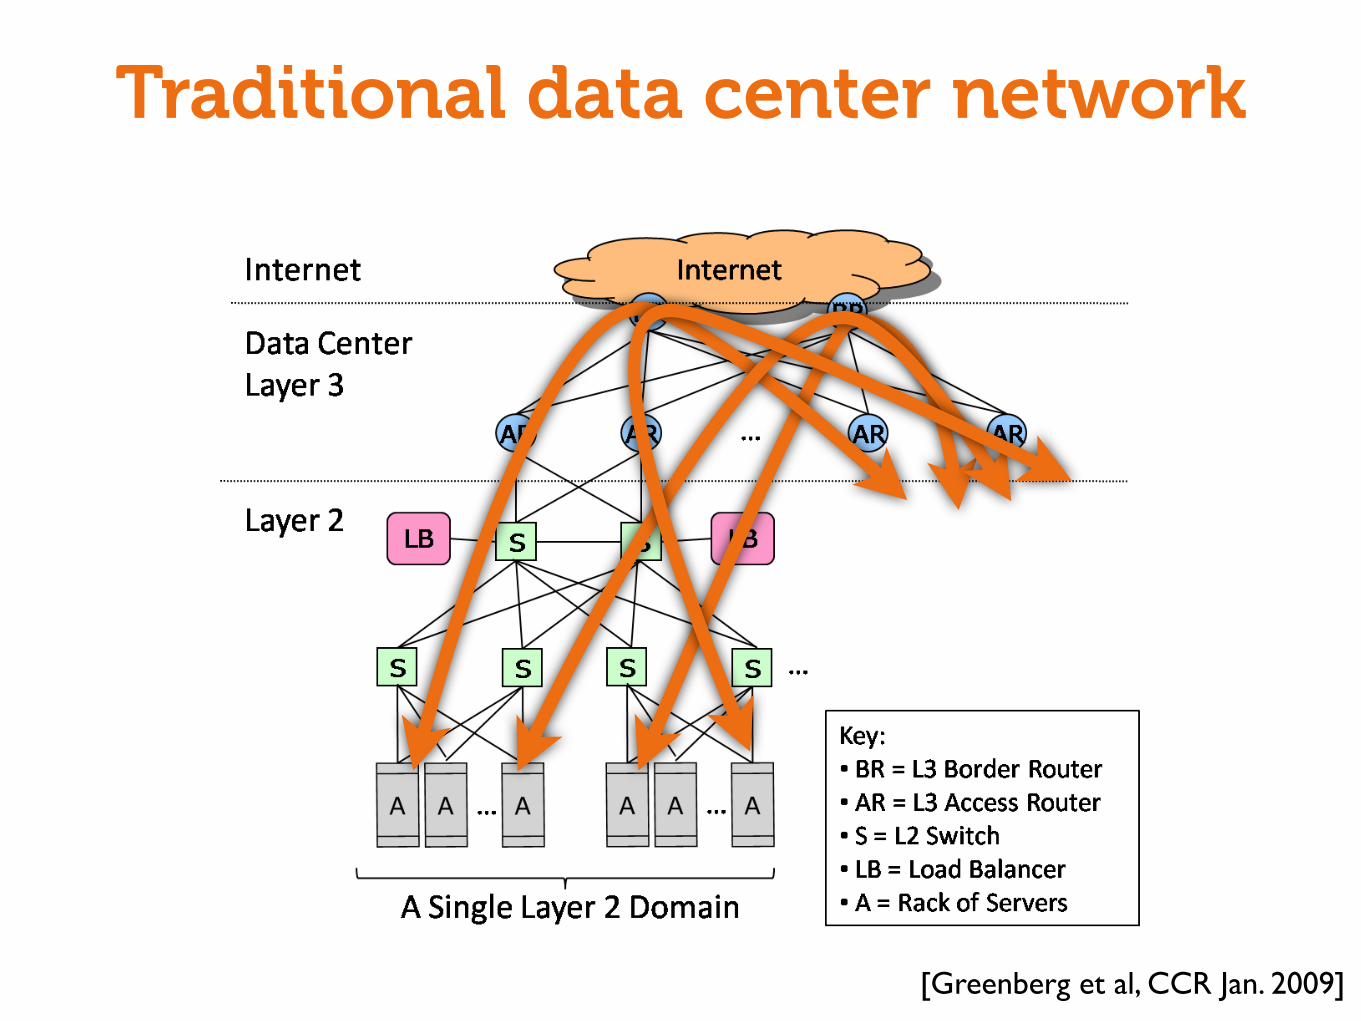
Poor server to server connectivity: The hierarchical natureof the network means that communication between servers in dif-ferent layer 2 domains must go through the layer 3 portion of thenetwork. Layer 3 ports are significantly more expensive than layer2 ports, owing in part to the cost of supporting large buffers, andin part to marketplace factors. As a result, these links are typicallyoversubscribed by factors of 10:1 to 80:1 (i.e., the capacity of thelinks between access routers and border routers is significantly lessthan the sum of the output capacity of the servers connected to theaccess routers). The result is that the bandwidth available betweenservers in different parts of the DC can be quite limited. Manag-ing the scarce bandwidth could be viewed as a global optimizationproblem – servers from all applications must be placed with greatcare to ensure the sum of their traffic does not saturate any of thenetwork links. Unfortunately, achieving this level of coordinationbetween (changing) applications is untenable in practice.
Proprietary hardware that scales up, not out: Conventionalload balancers are used in pairs in a 1+1 resiliency configuration.When the load becomes too great for the load balancers, operatorsreplace the existing load balancers with a new pair having morecapacity, which is an unscalable and expensive strategy.
3.2 Design ObjectivesIn order to achieve agility within a data center, we argue the
network should have the following properties:Location-independent Addressing: Services should use loca-
tion-independent addresses that decouple the server’s location inthe DC from its address. This enables any server to become part ofany server pool while simplifying configuration management.
UniformBandwidth and Latency: If the available bandwidthbetween two servers is not dependent on where they are located,then the servers for a given service can be distributed arbitrarily inthe data center without fear of running into bandwidth choke points.Uniform bandwidth, combined with uniform latency between anytwo servers would allow services to achieve same performance re-gardless of the location of their servers.
[Greenberg et al, CCR Jan. 2009]
Traditional data center network
3. AGILITYWe define agility inside a single data center to mean that any
server can be dynamically assigned to any service anywhere inthe data center, while maintaining proper security and performanceisolation between services. Unfortunately, conventional data centernetwork designs work against agility - by their nature fragmentingboth network and server capacity, and limiting the dynamic grow-ing and shrinking of server pools. In this section, we first look atthe network within the data center as it exists today and then dis-cuss some desirable properties for a better solution.
3.1 Networking in Current Data CentersMultiple applications run inside a single data center, typically
with each application hosted on its own set of (potentially virtual)server machines. A single data center network supports two typesof traffic: (a) traffic flowing between external end systems and inter-nal servers, and (b) traffic flowing between internal servers. A givenapplication typically involves both of these traffic types. In Searchapplications, for example, internal traffic dominates – building andsynchronizing instances of the index. In Video download applica-tions, external traffic dominates.
To support external requests from the Internet, an applicationis associated with one or more publicly visible and routable IPaddresses to which clients in the Internet send their requests andfrom which they receive replies. Inside the data center, requests arespread among a pool of front-end servers that process the requests.This spreading is typically performed by a specialized hardwareload balancer [23]. Using conventional load-balancer terminology,the IP address to which requests are sent is called a virtual IP ad-dress (VIP) and the IP addresses of the servers over which the re-quests are spread are known as direct IP addresses (DIPs).
and DesignFigure 2: The conventional network architecture for data cen-ters (adapted from figure by Cisco [15]).
Figure 2 shows the conventional architecture for a data center,taken from a recommended source [15]. Requests arriving from theInternet are IP (layer 3) routed through border and access routersto a layer 2 domain based on the destination VIP address. TheVIP is configured onto the two load balancers connected to the topswitches, and complex mechanisms are used to ensure that if oneload balancer fails, the other picks up the traffic [24]. For each VIP,the load balancers are configured with a list of DIPs, internal IPaddresses over which they spread incoming requests.
As shown in the figure, all the servers that connect into a pairof access routers comprise a single layer 2 domain. With conven-tional network architectures and protocols, a single layer-2 domainis limited in size to about 4,000 servers in practice, driven by theneed for rapid reconvergence upon failure. Since the overhead ofbroadcast traffic (e.g., ARP) limits the size of an IP subnet to a few
hundred servers, the layer 2 domain is divided up into subnets usingVLANs configured on the Layer 2 switches, one subnet per VLAN.
The conventional approach has the following problems thatinhibit agility:
Static Network Assignment: To support internal traffic withinthe data center, individual applications are mapped to specific phys-ical switches and routers, relying heavily on VLANs and layer-3based VLAN spanning [19] to cover the servers dedicated to theapplication. While the extensive use of VLANs and direct phys-ical mapping of services to switches and routers provides a de-gree of performance and security isolation, these practices lead totwo problems that ossify the assignment and work against agility:(a) VLANs are often policy-overloaded, integrating traffic manage-ment, security, and performance isolation, and (b) VLAN spanning,and use of large server pools in general, concentrates traffic on linkshigh in the tree, where links and routers are highly overbooked.
Fragmentation of resources: Popular load balancing tech-niques, such as destination NAT (or half-NAT) and direct serverreturn, require that all DIPs in a VIP’s pool be in the same layer2 domain [23]. This constraint means that if an application growsand requires more front-end servers, it cannot use available serversin other layer 2 domains - ultimately resulting in fragmentation andunder-utilization of resources. Load balancing via Source NAT (orfull-NAT) does allow servers to be spread across layer 2 domains,but then the servers never see the client IP, which is often unac-ceptable because servers use the client IP for everything from datamining and response customization to regulatory compliance.
Poor server to server connectivity: The hierarchical natureof the network means that communication between servers in dif-ferent layer 2 domains must go through the layer 3 portion of thenetwork. Layer 3 ports are significantly more expensive than layer2 ports, owing in part to the cost of supporting large buffers, andin part to marketplace factors. As a result, these links are typicallyoversubscribed by factors of 10:1 to 80:1 (i.e., the capacity of thelinks between access routers and border routers is significantly lessthan the sum of the output capacity of the servers connected to theaccess routers). The result is that the bandwidth available betweenservers in different parts of the DC can be quite limited. Manag-ing the scarce bandwidth could be viewed as a global optimizationproblem – servers from all applications must be placed with greatcare to ensure the sum of their traffic does not saturate any of thenetwork links. Unfortunately, achieving this level of coordinationbetween (changing) applications is untenable in practice.
Proprietary hardware that scales up, not out: Conventionalload balancers are used in pairs in a 1+1 resiliency configuration.When the load becomes too great for the load balancers, operatorsreplace the existing load balancers with a new pair having morecapacity, which is an unscalable and expensive strategy.
3.2 Design ObjectivesIn order to achieve agility within a data center, we argue the
network should have the following properties:Location-independent Addressing: Services should use loca-
tion-independent addresses that decouple the server’s location inthe DC from its address. This enables any server to become part ofany server pool while simplifying configuration management.
UniformBandwidth and Latency: If the available bandwidthbetween two servers is not dependent on where they are located,then the servers for a given service can be distributed arbitrarily inthe data center without fear of running into bandwidth choke points.Uniform bandwidth, combined with uniform latency between anytwo servers would allow services to achieve same performance re-gardless of the location of their servers.
[Greenberg et al, CCR Jan. 2009]
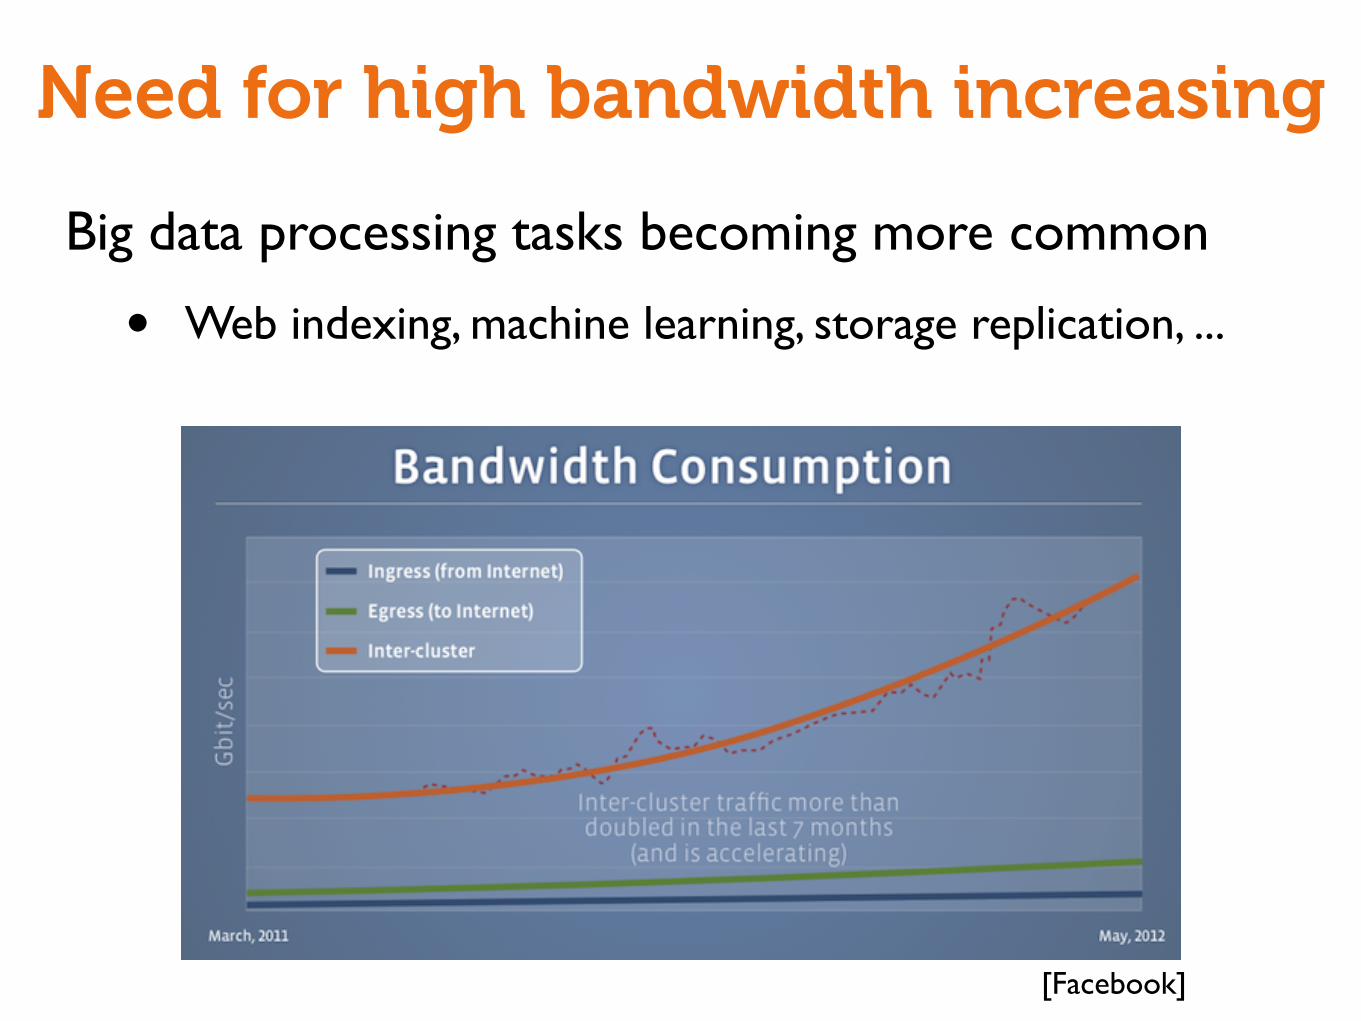
Need for high bandwidth increasing
Big data processing tasks becoming more common
• Web indexing, machine learning, storage replication, ...
[Facebook]
VL2: A Scalable and FlexibleData Center Network
[Greenberg, Hamilton, Jain, Kandula, Kim, Lahiri, Maltz, Patel, Sengupta, SIGCOMM 2009]
Key features:
• Flat addressing- Ethernet-style (layer 2) addresses to forward data,
rather than IP addresses- Separates names from locations• Randomized load balancing- Makes better use of network resources • High bandwidth network- Folded Clos network- Special case: fat tree
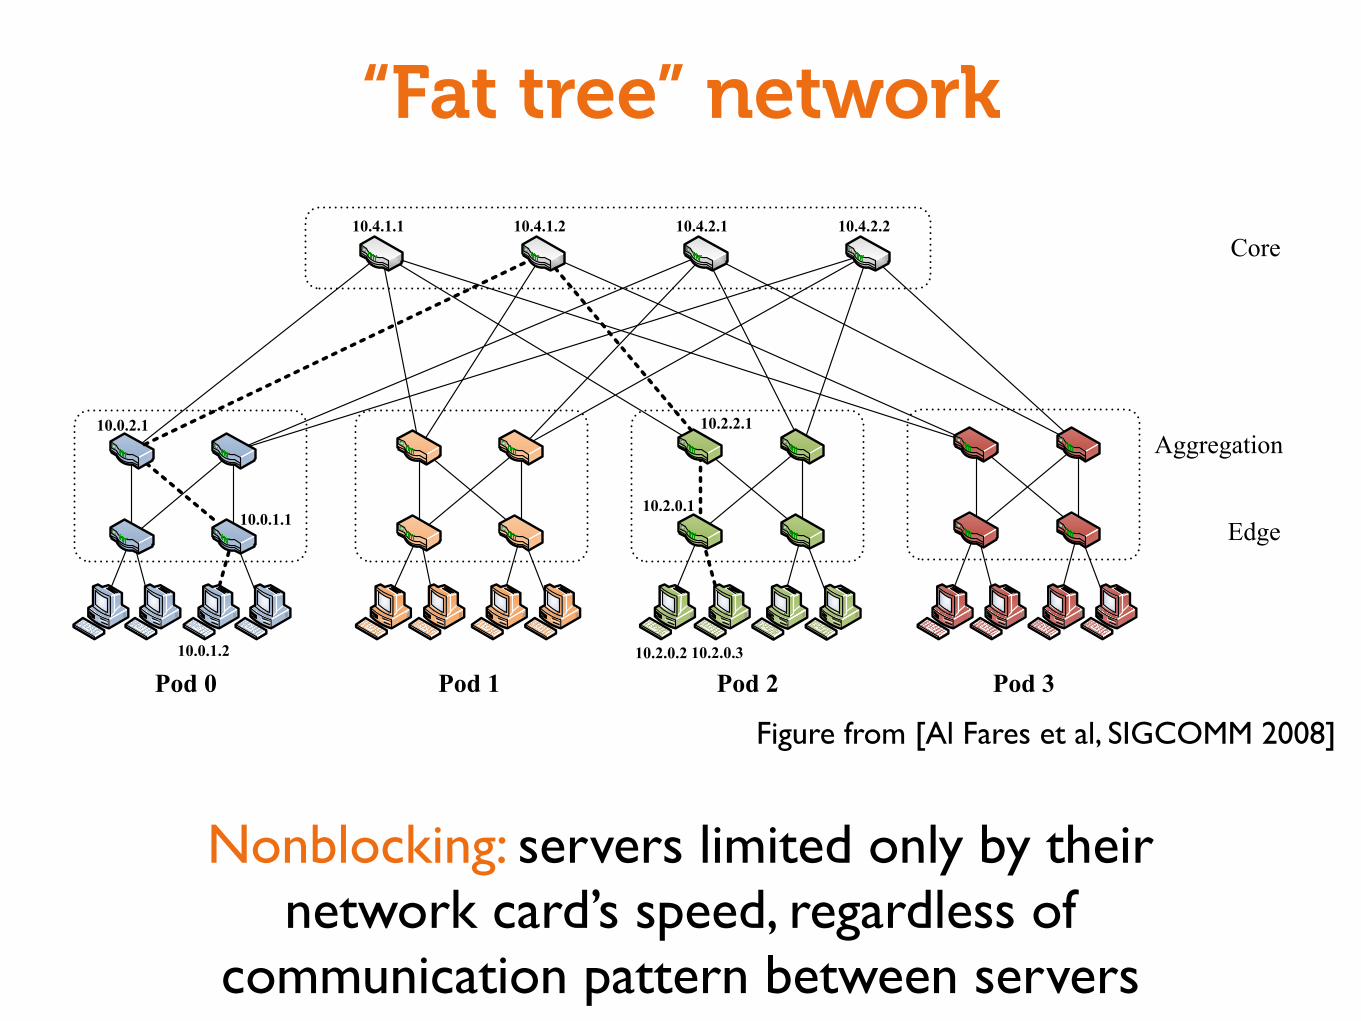
“Fat tree” network
Pod 0
10.0.2.1
10.0.1.1
Pod 1 Pod 3Pod 210.2.0.2 10.2.0.3
10.2.0.1
10.4.1.1 10.4.1.2 10.4.2.1 10.4.2.2Core
10.2.2.1
10.0.1.2
Edge
Aggregation
Figure 3: Simple fat-tree topology. Using the two-level routing tables described in Section 3.3, packets from source 10.0.1.2 todestination 10.2.0.3 would take the dashed path.
Prefix10.2.0.0/2410.2.1.0/240.0.0.0/0
Output port01
Suffix0.0.0.2/80.0.0.3/8
Output port23
Figure 4: Two-level table example. This is the table at switch10.2.2.1. An incoming packet with destination IP address10.2.1.2 is forwarded on port 1, whereas a packet with desti-nation IP address 10.3.0.3 is forwarded on port 3.
than one first-level prefix. Whereas entries in the primary table areleft-handed (i.e., /m prefix masks of the form 1m032!m), entriesin the secondary tables are right-handed (i.e. /m suffix masks ofthe form 032!m1m). If the longest-matching prefix search yieldsa non-terminating prefix, then the longest-matching suffix in thesecondary table is found and used.
This two-level structure will slightly increase the routing tablelookup latency, but the parallel nature of prefix search in hardwareshould ensure only a marginal penalty (see below). This is helpedby the fact that these tables are meant to be very small. As shownbelow, the routing table of any pod switch will contain no morethan k/2 prefixes and k/2 suffixes.
3.4 Two-Level Lookup ImplementationWe now describe how the two-level lookup can be implemented
in hardware using Content-Addressable Memory (CAM) [9].CAMs are used in search-intensive applications and are fasterthan algorithmic approaches [15, 29] for finding a match againsta bit pattern. A CAM can perform parallel searches among allits entries in a single clock cycle. Lookup engines use a specialkind of CAM, called Ternary CAM (TCAM). A TCAM can storedon’t care bits in addition to matching 0’s and 1’s in particularpositions, making it suitable for storing variable length prefixes,such as the ones found in routing tables. On the downside, CAMshave rather low storage density, they are very power hungry, and
Next hop10.2.0.110.2.1.110.4.1.110.4.1.2
Address00011011
Output port0123
RAM
Encoder
10.2.0.X10.2.1.XX.X.X.2X.X.X.3
TCAM
Figure 5: TCAM two-level routing table implementation.
expensive per bit. However, in our architecture, routing tables canbe implemented in a TCAM of a relatively modest size (k entrieseach 32 bits wide).
Figure 5 shows our proposed implementation of the two-levellookup engine. A TCAM stores address prefixes and suffixes,which in turn indexes a RAM that stores the IP address of the nexthop and the output port. We store left-handed (prefix) entries innumerically smaller addresses and right-handed (suffix) entries inlarger addresses. We encode the output of the CAM so that theentry with the numerically smallest matching address is output.This satisfies the semantics of our specific application of two-levellookup: when the destination IP address of a packet matches both aleft-handed and a right-handed entry, then the left-handed entry ischosen. For example, using the routing table in Figure 5, a packetwith destination IP address 10.2.0.3 matches the left-handed entry10.2.0.X and the right-handed entry X.X.X.3. The packet iscorrectly forwarded on port 0. However, a packet with destinationIP address 10.3.1.2 matches only the right-handed entry X.X.X.2and is forwarded on port 2.
3.5 Routing AlgorithmThe first two levels of switches in a fat-tree act as filtering traf-
fic diffusers; the lower- and upper-layer switches in any given podhave terminating prefixes to the subnets in that pod. Hence, if ahost sends a packet to another host in the same pod but on a dif-ferent subnet, then all upper-level switches in that pod will have aterminating prefix pointing to the destination subnet’s switch.
For all other outgoing inter-pod traffic, the pod switches havea default /0 prefix with a secondary table matching host IDs (the
67
Figure from [Al Fares et al, SIGCOMM 2008]
Nonblocking: servers limited only by their network card’s speed, regardless of
communication pattern between servers
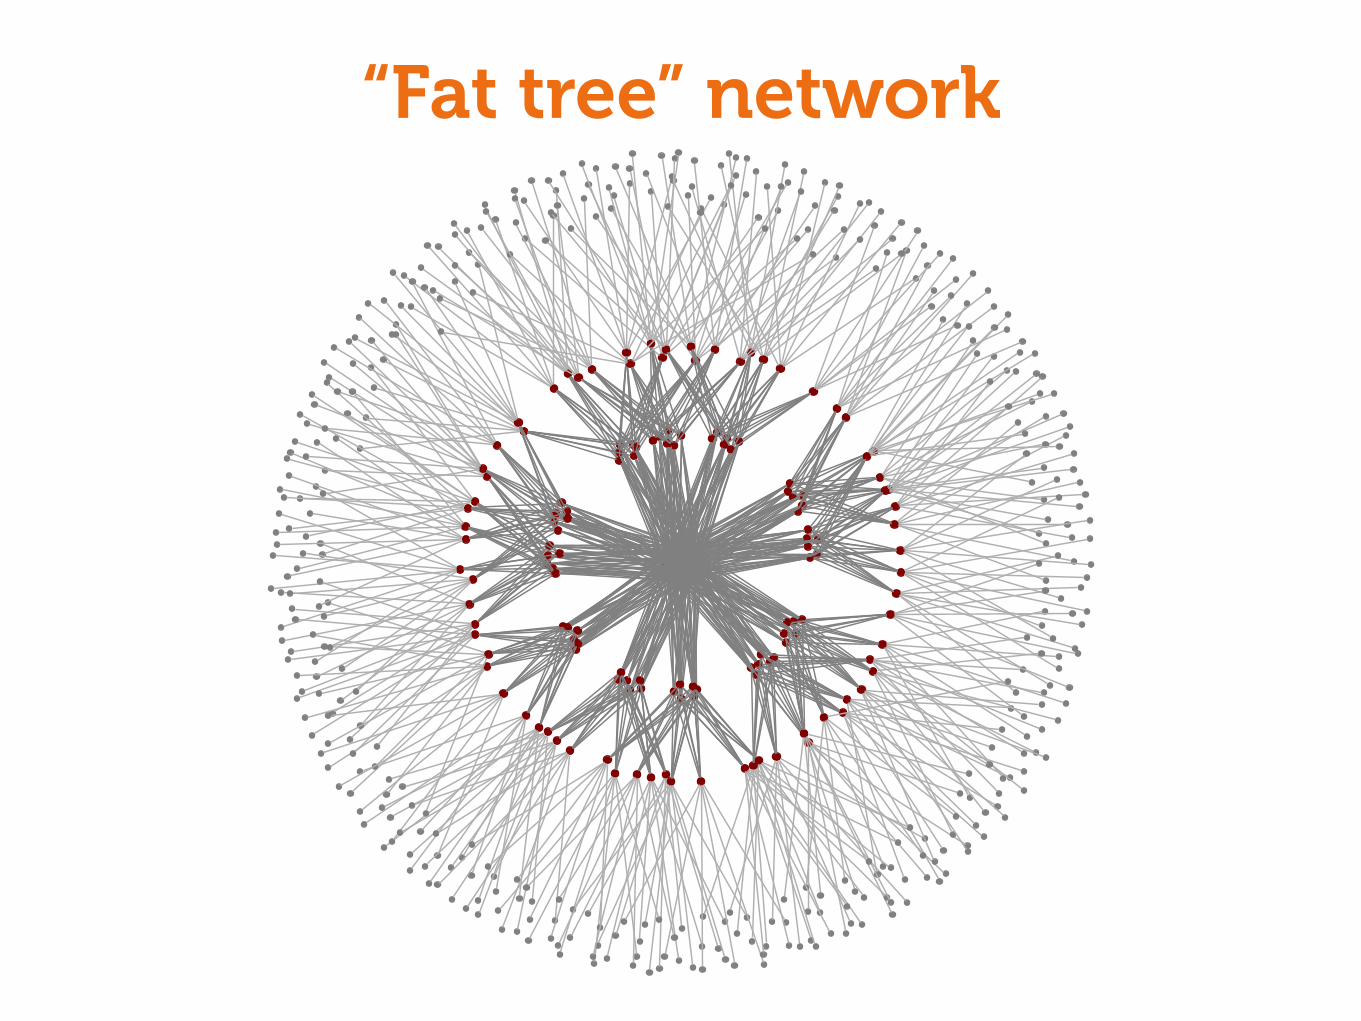
“Fat tree” network
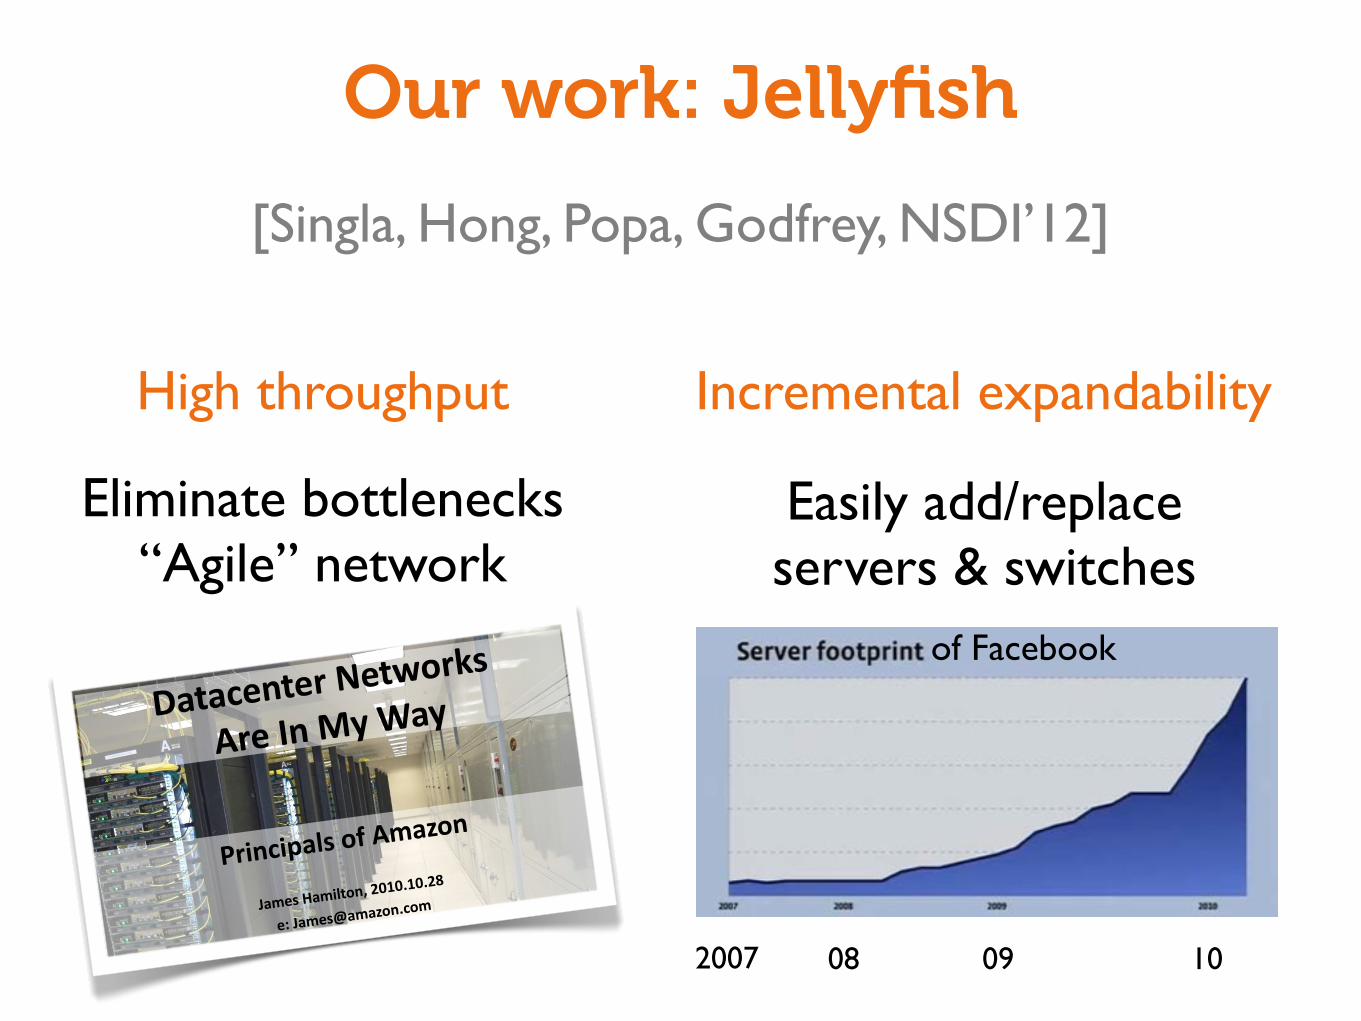
Our work: Jellyfish
High throughput
Eliminate bottlenecks“Agile” network
Incremental expandability
Easily add/replaceservers & switches
Datacenter Networks
Are In My Way
Principals of Amazon
James Hamilton, 2010.10.28
blog: perspectives.mvdirona.com
With Albert Greenberg, Srikanth Kandula, Dave Maltz, Parveen Patel, Sudipta
Sengupta, Changhoon Kim, Jagwinder Brar, Justin Pietsch, Tyson Lamoreaux,
Dhiren Dedhia, Alan Judge, Dave O'Meara, & Mike Marr
2007 1008 09
of Facebook
[Singla, Hong, Popa, Godfrey, NSDI’12]
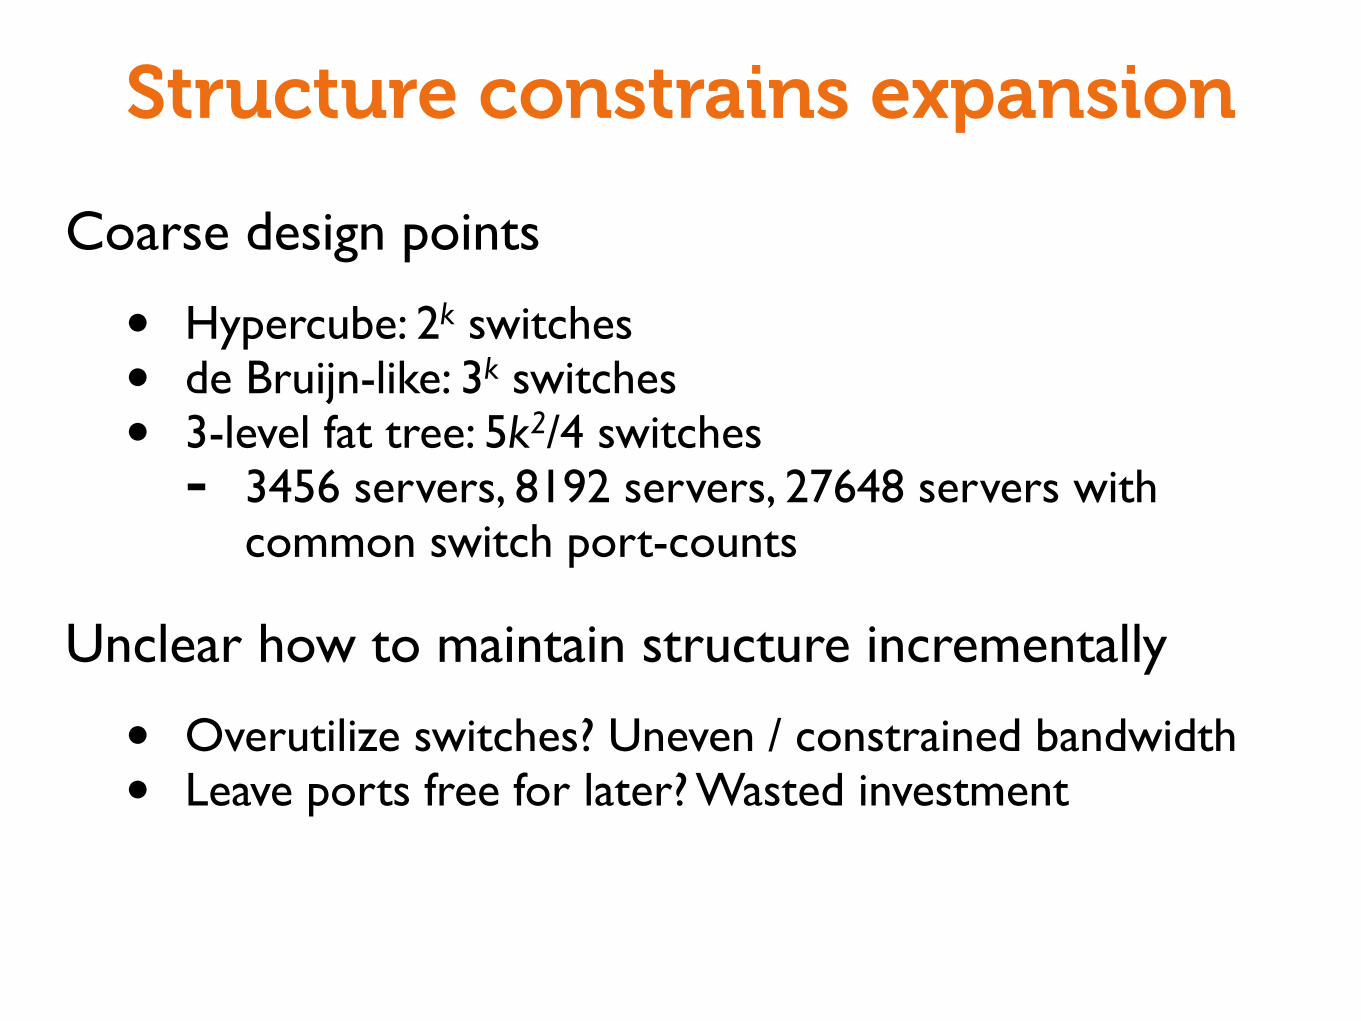
Structure constrains expansion
Coarse design points
• Hypercube: 2k switches• de Bruijn-like: 3k switches• 3-level fat tree: 5k2/4 switches- 3456 servers, 8192 servers, 27648 servers with
common switch port-counts
Unclear how to maintain structure incrementally
• Overutilize switches? Uneven / constrained bandwidth• Leave ports free for later? Wasted investment
Our Solution
Forget about structure –let’s have no structure at all!
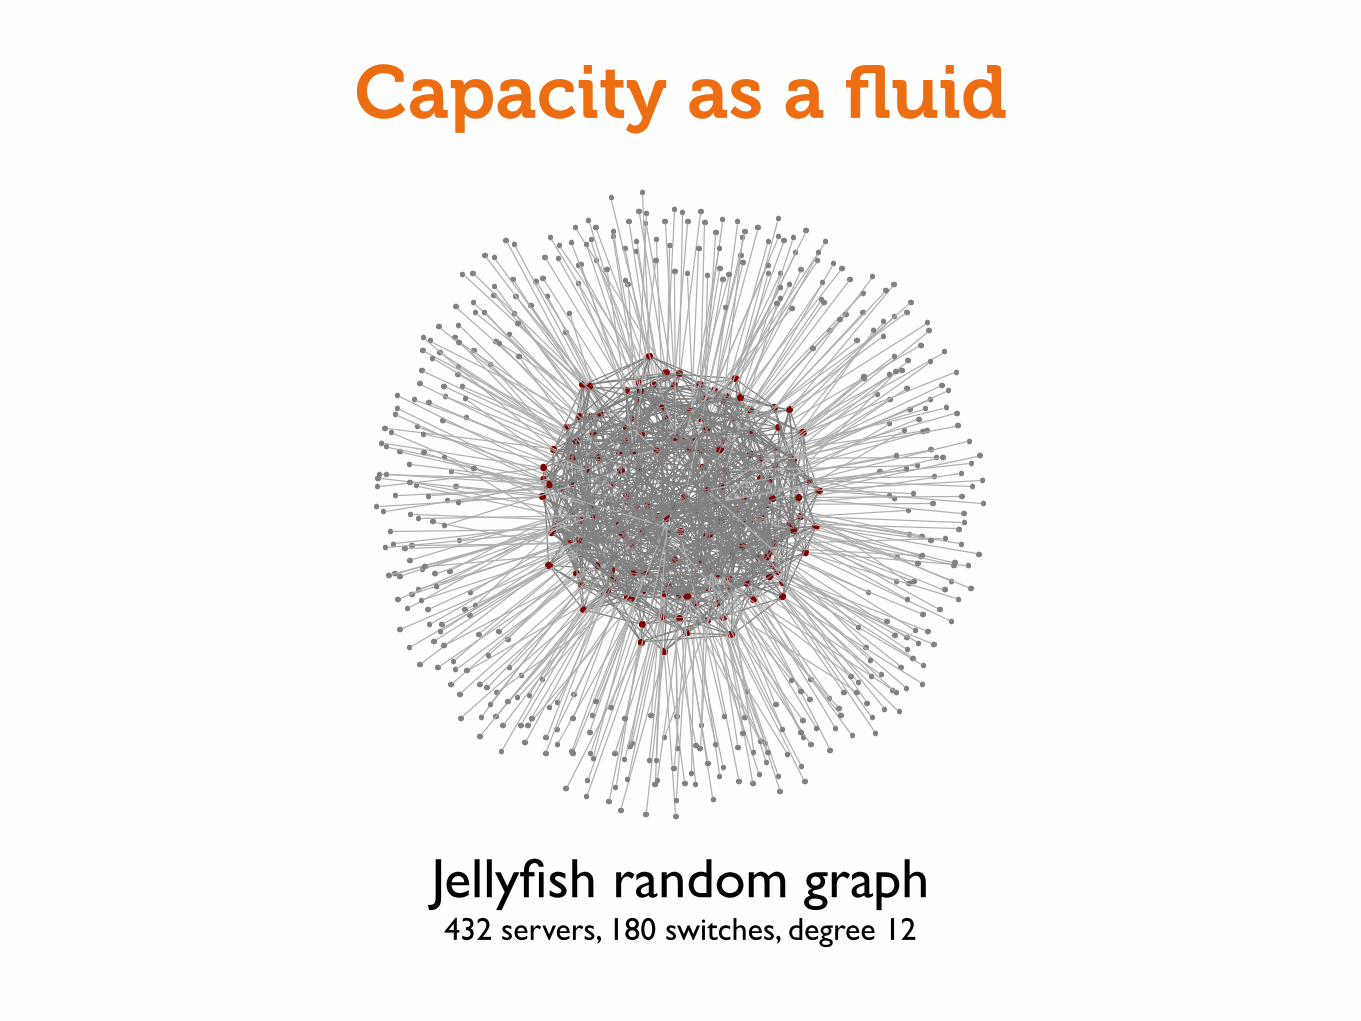
Capacity as a fluid
Jellyfish random graph432 servers, 180 switches, degree 12
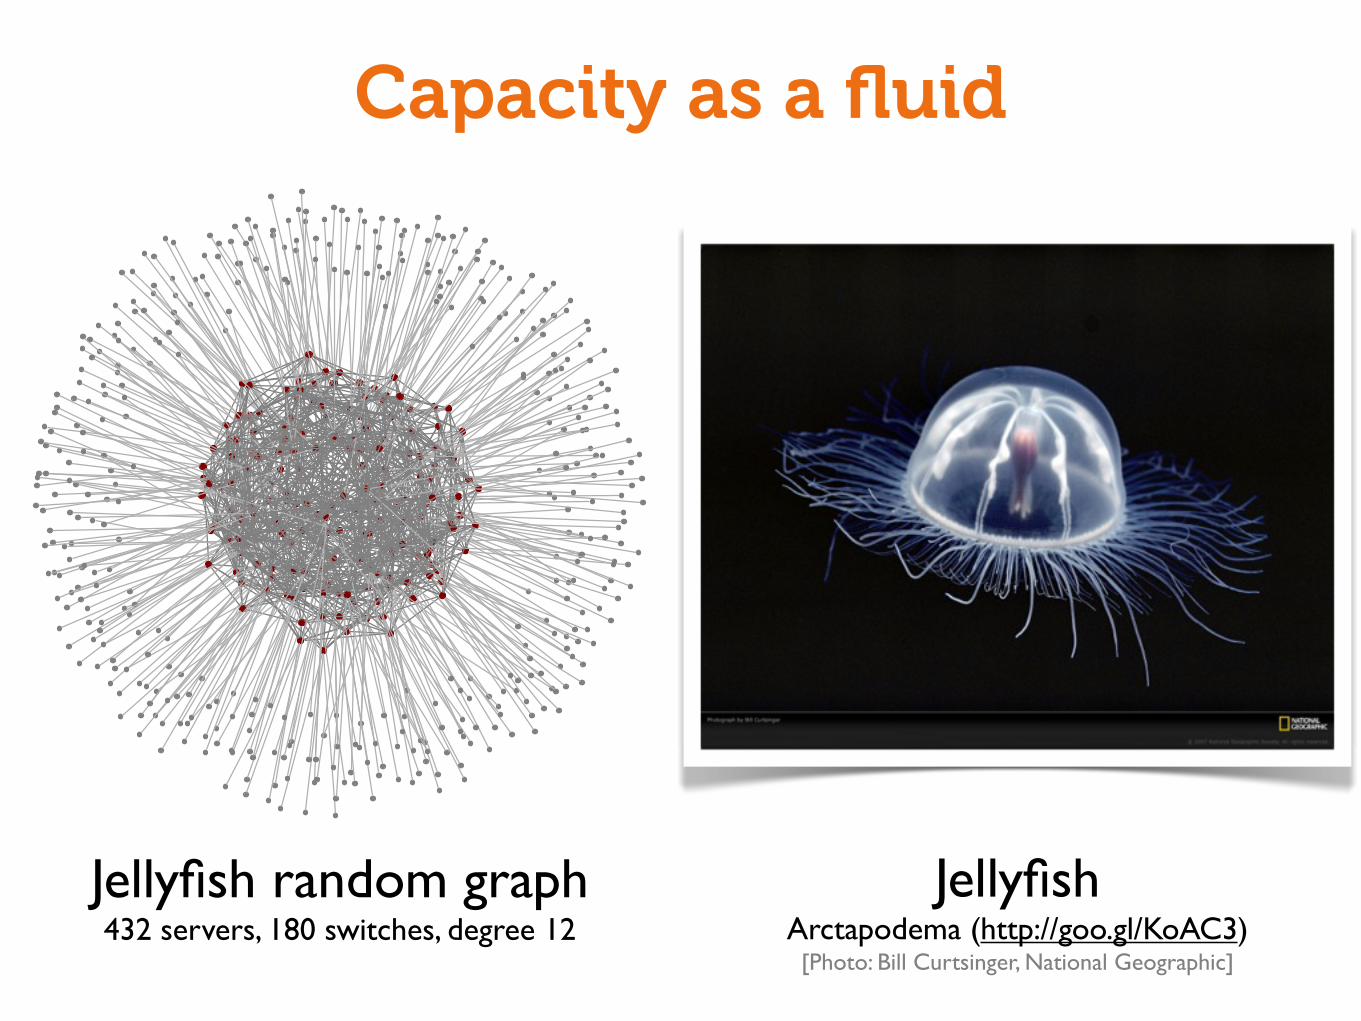
Capacity as a fluid
Jellyfish random graph432 servers, 180 switches, degree 12
JellyfishArctapodema (http://goo.gl/KoAC3)
[Photo: Bill Curtsinger, National Geographic]
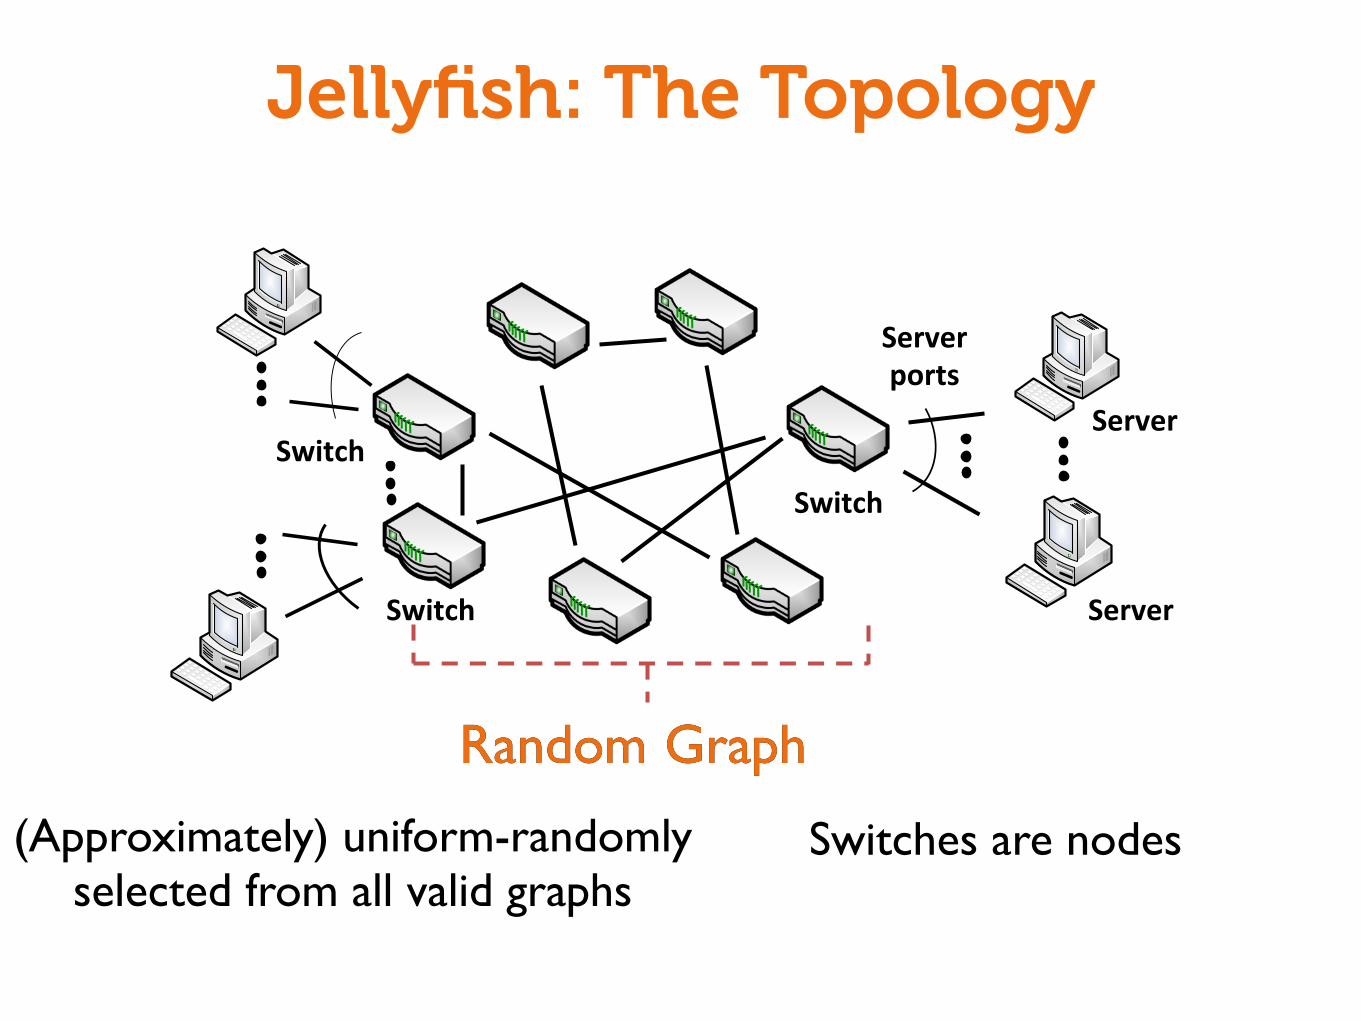
Jellyfish: The Topology
Switch'
Server'ports'
Server''
Server'
Random'''Regular'''Graph'
Switches'are'nodes'Each'node'has''the'same'degree'
Uniform'randomly'selected'from'all'regular'graphs'
Switch'
Switch'
Graph
Switches are nodes
GraphRandom
(Approximately) uniform-randomly selected from all valid graphs
Random
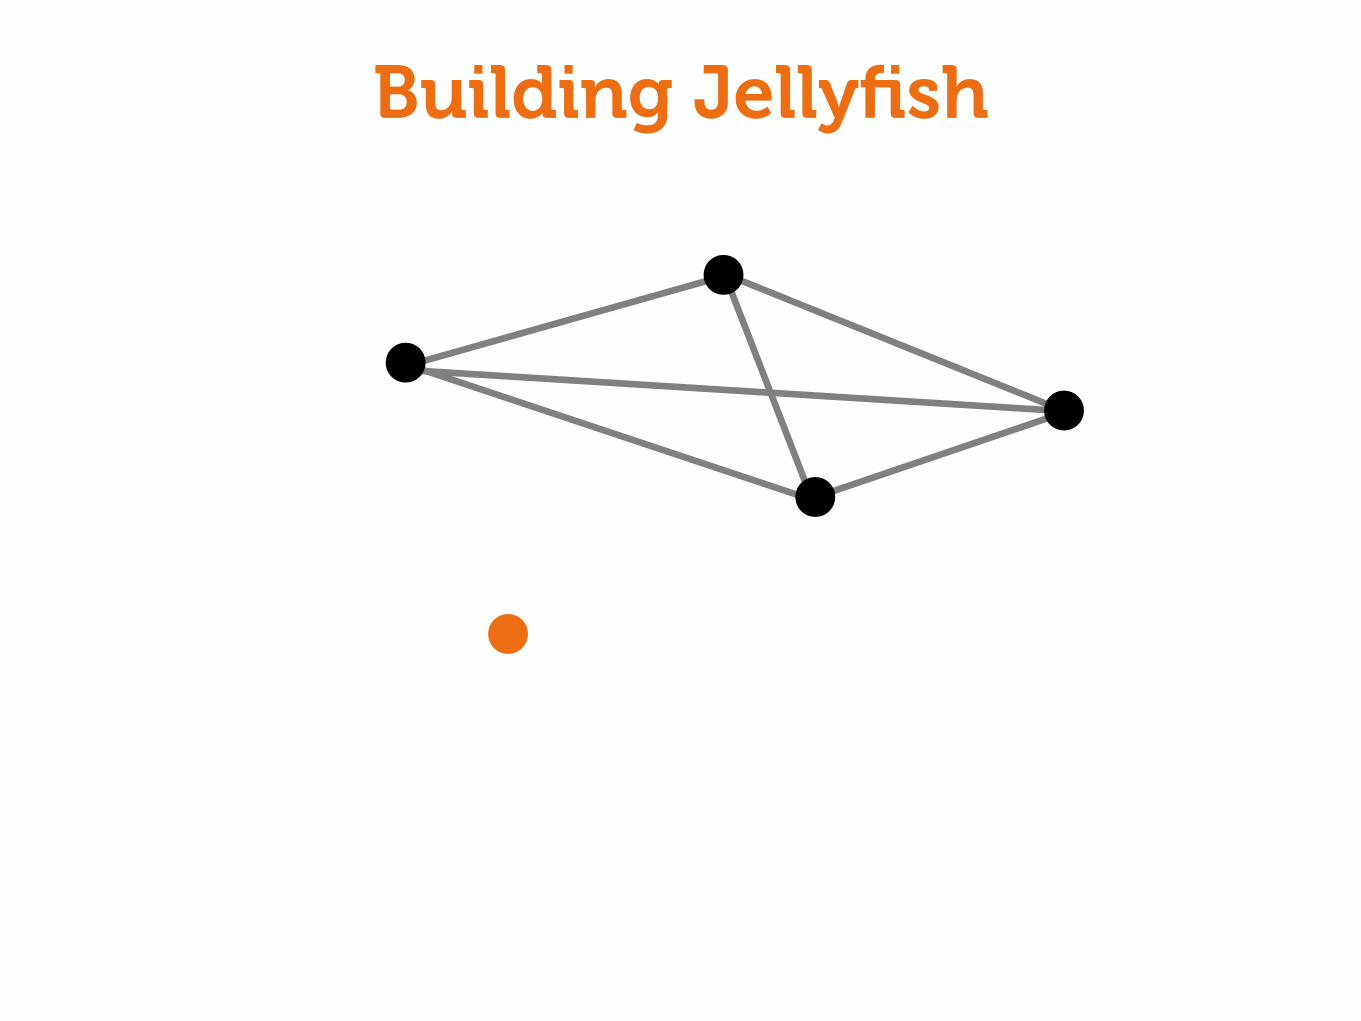
Building Jellyfish
Building Jellyfish
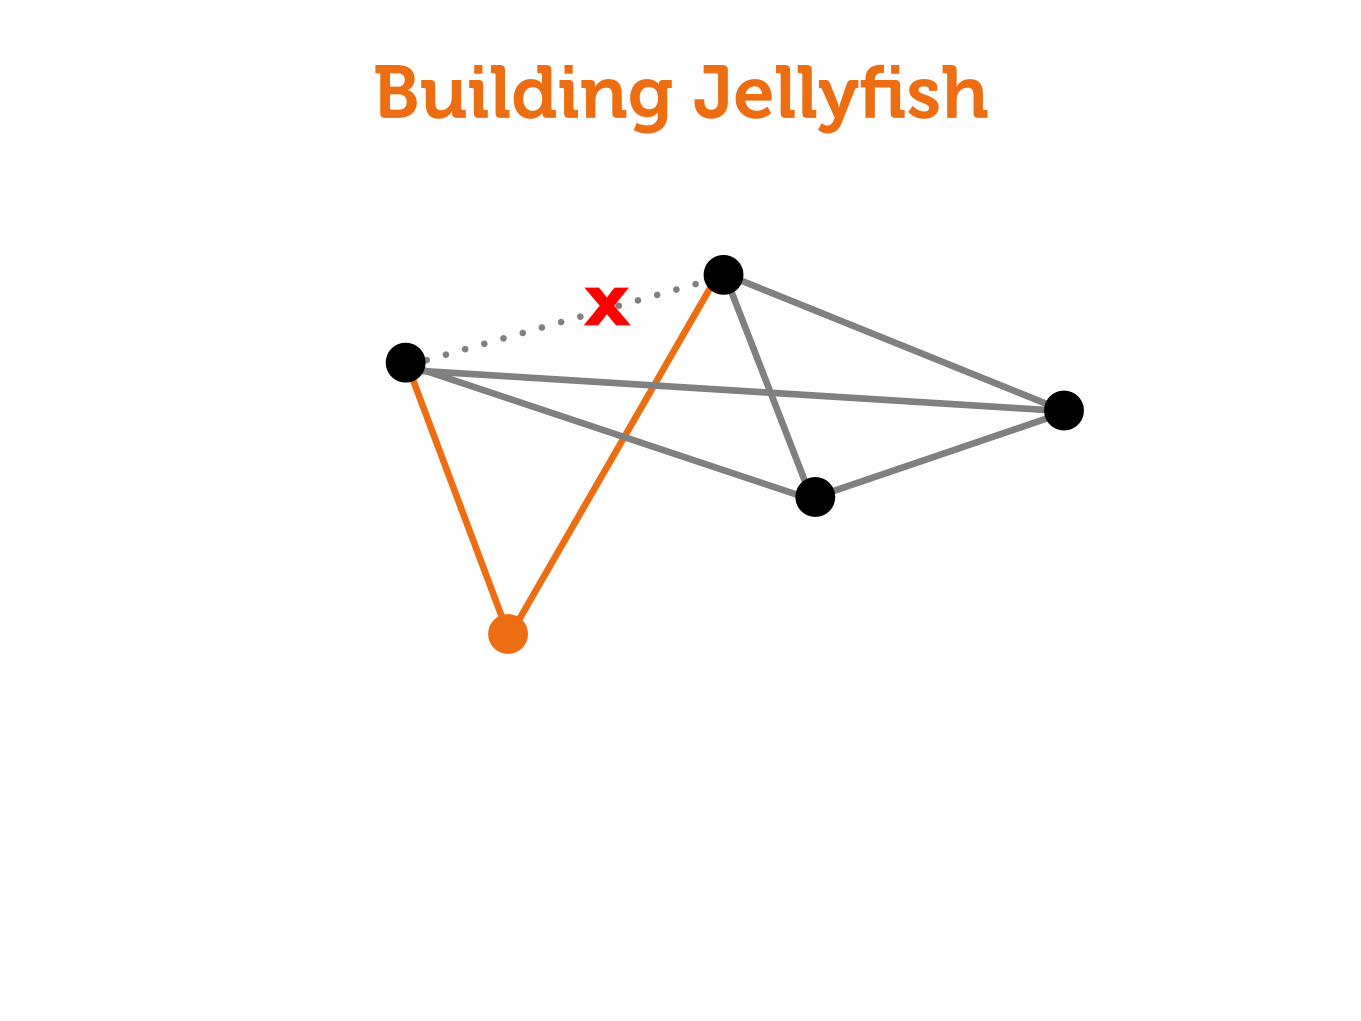
X
Building Jellyfish
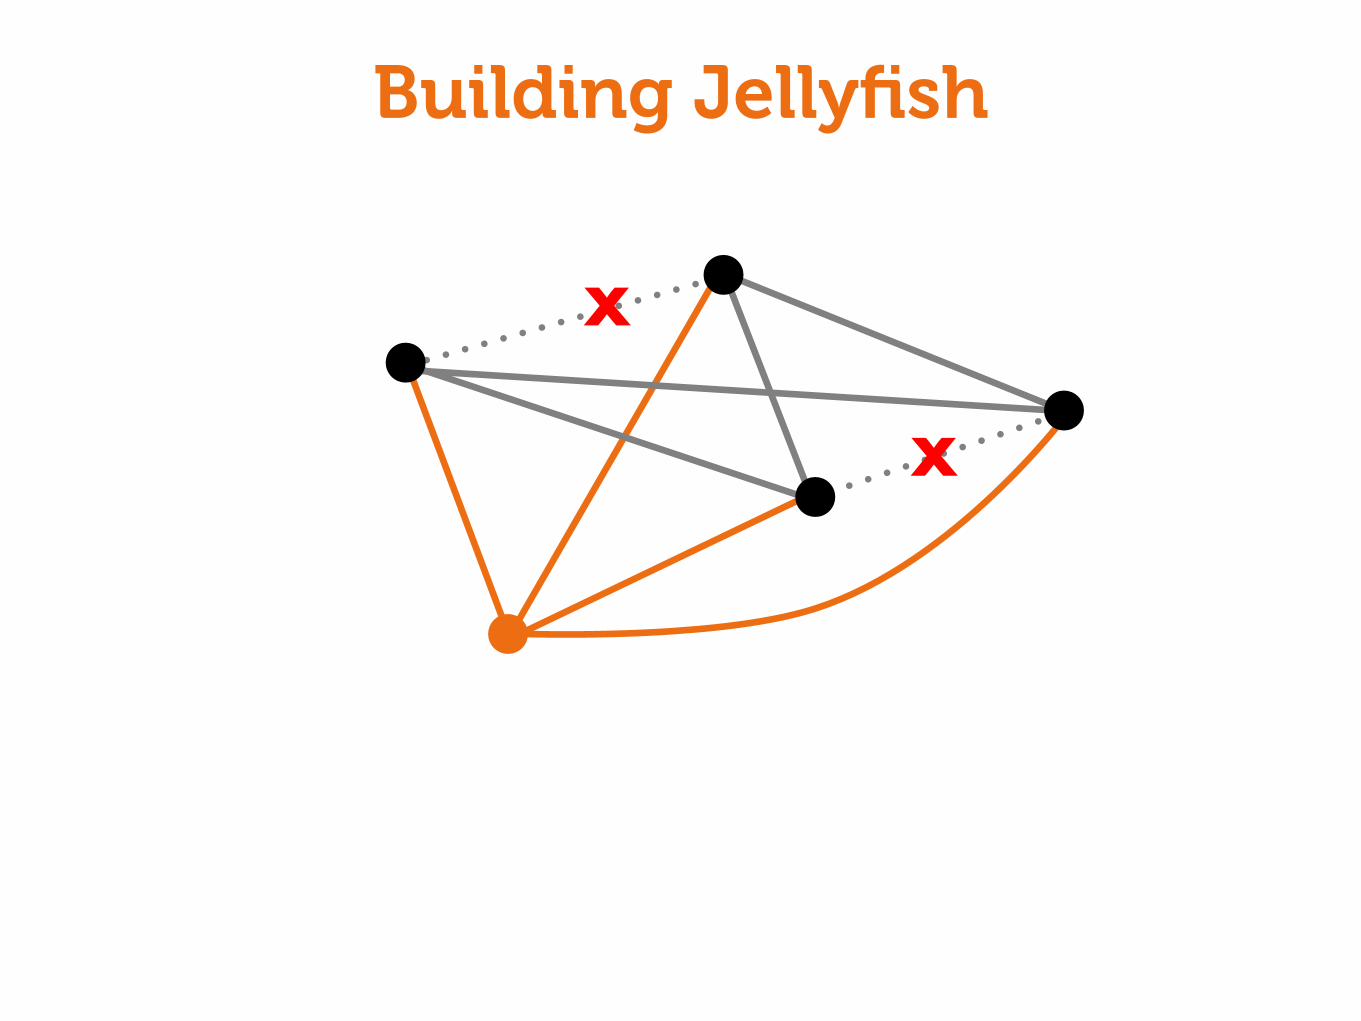
X
X
Building Jellyfish
60% cheaper incremental expansioncompared with past technique for
traditional networks
LEGUP: [Curtis, Keshav, Lopez-Ortiz, CoNEXT’10]

“OK, but... does it really work?”
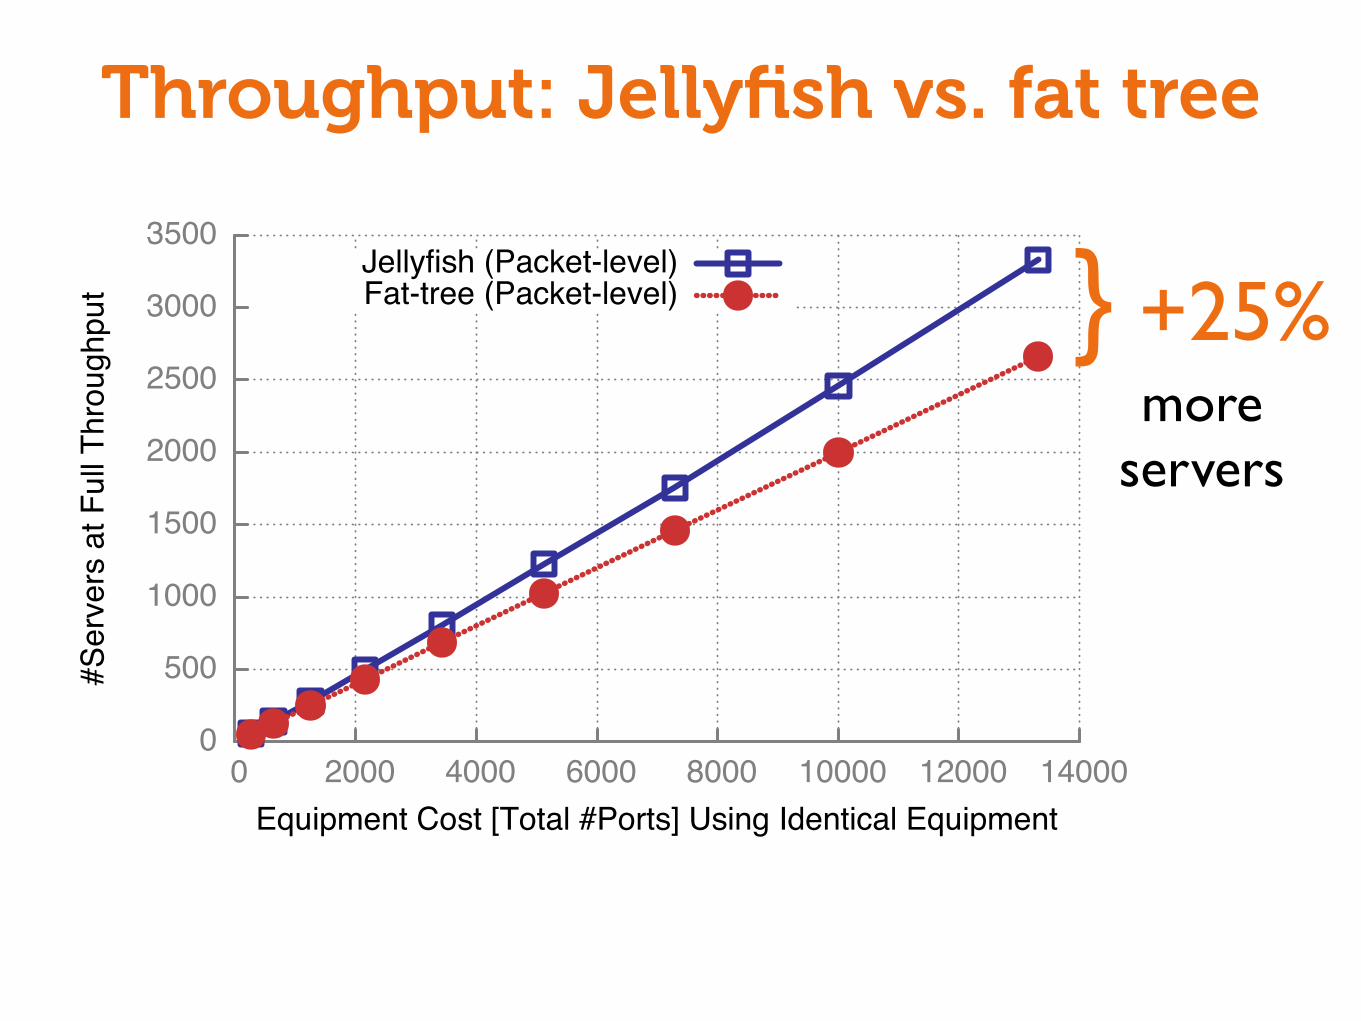
Throughput: Jellyfish vs. fat tree
} +25%
moreservers
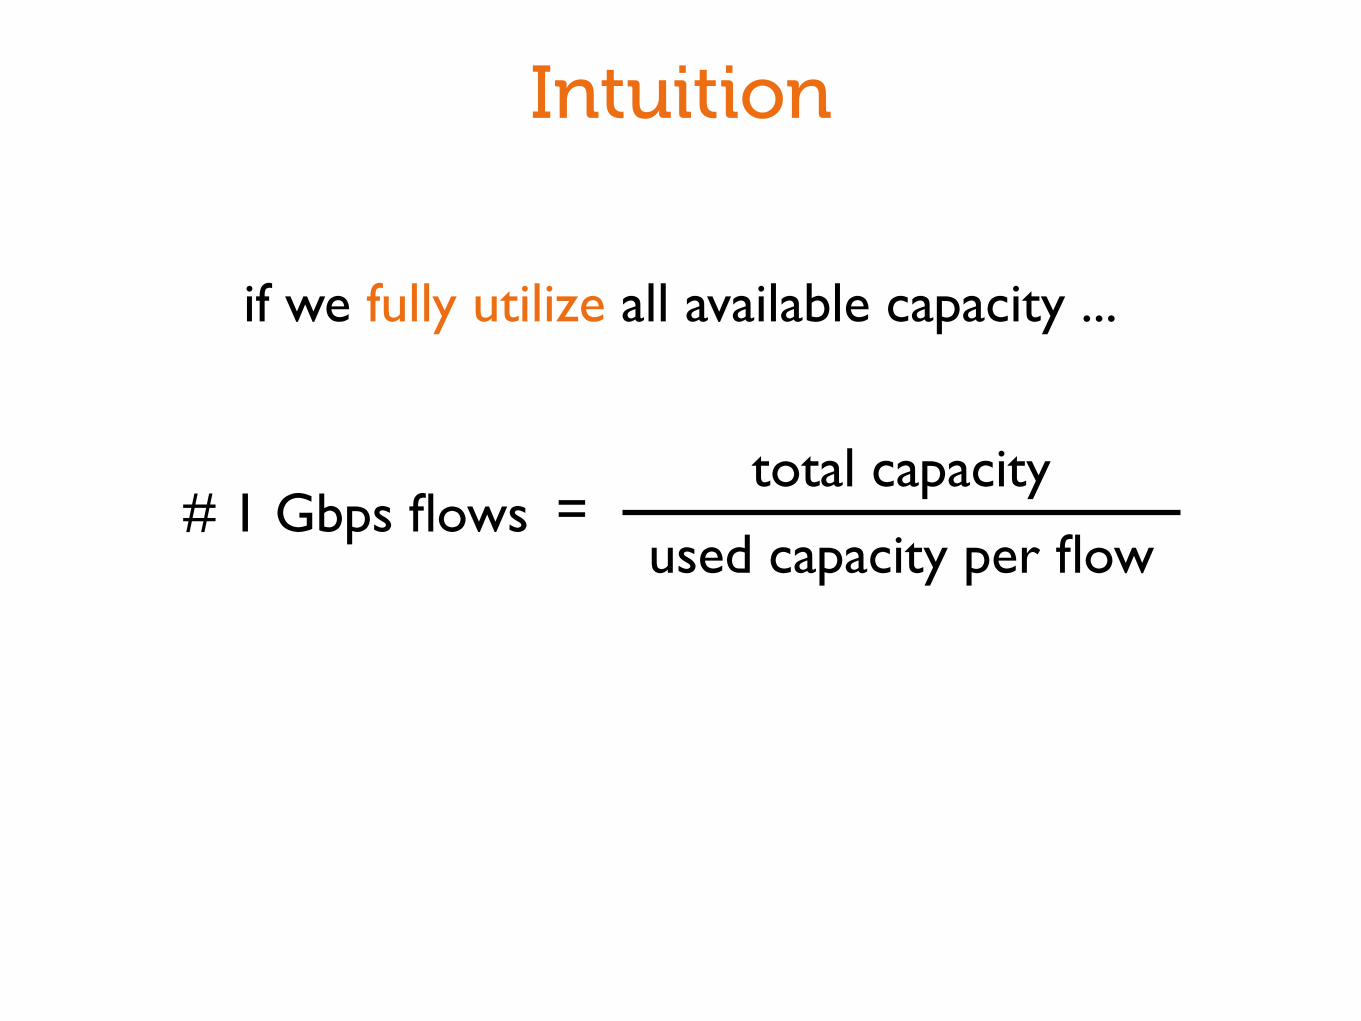
Intuition
# 1 Gbps flowstotal capacity
used capacity per flow=
if we fully utilize all available capacity ...
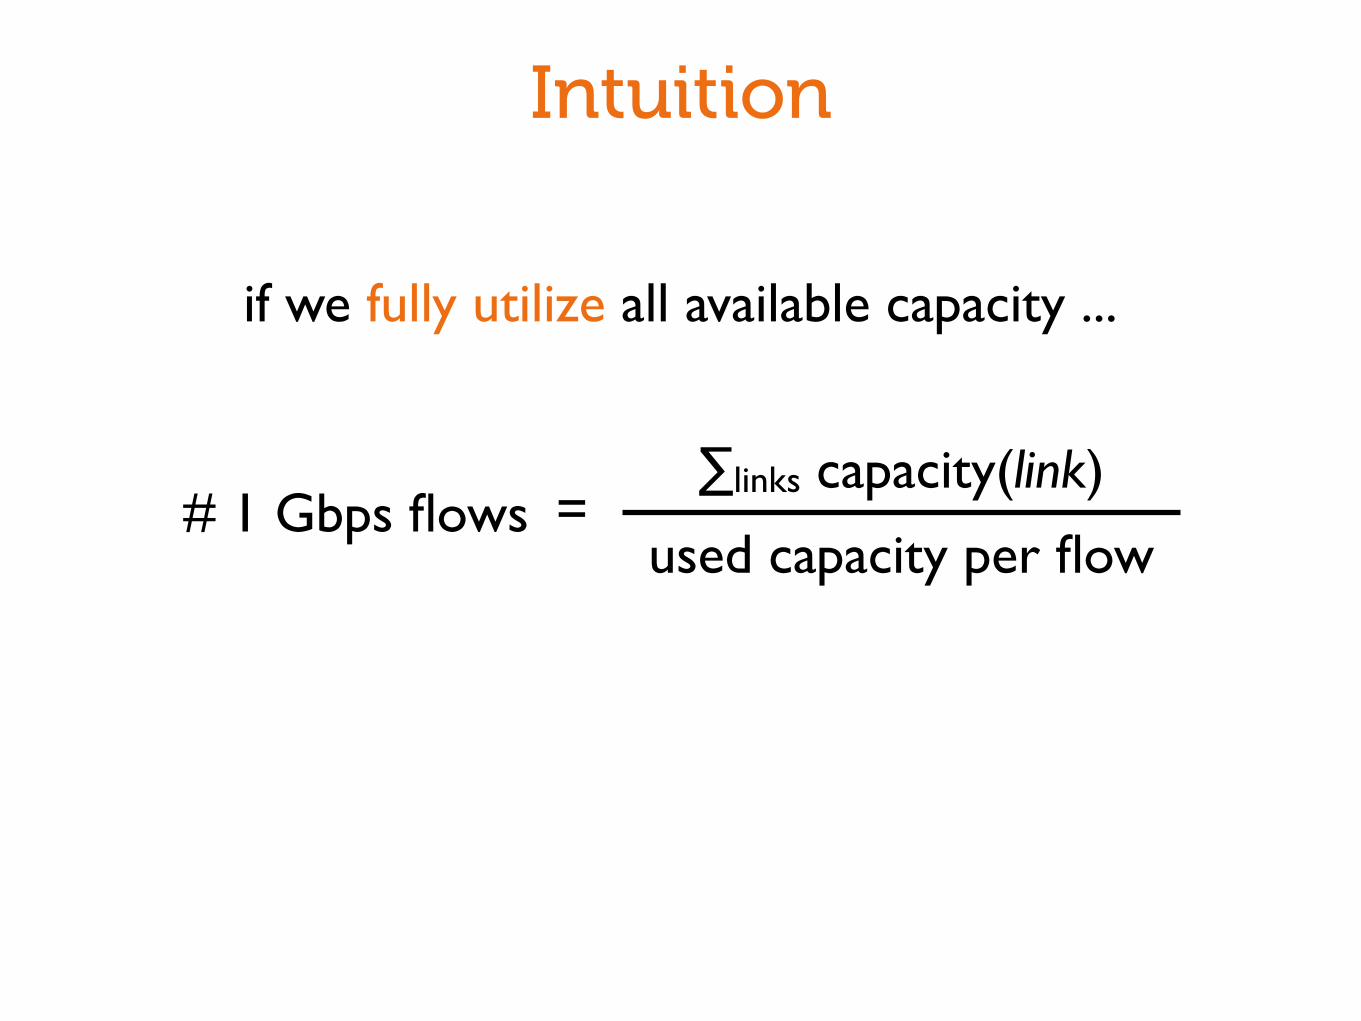
Intuition
# 1 Gbps flows∑links capacity(link)
used capacity per flow=
if we fully utilize all available capacity ...
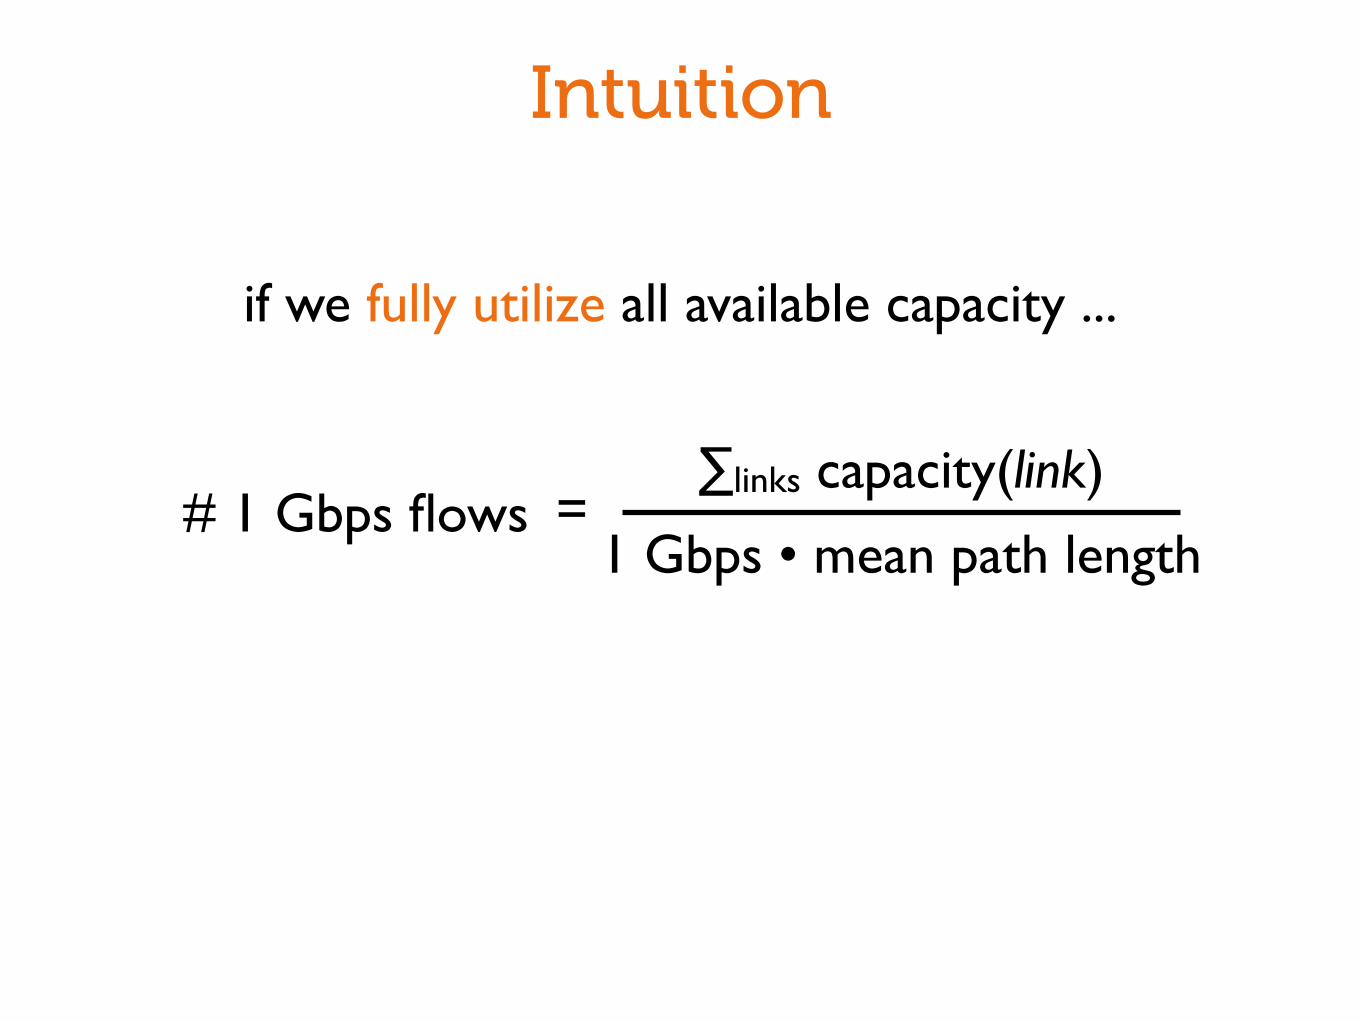
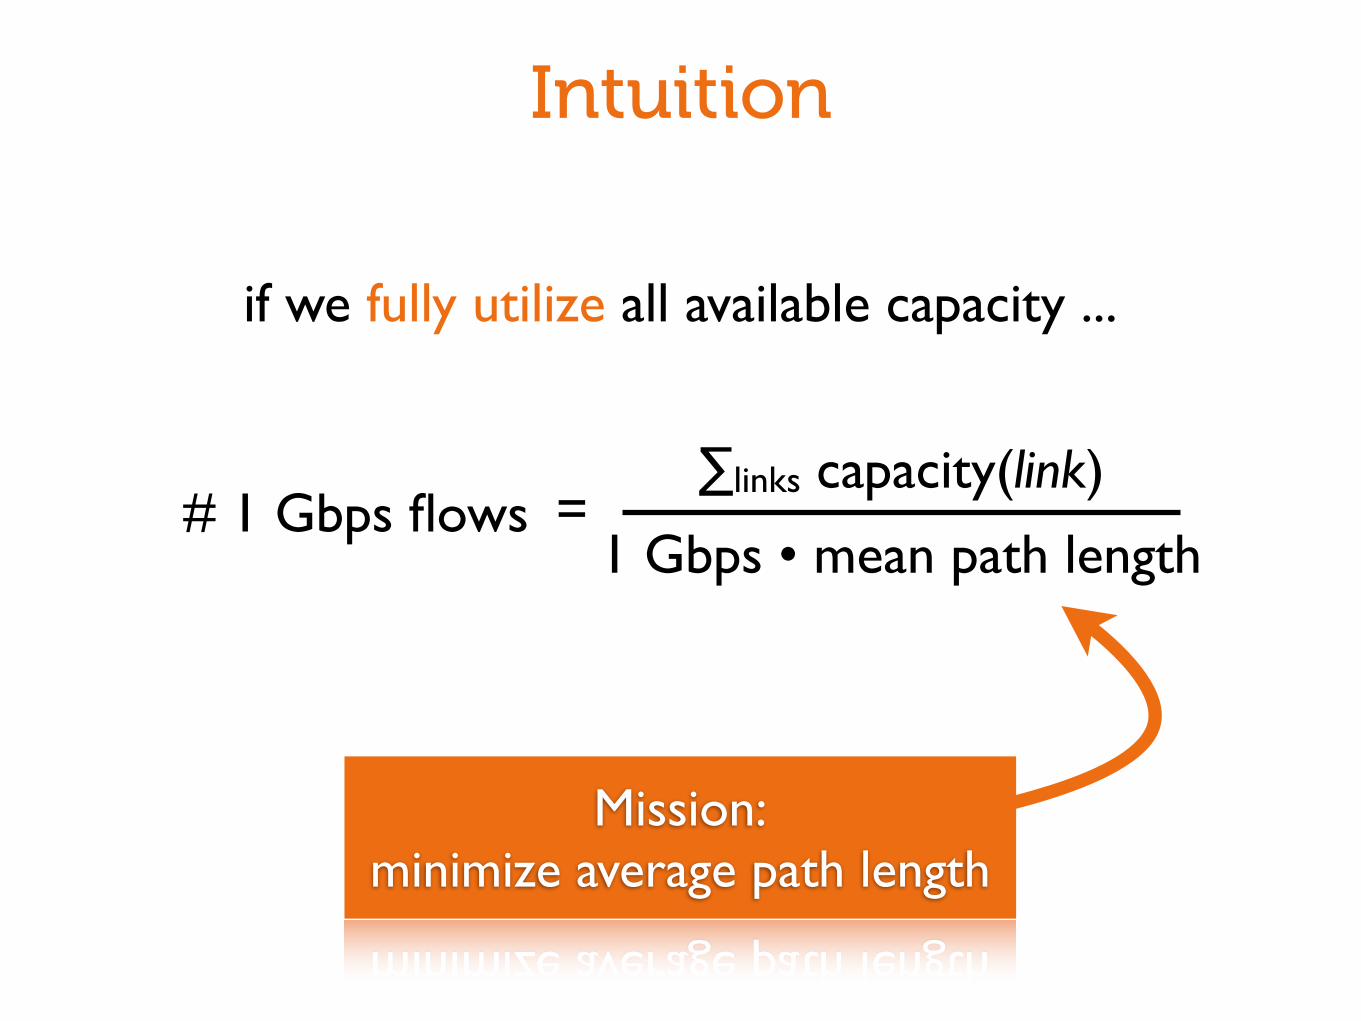
Intuition
# 1 Gbps flows∑links capacity(link)
1 Gbps • mean path length=
if we fully utilize all available capacity ...
Intuition
# 1 Gbps flows∑links capacity(link)
1 Gbps • mean path length=
if we fully utilize all available capacity ...
Mission:minimize average path length
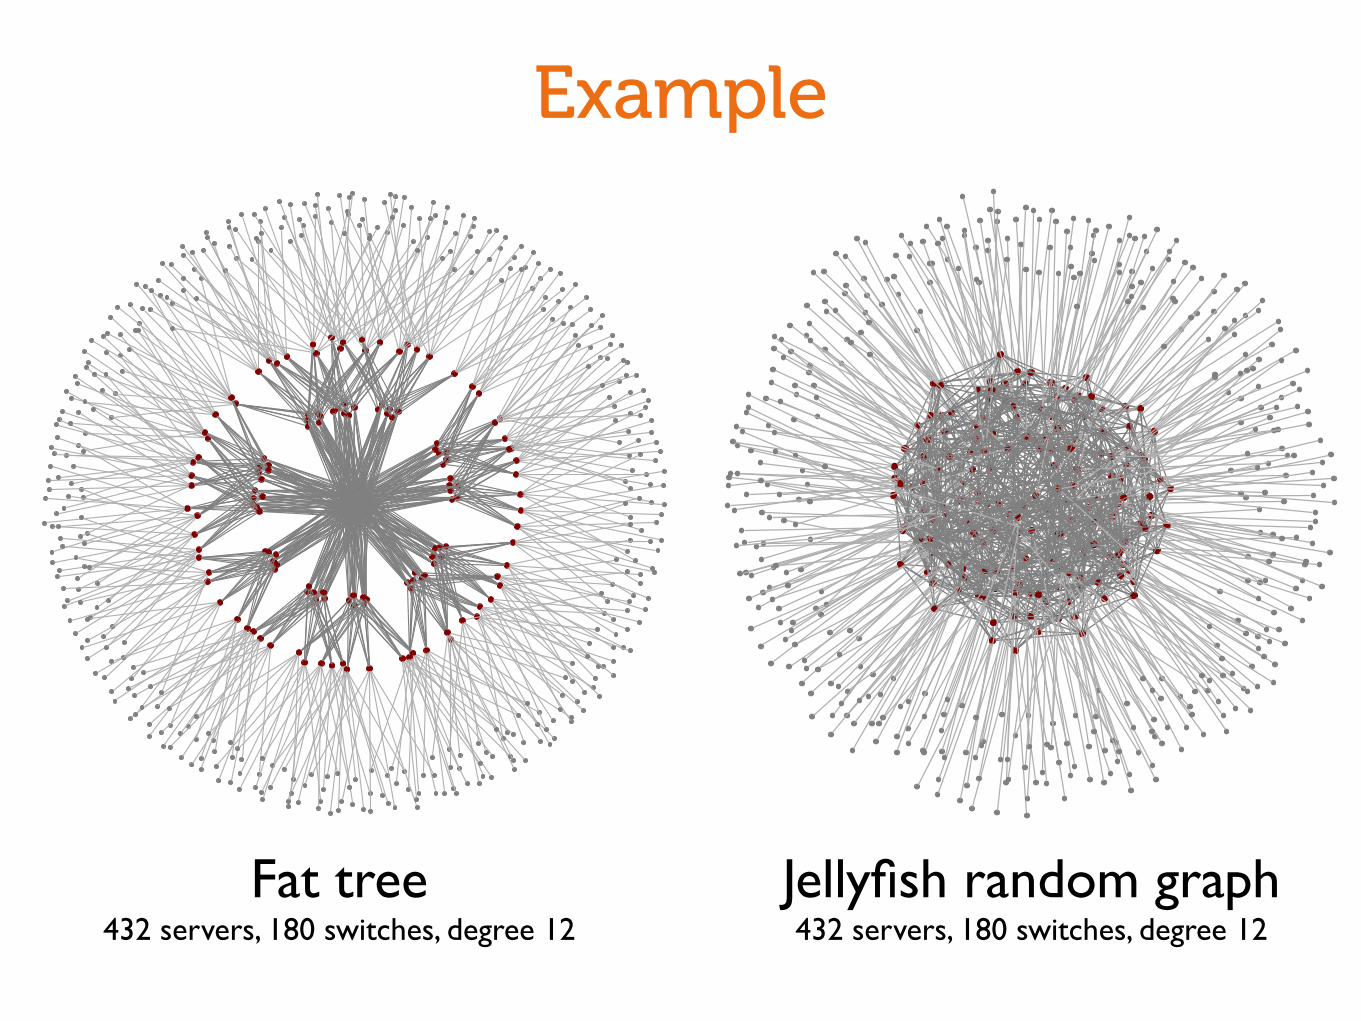
Example
Fat tree432 servers, 180 switches, degree 12
Jellyfish random graph432 servers, 180 switches, degree 12
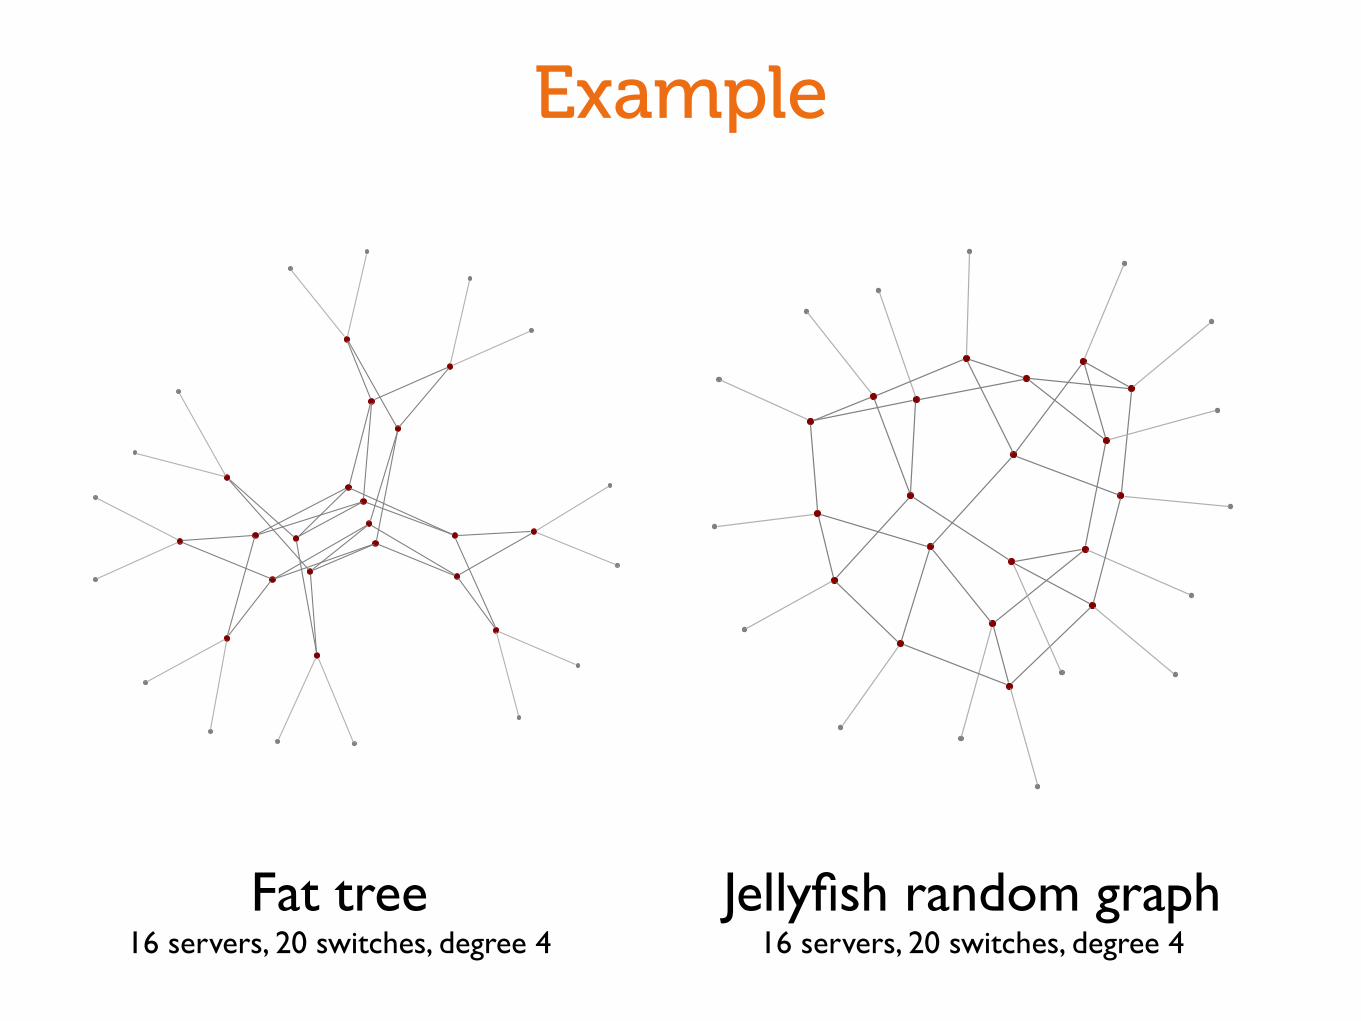
Example
Fat tree16 servers, 20 switches, degree 4
Jellyfish random graph16 servers, 20 switches, degree 4
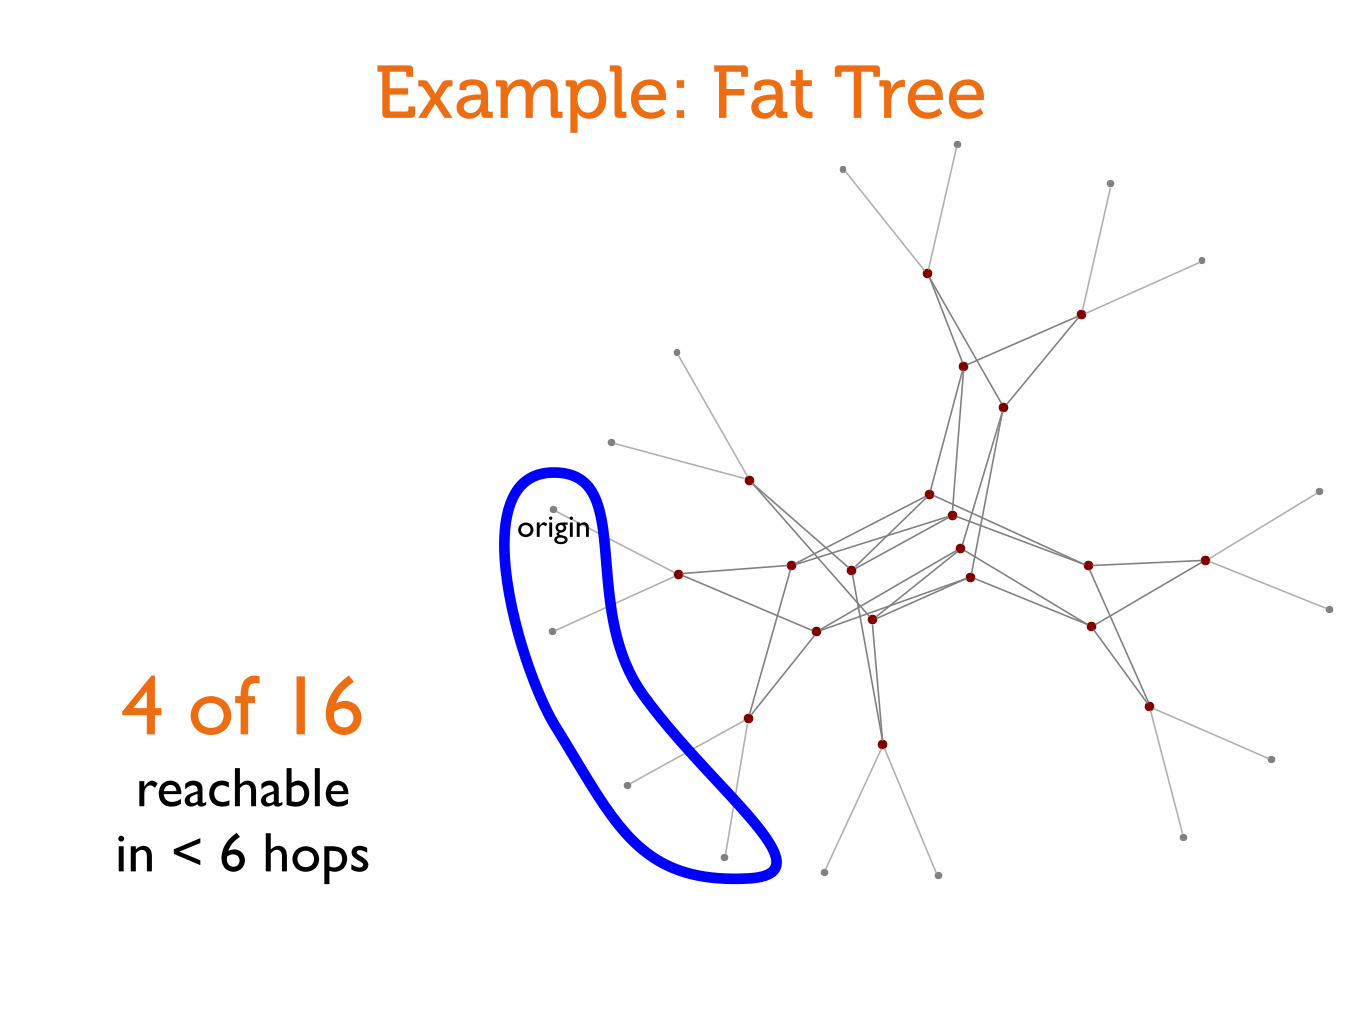
Example: Fat Tree
origin
4 of 16reachable
in < 6 hops
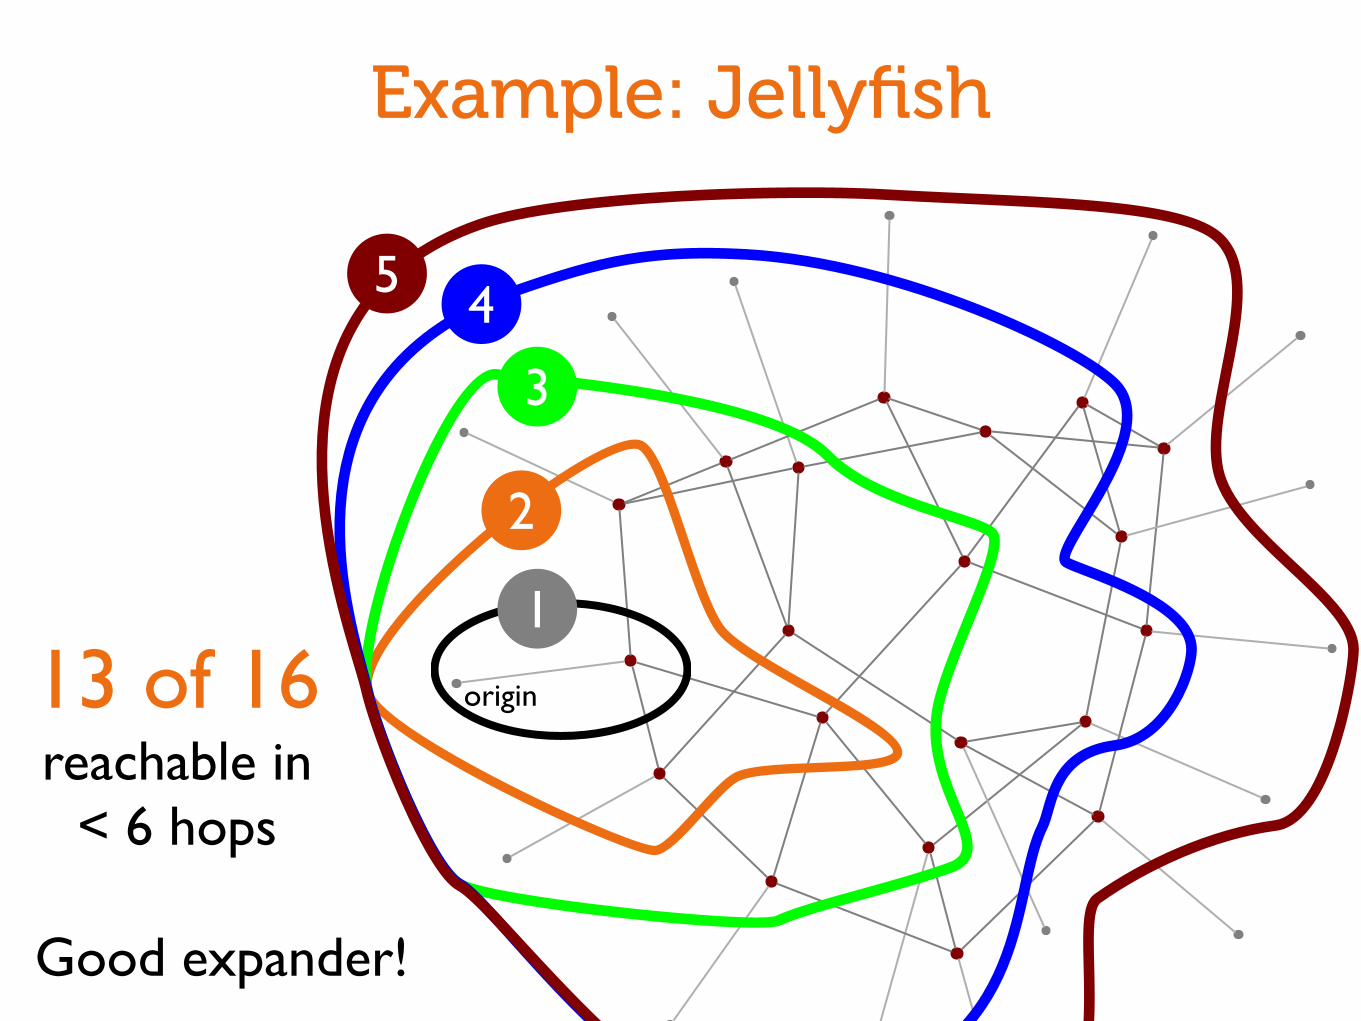
Example: Jellyfish
origin13 of 16reachable in
< 6 hops
1
2
3
45
Good expander!
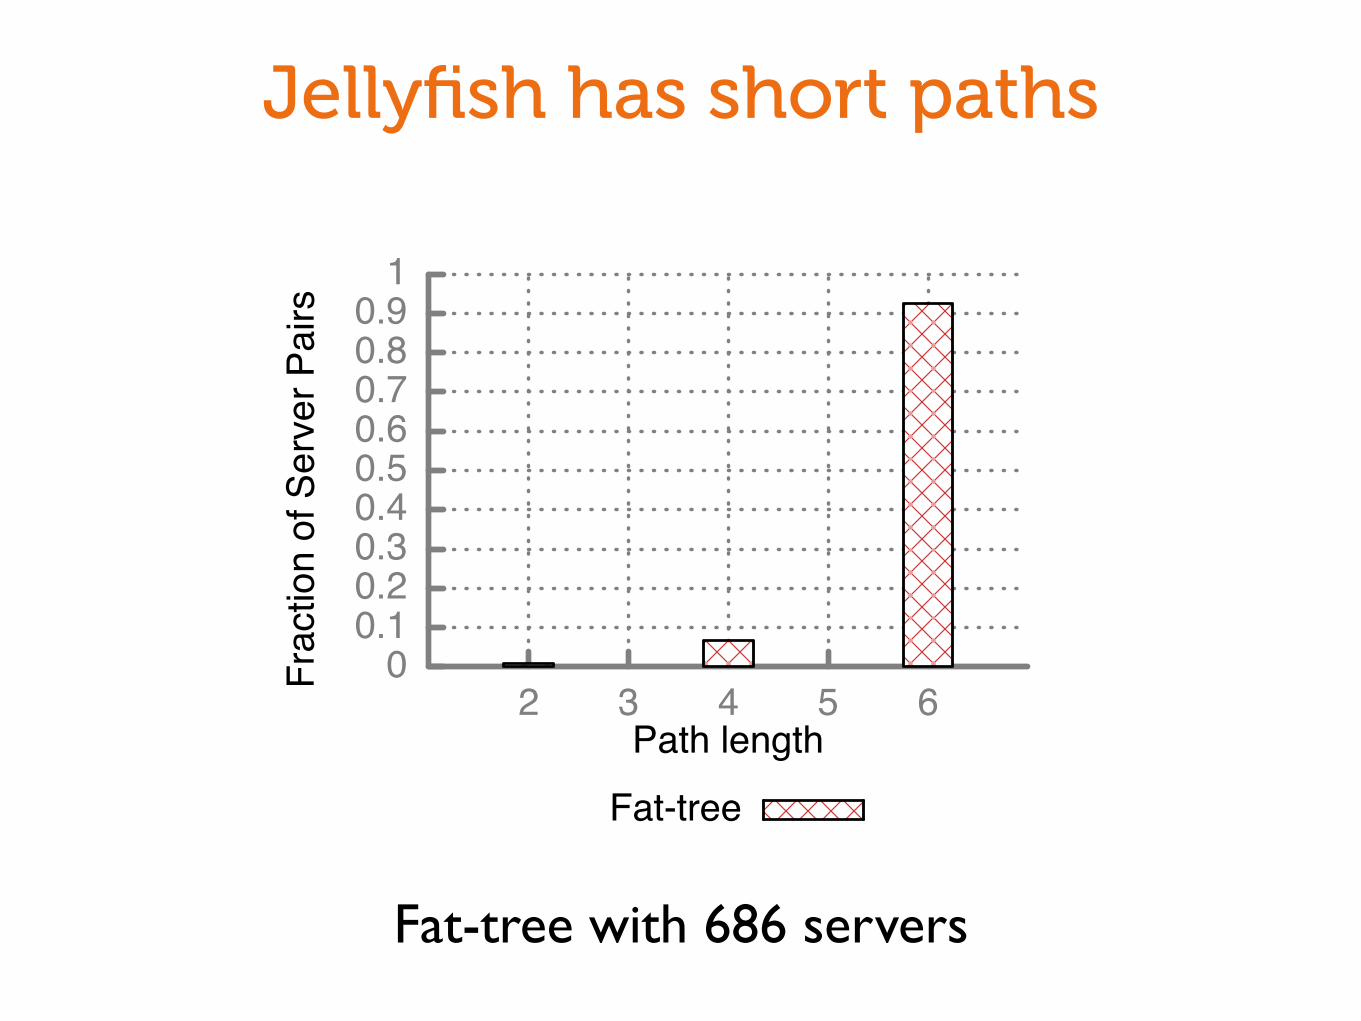
Jellyfish has short paths
Fat-tree with 686 servers
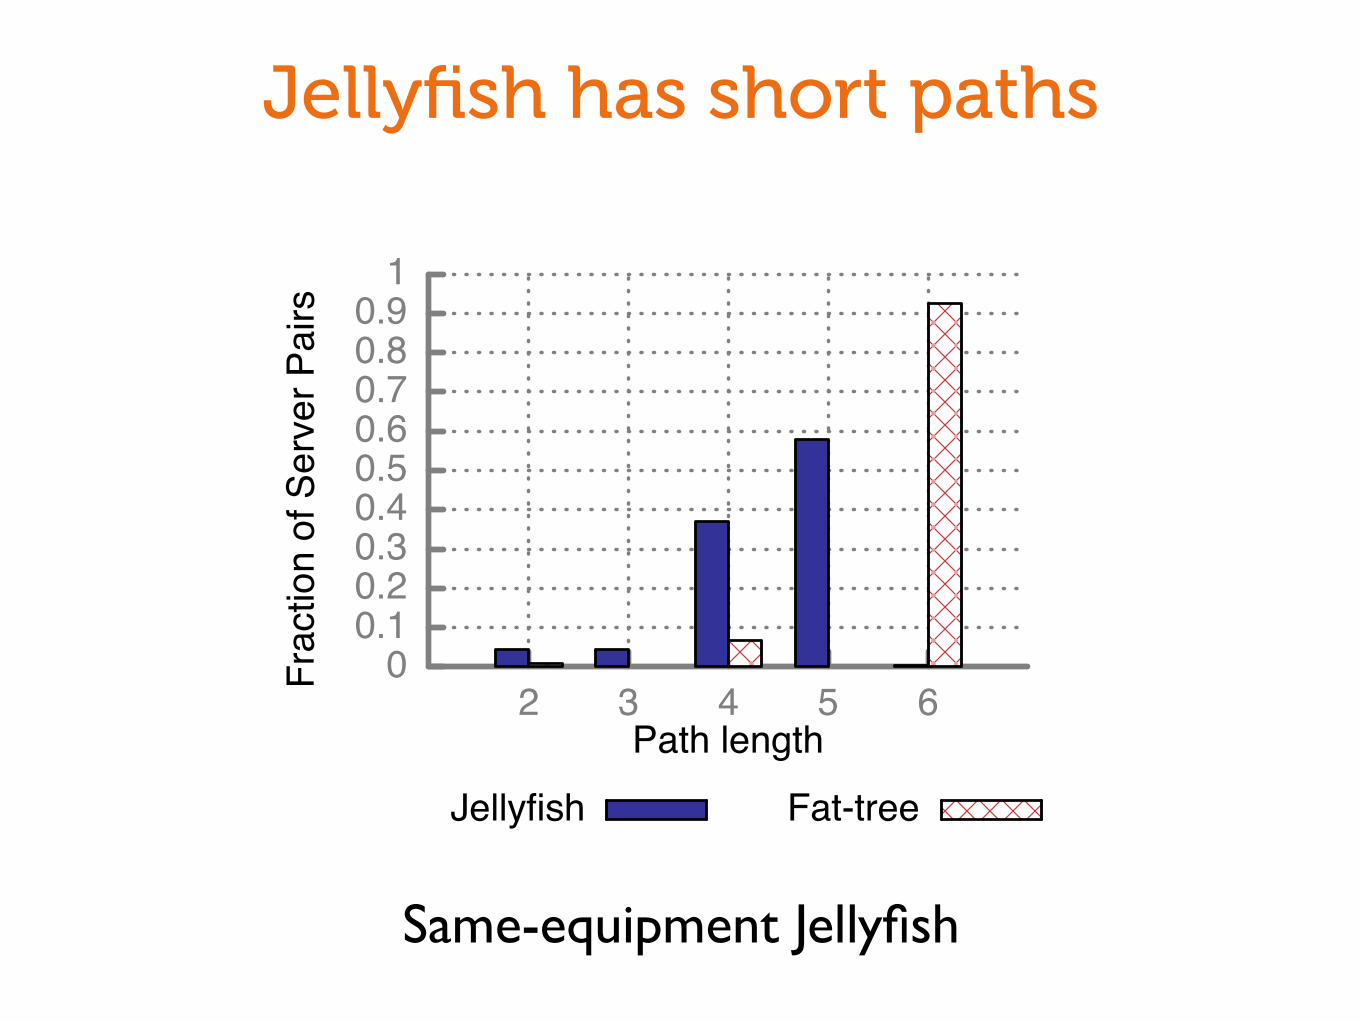
Jellyfish has short paths
Same-equipment Jellyfish
≈ ?
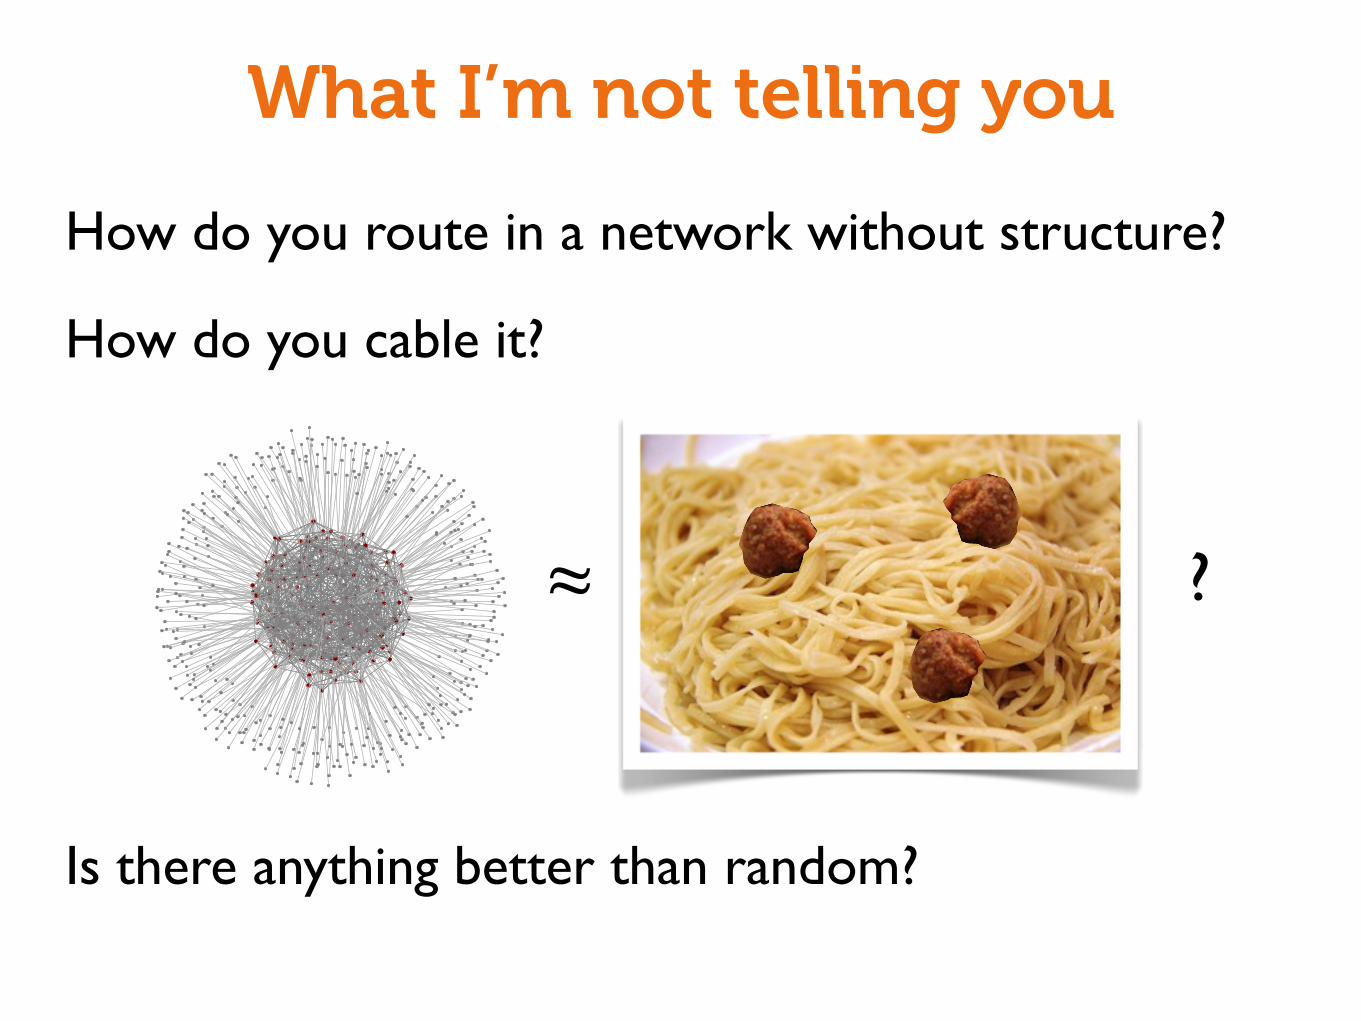
What I’m not telling you
How do you route in a network without structure?
How do you cable it?
Is there anything better than random?
Software Defined Networking
The Problem
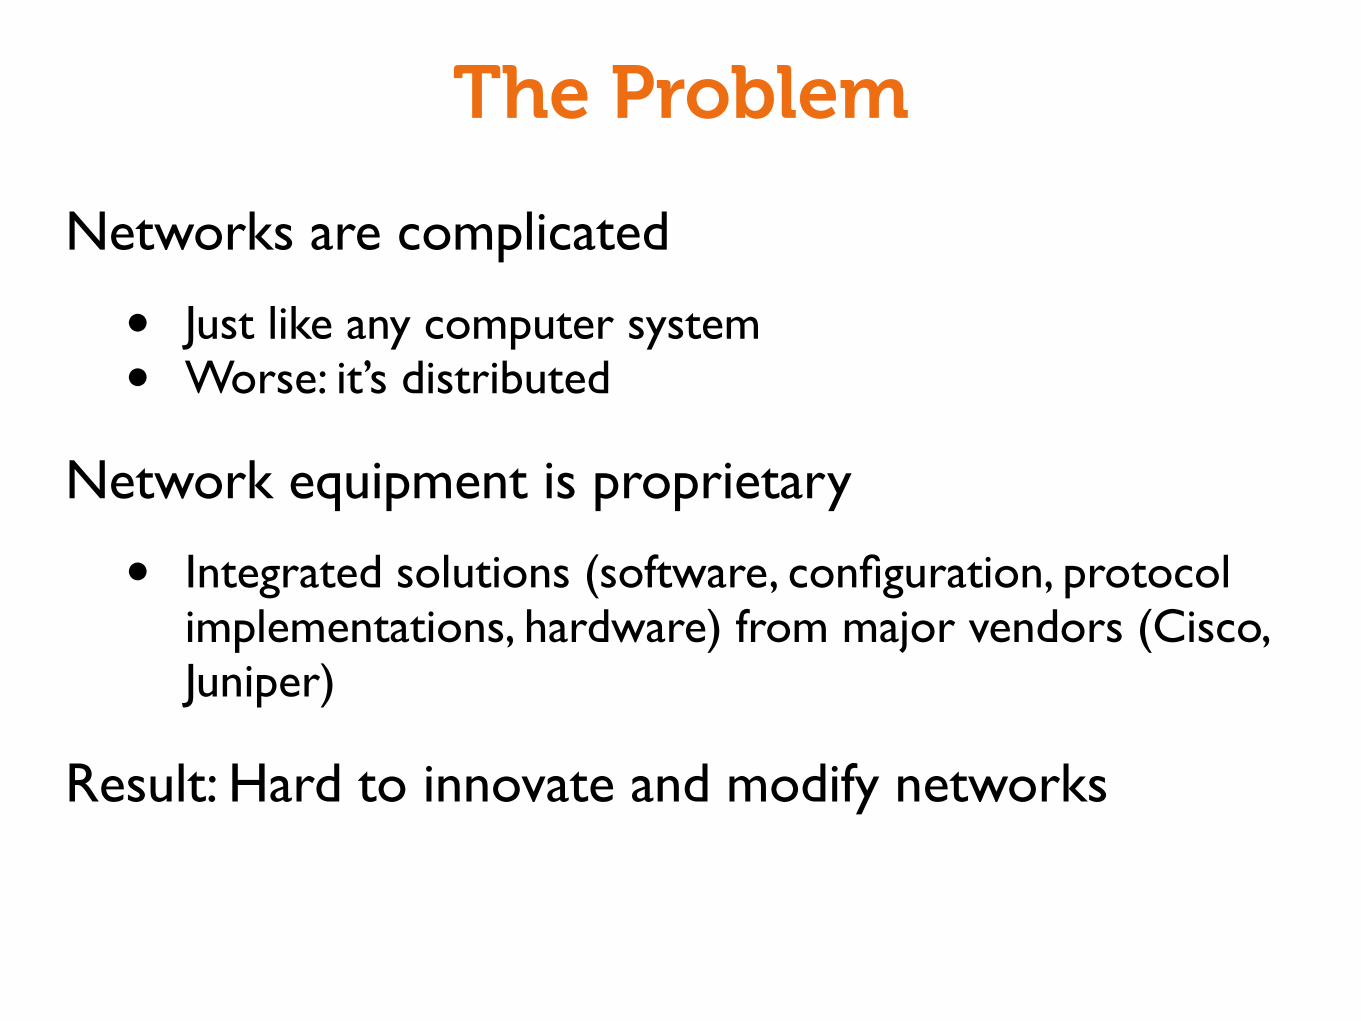
Networks are complicated
• Just like any computer system• Worse: it’s distributed
Network equipment is proprietary
• Integrated solutions (software, configuration, protocol implementations, hardware) from major vendors (Cisco, Juniper)
Result: Hard to innovate and modify networks
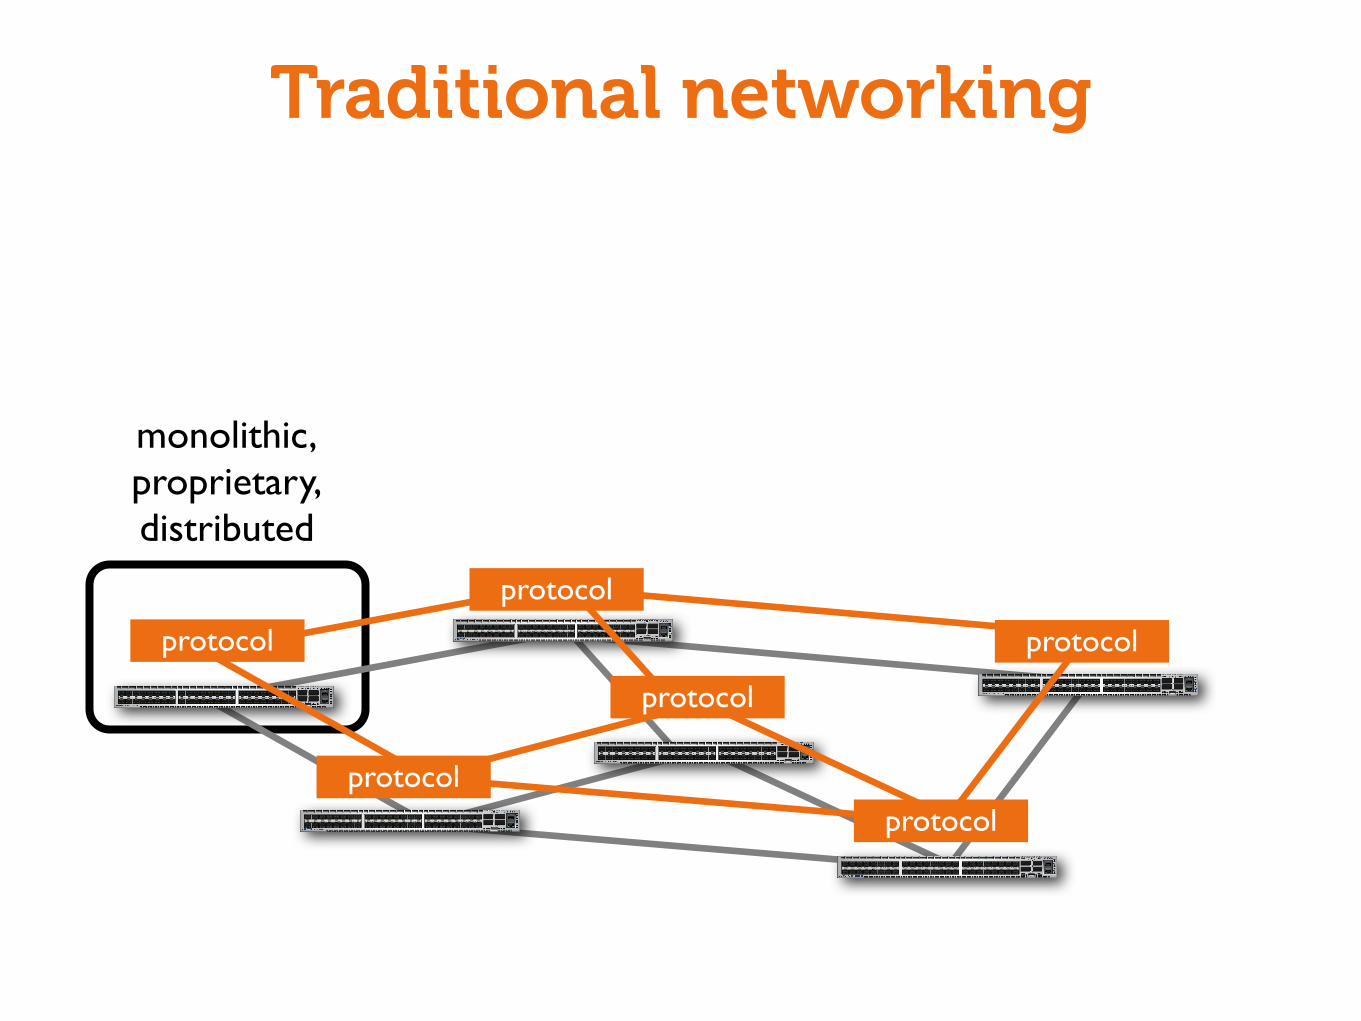
monolithic,proprietary,distributed
Traditional networking
protocol
protocol
protocol
protocol
protocolprotocol
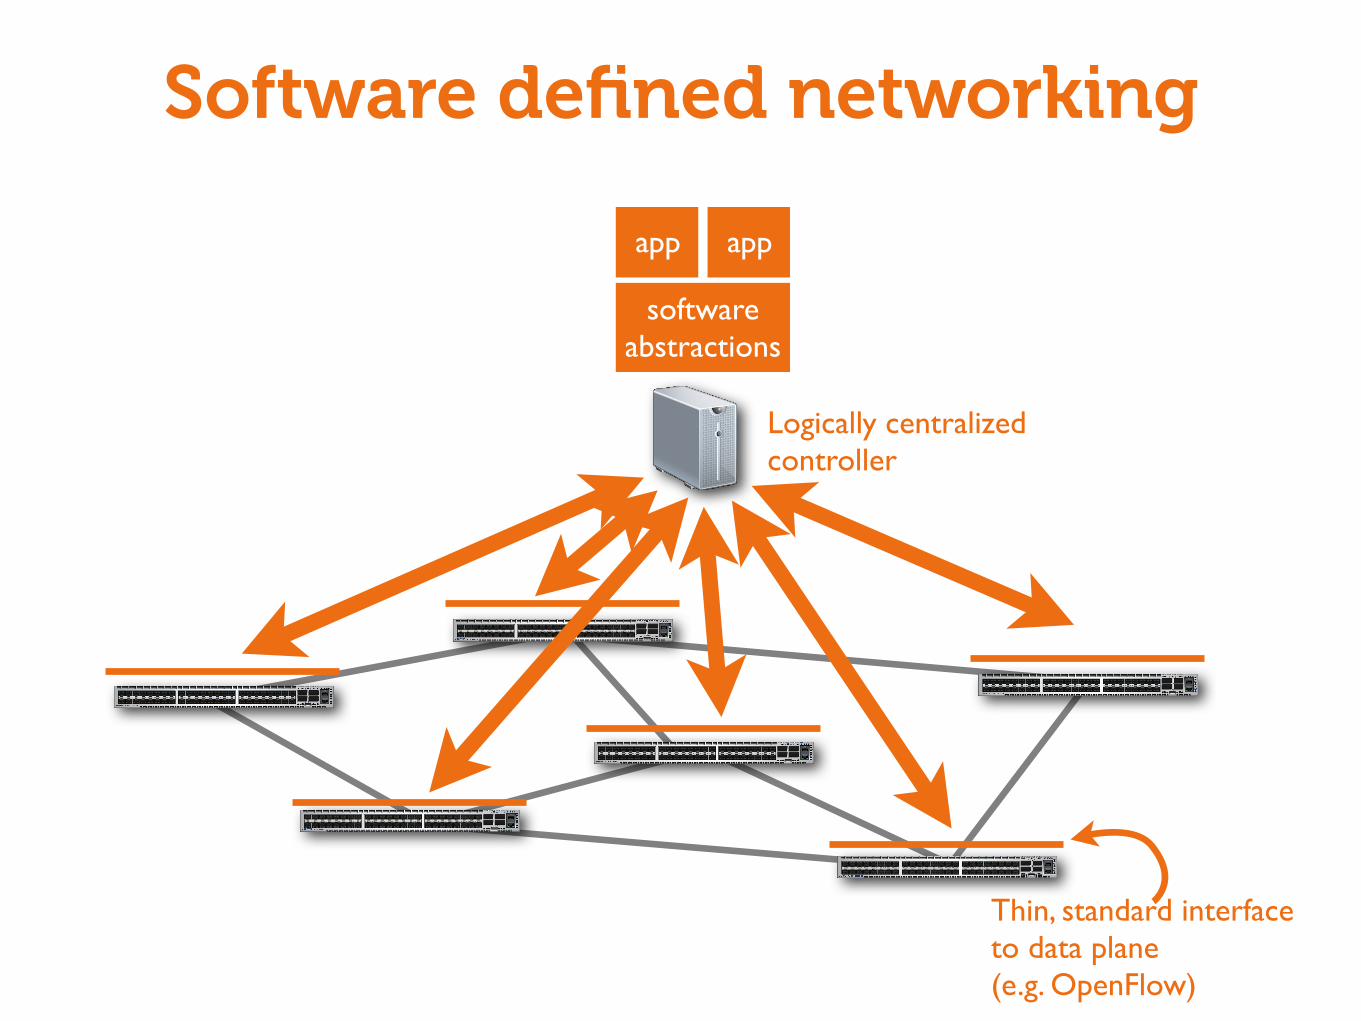
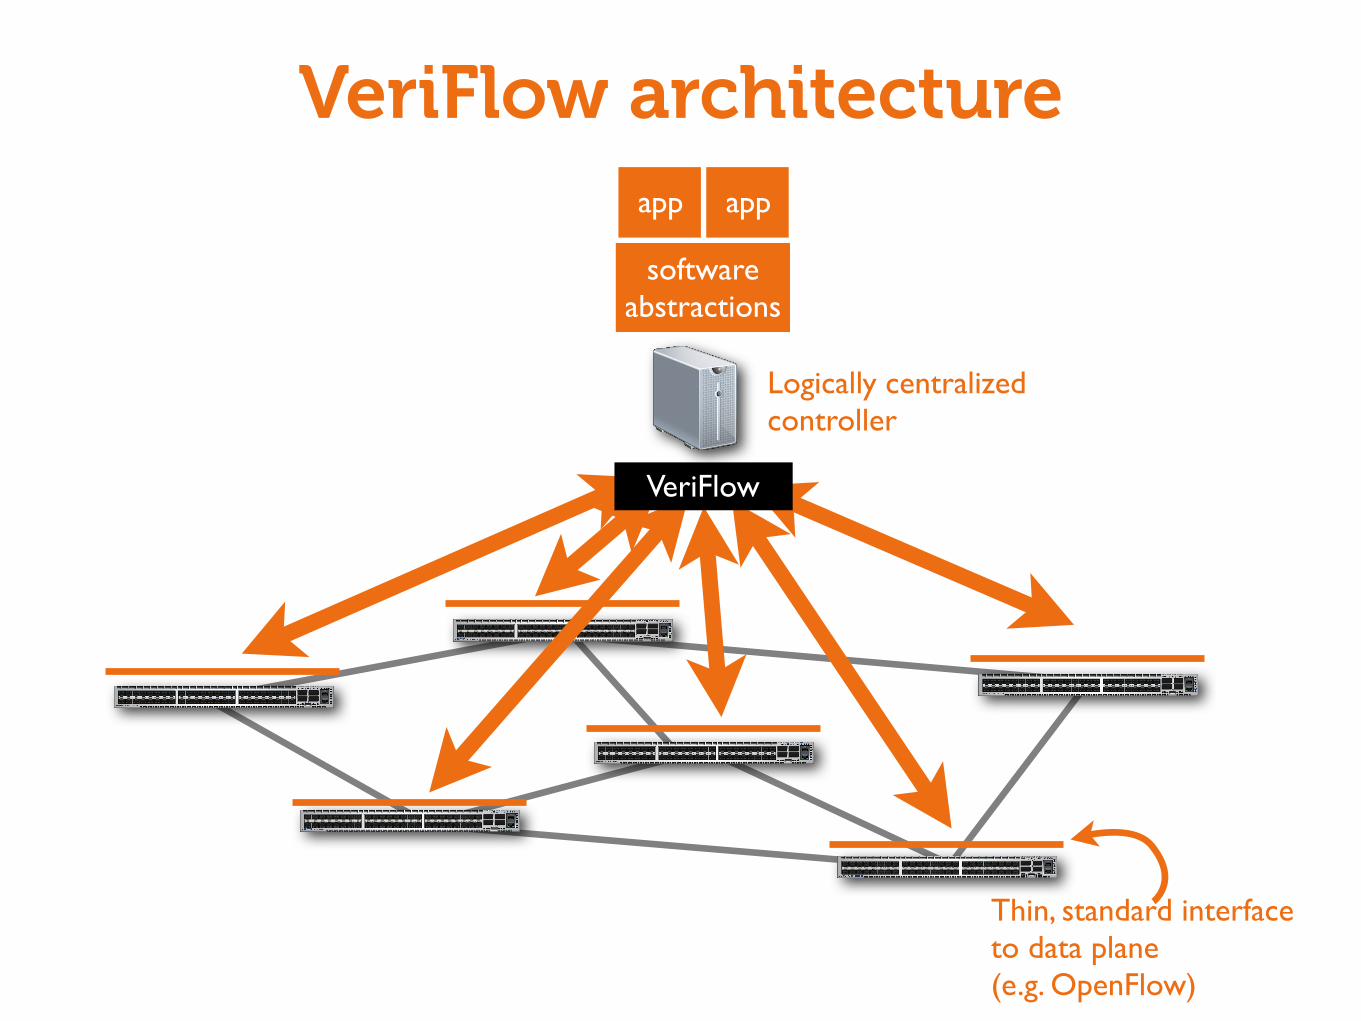
Software defined networking
Thin, standard interfaceto data plane(e.g. OpenFlow)
Logically centralizedcontroller
softwareabstractions
app app
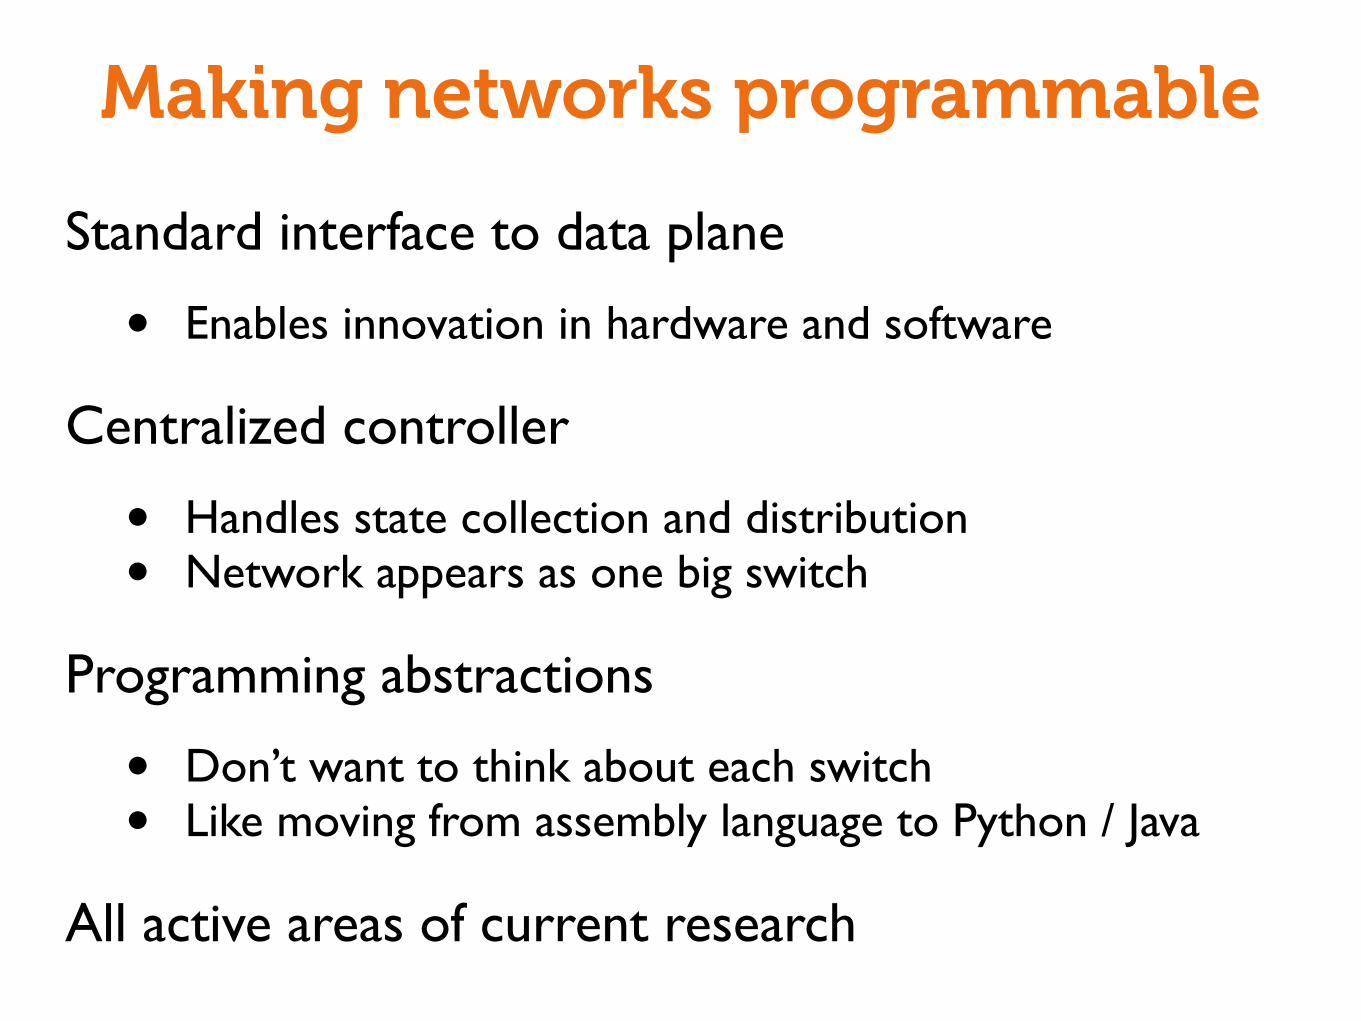
Making networks programmable
Standard interface to data plane
• Enables innovation in hardware and software
Centralized controller
• Handles state collection and distribution• Network appears as one big switch
Programming abstractions
• Don’t want to think about each switch• Like moving from assembly language to Python / Java
All active areas of current research
From research to reality
Original papers: 2007, 2008
Now:
• Offerings from major vendors and startups (NEC, IBM, Nicira, ...)• Deployment in production networks
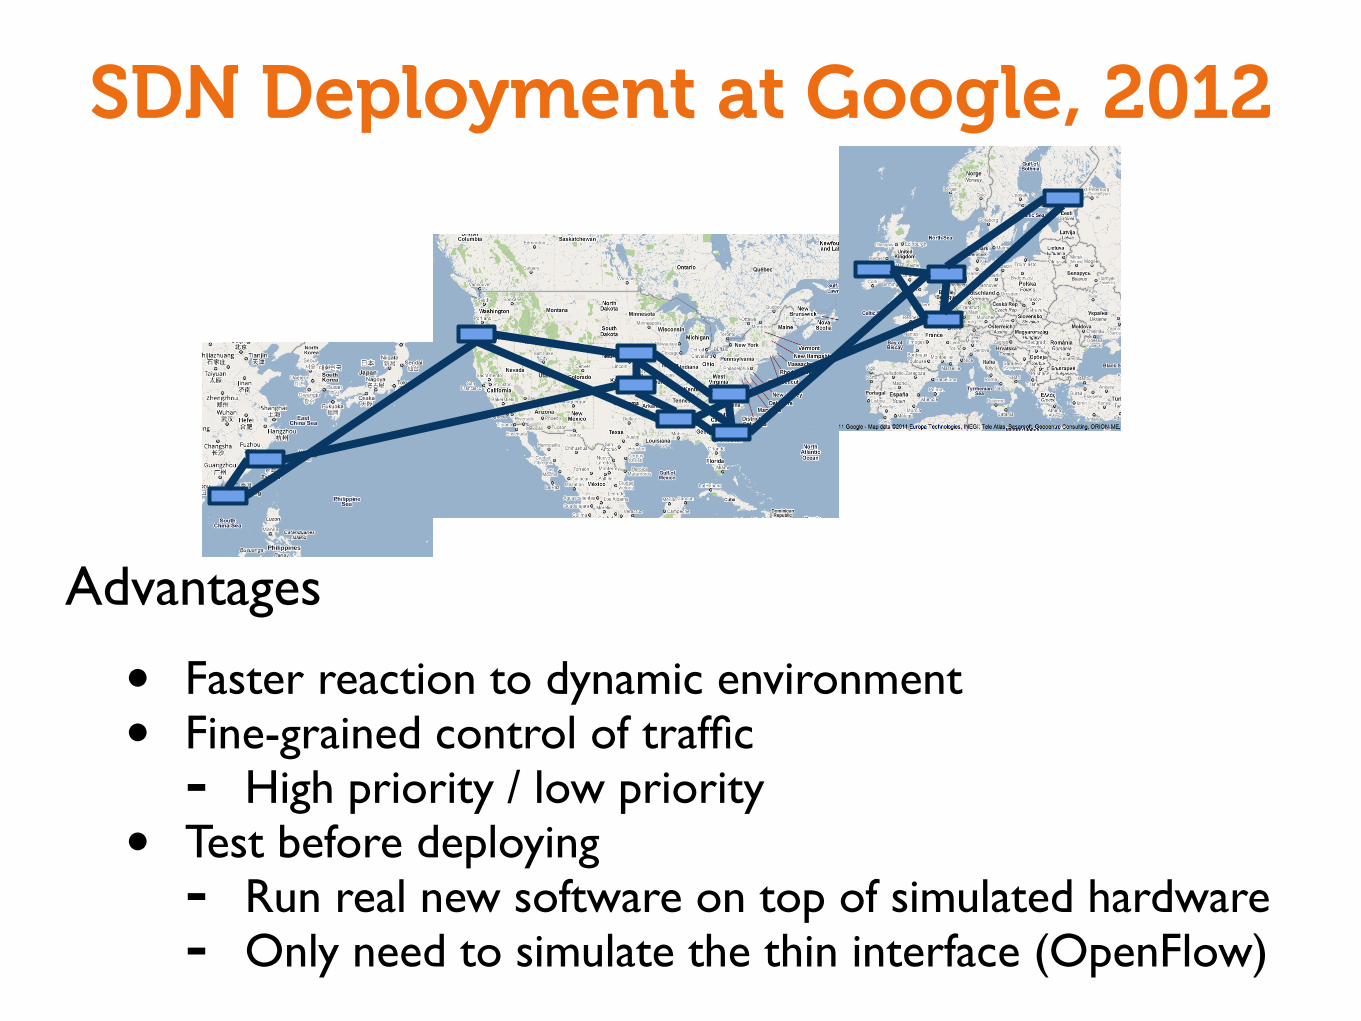
SDN Deployment at Google, 2012
Advantages
• Faster reaction to dynamic environment• Fine-grained control of traffic- High priority / low priority• Test before deploying- Run real new software on top of simulated hardware- Only need to simulate the thin interface (OpenFlow)
*RRJOH�&RQILGHQWLDO�DQG�3URSULHWDU\
*RRJOHV�2SHQ)ORZ�:$1
Our work: debugging the data plane
[Work with Ahmed Khurshid, Haohui Mai, Wenxuan Zhou, Rachit Agarwal, Matthew Caesar, and Sam King]
Network debugging is challenging
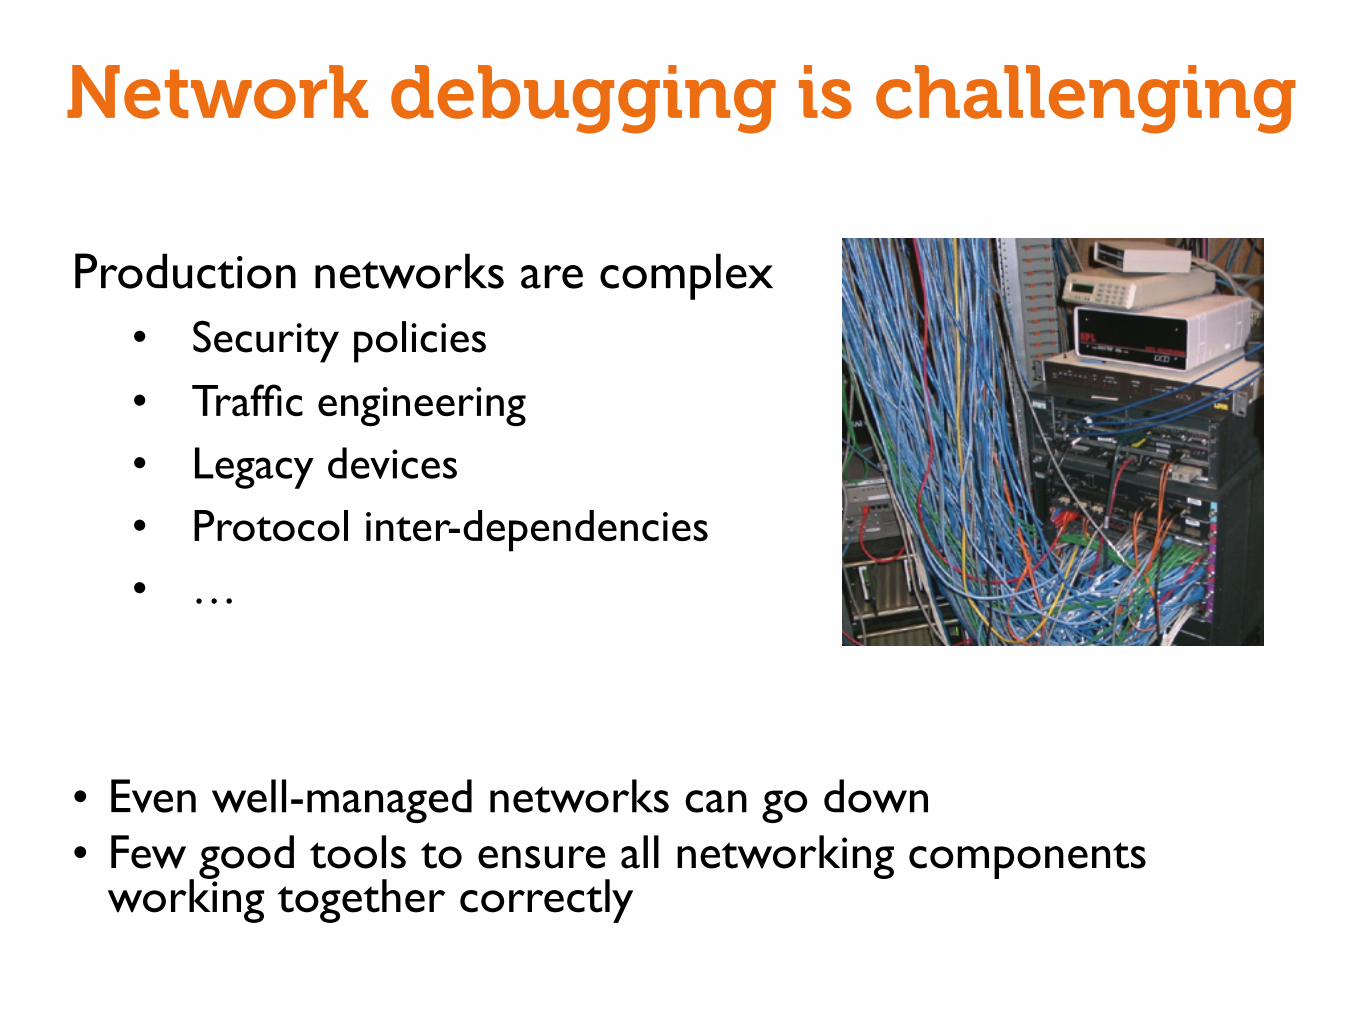
Production networks are complex• Security policies• Traffic engineering• Legacy devices• Protocol inter-dependencies• …
• Even well-managed networks can go down• Few good tools to ensure all networking components
working together correctly
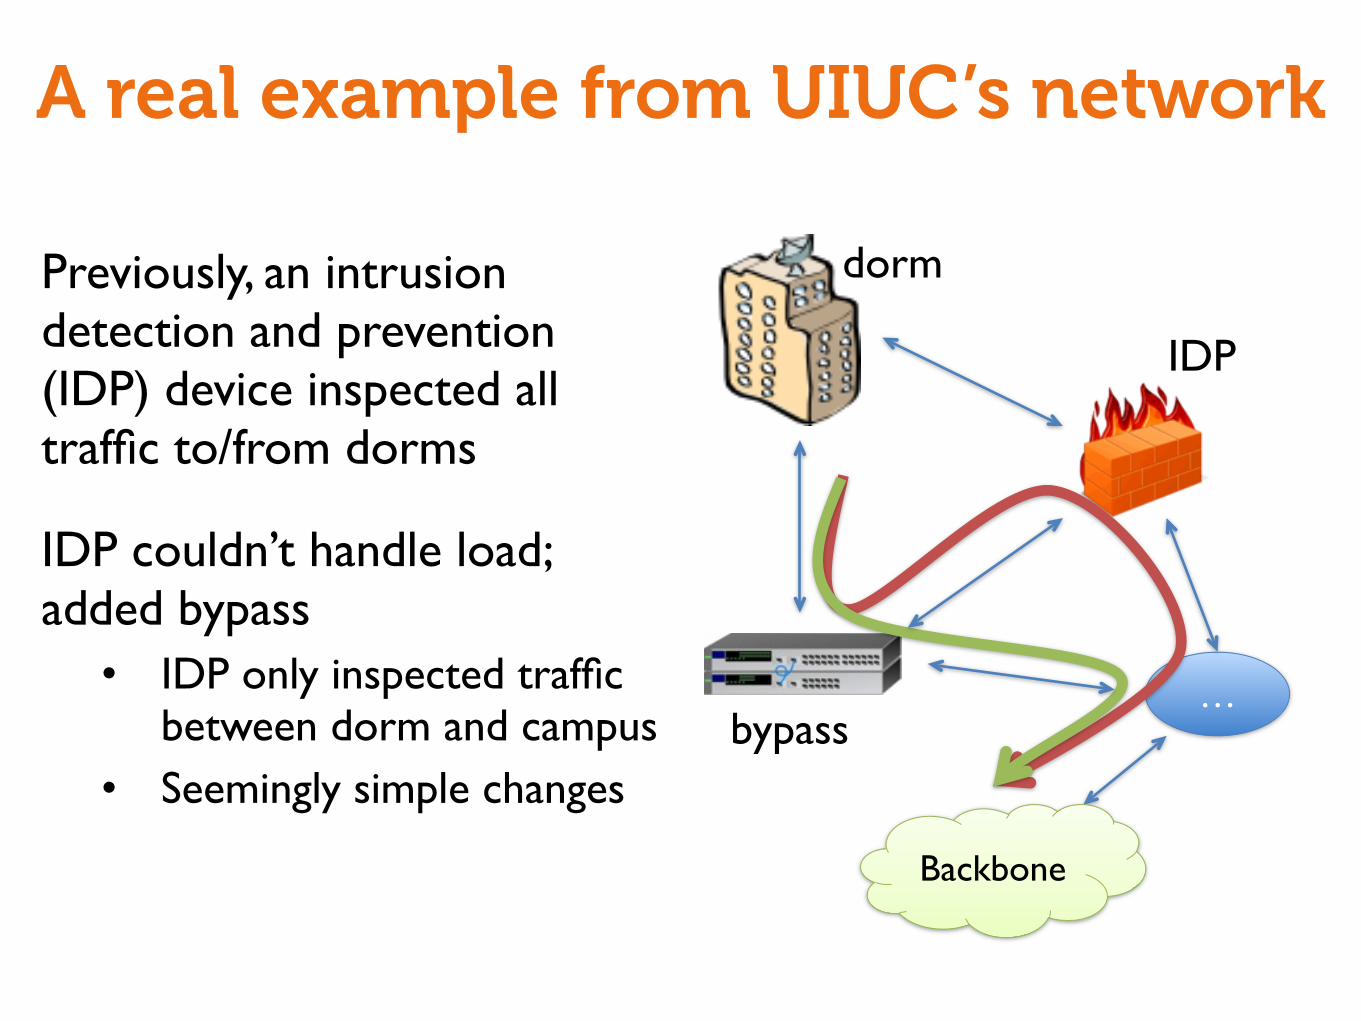
A real example from UIUC’s network
Previously, an intrusion detection and prevention (IDP) device inspected all traffic to/from dorms
IDP couldn’t handle load; added bypass• IDP only inspected traffic
between dorm and campus• Seemingly simple changes
…
Backbone
dorm
IDP
bypass
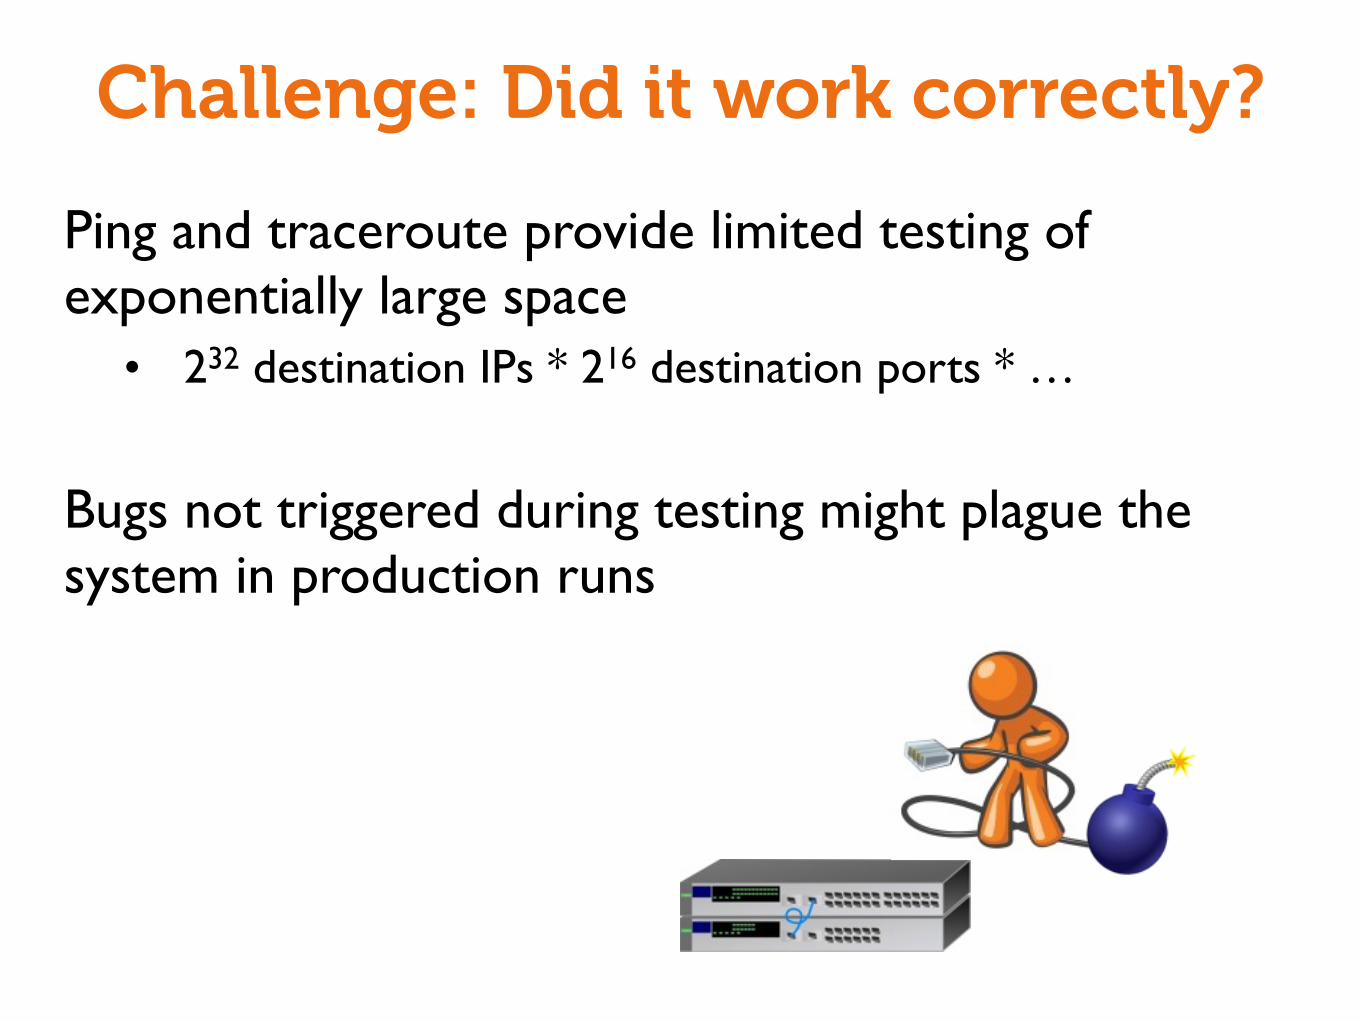
Challenge: Did it work correctly?
Ping and traceroute provide limited testing of exponentially large space• 232 destination IPs * 216 destination ports * …
Bugs not triggered during testing might plague the system in production runs
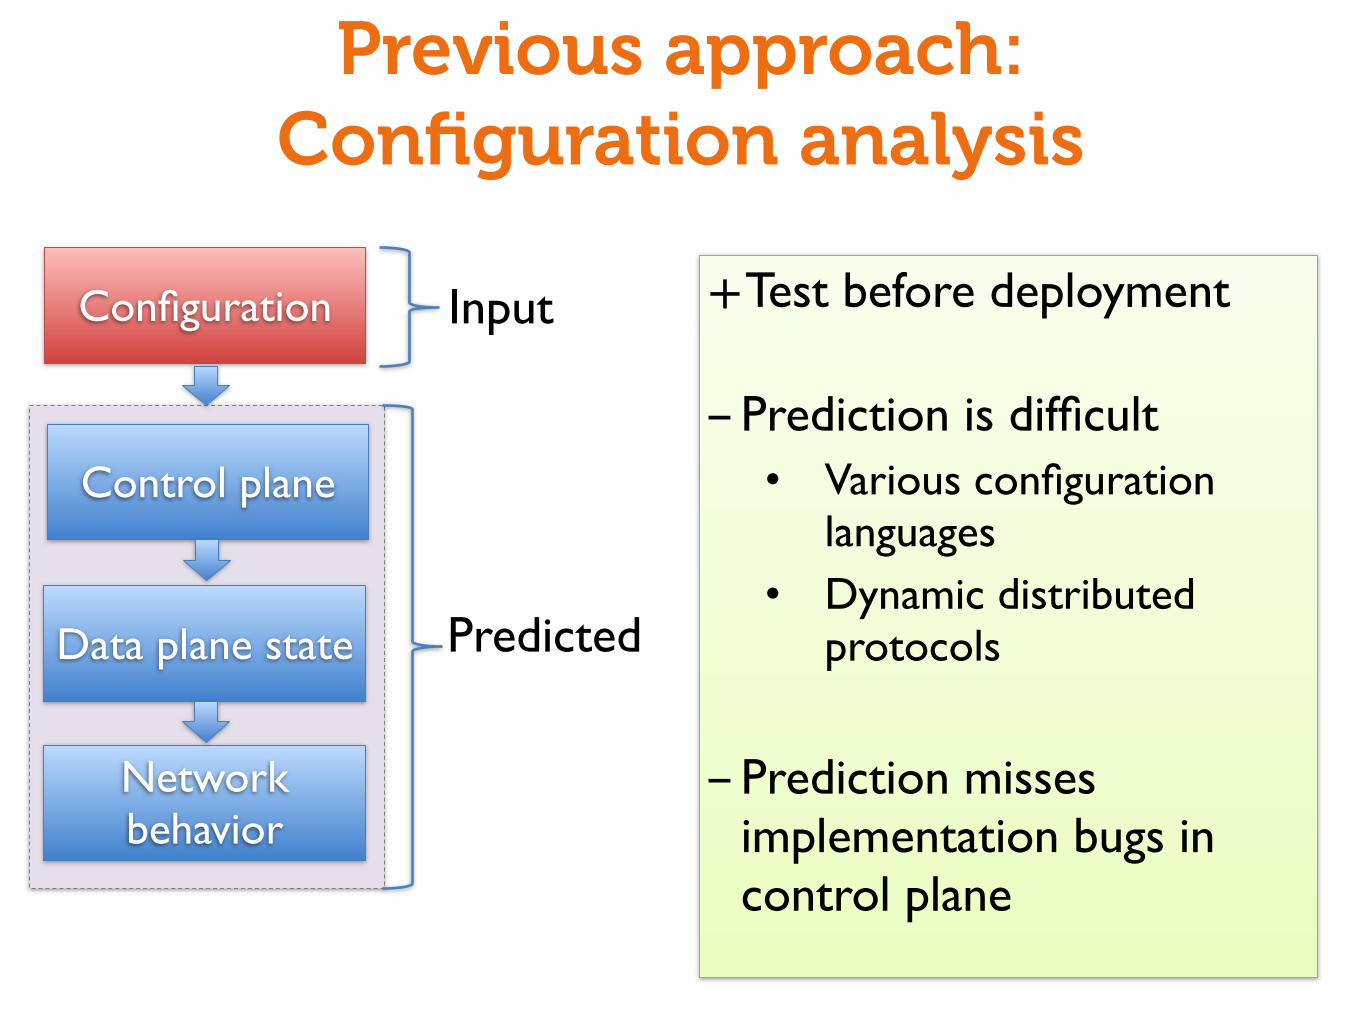
Previous approach:Configuration analysis
+Test before deployment
-Prediction is difficult• Various configuration
languages• Dynamic distributed
protocols
-Prediction misses implementation bugs in control plane
Configuration
Control plane
Data plane state
Network behavior
Input
Predicted
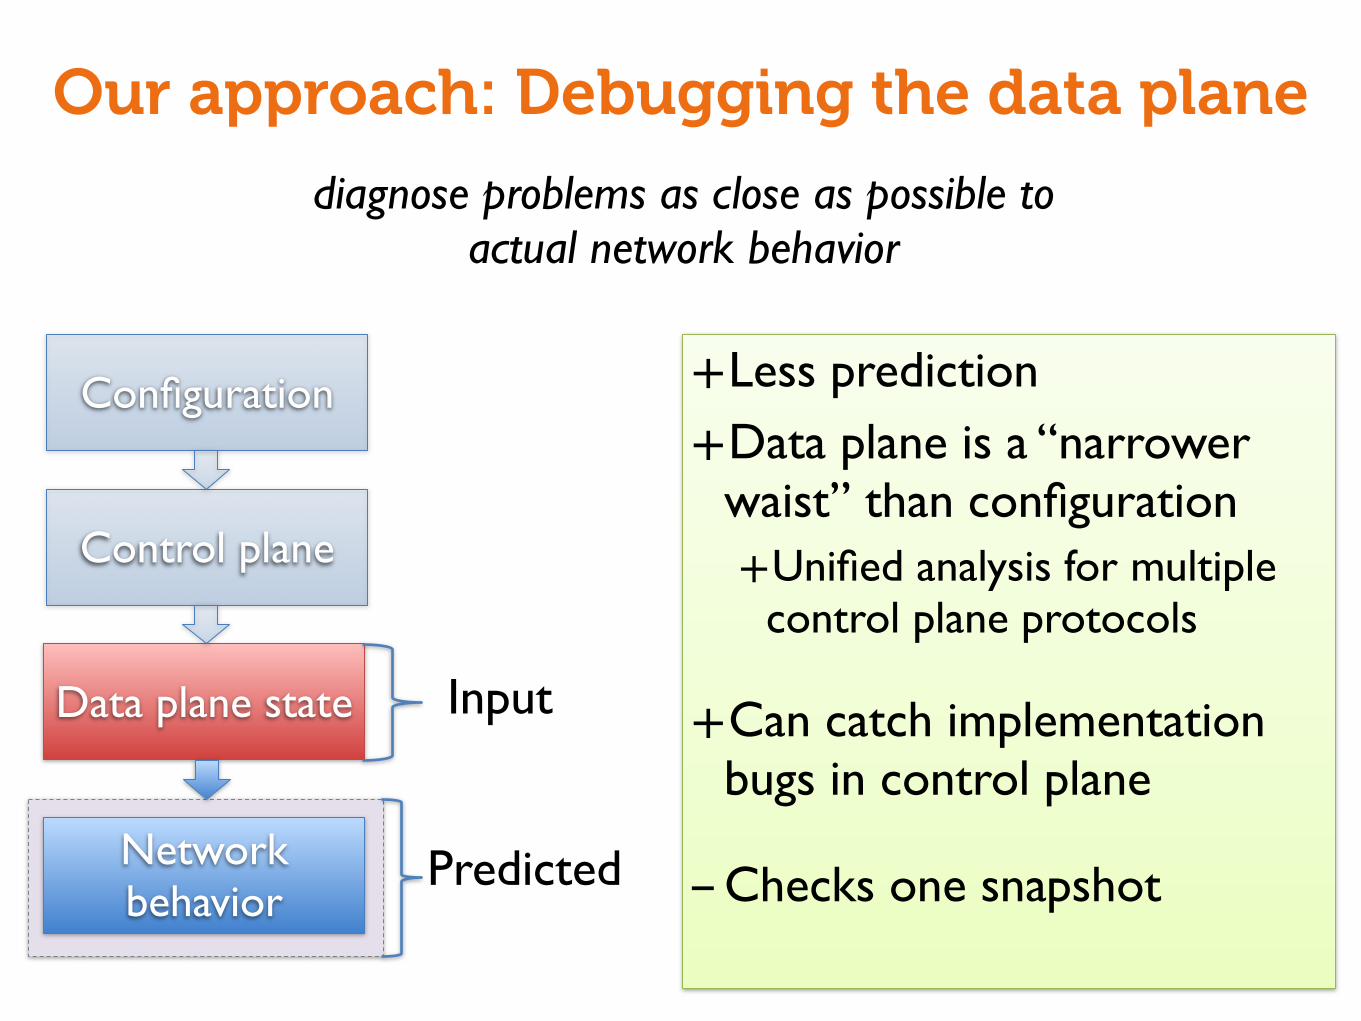
Our approach: Debugging the data plane
+Less prediction
+Data plane is a “narrower waist” than configuration+Unified analysis for multiple
control plane protocols
+Can catch implementation bugs in control plane
-Checks one snapshot
Configuration
Control plane
Data plane state
Network behavior
Input
Predicted
diagnose problems as close as possible to actual network behavior
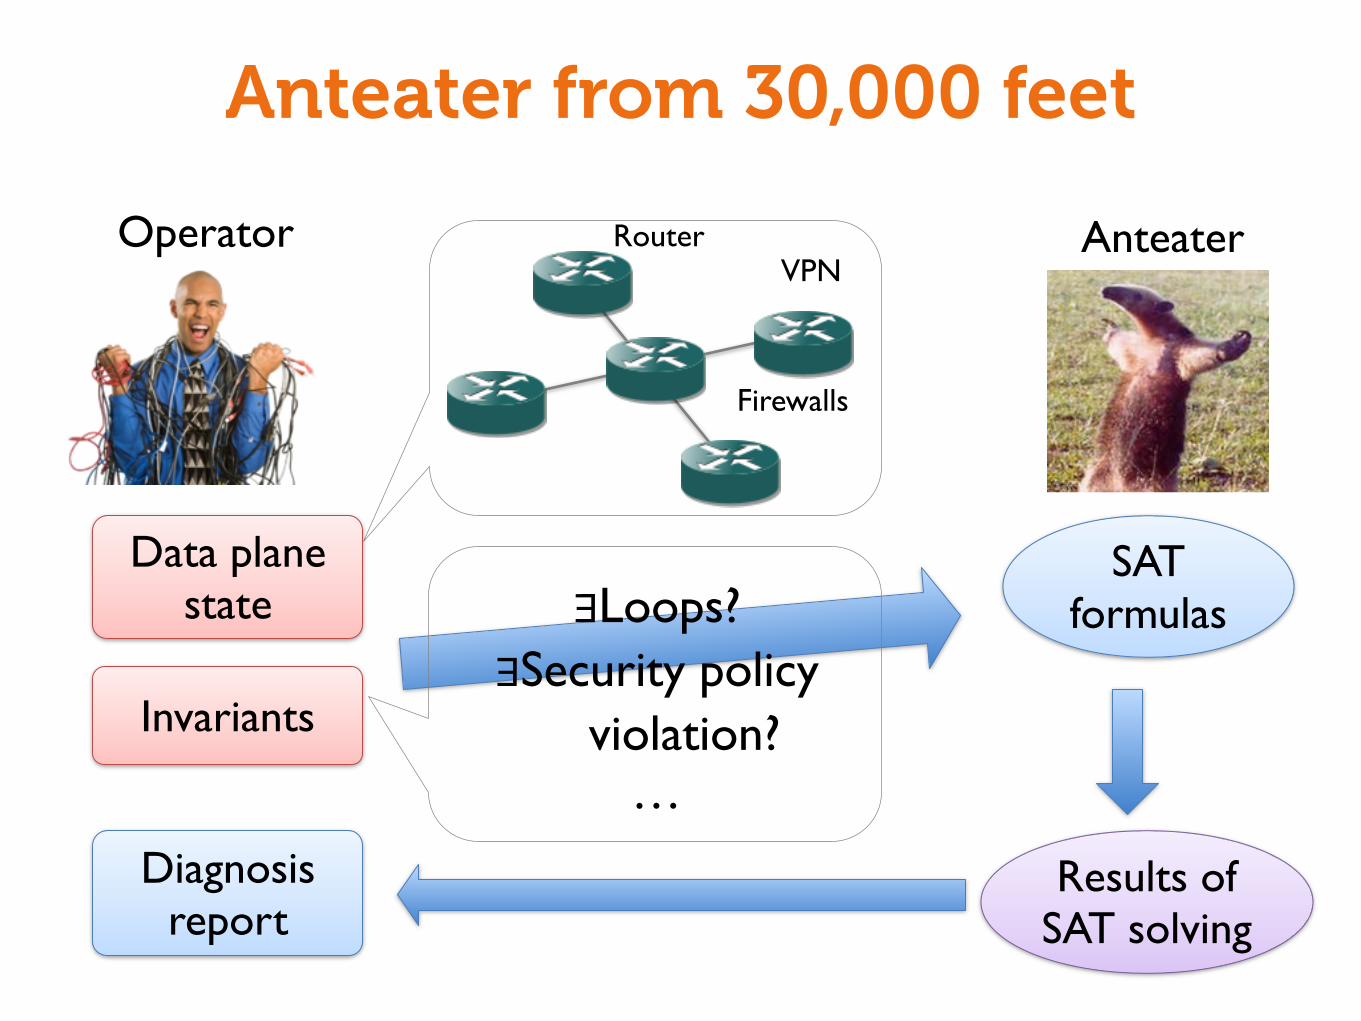
Anteater from 30,000 feet
Diagnosis report
Invariants
Data plane state
SAT formulas
Results of SAT solving
Operator AnteaterRouter
Firewalls
VPN
∃Loops?∃Security policy
violation?…
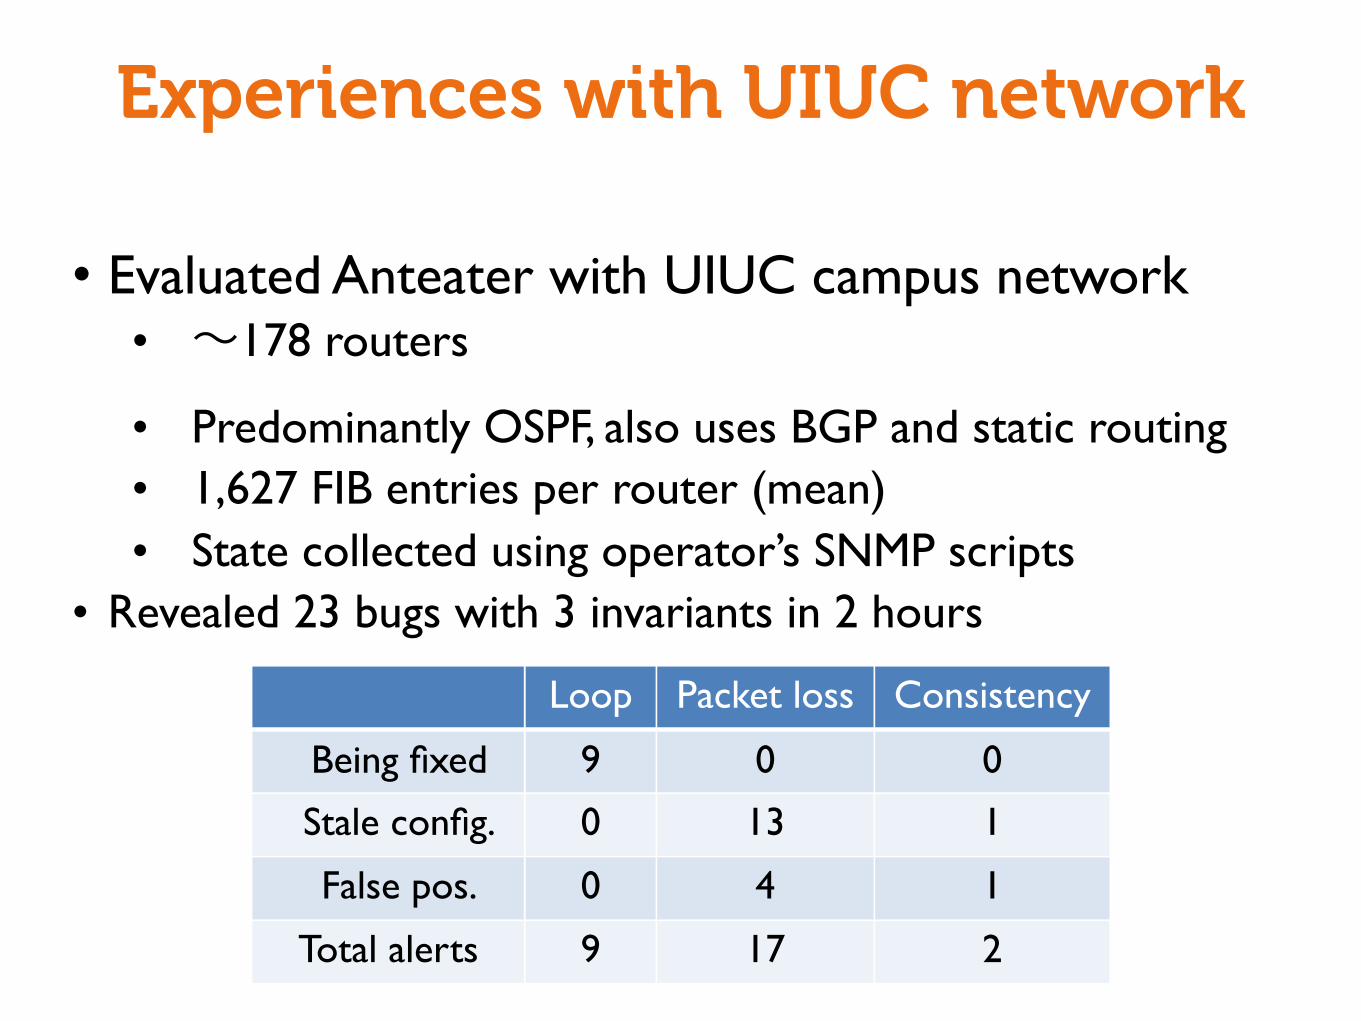
Experiences with UIUC network
• Evaluated Anteater with UIUC campus network• ~178 routers
• Predominantly OSPF, also uses BGP and static routing• 1,627 FIB entries per router (mean)• State collected using operator’s SNMP scripts
• Revealed 23 bugs with 3 invariants in 2 hours
Loop Packet loss Consistency
Being fixed 9 0 0
Stale config. 0 13 1
False pos. 0 4 1
Total alerts 9 17 2
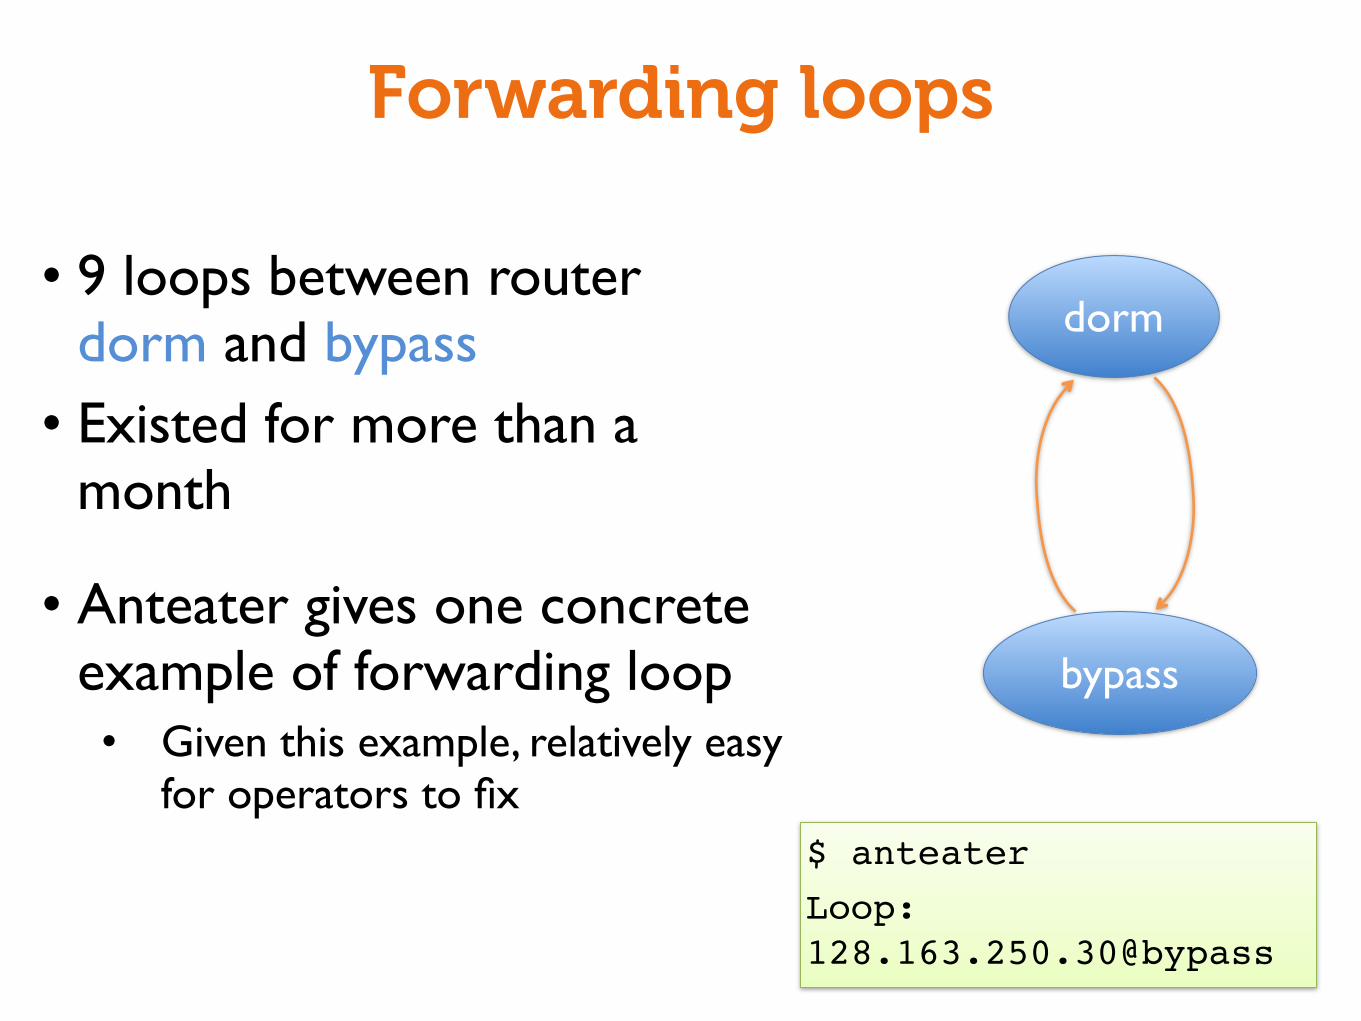
Forwarding loops
• 9 loops between router dorm and bypass• Existed for more than a
month
• Anteater gives one concrete example of forwarding loop• Given this example, relatively easy
for operators to fix
dorm
bypass
$ anteater Loop: 128.163.250.30@bypass
Backbone
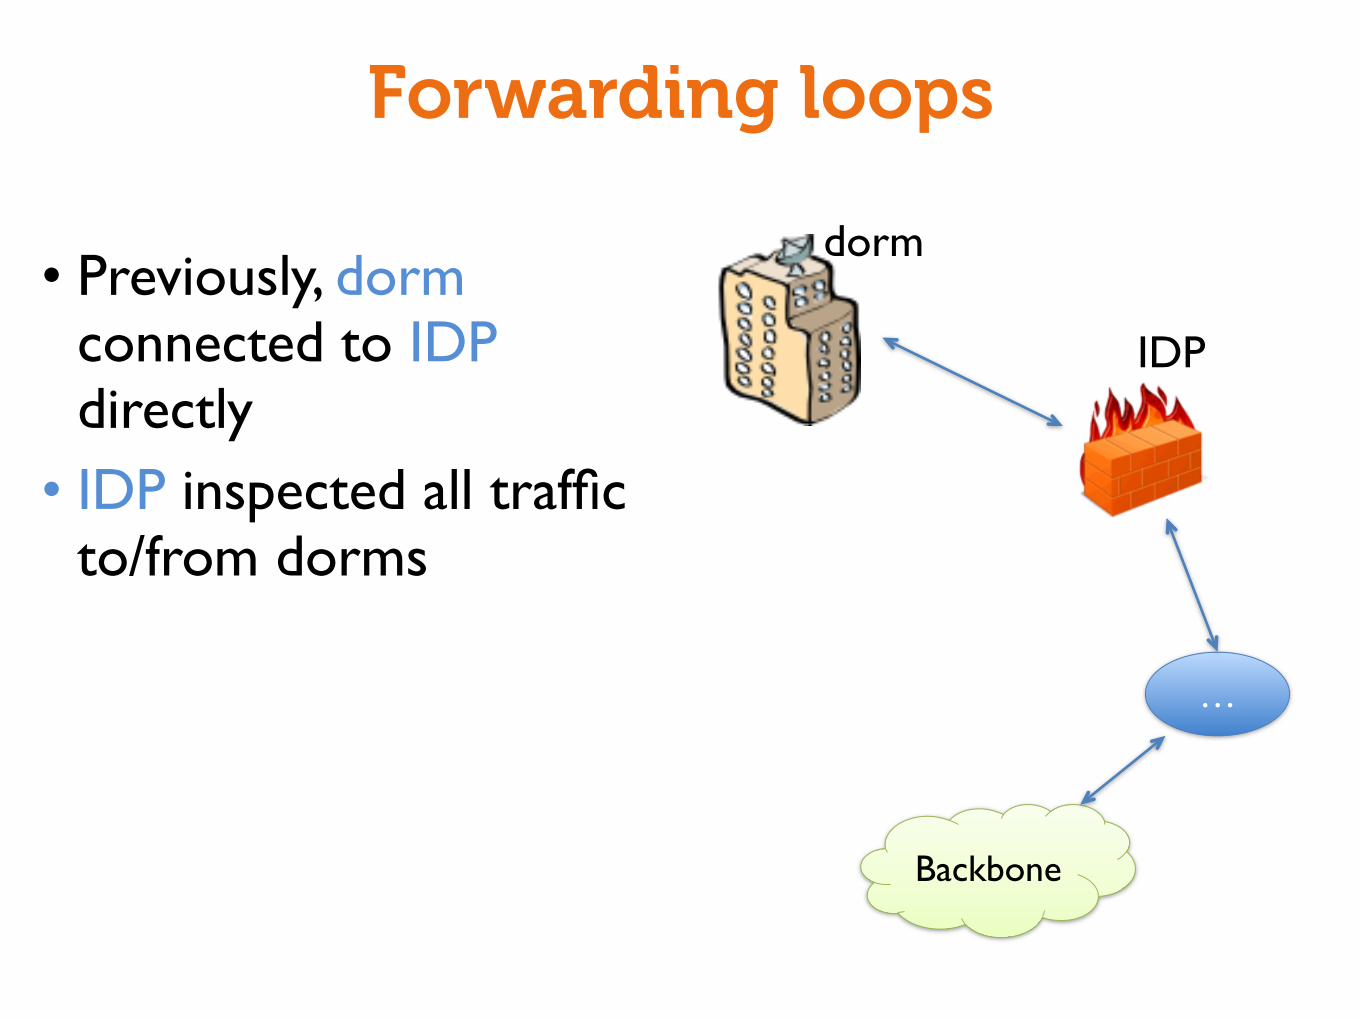
Forwarding loops
• Previously, dorm connected to IDP directly• IDP inspected all traffic
to/from dorms
…
dorm
IDP
Backbone
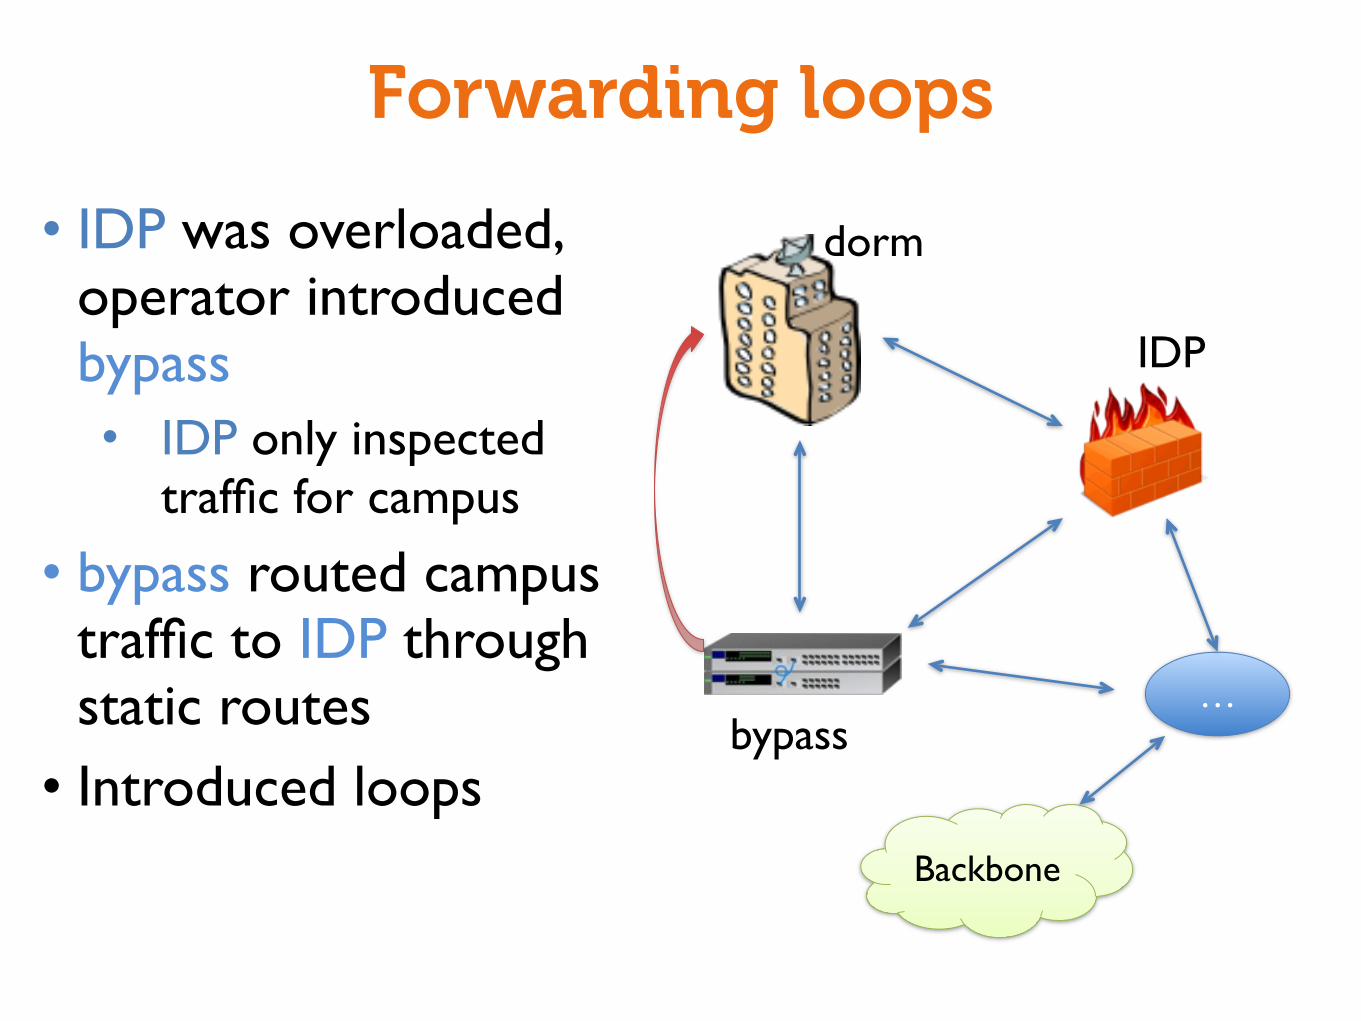
Forwarding loops
• IDP was overloaded, operator introduced bypass• IDP only inspected
traffic for campus
• bypass routed campus traffic to IDP through static routes• Introduced loops
…
dorm
IDP
bypass
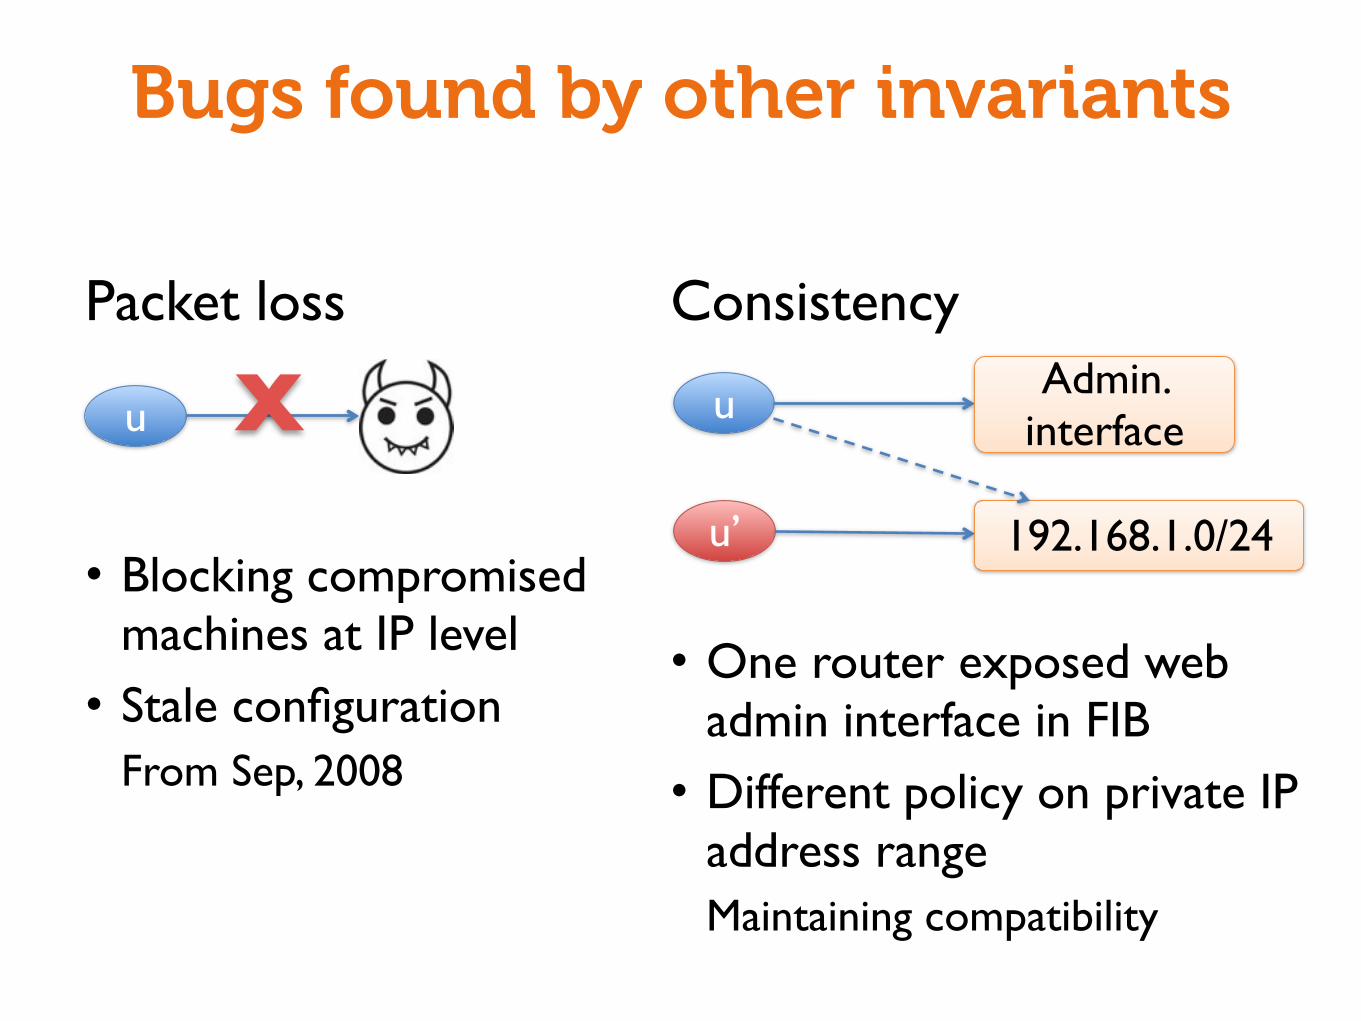
Bugs found by other invariants
u X u
u’
Admin. interface
192.168.1.0/24
Packet loss
• Blocking compromised machines at IP level• Stale configuration
From Sep, 2008
Consistency
• One router exposed web admin interface in FIB• Different policy on private IP
address rangeMaintaining compatibility
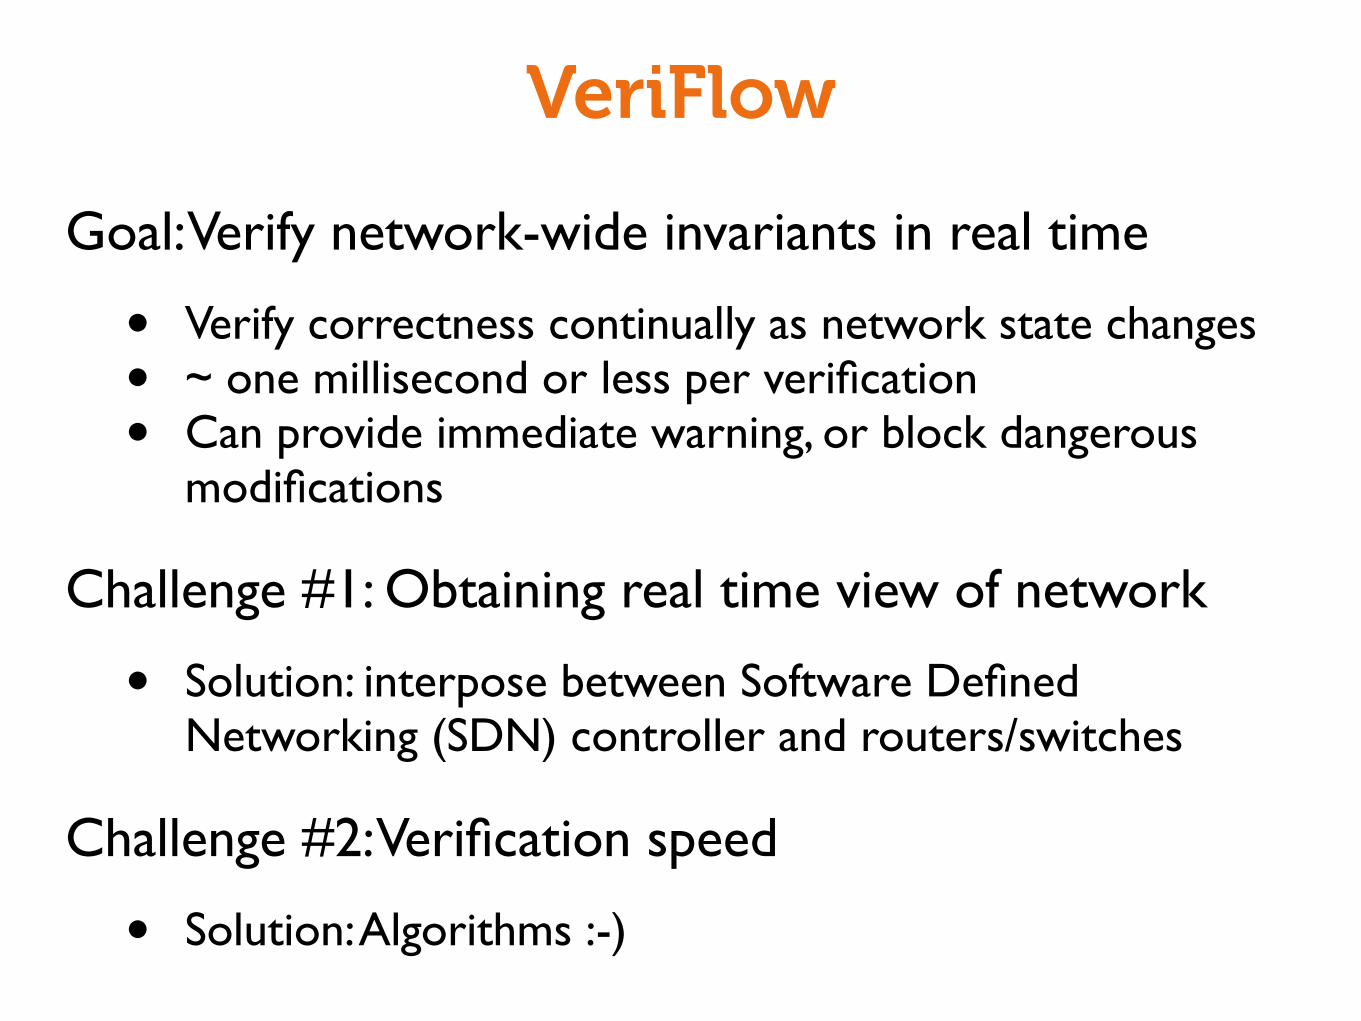
VeriFlow
Goal: Verify network-wide invariants in real time
• Verify correctness continually as network state changes• ~ one millisecond or less per verification• Can provide immediate warning, or block dangerous
modifications
Challenge #1: Obtaining real time view of network
• Solution: interpose between Software Defined Networking (SDN) controller and routers/switches
Challenge #2: Verification speed
• Solution: Algorithms :-)

Software defined networking
Thin, standard interfaceto data plane(e.g. OpenFlow)
Logically centralizedcontroller
softwareabstractions
app app
VeriFlow architecture
Thin, standard interfaceto data plane(e.g. OpenFlow)
Logically centralizedcontroller
softwareabstractions
app app
VeriFlow
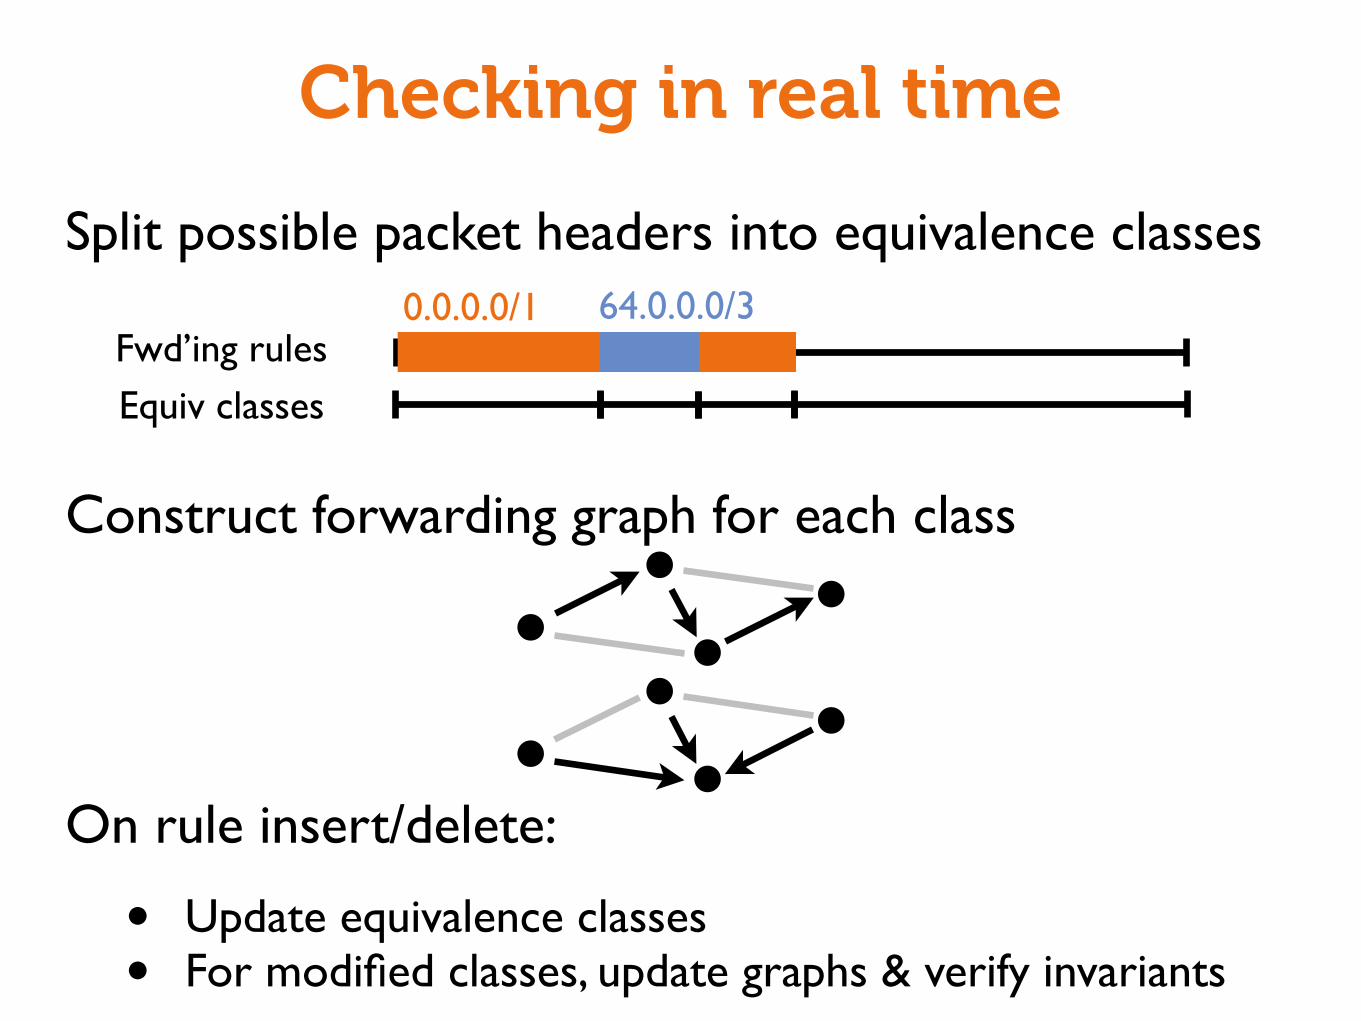
Split possible packet headers into equivalence classes
Construct forwarding graph for each class
On rule insert/delete:
• Update equivalence classes• For modified classes, update graphs & verify invariants
Fwd’ing rules
Checking in real time
Equiv classes
0.0.0.0/1 64.0.0.0/3
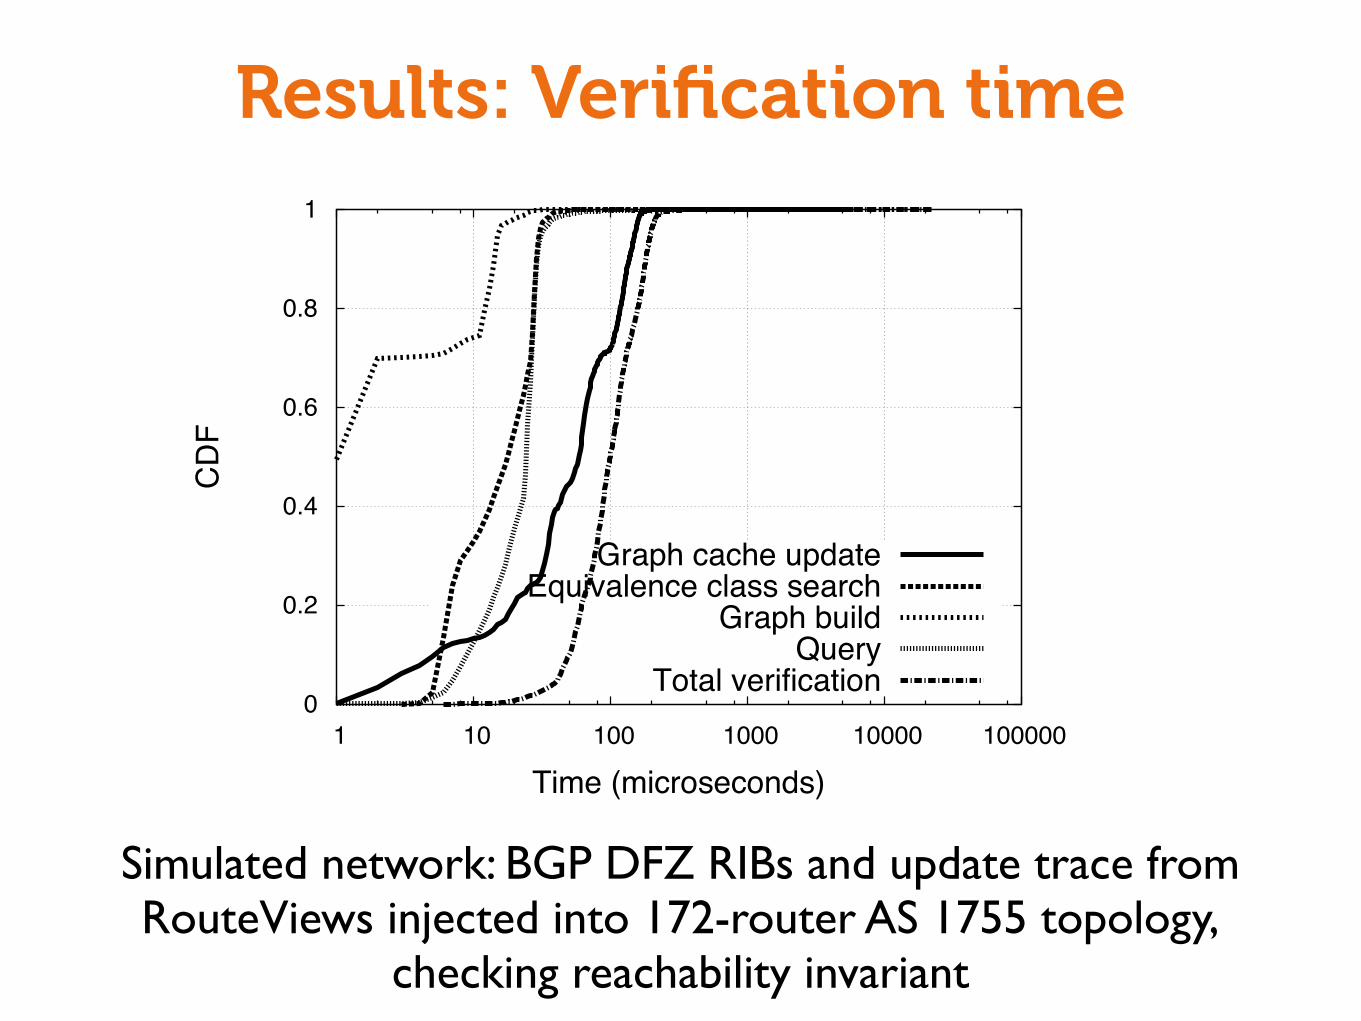
Results: Verification time
0
0.2
0.4
0.6
0.8
1
1 10 100 1000 10000 100000
CD
F
Time (microseconds)
Graph cache updateEquivalence class search
Graph buildQuery
Total verification
Simulated network: BGP DFZ RIBs and update trace from RouteViews injected into 172-router AS 1755 topology,
checking reachability invariant
Closing Thoughts:Why Networking Research?
0E
150E
140E
130E
120E
110E
100EO
C
E
A
N
I
A
A
S
IA
RK,lu
oeS
HT,
kokg
nGS
,ero
pag
DI,a
trak
aJ
NC,
gniji
eBWT
,iepia
T
PJ,oyk
oT
UA,yen
dyS
UR,k
otsovi
dalV
[Huffaker, claffy, Hyun, Luckie, Lyu, CAIDA]
010W
20W
30W
40W
50W
60W
70W
80W90W
100W
110W
120W
130W
140W
150W
160W
170W
180E/W
170E
160E
150E
140E
130E
120E
110E
100E90E
80E
70E
60E
50E
40E
30E
20E
10E
O
C
E
A
N
I
AA
FR
IC
A
S
O
U
T
H
AM
ER
IC
A
A
S
IA
EU
RO
PE
NO
RTH AME
RI
CA
Brussels, BE
Oslo, NO
RK,lu
oeS
SU,ululonoH
SU,re
To
SU,ogei
Dna
SU,esoJnaS
SU,xineo
SU,not
C
Ottaw
Was
Boston
Buenos Aires, A
Rio de Janeiro, BR
London, UKParis, FR
Berlin, DE
Vienna, ATStockholm
, SESofi
a, BGHel
sinki, FIPre
toria, ZA
Kiev, UA
Warsaw,
PL
Ankara, TR
Tel Aviv, IL
Moscow,RU
AbuDhabi,AEBombay,IN
Delhi, IN
HT,
kokg
naB
GS,e
ropa
gniS
DI,a
trak
aJ
NC,
gniji
eBWT
,iepia
T
PJ,oyk
oT
UA,yen
dyS
Frankfurt, DE
UR,k
otsovi
dalV
Alges, PT
Dublin, IE
1299(TeliaNet)1299(TeliaNet) 702(MCI)702(MCI)
10026(Asia Netcom)10026(Asia Netcom)
4755(TATACOMM)4755(TATACOMM)
8395(COMSTAR)8395(COMSTAR)
2516(KDDI)2516(KDDI)
7575(AARNET)7575(AARNET)
38809(NXGNET)38809(NXGNET) 3904 (Hutchison)9304 (Hutchison)
7714(TelstraClear)7714(TelstraClear)
20485(JSC)20485(JSC)
1273(CW)1273(CW)5459(London IX)5459(London IX)
1239(Sprint)1239(Sprint) 12989(HWNG)12989(HWNG)3549(Global Crossing)3549(Global Crossing)
4320(Embratel)4320(Embratel)
577(Bell Canada)577(Bell Canada)7843(Road Runner)7843(Road Runner)
2828(XOXO)2828(XOXO)3561(Savvis)3561(Savvis)
701(UUNET)701(UUNET)3356(Level 3)3356(Level 3)
6677(ICENET)6677(ICENET)
3320(Deutsche Telekom)3320(Deutsche Telekom) 8928(Interoute)8928(Interoute)
2914(NTT)2914(NTT)
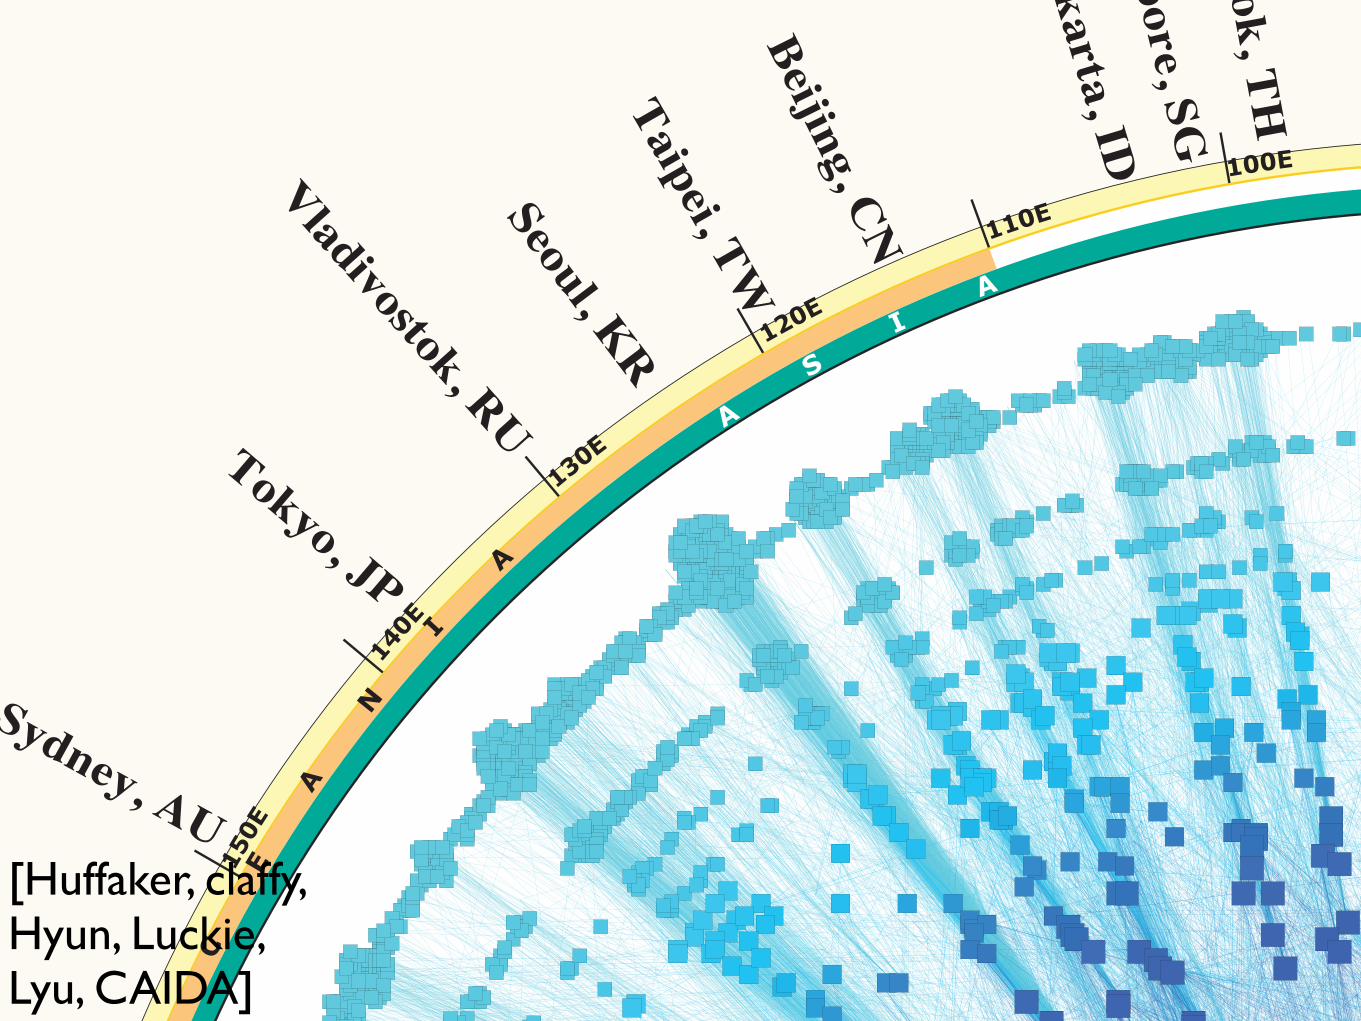
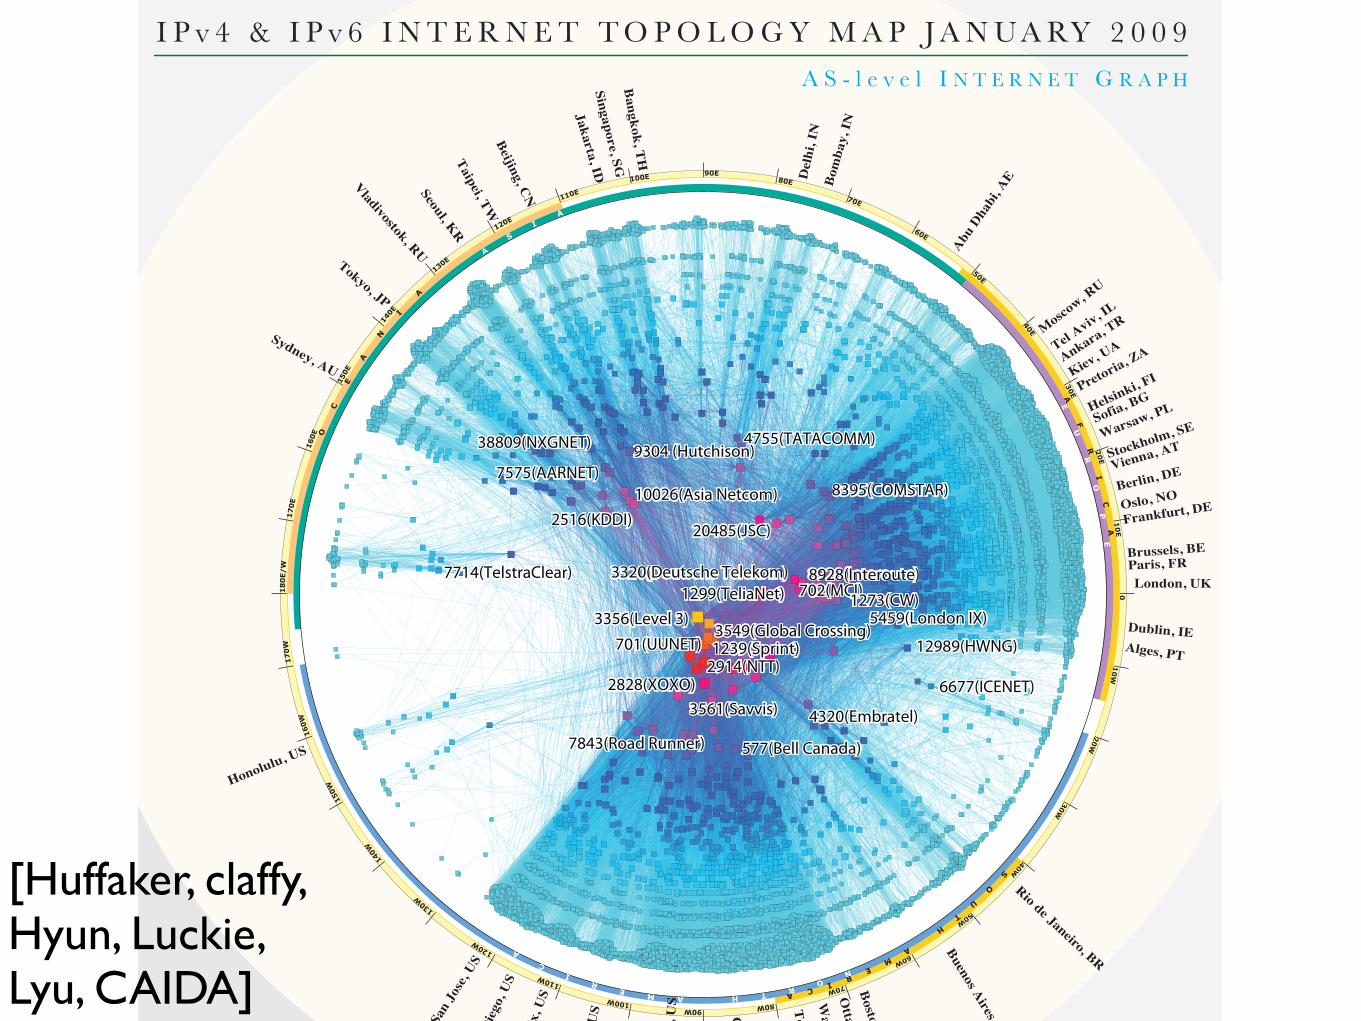
A S - l e v e l I N T E R N E T G R A P H
I P v 4 & I P v 6 I N T E R N E T T O P O L O G Y M A P J A N U A RY 2 0 0 9
[Huffaker, claffy, Hyun, Luckie, Lyu, CAIDA]

FridayJune 12
SaturdayJune 13
SundayJune 14
[James Cowie,Renesys Corporation]
Routing instabilities and outages in Iranian prefixesfollowing 2009 presidential electionA
ffect
ed p
refix
es
[Earl Zmijewski, Renesys Corporation]
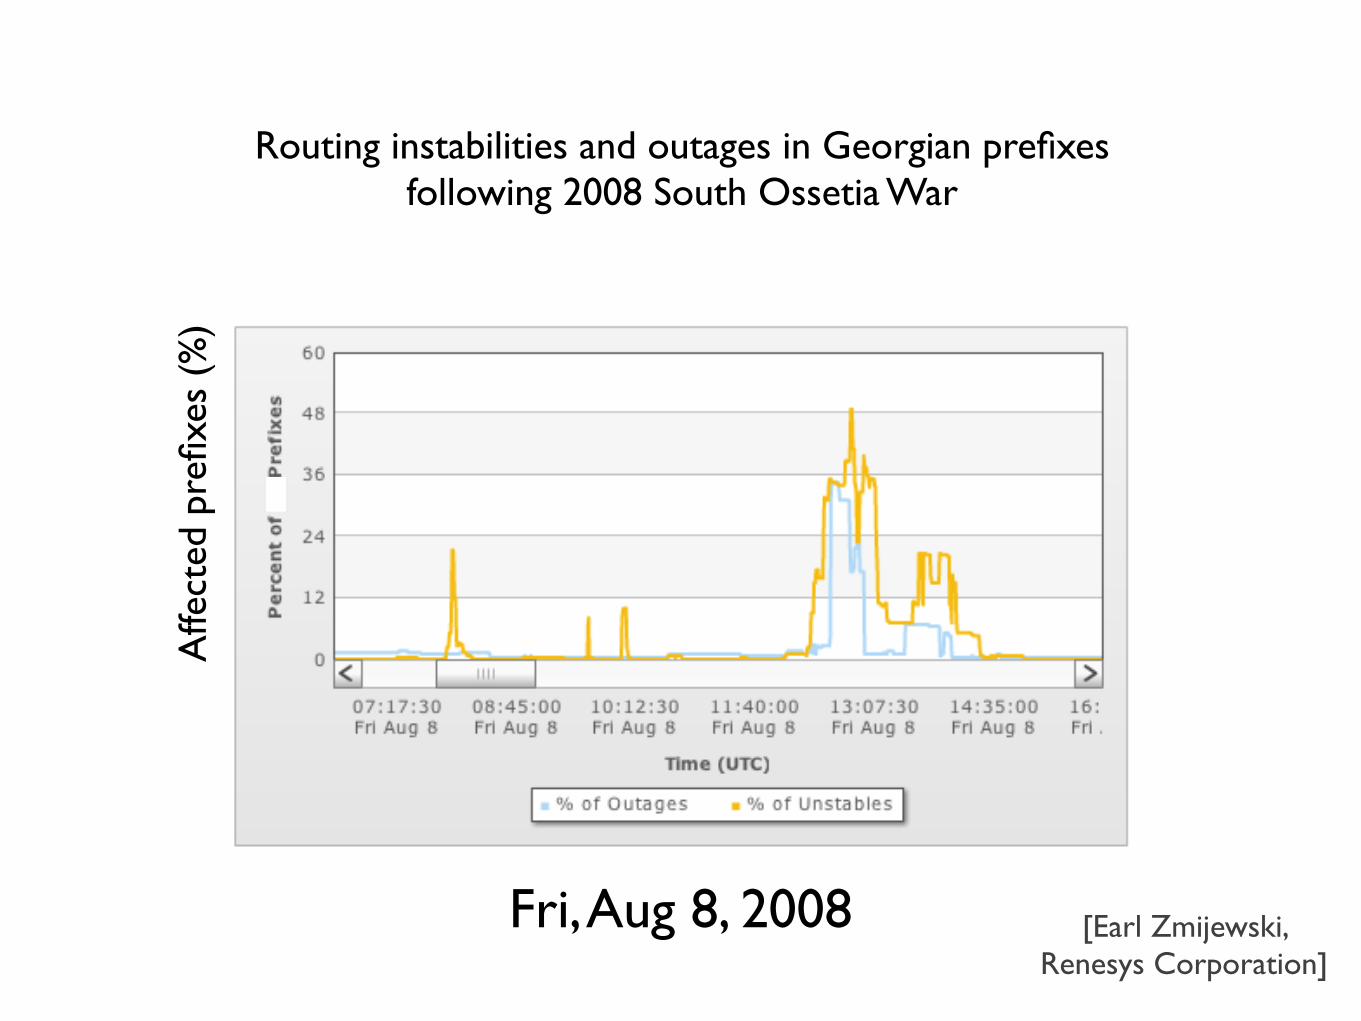
Routing instabilities and outages in Georgian prefixesfollowing 2008 South Ossetia War
Affe
cted
pre
fixes
(%
)
Fri, Aug 8, 2008
1. It’s relevant
Majority of new developments in computer systems are dependent on networking
Far-reaching impacts beyond systems & networking
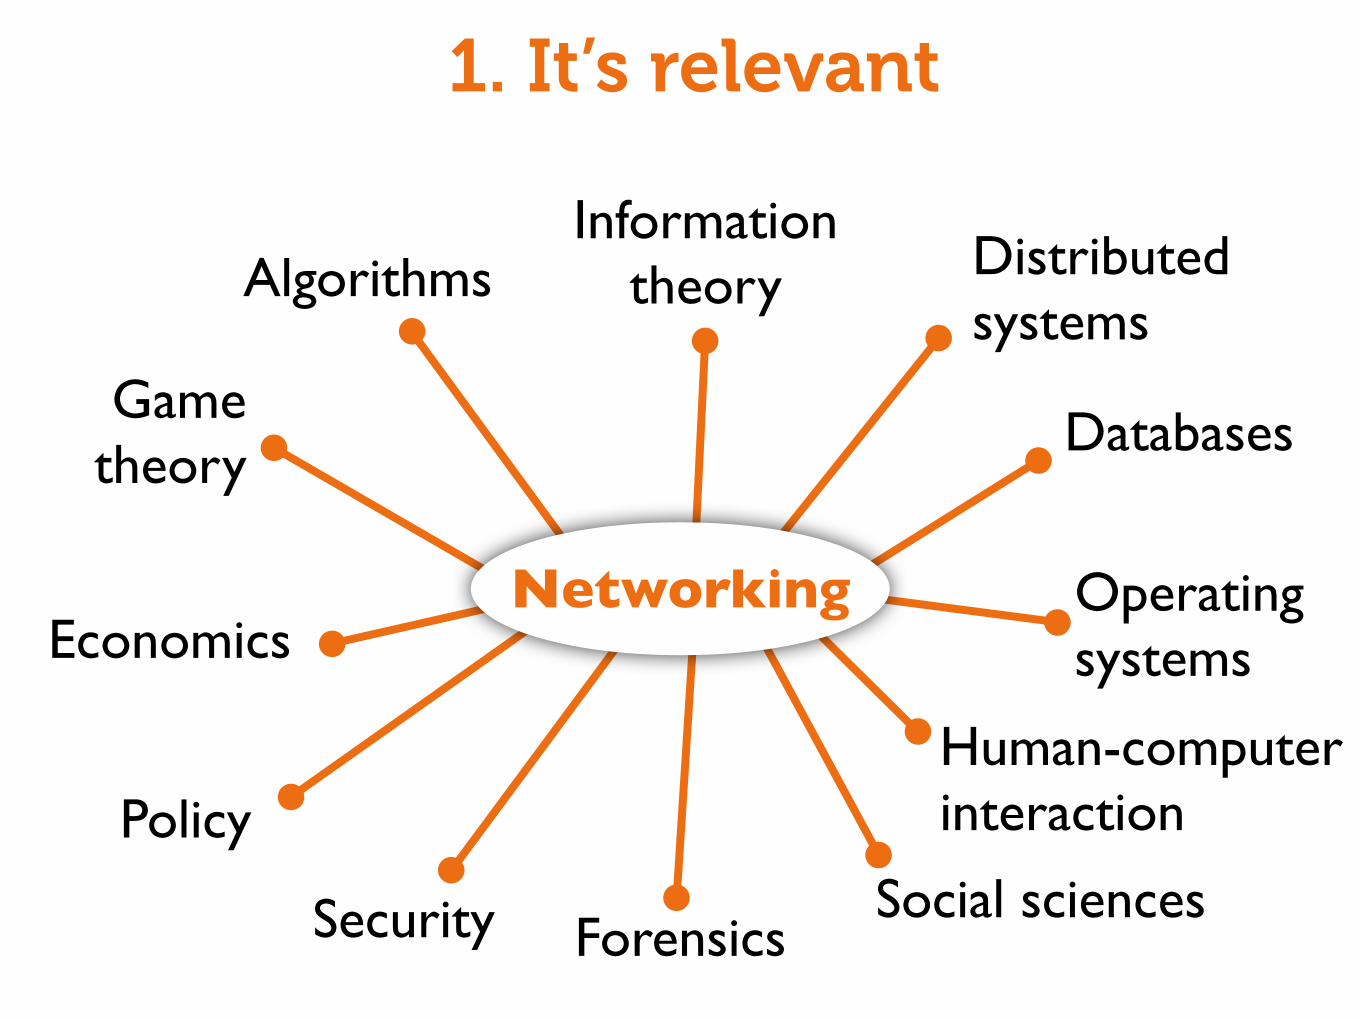
1. It’s relevant
AlgorithmsInformation
theory
Gametheory
Economics
Policy
Security Forensics
Distributedsystems
Databases
Human-computerinteraction
Operatingsystems
Social sciences
Networking
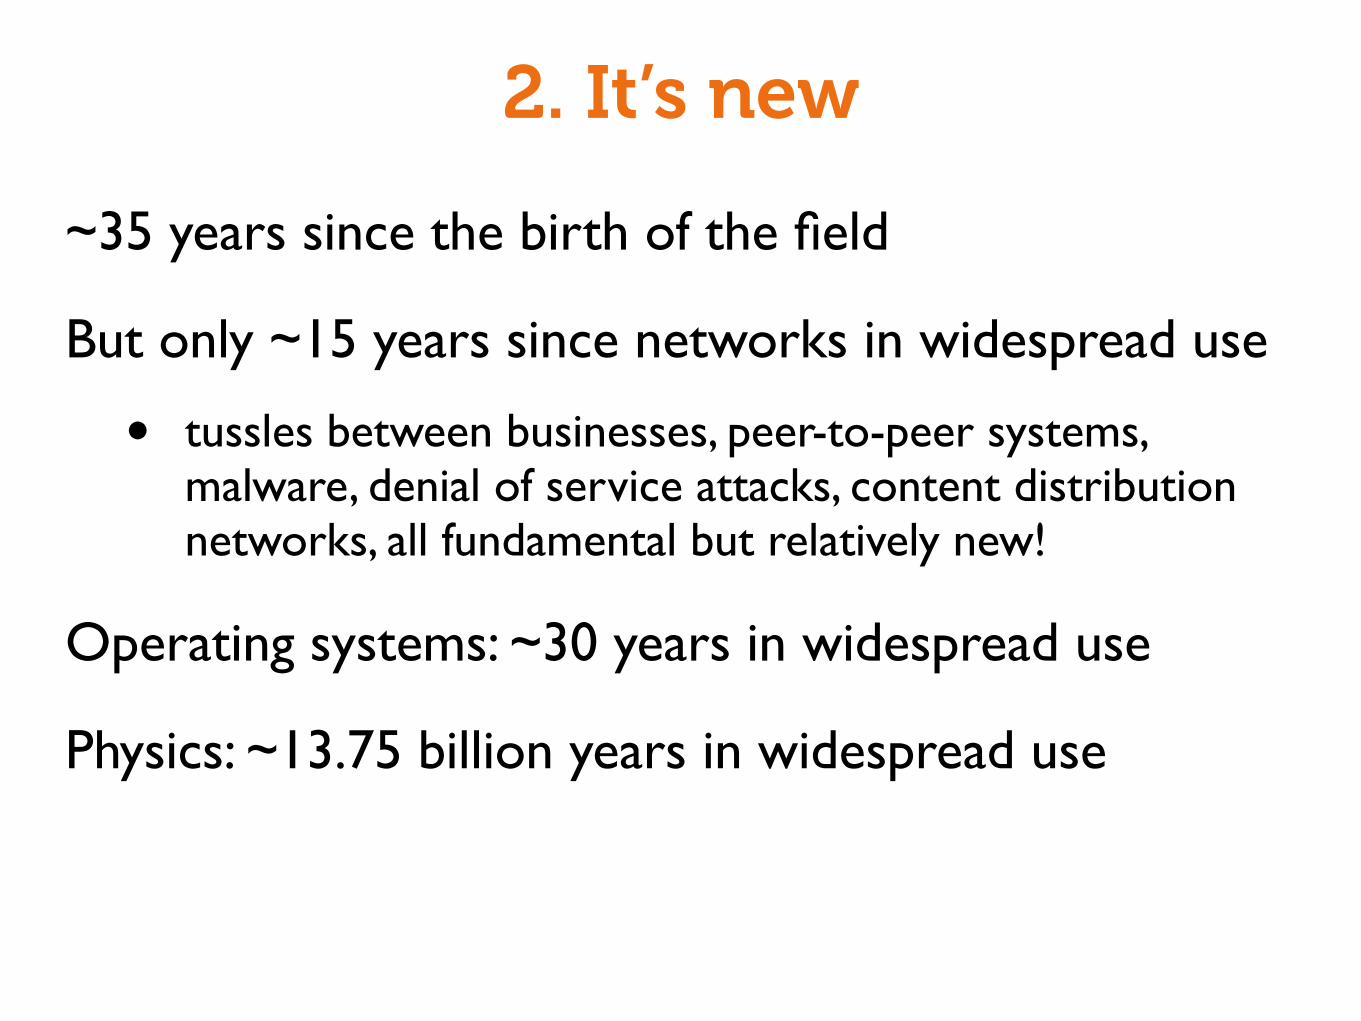
2. It’s new
~35 years since the birth of the field
But only ~15 years since networks in widespread use
• tussles between businesses, peer-to-peer systems, malware, denial of service attacks, content distribution networks, all fundamental but relatively new!
Operating systems: ~30 years in widespread use
Physics: ~13.75 billion years in widespread use
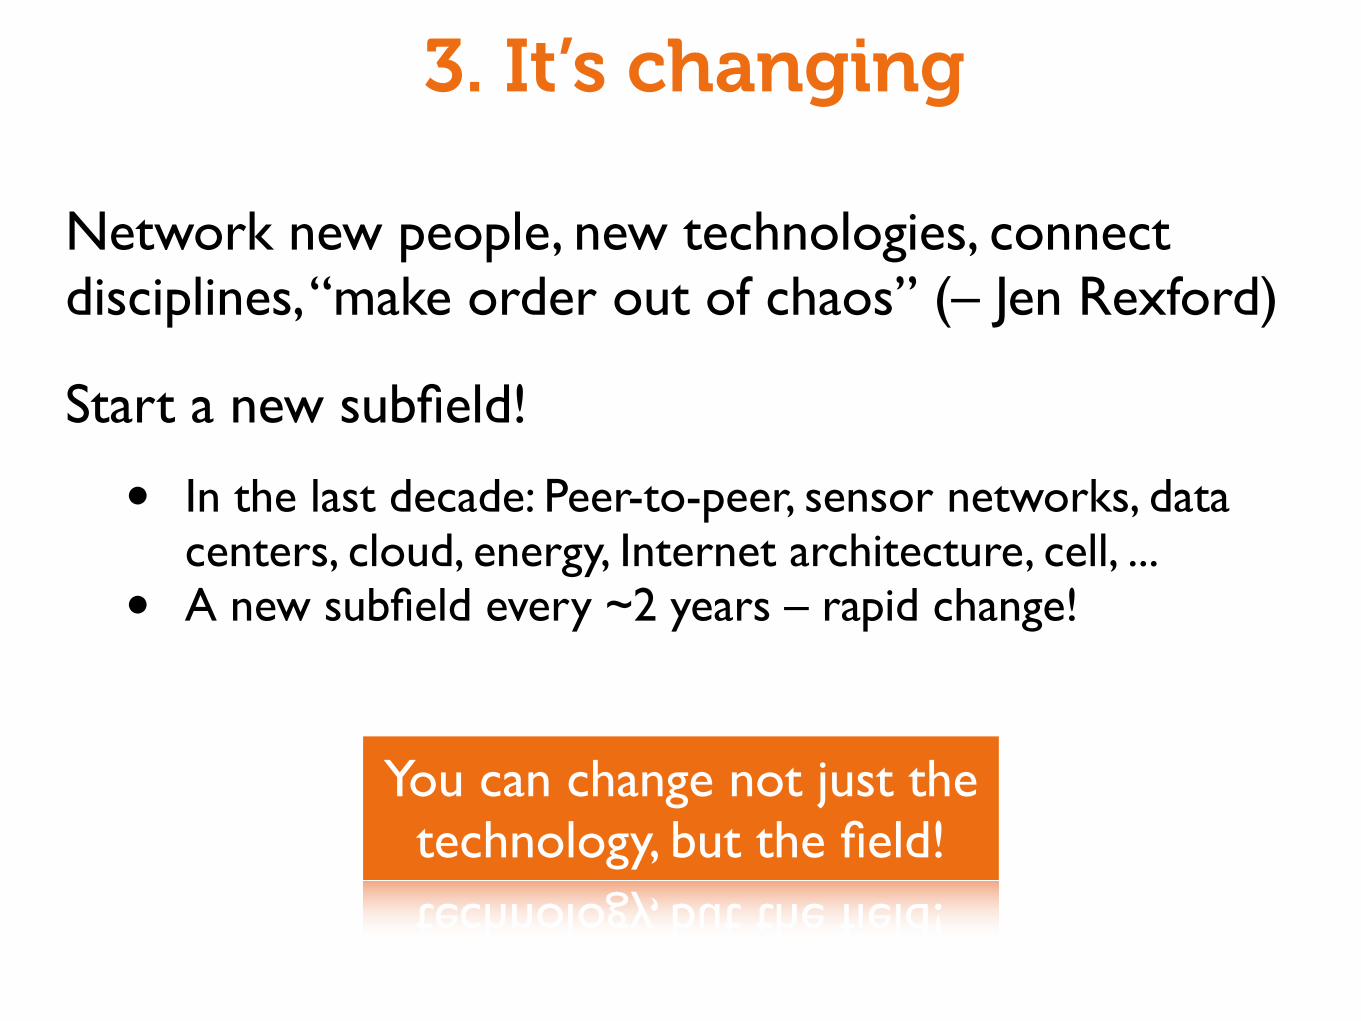
Network new people, new technologies, connect disciplines, “make order out of chaos” (– Jen Rexford)
Start a new subfield!
• In the last decade: Peer-to-peer, sensor networks, data centers, cloud, energy, Internet architecture, cell, ...• A new subfield every ~2 years – rapid change!
3. It’s changing
You can change not just the technology, but the field!
3. It’s changing
About 2/3 of the world not yet online!
–– The London Anecdotes,1848
“
”
It is anticipated that the whole of the populous parts of the United States will, within two or three years, be covered with net-work like a spider's web.

What it all adds up to...
You have the opportunity for big impact!

![HNC Computing - SQA · 5 HND Computing: Networking (based on HND Computer Networking & Internetworking). Although this document relates [only] to the HNC Computing award, reference](https://img.pdfslide.net/doc/110x75/5f0279fe7e708231d40473bd/hnc-computing-sqa-5-hnd-computing-networking-based-on-hnd-computer-networking.jpg)