Embed Size (px)
Citation preview
msci.com ©2013. All rights reserved. msci.com ©2012. All rights reserved. msci.com msci.com
Current Global Equity Market Dynamics and the Use of Factor Portfolios for Hedging Effectiveness Déborah Berebichez, Ph.D.
February 2013
msci.com ©2013. All rights reserved. 2 msci.com
Outline
I. Overview of Barra’s Global Equity Model
II. Is Buying an Index Really a Country bet?
III. Greece Case Study
IV. Hedging out Undesired Exposures with a Factor-Mimicking Portfolio
V. Rebalancing Frequency

msci.com ©2013. All rights reserved. 3 msci.com
I. Overview of our Global Equity Model
msci.com ©2013. All rights reserved.
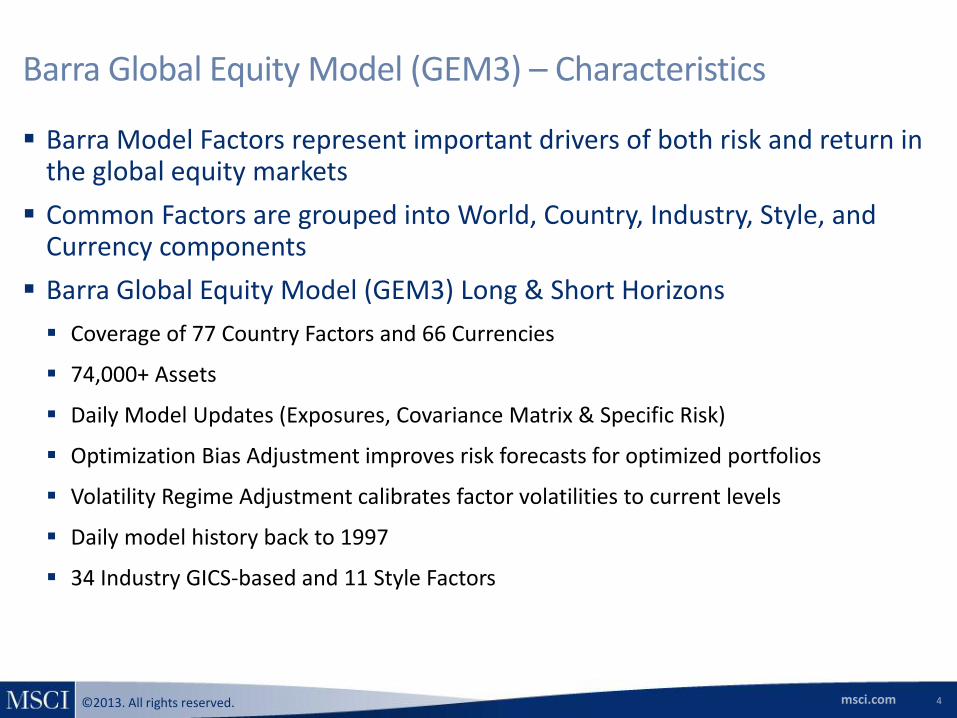
Barra Global Equity Model (GEM3) – Characteristics
Barra Model Factors represent important drivers of both risk and return in the global equity markets
Common Factors are grouped into World, Country, Industry, Style, and Currency components
Barra Global Equity Model (GEM3) Long & Short Horizons
Coverage of 77 Country Factors and 66 Currencies
74,000+ Assets
Daily Model Updates (Exposures, Covariance Matrix & Specific Risk)
Optimization Bias Adjustment improves risk forecasts for optimized portfolios
Volatility Regime Adjustment calibrates factor volatilities to current levels
Daily model history back to 1997
34 Industry GICS-based and 11 Style Factors
4
msci.com ©2013. All rights reserved.
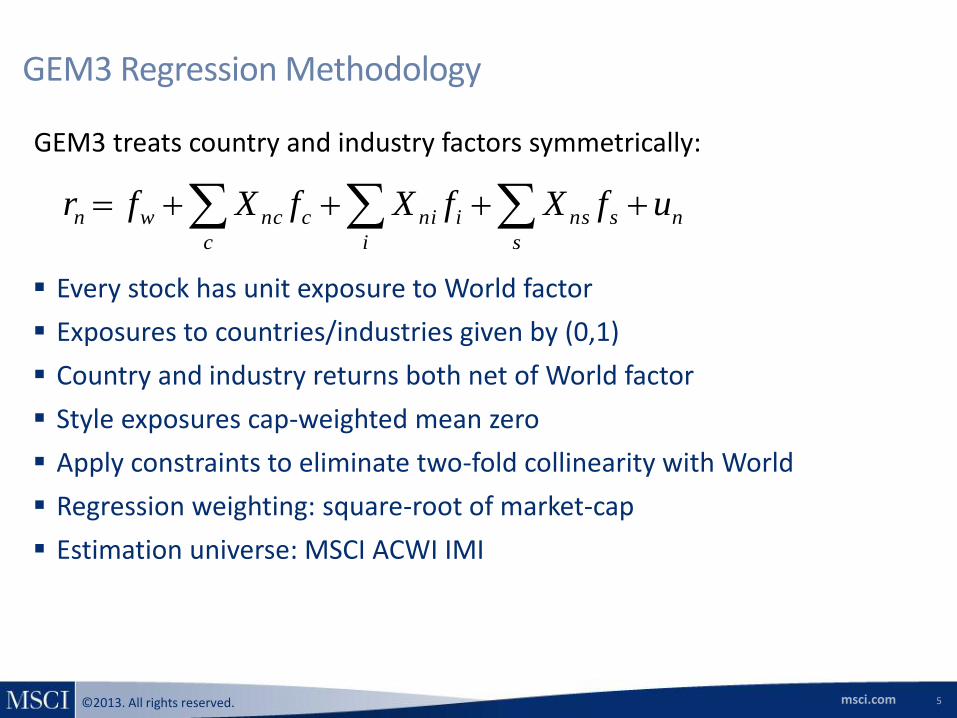
GEM3 Regression Methodology
Every stock has unit exposure to World factor
Exposures to countries/industries given by (0,1)
Country and industry returns both net of World factor
Style exposures cap-weighted mean zero
Apply constraints to eliminate two-fold collinearity with World
Regression weighting: square-root of market-cap
Estimation universe: MSCI ACWI IMI
n
s
sns
i
ini
c
cncwn ufXfXfXfr
GEM3 treats country and industry factors symmetrically:
5
msci.com ©2013. All rights reserved.
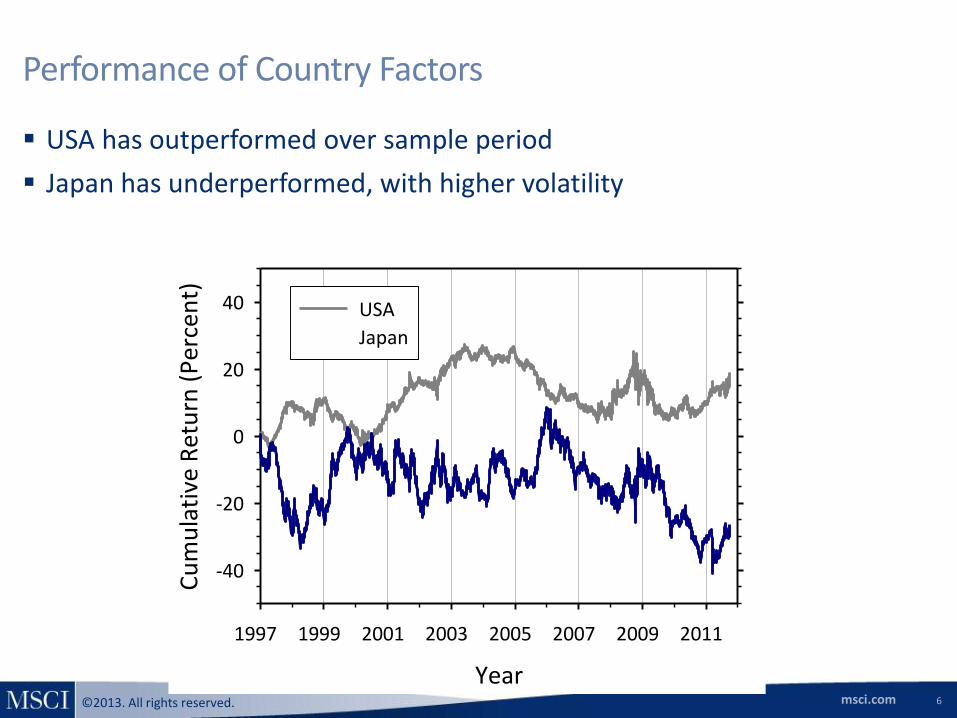
Performance of Country Factors
USA has outperformed over sample period
Japan has underperformed, with higher volatility
6
Year
1997 1999 2001 2003 2005 2007 2009 2011
Cu
mu
lati
ve R
etu
rn (
Per
cen
t)
-40
-20
0
20
40 USA
Japan
msci.com ©2013. All rights reserved.
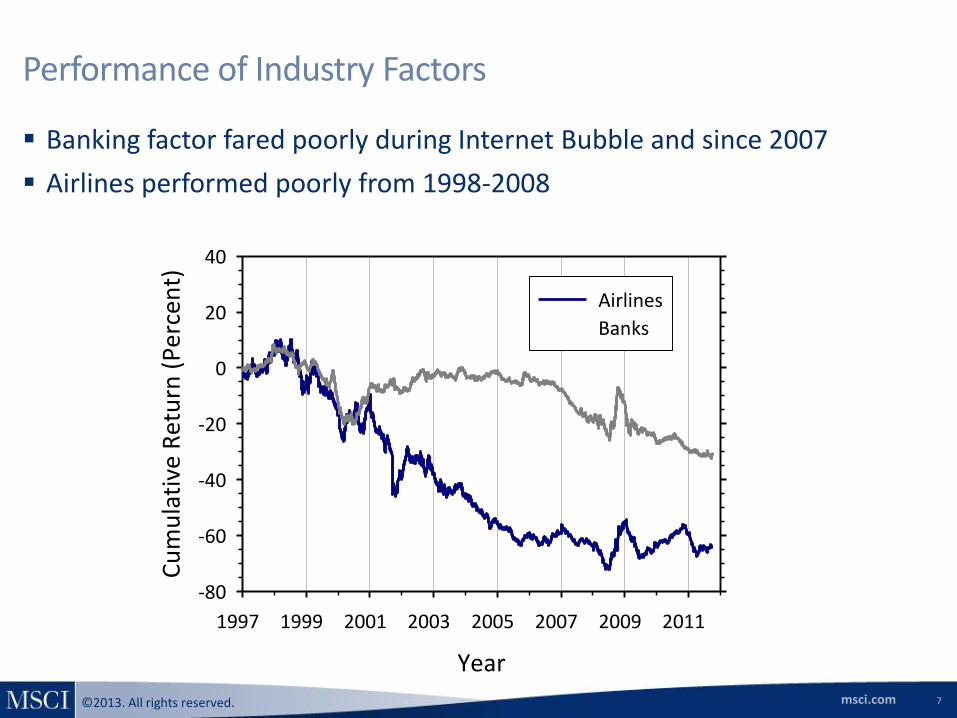
Performance of Industry Factors
Banking factor fared poorly during Internet Bubble and since 2007
Airlines performed poorly from 1998-2008
7
Year
1997 1999 2001 2003 2005 2007 2009 2011
Cu
mu
lati
ve R
etu
rn (
Per
cen
t)
-80
-60
-40
-20
0
20
40
Airlines
Banks
msci.com ©2013. All rights reserved.
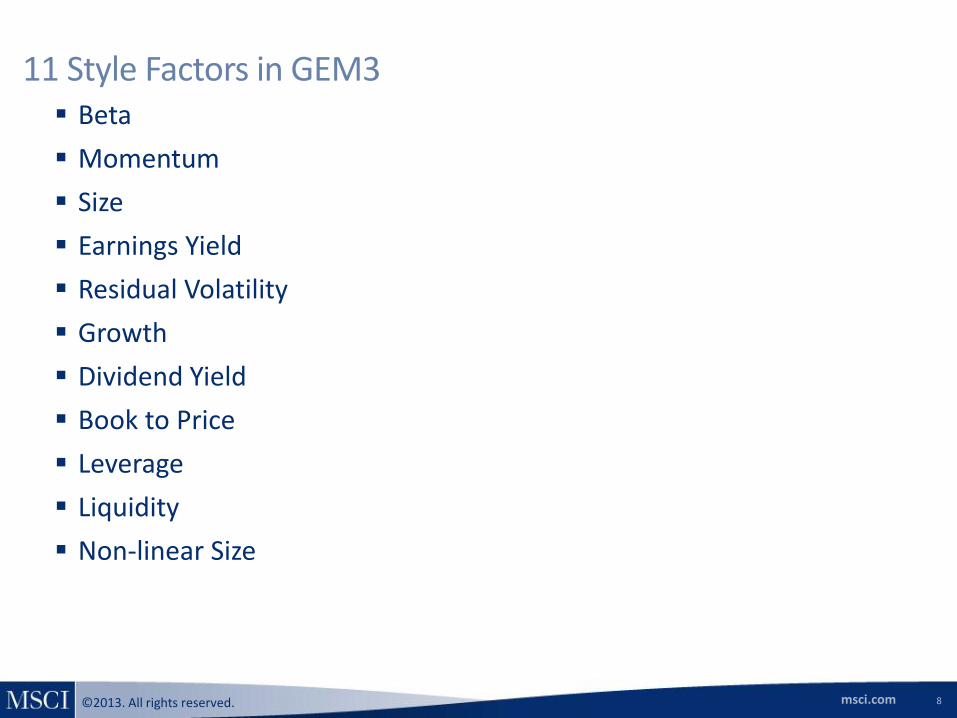
11 Style Factors in GEM3
8
Beta
Momentum
Size
Earnings Yield
Residual Volatility
Growth
Dividend Yield
Book to Price
Leverage
Liquidity
Non-linear Size
msci.com ©2013. All rights reserved.
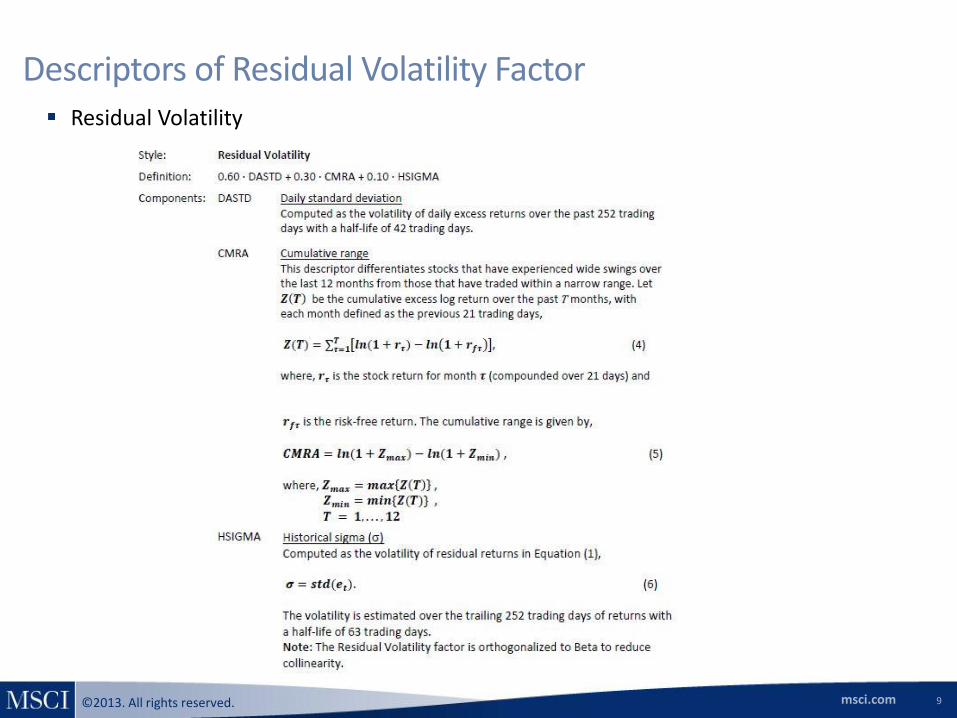
Descriptors of Residual Volatility Factor Residual Volatility
9
msci.com ©2013. All rights reserved.
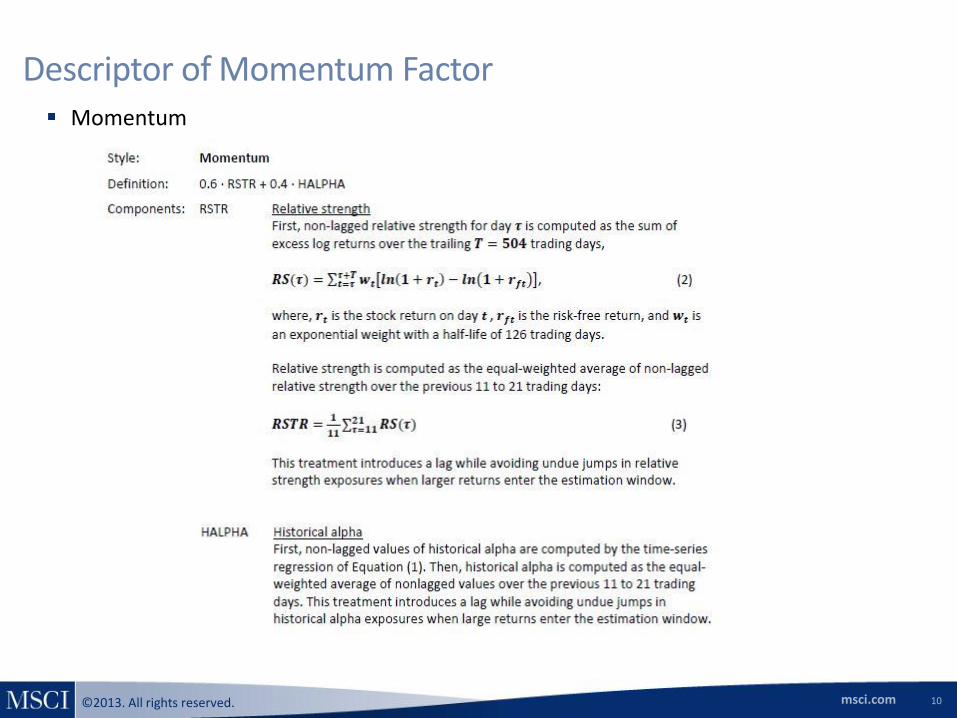
Descriptor of Momentum Factor Momentum
10
msci.com ©2013. All rights reserved.
January 2013 Global Equity Market Watch – Highlights
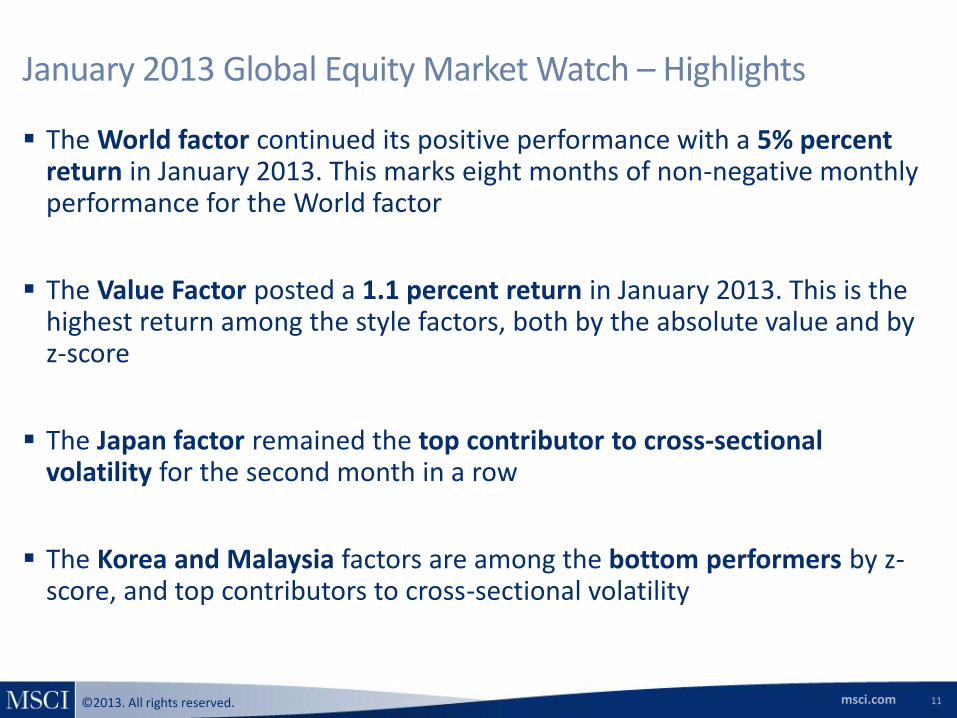
The World factor continued its positive performance with a 5% percent return in January 2013. This marks eight months of non-negative monthly performance for the World factor
The Value Factor posted a 1.1 percent return in January 2013. This is the highest return among the style factors, both by the absolute value and by z-score
The Japan factor remained the top contributor to cross-sectional volatility for the second month in a row
The Korea and Malaysia factors are among the bottom performers by z-score, and top contributors to cross-sectional volatility
11
msci.com ©2013. All rights reserved. 12
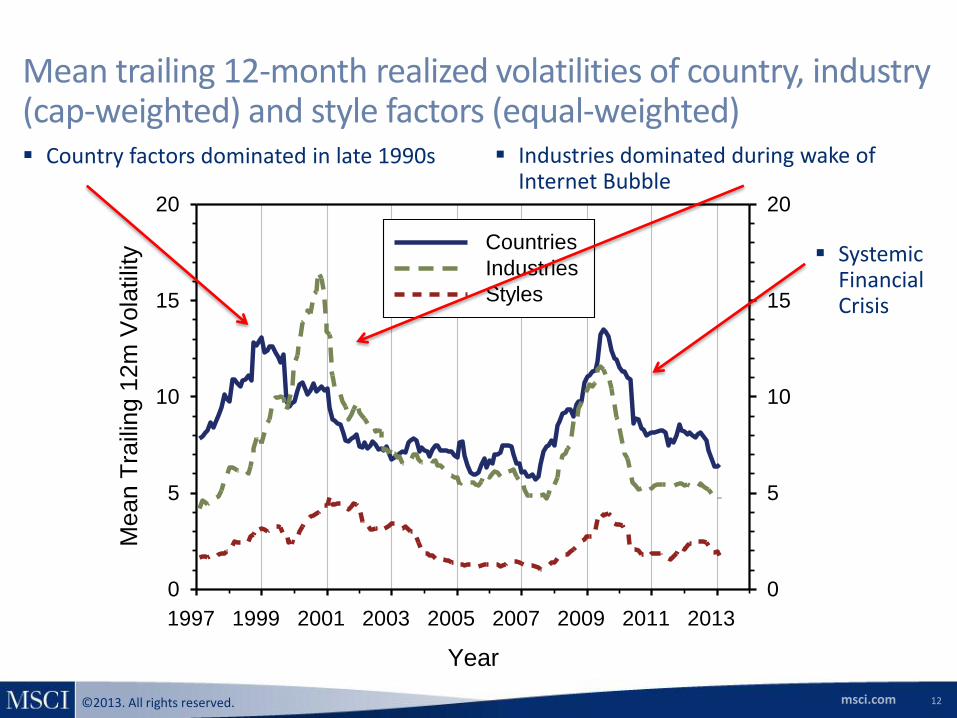
Mean trailing 12-month realized volatilities of country, industry (cap-weighted) and style factors (equal-weighted)
Year
1997 1999 2001 2003 2005 2007 2009 2011 2013
Me
an
Tra
ilin
g 1
2m
Vo
latilit
y
0
5
10
15
20
0
5
10
15
20
Countries
Industries
Styles
Country factors dominated in late 1990s Industries dominated during wake of Internet Bubble
Systemic Financial Crisis

msci.com ©2013. All rights reserved. 13 msci.com
II. Is Buying an Index Really a Country Bet?
msci.com ©2013. All rights reserved.
Is Buying an Index Really a Country Bet?
14
When you buy/sell an Index such as MSCI Greece IMI to gain (long or short) exposure to the country Greece, you are not only getting exposure to Greece but to many other style and industry factors
You are getting more (or less) than just the country. The returns (or lack thereof) depend on the exposure to multiple underlying factors
A real country bet like a pure Greece exposure can be achieved in two ways:
Constructing a factor-mimicking Greece portfolio (very high exposure to Greece and very low exposure to every other country, style, industry and the world factor)
Or by hedging out the underlying exposure to all other undesired factors
msci.com ©2013. All rights reserved.
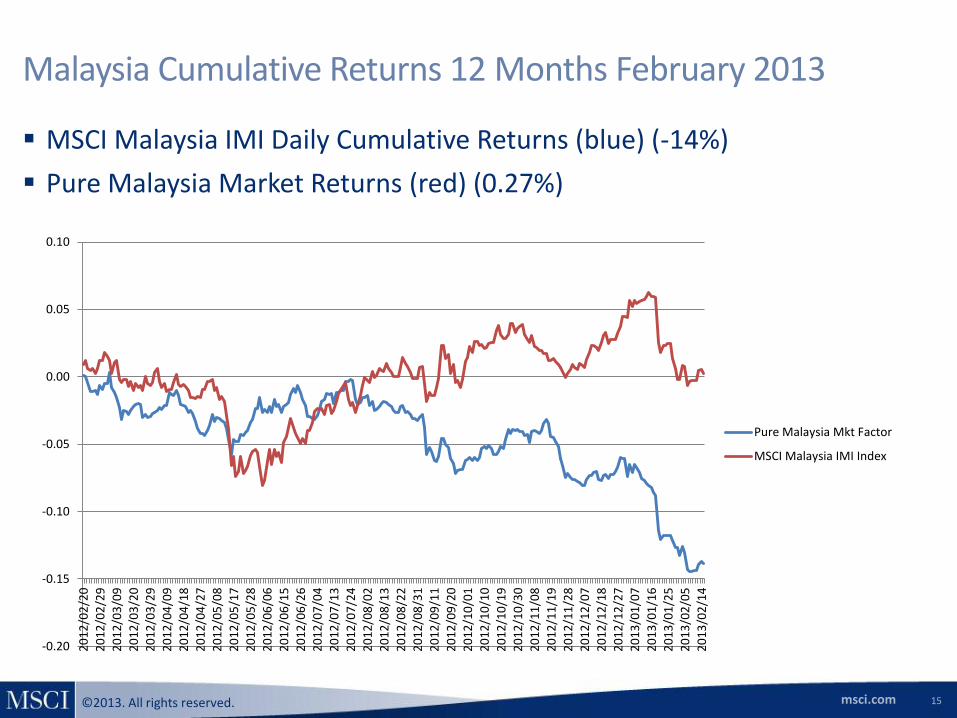
Malaysia Cumulative Returns 12 Months February 2013
MSCI Malaysia IMI Daily Cumulative Returns (blue) (-14%)
Pure Malaysia Market Returns (red) (0.27%)
15
-0.20
-0.15
-0.10
-0.05
0.00
0.05
0.10
20
12
/02
/20
20
12
/02
/29
20
12
/03
/09
20
12
/03
/20
20
12
/03
/29
20
12
/04
/09
20
12
/04
/18
20
12
/04
/27
20
12
/05
/08
20
12
/05
/17
20
12
/05
/28
20
12
/06
/06
20
12
/06
/15
20
12
/06
/26
20
12
/07
/04
20
12
/07
/13
20
12
/07
/24
20
12
/08
/02
20
12
/08
/13
20
12
/08
/22
20
12
/08
/31
20
12
/09
/11
20
12
/09
/20
20
12
/10
/01
20
12
/10
/10
20
12
/10
/19
20
12
/10
/30
20
12
/11
/08
20
12
/11
/19
20
12
/11
/28
20
12
/12
/07
20
12
/12
/18
20
12
/12
/27
20
13
/01
/07
20
13
/01
/16
20
13
/01
/25
20
13
/02
/05
20
13
/02
/14
Pure Malaysia Mkt Factor
MSCI Malaysia IMI Index

msci.com ©2013. All rights reserved. 16 msci.com
III. Greece Case Study

msci.com ©2013. All rights reserved.
Greece Cumulative Returns 12 Months February 2013
MSCI Greece IMI Cumulative Returns (blue) (8.5%)
Pure Greece Country Returns (red) (39%)
17
-60.00%
-40.00%
-20.00%
0.00%
20.00%
40.00%
60.00%
20
12
/02
/20
20
12
/02
/29
20
12
/03
/09
20
12
/03
/20
20
12
/03
/29
20
12
/04
/09
20
12
/04
/18
20
12
/04
/27
20
12
/05
/08
20
12
/05
/17
20
12
/05
/28
20
12
/06
/06
20
12
/06
/15
20
12
/06
/26
20
12
/07
/05
20
12
/07
/16
20
12
/07
/25
20
12
/08
/03
20
12
/08
/14
20
12
/08
/23
20
12
/09
/03
20
12
/09
/12
20
12
/09
/21
20
12
/10
/02
20
12
/10
/11
20
12
/10
/22
20
12
/10
/31
20
12
/11
/09
20
12
/11
/20
20
12
/11
/29
20
12
/12
/10
20
12
/12
/19
20
12
/12
/28
20
13
/01
/08
20
13
/01
/17
20
13
/01
/28
20
13
/02
/06
20
13
/02
/15
MSCI Greece IMI -Cumulative Returns Pure Greece -Cumulative Returns
msci.com ©2013. All rights reserved.
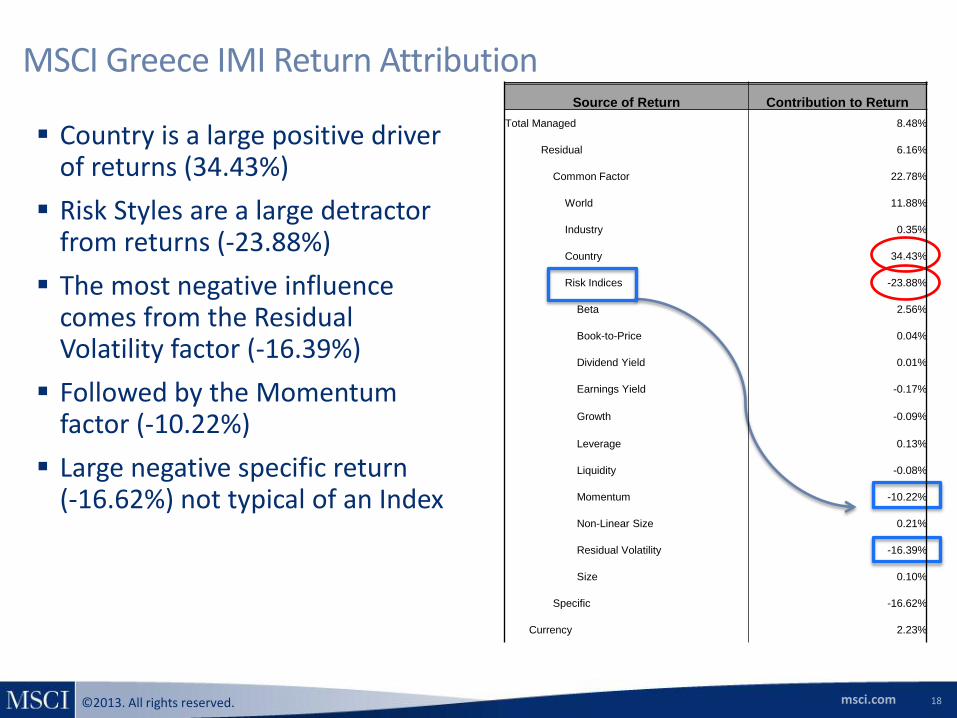
MSCI Greece IMI Return Attribution
18
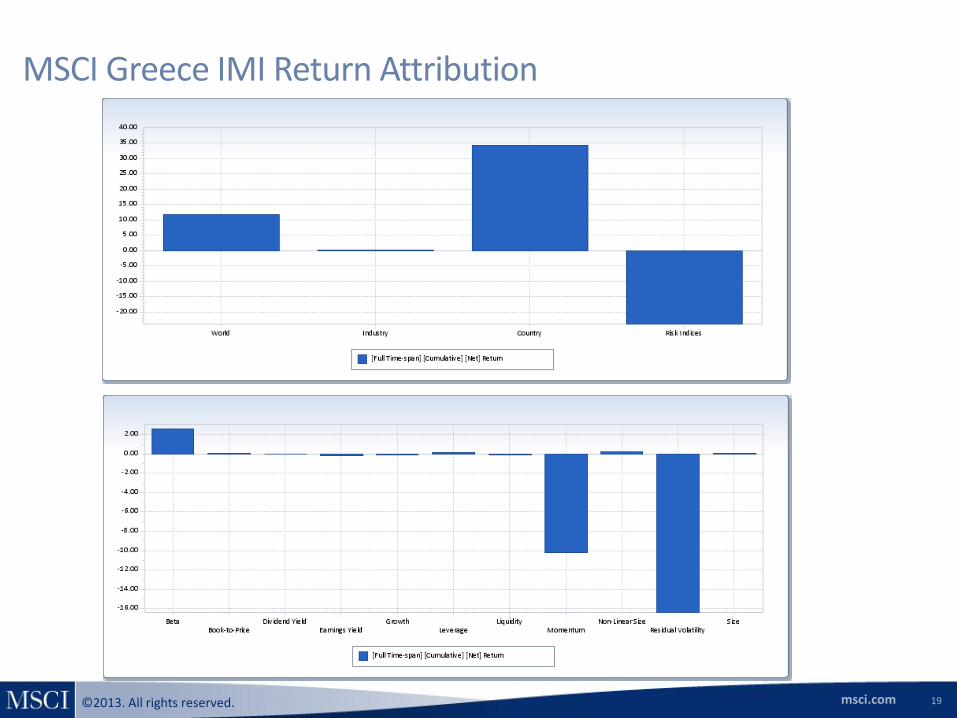
Country is a large positive driver of returns (34.43%)
Risk Styles are a large detractor from returns (-23.88%)
The most negative influence comes from the Residual Volatility factor (-16.39%)
Followed by the Momentum factor (-10.22%)
Large negative specific return (-16.62%) not typical of an Index
Source of Return Contribution to Return
Total Managed 8.48%
Residual 6.16%
Common Factor 22.78%
World 11.88%
Industry 0.35%
Country 34.43%
Risk Indices -23.88%
Beta 2.56%
Book-to-Price 0.04%
Dividend Yield 0.01%
Earnings Yield -0.17%
Growth -0.09%
Leverage 0.13%
Liquidity -0.08%
Momentum -10.22%
Non-Linear Size 0.21%
Residual Volatility -16.39%
Size 0.10%
Specific -16.62%
Currency 2.23%
msci.com ©2013. All rights reserved.
MSCI Greece IMI Return Attribution
19
msci.com ©2013. All rights reserved.
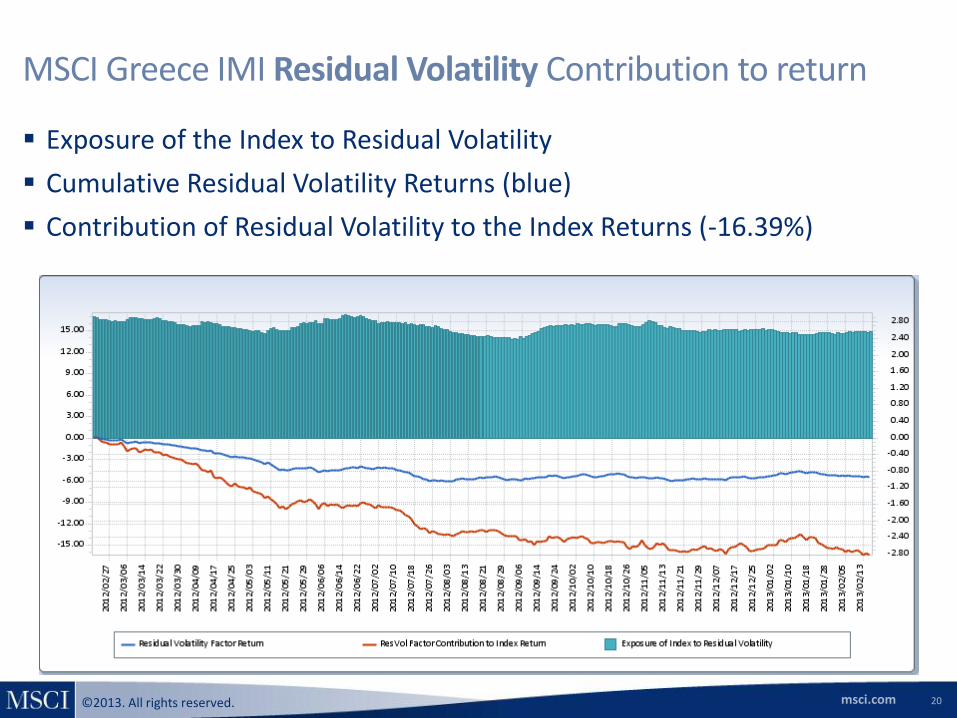
MSCI Greece IMI Residual Volatility Contribution to return
Exposure of the Index to Residual Volatility
Cumulative Residual Volatility Returns (blue)
Contribution of Residual Volatility to the Index Returns (-16.39%)
20
msci.com ©2013. All rights reserved.
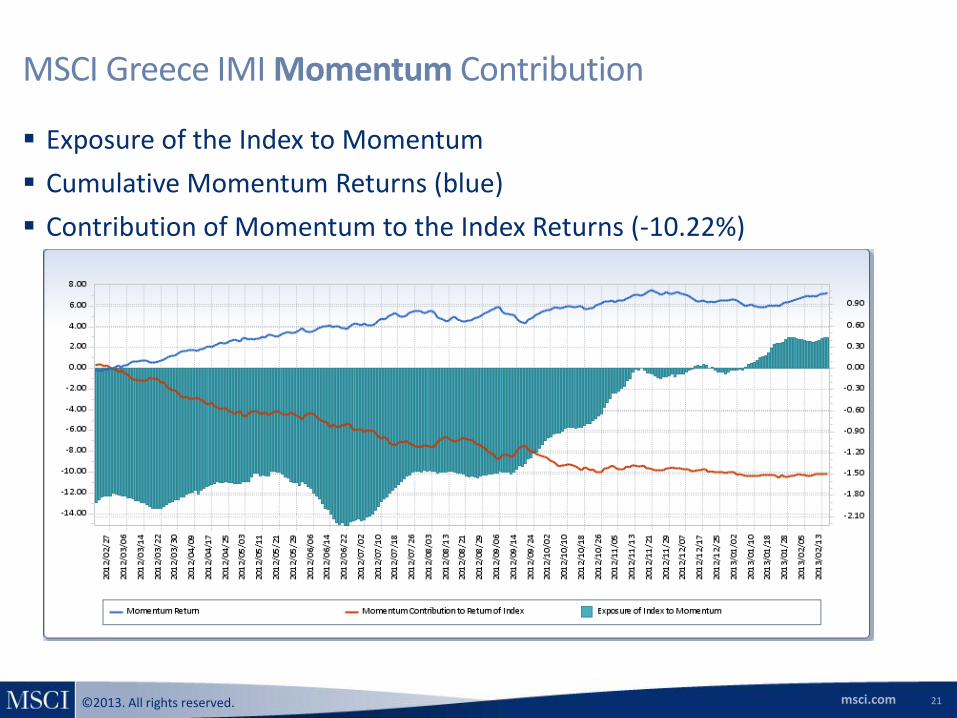
MSCI Greece IMI Momentum Contribution
Exposure of the Index to Momentum
Cumulative Momentum Returns (blue)
Contribution of Momentum to the Index Returns (-10.22%)
21
msci.com ©2013. All rights reserved. 22 msci.com
IV. Hedging out Undesired Exposures with a Factor-Mimicking Portfolio
msci.com ©2013. All rights reserved.
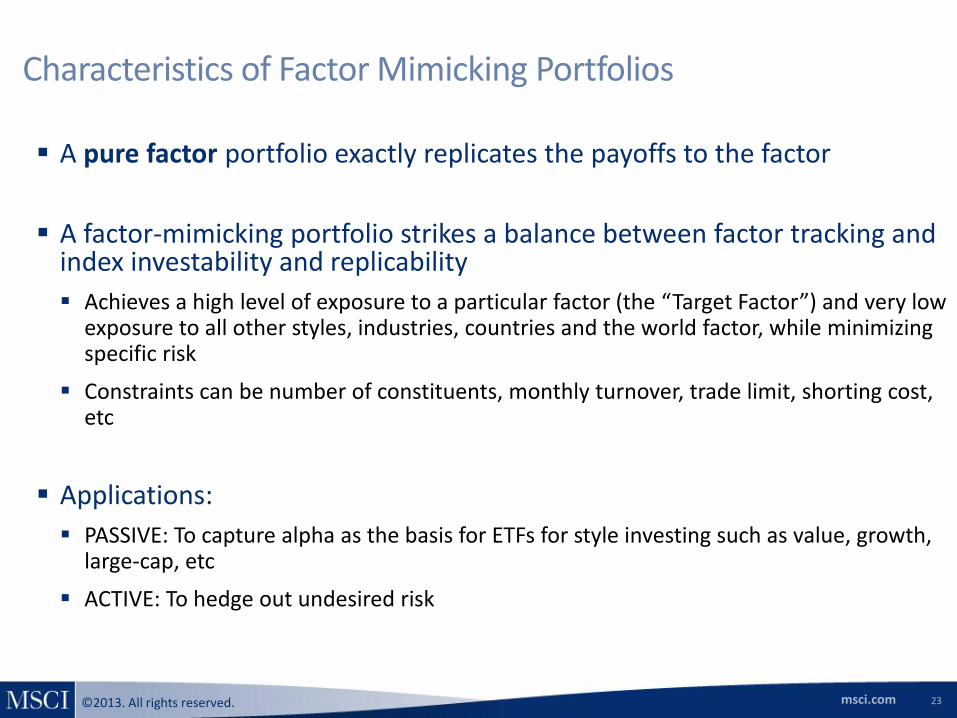
Characteristics of Factor Mimicking Portfolios
23
A pure factor portfolio exactly replicates the payoffs to the factor
A factor-mimicking portfolio strikes a balance between factor tracking and index investability and replicability
Achieves a high level of exposure to a particular factor (the “Target Factor”) and very low exposure to all other styles, industries, countries and the world factor, while minimizing specific risk
Constraints can be number of constituents, monthly turnover, trade limit, shorting cost, etc
Applications:
PASSIVE: To capture alpha as the basis for ETFs for style investing such as value, growth, large-cap, etc
ACTIVE: To hedge out undesired risk
msci.com ©2013. All rights reserved.
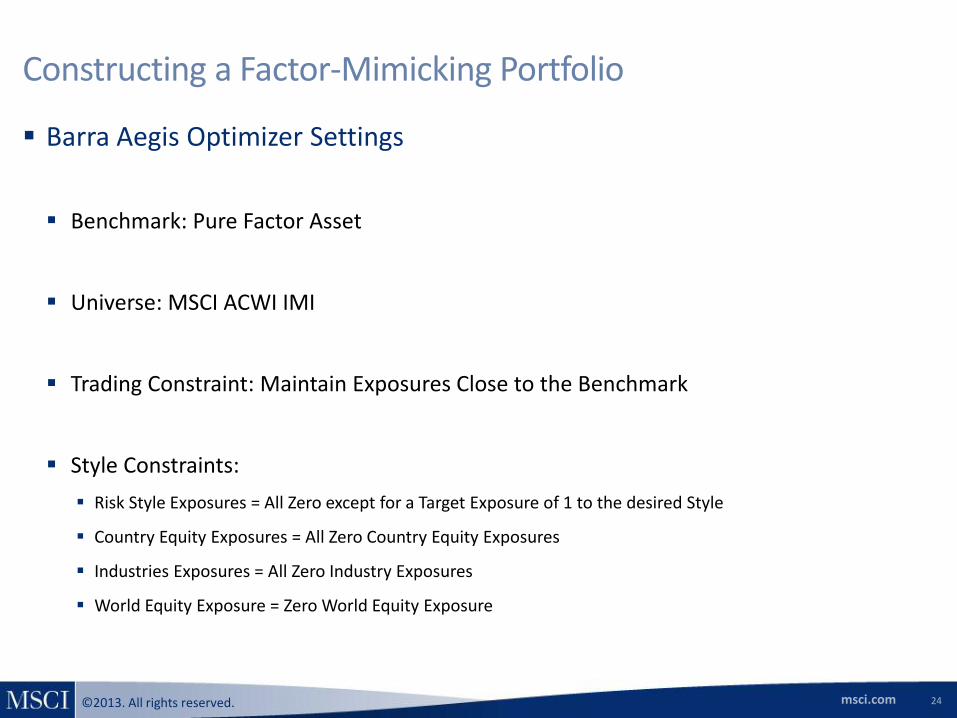
Constructing a Factor-Mimicking Portfolio
24
Barra Aegis Optimizer Settings
Benchmark: Pure Factor Asset
Universe: MSCI ACWI IMI
Trading Constraint: Maintain Exposures Close to the Benchmark
Style Constraints:
Risk Style Exposures = All Zero except for a Target Exposure of 1 to the desired Style
Country Equity Exposures = All Zero Country Equity Exposures
Industries Exposures = All Zero Industry Exposures
World Equity Exposure = Zero World Equity Exposure
msci.com ©2013. All rights reserved.
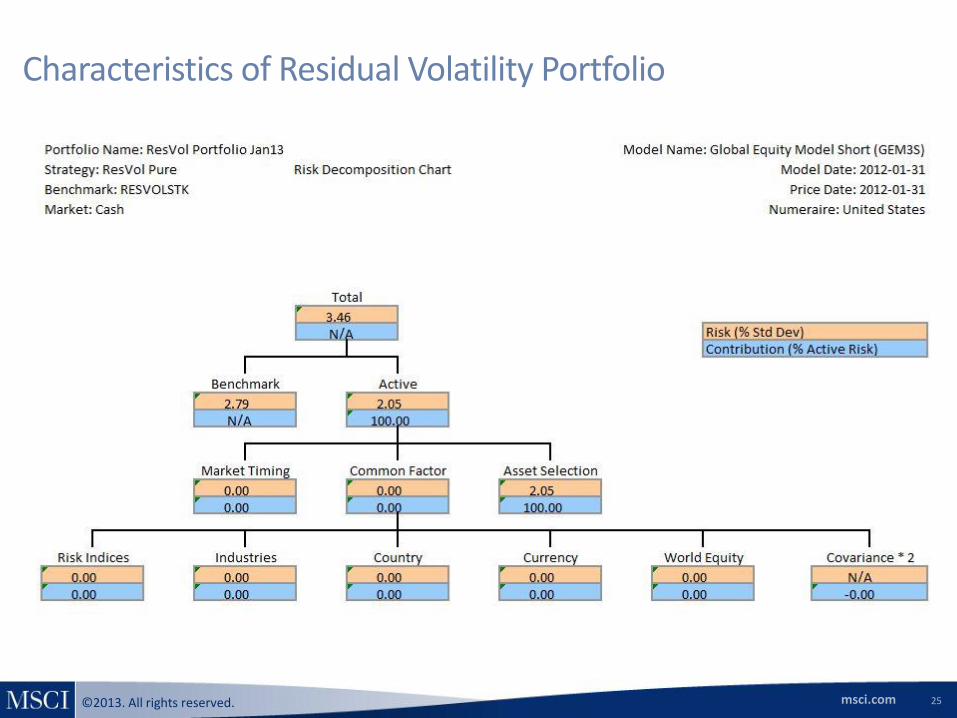
Characteristics of Residual Volatility Portfolio
25
msci.com ©2013. All rights reserved.
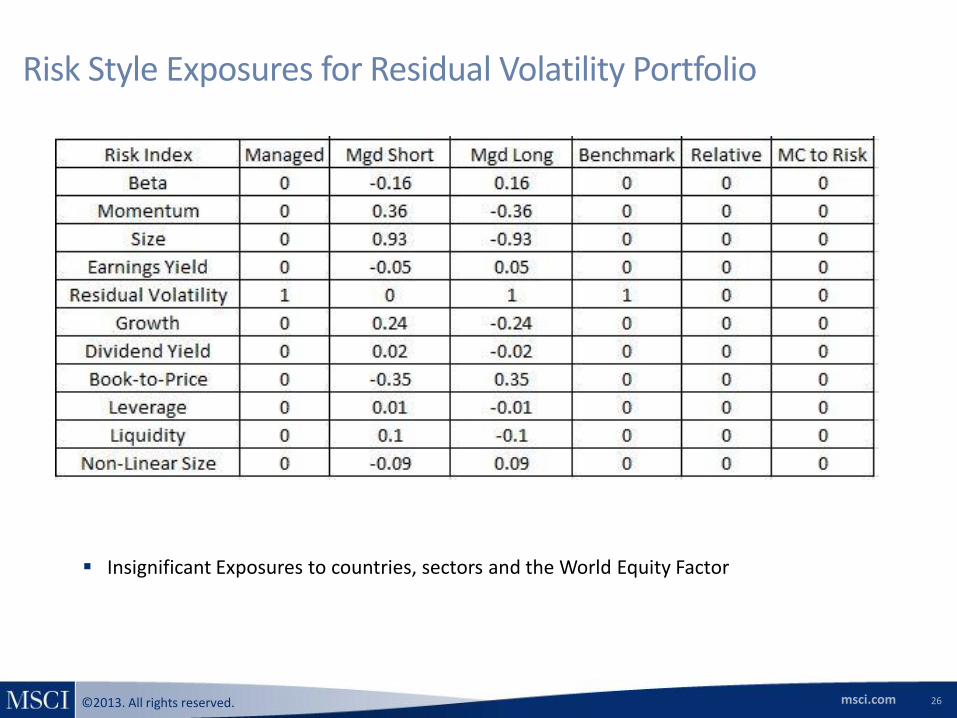
Risk Style Exposures for Residual Volatility Portfolio
26
Insignificant Exposures to countries, sectors and the World Equity Factor
msci.com ©2013. All rights reserved. 27 msci.com
V. Rebalancing Frequency
Change in Quality of the Factor-Mimicking Portfolios
msci.com ©2013. All rights reserved.
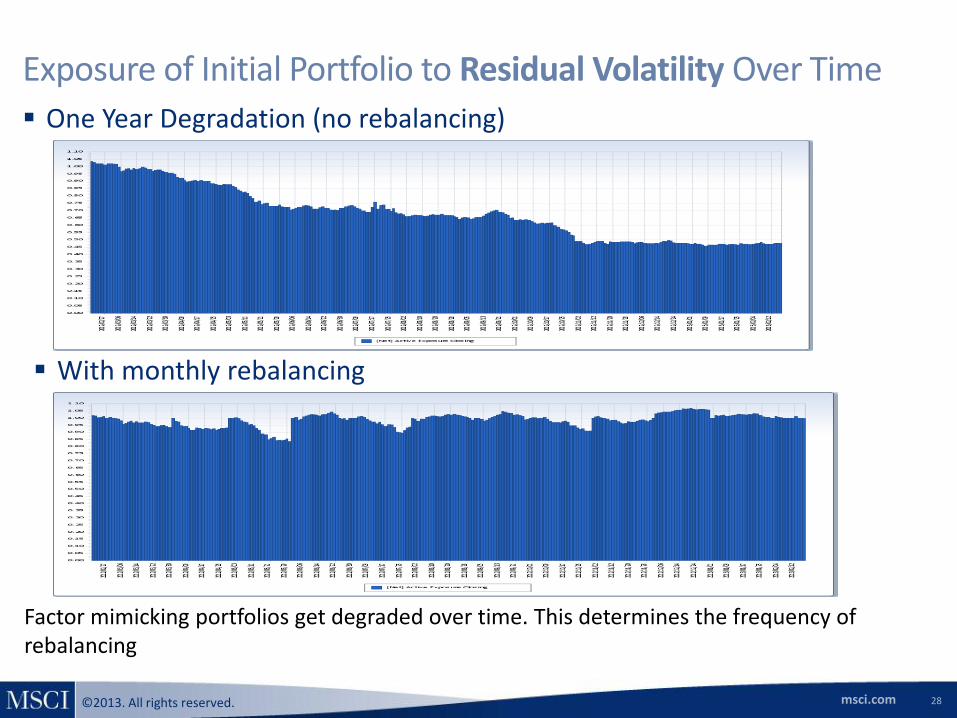
Exposure of Initial Portfolio to Residual Volatility Over Time
28
One Year Degradation (no rebalancing)
With monthly rebalancing
Factor mimicking portfolios get degraded over time. This determines the frequency of rebalancing
msci.com ©2013. All rights reserved.
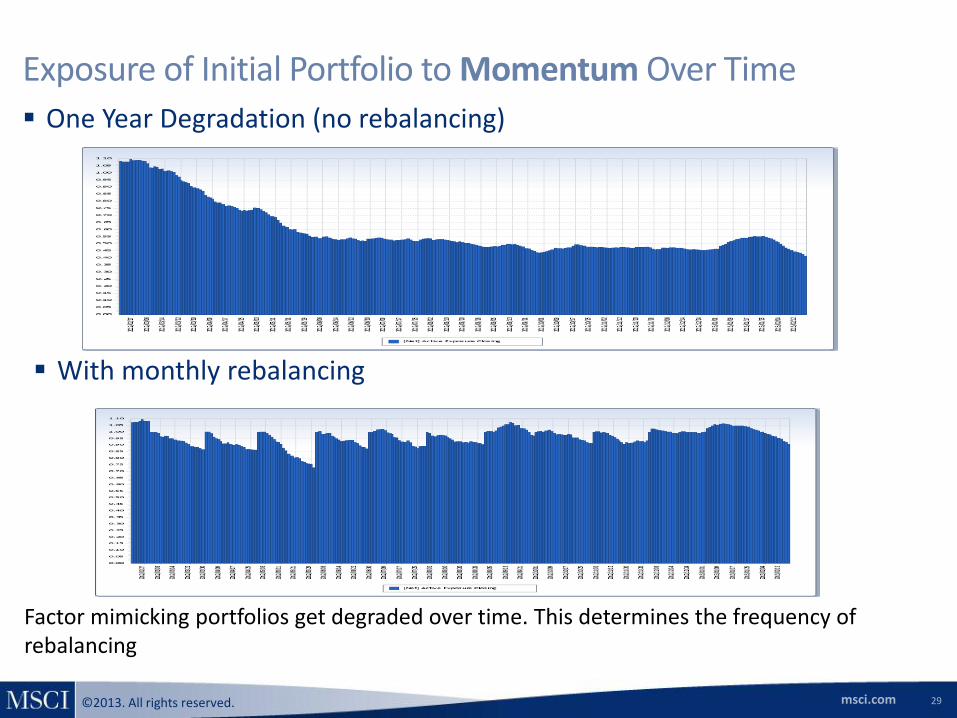
Exposure of Initial Portfolio to Momentum Over Time
29
One Year Degradation (no rebalancing)
With monthly rebalancing
Factor mimicking portfolios get degraded over time. This determines the frequency of rebalancing
msci.com ©2013. All rights reserved. 30 msci.com
MSCI 24 Hour Global Client Service
Asia Pacific
China North 10800.852.1032 (toll free)
China South 10800.152.1032 (toll free)
Hong Kong +852.2844.9333
Seoul +798.8521.3392 (toll free)
Singapore 800.852.3749 (toll free)
Sydney +61.2.9033.9333
Tokyo +81.3.5226.8222
Europe, Middle East & Africa
Cape Town +27.21.673.0100
Frankfurt +49.69.133.859.00
Geneva +41.22.817.9777
London +44.20.7618.2222
Milan +39.02.5849.0415
Paris 0800.91.59.17 (toll free)
Americas
Americas 1.888.588.4567 (toll free)
Atlanta +1.404.551.3212
Boston +1.617.532.0920
Chicago +1.312.706.4999
Monterrey +52.81.1253.4020
Montreal +1.514.847.7506
New York +1.212.804.3901
San Francisco +1.415.836.8800
São Paulo +55.11.3706.1360
Stamford +1.203.325.5630
Toronto +1.416.628.1007
[email protected] |www.msci.com
msci.com ©2013. All rights reserved. 31 msci.com
Notice and Disclaimer
This document and all of the information contained in it, including without limitation all text, data, graphs, charts (collectively, the “Information”) is the property of MSCl Inc. or its subsidiaries (collectively, “MSCI”), or MSCI’s licensors, direct or indirect suppliers or any third party involved in making or compiling any Information (collectively, with MSCI, the “Information Providers”) and is provided for informational purposes only. The Information may not be reproduced or redisseminated in whole or in part without prior written permission from MSCI.
The Information may not be used to create derivative works or to verify or correct other data or information. For example (but without limitation), the Information may not be used to create indices, databases, risk models, analytics, software, or in connection with the issuing, offering, sponsoring, managing or marketing of any securities, portfolios, financial products or other investment vehicles utilizing or based on, linked to, tracking or otherwise derived from the Information or any other MSCI data, information, products or services.
The user of the Information assumes the entire risk of any use it may make or permit to be made of the Information. NONE OF THE INFORMATION PROVIDERS MAKES ANY EXPRESS OR IMPLIED WARRANTIES OR REPRESENTATIONS WITH RESPECT TO THE INFORMATION (OR THE RESULTS TO BE OBTAINED BY THE USE THEREOF), AND TO THE MAXIMUM EXTENT PERMITTED BY APPLICABLE LAW, EACH INFORMATION PROVIDER EXPRESSLY DISCLAIMS ALL IMPLIED WARRANTIES (INCLUDING, WITHOUT LIMITATION, ANY IMPLIED WARRANTIES OF ORIGINALITY, ACCURACY, TIMELINESS, NON-INFRINGEMENT, COMPLETENESS, MERCHANTABILITY AND FITNESS FOR A PARTICULAR PURPOSE) WITH RESPECT TO ANY OF THE INFORMATION.
Without limiting any of the foregoing and to the maximum extent permitted by applicable law, in no event shall any Information Provider have any liability regarding any of the Information for any direct, indirect, special, punitive, consequential (including lost profits) or any other damages even if notified of the possibility of such damages. The foregoing shall not exclude or limit any liability that may not by applicable law be excluded or limited, including without limitation (as applicable), any liability for death or personal injury to the extent that such injury results from the negligence or wilful default of itself, its servants, agents or sub-contractors.
Information containing any historical information, data or analysis should not be taken as an indication or guarantee of any future performance, analysis, forecast or prediction. Past performance does not guarantee future results.
None of the Information constitutes an offer to sell (or a solicitation of an offer to buy), any security, financial product or other investment vehicle or any trading strategy.
MSCI’s indirect wholly-owned subsidiary Institutional Shareholder Services, Inc. (“ISS”) is a Registered Investment Adviser under the Investment Advisers Act of 1940. Except with respect to any applicable products or services from ISS (including applicable products or services from MSCI ESG Research Information, which are provided by ISS), none of MSCI’s products or services recommends, endorses, approves or otherwise expresses any opinion regarding any issuer, securities, financial products or instruments or trading strategies and none of MSCI’s products or services is intended to constitute investment advice or a recommendation to make (or refrain from making) any kind of investment decision and may not be relied on as such.
The MSCI ESG Indices use ratings and other data, analysis and information from MSCI ESG Research. MSCI ESG Research is produced by ISS or its subsidiaries. Issuers mentioned or included in any MSCI ESG Research materials may be a client of MSCI, ISS, or another MSCI subsidiary, or the parent of, or affiliated with, a client of MSCI, ISS, or another MSCI subsidiary, including ISS Corporate Services, Inc., which provides tools and services to issuers. MSCI ESG Research materials, including materials utilized in any MSCI ESG Indices or other products, have not been submitted to, nor received approval from, the United States Securities and Exchange Commission or any other regulatory body.
Any use of or access to products, services or information of MSCI requires a license from MSCI. MSCI, Barra, RiskMetrics, ISS, CFRA, FEA, and other MSCI brands and product names are the trademarks, service marks, or registered trademarks or service marks of MSCI or its subsidiaries in the United States and other jurisdictions. The Global Industry Classification Standard (GICS) was developed by and is the exclusive property of MSCI and Standard & Poor’s. “Global Industry Classification Standard (GICS)” is a service mark of MSCI and Standard & Poor’s. © 2012 MSCI Inc. All rights reserved. RV Jan 2012
msci.com ©2013. All rights reserved.
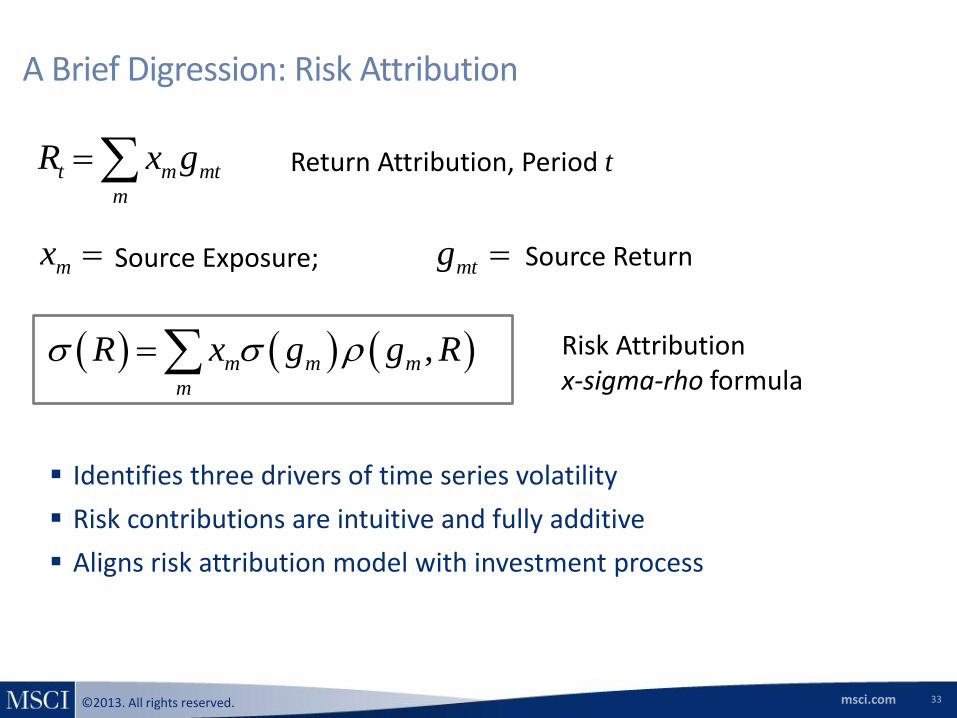
A Brief Digression: Risk Attribution
Identifies three drivers of time series volatility
Risk contributions are intuitive and fully additive
Aligns risk attribution model with investment process
t m mt
m
R x g Return Attribution, Period t
mx Source Exposure;
,m m m
m
R x g g R Risk Attribution x-sigma-rho formula
mtg Source Return
33
msci.com ©2013. All rights reserved.
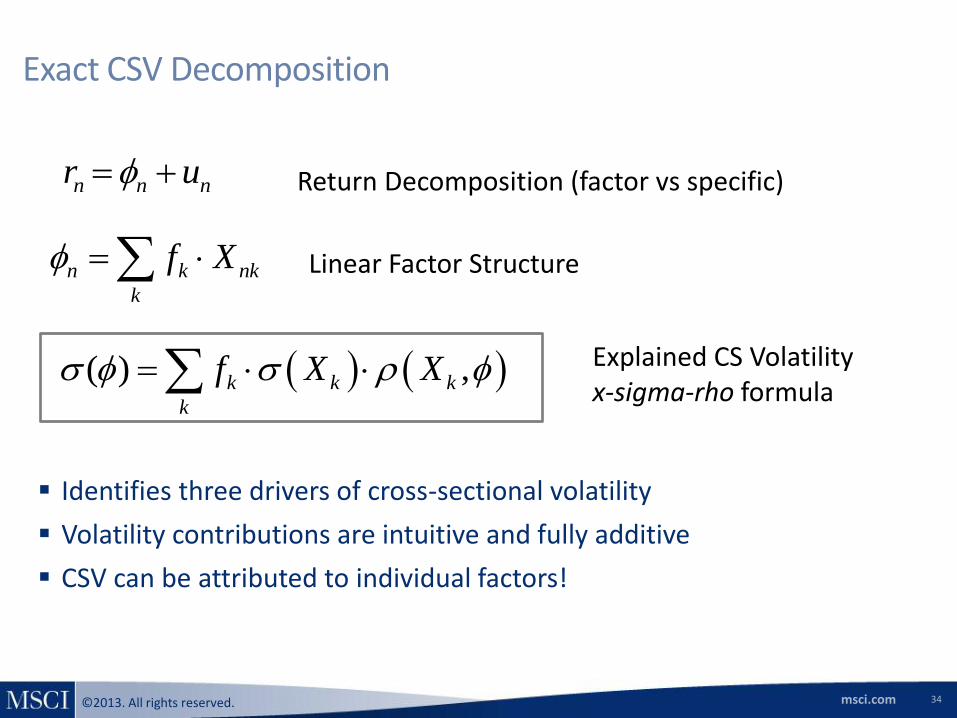
Exact CSV Decomposition
Identifies three drivers of cross-sectional volatility
Volatility contributions are intuitive and fully additive
CSV can be attributed to individual factors!
n n nr u Return Decomposition (factor vs specific)
Explained CS Volatility x-sigma-rho formula
( ) ,k k k
k
f X X
n k nk
k
f X Linear Factor Structure
34
msci.com ©2013. All rights reserved.
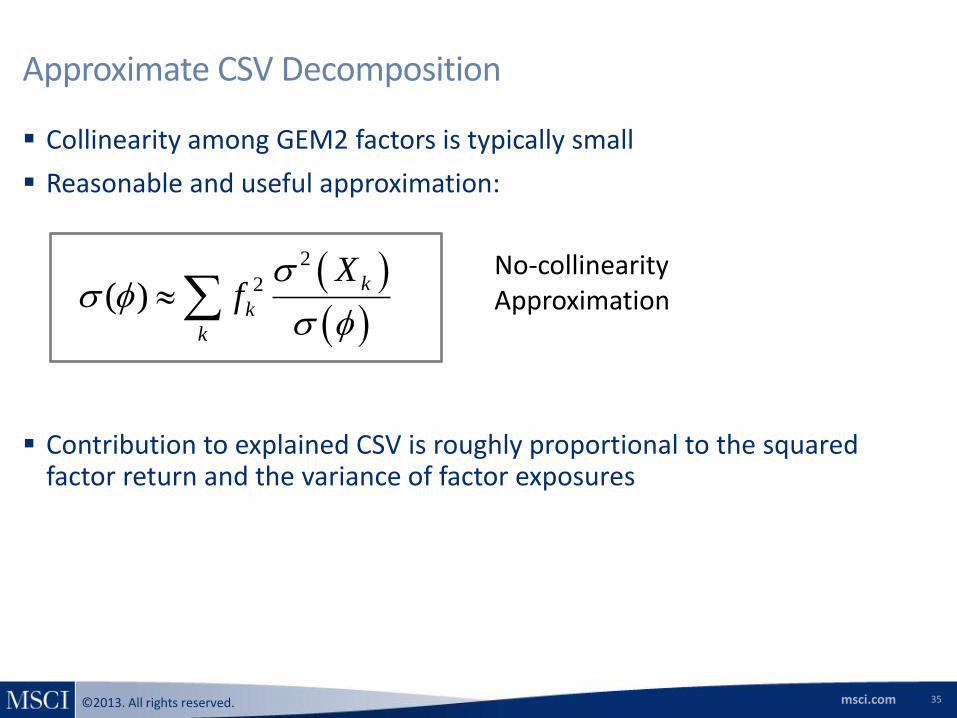
Approximate CSV Decomposition
Collinearity among GEM2 factors is typically small
Reasonable and useful approximation:
Contribution to explained CSV is roughly proportional to the squared factor return and the variance of factor exposures
2
2( )k
k
k
Xf
No-collinearity Approximation
35
msci.com ©2013. All rights reserved.
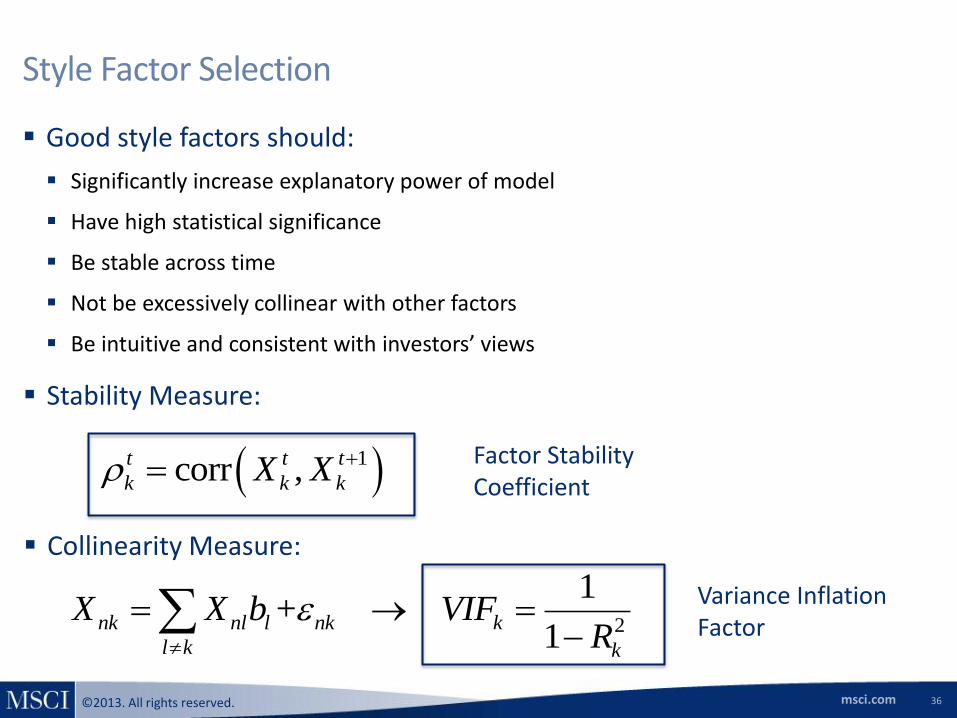
Style Factor Selection
Good style factors should:
Significantly increase explanatory power of model
Have high statistical significance
Be stable across time
Not be excessively collinear with other factors
Be intuitive and consistent with investors’ views
Stability Measure:
Collinearity Measure:
1corr ,t t t
k k kX X
2
1+
1nk nl l nk k
l k k
X X b VIFR
Variance Inflation Factor
Factor Stability Coefficient
36
msci.com ©2013. All rights reserved.
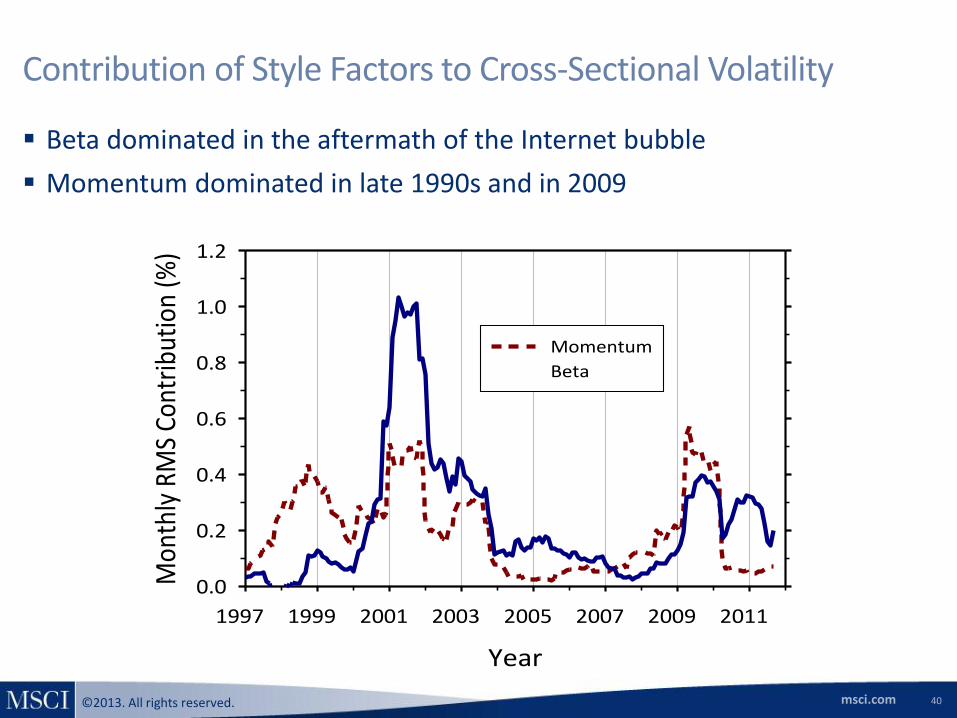
Contribution of Style Factors to Cross-Sectional Volatility
Beta dominated in the aftermath of the Internet bubble
Momentum dominated in late 1990s and in 2009
40
Year
1997 1999 2001 2003 2005 2007 2009 2011
Mon
thly
RM
S Co
ntri
butio
n (%
)
0.0
0.2
0.4
0.6
0.8
1.0
1.2
Momentum
Beta
msci.com ©2013. All rights reserved.
Model Highlights and Overview
Methodology Details
Factor Structure
Explanatory Power
Optimization Bias Adjustment
Volatility Regime Adjustment
New Specific Risk Model
Additional Empirical Results
Summary
Outline
41
msci.com ©2013. All rights reserved.
Full daily updates of all components of the model
Extended coverage to 22 frontier markets
Enhanced style factors
Methodology Advances:
An innovative Optimization Bias Adjustment methodology designed to provide improved risk forecasts for optimized portfolios by reducing the effects of sampling error
Volatility Regime Adjustment designed to calibrate volatility forecasts to current levels
A new specific risk model based on daily asset-level specific returns with Bayesian adjustment designed to reduce biases due to sampling error
Improved risk forecasts
Model Highlights
42
msci.com ©2013. All rights reserved.
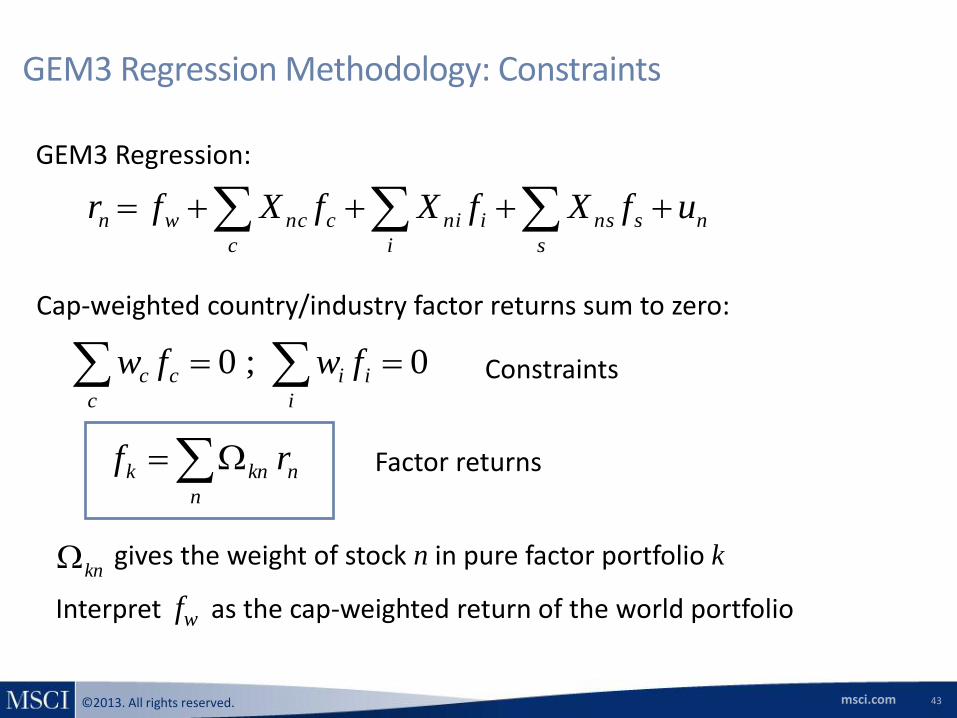
GEM3 Regression Methodology: Constraints
Cap-weighted country/industry factor returns sum to zero:
i
ii
c
cc fwfw 0;0 Constraints
n
s
sns
i
ini
c
cncwn ufXfXfXfr
n
nknk rf
gives the weight of stock n in pure factor portfolio k
GEM3 Regression:
Factor returns
Interpret fw as the cap-weighted return of the world portfolio
kn
43

msci.com ©2013. All rights reserved.
Style Factor Selection
Good style factors should:
Significantly increase explanatory power of model
Have high statistical significance
Be stable across time
Not be excessively collinear with other factors
Be intuitive and consistent with investors’ views
Stability Measure:
Collinearity Measure:
1corr ,t t t
k k kX X
2
1+
1nk nl l nk k
l k k
X X b VIFR
Variance Inflation Factor
Factor Stability Coefficient
44
msci.com ©2013. All rights reserved.
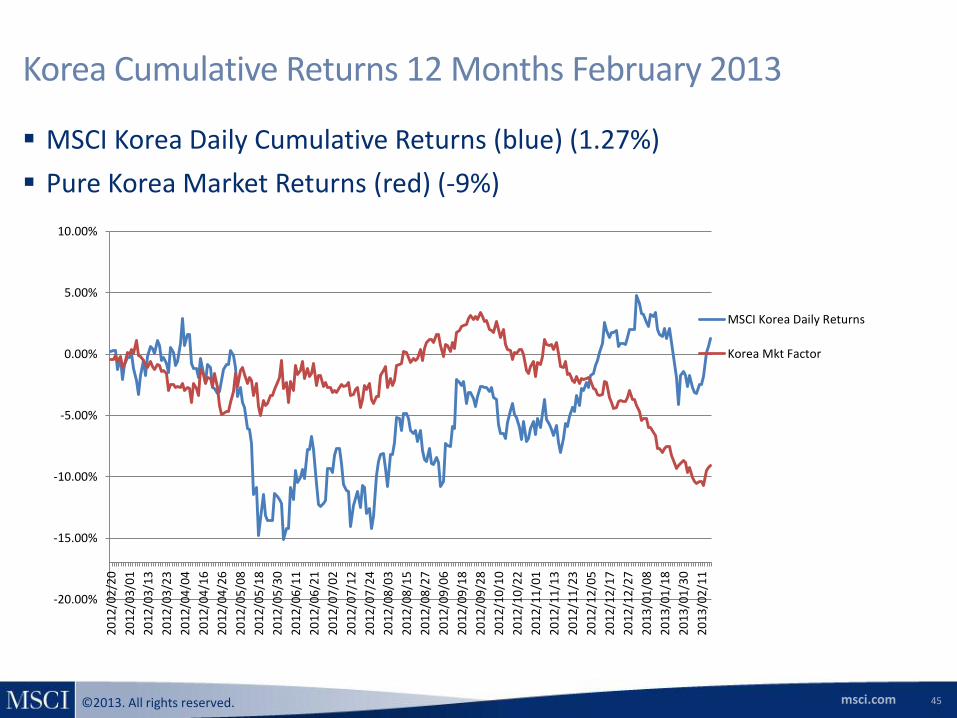
Korea Cumulative Returns 12 Months February 2013
MSCI Korea Daily Cumulative Returns (blue) (1.27%)
Pure Korea Market Returns (red) (-9%)
45
-20.00%
-15.00%
-10.00%
-5.00%
0.00%
5.00%
10.00%
20
12
/02
/20
20
12
/03
/01
20
12
/03
/13
20
12
/03
/23
20
12
/04
/04
20
12
/04
/16
20
12
/04
/26
20
12
/05
/08
20
12
/05
/18
20
12
/05
/30
20
12
/06
/11
20
12
/06
/21
20
12
/07
/02
20
12
/07
/12
20
12
/07
/24
20
12
/08
/03
20
12
/08
/15
20
12
/08
/27
20
12
/09
/06
20
12
/09
/18
20
12
/09
/28
20
12
/10
/10
20
12
/10
/22
20
12
/11
/01
20
12
/11
/13
20
12
/11
/23
20
12
/12
/05
20
12
/12
/17
20
12
/12
/27
20
13
/01
/08
20
13
/01
/18
20
13
/01
/30
20
13
/02
/11
MSCI Korea Daily Returns
Korea Mkt Factor
msci.com ©2013. All rights reserved. 46 msci.com
Optimization Bias Adjustment
msci.com ©2013. All rights reserved.
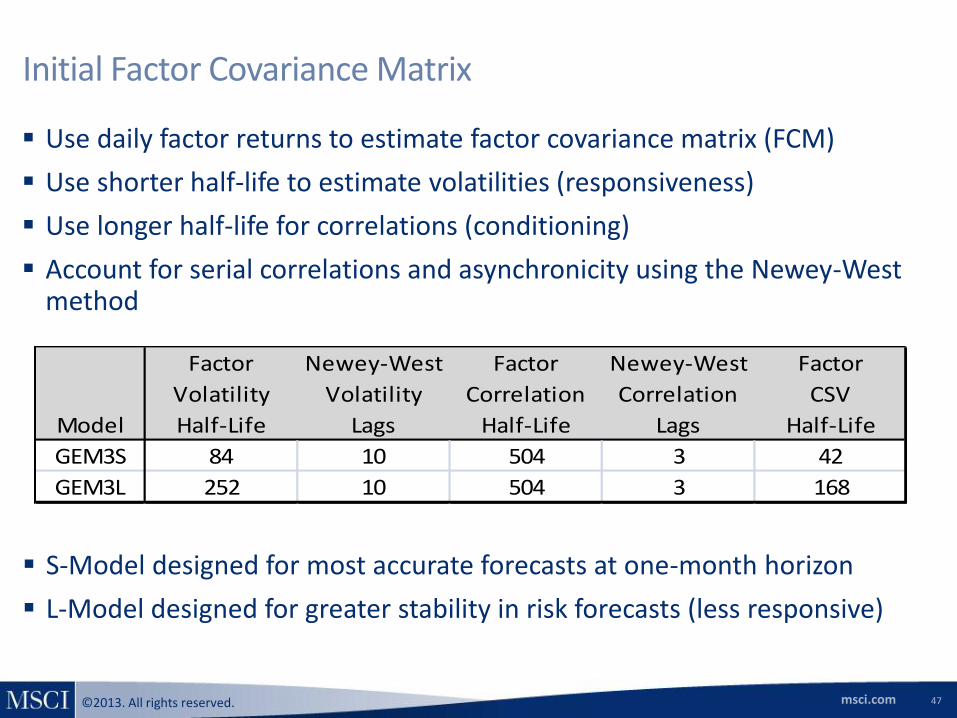
Initial Factor Covariance Matrix
Use daily factor returns to estimate factor covariance matrix (FCM)
Use shorter half-life to estimate volatilities (responsiveness)
Use longer half-life for correlations (conditioning)
Account for serial correlations and asynchronicity using the Newey-West method
Factor Newey-West Factor Newey-West Factor
Volatility Volatility Correlation Correlation CSV
Model Half-Life Lags Half-Life Lags Half-Life
GEM3S 84 10 504 3 42
GEM3L 252 10 504 3 168
S-Model designed for most accurate forecasts at one-month horizon
L-Model designed for greater stability in risk forecasts (less responsive)
47
msci.com ©2013. All rights reserved.
Eigenfactors and Optimization Bias
Traditional risk models tend to underpredict the risk of optimized portfolios
This bias is related to estimation error in the covariance matrix
Eigenfactors represent uncorrelated linear combinations of pure factors
Eigenfactors solve certain classes of minimum variance optimizations
Eigenfactors reliably capture systematic biases in the sample factor covariance matrix (FCM)
The biases can be demonstrated and estimated by simulation
Removing the biases of the eigenfactors is effective at removing the biases of optimized portfolios
Jose Menchero, DJ Orr, and Jun Wang. “Eigen-Adjusted Covariance Matrices,” MSCI Research Insight, May 2011
48
msci.com ©2013. All rights reserved.
Assume that the sample FCM F0 denotes the “true” FCM
Simulate a set of factor returns fn from F0 (e.g., Cholesky approach)
Compute simulated FCM Fn using same estimator as used for F0
Diagonalize Fn to obtain simulated eigenfactor volatilities
Use F0 to compute the “true” volatilities of simulated eigenfactors
Compute the average bias of simulated eigenfactors by Monte Carlo simulation
Assume F0 suffers from the same biases as the simulated FCM and de-bias the eigenvariances
Transform adjusted FCM back to the original pure basis
Optimization Bias Adjustment Methodology
49
msci.com ©2013. All rights reserved. 50 msci.com
Volatility Regime Adjustment for Factors
msci.com ©2013. All rights reserved.
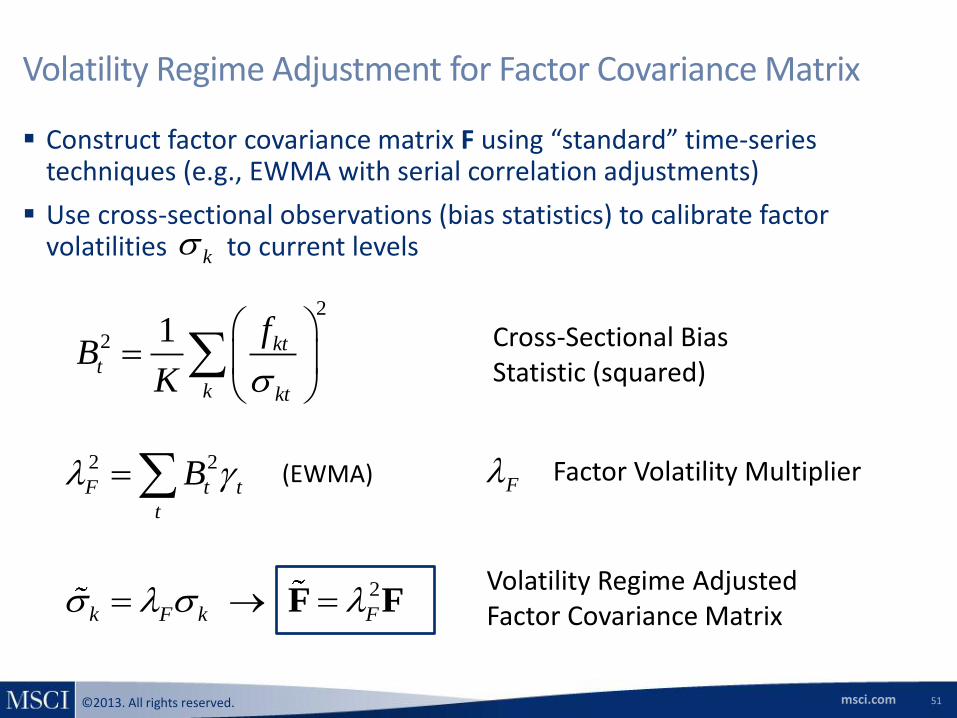
Construct factor covariance matrix F using “standard” time-series techniques (e.g., EWMA with serial correlation adjustments)
Use cross-sectional observations (bias statistics) to calibrate factor volatilities to current levels
Volatility Regime Adjustment for Factor Covariance Matrix
k
2
k F k F F FVolatility Regime Adjusted Factor Covariance Matrix
F Factor Volatility Multiplier
2
2 1 ktt
k kt
fB
K
2 2
F t t
t
B
Cross-Sectional Bias Statistic (squared)
(EWMA)
51
msci.com ©2013. All rights reserved.
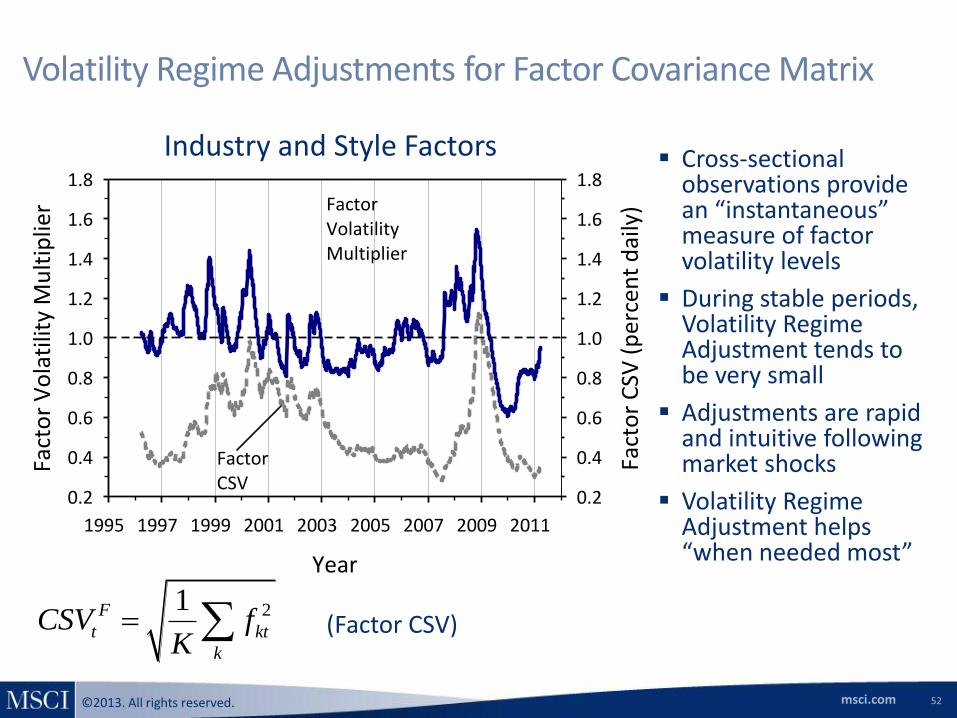
Volatility Regime Adjustments for Factor Covariance Matrix
Cross-sectional observations provide an “instantaneous” measure of factor volatility levels
During stable periods, Volatility Regime Adjustment tends to be very small
Adjustments are rapid and intuitive following market shocks
Volatility Regime Adjustment helps “when needed most”
(Factor CSV)
Year
1995 1997 1999 2001 2003 2005 2007 2009 2011
Fact
or
Vo
lati
lity
Mu
ltip
lier
0.2
0.4
0.6
0.8
1.0
1.2
1.4
1.6
1.8
Fact
or
CSV
(p
erce
nt
dai
ly)
0.2
0.4
0.6
0.8
1.0
1.2
1.4
1.6
1.8FactorVolatilityMultiplier
FactorCSV
Industry and Style Factors
21F
t kt
k
CSV fK
52
msci.com ©2013. All rights reserved.
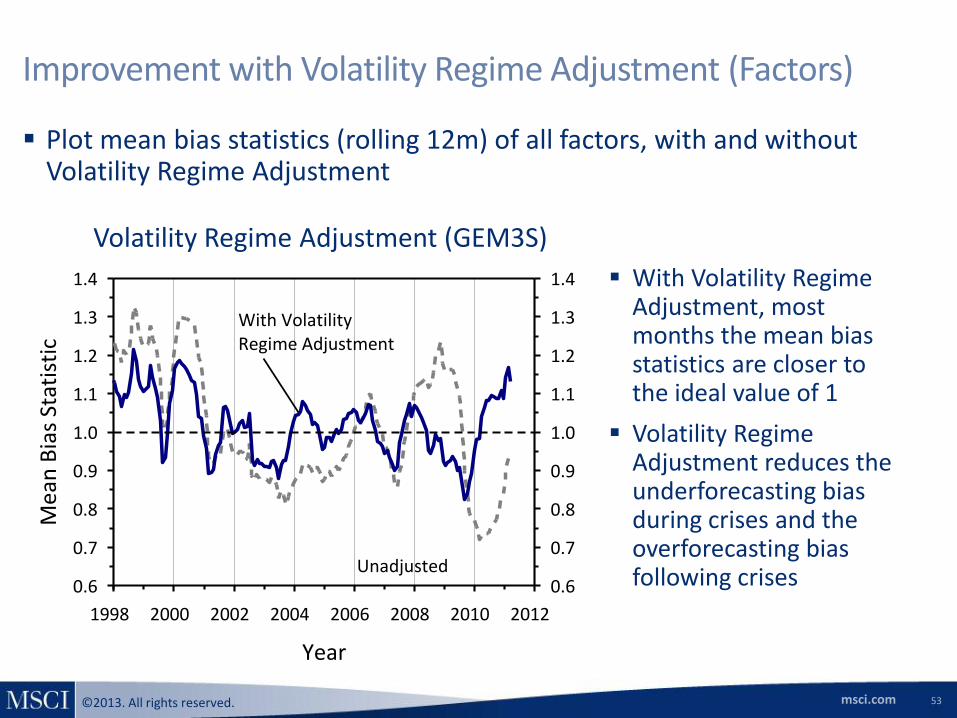
Improvement with Volatility Regime Adjustment (Factors)
With Volatility Regime Adjustment, most months the mean bias statistics are closer to the ideal value of 1
Volatility Regime Adjustment reduces the underforecasting bias during crises and the overforecasting bias following crises
Plot mean bias statistics (rolling 12m) of all factors, with and without Volatility Regime Adjustment
Year
1998 2000 2002 2004 2006 2008 2010 2012
Mea
n B
ias
Stat
isti
c
0.6
0.7
0.8
0.9
1.0
1.1
1.2
1.3
1.4
0.6
0.7
0.8
0.9
1.0
1.1
1.2
1.3
1.4
With Volatility Regime Adjustment
Unadjusted
Volatility Regime Adjustment (GEM3S)
53