Embed Size (px)
Citation preview
Pacific Disaster CenterArea Brief: GeneralExecutive Summary
HONOLULU
04:45:5908 Jun 2017
LIMA
09:45:5908 Jun 2017
WASH.D.C.
10:45:5908 Jun 2017
ZULU
14:45:5908 Jun 2017
NAIROBI
17:45:5908 Jun 2017
BANGKOK
21:45:5908 Jun 2017
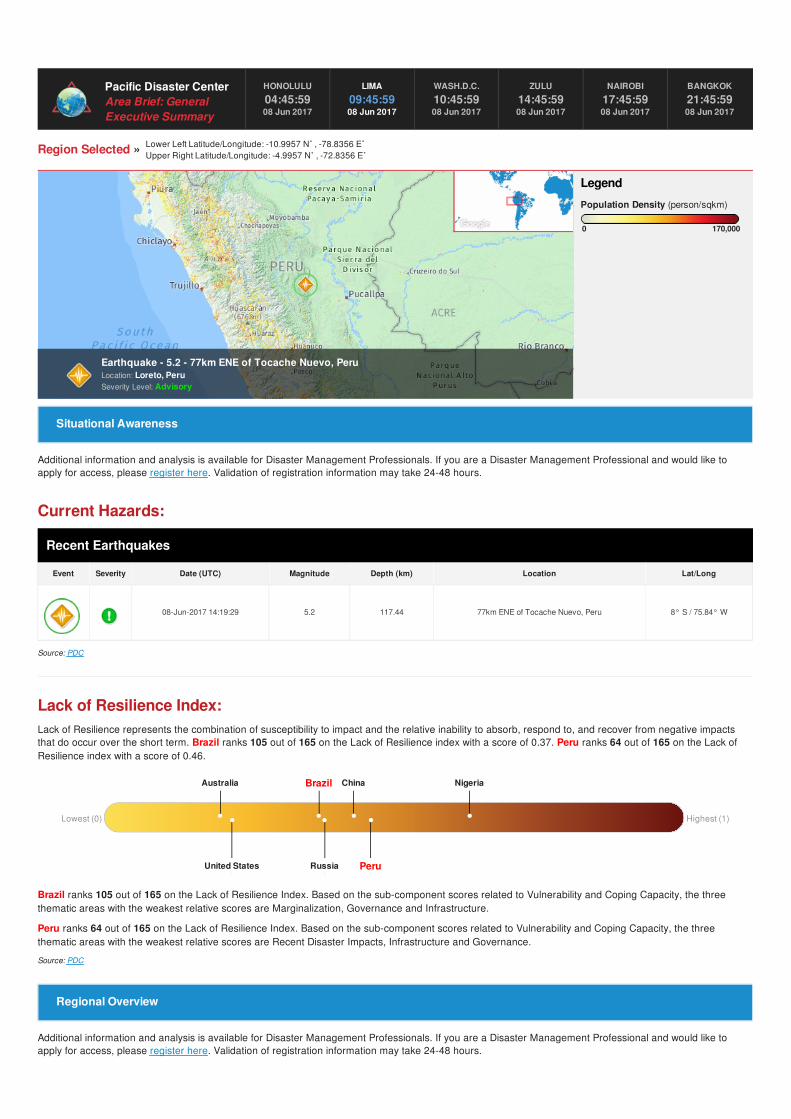
Region Selected » Lower Left Latitude/Longitude: -10.9957 N˚ , -78.8356 E˚Upper Right Latitude/Longitude: -4.9957 N˚ , -72.8356 E˚
Current Hazards:
Recent Earthquakes
Event Severity Date (UTC) Magnitude Depth (km) Location Lat/Long
08-Jun-2017 14:19:29 5.2 117.44 77km ENE of Tocache Nuevo, Peru 8° S / 75.84° W
Source: PDC
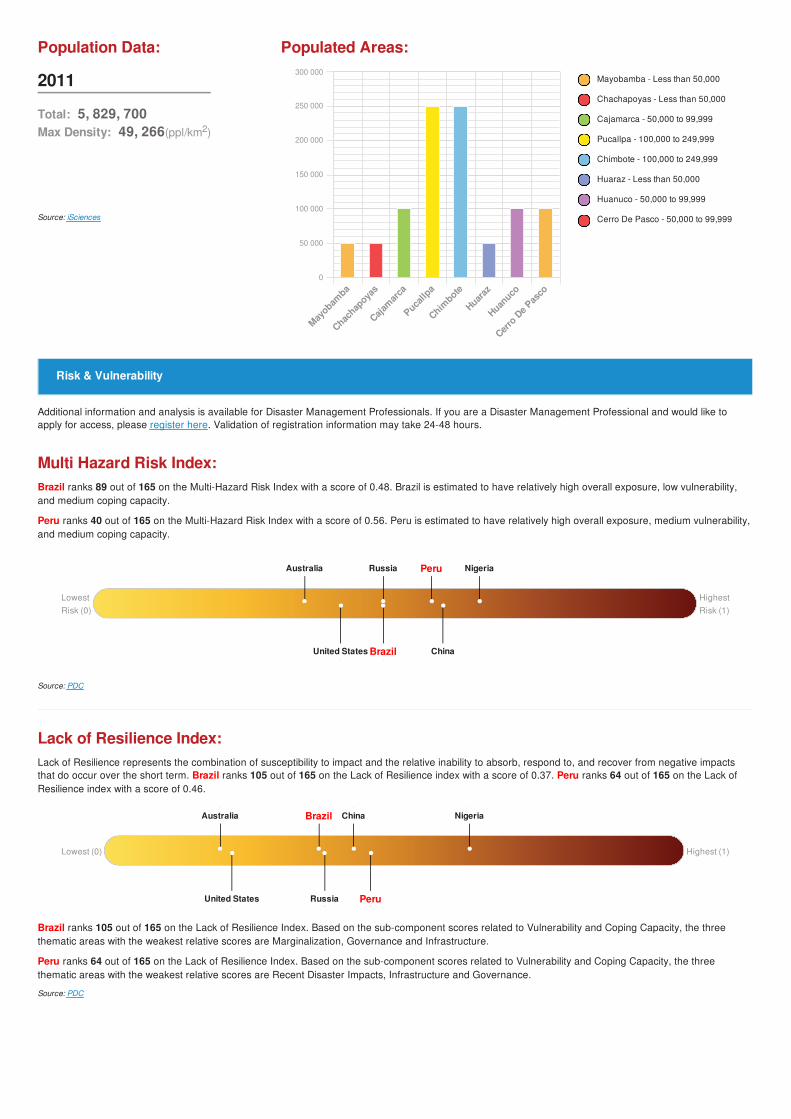
Lack of Resilience Index:Lack of Resilience represents the combination of susceptibility to impact and the relative inability to absorb, respond to, and recover from negative impactsthat do occur over the short term. Brazil ranks 105 out of 165 on the Lack of Resilience index with a score of 0.37. Peru ranks 64 out of 165 on the Lack ofResilience index with a score of 0.46.
Brazil ranks 105 out of 165 on the Lack of Resilience Index. Based on the sub-component scores related to Vulnerability and Coping Capacity, the threethematic areas with the weakest relative scores are Marginalization, Governance and Infrastructure.
Peru ranks 64 out of 165 on the Lack of Resilience Index. Based on the sub-component scores related to Vulnerability and Coping Capacity, the threethematic areas with the weakest relative scores are Recent Disaster Impacts, Infrastructure and Governance.
Source: PDC
170,000
Legend
Population Density (person/sqkm)
0
Additional information and analysis is available for Disaster Management Professionals. If you are a Disaster Management Professional and would like toapply for access, please register here. Validation of registration information may take 24-48 hours.
Additional information and analysis is available for Disaster Management Professionals. If you are a Disaster Management Professional and would like toapply for access, please register here. Validation of registration information may take 24-48 hours.
Earthquake - 5.2 - 77km ENE of Tocache Nuevo, PeruLocation: Loreto, PeruSeverity Level: Advisory
Situational Awareness
Lowest (0) Highest (1)
Regional Overview
PeruRussiaUnited States
BrazilAustralia China Nigeria
Population Data:
2011
Total: 5, 829, 700Max Density: 49, 266(ppl/km2)
Source: iSciences
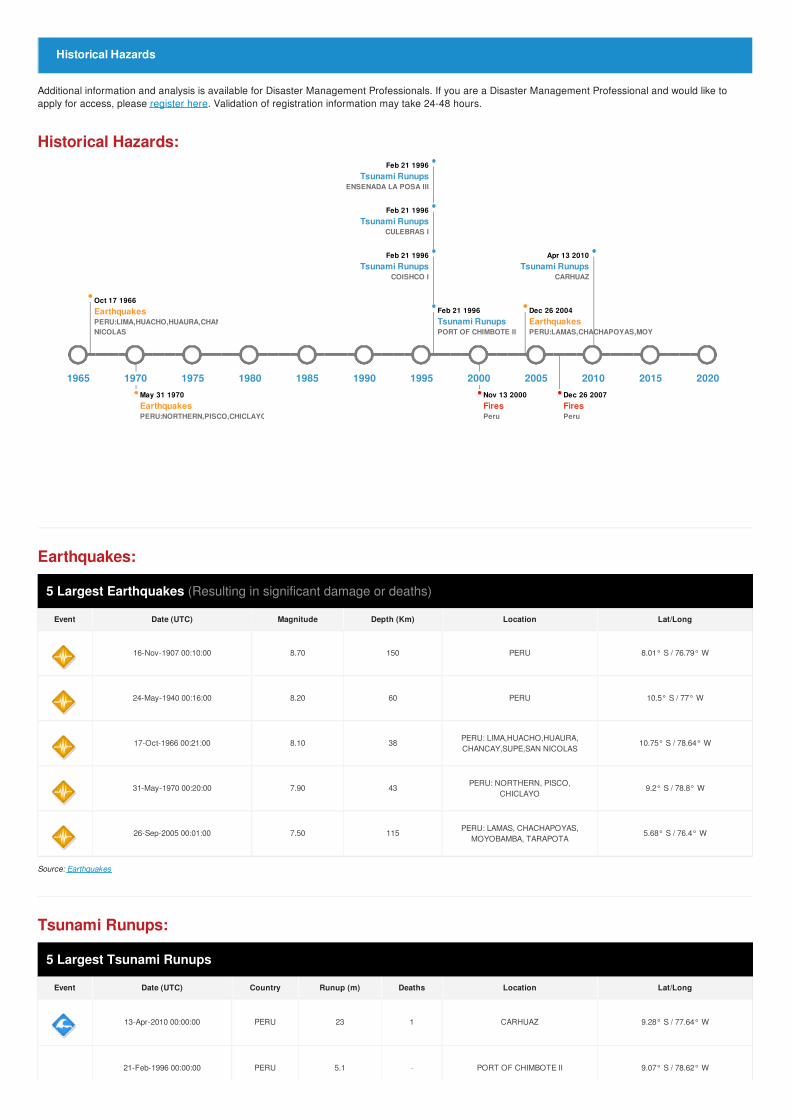
Mayobamba - Less than 50,000
Chachapoyas - Less than 50,000
Cajamarca - 50,000 to 99,999
Pucallpa - 100,000 to 249,999
Chimbote - 100,000 to 249,999
Huaraz - Less than 50,000
Huanuco - 50,000 to 99,999
Cerro De Pasco - 50,000 to 99,999
Populated Areas:
Multi Hazard Risk Index:Brazil ranks 89 out of 165 on the Multi-Hazard Risk Index with a score of 0.48. Brazil is estimated to have relatively high overall exposure, low vulnerability,and medium coping capacity.
Peru ranks 40 out of 165 on the Multi-Hazard Risk Index with a score of 0.56. Peru is estimated to have relatively high overall exposure, medium vulnerability,and medium coping capacity.
Source: PDC
Lack of Resilience Index:Lack of Resilience represents the combination of susceptibility to impact and the relative inability to absorb, respond to, and recover from negative impactsthat do occur over the short term. Brazil ranks 105 out of 165 on the Lack of Resilience index with a score of 0.37. Peru ranks 64 out of 165 on the Lack ofResilience index with a score of 0.46.
Brazil ranks 105 out of 165 on the Lack of Resilience Index. Based on the sub-component scores related to Vulnerability and Coping Capacity, the threethematic areas with the weakest relative scores are Marginalization, Governance and Infrastructure.
Peru ranks 64 out of 165 on the Lack of Resilience Index. Based on the sub-component scores related to Vulnerability and Coping Capacity, the threethematic areas with the weakest relative scores are Recent Disaster Impacts, Infrastructure and Governance.
Source: PDC
Additional information and analysis is available for Disaster Management Professionals. If you are a Disaster Management Professional and would like toapply for access, please register here. Validation of registration information may take 24-48 hours.
Mayobam
ba
Chachap
oyas
Cajam
arca
Pucallp
a
Chimbote
Huaraz
Huanuco
Cerro
De P
asco
0
50 000
100 000
150 000
200 000
250 000
300 000
Risk & Vulnerability
LowestRisk (0)
HighestRisk (1)
Lowest (0) Highest (1)
Brazil ChinaUnited States
PeruRussiaUnited States
PeruAustralia Russia Nigeria
BrazilAustralia China Nigeria
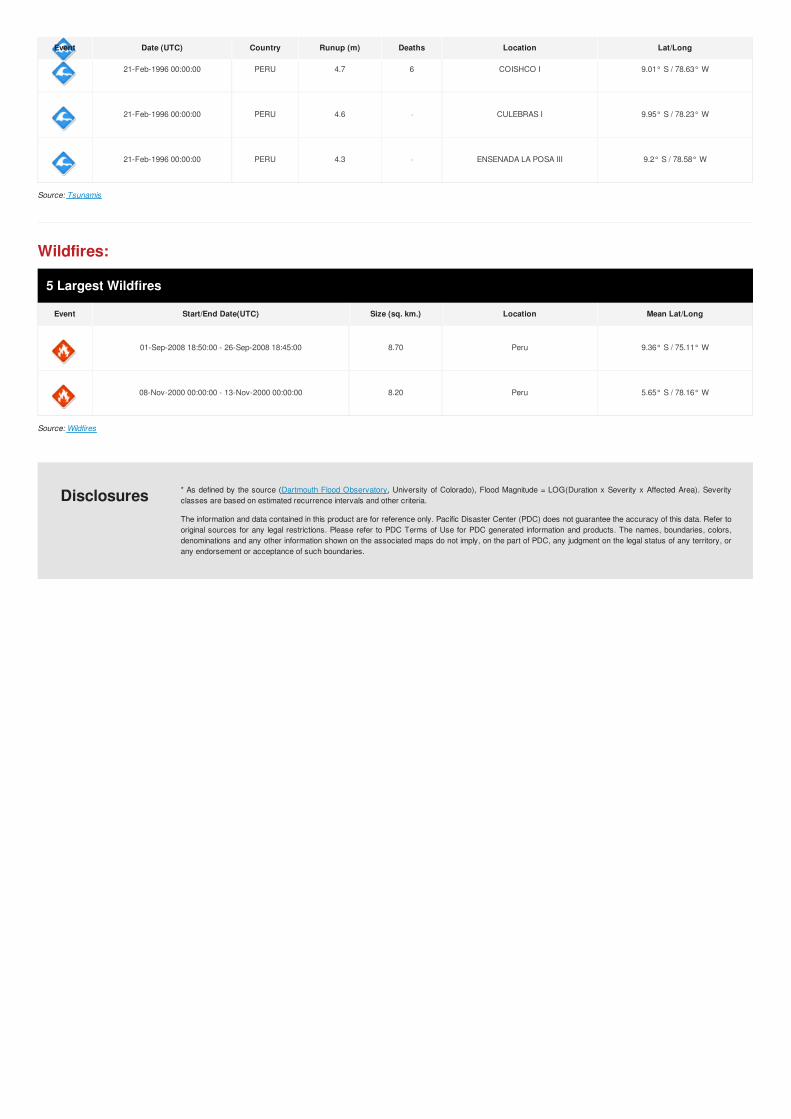
Historical Hazards:
Earthquakes:
5 Largest Earthquakes (Resulting in significant damage or deaths)
Event Date (UTC) Magnitude Depth (Km) Location Lat/Long
16-Nov-1907 00:10:00 8.70 150 PERU 8.01° S / 76.79° W
24-May-1940 00:16:00 8.20 60 PERU 10.5° S / 77° W
17-Oct-1966 00:21:00 8.10 38PERU: LIMA,HUACHO,HUAURA,CHANCAY,SUPE,SAN NICOLAS
10.75° S / 78.64° W
31-May-1970 00:20:00 7.90 43PERU: NORTHERN, PISCO,
CHICLAYO9.2° S / 78.8° W
26-Sep-2005 00:01:00 7.50 115PERU: LAMAS, CHACHAPOYAS,
MOYOBAMBA, TARAPOTA5.68° S / 76.4° W
Source: Earthquakes
Tsunami Runups:
5 Largest Tsunami Runups
Event Date (UTC) Country Runup (m) Deaths Location Lat/Long
13-Apr-2010 00:00:00 PERU 23 1 CARHUAZ 9.28° S / 77.64° W
21-Feb-1996 00:00:00 PERU 5.1 - PORT OF CHIMBOTE II 9.07° S / 78.62° W
Additional information and analysis is available for Disaster Management Professionals. If you are a Disaster Management Professional and would like toapply for access, please register here. Validation of registration information may take 24-48 hours.
Historical Hazards
May 31 1970EarthquakesPERU:NORTHERN,PISCO,CHICLAYO
Nov 13 2000FiresPeru
Dec 26 2007FiresPeru
Feb 21 1996Tsunami Runups
ENSENADA LA POSA III
Feb 21 1996Tsunami Runups
CULEBRAS I
Feb 21 1996Tsunami Runups
COISHCO I
Apr 13 2010Tsunami Runups
CARHUAZ
Oct 17 1966EarthquakesPERU:LIMA,HUACHO,HUAURA,CHANCAY,SUPE,SANNICOLAS
Feb 21 1996Tsunami RunupsPORT OF CHIMBOTE II
Dec 26 2004EarthquakesPERU:LAMAS,CHACHAPOYAS,MOYOBAMBA,TARAPOTA
1965 1970 1975 1980 1985 1990 1995 2000 2005 2010 2015 2020
21-Feb-1996 00:00:00 PERU 4.7 6 COISHCO I 9.01° S / 78.63° W
21-Feb-1996 00:00:00 PERU 4.6 - CULEBRAS I 9.95° S / 78.23° W
21-Feb-1996 00:00:00 PERU 4.3 - ENSENADA LA POSA III 9.2° S / 78.58° W
Event Date (UTC) Country Runup (m) Deaths Location Lat/Long
Source: Tsunamis
Wildfires:
5 Largest Wildfires
Event Start/End Date(UTC) Size (sq. km.) Location Mean Lat/Long
01-Sep-2008 18:50:00 - 26-Sep-2008 18:45:00 8.70 Peru 9.36° S / 75.11° W
08-Nov-2000 00:00:00 - 13-Nov-2000 00:00:00 8.20 Peru 5.65° S / 78.16° W
Source: Wildfires
* As defined by the source (Dartmouth Flood Observatory, University of Colorado), Flood Magnitude = LOG(Duration x Severity x Affected Area). Severityclasses are based on estimated recurrence intervals and other criteria.
The information and data contained in this product are for reference only. Pacific Disaster Center (PDC) does not guarantee the accuracy of this data. Refer tooriginal sources for any legal restrictions. Please refer to PDC Terms of Use for PDC generated information and products. The names, boundaries, colors,denominations and any other information shown on the associated maps do not imply, on the part of PDC, any judgment on the legal status of any territory, orany endorsement or acceptance of such boundaries.
Disclosures


![Technik, die Zeichen setzt - muenchen.deb199b9d9-cfb2-4407-b86c... · Source: Paul Barringer, Barringer & Associates ,Inc. 5 Förderhöhe [%] Fördermenge [%] ... 11 Außerdem: Lastgangmessung](https://img.pdfslide.net/doc/110x75/5b5439937f8b9a1f648cb4f3/technik-die-zeichen-setzt-b199b9d9-cfb2-4407-b86c-source-paul-barringer.jpg)


![An Introduction to AP Capstone SLT [Read-Only]files.ctctcdn.com › 3034687f001 › aacf7c19-4e61-466f-83cf-11... · 2016-02-15 · deliver a presentation Teachers & Students select](https://img.pdfslide.net/doc/110x75/5f0ce9a07e708231d437bf6d/an-introduction-to-ap-capstone-slt-read-onlyfiles-a-3034687f001-a-aacf7c19-4e61-466f-83cf-11.jpg)