Embed Size (px)
Citation preview

Current Research Trends in Geospatial Arena
– Australia & New Zealand Perspective
Dr Zaffar Sadiq Mohamed-Ghouse Director- Business, Research (NSW) & International Relations
Cooperative Research Centre for Spatial Information Australia [email protected]

The Australia and New Zealand Cooperative Research Centre for Spatial Information
First funded in 2004 - joint venture of about 100 government, academic and private sector organisations (until 2018) Undertakes user led research involving spatial technologies to solve complex problems of national significance for Australia and New Zealand Overall goal is to accelerate the spatial enablement of Australia & New Zealand
National Positioning Infrastructure, strengthening skilled capacity, supporting industry growth, ‘open data’, productivity improvements

Research partners… Government partners…

5
International Collaborations

The Australian Spatial Landscape
• GDP growth of around 2.5% in 2015 (around world average)
• Debt: Federal Government debt levels low by international standards (<30% of GDP)
• Productivity flat and of real concern to government and industry
• Strategy: Both the Business Council of Australia and the Chief Scientist calling for a national strategy, especially for STEM, and to also address education and skilled capacity building
• Increased interest from Government in having Australia retain ‘indigenous capability’ especially in GNSS and EO.
• The ‘Open’ agenda is driving Australian government to redefine their role in data production and management. They will do less creation, blend much more data with industry and community, focus more on standards, accept volunteered data, and contemplate more targeted regulation
• Increased tension between the ‘open’ agenda versus privacy and cyber security
• Impact of commoditisation
• BuildingSmart calling on the Australian Government to mandate use of BIM’s for building and planning
• Collaboration: Australian businesses that collaborate are 55% more likely to report increased productivity (Australian Innovation Systems Report, 2012)
6

7
Drivers Technology Drivers • Global Navigation Satellite Systems growth* • Satellite imaging growth*
• Web 3.0 semantic web*
• 3D and 4D fully topological and metric
• Digital Earth (Virtual reality) *
• Geolocation (Location Intelligence) *
• Sensor web and RFIDs (Internet of things)
• UAVs
Policy Drivers
• Open source, open access, open standards, open data*
• Government out sourcing *
• Space policy *
• Broadband
*CRCSI activity
All disruptive
All capable of leading to productivity increases

• Measure
• Integrate
• Deliver
• Use

• NATIONAL PRECISE POSITIONING
Focused on solving multi satellite (GPS etc.)
signal processing and economic impediments
to the creation of precise positioning services
operating at less than 2 cm (x/y) accuracies.
E.g. supports autonomous operations such as
remote mining.
• RAPID SPATIAL ANALYTICS
Improve the lag between data capture to
valued information generation through
automation, from devices and cloud-based
infrastructure.
E.g. Provide answers and not just data.
Internet of Things / Sensor Networks
Research Programs

• NEXT GENERATION SPATIAL
INFRASTRUCTURES
To identify and exploit the emerging
capabilities of the semantic web to enable
smarter and automatic data linkages along an
information supply chain to create value-added
applications.
E.g. Information discovery, linkage and output
generation through smarter data models and
cloud services to link.
Research Programs
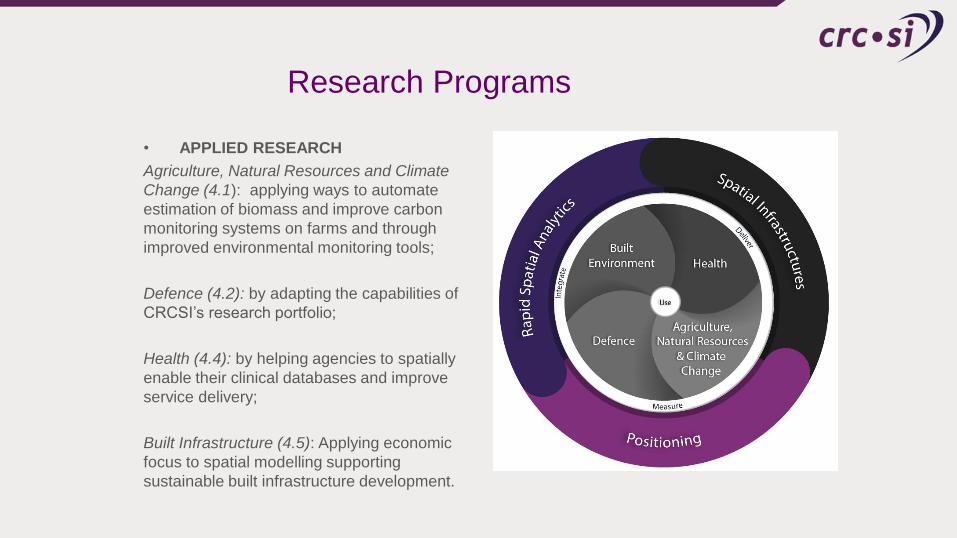
• APPLIED RESEARCH
Agriculture, Natural Resources and Climate
Change (4.1): applying ways to automate
estimation of biomass and improve carbon
monitoring systems on farms and through
improved environmental monitoring tools;
Defence (4.2): by adapting the capabilities of
CRCSI’s research portfolio;
Health (4.4): by helping agencies to spatially
enable their clinical databases and improve
service delivery;
Built Infrastructure (4.5): Applying economic
focus to spatial modelling supporting
sustainable built infrastructure development.
Research Programs

Evolution of the Web
SDIs in five years
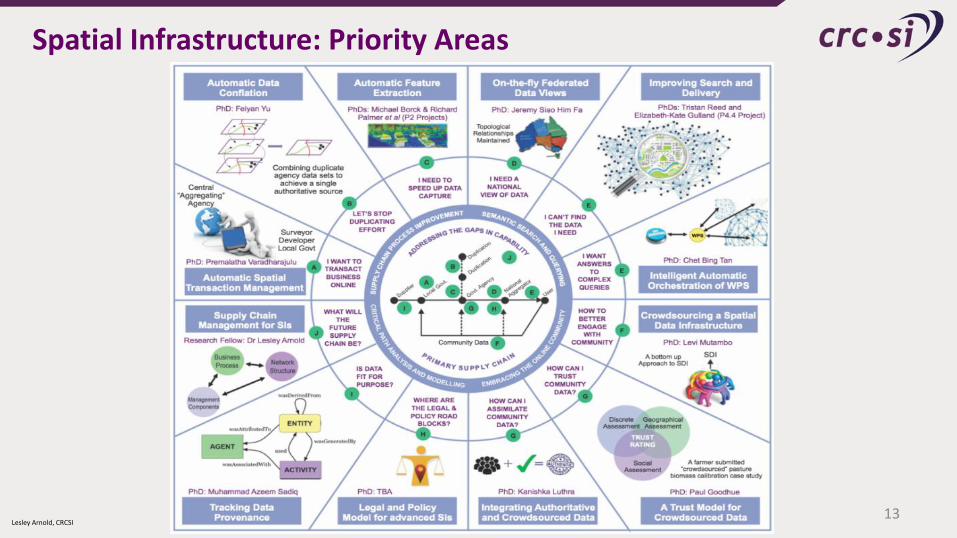
Spatial Infrastructure: Priority Areas
13 Lesley Arnold, CRCSI

ANZ Foundation Spatial Data Framework
Source: Office of Spatial Policy
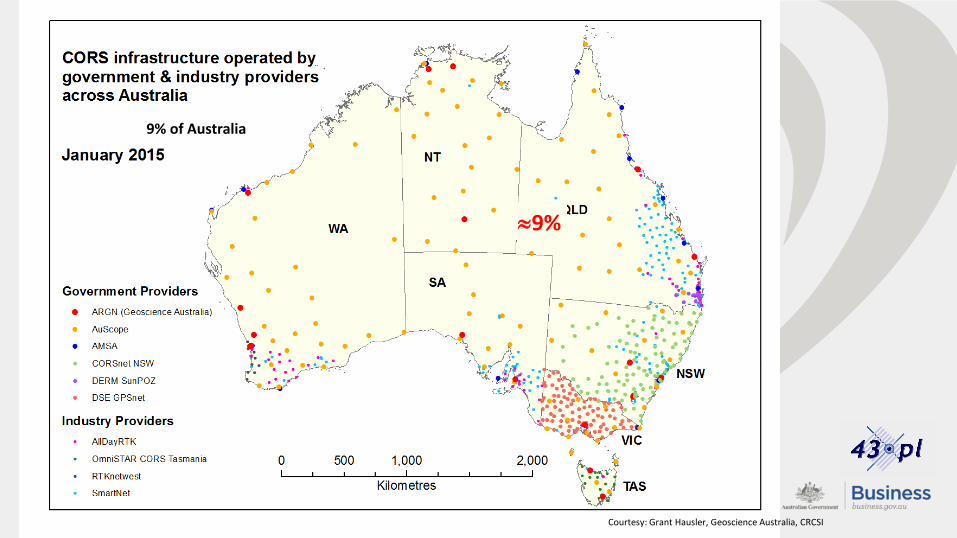
9%
9%
Courtesy: Grant Hausler, Geoscience Australia, CRCSI
9% of Australia

Source: http://www.telstra.com.au/mobile-phones/coverage-networks/our-coverage/
1. Precise Positioning cont. Australia’s current (Telstra) mobile phone coverage 30% of Australia
30%

The Japanese QZSS solution….
Launch program….
2010 – 1 satellite (“Michibiki”)
2018 – 4 satellites
2023 – 7 satellites (including
Courtesy: Suelynn Choy RMIT University
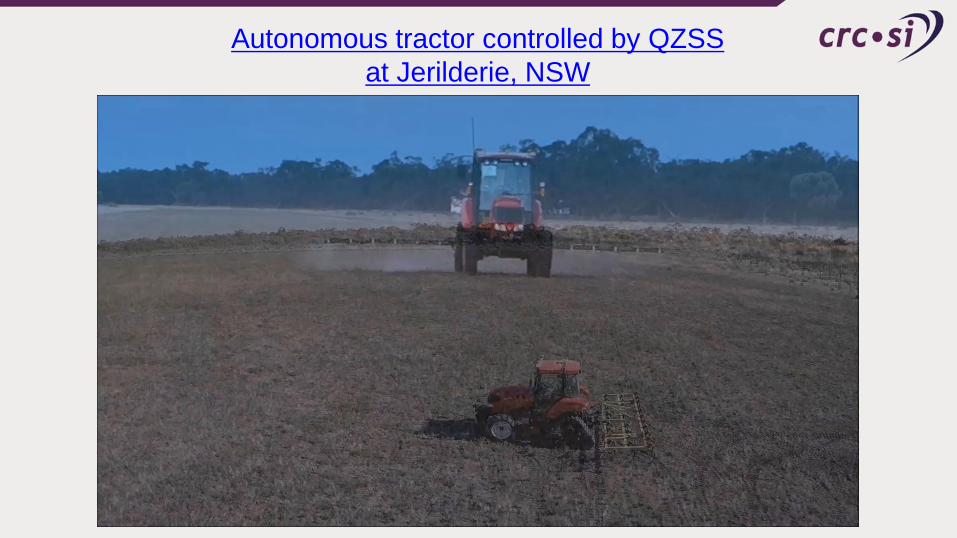
Autonomous tractor controlled by QZSS
at Jerilderie, NSW

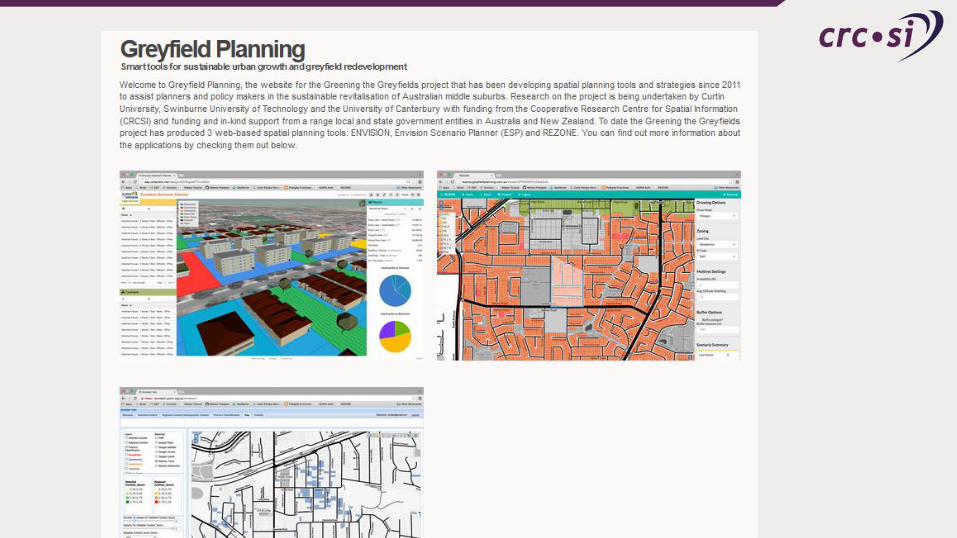
Urban Redevelopment: Greening the Greyfields
19
Objectives: • Develop a set of strategies and decision making
tools for urban planning • Delivers enhanced economic, social and
environmental outcomes for urban regeneration in the middle suburbs
Four modules: 1. Spatial understanding of Australian urban
economics 2. Shared urban spatial information platform 3. Visualisation tools to assess precinct level
greyfield re-developments
4. Community engagement tools for regenerating greyfields
5. ENVISION analysis tool being adopted by governments across Australia and New Zealand
Prof Peter Newman, Curtin and Prof Peter Newton, Swinburne

21
• CRCSI developed technology enables efficient, accurate capture infrastructure from planes
• Achieves what a pilot can not
• Gave rise to the world’s largest routine data capture program of powerline network (150,000km pa)
• Game changer – previously to fly 1/20th of this took days to plan, weeks to capture, months to process and analyse is now completed within 24 hrs
• System on track to save Ergon Energy $14M pa (reference Ergon CEO “The Australian” 17 Sept 2013)
• Technology licensed globally and spin off process well advanced
Infrastructure Capture – Powerline Flight Assist System
22
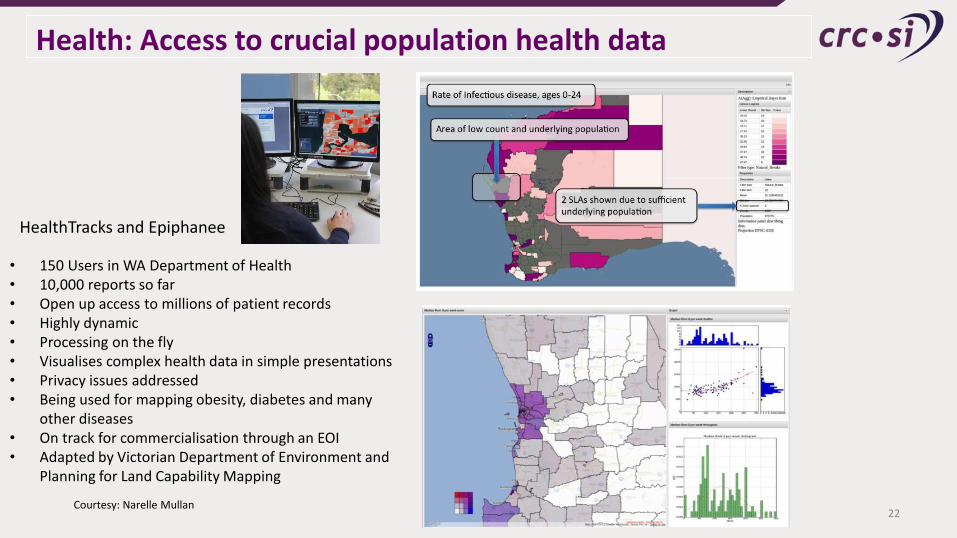
Health: Access to crucial population health data
HealthTracks and Epiphanee
• 150 Users in WA Department of Health • 10,000 reports so far • Open up access to millions of patient records • Highly dynamic • Processing on the fly • Visualises complex health data in simple presentations • Privacy issues addressed • Being used for mapping obesity, diabetes and many
other diseases • On track for commercialisation through an EOI • Adapted by Victorian Department of Environment and
Planning for Land Capability Mapping
Courtesy: Narelle Mullan

NRM Spatial Hub
Objective: Sustainable pasture and rangeland management
Caring for Our Country Program
Meat and Livestock Australia (MLA) Queensland Government
All NRM Regional Bodies.
Stage 1 funded for 2yrs (Mar 2014-16).
$1.6m cash and $2.8M in-kind
24 Courtesy: Phil Tickle
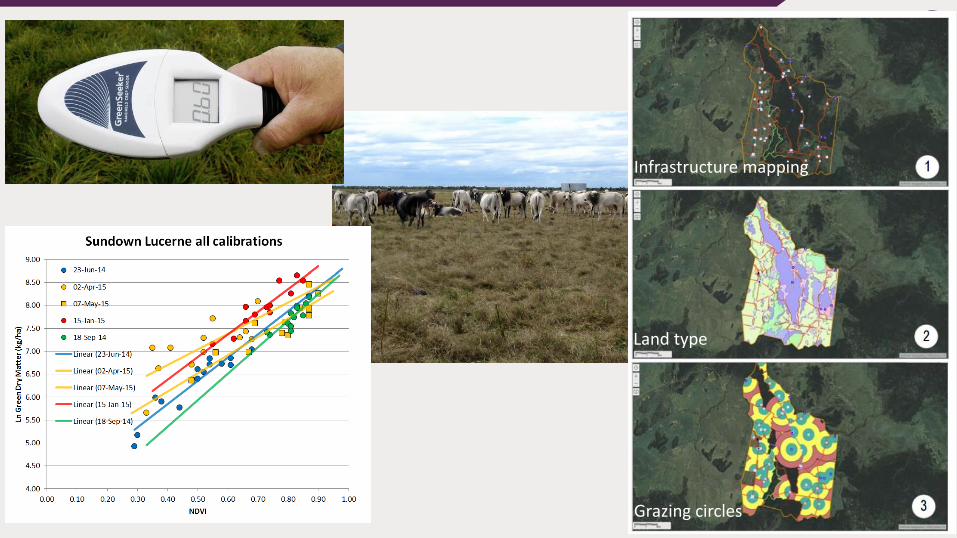
Infrastructure mapping
Land type
Grazing circles

Courtesy; Phil Wilkes, CRCSI PhD candidate RMIT
P 2.07. CRCSI
Canopy height profiles
Canopy height profiles from Airborne LiDAR data and forest inventory measurements. Key result: an automated approach to estimate canopy layers; position and density from airborne LiDAR. Will lead to the creation of a tool kit for widespread operational use.

Courtesy Will Woodgate CRCSI PhD candidate RMIT
Simulated upward-looking hemispherical photo
Rushworth forest, Victoria
P 2.07 : Uncertainty in key vegetation products
Oblique view of a simulated forest scene
Foliage and wood plant volume
density

A New Australian Datum
1990 2000 2010 2020
GDA94
GDA Dynamic
2015 GDA2020
ICSM/ANZLIC Adoption and User Implementation
Datum:
– Updated continuously as new observations are contributed and blunders detected
– Supports the continuous update of the national Geoid model
– Supports time-based corrections (i.e. deformation models)
– Has tools and services that facilitate its use by the mass-market
– To be known as ITRF2013 Courtesy: John Dawson, GA 28

29
National Priority – Coalition of Australian Governments
Coordinated national approach for acquisition and distribution
Applied research into acquisition, integration and analysis
Development of tools for analysis and visualisation systems
Data portal for data and derived products – 300,000 pdf downloads over 4 years (via Geoscience Australia website)
Online sea-level rise visualisation tool
National guidelines for collection and processing of data
200,000 km2 of 15cm DEMs covering 80% of Australia’s pop
Partnerships: National Elevation Data Framework

The Coastal Flooding Visualisation Tool

White House Launch of the Climate Data Initiative
https://www.youtube.com/watch?v=pfe5oRdsCp0

Driving National LiDAR Standards
• Over the last 5 years the standard has led to a dramatic improvement in data quality, interoperability, reduced investor risk and increased industry efficiency
• The Specifications have provided the basis for new automated tools for testing compliance and quality assurance (LiDAR QA) and a new tool has been developed (QA4LiDAR)
32

Pacific-Australia Climate Change Science and Adaptation
Planning (PACCSAP) Programme
Port Vila, Vanuatu LiDAR DSM and Aerial Photography
Vanimo, Papua New Guinea Coloured LiDAR Point Cloud
Nuku’alofa, Tonga Highest Tide 2090
1. LiDAR acquisition 2. Building tailored hardware and software 3. Comprehensive training program tailored to
each country 4. Developing a initial coastal risk assessment
reports for all survey areas Significant insights and lessons for future programs
33
Courtesy: Nathan Quadros

Future of Sea Level Rise and Coastal Flood Modelling
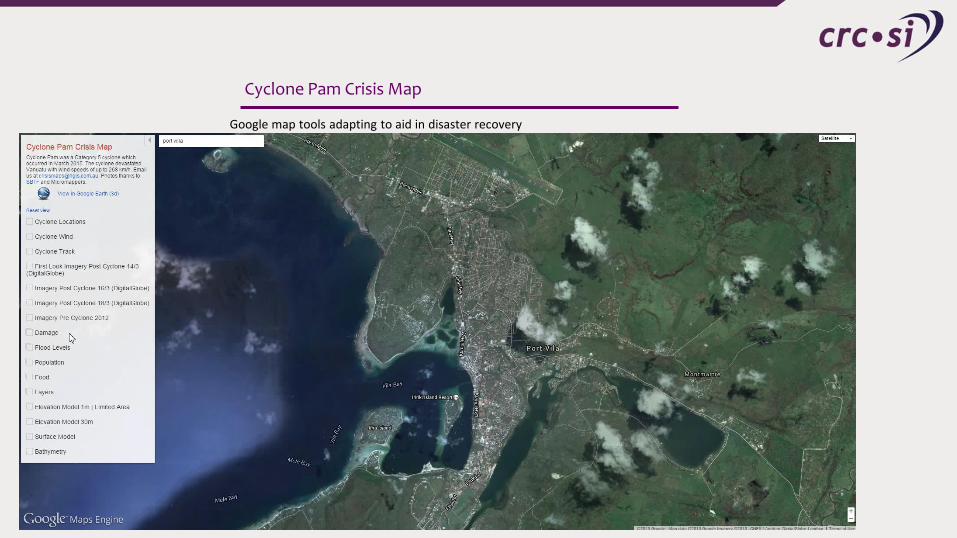
Cyclone Pam Crisis Map
Google map tools adapting to aid in disaster recovery


Impact
Initial Impact:
Benefits – $305M
Costs – $187M

Growth Areas/ New Opportunities post 2018
• Geodetic Research program & NPI research Engine
• Satellite Convergence Program
• Intelligent & Autonomous transport regulatory reform
• Real-Time Video Analysis (Satellites, Aerial etc)
• Renewable Energy
• BIM2GIS – Construction Industry
• Spatial enabling health Insurance data
• Medical and human imaging
• Fitness Devices, Biodata, Smart Homes and Internet of Things
• Centralised patient data records in health.

Summary
• Skilled resources in software tool development
• Excellent Consulting Skills with Multi-Disciplinary team
• Track record in Rapid Prototype Development based on client
needs and time frame
• Agile & Efficient project management structures
• Quality deliverables on time & within budget
• Won several Industry awards at local and global level

Future
This is the only spatial research organisation in Australia and New Zealand with
the critical mass, experience, requisite skill sets and established network of
collaboration to tackle complex spatial research challenges across three
sectors; government, private and research, in Australia and New Zealand.
What do we do
Developing, managing and delivering end user driven outcomes through
collaborative research, development and innovation partnerships.