Embed Size (px)
Citation preview

The opinions expressed in this presentation are those of the speaker. The International Society and International Foundation disclaim responsibility for views expressed and statements made by the program speakers.
Current Trends in Employee Health Plans:
How Does Your Plan Compare?
David Cooke, CEBSPrincipal
MercerChicago, Illinois
9A-1
A B O U T M E R C E R ’ S N A T I O N A L S U R V E Y O F E M P L O Y E R - S P O N S O R E D H E A L T H P L A N S
Oldest Marking 31 years of measuring health plan trends
Largest2,544 employers participated in 2016
Statistically valid Based on a probability sample of private and public employers for reliable results
Includes employers of all sizes, all industries, all regions Results project to all US employers with 10 or more employees
Most comprehensiveExtensive questionnaire covers a full range of health benefit issues and strategies
Employer size groups in presentationSmall: 10-499 employees / Large: 500+ employees / Jumbo: 20,000+ employees
9A-2
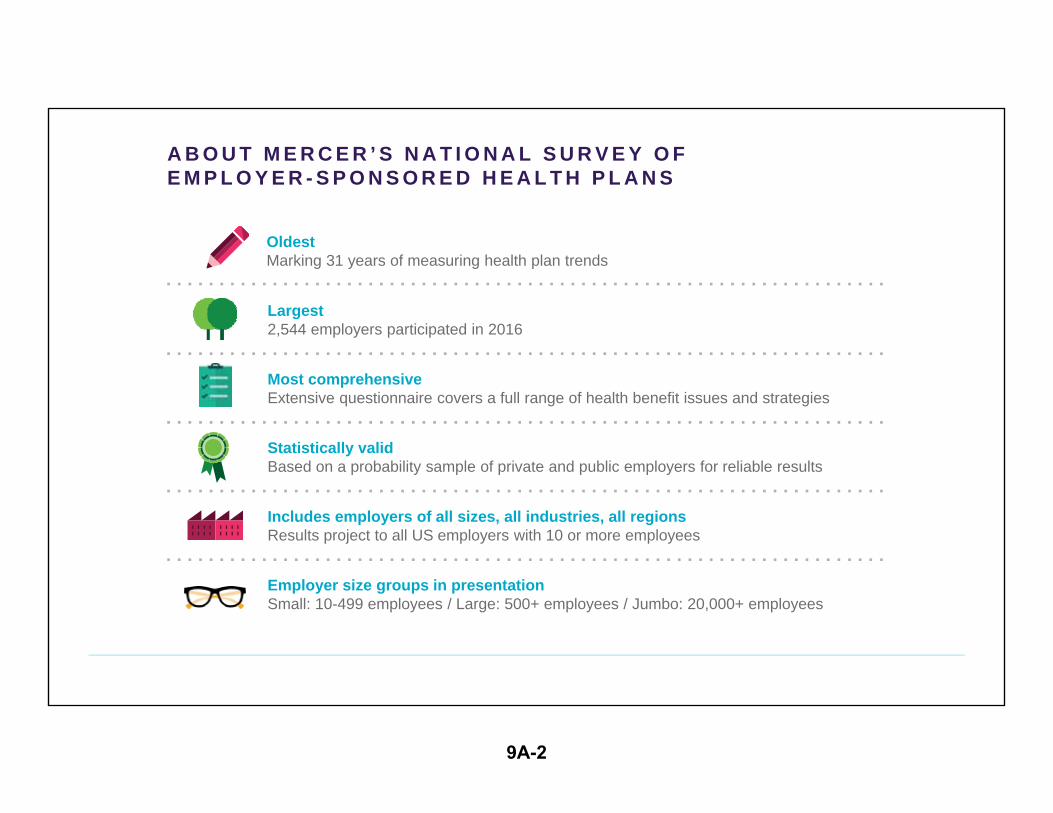
1Cost growth slowed to 2.4% in 2016 , but faster growth is predicted for 2017The underlying trend – the average cost increase before plan changes – remains around 6%, far outpacing inflation
2Enrollment in high-deductible CDHPs rose to 29% of covered employees, helping to slow cost Under excise tax threat, large employers continued to add CDHPs, most often as an option
3 Sharp increase in prescription drug cost is driving overall medical plan trendSpecialty Rx cost increases are in the double digits for many employers
4 With the growth in CDHPs, a move to personalize the consumer experienceEmployers add financial wellness and advocacy programs; offerings of telemedicine soar
5Network strategies—ACOs, Centers of Excellence, other narrow networks—increase the visibility of qualityEmployers look beyond cost-shifting to focus on pay for value and better quality
6 Analysis: 25 strategies that are helping employers achieve lower cost trendsSuccessful programs address pay for value, quality, personalized employee experience
H E A D L I N E S U R V E Y R E S U L T S
9A-3
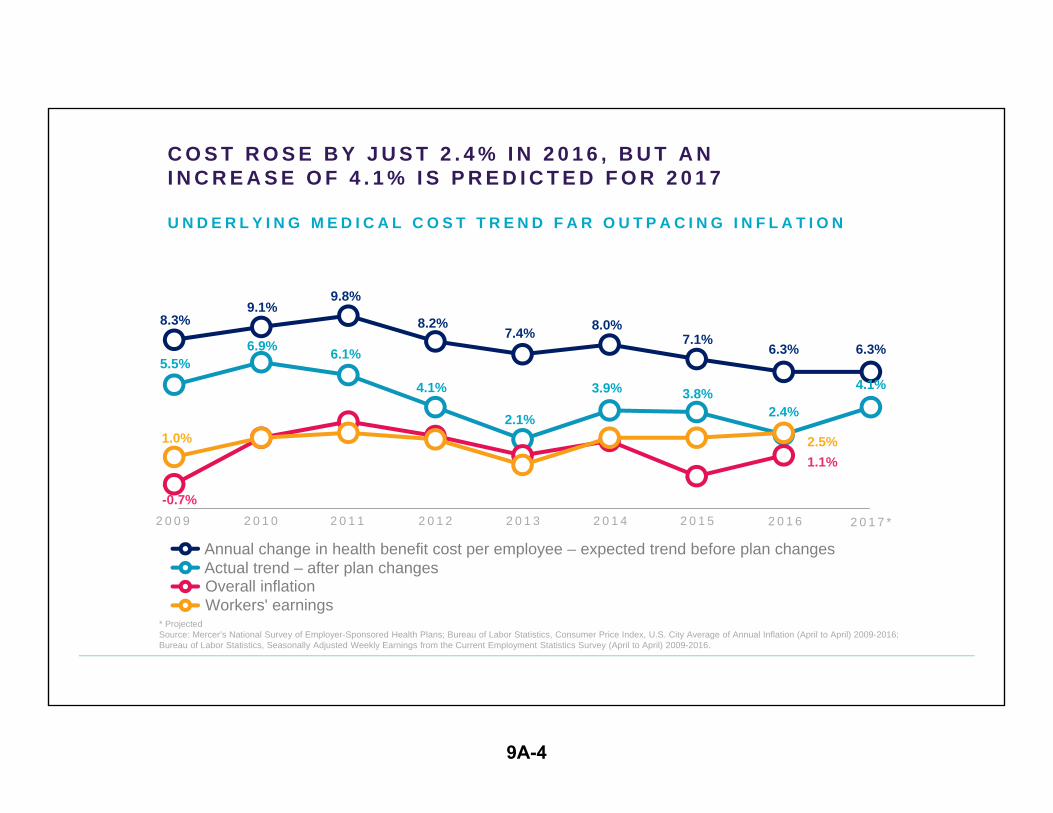
8.3%9.1%
9.8%
8.2%7.4% 8.0%
7.1%6.3% 6.3%
5.5%6.9% 6.1%
4.1%
2.1%
3.9% 3.8%2.4%
4.1%
-0.7%
1.1%
1.0% 2.5%
Annual change in health benefit cost per employee – expected trend before plan changesActual trend – after plan changes Overall inflation Workers' earnings
2 0 0 9 2 0 1 0 2 0 1 1 2 0 1 2 2 0 1 3 2 0 1 4 2 0 1 5
C O S T R O S E B Y J U S T 2 . 4 % I N 2 0 1 6 , B U T A NI N C R E A S E O F 4 . 1 % I S P R E D I C T E D F O R 2 0 1 7
U N D E R L Y I N G M E D I C A L C O S T T R E N D F A R O U T P A C I N G I N F L A T I O N
2 0 1 6 2 0 1 7 *
* ProjectedSource: Mercer’s National Survey of Employer-Sponsored Health Plans; Bureau of Labor Statistics, Consumer Price Index, U.S. City Average of Annual Inflation (April to April) 2009-2016; Bureau of Labor Statistics, Seasonally Adjusted Weekly Earnings from the Current Employment Statistics Survey (April to April) 2009-2016.
9A-4

$11,271 $12,173 $12,423 $12,147
$13,074 $11,697
$0
$2,000
$4,000
$6,000
$8,000
$10,000
$12,000
$14,000
10-499 500-999 1,000-4,999 5,000-9,999 10,000-19,999 20,000 ormore
C O S T R I S E S W I T H E M P L O Y E R S I Z E –E X C E P T F O R T H E V E R Y L A R G E S T E M P L O Y E R S
Average total health benefit cost per employee, by employer size
N U M B E R O F E M P L O Y E E S
9A-5

V
$1,113 $1,192
$1,410 $1,452
$1,663 $1,681 $1,738 $1,805
$511 $565 $587 $666 $684 $785 $833 $883
2009 2010 2011 2012 2013 2014 2015 2016
Small employersLarge employers
E M P L O Y E R S H A V E R E L I E D O N C O S T - S H I F T I N G T O C U R T A I L C O S T G R O W T H I N T H E H E A L T H R E F O R M E R A
Average PPO deductible for individual, in-network coverage
9A-6

v
11.5%
9.9% 9.3%
7.6% 7.6%6.3%
5.1% 5.2% 5.5% 5.4%
8.0% 7.4% 7.9%
0.0%
2.0%
4.0%
6.0%
8.0%
10.0%
12.0%
14.0%
2005 2006 2007 2008 2009 2010 2011 2012 2013 2014 2015 2016 2017
A K E Y C O S T D R I V E R I N 2 0 1 6 :A J U M P I N P R E S C R I P T I O N D R U G B E N E F I T C O S T
Cost change in prescription drug benefit offered throughprimary medical plan for large employers
3 2 % O F L A R G E E M P L O Y E R S R E P O R T E D A N I N C R E A S E I N T H E P E R - E M P L O Y E EC O S T O F S P E C I A L T Y D R U G S A T T H E L A S T R E N E W A L – O N A V E R A G E
2 4 % . 4 1 % D I D N ’ T K N O W , A N D 2 4 % S A I D C O S T S T A Y E D A B O U T T H E S A M E .
9A-7

63%
49%
35%
22%
13%
1,000 – 4,999 employees
500 - 999 employees
5,000 – 9,999 employees
D R U G B E N E F I T S H AV E B E E N C A R V E D O U T O F P R I M A RY M E D I C A L P L A N , B Y E M P L O Y E R S I Z E
10,000 – 19,999 employees
20,000 or more employees
9A-8
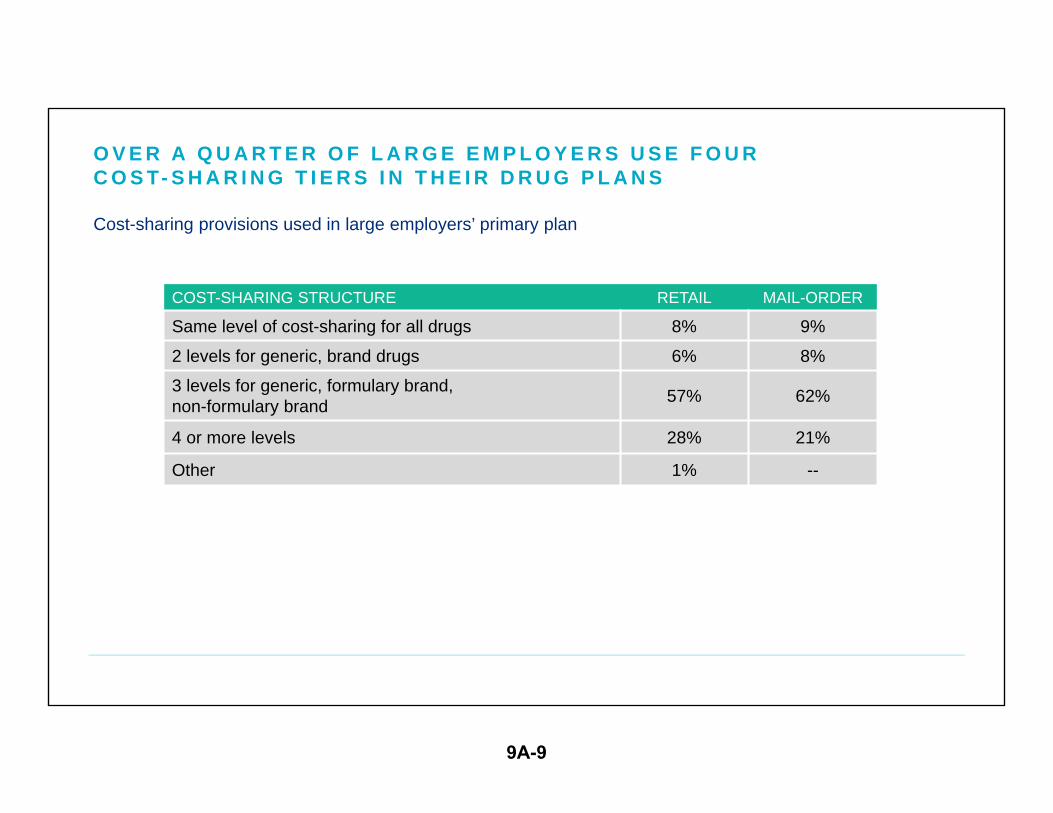
O V E R A Q U A R T E R O F L A R G E E M P L O Y E R S U S E F O U RC O S T- S H A R I N G T I E R S I N T H E I R D R U G P L A N S
Cost-sharing provisions used in large employers’ primary plan
COST-SHARING STRUCTURE RETAIL MAIL-ORDER
Same level of cost-sharing for all drugs 8% 9%
2 levels for generic, brand drugs 6% 8%
3 levels for generic, formulary brand, non-formulary brand 57% 62%
4 or more levels 28% 21%
Other 1% --
9A-9

AV E R A G E C O PAY M E N T A M O U N T S I N P R E S C R I P T I O N D R U G P L A N S
In large employers’ primary medical plan
RETAIL MAIL-ORDER
Generic $11 $22
Brand-name $32 $66
Non-formulary brand $55 $114
Specialty / biotech, when separate $115 $179
9A-10

28%
41%
25%
47%
51%
82%
13%
16%
17%
21%
35%
60%
Employers with 500+employeesEmployers with 20,000+employees
Step therapy
Mandatory generics with or without physician override
P R E S C R I P T I O N D R U G P L A N C O S T- M A N A G E M E N T F E AT U R E S
Mandatory mail order (after 2-4 retail fills)
Retail penalty program
Mandatory drug exclusions
Members may fill 90-day maintenance drugs at a specific retail pharmacy
9A-11
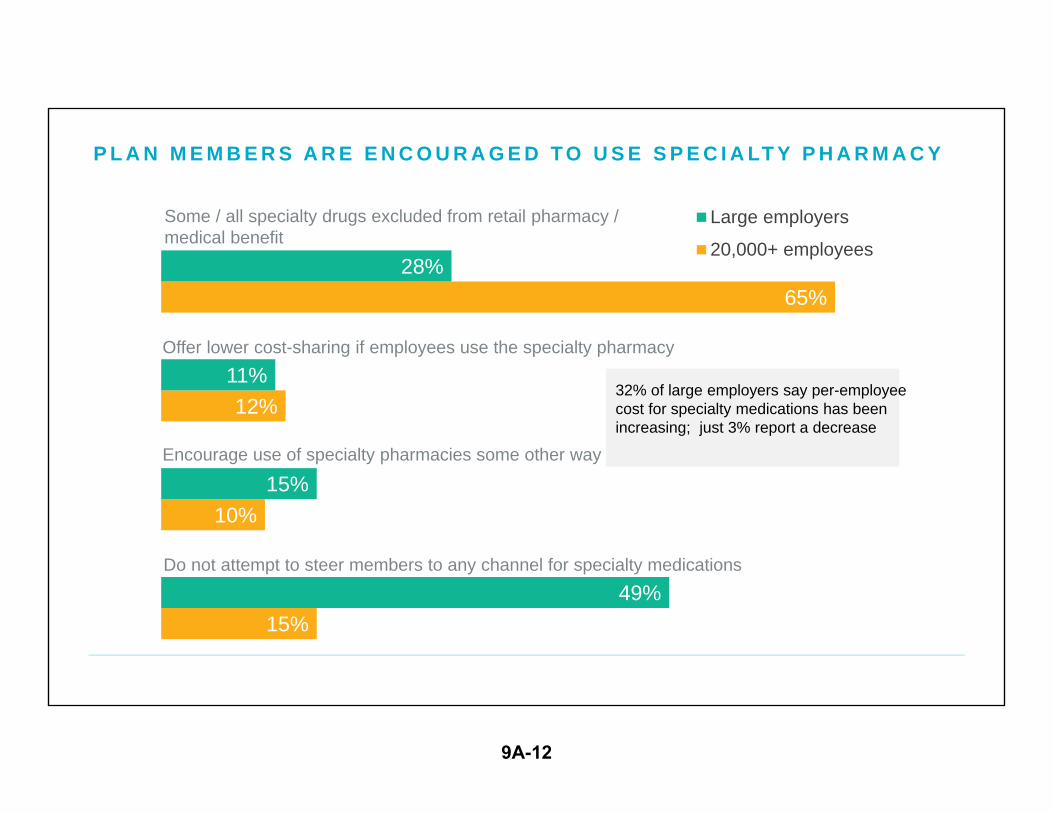
15%
10%
12%
65%
49%
15%
11%
28%
Large employers
20,000+ employees
Offer lower cost-sharing if employees use the specialty pharmacy
Some / all specialty drugs excluded from retail pharmacy / medical benefit
P L A N M E M B E R S A R E E N C O U R A G E D T O U S E S P E C I A LT Y P H A R M A C Y
Encourage use of specialty pharmacies some other way
Do not attempt to steer members to any channel for specialty medications
32% of large employers say per-employee cost for specialty medications has been increasing; just 3% report a decrease
9A-12

v
v
L I M I T I N G D E P E N D E N T C O V E R A G E : S O M E G R O W T H I N S P O U S A L S U R C H A R G E S A N D E X C L U S I O N S
Special provisions for employees’ spouses with other coverage available
8%12%11%
14%
2015
2016
E M P L O Y E R S W I T H 5 0 0 O R M O R E E M P L O Y E E S
Spouses with other coverageare not eligible
Spouses with other coverage mustpay surcharge
5%
26%
8%
27%
2015
2016
Spouses with other coverageare not eligible
Spouses with othercoverage mustpay surcharge
E M P L O Y E R S W I T H 2 0 , 0 0 0 O R M O R E E M P L O Y E E S
Median monthly surcharge: $100
Median monthly surcharge: $100
9A-13

T H E T O P C O S T - M A N A G E M E N T S T R A T E G Y :C O N S U M E R - D I R E C T E D H E A L T H P L A N S
Large employers
20%23%
32%36%
39%
48%
59% 61%
72%
8% 10%13% 15%
18%23%
28%33%
2009 2010 2011 2012 2013 2014 2015 2016 By 2019(projected)
Percent of employers offering CDHPs
Percent of covered employees enrolled inCDHPs
By 2019, 72% of large employers expect to offer a CDHP
9A-14

S L O W D O W N I N N E W C D H P I M P L E M E N T A T I O N S I N 2 0 1 6 –C H A L L E N G E I S T O G R O W E N R O L L M E N T I N E X I S T I N G P L A N SPercent of employers offering / likely to offer CDHP, by employer size
N U M B E R O F E M P L O Y E E S 2 0 1 1 2 0 1 2 2 0 1 3 2 0 1 4 2 0 1 5 2 0 1 6
E X P E C T T O O F F E R
I N 2 0 1 9
Small employers (10-499 employees) 20% 22% 23% 26% 28% 25% 34%
All large employers (500+ employees) 32% 36% 39% 48% 59% 61% 72%
Jumbo employers (20,000+ employees) 48% 59% 63% 72% 73% 80% 87%
9A-15
v
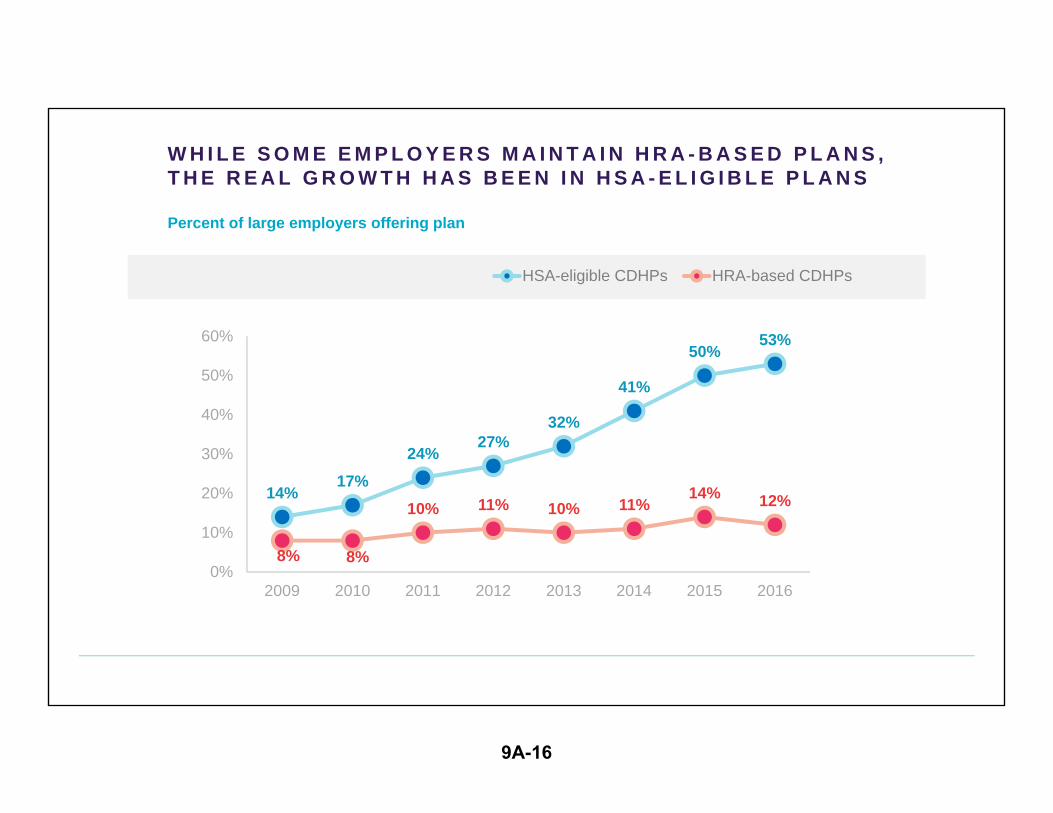
14%17%
24%27%
32%
41%
50%53%
8% 8%
10% 11% 10% 11%14% 12%
0%
10%
20%
30%
40%
50%
60%
2009 2010 2011 2012 2013 2014 2015 2016
HSA-eligible CDHPs HRA-based CDHPs
W H I L E S O M E E M P L O Y E R S M A I N T A I N H R A - B A S E D P L A N S , T H E R E A L G R O W T H H A S B E E N I N H S A - E L I G I B L E P L A N S
Percent of large employers offering plan
9A-16
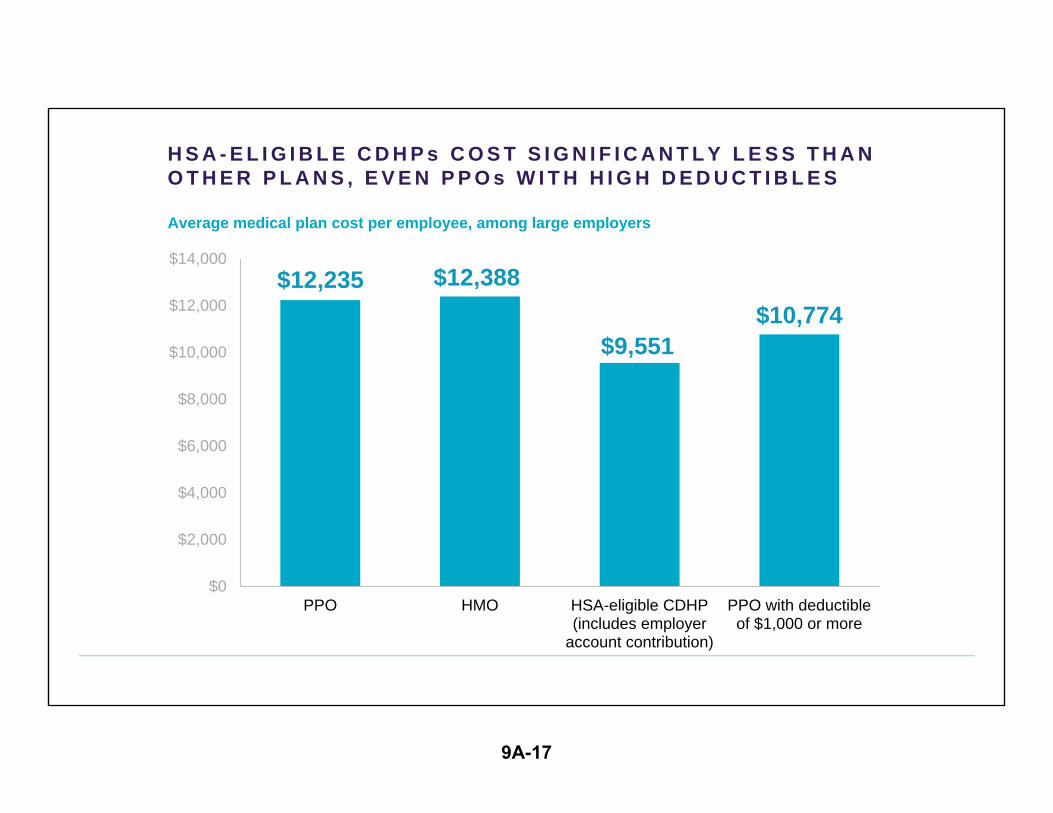
H S A - E L I G I B L E C D H P s C O S T S I G N I F I C A N T L Y L E S S T H A N O T H E R P L A N S , E V E N P P O s W I T H H I G H D E D U C T I B L E S
Average medical plan cost per employee, among large employers
$12,235 $12,388
$9,551$10,774
$0
$2,000
$4,000
$6,000
$8,000
$10,000
$12,000
$14,000
PPO HMO HSA-eligible CDHP(includes employer
account contribution)
PPO with deductibleof $1,000 or more
9A-17
v
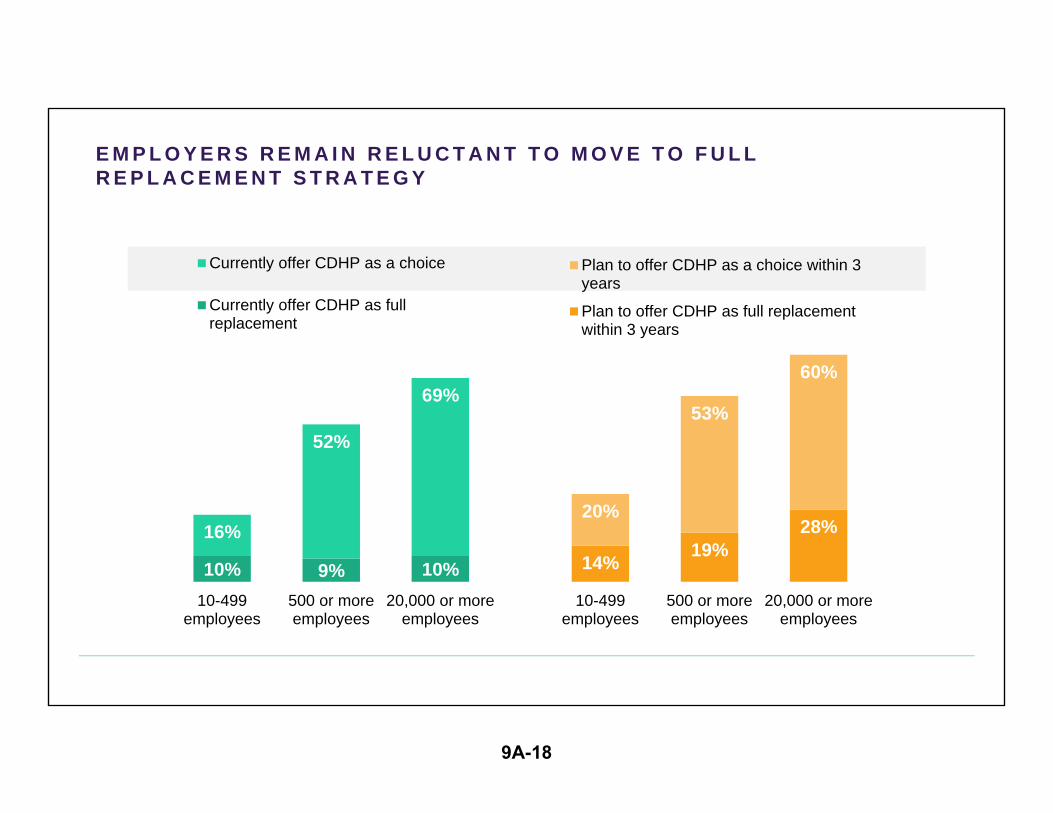
E M P L O Y E R S R E M A I N R E L U C T A N T T O M O V E T O F U L L R E P L A C E M E N T S T R A T E G Y
10% 9% 10%
16%
52%
69%
10-499employees
500 or moreemployees
20,000 or moreemployees
Currently offer CDHP as a choice
Currently offer CDHP as fullreplacement
14% 19%28%
20%
53%
60%
10-499employees
500 or moreemployees
20,000 or moreemployees
Plan to offer CDHP as a choice within 3years
Plan to offer CDHP as full replacementwithin 3 years
9A-18
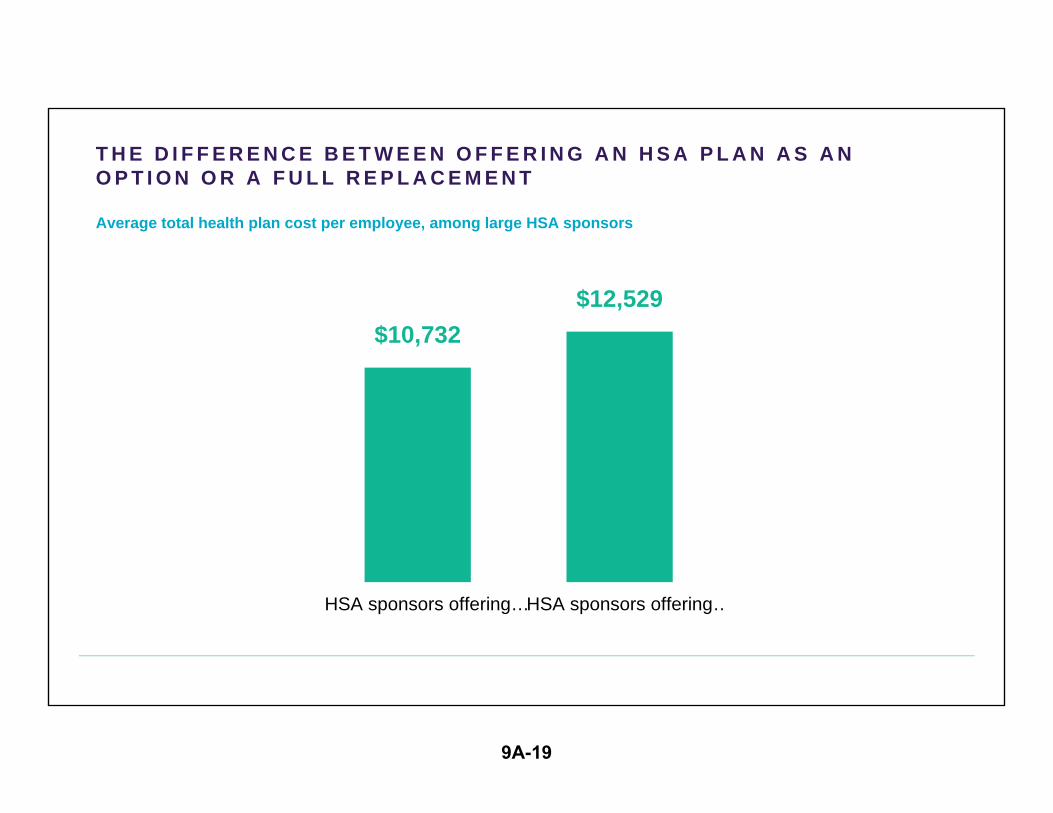
T H E D I F F E R E N C E B E T W E E N O F F E R I N G A N H S A P L A N A S A N O P T I O N O R A F U L L R E P L A C E M E N T
Average total health plan cost per employee, among large HSA sponsors
$10,732 $12,529
HSA sponsors offering…HSA sponsors offering…
9A-19
1
1
1
1
<1
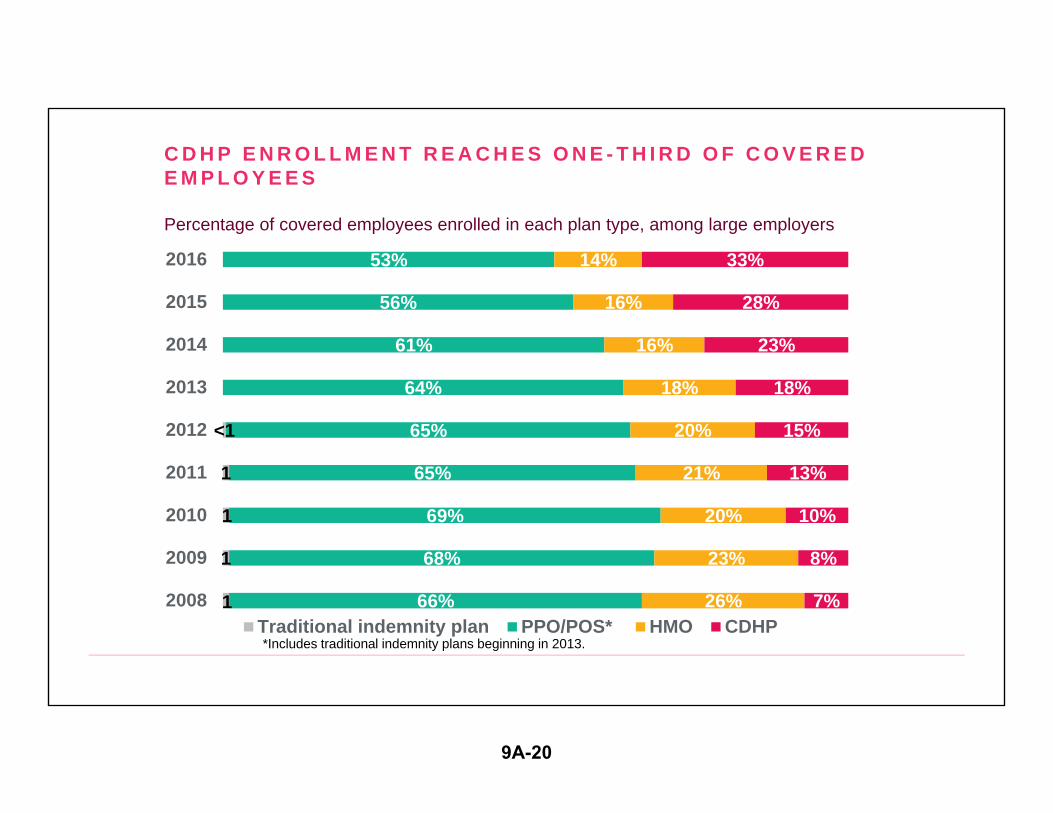
66%
68%
69%
65%
65%
64%
61%
56%
53%
26%
23%
20%
21%
20%
18%
16%
16%
14%
7%
8%
10%
13%
15%
18%
23%
28%
33%
2008
2009
2010
2011
2012
2013
2014
2015
2016
Traditional indemnity plan PPO/POS* HMO CDHP*Includes traditional indemnity plans beginning in 2013.
C D H P E N R O L L M E N T R E A C H E S O N E - T H I R D O F C O V E R E D E M P L O Y E E S
Percentage of covered employees enrolled in each plan type, among large employers
9A-20
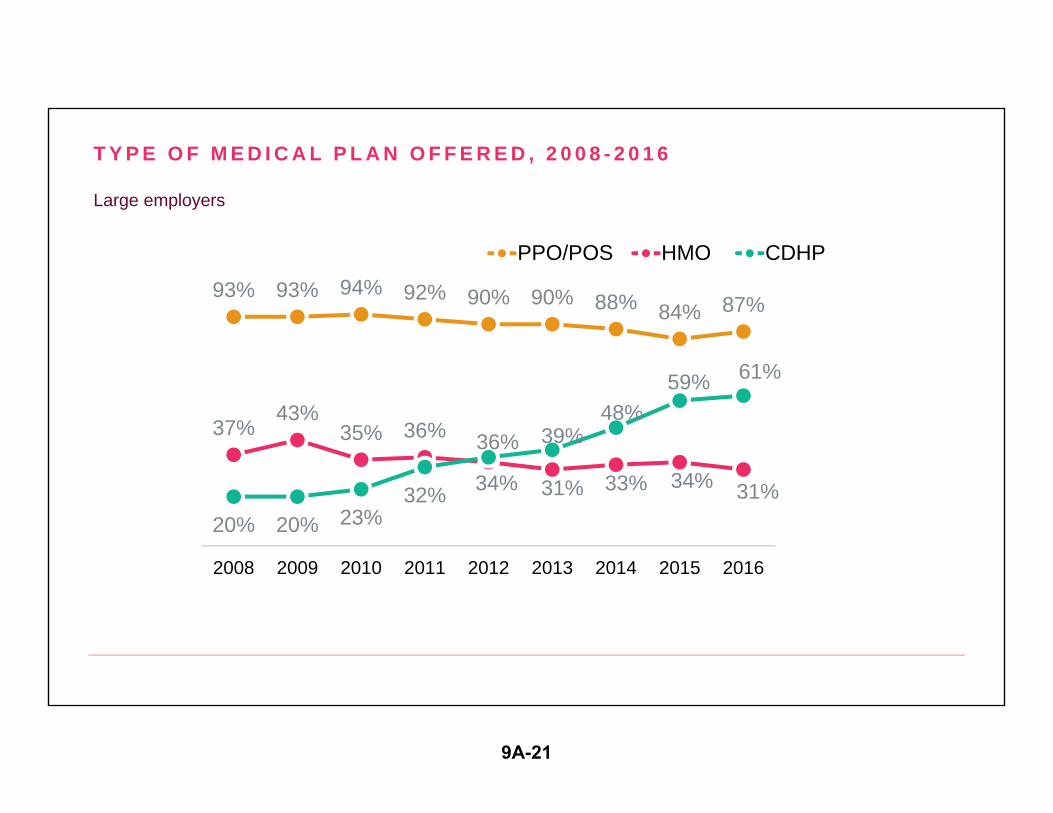
T Y P E O F M E D I C A L P L A N O F F E R E D , 2 0 0 8 - 2 0 1 6
Large employers
93% 93% 94% 92% 90% 90% 88% 84% 87%
37%43%
35% 36%
34% 31% 33% 34% 31%20% 20% 23%
32%
36% 39%48%
59% 61%
2008 2009 2010 2011 2012 2013 2014 2015 2016
PPO/POS HMO CDHP
9A-21
v
60%
v
v
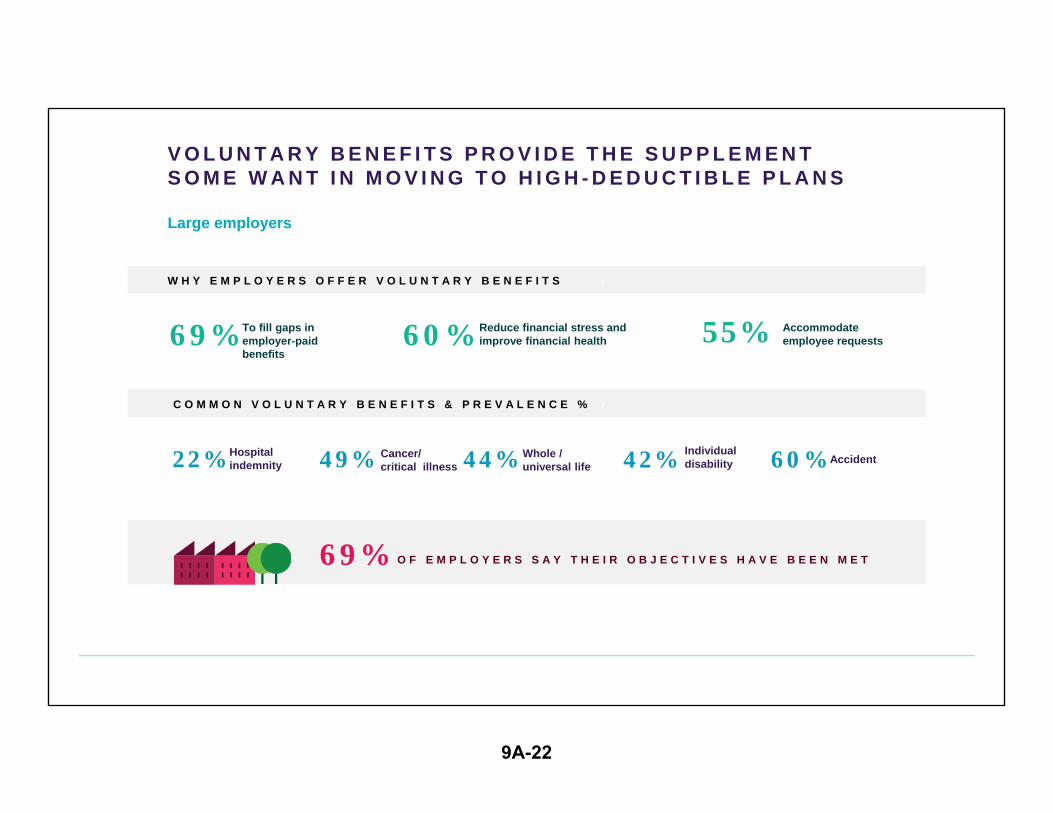
V O L U N T A R Y B E N E F I T S P R O V I D E T H E S U P P L E M E N T S O M E W A N T I N M O V I N G T O H I G H - D E D U C T I B L E P L A N S
Large employers
Cancer/critical illness Accident
Individual disability
Whole /universal life
Hospital indemnity
To fill gaps in employer-paid benefits
Reduce financial stress and improve financial health
Accommodateemployee requests
W H Y E M P L O Y E R S O F F E R V O L U N T A R Y B E N E F I T S
O F E M P L O Y E R S S A Y T H E I R O B J E C T I V E S H A V E B E E N M E T
C O M M O N V O L U N T A R Y B E N E F I T S & P R E V A L E N C E %
69% 60% 55%
22% 49% 44% 42%
69%
9A-22

v
v
H E L P I N G E M P L O Y E E S S A V E O N O F F I C E V I S I T S : T E L E M E D I C I N E I S F A S T - G R O W I N G T R E N D
Percent of employers offering telemedicine
11%18%
30%
59%
18%34%
44%
70%
2013 2014 2015 2016
All large employers Employers with 20,000+ employees
A M O N G L A R G E E M P L O Y E R S O F F E R I N G T E L E M E D I C I N E
13%Require coinsurance
64%Require a copay
$25Is the median copay
9A-23
v
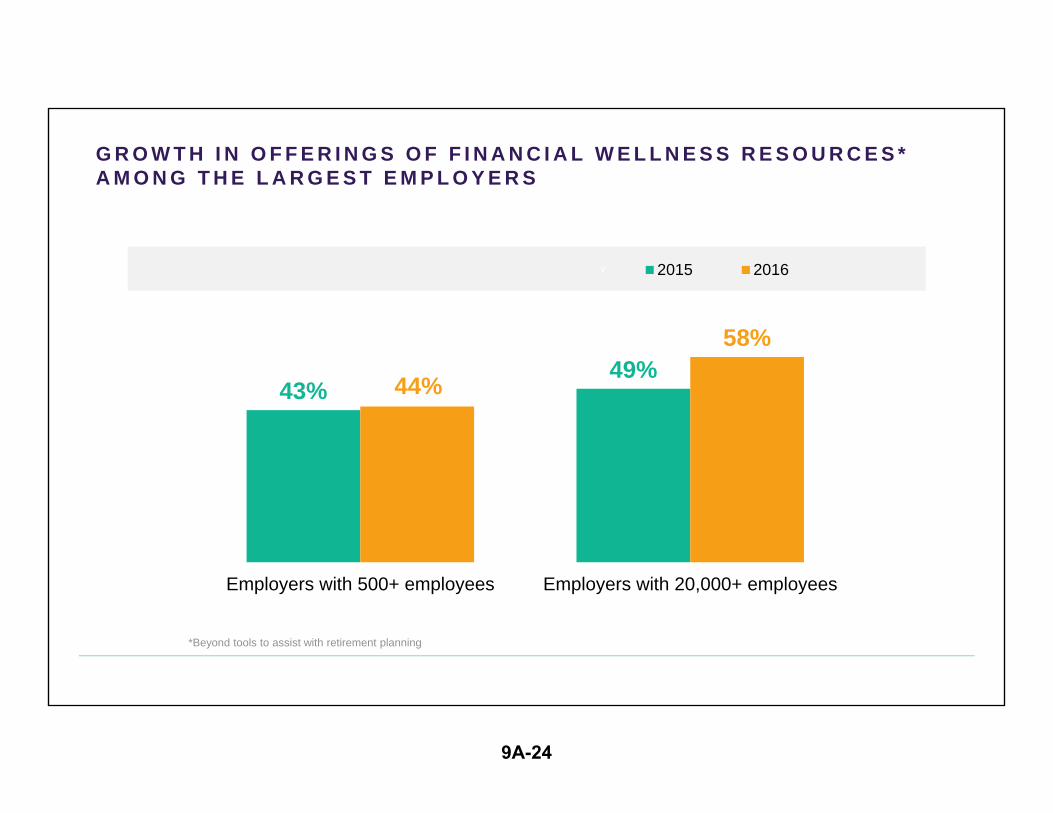
G R O W T H I N O F F E R I N G S O F F I N A N C I A L W E L L N E S S R E S O U R C E S * A M O N G T H E L A R G E S T E M P L O Y E R S
43%49%44%
58%
Employers with 500+ employees Employers with 20,000+ employees
2015 2016
*Beyond tools to assist with retirement planning
9A-24

B U T W H I L E C O S T - S H I F T I N G A N D C O N S U M E R I S M H A V E H E L P E D H O L D D O W N C O S T G R O W T H , I T ’ S N O T E N O U G H
Only about 30% of healthcare cost is “shoppable”
• Healthcare consumers may be able to compare costs for non-urgent care like a physician office visit or MRI, but not in the face of an emergency or critical illness
• A range of options for healthcare services doesn’t exist in all markets
Research shows CDHP enrollees spend more out of pocket and use fewer services
• Concerns remain about whether, or at what point, lower utilization adversely affects health
Once everyone is in a high-deductible health plan, where do cost-savings come from?
9A-25
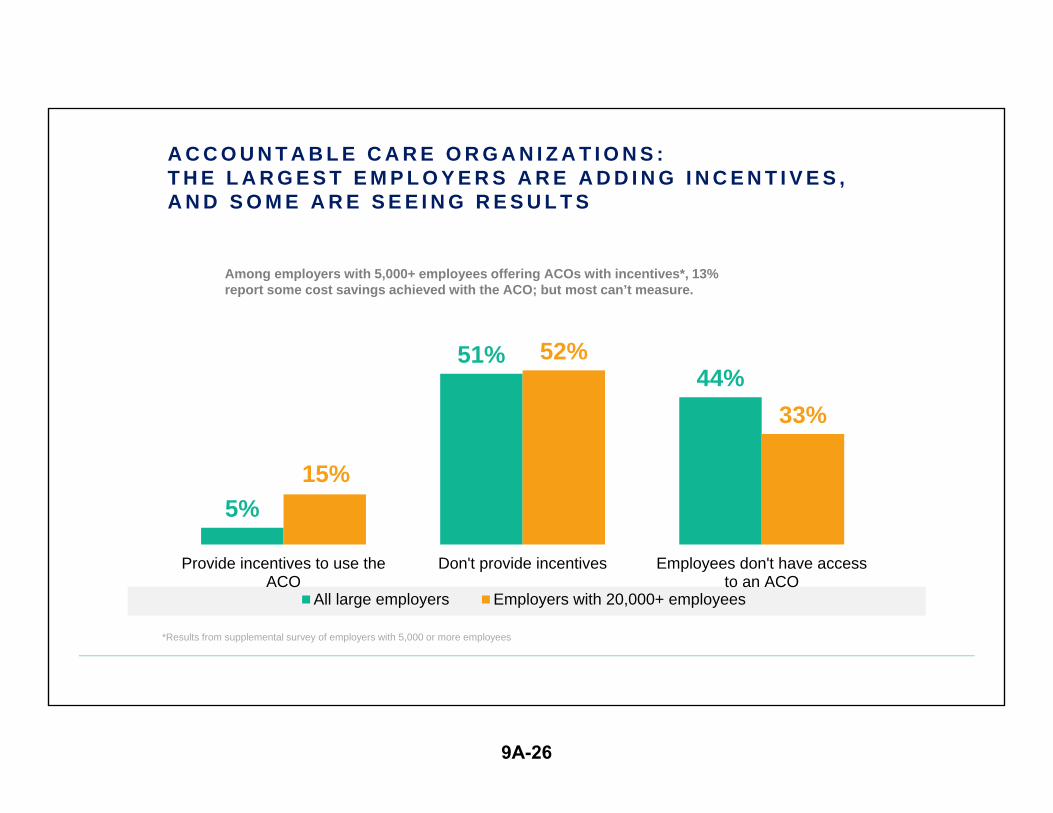
A C C O U N T A B L E C A R E O R G A N I Z A T I O N S :T H E L A R G E S T E M P L O Y E R S A R E A D D I N G I N C E N T I V E S , A N D S O M E A R E S E E I N G R E S U L T S
5%
51%44%
15%
52%
33%
Provide incentives to use theACO
Don't provide incentives Employees don't have accessto an ACO
All large employers Employers with 20,000+ employees
Among employers with 5,000+ employees offering ACOs with incentives*, 13% report some cost savings achieved with the ACO; but most can’t measure.
*Results from supplemental survey of employers with 5,000 or more employees
9A-26

S U R G I C A L C E N T E R S O F E X C E L L E N C E
13%
54%
34%31%
50%
19%
Provide incentives to usesurgical centers of excellence
Don't provide incentives Employees don't have access tosurgical centers of excellence
All large employers Employers with 20,000+ employees
Among employers with 5,000+ employees offering COEs with incentives*, 31% have direct provider contracts or customized carrier arrangement
*Results from supplemental survey of employers with 5,000 or more employees
9A-27

v
P R O V I D E W O R K S I T E O R N E A R - S I T E M E D I C A L C L I N I C F O R P R I M A R Y C A R E S E R V I C E S
24%29% 31% 32%25%
31%36%
40%
0%5%
10%15%20%25%30%35%40%45%
2013 2014 2015 2016
Employers with 5,000 or more employeesEmployers with 20,000 or more employees
* From supplemental survey of employers with 5,000 or more employees
M O R E T H A N H A L F O F R E S P O N D E N T S W I T H A N O N S I T E C L I N I C ( 5 8 % )S A Y T H A T I T I S I N T E G R A T E D W I T H T H E I R P O P U L A T I O N H E A L T H I N I T I A T I V E S *
9A-28
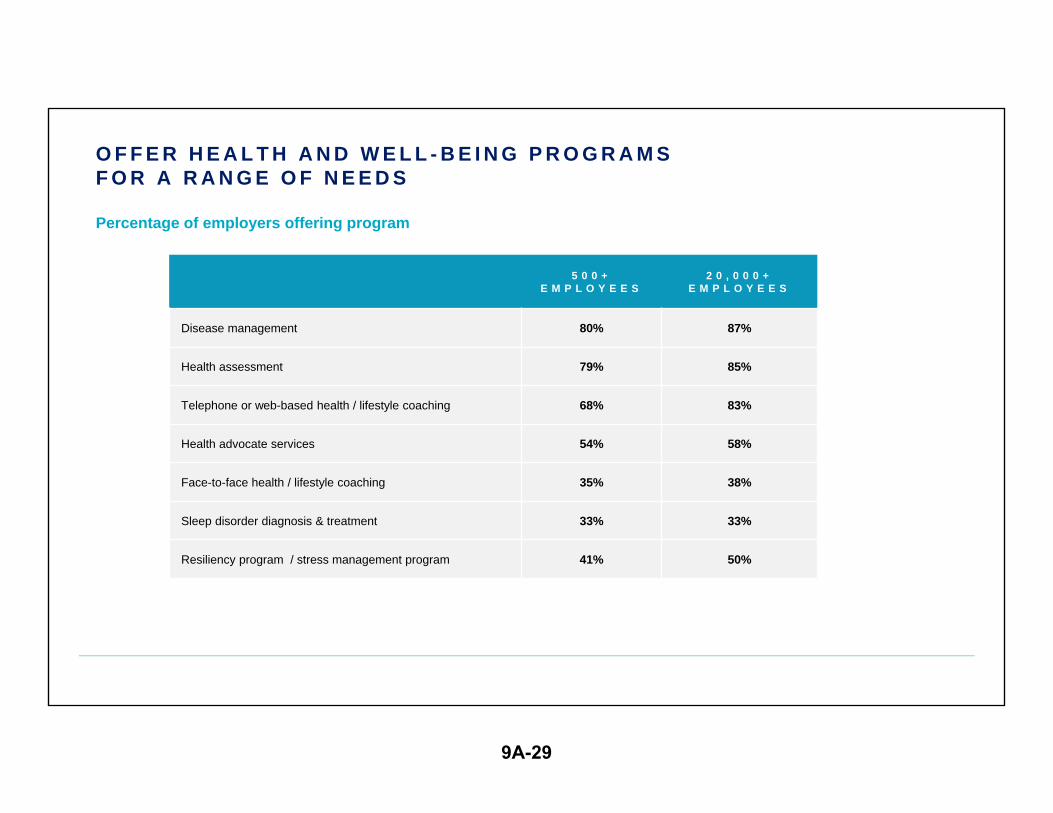
O F F E R H E A L T H A N D W E L L - B E I N G P R O G R A M SF O R A R A N G E O F N E E D S
Percentage of employers offering program
5 0 0 + E M P L O Y E E S
2 0 , 0 0 0 + E M P L O Y E E S
Disease management 80% 87%
Health assessment 79% 85%
Telephone or web-based health / lifestyle coaching 68% 83%
Health advocate services 54% 58%
Face-to-face health / lifestyle coaching 35% 38%
Sleep disorder diagnosis & treatment 33% 33%
Resiliency program / stress management program 41% 50%
9A-29
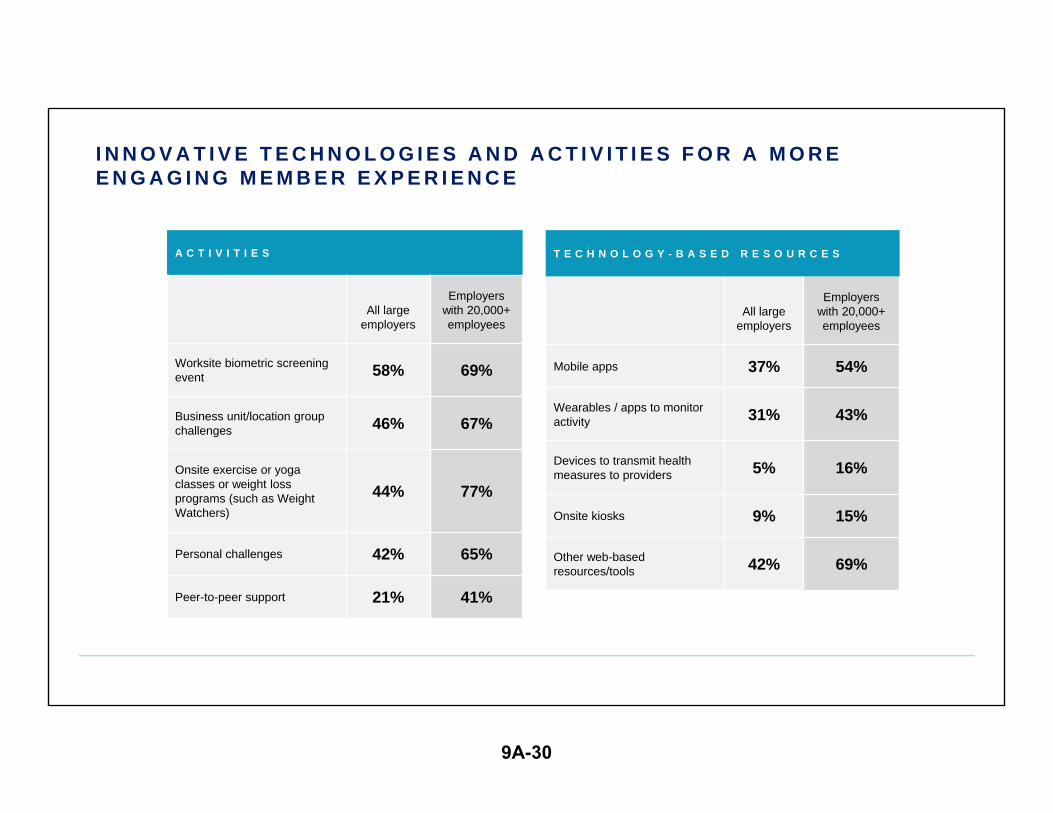
I N N O V A T I V E T E C H N O L O G I E S A N D A C T I V I T I E S F O R A M O R E E N G A G I N G M E M B E R E X P E R I E N C E
A C T I V I T I E S
All large employers
Employers with 20,000+ employees
Worksite biometric screening event 58% 69%
Business unit/location group challenges 46% 67%
Onsite exercise or yoga classes or weight loss programs (such as Weight Watchers)
44% 77%
Personal challenges 42% 65%
Peer-to-peer support 21% 41%
T E C H N O L O G Y - B A S E D R E S O U R C E S
All large employers
Employers with 20,000+ employees
Mobile apps 37% 54%
Wearables / apps to monitor activity 31% 43%
Devices to transmit health measures to providers 5% 16%
Onsite kiosks 9% 15%
Other web-based resources/tools 42% 69%
9A-30

v
4%
17%
24%
64%
Financial penalties, such as higher premiums, loss of plan eligibility
O F F E R I N C E N T I V E S I N C O N N E C T I O N W I T HW E L L - B E I N G P R O G R A M S
Large employers
Financial rewards, such as lower premiums, cash/gift cards
Non-financial rewards, such as lottery, recognition, token gifts
Charitable contributions on behalf of members
E A R N E D F O R
Participation 66%
Outcomes 29%
No incentives provided 25%
M A X I M U MA N N U A L V A L U E
M E D I A N
Participation $300
Outcomes $350
2015 2016
Offer lower premium for non-tobacco use
22% 26%
9A-31
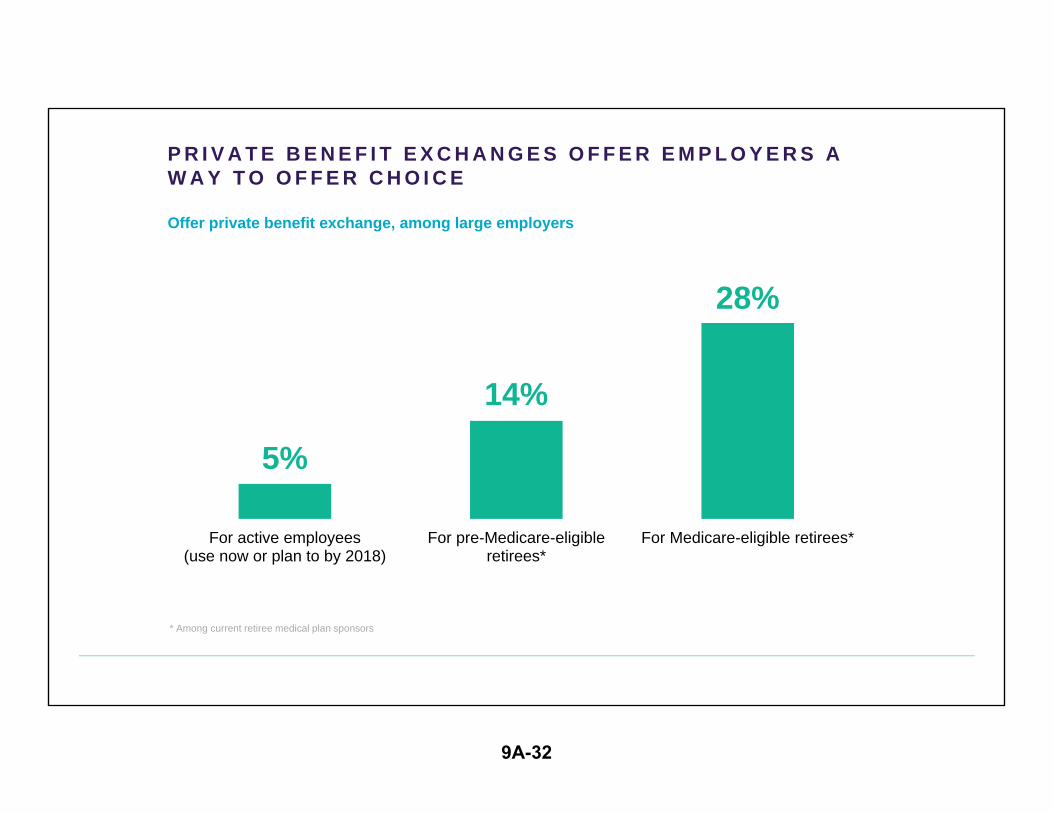
P R I V A T E B E N E F I T E X C H A N G E S O F F E R E M P L O Y E R S A W A Y T O O F F E R C H O I C E
Offer private benefit exchange, among large employers
5%
14%
28%
For active employees(use now or plan to by 2018)
For pre-Medicare-eligibleretirees*
For Medicare-eligible retirees*
* Among current retiree medical plan sponsors
9A-32

39%46% 47%
52% 55%62%
57%
0%
10%
20%
30%
40%
50%
60%
70%
2010 2011 2012 2013 2014 2015 2016
F O L L O W I N G S U P R E M E C O U R T R U L I N G O N M A R R I A G E E Q U A L I T Y, S O M E E M P L O Y E R S A R E D R O P P I N G S A M E - S E X D O M E S T I C PA R T N E R C O V E R A G E
Large employers offering same-sex domestic partner coverage
9A-33

THANK YOU
QUESTIONS?
9A-34