Embed Size (px)
Citation preview

CUSTOMER MAGAZINE FOR NEUROSCIENCE
EUROPEAN EDITION
No.
reSOLUTION
SP
EC
IAL
ED
ITIO
N
Confocal Fixed Stage System
Stereotaxic Atlases for Neuroscience
Immunohistochemistry in Research and Diagnosis
0 7
2 reSOLUTION
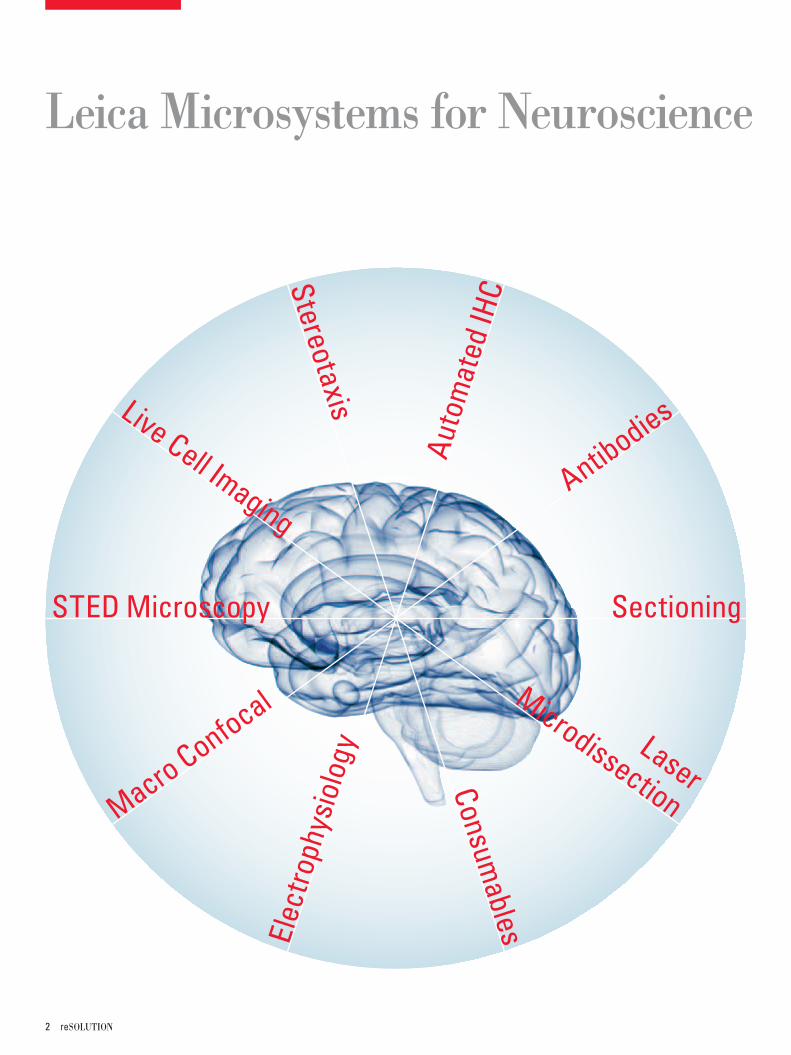
Leica Microsystems for Neuroscience
Live Cell ImagingStereotaxis
Auto
mat
ed IH
CAntibodies
Laser
MicrodissectionMacro Confocal
Elec
troph
ysio
logy
Consumables
STED Microscopy Sectioning

Neuroscience 3
A P P L I C AT I O N R E P O R T S
Observing Life’s Nanostructures with STED 04Superresolution Light Microscopy
New Standard in Electrophysiology and Deep Tissue Imaging 08Confocal Fixed Stage System
Navigator Through the Brain 12Stereotaxic Atlases for Neuroscience Research
Brains and Brawn 16Immunohistochemistry in Research andDiagnosis
From Concept to Diagnosis 19NovocastraTM Antibodies
Enhanced Research Applications for IHC 22The New Leica Bond™ Research Platform
The Mitochondrial Hypothesis of Ageing 25Laser Microdissection in the Research ofAgeing and Neurodegenerative Diseases
CON
TEN
TS
TECHNOLOGY
Deep Brain Surgery in Animal Research 28New Stereotaxic Instrument
Good Vibrations for Great Sections in Neuroscience 31Leica VT1200 and Leica VT1200 S
From Gene to Cell – from Cell to Embryo 32The World’s First Macro Zoom Confocal
Neuronal Image Analysis – Fast and Easy 34Leica MMAF Module “Neurite Outgrowth”
Ice-Cold Precision 36Cryostat Leica CM3050 S
The Working Animal 37Leica SM2500 Large Scale Heavy-DutySectioning System
Reproducible Bare Grid Technique 38New Plunge Freezer for Cryo-TEM
REGISTRATION 36
IMPRINT 39
Dear Readers,
Our consciousness is based on hundred billions of nerve cells, every single one of them connected with up to ten thousand other cells. Today, we know a lot about how these nerve cells communicate. However, we are still far from fully understanding the interactions of all these signal units and the basic molecular prin-ciples of brain functions. To pave the way for new therapies and medicines, we need to obtain more detailed knowledge.
Leica Microsystems offers neuroscientists a broad spectrum of system solutions and products that help them make new discoveries and find answers to unsolved problems. In this special edition of reSOLUTION, we present a number of them in the form of application and technology reports. They include some out-standing examples of collaboration between members of the scientific community and our company: the development of the first Large Scale Imaging Macro-Confocal and super-resolution STED technology.
Before samples can be examined under the microscope, they have to be carefully prepared and optimised for the particular experiment. Leica Microsystems caters for this need by offering a wealth of solutions that make work steps easier and reproducible – from cryostats, automated tissue processing and immunohis-tochemistry up to consumables.
You can read all the articles in this issue on our website, too, where you will also find further information. Just use the shortcut at the end of the article.
Have fun reading!
Anja Schué Didier Goor Martha Foley, Ph.D.Corporate Communications European Marketing Manager Research Global Marketing Manager, Biosystems Division
EDIT
ORIA
L
4 reSOLUTION
A P P L I C A T I O N R E P O R T
Superresolution Light Microscopy
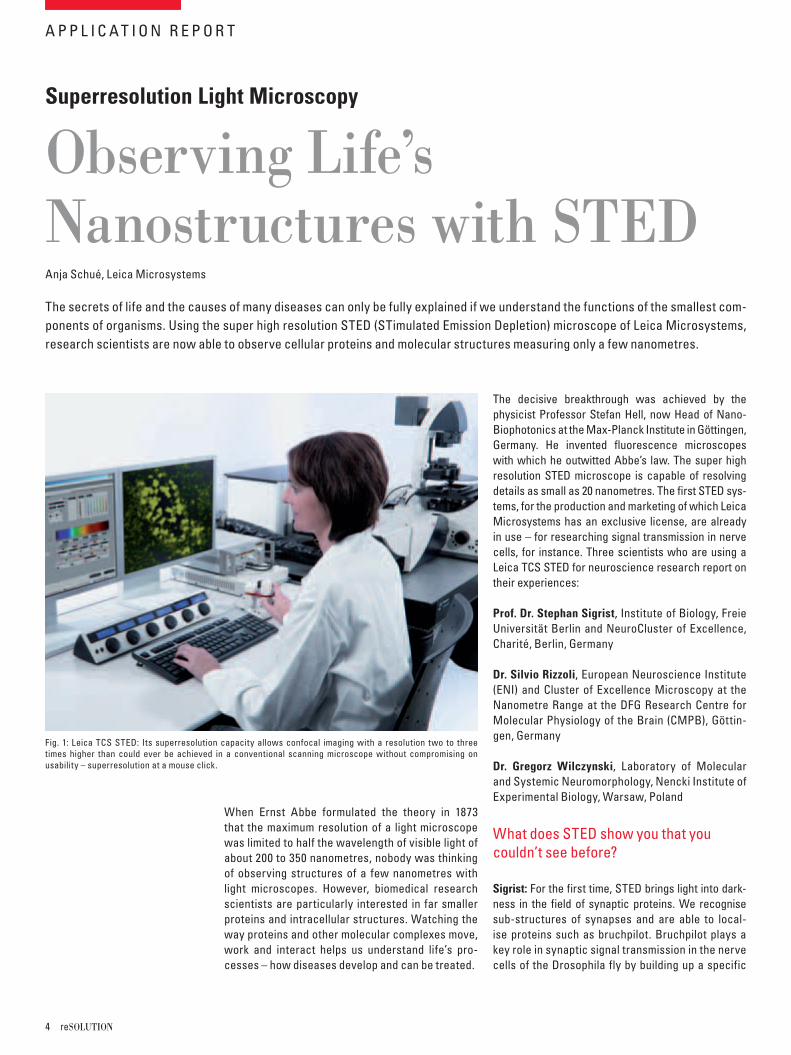
Observing Life’sNanostructures with STED Anja Schué, Leica Microsystems
The secrets of life and the causes of many diseases can only be fully explained if we understand the functions of the smallest com-ponents of organisms. Using the super high resolution STED (STimulated Emission Depletion) microscope of Leica Microsystems, research scientists are now able to observe cellular proteins and molecular structures measuring only a few nanometres.
Fig. 1: Leica TCS STED: Its superresolution capacity allows confocal imaging with a resolution two to three times higher than could ever be achieved in a conventional scanning microscope without compromising on usability – superresolution at a mouse click.
When Ernst Abbe formulated the theory in 1873 that the maximum resolution of a light microscope was limited to half the wavelength of visible light of about 200 to 350 nanometres, nobody was thinking of observing structures of a few nanometres with light microscopes. However, biomedical research scientists are particularly interested in far smaller proteins and intracellular structures. Watching the way proteins and other molecular complexes move, work and interact helps us understand life’s pro-cesses – how diseases develop and can be treated.
The decisive breakthrough was achieved by the physicist Professor Stefan Hell, now Head of Nano-Biophotonics at the Max-Planck Institute in Göttingen, Germany. He invented fluorescence microscopes with which he outwitted Abbe’s law. The super high resolution STED microscope is capable of resolving details as small as 20 nanometres. The first STED sys-tems, for the production and marketing of which Leica Microsystems has an exclusive license, are already in use – for researching signal transmission in nerve cells, for instance. Three scientists who are using a Leica TCS STED for neuroscience research report on their experiences:
Prof. Dr. Stephan Sigrist, Institute of Biology, Freie Universität Berlin and NeuroCluster of Excellence, Charité, Berlin, Germany
Dr. Silvio Rizzoli, European Neuroscience Institute (ENI) and Cluster of Excellence Microscopy at the Nanometre Range at the DFG Research Centre for Molecular Physiology of the Brain (CMPB), Göttin-gen, Germany
Dr. Gregorz Wilczynski, Laboratory of Molecular and Systemic Neuromorphology, Nencki Institute of Experimental Biology, Warsaw, Poland
Sigrist: For the first time, STED brings light into dark-ness in the field of synaptic proteins. We recognise sub-structures of synapses and are able to local-ise proteins such as bruchpilot. Bruchpilot plays a key role in synaptic signal transmission in the nerve cells of the Drosophila fly by building up a specific
What does STED show you that you couldn’t see before?

Neuroscience 5
A P P L I C A T I O N R E P O R T
structure there for supporting signal transmission. If the Drosophila fly does not have much bruchpilot, it cannot sustain flight, if it has none at all, it dies. The protein is found in similar form in humans, too, and could be connected with diseases of the ner-vous system. Studying animals helps to understand
the functions of the protein in humans. Understand-ing biological signal transmission is not only im-portant for science in general. It is probable that synaptic defects trigger a large number of neurode-generative diseases. In addition, it is almost certain that memory and learning processes are organised at synapses.
Rizzoli: Measuring only 40 – 50 nm, vesicles, which stock neurotransmitters in the synapsis and release them for signal transmission to the cell membrane, are among the smallest organelles of the nerve cell. Only with the help of STED were we able to localise individual vesicles, which usually occur in groups of 100 – 300. And contrary to previous assumptions
that they hardly moved, we see that they move to and fro all the time, extremely rapidly and seemingly at random. This was inconceivable for us, as signal transmission is a highly complex, controlled pro -cess. We managed to record a first live video of these processes. As well as this, our knowledge of the vesicle recycling process at the cell membrane has also been revolutionised by STED. We now know, for example, that after fusing with the cell membrane, vesicle molecules are connected like a drop of oil in water – which facilitates vesicle recycling.
Wilczynski: Most synapses are situated on tiny protrusions 200 nm to 2 µm in size called dendritic spines. Their different shapes and sizes are thought to have a crucial influence on signal transmission. Changes of the dendritic spines also play a role in diseases such as epilepsy and the congenital dis-ease Fragile X syndrome. Conflicting evidence has been obtained on dendritic spine form variety so far, and STED enables us to examine it in much more de-
tail than with conventional confocal microscopy and to perform much more analysis than with electron microscopy. With STED we can examine several thousands of dendritic spines in the time it takes us to do 200 to 300 with EM. STED gives our results far higher statistic relevance for a new classification of dendritic spines.
Sigrist: Without exaggerating, I can say that I dis-covered a new world. I immediately realised that STED is a breakthrough for finding answers to our questions and that we had had extremely naïve ideas of what we could see with light microscopy. But, after all, that’s the beauty of science – that new discoveries always raise new questions.
Rizzoli: I well remember the day in 2005 when I took the first photos of vesicles on a STED prototype in Stefan Hell’s laboratory. In those days, it still took five to ten minutes to take a photo – now it only takes 28 milliseconds – and it took us all day to get a good picture. It was fascinating, like opening a new chapter in the book of science. Research scientists must have had similar feelings in the fifties when the first electrophysiological image of a synapse was produced. Nobody even knew about vesicles then.
Wilczynski: I was naturally delighted with the greater resolution that STED provides. The images are not only a bit sharper, it’s a whole new class of imaging. Actually, I’d expected this new technology to offer higher resolution. But I also found out very quickly that the sample material and the subject of your research play a crucial role for whether you get the most out of the higher resolution.
Sigrist: Very important indeed, as STED takes us into the realm of protein complexes and therefore gives us a really close up view of life. At present, we are able to resolve structures below the 100 nano-metre mark. Professor Hell, who is working on the further development of STED, has already achieved far higher resolutions. If we can use resolutions of a few tens of nanometres, it will be possible to de-termine with light microscopy whether proteins are close together or further apart. This would consti-tute a further quantum leap in our understanding of protein functions.
“Why are we interested in flies that turn into crash pilots?”
“For the first time, we have filmed real-time movement of synaptic vesicles.”
“Whether mushroom-shaped, branched or stubby – with STED we hope to classifydendritic spines efficiently.”
You were one of the first to work with STED. What was it like to see the first images?
How do you rate the future significance of STED in life sciences?
6 reSOLUTION
A P P L I C A T I O N R E P O R T
Rizzoli: STED has proved that the former resolution limit can be overcome. Today, everyone who works with conventional high-end resolution wants to work with super high resolution. Meanwhile, many labor-atories are trying to develop new, super high-res techniques. But STED has made the most progress and is the only technology that really works. STED was like a starting pistol for a real technology race. It will be exciting to see what else happens in the next few years.
Wilczynski: I’m quite sure that the significance of super high resolution light microscopy will increase. And I’m also sure that even technologies like STED will continue to improve in terms of resolution. I also see advantages in comparison with EM – morpho-logical examinations of cellular structures that were only possible with complex EM in the past can now be realised much more quickly with STED, as our case shows.
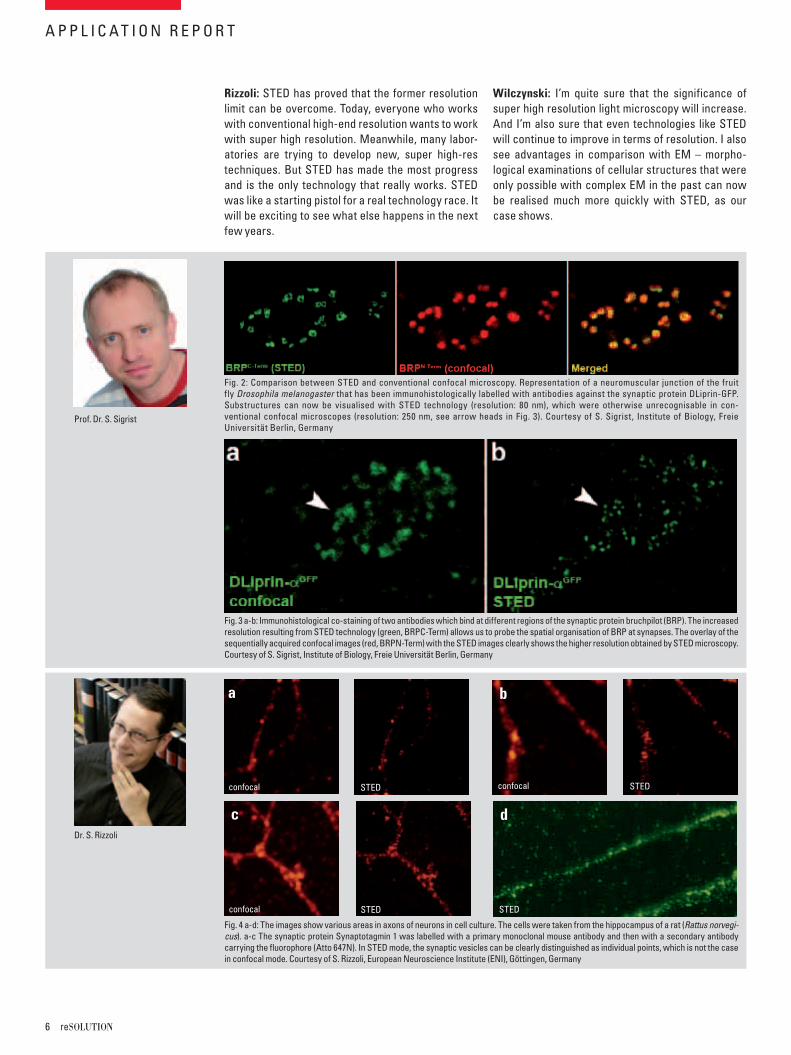
Fig. 2: Comparison between STED and conventional confocal microscopy. Representation of a neuromuscular junction of the fruit fly Drosophila melanogaster that has been immunohistologically labelled with antibodies against the synaptic protein DLiprin-GFP. Substructures can now be visualised with STED technology (resolution: 80 nm), which were otherwise unrecognisable in con-ventional confocal microscopes (resolution: 250 nm, see arrow heads in Fig. 3). Courtesy of S. Sigrist, Institute of Biology, Freie Universität Berlin, Germany
Fig. 3 a-b: Immunohistological co-staining of two antibodies which bind at different regions of the synaptic protein bruchpilot (BRP). The increased resolution resulting from STED technology (green, BRPC-Term) allows us to probe the spatial organisation of BRP at synapses. The overlay of the sequentially acquired confocal images (red, BRPN-Term) with the STED images clearly shows the higher resolution obtained by STED microscopy. Courtesy of S. Sigrist, Institute of Biology, Freie Universität Berlin, Germany
Fig. 4 a-d: The images show various areas in axons of neurons in cell culture. The cells were taken from the hippocampus of a rat (Rattus norvegi-cus). a-c The synaptic protein Synaptotagmin 1 was labelled with a primary monoclonal mouse antibody and then with a secondary antibody carrying the fluorophore (Atto 647N). In STED mode, the synaptic vesicles can be clearly distinguished as individual points, which is not the case in confocal mode. Courtesy of S. Rizzoli, European Neuroscience Institute (ENI), Göttingen, Germany
confocal STED confocal STED
a b
c
confocal STED
Prof. Dr. S. Sigrist
Dr. S. Rizzoli
d
STED

Neuroscience 7
A P P L I C A T I O N R E P O R T
Fig. 5 a-b: Confocal (a) and STED images (b) of dentritic protrusions in cultured neurons. The inserts show the improved resolution with STED microscopy at the level of individual synapses. Green: Atto647-labelled GFP, red: synaptophysin. Courtesy of G. Wilczynski, Nencki Institute of Experimental Biology, Warsaw, Poland
a b
In the past, biologically relevant STED imaging was mainly limited to fixed immunolabelling techniques. The HaloTag® labelling technol-ogy developed by Promega is a new approach for live cell imaging in STED microscopy. This technology is comprised of the HaloTag® re-porter protein, to which a gene of interest is fused, and the HaloTag® ligands. The reporter protein is an engineered, catalytically inac-tive derivative of a hydrolase that forms a covalent bond with the ligands. The ligands are diverse markers, such as fluorescent dyes, to which a linker designed to react covalently to the reporter pro-tein is attached by simple chemistry. For this purpose, a membrane impermeant ligand was optimised for the Leica TCS STED micro-scope containing the fluorescent dye Atto655 and used to label live HeLa cells stably expressing human β-1 integrin-HaloTag® fusion protein. These cells were generated to study integrins; proteins
essential for cell adhesion and migration that are localised to both the cell surface and trafficking vesicles. STED imaging revealed lo-calisation of the integrin fusion in unprecedented detail.
Reference
J. Schröder, H. Benink, M. Dyba, and G. V. Los; In Vivo Labelling Method Using a Genetic Construct for Nanoscale Resolution Microscopy; Biophysical Journal, Volume 96, Issue 1, 7 January 2009.
More information on the principle of the HaloTag® labelling tech-nology:http://www.promega.com/paguide/animation/selector.htm?coreName=halotag01
New in vivo Labelling Method for STED Microscopy
Dr. G. Wilczynski (left) and his team
confocal STED
www.leica-microsystems.com/SP.0301

8 reSOLUTION
Confocal Fixed Stage System
New Standard inElectrophysiology and DeepTissue ImagingDr. Irmtraud Steinmetz, Leica Microsystems
The function of nerve and muscle cells relies on ionic currents flowing through ion channels. These ion channels play a major role in cell physiology. One way to investigate ion channels is to use patch clamping. This method allows investiga-tion of ion channels in detail and recording of the electric activity of different types of cells, mainly excitable cells like neurons, muscle fibres or beta cells of the pancreas. The patch clamping technique was developed by Erwin Neher and Bert Sakmann in the 1970s and 80s to study individual ion channels in living cells. In 1991 they received the Nobel Prize for Physiology and Medicine for their work. Today the patch clamping technique is one of the most important methods in the field of electrophysiology.
In patch clamp experiments a tight seal is formed between a glass pipette and the cell membrane. This arrangement allows the recording of small currents and voltages involved in the activity of neurons and other cells (Fig. 1). A large observa-tion field is necessary in order to find the regions of interest within a specimen, for example in the brain of a living mouse, living brain slices, embryos, etc. In addition, it is important to be able to visualise detailed structures so that pipettes and electrodes in the specimen can be placed accurately. The Leica DM6000 CFS (Fig. 2) combines the new high NA/low magnification objective lens HCX APO L20x/1.0 W with the magnification changer in the CCD camera mode. This combination allows for a fast overview of the specimen while keeping a large observation field. Furthermore, the observation field can be changed easily by using different mag-nification changers. A large field of view is achieved
Fig. 1: The principle of the patch clamp technique. a) Pressure is applied to the pipette to penetrate through the tissue. b) Suction is applied to form a tight contact with the cell. a) and b) adapted from Stuart et al. 1993) c) A patch electrode is attached to a neuron to record voltage signals. A stimulation electrode can be placed close to a dendrite for extracellular stimulation by voltage pulses. d) Steps to get a whole cell configuration: the soma of the cell is approached (on cell), formation of a giga-seal by releasing pressure, brief suction disrupts the membrane (whole cell), the cell can be filled with dyes or drugs. d) from PhD thesis of Th. Nevian: “Calcium dynamics in dendrites and spines in the somatosensory “barrel” cortex of the rat”, 2003.
Fig. 2: The Confocal Fixed Stage System Leica DM6000 CFS inte-grates the Leica DM6000 fixed stage microscope into the Leica TCS SP5 confocal platform. The system helps to realise highly sophisticated experimental setups in physiology and electro-physiology from single cells to whole organisms.
Patchpipette
Slice
Stimulationelectrode
a b
c d
Pressure Suction
on-cell giga-seal whole-cell whole-cell
A P P L I C A T I O N R E P O R T
Large field of view andhigh magnification

Neuroscience 9
using the 20x objective. To identify individual cells, the 4x magnification changer can be used. There-fore, using both the objective and the magnification changer it is possible to easily position pipettes very close to the cell (Fig. 3). If a higher resolution is re-quired, as for the investigation of neuronal spines, the system can be switched to confocal scan mode.
To study neuronal networks in the brain, spe-cific labelling of individual cells is required. A new method, called single cell electroporation (Nevian and Helmchen 2007), allows rapid and selective loading of cells. Brief voltage pulses are delivered, causing an electromagnetic field to be applied to the membrane. This results in the transient forma-tion of small pores; the pores close within seconds. Charged molecules are transported in the direction of the electrochemical gradient during opening of the pores. This method can be used to load neurons with calcium-sensitive dyes and other dyes (Fig. 4).
Using the single cell electroporation technique, the background staining is lower compared to using the loading by intracellular recording electrodes or patch pipettes. The single cell electroporation technique is especially well suited for functional imaging of subcellular Ca2+-dynamics in vitro and in vivo. Multiple substances can be loaded to ob-tain morphological and functional measurements at the same time. Furthermore, multiple cells can be loaded sequentially in order to image small neuronal networks by using the same pipette.
In many physiological applications the reaction of cells to different types of stimuli is of interest. The reactions of the cells, as seen by electrical and fluo-rescence intensity data, need to be measured and displayed in a synchronised manner. The intensity data usually refer to the intracellular calcium con-centration or pH-value. The Leica DM6000 CFS enables the synchronised correlation of electrical and optical data; voltage recordings are correlated in synchronisation with the fluorescence intensity data and are automatically displayed in graphs. This reveals a fast and direct overview of the experimen-tal progress and online data evaluation. Further-more, images are displayed below the graphs to get fast information about the morphology of the cell.
A data acquisition box and Leica trigger unit are integral components for viewing the intensity and voltage data correlation. Recorded signals, as from a neuron, are typically amplified, and then sent to a NI Data Acquisition Box (DAQ box) from National Instruments, which digitises the signals. The DAQ box is connected to the trigger unit that allows for the synchronisation with the scanning process. It is also connected to the PC so that correlated optical and electrical data, as well as images, can be dis-played.
With the calcium-sensitive dye Fluo4 labelled iso-lated cardiomyocytes from trout were stimulated by a trigger pulsing regime using patch clamping (HEKA EPC-10 double). Cardiomyocyte responses to intracellular calcium concentration and ionic cur-rents were measured using fluorescence imaging and electrical recordings. The stimulation protocol on the patch clamp setup was synchronised with the confocal time lapse series using a trigger on the patch clamp setup to mark events in individual frames on the time axis. Line triggers are recorded in order to have the exact correlation of the image
Fig. 3: Identification of cells: Dodt gradi-ent contrast transmitted light images of a mouse brain slice taken by a CCD camera (Leica DFC360 FX). To identify the layer of interest in a brain slice, overview imaging was performed using the magnification changers 0.35 and 1.0. Single cells were selected for the experiment when using the 4x magnification changer.
Fig. 4: a) A specific neuron was loaded with a calcium sensitive dye by single cell electroporation; overlay of simultaneous acquisition of fluorescence with a Non-Descanned Detector (NDD) and transmit-ted light; b) small neuronal network: rat brain slice, layer 5, red: Interneurons Alexa 594, green: Pyramidal Cell Oregon Green Bapta 1 (calcium sensitive), Z = 123 μm,two photon excitation; detection with a 2-channel NDD. Courtesy of Dr. Thomas Nevian, Inst. of Physiology, University of Bern, Switzerland
a b
A P P L I C A T I O N R E P O R T
Single cell electroporation
Correlating optical and electrical data – and images
Currents and calcium inheart muscle cells

10 reSOLUTION
scan, fluorescence signal intensity, and electrical response of the cell (Fig. 5). These triggers are au-tomatically generated by the scan head. This means that whenever a line is scanned, its corresponding trigger pulse is recorded and displayed in the quan-tification chart. Synchronisation of images and trig-gered pulses is accomplished using the DAQ box.
A major challenge in physiological applications is the study of cells in deeper layers of tissue. Multi-photon microscopy provides several advantages for solving this challenge. Lower light scattering, restricted excitation and bleaching to the focal plane, and reduced phototoxicity are the properties of multiphoton microscopy that enable visualisation of deep structures. Brain slices, for example, are highly scattering and are usually sliced several hun-dred micrometres thick. Therefore it is very difficult to image brain slices using a standard confocal mi-croscope. Thicker specimens can be imaged using multiphoton microscopy due to an enhancement in photon collecting efficiency.
In confocal microscopy the pinhole aperture rejects the out-of-focus fluorescence light as well as the scattered (diffused) light. Since the scattered light
is not ‘seen’ by the detector, it is not easy to image highly light scattering tissues such as thick brain slices. In multiphoton microscopy however, no con-focal pinhole is required to reject the out-of-focus light because all fluorescent light originates from the focal spot. The emitted light from the specimen does not need to pass through the microscope again. Therefore, detectors can be placed as close as pos-sible to the specimen so that scattered photons can be collected. In this way significantly higher photon collection efficiency is achieved compared to con-focal microscopy.
The external Non-Descanned Detectors (NDDs) are PMTs for collecting emitted light from the focused and scattered light (Fig. 6). The NDDs are boxes con-taining PMTs for the detection of either two or four different fluorescence signals (4-channel NDD). To separate the signals, several filter cubes are avail-able and can be introduced into the detector box.
Unstained neurons in thick brain slices are phase objects. To make them visible it is necessary to con-vert their phase gradients into amplitude gradients. There are different ways to achieve this. One is by using differential interference contrast (DIC), which requires prisms and polarisation filters in the beam path. Thus, when transmitted light and fluores-cence are imaged together the photon collecting ef-ficiency is reduced due to the optical components in the beam path. Infrared Scanning Gradient Contrast (SGC imaging) – also referred to as Dodt Contrast – is another method used to visualise unstained cells in thick scattering tissue. This is a special optical system developed by Hans-Ulrich Dodt (Max-Planck Institute, Munich, Germany). In this technique the contrast can be specifically adjusted to enable dif-ferent structures (horizontal or vertical) to be high-lighted.
Using the Dodt gradient contrast method no optical components are needed in the beam path to get high-contrast and high-resolution images. Here, a lens system between the microscope stage and the lamp house re-images the aperture plane of the condens-er. Spatial filtering is performed by a quarter annulus located in the illumination beam. After the annulus, a diffuser is placed to generate an oblique illumination across the condenser aperture. The light-stop blocks much of the illuminating light and only a part of the illuminating light cone is used. Therefore, less stray light is generated in the slice and an oil-immersion condenser, e.g. with 1.4 NA, can be used for high resolution images. Adjustments can be made to the
Fig. 5: Quantification of the experiment described in the text. Intensity graph (top), electrical data (middle) and images (bottom) recorded during a patch clamp experiment in a cardiomyocyte. Cells have been stimulated by different pulsing pro-tocols, and their reactions as indicated by ionic currents and calcium signal intensity were measured within an ROI. The lower graph shows the current recorded (pur-ple), stimulation trigger pulses (red) and line trigger (green).
Fig. 6: A Leica DM6000 CFS System equipped with external detectors (NDDs). Images: neurons selectively marked in a 300 μm thick living mouse brain sec-tion excited with IR light. Two neurons in a living brain slice labelled with Oregon Green Bapta 1. Detection of the same fluor-escence by RLD and TLD. The TLD shows a significantly brighter signal. Courtesy of Dr. Thomas Nevian, Inst. of Physiology, University of Bern, Switzerland
RLDs
TLDs
A P P L I C A T I O N R E P O R T
Multiphoton microscopy andexternal detectors
Fluorescence and high contrasttransmitted light imaging
Neuroscience 11
direction of the spatial filter and to the distance of the diffuser with respect to the spatial filter.
The contrast created is very strong and images look similar to DIC images. The Dodt gradient con-trast images are detected with a transmitted light detector or so called Dodt detector. The PMT of the Dodt detector has a higher IR-sensitivity (up to ap-prox. 900 nm) compared to regular PMTs. A Leica DM6000 CFS system equipped with NDDs and a Dodt detector allows simultaneous detection of fluorescence and transmitted light when using IR excitation. It provides the highest photon collection efficiency as there are no optical components in the beam path. This also facilitates many applications in physiology, e.g. optically guided patch clamping (Fig. 7). The NDDs are also suitable for detection of second harmonic generation signals (SHG) (Fig. 8).The Dodt gradient contrast works in camera and scanning mode when using IR excitation. It can also be used upon VIS excitation, but the contrasting ef-fect can be less prominent.
ReferencesH.U. Dodt and W. Zieglgänsberger, 1990. Visualising unstained neurons in living brain slices by infrared DIC videomicroscopy. Brain Research 537(1-2): 333-6.
G. Stuart and B. Sakmann, 1993. Patch-clamp recordings from the soma and dentrides of neurons in brain slices using infrared video microscopy. Pflügers Archive – European Journal of Physiology. 423: 511-518.
W. Denk, 1996. Two photon excitation in functional imaging. Journal of Biomedical Optics 1 (3), 296-304.
Th. Nevian, 2003. PhD thesis: Calcium dynamics in dendrites and spines in the somatosensory “barrel” cortex of the rat.
Th. Nevian and F. Helmchen, 2007. Calcium indicator loading of neurons using single cell electroporation. Pflügers Archive – European Journal of Physiology. 454: 675-688.
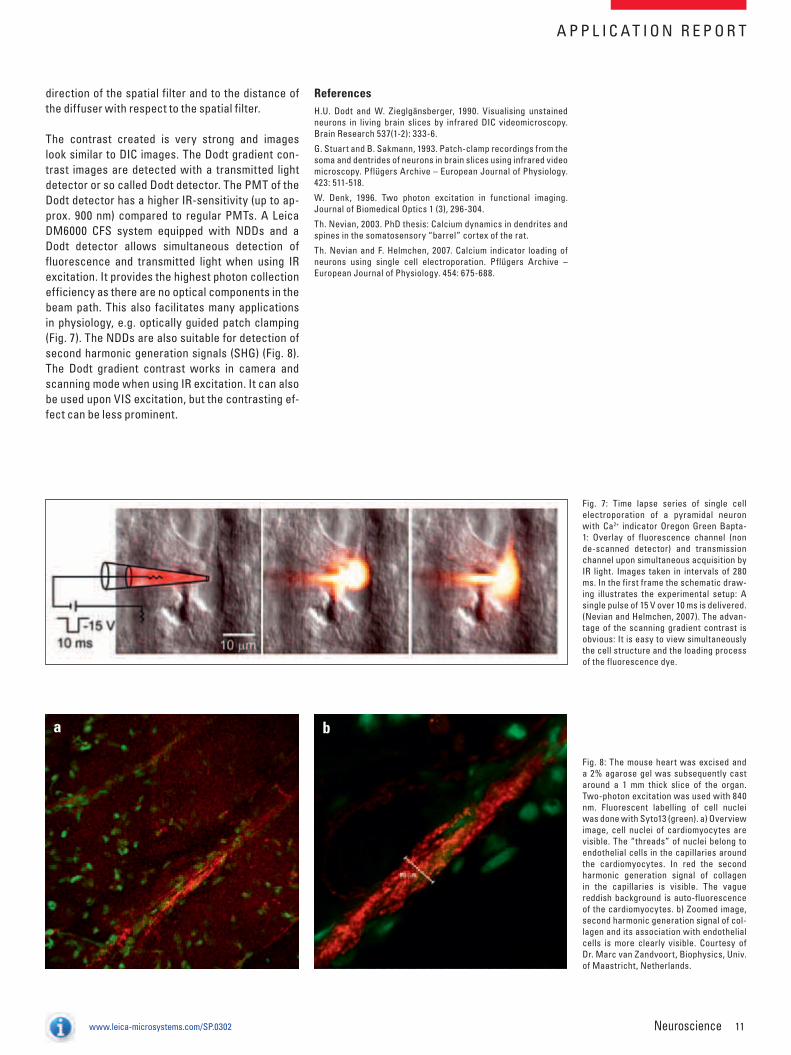
Fig. 8: The mouse heart was excised and a 2% agarose gel was subsequently cast around a 1 mm thick slice of the organ. Two-photon excitation was used with 840 nm. Fluorescent labelling of cell nuclei was done with Syto13 (green). a) Overview image, cell nuclei of cardiomyocytes are visible. The “threads” of nuclei belong to endothelial cells in the capillaries around the cardiomyocytes. In red the second harmonic generation signal of collagen in the capillaries is visible. The vague reddish background is auto-fluorescence of the cardiomyocytes. b) Zoomed image, second harmonic generation signal of col-lagen and its association with endothelial cells is more clearly visible. Courtesy of Dr. Marc van Zandvoort, Biophysics, Univ. of Maastricht, Netherlands.
Fig. 7: Time lapse series of single cell electroporation of a pyramidal neuron with Ca2+ indicator Oregon Green Bapta-1: Overlay of fluorescence channel (non de-scanned detector) and transmission channel upon simultaneous acquisition by IR light. Images taken in intervals of 280 ms. In the first frame the schematic draw-ing illustrates the experimental setup: A single pulse of 15 V over 10 ms is delivered. (Nevian and Helmchen, 2007). The advan-tage of the scanning gradient contrast is obvious: It is easy to view simultaneously the cell structure and the loading process of the fluorescence dye.
a b
A P P L I C A T I O N R E P O R T
www.leica-microsystems.com/SP.0302

12 reSOLUTION
Stereotaxic Atlases for Neuroscience Research
Navigator Through the BrainCharles W. Scouten, Ph.D. and Martha Foley, Ph.D., Leica Microsystems
Dr. George Paxinos paved the way for future neuroscience research by being the first to produce an accurate 3D stereotaxic atlas to guide placement of electrodes and injections in the brain of experimental animals. His atlases are now international standards.
Born and raised in Greece, and educated at Ber-keley, McGill, and Yale, Paxinos has published 36 books, 115 referred journal articles, two reviews, 25 book chapters, and 13 CD-ROMs about the brains of experimental animals and of humans. He has iden-tified and named 80 nuclei in mammals and 185 in birds. The nomenclature and abbreviation scheme that he developed is the most recognised interna-tionally, and represents a seamless guide from de-velopment to adulthood and from mammals to birds, to the extent that homologies permit.
Thompson ISI lists his first book, The Rat Brain in Stereotaxic Coordinates, in the top 50 most cited items in the Web of Science, and it is the only neu-roscience publication so listed. Here, Paxinos and
colleague Charles Watson defined the flat skull position in the rat, which is now the universally used position for stereotaxic surgery. Paxinos has constructed the most accurate maps of the human sub cortex and is now working on the cortex. He is a member of the first International Consortium for Brain Mapping, a UCLA-based consortium that re-ceived top ranking and was funded by the NIMH-led Human Brain Project.
The automated onscreen atlas now contains 3D maps of rat and mice brain, and it will contain human brain. Next, we will add monkey and possibly other species. The atlas can be rotated by any angle of ap-proach and then sectioned by a software-free cut-ting tool at any desired angle. It is like the sectioning of a brain at any angle, not necessarily in the three cardinal planes.
For rat and mouse stereotaxic surgery, it is helpful for interpreting brain sections that are not cut in the plane of the atlas; that is, are laterally asymmetrical, or, more frequently, not cut in the skull-flat position top to bottom. For example, the dorsal part of the brain may be some sections more rostral or caudal than the ventral part of the brain. To interpret one section on the microscope, you would have to go through five pages of an atlas, which is cumbersome and can lead to errors. But if you can resection the atlas data to produce a cut that better resembles what is seen under the microscope, it is very helpful. Even in my own lab, a brain is sometimes sectioned so the coronal sections are not perpendicular to skull-flat and students ask, “What do I have here?” I find that the section is somewhere between the horizontal and coronal plane.
Fig. 1: Dr. George Paxinos, Prince of Wales Medical Research Institute and The University of New South Wales, Sydney, Australia. Dr. Paxinos has written 36 stereotaxic atlases. “The Rat Brain in Stereotaxic Coordinates”, 6th Edition, is ranked among the 50 most cited items in the entire web of science and has attracted over 30,000 citations.
A P P L I C A T I O N R E P O R T
We understand you are working withElsevier on the release of a newautomated atlas. Can you describe it?

Neuroscience 13
curacy we find in the monkey atlases, which are far better at delineating cortex. The new monkey atlas that we have just done is the most accurate atlas of a primate ever produced. The cortical delineations are state-of-the-art.
I went on a sabbatical to Cambridge 1976, where my work involved cutting brain in horizontal sections to best interpret my knife cuts. If I cut coronal, I could not see what I was doing, I only saw cut lines. But I needed to see pileup accumulation of immunore-active material in one direction and depletion in the other direction. There was no atlas of rat brain that showed horizontal sections so I thought of building and publishing one. The paper did well but what peo-ple really wanted was coronal. Although what we had published was better for stereotaxic and had better delineations than König and Klippel, coronal was clearly what we had to do.
Yes. I had picked up the technique of staining for acetylcholinesterase, and I thought I could see the brain better. There were no ambiguities in many in-stances, so I had the idea that we could do a better atlas. Horizontal was of course easier, but the game
If you take a horizontal line, and you are at the fa-siculus retroflexus and the medial lateral plane is symmetrical, then you have the same structure on the other side. You cannot be anywhere else. But if you go higher to the habenula or down below to the hypothalamus, you don’t know. You have to find a landmark at the same horizontal level. Often the brain does not have landmarks that you can be ab-solutely certain about.
In clinical psychology they call it ‘perseveration.’ [laughter] You just can’t quit! Although we haven’t sectioned it yet, we are working on an atlas of the marmoset brain. The marmoset is the size of a small rat, yet it is a primate. The work we have done so far in the cortex of the marmoset indicates that its cortical areas of cerebral cortex are the same as the cortical areas of human brain.
We want to do an atlas of the human cortex, which could be an atlas of the entire human brain. There hasn’t been a good atlas of the human cortex since the work of Von Economo in the 1920s. Now it is Brodmann who is followed, but Von Economo is bet-ter. But even Von Economo does not have the ac-
Fig. 2: Location of Bregma and Lambda as defined by Dr. George Paxinos (George Paxinos and Charles Watson: The Rat Brain in Stereotaxic Coordinates, Academic Press, New York, 1998, p. 11). Courtesy of Academic Press.
A P P L I C A T I O N R E P O R T
It is hard to figure out where a given point is, if you are not in the atlas planeof section.
Are you planning future atlas projects?
What inspired you to go into atlas work?
Did you use fresh tissue (to avoidshrinkage) on that early atlas?

14 reSOLUTION
Yes, but it was really the issue of getting accurate coordinates. It was one year’s work of starting at 9 a.m. in the morning and finishing, if the brain was promising, at 4 a.m. the next morning. I worked like this for a year to ensure that each of the cuts was exactly right. I was always getting so close.
All in three cardinal planes. But I was convinced that the König and Klippel atlas was not really helpful to scientists, as it omitted many parts of the brain and the point of Bregma, the most frequently used refer-ence point in stereotaxic surgery. It was not useful for stereotaxic surgery.
Yes, it was not only shrunk, but the atlas described 150-gram female rats whereas most researchers use 300-gram males. There is a big difference be-tween these brains. But my greatest difficulty with it was in my graduate years. I was to be instructed
is played in another field, coronal. Although it was very difficult, we did the coronal sections over three years. I was inserting 15 marker electrodes from rostral to caudal every 2 mm plus three horizontal electrodes in each brain, plus two sagittal elec-trodes to mark the coordinate system.
By the way, at that time we defined the now stan-dard reference position for the skull, the skull-flat position, with Bregma and Lambda at the same ver-tical position; and how to locate them not necessar-ily exactly where the sutures cross, but where the lines of best fit would cross the midline suture.
Yes, as the zero point, but at some elevation of the incisor bar, rather than skull-flat. We defined and implemented the skull-flat position for our atlases [and it improved reproducibility].
As we were taking the brain out, it would assume the shape of whatever surface it was on. I was try-ing to get all my electrodes to come in one section; an aligned cut of brain. I then had the idea to freeze the whole head together with the brain inside. I prized the frozen bone off the frozen brain, which didn’t give the brain a chance to assume the shape of what it was placed on. At that point, I really made progress.
Fig. 3: Using a stereotaxic atlas to target a brain.
A P P L I C A T I O N R E P O R T
Wasn’t Bregma being used in the 1980s?
It must have been a really difficultdissection
From the olfactory bulb to thespinal cord!
In addition, all the coordinates wereinaccurate, as the brain had shrunk

Neuroscience 15
by my professor on how to do stereotaxic surgery on a rat, but the rat declined to go under anaes-thetic. The professor said, “Look, I have run out of time, but when he goes under, implant the electrode in the hypothalamus. Find the coordinates from the atlas.” In my rush to operate on the animal before he woke up, I failed to read the introduction where it was clearly stated that the stereotaxic zero point of the atlas coordinates was not the zero point of the stereotaxic instrument, but 4.9 mm above the ear-bar plane. In targeting the hypothalamus, I missed the brain by 4.9 mm. And I thought that any psychol-ogist, as I was then, could do better than that. The whole point is to have an atlas to depend on, not just refer to. At that time, you always had to derive your coordinates experimentally.
As a side story, when I tried to publish this new at-las, Elsevier replied that one of their advisors told them not to publish it, and there was a rhetorical question, “Why yet another atlas of the rat brain?” We knew the need of another atlas, as the König and Klippel atlas did not display the pons, the medulla, the cerebellum, the cortex, the spinal cord, and the point of Bregma. It was not useful for stereotaxic surgery, it was not there. But eventually Academic Press, now owned by Elsevier, published it.
What I have found in neuroscience, is that if you have the hardware, don’t let a project wait. Work straight through the weekends. Perseverance, not
[necessarily] perseveration, but perseverance. There is more perspiration than inspiration in sci-ence. I have seen very clever students fall by the wayside, and others succeed because they were more determined to succeed. My advice is, don’t wait for inspiration in the first sentence of your paper. Just write something and keep going. More specifically to neuroscientists, get to know the con-cept of neuromeres.
If you look in the Atlas of the Rat Brain in Stereotax-ic Coordinates, Compact 6th Edition, you will see an introduction to the concept. There are 15 diagrams where we explain it for the reader who is new to the idea. This concept will have a big impact on our un-derstanding of neuroanatomy and function.
Yes, a neuromere is a developmental unit. The same gene groups are responsible for patterning in the nervous system of the human and the mouse. They are also involved in the segmenting the body of Drosophila. These genes act throughout evolution. We are now just appreciating the importance of them in the organisation of the brain stem, how it is put together and so how it will function.
www.leica-microsystems.com/SP.0303
A P P L I C A T I O N R E P O R T
What advice would you give to young neuroscientists?
The idea of neuromeres?

16 reSOLUTION
Antibodies in Research and Diagnosis
Brains and BrawnGary McIntosh, Ph.D. and Nigel Piggott, Ph.D., Leica Microsystems
The increased sensitivity of immunohistochemistry (IHC) over standard Hematoxy-lin and Eosin (H&E) staining has established the IHC technique in the study of many diseases. Herein we describe the utility of some NovocastraTM antibodies that can be used in the study of brain and muscle diseases.
Fig. 1: Human brain, Alzheimer’s disease: immunohistochemical staining for tau protein using NCL-TAU-2 (Clone Tau-2). Paraffin section.
Dementia is a common, chronic and progressive condition of several different types. It is a complex spectrum of disease states with no single cause. Dementia is characterised by the long-term de-cline in memory, neuropsychiatric and behavioural disorders. It is common in the elderly, but can oc-cur at any age. Dementia affects 5-8 % of all people between ages 65 and 74, and rises with increasing age to 25 %. More than 24.3 million people are es-timated to have dementia globally, with 4.6 million new cases being diagnosed each year.
At the molecular level, dementias have been recent-ly classified according to the presence of abnormal proteins such as tau and synuclein.
Alzheimer’s disease (AD) is the most common age-related cause of neuro-degenerative disease and is defined by the presence of the protein tau. The pro-gressive death of nerve cells in the brain is associ-ated with twisted strands (neurofibrillary tangles) of the tau protein (Fig. 1) and deposits of the protein fragment beta-amyloid in amyloid plaques (Fig. 2).
Parkinson’s disease is a progressive, neuro-de-generative condition characterised by the loss of dopaminergic neurons in the midbrain substantia nigra. The abnormal presence of the protein alpha-synuclein has been demonstrated in Parkinson’s disease (PD) and dementia with Lewy bodies (DLB). Lewy bodies are protein aggregates of alpha-synu-clein together with others such as ubiquitin, neuro-filiament protein and alpha-B crystallin (Fig. 3).
There is considerable overlap between these dis-ease states where concomitant DLB and AD pathol-ogy is present, the so-called Lewy body variant of Alzheimer’s disease. Other proteins, such as amy-loid precursor protein (APP) (Fig. 4) and tyrosine hydroxylase (TH) (Fig. 5), may also be useful in the detection of pathogenesis in Alzheimer’s disease.
Muscular dystrophy is characterised by the pro-gressive weakness and degeneration of skeletal muscles. Some patients may only experience mild symptoms within a lifetime whereas others will have severe symptoms and die at a young age. The muscular dystrophies share common muscle histology demonstrating a characteristic variation in muscle fibre size, fibre death, infiltration by in-flammatory cells and ultimately, replacement of the muscle fibres by fat and connective tissue. In com-bination with routine microscopic examination of a muscle biopsy, immunohistochemistry can be used to make a definitive diagnosis in some muscular dys-trophies by identifying deficiencies of key proteins.
Of the nine types of muscular dystrophy, the most common and severe form is Duchenne muscular dystrophy (DMD) which affects young boys. It oc-
Dementia
Muscular dystrophy

Neuroscience 17
Fig. 2 Human brain, Alzheimer’s disease: immunohistochemical staining for beta amyloid protein using NCL-B-Amyloid (Clone 6F/3D). Note intense staining of senile plaques. Paraffin section.
Fig. 3: Human brain, Lewy body dementia: immunohistochemical staining for alpha-synuclein using NCL-ASYN (Clone KM51). Note staining of alpha-synuclein contain-ing Lewy bodies. Paraffin section.
Fig. 4: Human brain, Alzheimer’s disease: immunohistochemical staining for amy-loid precursor protein using NCL-APP-288 (Clone 3G12). Note intense staining of neurofibrillary tangles and senile plaques. Paraffin section.
Fig. 5: Human midbrain: immunohisto-chemical staining of tyrosine hydroxylase enzyme using NCL-TH (Clone 1B5). Note cytoplasmic staining of catecholaminer-gic cells and their processes. Paraffin section (Peroxidase substrate: nickel DAB, Counterstain: eosin).

18 reSOLUTION
curs in around 1 in 3,500 male births and is inher-ited on the X chromosome. Although females may be carriers of the defective gene, they usually show no symptoms. In severe DMD, the dystrophin pro-tein that stabilizes the muscle membrane during contraction is absent resulting in impaired function of the muscle cells and deterioration of the muscle fibres (Fig 6).
In Becker muscular dystrophy (BMD), the second most common form of muscular dystrophy, the dys-
trophin molecule is also affected but patients show a less pronounced reduction in protein expression. BMD is also linked to the X chromosome, occurring in around 1 in 30,000 male births.
The other types of muscular dystrophy are rare with proteins such as emerin, sarcoglycans and calpain affected and not all are linked to the X chromosome. A differential diagnosis may be achieved by labelling muscle biopsies with antibodies to these proteins.
Fig. 6: Human skeletal muscle: immunohis-tochemical staining for dystrophin using NCL-DYSA (Clone 13H6). Note membrane staining of normal muscle fibers (A) and reduced variable staining of muscle fibres from an individual with Duchenne and Becker muscular dystrophy (B). Paraffin section.
www.gitverlag.com
Looking back, acting forward:Compositional Analysis
Electron Microscopy
Image Processing
Light Microscopy
Scanning Probe Microscopy
www.imaging-git.com
elmieuropeanlight microscopy
initiative
We are very grateful to our partners from industry and academia, and the community, for their commitment and loyal collaboration.
10 YEARSOF FACTS AND VISIONS
IMAGING & MICROSCOPY
www.leica-microsystems.com/SP.0304
A P P L I C A T I O N R E P O R T
Neuroscience 19
Rees: Antigen design and the selection of an appro-priate target region is probably the most important step in antibody development. This determines the level of antigen solubility, immunogenicity and spe-cificity of the monoclonal antibody produced. When developing an epitope-specific antibody, immunis-ing proteins can either be made using synthetic chemical processes or produced via recombinant protein technologies using the encoding genes. Our scientists tend to favour the latter approach, pro-ducing recombinant protein and including as large a target region as possible. This maximises the prob-ability of producing a robust monoclonal antibody suitable for use on FFPE tissue.
The antigen design process involves several impor-tant steps (Fig. 1). The first step in the design pro-cess is the homology analysis where we assess the target for regions of similarity to other proteins. We identify either the region to avoid or the region(s) to produce screening antigens to help select for those hybridomas producing antibody specific for our tar-get. Once a decision on the target region has been made, we then design DNA primers specific to the encoding gene sequence to facilitate the ampli-fication of the gene. The amplified genes are then transferred to a bacterial protein expression sys-tem where the protein is expressed and purified by means of column chromatography to produce solu-ble immunogen. For any given target, we can pro-duce a number of proteins that can either be used as an immunogen or a screening protein in ELISA and Western blot validation for any antibody produced. To maximise our success rate, we have developed a
Today, Novocastra forms an important part of the overall histology range of Leica Microsystems’ Bio-systems Division. Reagents are developed in-house under strict regulatory requirements to deliver clini-cally useful results in immunohistochemistry. Novo-castra has many antibody milestones etched into its history that have found a place in the daily arsenal of antibodies used by pathologists in their laboratories. Such milestones have included the first monoclonal antibody to work in formalin-fixed, paraffin-embed-ded (FFPE) tissue for Anti-CD4 Clone 1F6 and Anti-CD23 Clone 1B12 (1996) and the world’s first and still the only clones to work in FFPE tissue for Anti-CD10 clone 56C6 (1998), Anti-CD11c clone 5D11 (2006), and Anti-CD33 clone PWS44 (2007).
To gain further insight into the development of Novo-castra™ antibodies, two scientists, Mark Rees, Ph.D., Marketing Manager, and Nigel Piggott, Ph.D., Prin-cipal Development Scientist, both of Leica Micro-systems’ Biosystems Division, explain what it takes for a company to deliver success in the form of clini-cally significant antibody reagents.
Rees: For our selection process, obtaining the “Voice of the Customer (VOC)” is crucial. By conducting a VOC exercise we are able to obtain valuable input from the market, forge collaborative links with pa-thologists and obtain the data necessary for reagent design and development. We rely upon data within the current scientific literature and also upon feed-back from our customers, through marketing and our network of Key Opinion Leaders (KOL) in pathology.
Newcastle upon Tyne – this lively town in Northern England is not only famous for its culture, but it has been the base for the devel-oper and manufacturer of antibodies and other reagents of the brand, Novocastra™. “Novocastra” is based upon the Latin name for the city of Newcastle and was the name given to the original company founded by Prof. C. Wilson Horne. The company grew and in 2003 was integrated into Vision Biosystems where its products have continued to make an impact in the immunohistochemistry diagnostic market.
Novocastra™ Antibodies
From Concept to DiagnosisKenneth Mitchell, Ph.D., Leica Microsystems
A P P L I C A T I O N R E P O R T
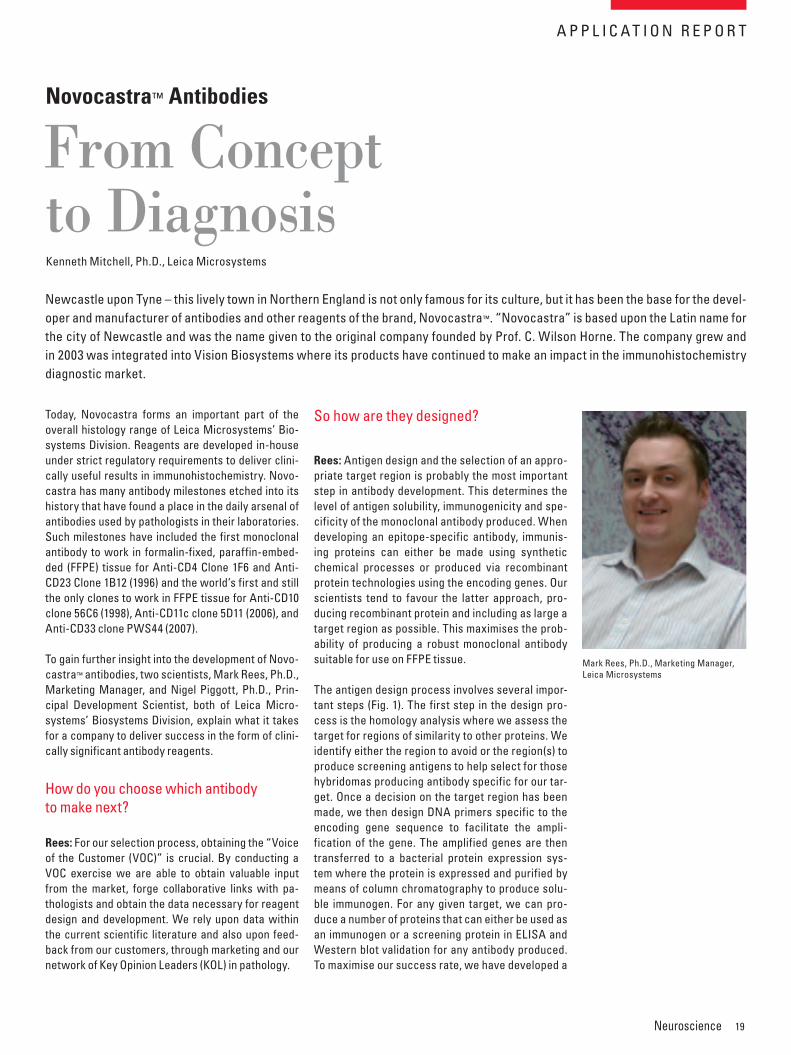
Mark Rees, Ph.D., Marketing Manager, Leica Microsystems
How do you choose which antibodyto make next?
So how are they designed?

20 reSOLUTION
series of antigenic fusion tags to enhance immuno-genicity of our antigens.
Piggott: Firstly, we have to identify that the mouse has responded to the immunogen by testing a sample of the mouse serum by IHC on FFPE tissue and by Western blot. A positive result is indicated when the mouse has responded to the protein of interest by giving the correct staining pattern on tissue and when it recognises a protein of the cor-rect molecular weight by blot. Five days prior to fusion, we would give that mouse an intravenous boost of antigen and a somatic cell fusion is car-ried out similar to that first described by Köhler and Milstein (1975). This process involves the fusion of antibody-secreting murine splenocytes to murine myeloma cells to give a hybridoma cell with im-mortal properties and antibody-generating ability. By screening the many hybridoma cells generated (Fig. 2), we are able to select for the best antibody for use in FFPE by immunohistochemistry. The next stage involves the stabilisation of the antibody-secreting properties of the hybridoma by growth
in cell culture at which time we select hybridomas that grow well and continue to secrete the anti-body of interest. Following this stabilisation, we screen the antibody produced on a range of normal and abnormal FFPE tissues obtained from ethically approved sources.
Piggott: All our research, development and manu-facturing procedures comply with regional regu-latory requirements. We perform a wide range of testing on the antibody to determine that it is the best performing, most sensitive and specific anti-body that can be used both as a liquid concentrated antibody on the bench in manual staining and as a ready-to-use reagent for the BOND-MAX™ auto-mated immunohistostainer. We have responded to the market by choosing an antibody that works in both settings. We also perform extensive stability experiments to determine that the product is stable as a liquid reagent and we produce multiple batches for manufacture and test each of these. Following this “in-house” assessment, we work closely with a number of independent pathologists who “road test” our antibodies on surgical pathology cases,
Target selection
Homology analysis
BLAST
RT PCR
or
ELISA, IHC, Western blot
Hybridomas Fusion Polyclonal Immunisation
Selection of best antibody byIHC & characterisation
Express fusion protein
Antigenic tagFusion
Fusion
Fusion
Fig. 1: Novel antibody developmentstrategies
Nigel Piggott, Ph.D., Principal Development Scientist, Leica Microsystems
A P P L I C A T I O N R E P O R T
What are the next steps to developan antibody for commercial diagnostic utility?
How do you ensure the qualityof the reagents?

Neuroscience 21
alongside a competitor antibody, if one is available. It is through such extensive screening on a wide range of tissues that have been prepared in numer-ous institutions that we are able to ensure only the best possible antibody, or clone, is selected for re-lease as a Novocastra™ reagent. Coinciding with this antibody release, our collaborating KOL’s may write a peer-reviewed article for publication.
Piggott: The time taken variable depends upon a number of different factors. If we obtain the correct, successful response in the mouse, the project usu-ally takes between 18–24 months to complete. If the project is very important we may have several strat-egies running in parallel.
Fig. 2: Hybridoma validation
ReferencesMiettinen M, Lasota J. Archives of Pathology and Laboratory Medicine 2006; 130: 1466–1478.
Rubin B. Histopathology 2006; 48: 83–96.
Köhler G, Milstein C. Nature 1975, Aug 7; 256 (5517): 495–497.
More information on Novocastra™ reagents:[email protected]
www.leica-microsystems.com/SP.030
A P P L I C A T I O N R E P O R T
The interview was conducted by:Kenneth Mitchell, Ph.D., Product Manager, Leica Microsystems
How long does this process take?
22 reSOLUTION
The New Leica Bond™ Research Platform
Enhanced Research Applications for IHC Michael Gandy and Craig Barker, Leica Microsystems
A wide variety of histological techniques have long been employed in cancer research and diagnostics. Historically these tech-niques, such as immunohistochemistry (IHC) and in situ hybridisation (ISH), have been manual, time consuming and labour inten-sive. In the field of histology, three major technical advancements over the last decade – high volume tissue micro-arraying, fully automated IHC and ISH, and slide scanning and image analysis – have enabled histological investigation to remain as one of the key life science research tools used today.
Yet to find widespread application in the diagnostic setting, multiple labelling is a technique that has
been successfully performed in various formats for a number of years. Two of the main uses of
multiple labelling techniques have been their utilisation in evaluating antigen versus an-tigen or antigen versus gene expression in samples with limited viable cellular material or in samples where cellular differentiation and/or antigenic expression in adjacent
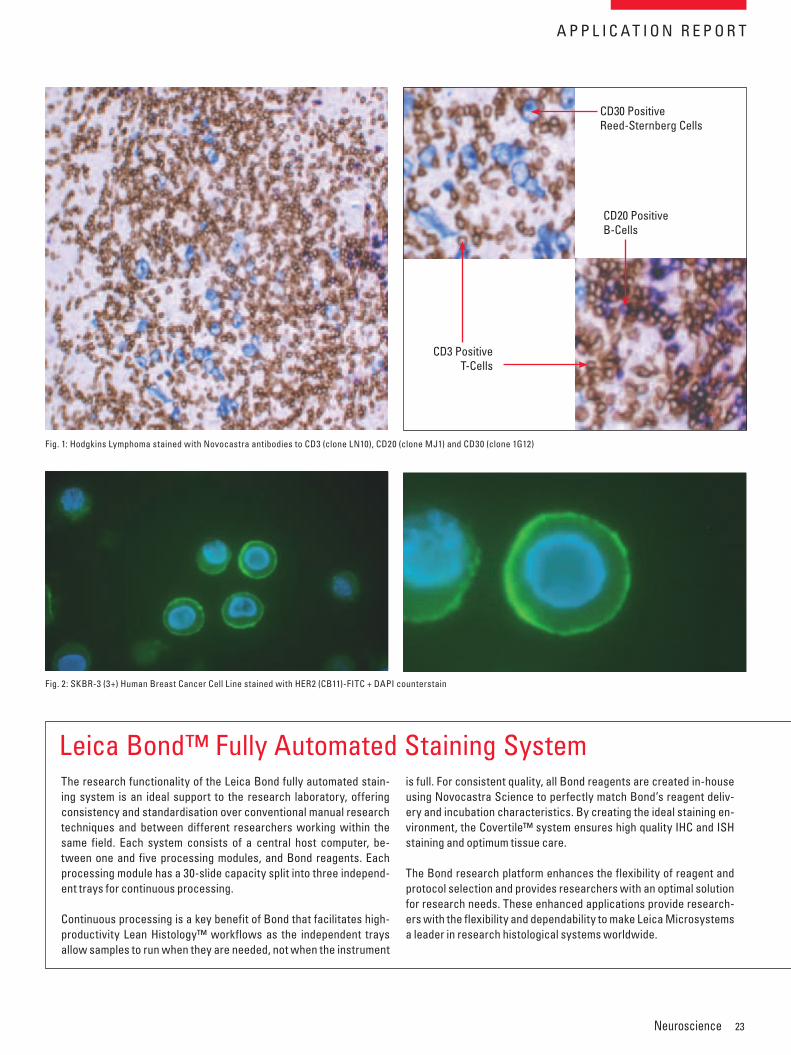
cellular targets require same slide evalua-tion. Figure 1 illustrates a case of Hodgkin’s
Lymphoma stained with Novocastra™ anti-bodies to CD3 (clone LN10), CD20 (clone MJ1) and
CD30 (clone 1G12).
The application of direct immunofluorescence is a useful research tool for assessing primary antibody specificity. The lack of subsequently applied chro-mogenic detection chemistry allows the assignment of a specific fluorescence signal to the antibody un-der evaluation, ruling out any potential detection system cross reactivity. This technique can often be used with multiple marker/multiple fluorophore labels to demonstrate and differentiate a range of highly specific cellular components. Figure 2 illus-trates fully automated direct immunofluorescence of the SKBR-3 human breast cancer cell line stained with the anti-FITC conjugated mouse monoclonal anti-HER2 antibody clone CB11 and counterstained with DAPI. Note the slight granular appearance of
the direct fluorescent signal attributed to the spe-cific heterogeneity of membrane HER2 expression. This specific membrane expression pattern is often lost when layered chromogenic signal amplification is applied.
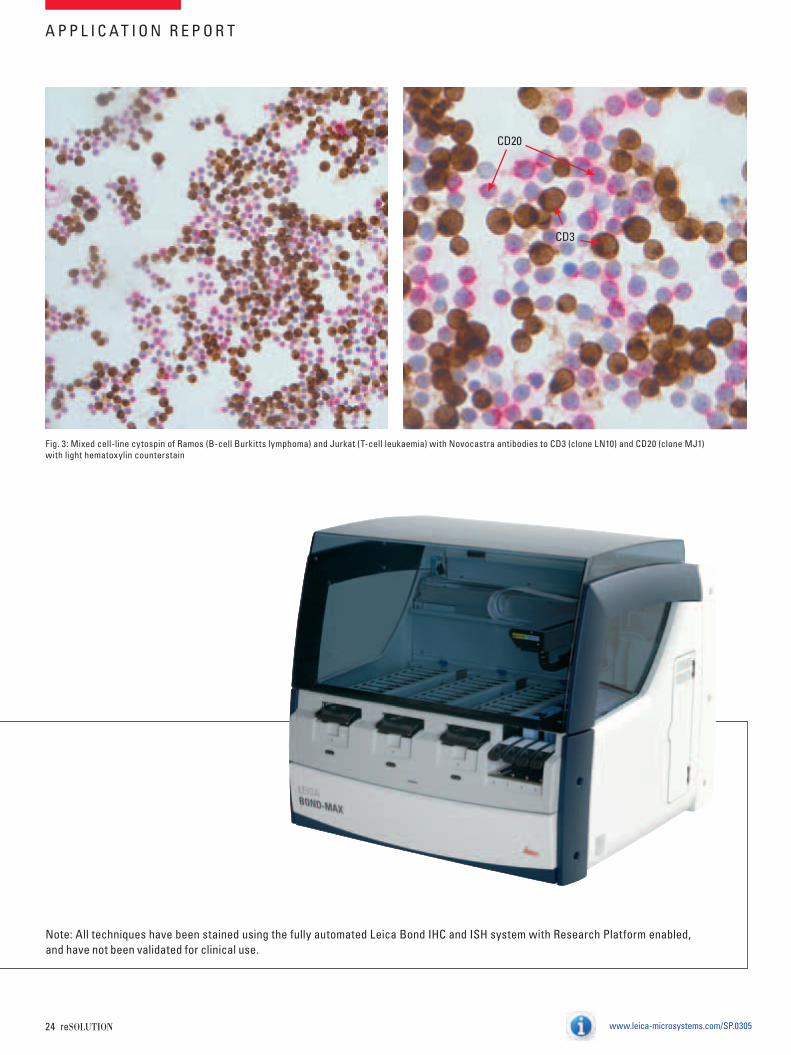
The performance of immunocytochemistry on cy-tological preparations is again commonplace in the clinical setting, but it also has a role within cancer research. The use of cytological preparations in tu-mour biology research allows for cellular antigens to be evaluated and localisation determined without the artifacts induced by the rigours of prolonged formalin fixation and paraffin processing. Figure 3 shows dual colour labelling on an in-house grown, polyethylene glycol (PEG) fixed, mixed cell-line cyto-spin of Ramos (B-cell Burkitts lymphoma) andJurkat (T-cell leukaemia) with Novocastra anti-bodies to CD3 (clone LN10) and CD20 (clone MJ1), with a light hematoxylin counterstain. Note the polar membrane localisation of CD20 together with blanket membrane and cytoplasmic staining of the CD3 antigen.
More information on the Leica Bond™ system: [email protected]
More information on research solutions andapplications:[email protected]
A P P L I C A T I O N R E P O R T
Multiple chromogenic labelling
Direct immunofluorescence
Cytological immunopreparations
Neuroscience 23
Fig. 1: Hodgkins Lymphoma stained with Novocastra antibodies to CD3 (clone LN10), CD20 (clone MJ1) and CD30 (clone 1G12)
CD30 PositiveReed-Sternberg Cells
CD20 PositiveB-Cells
CD3 PositiveT-Cells
Fig. 2: SKBR-3 (3+) Human Breast Cancer Cell Line stained with HER2 (CB11)-FITC + DAPI counterstain
The research functionality of the Leica Bond fully automated stain-ing system is an ideal support to the research laboratory, offering consistency and standardisation over conventional manual research techniques and between different researchers working within the same field. Each system consists of a central host computer, be-tween one and five processing modules, and Bond reagents. Each processing module has a 30-slide capacity split into three independ-ent trays for continuous processing.
Continuous processing is a key benefit of Bond that facilitates high-productivity Lean Histology™ workflows as the independent trays allow samples to run when they are needed, not when the instrument
is full. For consistent quality, all Bond reagents are created in-house using Novocastra Science to perfectly match Bond’s reagent deliv-ery and incubation characteristics. By creating the ideal staining en-vironment, the Covertile™ system ensures high quality IHC and ISH staining and optimum tissue care.
The Bond research platform enhances the flexibility of reagent and protocol selection and provides researchers with an optimal solution for research needs. These enhanced applications provide research-ers with the flexibility and dependability to make Leica Microsystems a leader in research histological systems worldwide.
Leica Bond™ Fully Automated Staining System
A P P L I C A T I O N R E P O R T
24 reSOLUTION
b
Fig. 3: Mixed cell-line cytospin of Ramos (B-cell Burkitts lymphoma) and Jurkat (T-cell leukaemia) with Novocastra antibodies to CD3 (clone LN10) and CD20 (clone MJ1) with light hematoxylin counterstain
CD20
CD3
Note: All techniques have been stained using the fully automated Leica Bond IHC and ISH system with Research Platform enabled, and have not been validated for clinical use.
www.leica-microsystems.com/SP.0305
A P P L I C A T I O N R E P O R T
Neuroscience 25
Why do we grow old? Research scientists have been looking for an answer to this question for many years – particularly against the background of the increase in neurodegenerative diseases among older people such as Morbus Parkinson. Molecular-biological studies suggest that mitochondria play a major role in the ageing process. PD Dr. med. Andreas Bender from the Neurological Hospital of the University of Munich / Großhadern is researching the mitochondrial hypothesis of ageing, which regards a molecular vicious circle of oxidative damage and mtDNA mutations as being a cause of neuronal functional disorders. In this field of research, laser microdissection is a valuable technique for obtaining homogeneous sample material from individual cell types for meaningful results.
Laser Microdissection in the Research of Ageing andNeurodegenerative Diseases
The MitochondrialHypothesis of AgeingAnja Schué, Leica Microsystems
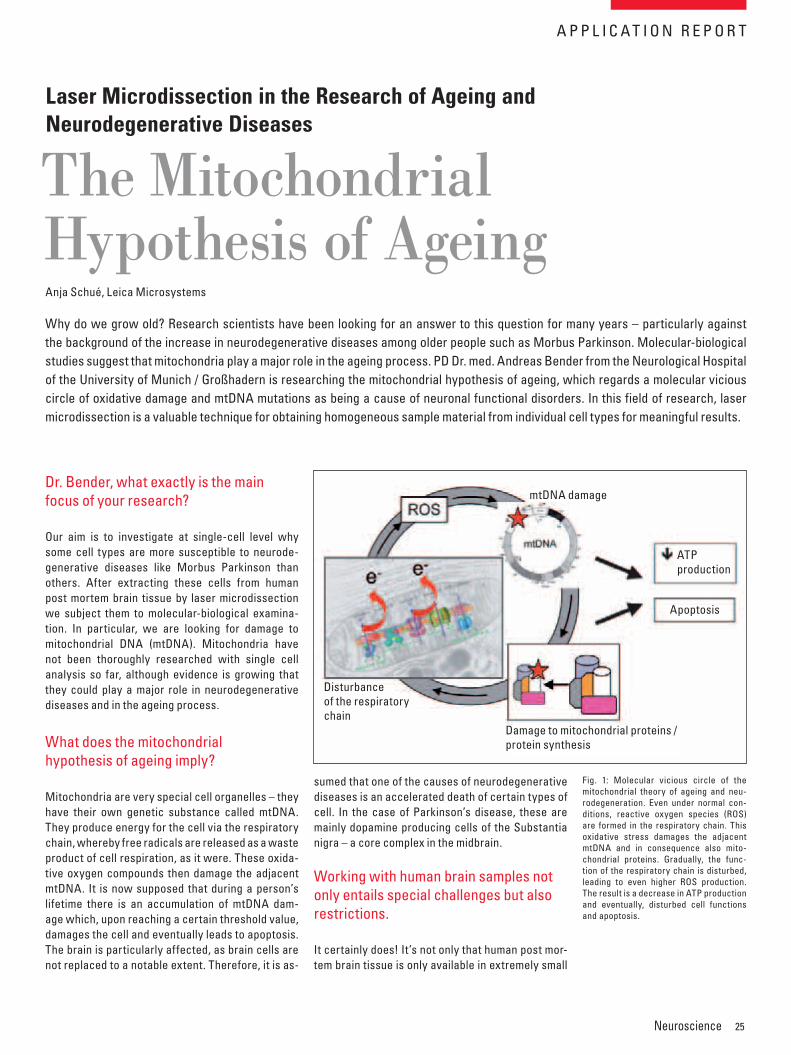
Fig. 1: Molecular vicious circle of the mitochondrial theory of ageing and neu-rodegeneration. Even under normal con-ditions, reactive oxygen species (ROS) are formed in the respiratory chain. This oxidative stress damages the adjacent mtDNA and in consequence also mito-chondrial proteins. Gradually, the func-tion of the respiratory chain is disturbed, leading to even higher ROS production. The result is a decrease in ATP production and eventually, disturbed cell functions and apoptosis.
sumed that one of the causes of neurodegenerative diseases is an accelerated death of certain types of cell. In the case of Parkinson’s disease, these are mainly dopamine producing cells of the Substantia nigra – a core complex in the midbrain.
It certainly does! It’s not only that human post mor-tem brain tissue is only available in extremely small
Our aim is to investigate at single-cell level why some cell types are more susceptible to neurode-generative diseases like Morbus Parkinson than others. After extracting these cells from human post mortem brain tissue by laser microdissection we subject them to molecular-biological examina-tion. In particular, we are looking for damage to mitochondrial DNA (mtDNA). Mitochondria have not been thoroughly researched with single cell analysis so far, although evidence is growing that they could play a major role in neurodegenerative diseases and in the ageing process.
Mitochondria are very special cell organelles – they have their own genetic substance called mtDNA. They produce energy for the cell via the respiratory chain, whereby free radicals are released as a waste product of cell respiration, as it were. These oxida-tive oxygen compounds then damage the adjacent mtDNA. It is now supposed that during a person’s lifetime there is an accumulation of mtDNA dam-age which, upon reaching a certain threshold value, damages the cell and eventually leads to apoptosis. The brain is particularly affected, as brain cells are not replaced to a notable extent. Therefore, it is as-
Damage to mitochondrial proteins /protein synthesis
Disturbanceof the respiratory chain
mtDNA damage
Apoptosis
ATPproduction
A P P L I C A T I O N R E P O R T
Dr. Bender, what exactly is the mainfocus of your research?
What does the mitochondrialhypothesis of ageing imply?
Working with human brain samples not only entails special challenges but also restrictions.
26 reSOLUTION
examine the cells that interest us. Before the age of laser microdissection, most examinations were done on homogenates. These contained different types of cells, so that the molecular connections we were researching sometimes disappeared in a great background noise. If a disease only affects one par-ticular cell type, as in the case of Parkinson’s, we only obtain meaningful results when we are able to analyse homogeneous cell material. This is the ad-vantage of laser microdissection.
I have worked with different systems and I am able to say that I am extremely satisfied with the technol-ogy of Leica Microsystems. I like the way the dissec-tates just drop down by the pull of gravity instead of having to be collected by complicated systems. The Leica system is fast and precise, and the software is clearly designed and easy to use, too.
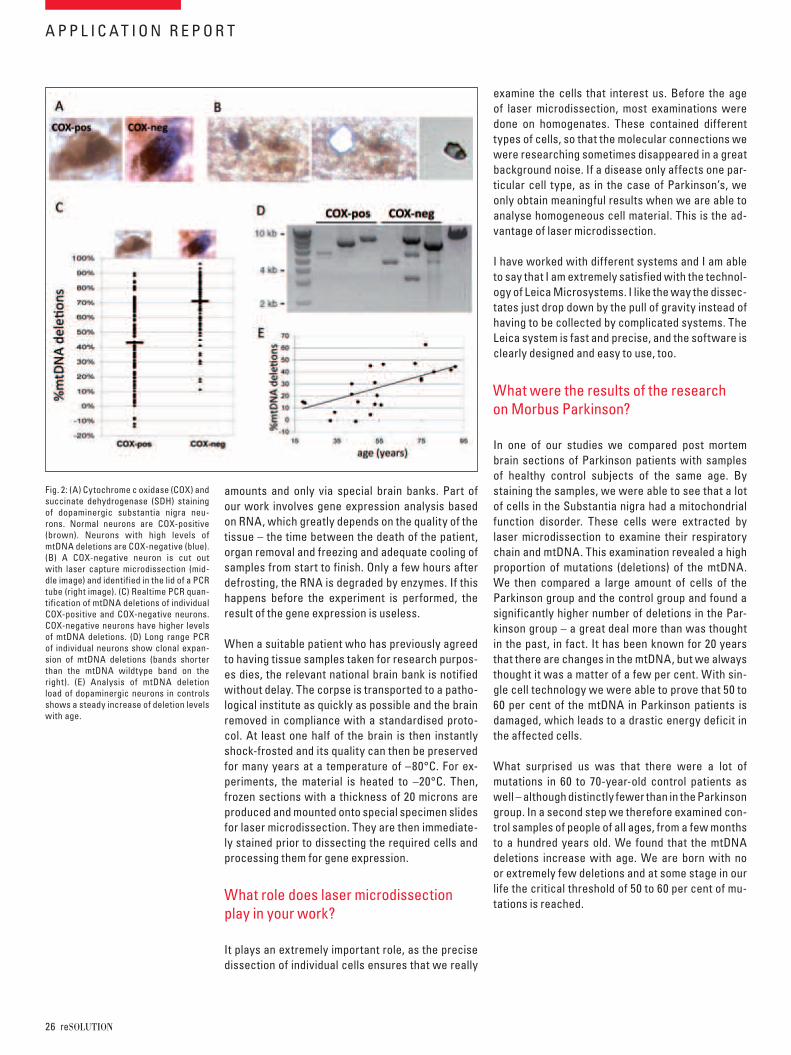
In one of our studies we compared post mortem brain sections of Parkinson patients with samples of healthy control subjects of the same age. By staining the samples, we were able to see that a lot of cells in the Substantia nigra had a mitochondrial function disorder. These cells were extracted by laser microdissection to examine their respiratory chain and mtDNA. This examination revealed a high proportion of mutations (deletions) of the mtDNA. We then compared a large amount of cells of the Parkinson group and the control group and found a significantly higher number of deletions in the Par-kinson group – a great deal more than was thought in the past, in fact. It has been known for 20 years that there are changes in the mtDNA, but we always thought it was a matter of a few per cent. With sin-gle cell technology we were able to prove that 50 to 60 per cent of the mtDNA in Parkinson patients is damaged, which leads to a drastic energy deficit in the affected cells.
What surprised us was that there were a lot of mutations in 60 to 70-year-old control patients as well – although distinctly fewer than in the Parkinson group. In a second step we therefore examined con-trol samples of people of all ages, from a few months to a hundred years old. We found that the mtDNA deletions increase with age. We are born with no or extremely few deletions and at some stage in our life the critical threshold of 50 to 60 per cent of mu-tations is reached.
amounts and only via special brain banks. Part of our work involves gene expression analysis based on RNA, which greatly depends on the quality of the tissue – the time between the death of the patient, organ removal and freezing and adequate cooling of samples from start to finish. Only a few hours after defrosting, the RNA is degraded by enzymes. If this happens before the experiment is performed, the result of the gene expression is useless.
When a suitable patient who has previously agreed to having tissue samples taken for research purpos-es dies, the relevant national brain bank is notified without delay. The corpse is transported to a patho-logical institute as quickly as possible and the brain removed in compliance with a standardised proto-col. At least one half of the brain is then instantly shock-frosted and its quality can then be preserved for many years at a temperature of –80°C. For ex-periments, the material is heated to –20°C. Then, frozen sections with a thickness of 20 microns are produced and mounted onto special specimen slides for laser microdissection. They are then immediate-ly stained prior to dissecting the required cells and processing them for gene expression.
It plays an extremely important role, as the precise dissection of individual cells ensures that we really
Fig. 2: (A) Cytochrome c oxidase (COX) and succinate dehydrogenase (SDH) staining of dopaminergic substantia nigra neu-rons. Normal neurons are COX-positive (brown). Neurons with high levels of mtDNA deletions are COX-negative (blue). (B) A COX-negative neuron is cut out with laser capture microdissection (mid-dle image) and identified in the lid of a PCR tube (right image). (C) Realtime PCR quan-tification of mtDNA deletions of individual COX-positive and COX-negative neurons. COX-negative neurons have higher levels of mtDNA deletions. (D) Long range PCR of individual neurons show clonal expan-sion of mtDNA deletions (bands shorter than the mtDNA wildtype band on the right). (E) Analysis of mtDNA deletion load of dopaminergic neurons in controls shows a steady increase of deletion levels with age.
A P P L I C A T I O N R E P O R T
What role does laser microdissection play in your work?
What were the results of the research on Morbus Parkinson?
Neuroscience 27www.leica-microsystems.com/SP.0306
Such therapies are feasible in principle, of course. One approach would be to prevent cells from ac-cumulating mitochondrial damage by using anti-oxidative substances. On the other hand, extensive research is being conducted on how to make an already damaged cell produce more new, healthy mitochondria. However, it is too early to predict whether and when the results will assume rele-vance for mitochondrial diseases in everyday hos-pital routine.
Mitochondrial function disorders are certainly not the only cause of ageing. A recent review compared over a hundred hypotheses on why we grow old. Even if we managed to protect the mitochondria, it would be wrong to conclude that the cell would then lead a long and healthy life. It might trigger new problems. Saving mitochondria as a recipe for the fountain of youth; that is too simple, even though, of course, it would be a nice aspect of our work.
ReferencesBender A et al. Dopaminergic midbrain neurons are the prime tar-get for mitochondrial DNA deletions. J Neurol. 2008; 255:1231-5.
Reeve AK, Krishnan KJ, Elson JL, Morris CM, Bender A et al. Na-ture of mitochondrial DNA deletions in substantia nigra neurons. Am J Hum Genet. 2008;82:228-35.
Bender A et al. High levels of mitochondrial DNA deletions in sub-stantia nigra neurons in aging and Parkinson disease. Nat Genet. 2006;38:515-517.
More information on mitochondria research:[email protected]
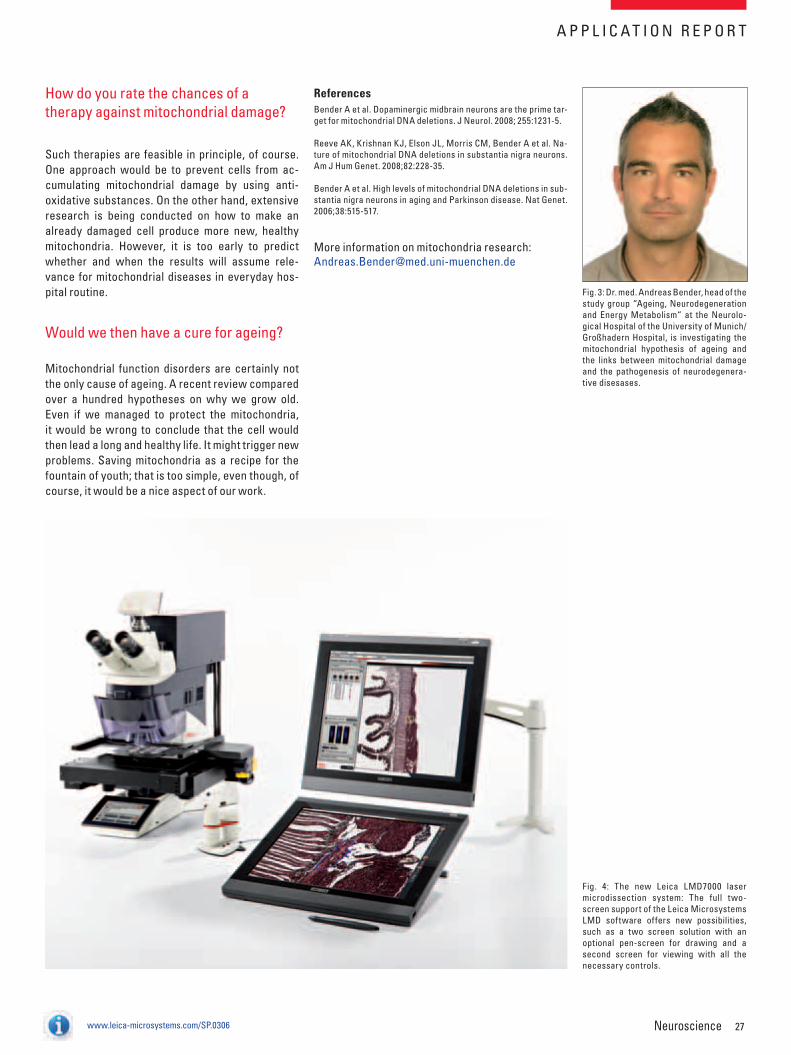
Fig. 3: Dr. med. Andreas Bender, head of the study group “Ageing, Neurodegeneration and Energy Metabolism“ at the Neurolo-gical Hospital of the University of Munich/ Großhadern Hospital, is investigating the mitochondrial hypothesis of ageing and the links between mitochondrial damage and the pathogenesis of neurodegenera-tive disesases.
A P P L I C A T I O N R E P O R T
Fig. 4: The new Leica LMD7000 laser microdissection system: The full two-screen support of the Leica Microsystems LMD software offers new possibilities, such as a two screen solution with an optional pen-screen for drawing and a second screen for viewing with all the necessary controls.
How do you rate the chances of atherapy against mitochondrial damage?
Would we then have a cure for ageing?

28 reSOLUTION
New Stereotaxic Instrument
Deep Brain Surgery inAnimal ResearchCharles W. Scouten, Ph.D., Leica Microsystems
The brain is different from most other organs. Every location in it has a different function for the animal’s behaviour or bodily control. So much so that mapping the brain as to chemistry, connectivity and function is a major part of what neuro-science is about. Neuroscientists study functional localisation in the brain partly so that we can know where in the brain a particular symptom set arose. To study lo-calisation, it is necessary to be able to reproducibly place probes of various kinds –lesion electrode, recording electrode, microdialysis probe, stimulating electrode, injection needle, withdrawal cannula, and more – in very specific locations in the brain. In primates or animals such as cats or dogs, such placement would have to be guided by an image of the particular brain under study, since individual differ-ences are very large.
Fig. 1: The Leica Angle Two stereotaxic instrument improves accuracy in small animal brain surgery
In rodents of a given species and age range, how-ever, there are only very small individual differences in brain size and shape. Thus, it is possible to make a 3D map – a Stereotaxic Atlas – of the brain with co-ordinate overlay giving dimensions of how to reach any part of the brain. A stereotaxic instrument is then used to move a probe from a selected external zero point to a specified coordinate location in the brain.
The small animal stereotaxic instrument Leica Angle Two significantly improves accuracy over conventional vernier scale stereotaxic instruments, and enables the operator to reach any target site in the brain from any chosen angle accurately and consistently.
A stereotaxic instrument is composed of a species-specific head holder mounted on a base plate and used to orient an anaesthetised animal’s head in a defined position, and a 3D manipulator with move-ment axes aligned with the head holder. The ma-nipulator is used to move a probe tip to a selected target coordinate in the brain of that animal relative to a chosen zero point. The zero point is usually skull landmarks Bregma or Lambda, which are visible lines on the skull where bone plates have grown to-gether. These points overlie the brain at consistent positions relative to brain structures in rodents (less reliably in primates or most other mammals). They are at a crossover of the midline suture, and the an-terior (Bregma) and posterior (Lambda) coronal su-tures across the skull perpendicular to the midline. Conventional stereotaxic instruments have three vernier scales to align to measure from Bregma to the target.
The vernier scale instruments have the flexibility to tilt or rotate the manipulator to a different approach angle, but doing so usually requires a pilot study to see where the tips are reaching to, and adjusting the target coordinates. As a result, stereotaxic surgery is much easier to do, and takes much less time with less risk of error, and fewer animals, if the probe al-ways approaches in a straight vertical position with the head in the “skull flat” position. However, this results in confounding the path of approach with the action at target. For example, if making injections
T E C H N O L O G Y
Reaching any target
Easier, more efficient and safer

Neuroscience 29
Fig. 2: Angle Two screen shows where the probe tip is above or in the brain as the operator moves it toward the target
Fig. 3: Intersection of Bregma and Lamba. Courtesy of Miles Cunningham, MD, Ph.D., McLean Hospital of Harvard University, Cambridge, MA.
into hypothalamus from a glass pipette, a little in-jectate will leak out on the way down. Then, when a bolus is forced out, some will run up the path of least resistance, the already opened needle track. Lastly, when the pipette is pulled out, it leaves a vacuum behind and more injectate is sucked up into the nee-dle track.
So overall, the injection is not just in the hypothala-mus, but all along the needle path through the brain. Which leaves the question when results are seen lat-er, are they caused by the injection at the target site, or the injected material somewhere above the target? A similar analysis applies to lesion or recording stud-ies, and tissue damaged by passage of the electrode.
With the Leica Angle Two, every surgery can be done from a different approach angle, without need for pilot studies or manual math problem solving. If the same result is achieved over several different approach paths, then it is the action at target, not something along the approach path, that caused the result. Interpretation of results is better served by varying the angle of approach.
The manipulator features linear encoders on the three linear axes, and rotary encoders on tilt and rotation movements, five instrumented axes in all. These connect to a computer, into which a target point in conventional atlas coordinates relative
T E C H N O L O G Y
Varying the angle of approach

30 reSOLUTION
Fig. 4: A stereotaxic instrument holds the head in a fixed position. The instrument has an arm that can move in three dimen-sions. The surgeon can thus position an electrode or other device within a particu-lar sub-cortical structure.
to Bregma and assuming “skull flat” (Bregma and Lambda at the same vertical coordinate) is entered either by typing, or by scrolling an onscreen atlas of coronal sections of the brain, and clicking on the de-sired target point in the atlas pictures.
The animal is then anaesthetised and installed in the head holder, the skull landmarks exposed, and the manipulator tilted and/or rotated to any cho-sen complex angle. The rotary encoders supply the computer with exact information about the angle of approach of the probe. The operator only needs to touch the probe tip to Bregma and click to show the computer the location of Bregma in the tilted and ro-tated coordinates. The computer has the math algo-rithms to display how far to move on the three linear axes to move the tip to the target point, given the tilt and rotation.
The three displayed coordinate numbers count down to zero as the target coordinates are ap-proached. The atlas display on screen shows where
the probe tip is above or in the brain as the operator moves it toward the target. The user can see what structures are being traversed as the probe moves toward the target.
The Leica Angle Two includes the Virtual Skull Flat™ feature. Adjusting the animal’s head to skull flat is normally a trial and error and time consuming proc-ess. Very small errors in head tilt give large errors in position reached, especially if the probe is being lowered to a position deep in the brain. Touching the probe to Lambda, and clicking a button on screen, after showing the computer where Bregma is lo-cated, enables the computer to calculate the degree of head tilt, and how that alters the target position. The path to the target is then recalculated given the head tilt, and a mathematically correct target posi-tion presented. It is no longer necessary to achieve actual skull flat adjustment.
www.leica-microsystems.com/SP.0307
T E C H N O L O G Y
No time-consuming adjustment

Neuroscience 31
“Ideally, a tissue slicer should generate large-amplitude and high-frequency movements of the cutting blade in a horizontal axis, with minimal vibrations in the vertical axis.”* (According to Prof. Peter Jonas, Institute of Physiology, University of Freiburg, Germany)
Leica VT1200 and Leica VT1200 S
Good Vibrations for GreatSections in NeuroscienceBianca Kircher, Leica Microsystems
Key features – High section quality– Vertical vibration measurement device “Vibrocheck”– New blade holder for safe blade insertion– Removable ice and buffer tray (drawer principle)– Integrated palm rests – Integrated LED illumination– Optional magnifier– Optional microscope – External control panel
Leica Microsystems translated this into the semi automated Leica VT1200 and the semi- and fully au-tomated Leica VT1200 S Vibrating Blade Microtome for cutting fresh and fixed tissues in neuroscience. Both instruments cut tissue with minimal vertical deflection for sectioning results of highest quality with viable cells retained on the section surfaces. The vertical deflection can be measured by using the optional measurement device Vibrocheck and minimised below 1 µm by using an adjustment screw on the blade holder. The semiautomatic instrument is the preferred instrument for users who wish to manually select the desired section thickness prior to each section.
This fully automated instrument is recommended for multi user laboratories where users who prefer semi-automated vibrating blade microtomes and users who prefer fully automated instruments can work together. The mode of operation can be indi-vidually selected and up to eight individual param-eter settings can be stored. The instrument was designed in collaboration with Prof. Dr. Peter Jonas and his group, Physiology Department, University of Freiburg, Germany.
* ReferenceJ. R. P. Geiger, J. Bischofberger, I. Vida, U. Fröbe, S. Pfitzinger, H. J. Weber, K. Haverkampf, P. Jonas: Patch-clamp recording in brain slices with improved slicer technology. Pflügers Arch. – Eur. J. Phy siol. (2002) 443: 491–501.
www.leica-microsystems.com/SP.0308
T E C H N O L O G Y

32 reSOLUTION
T E C H N O L O G Y
The World’s First Macro Zoom Confocal
From Gene to Cell –from Cell to EmbryoAnja Schué, Leica Microsystems
Modern developmental biology is an emerging field of research, studying the dynamics of cell growth, differentiation processes and the development of organs in vivo. Thus, an increasing number of scientists extend their focus of bio-research from single cell studies to entire organisms, analysing the complex interaction within whole animals. These studies require an imaging system which provides high resolution, a large workspace, and a large field of view. A pioneering imaging system provides all these fea-tures in one: the Leica TCS LSI.
The large scale imaging platform adapts perfectly to the experiment needs of living specimen analysis. True confocal technology is used to provide crystal clear images of highest spectral resolution, reveal-ing finest details of the model organism, no matter if drosophila fly, mouse, zebra fish, plant or other model. An automated optical zoom system allows for seamless magnification change, easy switch-ing from overview to details and free 3D navigation through the specimen. Comfortable specimen hand-ling is provided by generous workspace.
The time for preparation, pre-selection and orienta-tion of the specimen is reduced enormously as macro and high-resolution confocal are combined in one in vivo system. Entire new experiments become possi-ble. By avoiding the transportation between different imaging tools, stress to living specimens is reduced, the survival rate increased. The Leica TCS LSI visu-alises cell growth and the fascinating differentiation of cells into organs in real life from cell to embryo – from embryo to adult.
Time resolved 4D processes – e.g. protein interac-tions or influence of drugs in bio-medical research – can be easily studied at highest resolution as ad-vanced time lapse software is provided. The Leica LAS AF Live Data Mode offers perfect automation for cell development studies.
A novelty in confocal imaging even for large speci-mens is the tremendous working distance of 97 mm and a field of view of 16 mm provided by the 1x apochromatic macro objective. Additionally, high resolution compound objectives can be adapted to use the Leica TCS LSI as a classical confocal.
Fig. 1: The unique Leica TSC LSI combines high resolution from micro to macro, a large workspace, and a large field of view. It opens new pathways for in vivo studies.
In vivo – large scale imaging High resolution from macro to micro
Making life visible in 4D

Neuroscience 33
T E C H N O L O G Y
A
Successful innovations need an idea to spark them off and professionals to put them into practice. In the case of the Leica TCS LSI it was the collabora-tion between the IGBMC (Institut de Génétique et de Biologie Moléculaire et Cellulaire, Strasbourg, France), one of Europe’s leading biomedical re-search centres, and Leica Microsystems that ena-bled its development. For over ten years a close and productive relationship has existed between the IGBMC and Leica which has brought enormous benefits to both sides
The IGBMC Imaging Centre owns more than 400 microscopy systems. Its founder and manager,Dr. Jean-Luc Vonesch, buys all the light micro-scopes and confocal systems from Leica Microsys-tems. The institute is one of the first to use Leica Microsystems’ latest technologies. This provides valuable feedback from experienced users so that products can be improved and further developed. The cooperation goes further than this, though. Eight years ago, Vonesch and microscopy special-ist Didier Hentsch already had the idea of develop-ing a microscope for in vivo studies that combined
the advantages of macroscopy with those of high-resolution fluorescence technology. The result was the Leica MacroFluo™. The special thing about the MacroFluo™ concept is the combination of the long working distances and object fields of a ster-eomicroscope with the vertical light path typical of microscopes. This guarantees absolutely parallax-free imaging and a maximum of precision for exam-ining whole in vivo models.
A few years later, the time was ripe for the next in-novation: the combination of macroscopy and con-focal technology. After three years’ development time and three prototypes, the Leica TCS LSI was ready for the market. “Right from the start, Leica Microsystems helped us to realise our ideas,” says Vonesch. “We discussed what we were envisag-ing and followed the project through together from the idea to the integrated system by excellent co-operation with product management.” Today, the Leica TCS LSI is put to extremely successful use at the IGBMC, e.g. for exploring arteriosclerosis or the cause of thrombosis in mice. “And we’re already working on improvements for the next generation of instruments,” adds Vonesch.
Fig. 3: The fathers of the first super-zoom confocal system: Didier Hentsch (lef t), microscope specialist at the IGBMC, and Dr. Jean-Luc Vonesch, Head of the IGBMC Imaging Centre in Strasbourg, France.
Fig. 2: Neuronal network in mouse brain (Carbocyanine Did). Courtesy of Dr. Pierre Godement, IGFL – École Normale Supérieure of Lyon, France
Fig. 4: Seamless zooming in and out. The 16:1 super zoom offers the largest magnifi-cation range from 0.57x to 9.2x. The Leica Z-zoom systems are fully apochromatic and allow continuous and parallax-free magnification adjustment.
www.leica-microsystems.com/SP.0309
IGBMC and Leica Microsystems
Combined expertise
From the idea to an integrated system
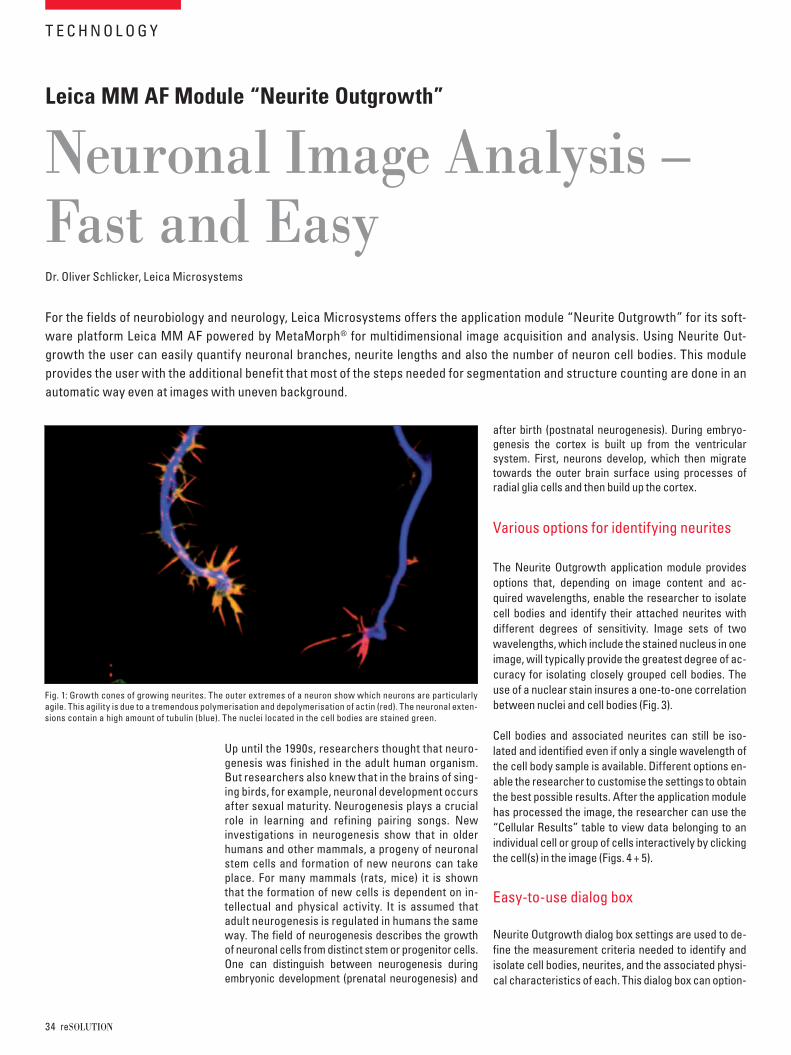
34 reSOLUTION
Leica MM AF Module “Neurite Outgrowth”
Neuronal Image Analysis – Fast and EasyDr. Oliver Schlicker, Leica Microsystems
For the fields of neurobiology and neurology, Leica Microsystems offers the application module “Neurite Outgrowth” for its soft-ware platform Leica MM AF powered by MetaMorph® for multidimensional image acquisition and analysis. Using Neurite Out-growth the user can easily quantify neuronal branches, neurite lengths and also the number of neuron cell bodies. This module provides the user with the additional benefit that most of the steps needed for segmentation and structure counting are done in an automatic way even at images with uneven background.
Up until the 1990s, researchers thought that neuro-genesis was finished in the adult human organism. But researchers also knew that in the brains of sing-ing birds, for example, neuronal development occurs after sexual maturity. Neurogenesis plays a crucial role in learning and refining pairing songs. New investigations in neurogenesis show that in older humans and other mammals, a progeny of neuronal stem cells and formation of new neurons can take place. For many mammals (rats, mice) it is shown that the formation of new cells is dependent on in-tellectual and physical activity. It is assumed that adult neurogenesis is regulated in humans the same way. The field of neurogenesis describes the growth of neuronal cells from distinct stem or progenitor cells. One can distinguish between neurogenesis during embryonic development (prenatal neurogenesis) and
after birth (postnatal neurogenesis). During embryo-genesis the cortex is built up from the ventricular system. First, neurons develop, which then migrate towards the outer brain surface using processes ofradial glia cells and then build up the cortex.
The Neurite Outgrowth application module provides options that, depending on image content and ac-quired wavelengths, enable the researcher to isolate cell bodies and identify their attached neurites with different degrees of sensitivity. Image sets of two wavelengths, which include the stained nucleus in one image, will typically provide the greatest degree of ac-curacy for isolating closely grouped cell bodies. The use of a nuclear stain insures a one-to-one correlation between nuclei and cell bodies (Fig. 3).
Cell bodies and associated neurites can still be iso-lated and identified even if only a single wavelength of the cell body sample is available. Different options en-able the researcher to customise the settings to obtain the best possible results. After the application module has processed the image, the researcher can use the “Cellular Results” table to view data belonging to an individual cell or group of cells interactively by clicking the cell(s) in the image (Figs. 4 + 5).
Neurite Outgrowth dialog box settings are used to de-fine the measurement criteria needed to identify and isolate cell bodies, neurites, and the associated physi-cal characteristics of each. This dialog box can option-
T E C H N O L O G Y
Fig. 1: Growth cones of growing neurites. The outer extremes of a neuron show which neurons are particularly agile. This agility is due to a tremendous polymerisation and depolymerisation of actin (red). The neuronal exten-sions contain a high amount of tubulin (blue). The nuclei located in the cell bodies are stained green.
Various options for identifying neurites
Easy-to-use dialog box
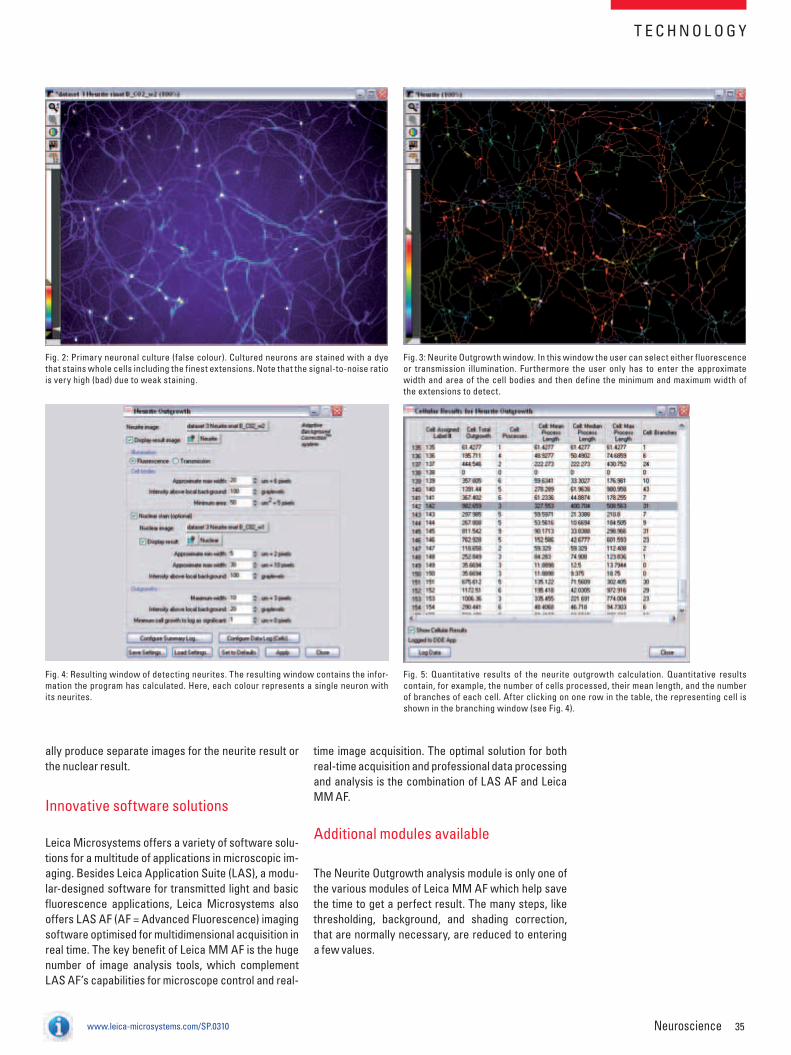
Neuroscience 35
T E C H N O L O G Y
ally produce separate images for the neurite result or the nuclear result.
Leica Microsystems offers a variety of software solu-tions for a multitude of applications in microscopic im-aging. Besides Leica Application Suite (LAS), a modu-lar-designed software for transmitted light and basic fluorescence applications, Leica Microsystems also offers LAS AF (AF = Advanced Fluorescence) imaging software optimised for multidimensional acquisition in real time. The key benefit of Leica MM AF is the huge number of image analysis tools, which complement LAS AF’s capabilities for microscope control and real-
time image acquisition. The optimal solution for both real-time acquisition and professional data processing and analysis is the combination of LAS AF and Leica MM AF.
The Neurite Outgrowth analysis module is only one of the various modules of Leica MM AF which help save the time to get a perfect result. The many steps, like thresholding, background, and shading correction, that are normally necessary, are reduced to entering a few values.
Fig. 2: Primary neuronal culture (false colour). Cultured neurons are stained with a dye that stains whole cells including the finest extensions. Note that the signal-to-noise ratio is very high (bad) due to weak staining.
Fig. 3: Neurite Outgrowth window. In this window the user can select either fluorescence or transmission illumination. Furthermore the user only has to enter the approximate width and area of the cell bodies and then define the minimum and maximum width of the extensions to detect.
Fig. 4: Resulting window of detecting neurites. The resulting window contains the infor-mation the program has calculated. Here, each colour represents a single neuron with its neurites.
Fig. 5: Quantitative results of the neurite outgrowth calculation. Quantitative results contain, for example, the number of cells processed, their mean length, and the number of branches of each cell. After clicking on one row in the table, the representing cell is shown in the branching window (see Fig. 4).
www.leica-microsystems.com/SP.0310
Innovative software solutions
Additional modules available

36 reSOLUTION
www.leica-microsystems.com/SP.0311
High precision is essential when preparing specimens for microscopy or other applications in neurological research. The Leica CM3050 S cryostat combines a high standard of precision with an ergonomic design.
Cryostat Leica CM3050 S
Ice-Cold PrecisionClaudia Dorenkamp, Leica Microsystems
At a Glance• Section thickness setting
outside the cryochamber on the control panel
• Step motor feed for reproducible thin sections
• Programmable reversesection counter
• Section thickness settings from 0.5 to 300 μm
• Separate control of specimen head and cryochamber temperature
• Ergonomic operation in a sitting position
With the Leica CM3050 S the user can operate from a comfortable sitting position, making long sessions at the instrument less tiring. The precise step motor allows reproducible thin series of sections of maxi-mum quality, although it is equally good for extra thick sections of up to 300 μm which are also frequently used in neuroscientific research. The precise speci-men orientation facilitates accurate work at specific areas of a specimen. Due to the section counter, the user can program the instrument to produce a prese-lected number of sections automatically.
To guarantee the best cutting temperature for the tissue, the temperature of the specimen head and the cryochamber are separately controlled via two compressors. The temperature of the chamber can be set to –40°C, that of the specimen head to –50°C.
Register for Upcoming reSOLUTION IssuesWould you like to read future issues of reSOLUTION, too? The following link will take you straight to the registration form:
www.leica-microsystems.com/registration.01
Choose between different reSOLUTION editions and we would also be glad tohear your opinion of our magazine and any suggestions for topics.
You can find this issue and all past issues of reSOLUTION on our website at:
www.leica-microsystems.com/magazines.01
Fig.1: The Leica CM3050 S gives the user freedom to work com-fortably while sitting. All functional keys are easily accessible in any position. For users who prefer to work while standing, a highly flexible hydraulic cabinet height adjustment is available.
RESEARCH CUSTOMER MAGAZINE
EUROPEAN EDITION
March2 0 0 9No. 06
reSOLUTION
Research Newsletter – European Edition
reSOLUTIONSOLUTION
T E C H N O L O G Y
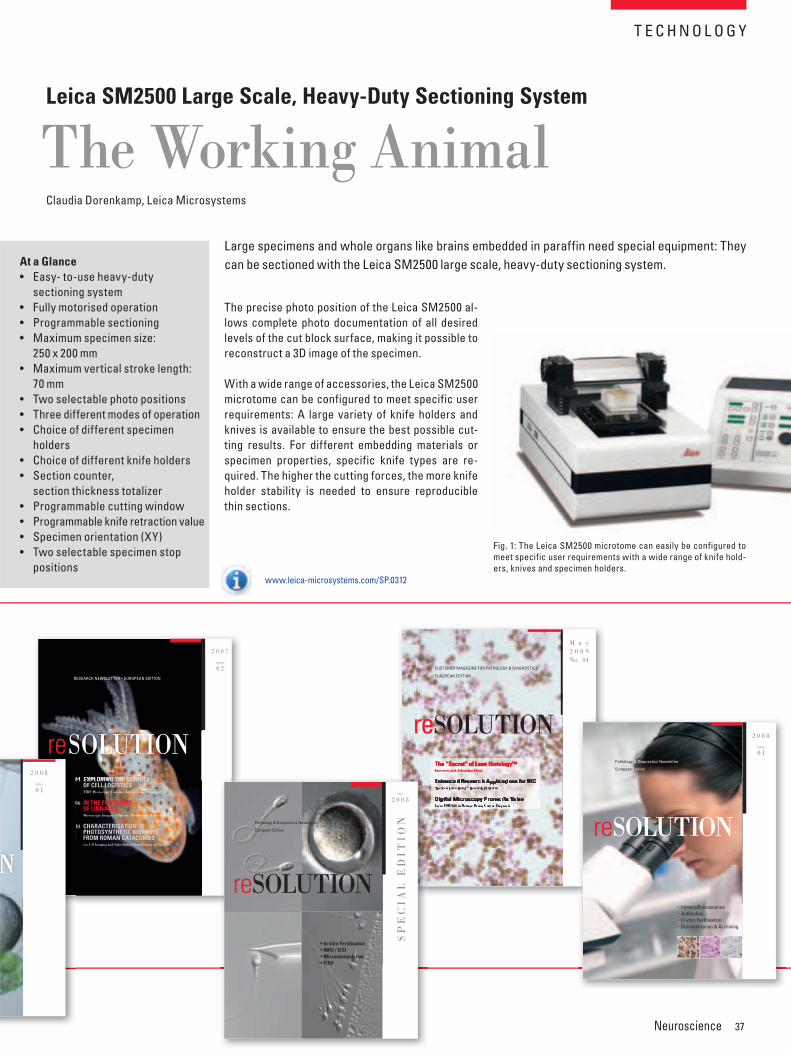
Neuroscience 37
CUSTOMER MAGAZINE FOR PATHOLOGY & DIAGNOSTICS
EUROPEAN EDITION
M a y2 0 0 9No. 04
reSOLUTION
EXPLORING THE SECRETS OF CELL LOGISTICS
IN THE FOOTSTEPS OF LINNAEUS
CHARACTERISATION OF PHOTOSYNTHETIC BIOFILMS FROM ROMAN CATACOMBS
Issue
RESEARCH NEWSLETTER – EUROPEAN EDITION
re
2 0 0 8Issue
0 1
NN
Large specimens and whole organs like brains embedded in paraffin need special equipment: They can be sectioned with the Leica SM2500 large scale, heavy-duty sectioning system.
Leica SM2500 Large Scale, Heavy-Duty Sectioning System
The Working AnimalClaudia Dorenkamp, Leica Microsystems
At a Glance• Easy- to-use heavy-duty
sectioning system• Fully motorised operation• Programmable sectioning• Maximum specimen size:
250 x 200 mm• Maximum vertical stroke length:
70 mm• Two selectable photo positions• Three different modes of operation• Choice of different specimen
holders• Choice of different knife holders• Section counter,
section thickness totalizer• Programmable cutting window• Programmable knife retraction value• Specimen orientation (XY)• Two selectable specimen stop
positions
The precise photo position of the Leica SM2500 al-lows complete photo documentation of all desired levels of the cut block surface, making it possible to reconstruct a 3D image of the specimen.
With a wide range of accessories, the Leica SM2500 microtome can be configured to meet specific user requirements: A large variety of knife holders and knives is available to ensure the best possible cut-ting results. For different embedding materials or specimen properties, specific knife types are re-quired. The higher the cutting forces, the more knife holder stability is needed to ensure reproducible thin sections.
Fig. 1: The Leica SM2500 microtome can easily be configured to meet specific user requirements with a wide range of knife hold-ers, knives and specimen holders.
www.leica-microsystems.com/SP.0312
2 0 0 8Issue
0 1Pathology & Diagnostics Newsletter
European Edition
Immunofluorescence Antibodies In vitro Fertilisation Documentation & Archiving
reSOLUTIONJune
2 0 0 8
Pathology & Diagnostics Newsletter
European Edition
reSOLUTION
SP
EC
IAL
ED
ITIO
N
• In vitro Fertilisation• IMSI / ICSI• Micromanipulation• FISH
T E C H N O L O G Y
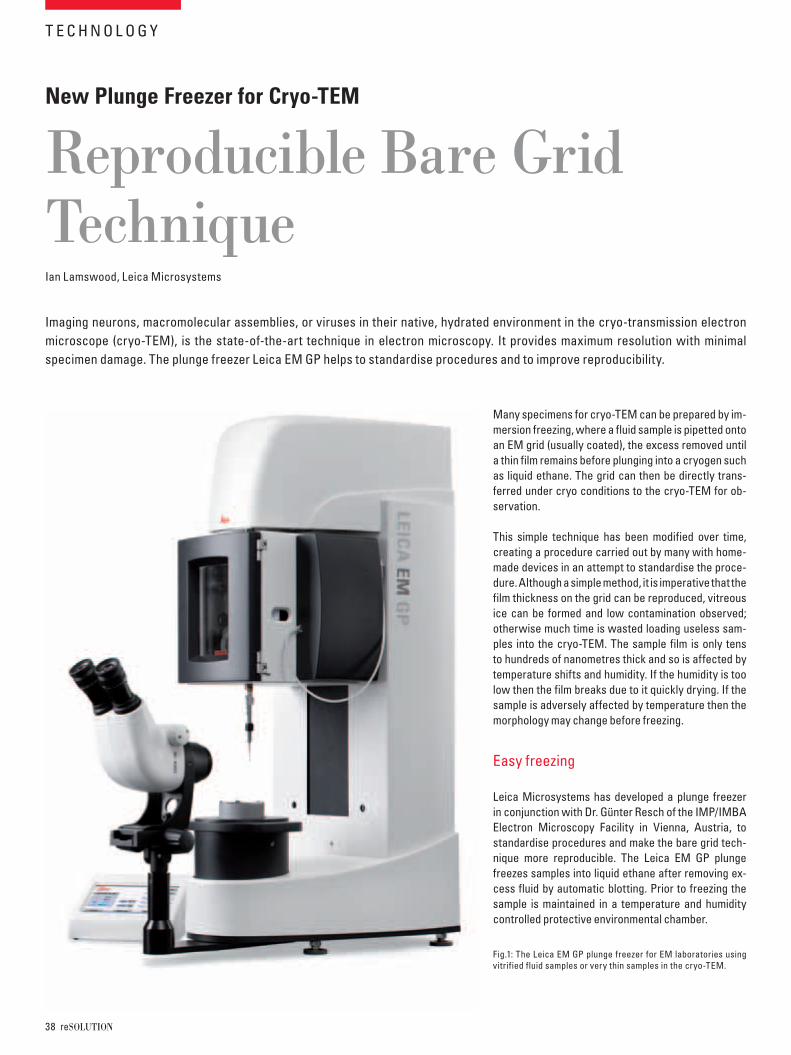
38 reSOLUTION
New Plunge Freezer for Cryo-TEM
Reproducible Bare Grid TechniqueIan Lamswood, Leica Microsystems
Imaging neurons, macromolecular assemblies, or viruses in their native, hydrated environment in the cryo-transmission electron microscope (cryo-TEM), is the state-of-the-art technique in electron microscopy. It provides maximum resolution with minimal specimen damage. The plunge freezer Leica EM GP helps to standardise procedures and to improve reproducibility.
Many specimens for cryo-TEM can be prepared by im-mersion freezing, where a fluid sample is pipetted onto an EM grid (usually coated), the excess removed until a thin film remains before plunging into a cryogen such as liquid ethane. The grid can then be directly trans-ferred under cryo conditions to the cryo-TEM for ob-servation.
This simple technique has been modified over time, creating a procedure carried out by many with home-made devices in an attempt to standardise the proce-dure. Although a simple method, it is imperative that the film thickness on the grid can be reproduced, vitreous ice can be formed and low contamination observed; otherwise much time is wasted loading useless sam-ples into the cryo-TEM. The sample film is only tens to hundreds of nanometres thick and so is affected by temperature shifts and humidity. If the humidity is too low then the film breaks due to it quickly drying. If the sample is adversely affected by temperature then the morphology may change before freezing.
Leica Microsystems has developed a plunge freezer in conjunction with Dr. Günter Resch of the IMP/IMBA Electron Microscopy Facility in Vienna, Austria, to standardise procedures and make the bare grid tech-nique more reproducible. The Leica EM GP plunge freezes samples into liquid ethane after removing ex-cess fluid by automatic blotting. Prior to freezing the sample is maintained in a temperature and humidity controlled protective environmental chamber.
Fig.1: The Leica EM GP plunge freezer for EM laboratories using vitrified fluid samples or very thin samples in the cryo-TEM.
T E C H N O L O G Y
Easy freezing
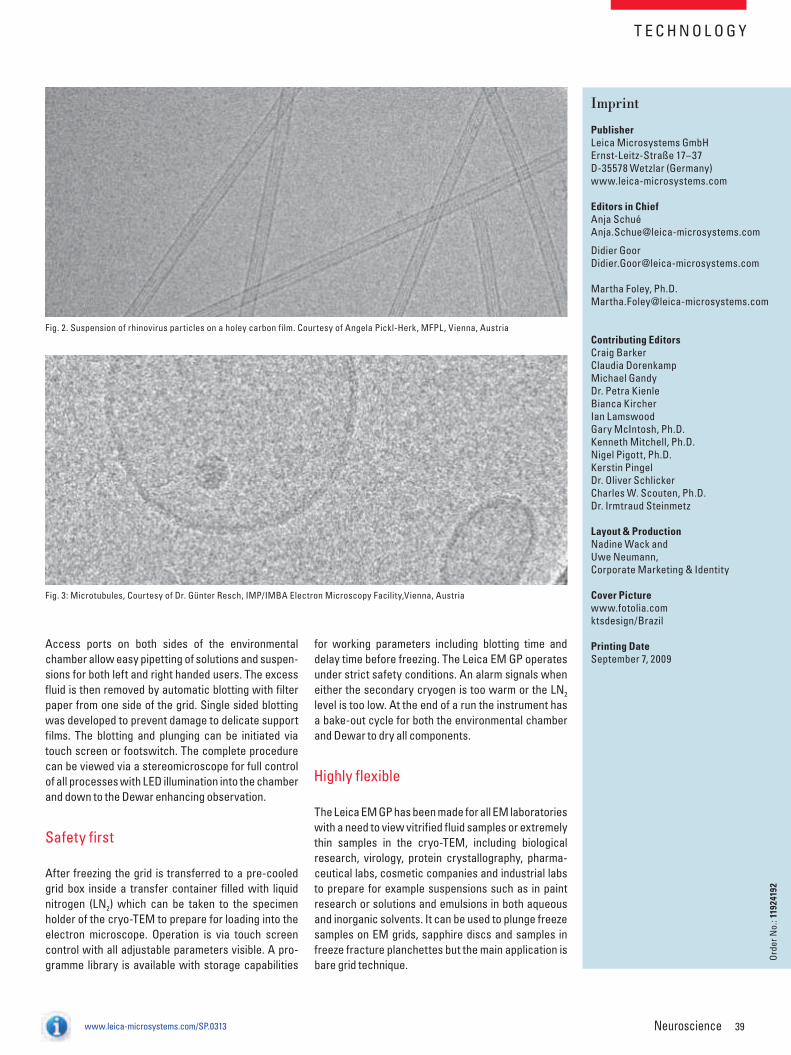
Neuroscience 39www.leica-microsystems.com/SP.0313
Imprint
Publisher Leica Microsystems GmbHErnst-Leitz-Straße 17–37D-35578 Wetzlar (Germany)www.leica-microsystems.com
Editors in ChiefAnja Schué[email protected]
Didier [email protected]
Martha Foley, [email protected]
Contributing EditorsCraig BarkerClaudia DorenkampMichael GandyDr. Petra KienleBianca KircherIan LamswoodGary McIntosh, Ph.D. Kenneth Mitchell, Ph.D.Nigel Pigott, Ph.D.Kerstin PingelDr. Oliver SchlickerCharles W. Scouten, Ph.D.Dr. Irmtraud Steinmetz
Layout & ProductionNadine Wack and Uwe Neumann, Corporate Marketing & Identity
Cover Picturewww.fotolia.comktsdesign/Brazil
Printing DateSeptember 7, 2009
Access ports on both sides of the environmental chamber allow easy pipetting of solutions and suspen-sions for both left and right handed users. The excess fluid is then removed by automatic blotting with filter paper from one side of the grid. Single sided blotting was developed to prevent damage to delicate support films. The blotting and plunging can be initiated via touch screen or footswitch. The complete procedure can be viewed via a stereomicroscope for full control of all processes with LED illumination into the chamber and down to the Dewar enhancing observation.
After freezing the grid is transferred to a pre-cooled grid box inside a transfer container filled with liquid nitrogen (LN2) which can be taken to the specimen holder of the cryo-TEM to prepare for loading into the electron microscope. Operation is via touch screen control with all adjustable parameters visible. A pro-gramme library is available with storage capabilities
for working parameters including blotting time and delay time before freezing. The Leica EM GP operates under strict safety conditions. An alarm signals when either the secondary cryogen is too warm or the LN2 level is too low. At the end of a run the instrument has a bake-out cycle for both the environmental chamber and Dewar to dry all components.
The Leica EM GP has been made for all EM laboratories with a need to view vitrified fluid samples or extremely thin samples in the cryo-TEM, including biological research, virology, protein crystallography, pharma-ceutical labs, cosmetic companies and industrial labs to prepare for example suspensions such as in paint research or solutions and emulsions in both aqueous and inorganic solvents. It can be used to plunge freeze samples on EM grids, sapphire discs and samples in freeze fracture planchettes but the main application is bare grid technique.
Fig. 2. Suspension of rhinovirus particles on a holey carbon film. Courtesy of Angela Pickl-Herk, MFPL, Vienna, Austria
Fig. 3: Microtubules, Courtesy of Dr. Günter Resch, IMP/IMBA Electron Microscopy Facility,Vienna, Austria
Ord
er N
o.: 1
1924
192
T E C H N O L O G Y
Safety first
Highly flexible

Professor Hell, what awaits us beyond the diffraction limit?Stefan Hell dared to think the unthinkable: nanometer resolution in the focal plane of alight microscope. Today this has become routine. Now it’s time to do the unthinkable again!For the discovery of new worlds in the nanostructures of life.
www.leica-microsystems.com
Pioneering Humanity is still forging ahead by refl ecting on its position from revolutionary perspectives. Leica Micro-systems has mapped its corporate values.For more information,visit our website.