Embed Size (px)
Citation preview
HULL CITY
COUNCIL CUSTOMER SEGMENTATION TOOLKIT
Business Intelligence Team Hull City Council

Introduction Customer segmentation is about recognising that not all people are the same. Hull is growing increasingly diverse. Our residents live in different neighbourhoods and communities; each with their own unique defining characteristics. People across the city not only look different from one another (e.g. age, ethnicity, housing, income etc) but they have differing attitudes and lifestyles. They use different types of services, have different needs and expectations from the local authority and prefer different communication channels and messaging styles. In a climate of reduced public funding, residents still have increasing expectations for high quality public services tailored to their individual needs. This means a blanket „one size‟ approach no longer fits all.
What is Segmentation?
Customer segmentation is simply the process of sub dividing our residents into distinct groups based on who they are (socio demographics), what they do (behaviours) and how they think and feel (attitudes). The aim is to identify and understand the differences between these groups; enabling us to create, tailor and target services more effectively; offering increased efficiency, better value for money and ultimately improved life outcomes.
The Hull Model This document introduces a bespoke customer segmentation model for Hull. Drawing on a range of national and local datasets, the Hull segmentation model links socio – demographic information with real local attitudinal and transactional data. It provides a detailed and accurate understanding of our resident‟s and their distribution around the city.
The model provides Hull City Council and its partners with a strategic management tool which can support and enhance public services in a range of ways. It can help us to:
Understand who uses public services, to what extent, and in what combinations – allowing us to manage and anticipate customer need both now and in the future
Allocate resources more efficiently by targeting services specifically at the people who either need or want them
Increase public satisfaction through improved service design - providing services based on an understanding of how customers prefer to access them
Create personalised marketing that increases service take up or which can nudge or trigger changes in behaviour
Realise greater value from research and consultation – identifying further differences and/or similarities in the behaviours and attitudes of different population sub groups
The benefits to our residents include:
More appropriate, efficient services
Increased access and awareness to services
Efficient and targeted communication which promotes the most relevant services, benefits and offerings targeted to the residents likely needs
A coordinated citywide „resident focused‟ approach that listens to, and responds to, the needs of the local population
Greater levels of satisfaction – residents have access to the services they want, in the ways and places that they want them
“Local authorities need in-depth knowledge of the characteristics and needs of their residents in order to provide relevant, focused and cost-effective services. Customer Segmentation provides this detailed understanding, supporting decision making and policy formulation at both a strategic and an operational level.” Experian
What Are The Benefits? Prioritising Resources In economically difficult times, segmentation provides the tools with which resources can be effectively targeted at those customers who want or need them the most. It can help us to make financial savings without affecting the quality of service received by the customer and helps us to prioritise services around customer demand - ensuring that every customer still has access to the services they require when they need them. Example: Where should we continue to provide expensive-to-run cash handling services? It is expensive to operate this service in every Customer Service Centre. Segmentation can help us to identify whether there are specific segments for which this is a crucial service, the potential for shifting them to other payment methods and ultimately the locations where we should and should not continue to offer this service. Intelligence Led Decision Making Effective decision making should be based on a thorough understanding of the residents and the communities those decisions will affect, both now and in the future. Segmentation provides this intelligence - helping to support decision making and the development of strategic and operational policy. Example: How do we decide when our libraries should open? Segmentation can help us to understand not just who is using each library, but also something about their likely lifestyle. It might be better, for example, closing a poorly used library in an area of high economic activity during the day but opening it for a couple of hours in an evening instead when people are home from work. Income Generation Segmentation provides us with a rich picture of our resident‟s financial characteristics including their propensity and ability to pay. The segments can therefore help us to identify opportunities and develop strategies to increase recoveries, improve payments or generate additional revenues.
Communication and Marketing By understanding our residents and their channel and messaging preferences we can create personalised communication and marketing that increases service take up or can nudge or trigger changes in behaviour. Example: How do we increase audiences at our theatres? Segmentation allows us to identify which groups have the highest propensity to visit our theatres and also the types of show each group prefers to see. This can help us to create popular and accessible programming and should inform pricing policy e.g. cheap family tickets aimed at low income families, gold membership aimed at highly engaged affluent couples etc. Targeted marketing strategies, taking into consideration preferred communication channels and highlighting relevant shows or special offers, should then be created around each segment to increase engagement. Citywide Resident Focused Approach There is an increasing trend across the public sector towards resident focused services. To achieve this, Hull City Council and its partners need to be supported by a wealth of information about the city‟s residents. The segmentation can help develop strategies for transformational service delivery by providing a detailed but accessible understanding of how residents want to access services and engage with us. Example: How do we help people who are struggling financially? Information from the People‟s Panel allowed us to identify those groups which include a high number of people who are in debt and/or struggling financially. The segmentation showed that these groups prefer to access financial support themselves rather than have to come into council offices or Hull Advice. Whilst home broadband is low in these groups, making a shift to online services difficult, many are high mobile phone users. Hull People‟s Premium was therefore developed as a text message service aimed at these groups – offering money saving ideas and details on products to help make money go further or reduce household expenditure. Currently over 2,000 residents have signed up for the service.
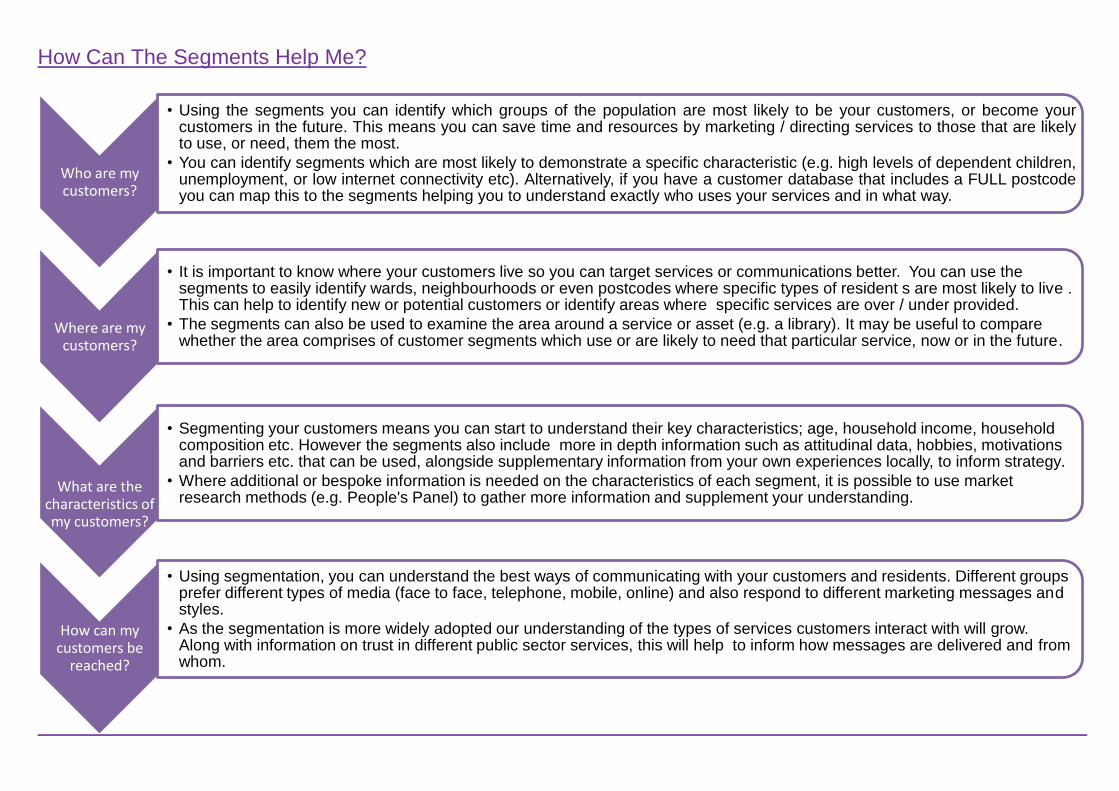
How Can The Segments Help Me?
Who are my customers?
• Using the segments you can identify which groups of the population are most likely to be your customers, or become yourcustomers in the future. This means you can save time and resources by marketing / directing services to those that are likelyto use, or need, them the most.
• You can identify segments which are most likely to demonstrate a specific characteristic (e.g. high levels of dependent children,unemployment, or low internet connectivity etc). Alternatively, if you have a customer database that includes a FULL postcodeyou can map this to the segments helping you to understand exactly who uses your services and in what way.
Where are my customers?
• It is important to know where your customers live so you can target services or communications better. You can use the segments to easily identify wards, neighbourhoods or even postcodes where specific types of resident s are most likely to live .This can help to identify new or potential customers or identify areas where specific services are over / under provided.
• The segments can also be used to examine the area around a service or asset (e.g. a library). It may be useful to compare whether the area comprises of customer segments which use or are likely to need that particular service, now or in the future.
What are the characteristics of my customers?
• Segmenting your customers means you can start to understand their key characteristics; age, household income, household composition etc. However the segments also include more in depth information such as attitudinal data, hobbies, motivations and barriers etc. that can be used, alongside supplementary information from your own experiences locally, to inform strategy.
• Where additional or bespoke information is needed on the characteristics of each segment, it is possible to use market research methods (e.g. People's Panel) to gather more information and supplement your understanding.
How can my customers be
reached?
• Using segmentation, you can understand the best ways of communicating with your customers and residents. Different groups prefer different types of media (face to face, telephone, mobile, online) and also respond to different marketing messages and styles.
• As the segmentation is more widely adopted our understanding of the types of services customers interact with will grow. Along with information on trust in different public sector services, this will help to inform how messages are delivered and from whom.
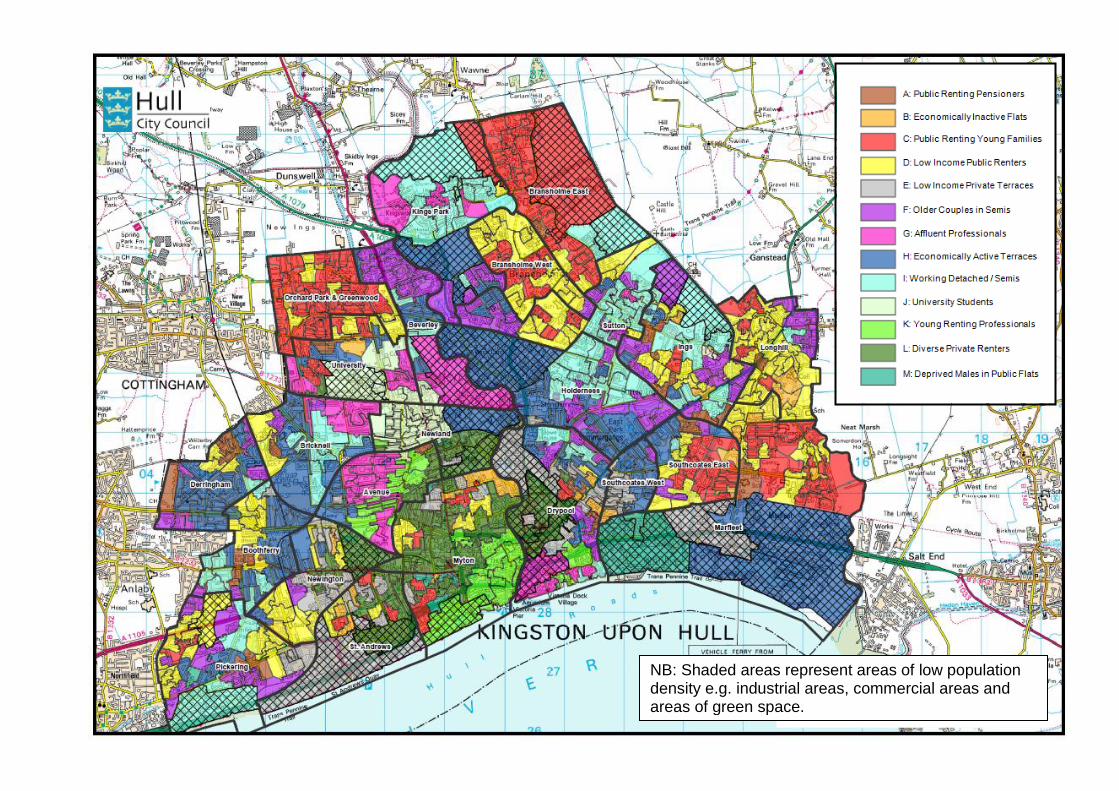
NB: Shaded areas represent areas of low population density e.g. industrial areas, commercial areas and areas of green space.

The Segments Key to Neighbourhood Priorities:
Group A: Pensioners in small public rented flats
3% of Hull Households
This group is defined by the above average proportion of single pensioners (aged 65+) living in social sheltered or specially adapted accommodation.
Health is a particular issue for this group - an above average proportion reports their health as bad and / or experience a limiting long term illness or disability for which regular care or support is required. They are often excluded from many activities due to health, access and resource barriers.
Digital shy – this group has very low levels of digital engagement and struggles with a large number of choices. Word of mouth is an important tool. Talking directly to them or getting people which they know and trust to talk to them is an effective strategy.
Group B: Economically inactive singles in public rented flats
3% of Hull Households
Containing an above average proportion of older (45+) single people living in social rented, purpose built flats.
Unemployment is high; including long term unemployment and those who have never worked. Health is also an issue with a high proportion of people in poor health and a high Standardised Illness Ratio. As a result there is a high dependency on out of work benefits including JSA and ESA/Incapacity.
This is a group of people who are defined by their high levels of dependency. There is little family/community structures to provide a sense of social cohesion.
Access to Council Services Health & Wellbeing
Active Community Activities for Adults & Older People
Activities for Teenagers
Activities for Young Children
Housing
Parking
Clean Streets
Education Green & Planted Areas
Traffic & Congestion Crime & ASB
Parks & Open Spaces
Public Transport Shops & Amenities
Sports & Leisure
Roads & Pavements Art & Culture Significant Priority
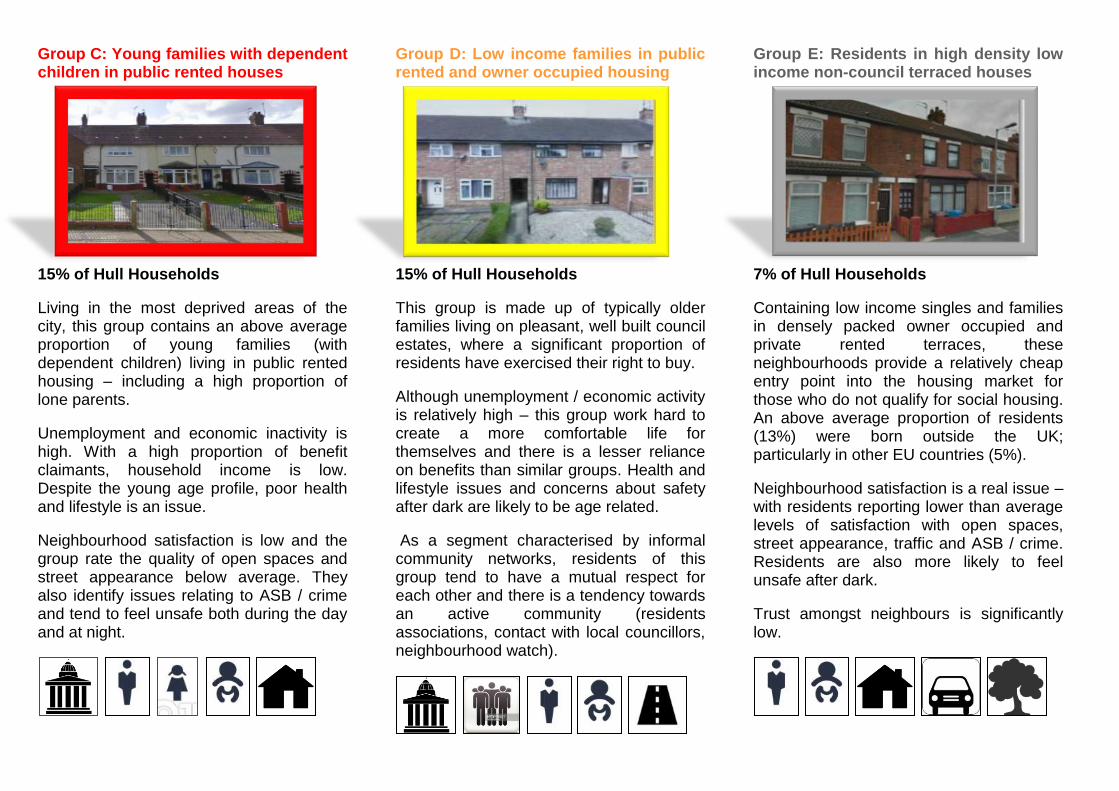
Group C: Young families with dependent children in public rented houses
15% of Hull Households
Living in the most deprived areas of the city, this group contains an above average proportion of young families (with dependent children) living in public rented housing – including a high proportion of lone parents.
Unemployment and economic inactivity is high. With a high proportion of benefit claimants, household income is low. Despite the young age profile, poor health and lifestyle is an issue.
Neighbourhood satisfaction is low and the group rate the quality of open spaces and street appearance below average. They also identify issues relating to ASB / crime and tend to feel unsafe both during the day and at night.
Group D: Low income families in public rented and owner occupied housing
15% of Hull Households
This group is made up of typically older families living on pleasant, well built council estates, where a significant proportion of residents have exercised their right to buy.
Although unemployment / economic activity is relatively high – this group work hard to create a more comfortable life for themselves and there is a lesser reliance on benefits than similar groups. Health and lifestyle issues and concerns about safety after dark are likely to be age related.
As a segment characterised by informal community networks, residents of this group tend to have a mutual respect for each other and there is a tendency towards an active community (residents associations, contact with local councillors, neighbourhood watch).
Group E: Residents in high density low income non-council terraced houses
7% of Hull Households
Containing low income singles and families in densely packed owner occupied and private rented terraces, these neighbourhoods provide a relatively cheap entry point into the housing market for those who do not qualify for social housing. An above average proportion of residents (13%) were born outside the UK; particularly in other EU countries (5%).
Neighbourhood satisfaction is a real issue – with residents reporting lower than average levels of satisfaction with open spaces, street appearance, traffic and ASB / crime. Residents are also more likely to feel unsafe after dark.
Trust amongst neighbours is significantly low.
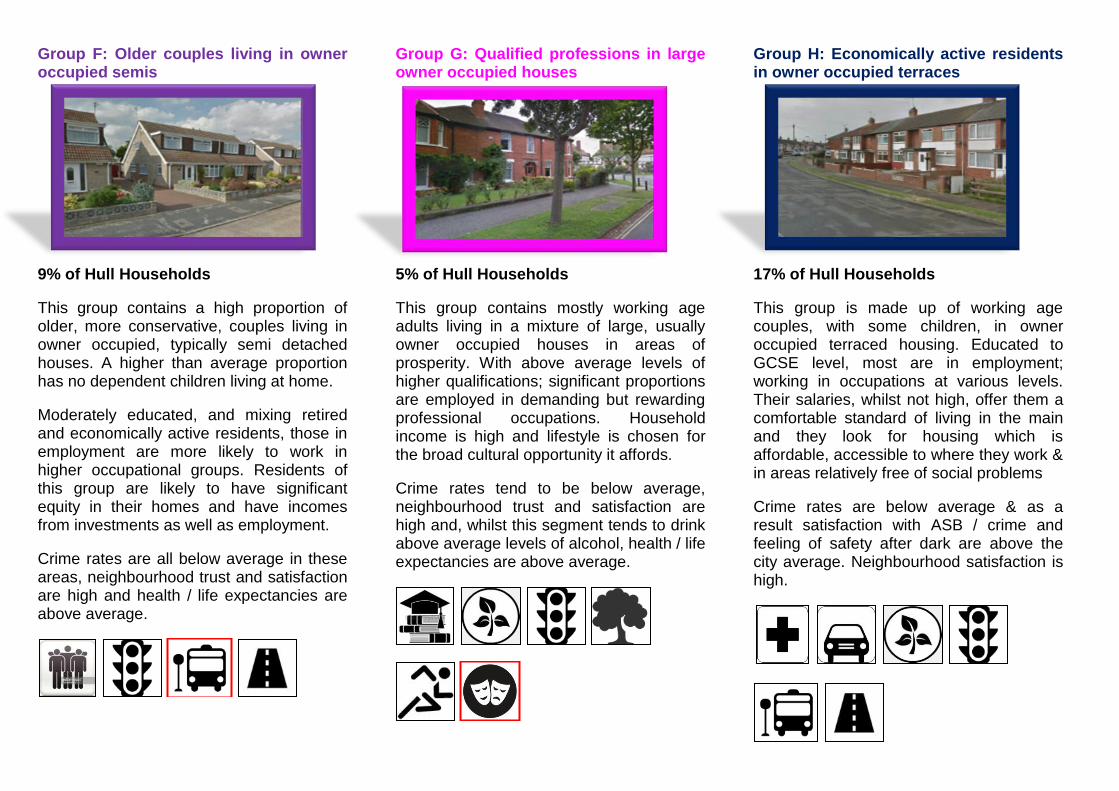
Group F: Older couples living in owner occupied semis
9% of Hull Households
This group contains a high proportion of older, more conservative, couples living in owner occupied, typically semi detached houses. A higher than average proportion has no dependent children living at home.
Moderately educated, and mixing retired and economically active residents, those in employment are more likely to work in higher occupational groups. Residents of this group are likely to have significant equity in their homes and have incomes from investments as well as employment.
Crime rates are all below average in these areas, neighbourhood trust and satisfaction are high and health / life expectancies are above average.
Group G: Qualified professions in large owner occupied houses
5% of Hull Households
This group contains mostly working age adults living in a mixture of large, usually owner occupied houses in areas of prosperity. With above average levels of higher qualifications; significant proportions are employed in demanding but rewarding professional occupations. Household income is high and lifestyle is chosen for the broad cultural opportunity it affords.
Crime rates tend to be below average, neighbourhood trust and satisfaction are high and, whilst this segment tends to drink above average levels of alcohol, health / life expectancies are above average.
Group H: Economically active residents in owner occupied terraces
17% of Hull Households
This group is made up of working age couples, with some children, in owner occupied terraced housing. Educated to GCSE level, most are in employment; working in occupations at various levels. Their salaries, whilst not high, offer them a comfortable standard of living in the main and they look for housing which is affordable, accessible to where they work & in areas relatively free of social problems
Crime rates are below average & as a result satisfaction with ASB / crime and feeling of safety after dark are above the city average. Neighbourhood satisfaction is high.

Group I: Economically active residents in owner occupied detached and semis
9% of Hull Households
Typically working age couples with children, this group live in owner occupied detached and semi detached housing in „desirable‟ family neighbourhoods.
An above average number are educated to A Level and higher and many work as managers. Household income is therefore high.
Crime rates are low and there are high levels of neighbourhood satisfaction – residents view these areas as attractive, safe places to live. The group are healthy – with high life expectancies and positive lifestyle behaviours.
Group J: University students in rented accommodation
4% of Hull Households
This group consists largely of young adults living in private rented terraces and flats whilst studying towards a degree at the university. Living alone, or in wholly student households, those who work are typically employed in the hospitality industry or in customer service. A higher than average proportion of residents (31%) was born outside the UK.
General health tends to be good – diet and drinking being the exception. Whilst incidents of crime / ASB are generally low there is a significantly high rate of dwelling burglaries in this area. Neighbourhood satisfaction is a real issue – residents identify problems with street appearance, quality of open spaces, traffic, parking and trust / social capital between neighbours.
Group K: Educated young professionals in private rented flats
4% of Hull Households
This group is made up of young, active, social and ambitious single people living in private rented flats. A high proportion (31%) was born outside the UK. Highly educated and employed in professional roles, they are often recent graduates and in the early/mid stages of their career.
General health and lifestyle is good – although as a young, affluent group they are much more likely than average to drink large amounts of alcohol. Crime rates are affected by the proximity of this group to both the city centre and Princes Avenue – with a high number of ASB and violence offences reported in these areas.
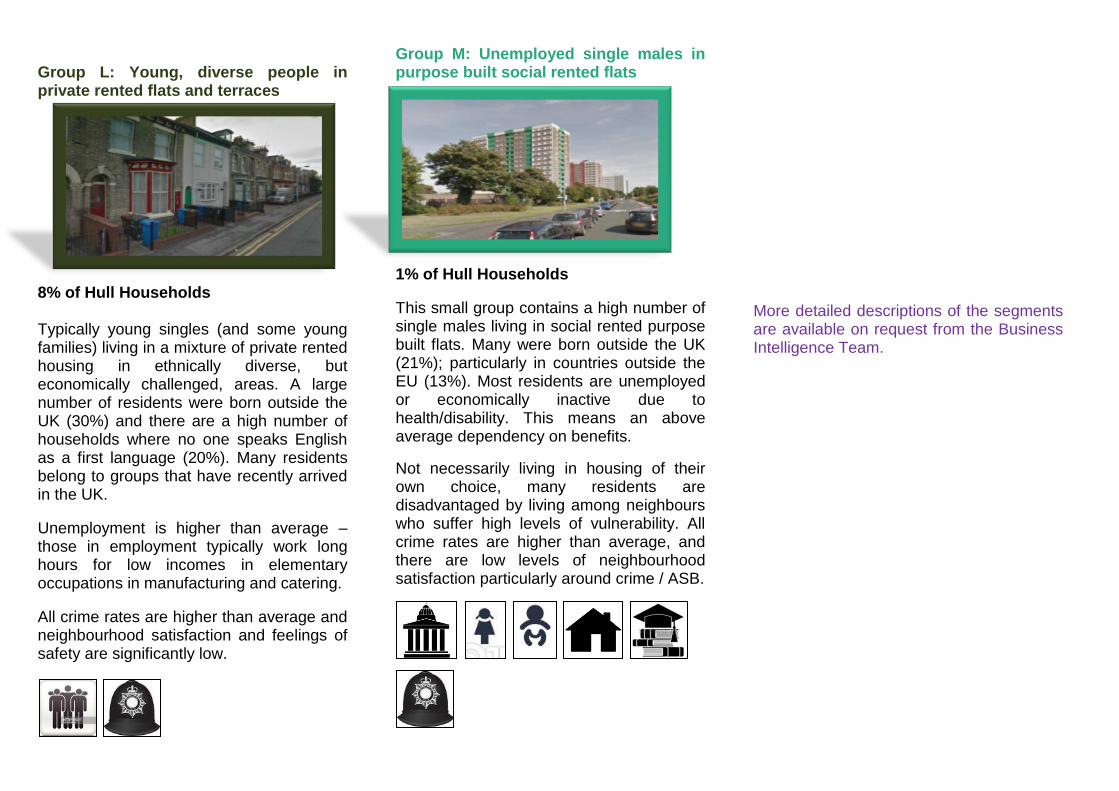
Group L: Young, diverse people in private rented flats and terraces
8% of Hull Households Typically young singles (and some young families) living in a mixture of private rented housing in ethnically diverse, but economically challenged, areas. A large number of residents were born outside the UK (30%) and there are a high number of households where no one speaks English as a first language (20%). Many residents belong to groups that have recently arrived in the UK.
Unemployment is higher than average – those in employment typically work long hours for low incomes in elementary occupations in manufacturing and catering.
All crime rates are higher than average and neighbourhood satisfaction and feelings of safety are significantly low.
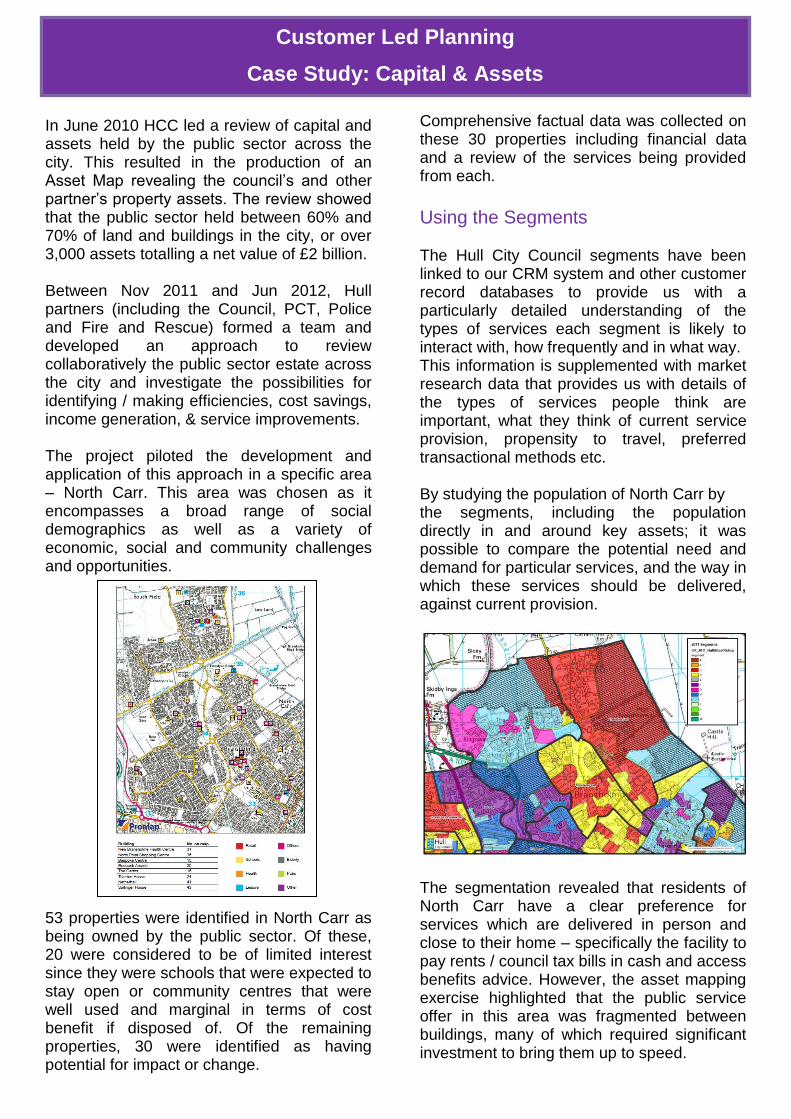
Group M: Unemployed single males in purpose built social rented flats 1% of Hull Households
This small group contains a high number of single males living in social rented purpose built flats. Many were born outside the UK (21%); particularly in countries outside the EU (13%). Most residents are unemployed or economically inactive due to health/disability. This means an above average dependency on benefits.
Not necessarily living in housing of their own choice, many residents are disadvantaged by living among neighbours who suffer high levels of vulnerability. All crime rates are higher than average, and there are low levels of neighbourhood satisfaction particularly around crime / ASB.
More detailed descriptions of the segments are available on request from the Business Intelligence Team.
Customer Led Planning
Case Study: Capital & Assets
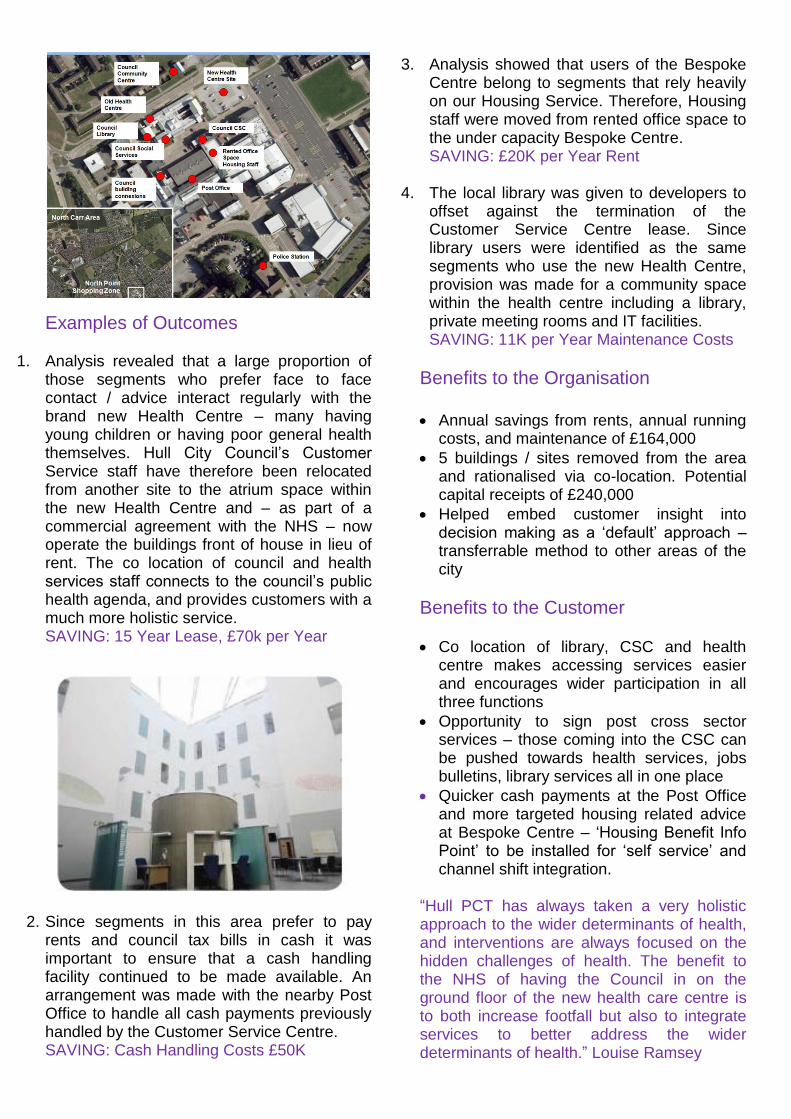
In June 2010 HCC led a review of capital and assets held by the public sector across the city. This resulted in the production of an Asset Map revealing the council‟s and other partner‟s property assets. The review showed that the public sector held between 60% and 70% of land and buildings in the city, or over 3,000 assets totalling a net value of £2 billion. Between Nov 2011 and Jun 2012, Hull partners (including the Council, PCT, Police and Fire and Rescue) formed a team and developed an approach to review collaboratively the public sector estate across the city and investigate the possibilities for identifying / making efficiencies, cost savings, income generation, & service improvements. The project piloted the development and application of this approach in a specific area – North Carr. This area was chosen as it encompasses a broad range of social demographics as well as a variety of economic, social and community challenges and opportunities.
53 properties were identified in North Carr as being owned by the public sector. Of these, 20 were considered to be of limited interest since they were schools that were expected to stay open or community centres that were well used and marginal in terms of cost benefit if disposed of. Of the remaining properties, 30 were identified as having potential for impact or change.
Comprehensive factual data was collected on these 30 properties including financial data and a review of the services being provided from each.
Using the Segments The Hull City Council segments have been linked to our CRM system and other customer record databases to provide us with a particularly detailed understanding of the types of services each segment is likely to interact with, how frequently and in what way. This information is supplemented with market research data that provides us with details of the types of services people think are important, what they think of current service provision, propensity to travel, preferred transactional methods etc. By studying the population of North Carr by the segments, including the population directly in and around key assets; it was possible to compare the potential need and demand for particular services, and the way in which these services should be delivered, against current provision.
The segmentation revealed that residents of North Carr have a clear preference for services which are delivered in person and close to their home – specifically the facility to pay rents / council tax bills in cash and access benefits advice. However, the asset mapping exercise highlighted that the public service offer in this area was fragmented between buildings, many of which required significant investment to bring them up to speed.
Examples of Outcomes
1. Analysis revealed that a large proportion of those segments who prefer face to face contact / advice interact regularly with the brand new Health Centre – many having young children or having poor general health themselves. Hull City Council‟s Customer Service staff have therefore been relocated from another site to the atrium space within the new Health Centre and – as part of a commercial agreement with the NHS – now operate the buildings front of house in lieu of rent. The co location of council and health services staff connects to the council‟s public health agenda, and provides customers with a much more holistic service. SAVING: 15 Year Lease, £70k per Year
2. Since segments in this area prefer to pay rents and council tax bills in cash it was important to ensure that a cash handling facility continued to be made available. An arrangement was made with the nearby Post Office to handle all cash payments previously handled by the Customer Service Centre. SAVING: Cash Handling Costs £50K
3. Analysis showed that users of the Bespoke Centre belong to segments that rely heavily on our Housing Service. Therefore, Housing staff were moved from rented office space to the under capacity Bespoke Centre. SAVING: £20K per Year Rent
4. The local library was given to developers to offset against the termination of the Customer Service Centre lease. Since library users were identified as the same segments who use the new Health Centre, provision was made for a community space within the health centre including a library, private meeting rooms and IT facilities. SAVING: 11K per Year Maintenance Costs
Benefits to the Organisation Annual savings from rents, annual running
costs, and maintenance of £164,000
5 buildings / sites removed from the area and rationalised via co-location. Potential capital receipts of £240,000
Helped embed customer insight into decision making as a „default‟ approach – transferrable method to other areas of the city
Benefits to the Customer
Co location of library, CSC and health centre makes accessing services easier and encourages wider participation in all three functions
Opportunity to sign post cross sector services – those coming into the CSC can be pushed towards health services, jobs bulletins, library services all in one place
Quicker cash payments at the Post Office and more targeted housing related advice at Bespoke Centre – „Housing Benefit Info Point‟ to be installed for „self service‟ and channel shift integration.
“Hull PCT has always taken a very holistic approach to the wider determinants of health, and interventions are always focused on the hidden challenges of health. The benefit to the NHS of having the Council in on the ground floor of the new health care centre is to both increase footfall but also to integrate services to better address the wider determinants of health.” Louise Ramsey
Strategy Development & Intervention
Case Study: Active Hull
Active Hull is Hull‟s strategy for sport and physical activity. It provides a common vision for everyone involved in the delivery of sport and physical activity in Hull and provides the framework to drive and support a coordinated and targeted approach to increasing opportunities and participation across the city. A Tailored Approach Using the segments it is evident that in participation terms, there are wide variations between different groups of people. Therefore we cannot expect to use a „one size fits all‟ approach to targeting and encouraging more people to increase their levels of participation. The segmentation tool provides those working in community sport an insight into the sporting behaviours and the barriers and motivations to taking part amongst our participants and those we wish to engage in a more active lifestyle.
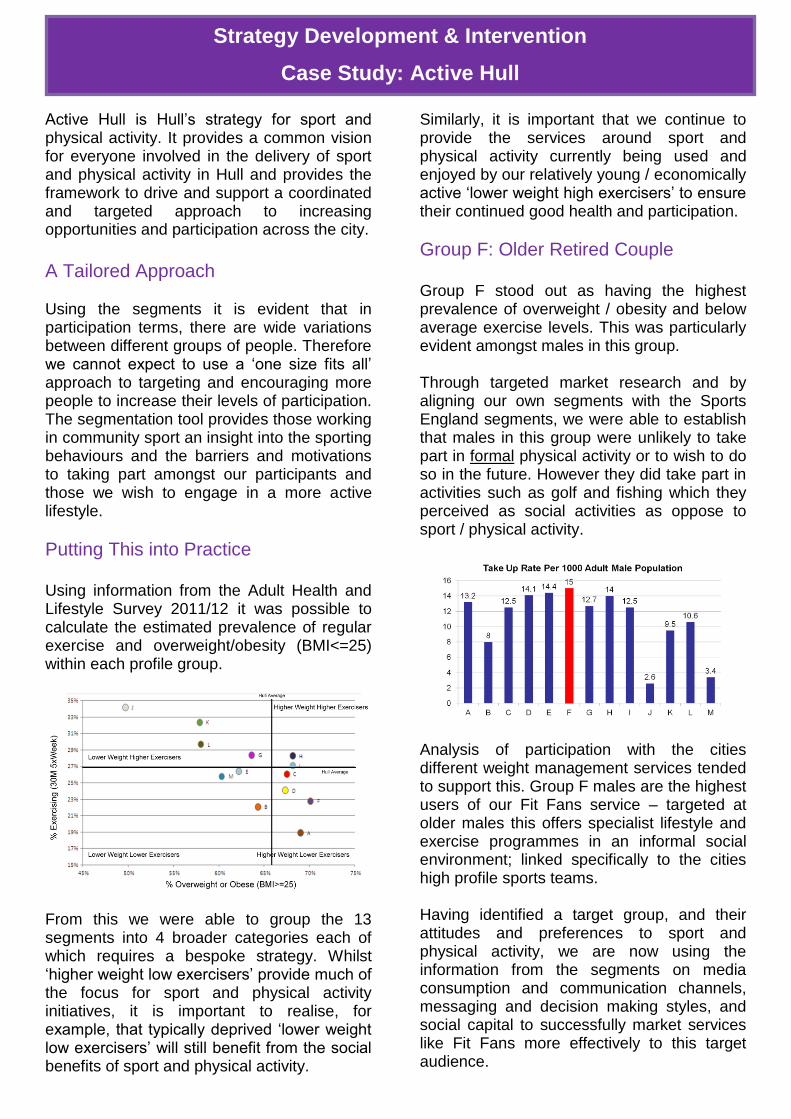
Putting This into Practice Using information from the Adult Health and Lifestyle Survey 2011/12 it was possible to calculate the estimated prevalence of regular exercise and overweight/obesity (BMI<=25) within each profile group.
From this we were able to group the 13 segments into 4 broader categories each of which requires a bespoke strategy. Whilst „higher weight low exercisers‟ provide much of the focus for sport and physical activity initiatives, it is important to realise, for example, that typically deprived „lower weight low exercisers‟ will still benefit from the social benefits of sport and physical activity.
Similarly, it is important that we continue to provide the services around sport and physical activity currently being used and enjoyed by our relatively young / economically active „lower weight high exercisers‟ to ensure their continued good health and participation.
Group F: Older Retired Couple Group F stood out as having the highest prevalence of overweight / obesity and below average exercise levels. This was particularly evident amongst males in this group. Through targeted market research and by aligning our own segments with the Sports England segments, we were able to establish that males in this group were unlikely to take part in formal physical activity or to wish to do so in the future. However they did take part in activities such as golf and fishing which they perceived as social activities as oppose to sport / physical activity. Analysis of participation with the cities different weight management services tended to support this. Group F males are the highest users of our Fit Fans service – targeted at older males this offers specialist lifestyle and exercise programmes in an informal social environment; linked specifically to the cities high profile sports teams. Having identified a target group, and their attitudes and preferences to sport and physical activity, we are now using the information from the segments on media consumption and communication channels, messaging and decision making styles, and social capital to successfully market services like Fit Fans more effectively to this target audience.
Service Review & Improvement
Case Study: Adult Education
Hull Training and Adult Education offers its services to over 8,000 learners and businesses every year, in over 100 different local and community venues. It provides a huge range of courses including Apprenticeships, Study Programmes, part time adult courses, and professional training for individuals and employers.
Curriculum Planning & Marketing We have developed a Curriculum Planning and Marketing Toolkit for managers and staff; designed to help them to understand the makeup of residents in each segment and the unique learner profiles within each Area of Learning. It outlines how to use this information to plan a curriculum for „hard to reach‟ learners and to create a bespoke marketing campaign This toolkit was created by:
Segmenting the learner database - allowing us to understand the differing levels of participation amongst the segments, to identify themes in curriculum interest within segments, and to identify which groups travel to learning, pay for learning etc.
Asking questions in the People‟s Panel to understand resident‟s views towards learning; their barriers and motivations to learning, their likelihood to participate in learning in the future and their learning areas of interest.
Combining with information on preferred contact methods and messaging styles and propensity to use other services and venues.
The toolkit was piloted with three „Area of Learning‟ Teams. Service management worked with these teams to introduce the project and ensure that staff understood the benefits and embraced the customer segmentation data approach. They attended team meetings to explain the data and provide staff with simple mechanisms for using the information to inform curriculum development and marketing strategies. Staff started to use their data to develop their offer based on an understanding of learner preferences and potential barriers.
The toolkit is now available to all staff members and the Service uses team meetings to support staff to understand and put the approach into practice.
New Curriculum for Difficult Times
The segmentation and toolkit was crucial in Hull successfully becoming one of six projects commissioned by NIACE as part of their “New Curriculum for Difficult Times” project. The segments and toolkit were used to help design a curriculum to meet the needs of the people living in North Bransholme, the area of the city with the lowest level of engagement in community learning. The project was a success – with increased first time participation amongst „hard to reach‟ groups – and was used as a NIACE case study.
What Difference Has It Made?
Learners: Previously „hard to reach learners‟ now have increased access to information on the courses they might like / find useful via their preferred communication methods. By using trusted intermediaries, they are more likely to communicate their needs and discuss their interests / barriers to learning.
Managers and Staff: Managers and staff are equipped to work with different segments, understanding the likes / dislikes of each, their barriers to learning and the best way to engage with them. This makes planning easier and more focussed.
The Organisation: The service is able to target groups more effectively and with less resource e.g. they no longer routinely use expensive marketing techniques, such as blanket leaflet distribution.
“Hull‟s segmentation generates insights to
inform the marketing, planning and delivery of
learning. It provides detailed information
about the learning preferences and
aspirations of non-learners, supplementing
extant MIS data on those already in learning,
and can facilitate and map join-up with other
council services. The dialogue with
communities this enables is potentially
transformational.” Simon Beer
Programme Design, Delivery and Evaluation
Case Study: Culture Profiles
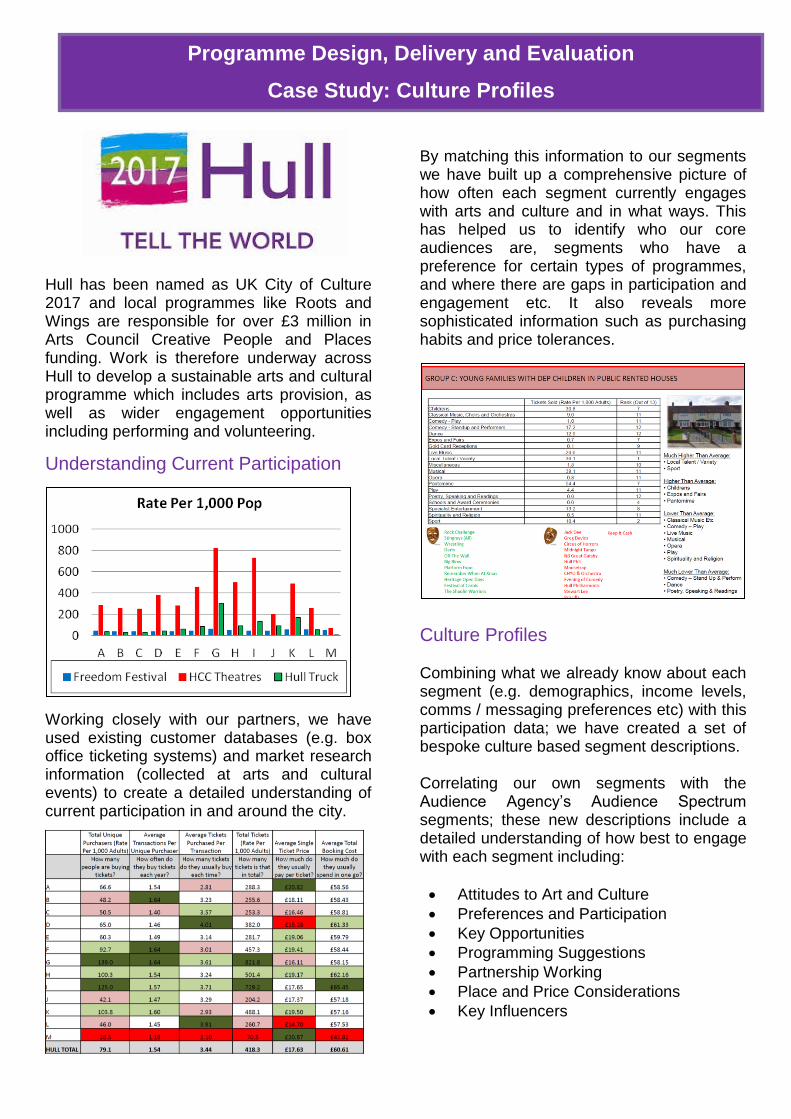
Hull has been named as UK City of Culture 2017 and local programmes like Roots and Wings are responsible for over £3 million in Arts Council Creative People and Places funding. Work is therefore underway across Hull to develop a sustainable arts and cultural programme which includes arts provision, as well as wider engagement opportunities including performing and volunteering.
Understanding Current Participation
Working closely with our partners, we have used existing customer databases (e.g. box office ticketing systems) and market research information (collected at arts and cultural events) to create a detailed understanding of current participation in and around the city.
By matching this information to our segments we have built up a comprehensive picture of how often each segment currently engages with arts and culture and in what ways. This has helped us to identify who our core audiences are, segments who have a preference for certain types of programmes, and where there are gaps in participation and engagement etc. It also reveals more sophisticated information such as purchasing habits and price tolerances.
Culture Profiles Combining what we already know about each segment (e.g. demographics, income levels, comms / messaging preferences etc) with this participation data; we have created a set of bespoke culture based segment descriptions. Correlating our own segments with the Audience Agency‟s Audience Spectrum segments; these new descriptions include a detailed understanding of how best to engage with each segment including:
Attitudes to Art and Culture
Preferences and Participation
Key Opportunities
Programming Suggestions
Partnership Working
Place and Price Considerations
Key Influencers

Audience & Programme Development The Culture Profiles can now be used by artists and organisers to:
Understand what makes audiences tick in Hull
Find the best fit audiences in their database
Find new audiences in a specific area
Pinpoint more audiences like their current ones to extend reach
Know how to appeal to a more diverse range of audiences
Spot opportunities to collaborate with neighbouring or partner organisations
Improve access by understanding different barriers for different audiences
Plan to create experiences for different kinds of audiences
Create and target their communications more effectively
Make a case to their stakeholders
Evaluation We are working with our partners to create a standardised evaluation template, which includes collecting full postcode. This will allow us to monitor changes in participation, particularly amongst target segments (e.g. those with lowest arts engagement), changes in awareness and attitudes, and the economic impact of events etc
“Segmentation provides insight into why and how different kinds of people engage with the arts. It can help any organisation working to increase arts engagement to identify target segments and develop tailored engagement strategies and marketing campaigns” Arts Council
How is The Tool Built? The Hull segments were created using a three step process: 1. Selecting the classification variables 2. The clustering process 3. Analysis of further „descriptive‟ data
sources to sense check the segments and provide further understanding
Geographical Base The Hull City Council Customer Segmentation Tool segments the population at Output Area (OA) level. Output Area‟s are built from adjacent unit postcodes and fit within administrative boundaries such as wards. They are the smallest statistical geography. There are 853 Output Area‟s in Hull - typically containing about 300 residents or 135 households. Classification Variables All of the information used to create the segmentation framework was taken from the 2011 Census – the only data source that provides unmodelled information about the entire resident population at Output Area level. The 300 + variables provided by the Census were classified into domains:
Demographics
Ethnicity and Religion
Household Composition
Housing
Socio – Economic
Employment
Health
National Identity A number of sophisticated statistical techniques (correlation and exploratory factor analysis) were then used to reduce this to a subset of 52 key variables – specially selected to represent the eight domains above and the population of Hull as a whole.
The Clustering Process K-Means Clustering was then used to assign cases (i.e. census output areas) into groups (called clusters) so that the cases within each cluster are more similar to each other than to those in other clusters. Finding the final 13 segments was an iterative process that involved exploring a large number of potential solution numbers – examining the data and looking for patterns. Additional Data Sources The final stage involved expanding the „narrative‟ of each segment by analysing additional data sources. Any up to date postcoded information can be attached to the segments allowing us to use internal data sources and research data to enhance our understanding of the city and its residents. Data which has been added to the segment descriptions includes:
People‟s Panel Data o Comms Channels o Importance of Services o Neighbourhood Priorities
KC Broadband Penetration
CRM Records
Health and Lifestyle Survey Data
Public Health Sciences Data
DWP Benefit Claimant Data
Experian Household Income Data
Community Safety Partnership Data
Adult Ed Enrolment
Library Membership
Recycling Rates
Hull Box Office Purchases
Cultural Participation These and other data sources are added / updated on a regular basis to ensure the segments provide an up to date understanding of our residents and their demand for services. Work has also been undertaken to align Hull City Council segments with other segmentation models (e.g. Arts Council, Sports England etc) to share understanding.
Frequently Asked Questions
Why do we have a bespoke model? Commercial segmentation models (e.g. Mosaic) are available. However, these segmentation models are typically created by benchmarking Hull against national averages. As a result much of Hull usually ends up categorised as predominantly white, deprived segments. Whilst compared to national statistics, Hull is unarguably white and deprived, we know there to be great range of diversity across the city – particularly at a fine geographical level such as Output Area level. A bespoke model, using only Hull data as the basis for segmentation, allows us to identify areas of differing ethnic diversity, areas of differing affluence or areas of differing economic activity etc in greater detail. The end result is a product that feels like a „better fit‟ than commercially available products and is more relatable to its users.
Is this safe and legal? The segmentation does not allow any individual to be identified from the data we work with.
Isn‟t this just stereotyping? Whilst this approach does generalise areas (not individuals) into categories, it is important to remember that the segment names & key characteristics are based upon the concept of „ideal types‟ - they are never intended to fully represent the variation observed within each segment. Ultimately, categorising communities using a bespoke customer segmentation model should be seen as no different from generally accepted segmentation techniques such as; Indices of Deprivation, age-sex standardisation, analyses by ethnicity, means-testing, or simply comparisons by local authority.
Doesn‟t this reinforce prejudices? The segmentation approach enables the identification of „high risk‟ groups. Such a segmentation model may correlate with, say, minority ethnic communities. However, this approach is not intended to be used to discriminate positively or negatively. Rather it highlights those population segments for which different services might be most appropriate, it may help in developing priorities for different areas, or it may illustrate current practices that are inadvertently prejudicing or disadvantaging different population segment.
Are the segments future proofed? Whilst the original segments were created based on 2011 Census data, much of the additional descriptive data is based on up to date information sourced from current market research and local and national databases. This information is typically updated at least annually meaning that the descriptions of the groups can change over time as the characteristics of the groups do so. The release of large datasets (midyear population estimates, future censuses etc) can be used to re-segment the population if necessary and to identify where significant changes in the population or their characteristics have occurred.
Is this expensive? The Hull City Council segments were created entirely in house and so, unlike commercial segmentation models were relatively cheap to produce and have no ongoing cost attached. Adoption of the segmentation model, applied rigorously to strategy and delivery can result in high gains in insight for very little additional cost. The entire approach is built on the prospect of leveraging considerable extra value from existing data resources, subsequently making both efficiency savings and improved customer satisfaction.
Where Can I Find Out More?
The customer segmentation model can be used to:
Identify who your customers are
Identify where your customers live
Describe what your customers look like and how they behave
Help you to understand how to engage and reach your customers
If you would like more information on the customer segmentation model, including:
Information on how it was created / updated
Detailed descriptions of the segments and their characteristics
A breakdown of the population / households in a specific area by segment
Segments with a specific characteristic or propensity to use a specific service etc
Help collecting data to add to the segment descriptions
Assistance segmenting your own existing data
Please Contact:
Business Intelligence Team Hull City Council E: [email protected]
Copyright © 2005 Hull City Council All rights reserved.