Embed Size (px)
Citation preview
Page: Run Date:Filter:
Report Type:
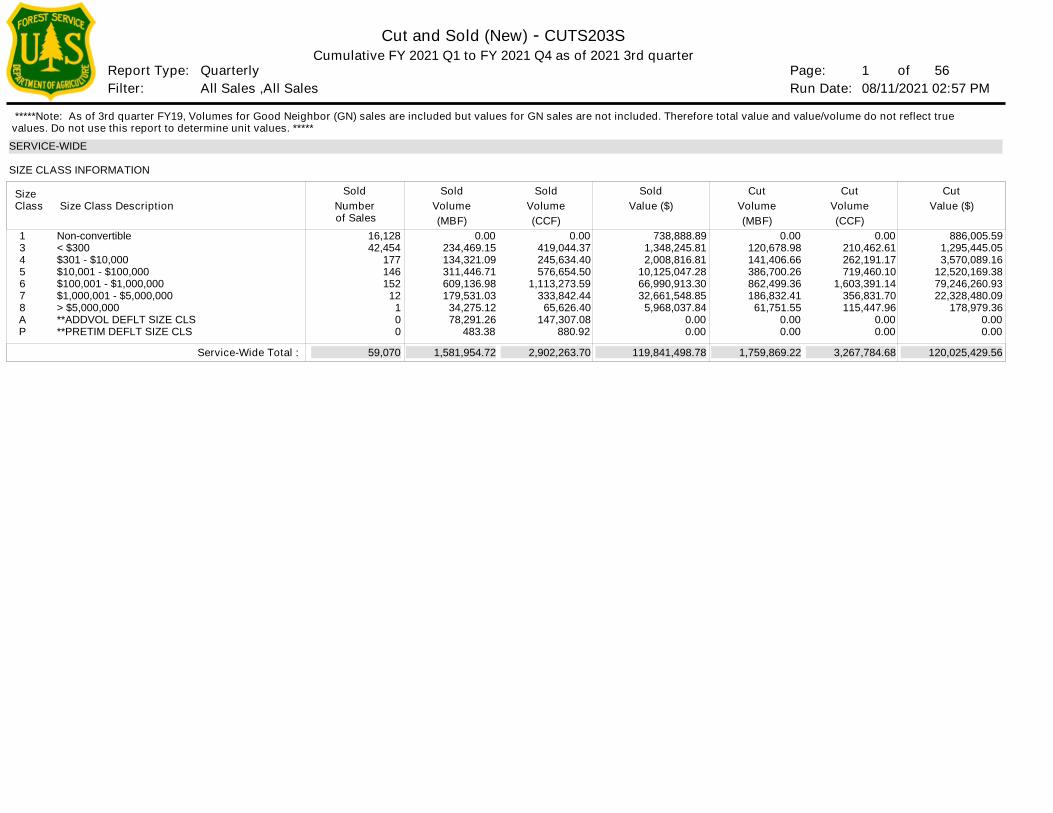
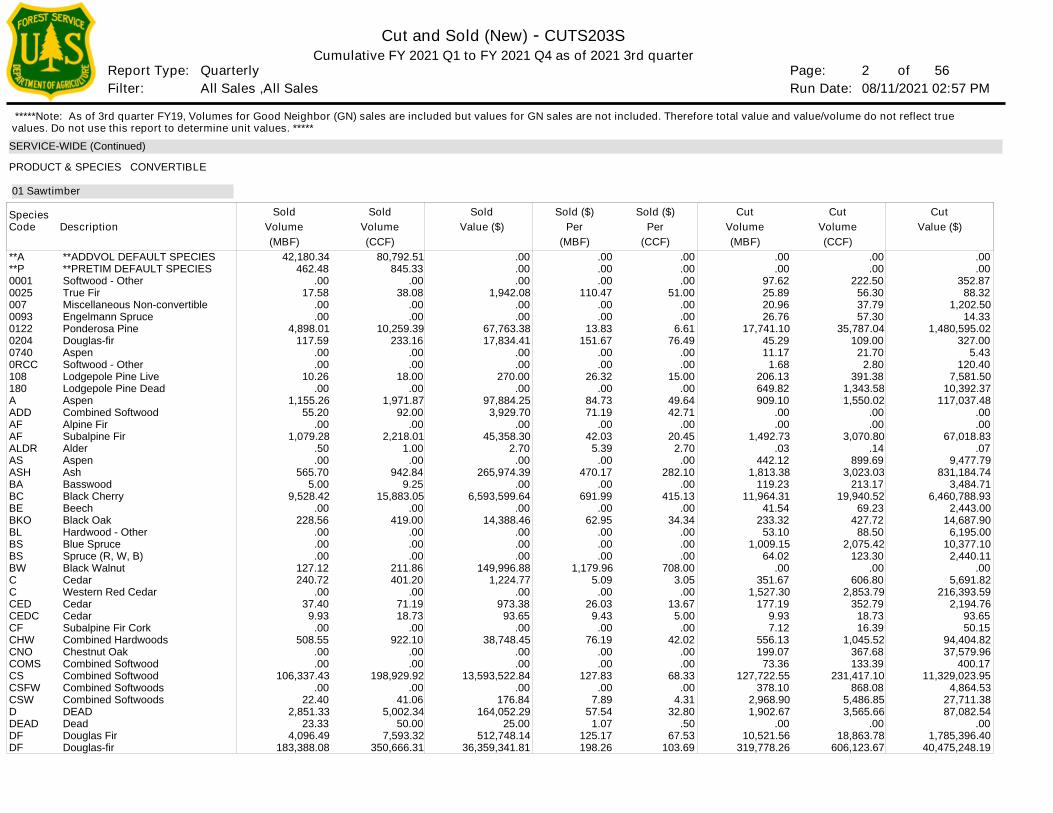
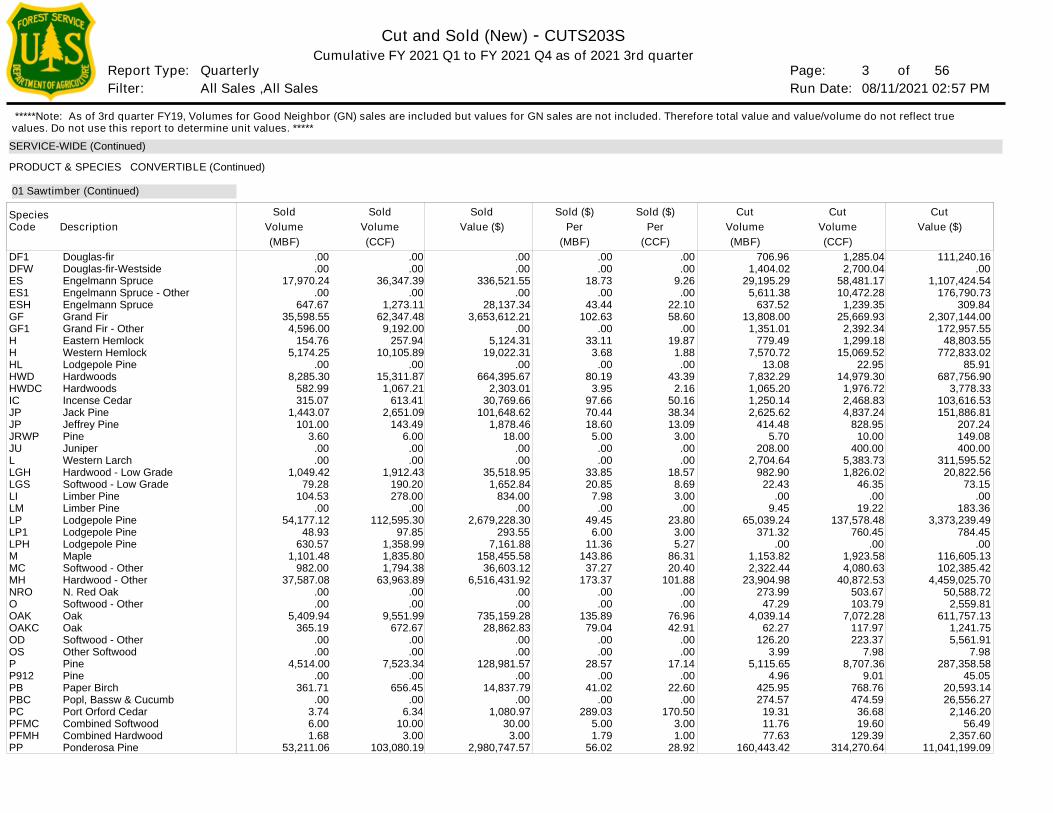
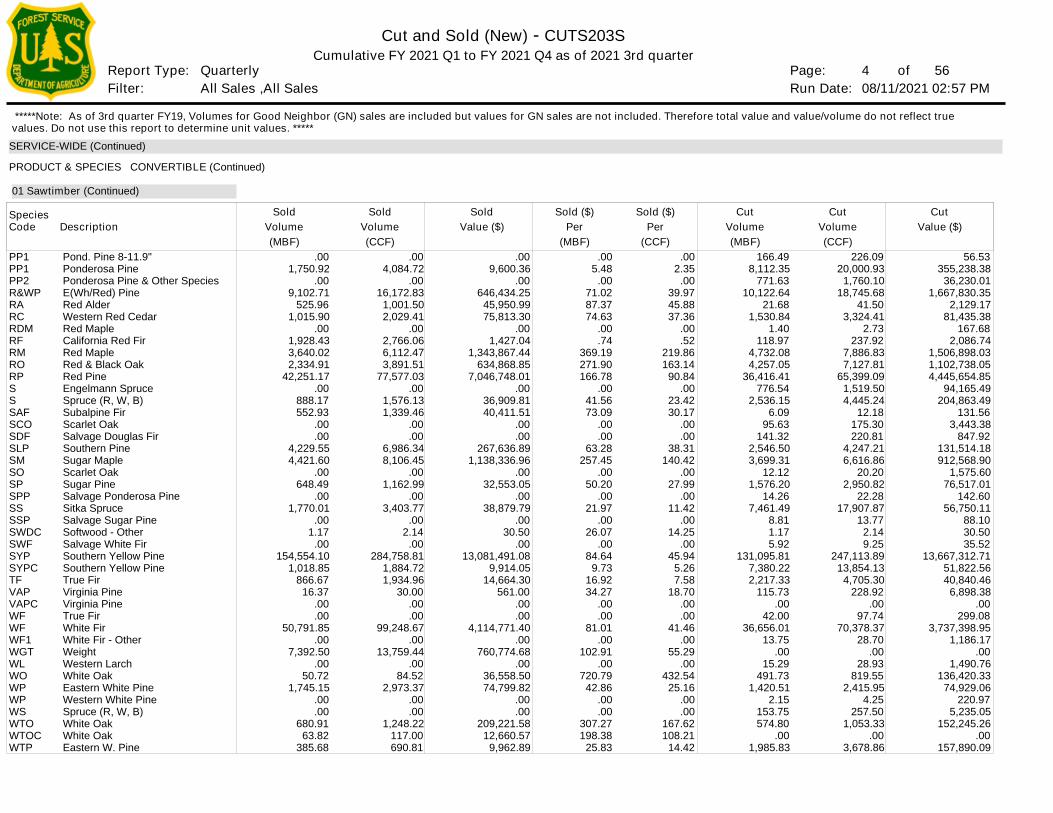
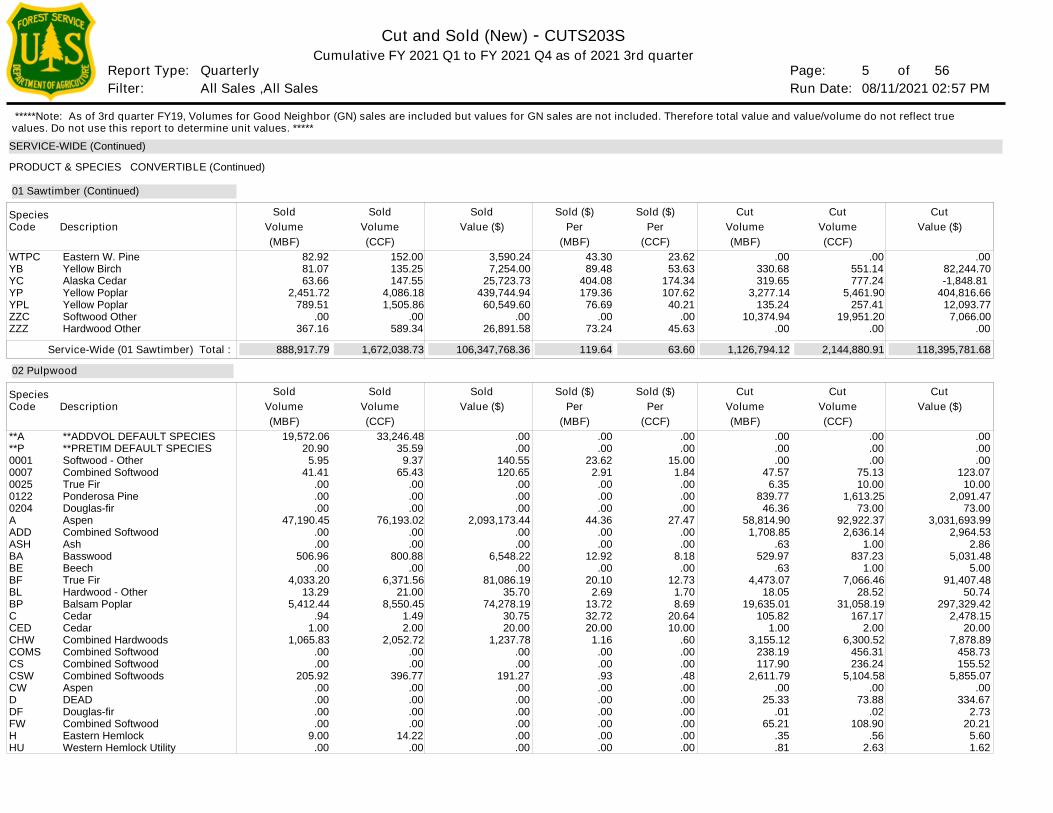
Cut and Sold (New) - CUTS203S
1 of 08/11/2021 02:57 PM
Cumulative FY 2021 Q1 to FY 2021 Q4 as of 2021 3rd quarter
All Sales ,All Sales Quarterly 56
SERVICE-WIDE
SizeClass Size Class Description Volume
1345678AP
Non-convertible< $300$301 - $10,000$10,001 - $100,000$100,001 - $1,000,000$1,000,001 - $5,000,000> $5,000,000**ADDVOL DEFLT SIZE CLS**PRETIM DEFLT SIZE CLS
886,005.59 1,295,445.05 3,570,089.16
12,520,169.38 79,246,260.93 22,328,480.09
178,979.36 0.00 0.00
0.00 210,462.61 262,191.17 719,460.10
1,603,391.14 356,831.70 115,447.96
0.00 0.00
(CCF)(MBF) 0.00
120,678.98 141,406.66 386,700.26 862,499.36 186,832.41
61,751.55 0.00 0.00
Service-Wide Total :
CutVolume
CutValue ($)
Cut
738,888.89 1,348,245.81 2,008,816.81
10,125,047.28 66,990,913.30 32,661,548.85
5,968,037.84 0.00 0.00
0.00 234,469.15 134,321.09 311,446.71 609,136.98 179,531.03
34,275.12 78,291.26
483.38
Volume(CCF)(MBF)
SoldVolume
SoldValue ($)
Sold
16,128 42,454
177 146 152
12 1 0 0
59,070 1,581,954.72 2,902,263.70 119,841,498.78 1,759,869.22 3,267,784.68 120,025,429.56
0.00 419,044.37 245,634.40 576,654.50
1,113,273.59 333,842.44
65,626.40 147,307.08
880.92
Number of Sales
SIZE CLASS INFORMATION
Sold
*****Note: As of 3rd quarter FY19, Volumes for Good Neighbor (GN) sales are included but values for GN sales are not included. Therefore total value and value/volume do not reflect true values. Do not use this report to determine unit values. *****
Page: Run Date:Filter:
Report Type:
Cut and Sold (New) - CUTS203S
2 of 08/11/2021 02:57 PM
Cumulative FY 2021 Q1 to FY 2021 Q4 as of 2021 3rd quarter
All Sales ,All Sales Quarterly 56
SpeciesCode Description Volume
**A**P0001002500700930122020407400RCC108180AADDAFAFALDRASASHBABCBEBKOBLBSBSBWCCCEDCEDCCFCHWCNOCOMSCSCSFWCSWDDEADDFDF
**ADDVOL DEFAULT SPECIES**PRETIM DEFAULT SPECIESSoftwood - OtherTrue FirMiscellaneous Non-convertibleEngelmann SprucePonderosa PineDouglas-firAspenSoftwood - OtherLodgepole Pine LiveLodgepole Pine DeadAspenCombined SoftwoodAlpine FirSubalpine FirAlderAspenAshBasswoodBlack CherryBeechBlack OakHardwood - OtherBlue SpruceSpruce (R, W, B)Black WalnutCedarWestern Red CedarCedarCedarSubalpine Fir CorkCombined HardwoodsChestnut OakCombined SoftwoodCombined SoftwoodCombined SoftwoodsCombined SoftwoodsDEADDeadDouglas FirDouglas-fir
.00 .00
352.87 88.32
1,202.50 14.33
1,480,595.02 327.00
5.43 120.40
7,581.50 10,392.37
117,037.48 .00 .00
67,018.83 .07
9,477.79 831,184.74
3,484.71 6,460,788.93
2,443.00 14,687.90
6,195.00 10,377.10
2,440.11 .00
5,691.82 216,393.59
2,194.76 93.65 50.15
94,404.82 37,579.96
400.17 11,329,023.95
4,864.53 27,711.38 87,082.54
.00 1,785,396.40
40,475,248.19
.00 .00
222.50 56.30 37.79 57.30
35,787.04 109.00
21.70 2.80
391.38 1,343.58 1,550.02
.00 .00
3,070.80 .14
899.69 3,023.03
213.17 19,940.52
69.23 427.72
88.50 2,075.42
123.30 .00
606.80 2,853.79
352.79 18.73 16.39
1,045.52 367.68 133.39
231,417.10 868.08
5,486.85 3,565.66
.00 18,863.78
606,123.67
(CCF)(MBF) .00 .00
97.62 25.89 20.96 26.76
17,741.10 45.29 11.17
1.68 206.13 649.82 909.10
.00 .00
1,492.73 .03
442.12 1,813.38
119.23 11,964.31
41.54 233.32
53.10 1,009.15
64.02 .00
351.67 1,527.30
177.19 9.93 7.12
556.13 199.07
73.36 127,722.55
378.10 2,968.90 1,902.67
.00 10,521.56
319,778.26
CutVolume
CutValue ($)
Cut
.00 .00 .00
1,942.08 .00 .00
67,763.38 17,834.41
.00 .00
270.00 .00
97,884.25 3,929.70
.00 45,358.30
2.70 .00
265,974.39 .00
6,593,599.64 .00
14,388.46 .00 .00 .00
149,996.88 1,224.77
.00 973.38
93.65 .00
38,748.45 .00 .00
13,593,522.84 .00
176.84 164,052.29
25.00 512,748.14
36,359,341.81
80,792.51 845.33
.00 38.08
.00 .00
10,259.39 233.16
.00 .00
18.00 .00
1,971.87 92.00
.00 2,218.01
1.00 .00
942.84 9.25
15,883.05 .00
419.00 .00 .00 .00
211.86 401.20
.00 71.19 18.73
.00 922.10
.00 .00
198,929.92 .00
41.06 5,002.34
50.00 7,593.32
350,666.31
42,180.34 462.48
.00 17.58
.00 .00
4,898.01 117.59
.00 .00
10.26 .00
1,155.26 55.20
.00 1,079.28
.50 .00
565.70 5.00
9,528.42 .00
228.56 .00 .00 .00
127.12 240.72
.00 37.40
9.93 .00
508.55 .00 .00
106,337.43 .00
22.40 2,851.33
23.33 4,096.49
183,388.08
Volume(CCF)(MBF)
SoldVolume
SoldValue ($)
Sold
01 Sawtimber
Per(MBF)
Sold ($)Per
(CCF)
Sold ($)
.00 .00 .00
110.47 .00 .00
13.83 151.67
.00 .00
26.32 .00
84.73 71.19
.00 42.03
5.39 .00
470.17 .00
691.99 .00
62.95 .00 .00 .00
1,179.96 5.09
.00 26.03
9.43 .00
76.19 .00 .00
127.83 .00
7.89 57.54
1.07 125.17 198.26
.00 .00 .00
51.00 .00 .00
6.61 76.49
.00 .00
15.00 .00
49.64 42.71
.00 20.45
2.70 .00
282.10 .00
415.13 .00
34.34 .00 .00 .00
708.00 3.05
.00 13.67
5.00 .00
42.02 .00 .00
68.33 .00
4.31 32.80
.50 67.53
103.69
SERVICE-WIDE (Continued)
PRODUCT & SPECIES CONVERTIBLE
*****Note: As of 3rd quarter FY19, Volumes for Good Neighbor (GN) sales are included but values for GN sales are not included. Therefore total value and value/volume do not reflect true values. Do not use this report to determine unit values. *****
Page: Run Date:Filter:
Report Type:
Cut and Sold (New) - CUTS203S
3 of 08/11/2021 02:57 PM
Cumulative FY 2021 Q1 to FY 2021 Q4 as of 2021 3rd quarter
All Sales ,All Sales Quarterly 56
SpeciesCode Description Volume
DF1DFWESES1ESHGFGF1HHHLHWDHWDCICJPJPJRWPJULLGHLGSLILMLPLP1LPHMMCMHNROOOAKOAKCODOSPP912PBPBCPCPFMCPFMHPP
Douglas-firDouglas-fir-WestsideEngelmann SpruceEngelmann Spruce - OtherEngelmann SpruceGrand FirGrand Fir - OtherEastern HemlockWestern HemlockLodgepole PineHardwoodsHardwoodsIncense CedarJack PineJeffrey PinePineJuniperWestern LarchHardwood - Low GradeSoftwood - Low GradeLimber PineLimber PineLodgepole PineLodgepole PineLodgepole PineMapleSoftwood - OtherHardwood - OtherN. Red OakSoftwood - OtherOakOakSoftwood - OtherOther SoftwoodPinePinePaper BirchPopl, Bassw & CucumbPort Orford CedarCombined SoftwoodCombined HardwoodPonderosa Pine
111,240.16 .00
1,107,424.54 176,790.73
309.84 2,307,144.00
172,957.55 48,803.55
772,833.02 85.91
687,756.90 3,778.33
103,616.53 151,886.81
207.24 149.08 400.00
311,595.52 20,822.56
73.15 .00
183.36 3,373,239.49
784.45 .00
116,605.13 102,385.42
4,459,025.70 50,588.72
2,559.81 611,757.13
1,241.75 5,561.91
7.98 287,358.58
45.05 20,593.14 26,556.27
2,146.20 56.49
2,357.60 11,041,199.09
1,285.04 2,700.04
58,481.17 10,472.28
1,239.35 25,669.93
2,392.34 1,299.18
15,069.52 22.95
14,979.30 1,976.72 2,468.83 4,837.24
828.95 10.00
400.00 5,383.73 1,826.02
46.35 .00
19.22 137,578.48
760.45 .00
1,923.58 4,080.63
40,872.53 503.67 103.79
7,072.28 117.97 223.37
7.98 8,707.36
9.01 768.76 474.59
36.68 19.60
129.39 314,270.64
(CCF)(MBF) 706.96
1,404.02 29,195.29
5,611.38 637.52
13,808.00 1,351.01
779.49 7,570.72
13.08 7,832.29 1,065.20 1,250.14 2,625.62
414.48 5.70
208.00 2,704.64
982.90 22.43
.00 9.45
65,039.24 371.32
.00 1,153.82 2,322.44
23,904.98 273.99
47.29 4,039.14
62.27 126.20
3.99 5,115.65
4.96 425.95 274.57
19.31 11.76 77.63
160,443.42
CutVolume
CutValue ($)
Cut
.00 .00
336,521.55 .00
28,137.34 3,653,612.21
.00 5,124.31
19,022.31 .00
664,395.67 2,303.01
30,769.66 101,648.62
1,878.46 18.00
.00 .00
35,518.95 1,652.84
834.00 .00
2,679,228.30 293.55
7,161.88 158,455.58
36,603.12 6,516,431.92
.00 .00
735,159.28 28,862.83
.00 .00
128,981.57 .00
14,837.79 .00
1,080.97 30.00
3.00 2,980,747.57
.00 .00
36,347.39 .00
1,273.11 62,347.48
9,192.00 257.94
10,105.89 .00
15,311.87 1,067.21
613.41 2,651.09
143.49 6.00
.00 .00
1,912.43 190.20 278.00
.00 112,595.30
97.85 1,358.99 1,835.80 1,794.38
63,963.89 .00 .00
9,551.99 672.67
.00 .00
7,523.34 .00
656.45 .00
6.34 10.00
3.00 103,080.19
.00 .00
17,970.24 .00
647.67 35,598.55
4,596.00 154.76
5,174.25 .00
8,285.30 582.99 315.07
1,443.07 101.00
3.60 .00 .00
1,049.42 79.28
104.53 .00
54,177.12 48.93
630.57 1,101.48
982.00 37,587.08
.00 .00
5,409.94 365.19
.00 .00
4,514.00 .00
361.71 .00
3.74 6.00 1.68
53,211.06
Volume(CCF)(MBF)
SoldVolume
SoldValue ($)
Sold
01 Sawtimber (Continued)
Per(MBF)
Sold ($)Per
(CCF)
Sold ($)
.00 .00
18.73 .00
43.44 102.63
.00 33.11
3.68 .00
80.19 3.95
97.66 70.44 18.60
5.00 .00 .00
33.85 20.85
7.98 .00
49.45 6.00
11.36 143.86
37.27 173.37
.00 .00
135.89 79.04
.00 .00
28.57 .00
41.02 .00
289.03 5.00 1.79
56.02
.00 .00
9.26 .00
22.10 58.60
.00 19.87
1.88 .00
43.39 2.16
50.16 38.34 13.09
3.00 .00 .00
18.57 8.69 3.00
.00 23.80
3.00 5.27
86.31 20.40
101.88 .00 .00
76.96 42.91
.00 .00
17.14 .00
22.60 .00
170.50 3.00 1.00
28.92
SERVICE-WIDE (Continued)
PRODUCT & SPECIES CONVERTIBLE (Continued)
*****Note: As of 3rd quarter FY19, Volumes for Good Neighbor (GN) sales are included but values for GN sales are not included. Therefore total value and value/volume do not reflect true values. Do not use this report to determine unit values. *****
Page: Run Date:Filter:
Report Type:
Cut and Sold (New) - CUTS203S
4 of 08/11/2021 02:57 PM
Cumulative FY 2021 Q1 to FY 2021 Q4 as of 2021 3rd quarter
All Sales ,All Sales Quarterly 56
SpeciesCode Description Volume
PP1PP1PP2R&WPRARCRDMRFRMRORPSSSAFSCOSDFSLPSMSOSPSPPSSSSPSWDCSWFSYPSYPCTFVAPVAPCWFWFWF1WGTWLWOWPWPWSWTOWTOCWTP
Pond. Pine 8-11.9"Ponderosa PinePonderosa Pine & Other SpeciesE(Wh/Red) PineRed AlderWestern Red CedarRed MapleCalifornia Red FirRed MapleRed & Black OakRed PineEngelmann SpruceSpruce (R, W, B)Subalpine FirScarlet OakSalvage Douglas FirSouthern PineSugar MapleScarlet OakSugar PineSalvage Ponderosa PineSitka SpruceSalvage Sugar PineSoftwood - OtherSalvage White FirSouthern Yellow PineSouthern Yellow PineTrue FirVirginia PineVirginia PineTrue FirWhite FirWhite Fir - OtherWeightWestern LarchWhite OakEastern White PineWestern White PineSpruce (R, W, B)White OakWhite OakEastern W. Pine
56.53 355,238.38
36,230.01 1,667,830.35
2,129.17 81,435.38
167.68 2,086.74
1,506,898.03 1,102,738.05 4,445,654.85
94,165.49 204,863.49
131.56 3,443.38
847.92 131,514.18 912,568.90
1,575.60 76,517.01
142.60 56,750.11
88.10 30.50 35.52
13,667,312.71 51,822.56 40,840.46
6,898.38 .00
299.08 3,737,398.95
1,186.17 .00
1,490.76 136,420.33
74,929.06 220.97
5,235.05 152,245.26
.00 157,890.09
226.09 20,000.93
1,760.10 18,745.68
41.50 3,324.41
2.73 237.92
7,886.83 7,127.81
65,399.09 1,519.50 4,445.24
12.18 175.30 220.81
4,247.21 6,616.86
20.20 2,950.82
22.28 17,907.87
13.77 2.14 9.25
247,113.89 13,854.13
4,705.30 228.92
.00 97.74
70,378.37 28.70
.00 28.93
819.55 2,415.95
4.25 257.50
1,053.33 .00
3,678.86
(CCF)(MBF) 166.49
8,112.35 771.63
10,122.64 21.68
1,530.84 1.40
118.97 4,732.08 4,257.05
36,416.41 776.54
2,536.15 6.09
95.63 141.32
2,546.50 3,699.31
12.12 1,576.20
14.26 7,461.49
8.81 1.17 5.92
131,095.81 7,380.22 2,217.33
115.73 .00
42.00 36,656.01
13.75 .00
15.29 491.73
1,420.51 2.15
153.75 574.80
.00 1,985.83
CutVolume
CutValue ($)
Cut
.00 9,600.36
.00 646,434.25
45,950.99 75,813.30
.00 1,427.04
1,343,867.44 634,868.85
7,046,748.01 .00
36,909.81 40,411.51
.00 .00
267,636.89 1,138,336.96
.00 32,553.05
.00 38,879.79
.00 30.50
.00 13,081,491.08
9,914.05 14,664.30
561.00 .00 .00
4,114,771.40 .00
760,774.68 .00
36,558.50 74,799.82
.00 .00
209,221.58 12,660.57
9,962.89
.00 4,084.72
.00 16,172.83
1,001.50 2,029.41
.00 2,766.06 6,112.47 3,891.51
77,577.03 .00
1,576.13 1,339.46
.00 .00
6,986.34 8,106.45
.00 1,162.99
.00 3,403.77
.00 2.14
.00 284,758.81
1,884.72 1,934.96
30.00 .00 .00
99,248.67 .00
13,759.44 .00
84.52 2,973.37
.00 .00
1,248.22 117.00 690.81
.00 1,750.92
.00 9,102.71
525.96 1,015.90
.00 1,928.43 3,640.02 2,334.91
42,251.17 .00
888.17 552.93
.00 .00
4,229.55 4,421.60
.00 648.49
.00 1,770.01
.00 1.17
.00 154,554.10
1,018.85 866.67
16.37 .00 .00
50,791.85 .00
7,392.50 .00
50.72 1,745.15
.00 .00
680.91 63.82
385.68
Volume(CCF)(MBF)
SoldVolume
SoldValue ($)
Sold
01 Sawtimber (Continued)
Per(MBF)
Sold ($)Per
(CCF)
Sold ($)
.00 5.48
.00 71.02 87.37 74.63
.00 .74
369.19 271.90 166.78
.00 41.56 73.09
.00 .00
63.28 257.45
.00 50.20
.00 21.97
.00 26.07
.00 84.64
9.73 16.92 34.27
.00 .00
81.01 .00
102.91 .00
720.79 42.86
.00 .00
307.27 198.38
25.83
.00 2.35
.00 39.97 45.88 37.36
.00 .52
219.86 163.14
90.84 .00
23.42 30.17
.00 .00
38.31 140.42
.00 27.99
.00 11.42
.00 14.25
.00 45.94
5.26 7.58
18.70 .00 .00
41.46 .00
55.29 .00
432.54 25.16
.00 .00
167.62 108.21
14.42
SERVICE-WIDE (Continued)
PRODUCT & SPECIES CONVERTIBLE (Continued)
*****Note: As of 3rd quarter FY19, Volumes for Good Neighbor (GN) sales are included but values for GN sales are not included. Therefore total value and value/volume do not reflect true values. Do not use this report to determine unit values. *****
Page: Run Date:Filter:
Report Type:
Cut and Sold (New) - CUTS203S
5 of 08/11/2021 02:57 PM
Cumulative FY 2021 Q1 to FY 2021 Q4 as of 2021 3rd quarter
All Sales ,All Sales Quarterly 56
Species
Species
Code
Code
Description
Description
Volume
Volume
WTPCYBYCYPYPLZZCZZZ
**A**P00010007002501220204AADDASHBABEBFBLBPCCEDCHWCOMSCSCSWCWDDFFWHHU
Eastern W. PineYellow BirchAlaska CedarYellow PoplarYellow PoplarSoftwood OtherHardwood Other
**ADDVOL DEFAULT SPECIES**PRETIM DEFAULT SPECIESSoftwood - OtherCombined SoftwoodTrue FirPonderosa PineDouglas-firAspenCombined SoftwoodAshBasswoodBeechTrue FirHardwood - OtherBalsam PoplarCedarCedarCombined HardwoodsCombined SoftwoodCombined SoftwoodCombined SoftwoodsAspenDEADDouglas-firCombined SoftwoodEastern HemlockWestern Hemlock Utility
.00 82,244.70-1,848.81
404,816.66 12,093.77
7,066.00 .00
.00 .00 .00
123.07 10.00
2,091.47 73.00
3,031,693.99 2,964.53
2.86 5,031.48
5.00 91,407.48
50.74 297,329.42
2,478.15 20.00
7,878.89 458.73 155.52
5,855.07 .00
334.67 2.73
20.21 5.60 1.62
.00 551.14 777.24
5,461.90 257.41
19,951.20 .00
.00 .00 .00
75.13 10.00
1,613.25 73.00
92,922.37 2,636.14
1.00 837.23
1.00 7,066.46
28.52 31,058.19
167.17 2.00
6,300.52 456.31 236.24
5,104.58 .00
73.88 .02
108.90 .56
2.63
(CCF)
(CCF)
(MBF)
(MBF)
.00 330.68 319.65
3,277.14 135.24
10,374.94 .00
.00 .00 .00
47.57 6.35
839.77 46.36
58,814.90 1,708.85
.63 529.97
.63 4,473.07
18.05 19,635.01
105.82 1.00
3,155.12 238.19 117.90
2,611.79 .00
25.33 .01
65.21 .35 .81
Service-Wide (01 Sawtimber) Total :
Cut
Cut
Volume
Volume
Cut
Cut
Value ($)
Value ($)
Cut
Cut
3,590.24 7,254.00
25,723.73 439,744.94
60,549.60 .00
26,891.58
.00 .00
140.55 120.65
.00 .00 .00
2,093,173.44 .00 .00
6,548.22 .00
81,086.19 35.70
74,278.19 30.75 20.00
1,237.78 .00 .00
191.27 .00 .00 .00 .00 .00 .00
152.00 135.25 147.55
4,086.18 1,505.86
.00 589.34
33,246.48 35.59
9.37 65.43
.00 .00 .00
76,193.02 .00 .00
800.88 .00
6,371.56 21.00
8,550.45 1.49 2.00
2,052.72 .00 .00
396.77 .00 .00 .00 .00
14.22 .00
82.92 81.07 63.66
2,451.72 789.51
.00 367.16
19,572.06 20.90
5.95 41.41
.00 .00 .00
47,190.45 .00 .00
506.96 .00
4,033.20 13.29
5,412.44 .94
1.00 1,065.83
.00 .00
205.92 .00 .00 .00 .00
9.00 .00
Volume
Volume
(CCF)
(CCF)
(MBF)
(MBF)
Sold
Sold
Volume
Volume
Sold
Sold
Value ($)
Value ($)
Sold
Sold
888,917.79 1,672,038.73 106,347,768.36 1,126,794.12 2,144,880.91 118,395,781.68
01 Sawtimber (Continued)
02 Pulpwood
Per
Per
(MBF)
(MBF)
Sold ($)
Sold ($)
Per
Per
(CCF)
(CCF)
Sold ($)
Sold ($)
43.30 89.48
404.08 179.36
76.69 .00
73.24
.00 .00
23.62 2.91
.00 .00 .00
44.36 .00 .00
12.92 .00
20.10 2.69
13.72 32.72 20.00
1.16 .00 .00 .93 .00 .00 .00 .00 .00 .00
119.64
23.62 53.63
174.34 107.62
40.21 .00
45.63
.00 .00
15.00 1.84
.00 .00 .00
27.47 .00 .00
8.18 .00
12.73 1.70 8.69
20.64 10.00
.60 .00 .00 .48 .00 .00 .00 .00 .00 .00
63.60
SERVICE-WIDE (Continued)
PRODUCT & SPECIES CONVERTIBLE (Continued)
*****Note: As of 3rd quarter FY19, Volumes for Good Neighbor (GN) sales are included but values for GN sales are not included. Therefore total value and value/volume do not reflect true values. Do not use this report to determine unit values. *****
Page: Run Date:Filter:
Report Type:
Cut and Sold (New) - CUTS203S
6 of 08/11/2021 02:57 PM
Cumulative FY 2021 Q1 to FY 2021 Q4 as of 2021 3rd quarter
All Sales ,All Sales Quarterly 56
SpeciesCode Description Volume
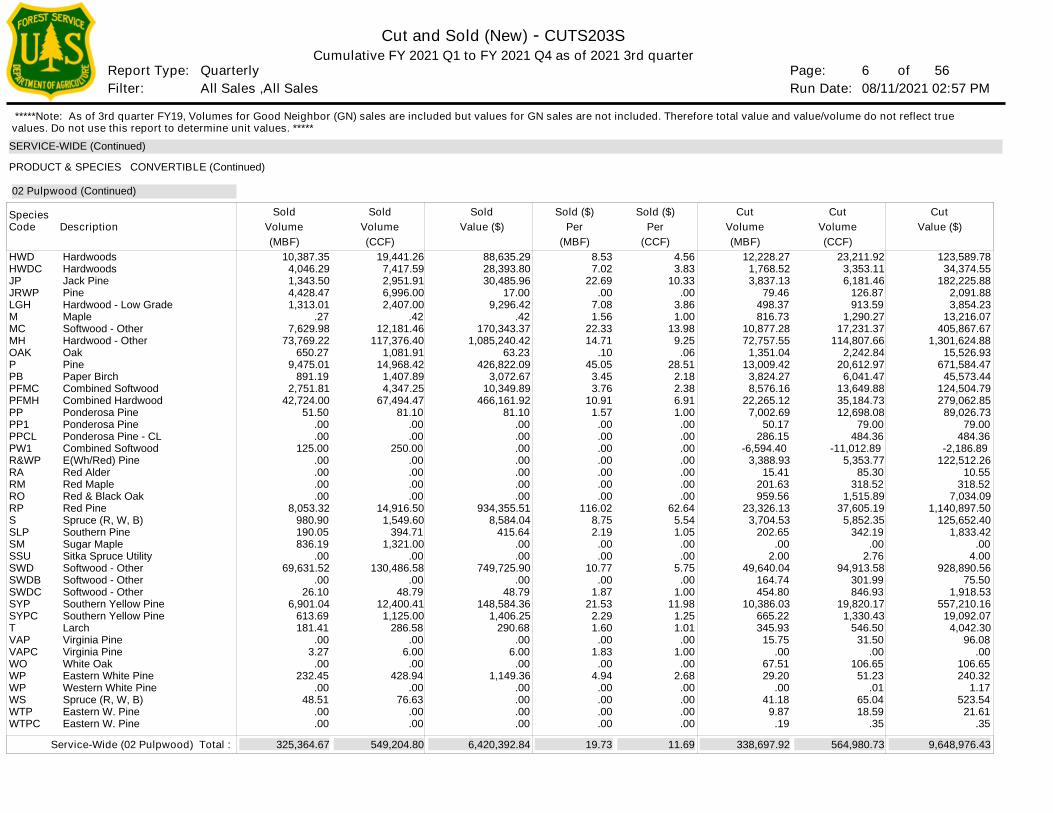
HWDHWDCJPJRWPLGHMMCMHOAKPPBPFMCPFMHPPPP1PPCLPW1R&WPRARMRORPSSLPSMSSUSWDSWDBSWDCSYPSYPCTVAPVAPCWOWPWPWSWTPWTPC
HardwoodsHardwoodsJack PinePineHardwood - Low GradeMapleSoftwood - OtherHardwood - OtherOakPinePaper BirchCombined SoftwoodCombined HardwoodPonderosa PinePonderosa PinePonderosa Pine - CLCombined SoftwoodE(Wh/Red) PineRed AlderRed MapleRed & Black OakRed PineSpruce (R, W, B)Southern PineSugar MapleSitka Spruce UtilitySoftwood - OtherSoftwood - OtherSoftwood - OtherSouthern Yellow PineSouthern Yellow PineLarchVirginia PineVirginia PineWhite OakEastern White PineWestern White PineSpruce (R, W, B)Eastern W. PineEastern W. Pine
123,589.78 34,374.55
182,225.88 2,091.88 3,854.23
13,216.07 405,867.67
1,301,624.88 15,526.93
671,584.47 45,573.44
124,504.79 279,062.85
89,026.73 79.00
484.36-2,186.89
122,512.26 10.55
318.52 7,034.09
1,140,897.50 125,652.40
1,833.42 .00
4.00 928,890.56
75.50 1,918.53
557,210.16 19,092.07
4,042.30 96.08
.00 106.65 240.32
1.17 523.54
21.61 .35
23,211.92 3,353.11 6,181.46
126.87 913.59
1,290.27 17,231.37
114,807.66 2,242.84
20,612.97 6,041.47
13,649.88 35,184.73 12,698.08
79.00 484.36
-11,012.89 5,353.77
85.30 318.52
1,515.89 37,605.19
5,852.35 342.19
.00 2.76
94,913.58 301.99 846.93
19,820.17 1,330.43
546.50 31.50
.00 106.65
51.23 .01
65.04 18.59
.35
(CCF)(MBF) 12,228.27
1,768.52 3,837.13
79.46 498.37 816.73
10,877.28 72,757.55
1,351.04 13,009.42
3,824.27 8,576.16
22,265.12 7,002.69
50.17 286.15
-6,594.40 3,388.93
15.41 201.63 959.56
23,326.13 3,704.53
202.65 .00
2.00 49,640.04
164.74 454.80
10,386.03 665.22 345.93
15.75 .00
67.51 29.20
.00 41.18
9.87 .19
Service-Wide (02 Pulpwood) Total :
CutVolume
CutValue ($)
Cut
88,635.29 28,393.80 30,485.96
17.00 9,296.42
.42 170,343.37
1,085,240.42 63.23
426,822.09 3,072.67
10,349.89 466,161.92
81.10 .00 .00 .00 .00 .00 .00 .00
934,355.51 8,584.04
415.64 .00 .00
749,725.90 .00
48.79 148,584.36
1,406.25 290.68
.00 6.00
.00 1,149.36
.00 .00 .00 .00
19,441.26 7,417.59 2,951.91 6,996.00 2,407.00
.42 12,181.46
117,376.40 1,081.91
14,968.42 1,407.89 4,347.25
67,494.47 81.10
.00 .00
250.00 .00 .00 .00 .00
14,916.50 1,549.60
394.71 1,321.00
.00 130,486.58
.00 48.79
12,400.41 1,125.00
286.58 .00
6.00 .00
428.94 .00
76.63 .00 .00
10,387.35 4,046.29 1,343.50 4,428.47 1,313.01
.27 7,629.98
73,769.22 650.27
9,475.01 891.19
2,751.81 42,724.00
51.50 .00 .00
125.00 .00 .00 .00 .00
8,053.32 980.90 190.05 836.19
.00 69,631.52
.00 26.10
6,901.04 613.69 181.41
.00 3.27
.00 232.45
.00 48.51
.00 .00
Volume(CCF)(MBF)
SoldVolume
SoldValue ($)
Sold
325,364.67 549,204.80 6,420,392.84 338,697.92 564,980.73 9,648,976.43
02 Pulpwood (Continued)
Per(MBF)
Sold ($)Per
(CCF)
Sold ($)
8.53 7.02
22.69 .00
7.08 1.56
22.33 14.71
.10 45.05
3.45 3.76
10.91 1.57
.00 .00 .00 .00 .00 .00 .00
116.02 8.75 2.19
.00 .00
10.77 .00
1.87 21.53
2.29 1.60
.00 1.83
.00 4.94
.00 .00 .00 .00
19.73
4.56 3.83
10.33 .00
3.86 1.00
13.98 9.25
.06 28.51
2.18 2.38 6.91 1.00
.00 .00 .00 .00 .00 .00 .00
62.64 5.54 1.05
.00 .00
5.75 .00
1.00 11.98
1.25 1.01
.00 1.00
.00 2.68
.00 .00 .00 .00
11.69
SERVICE-WIDE (Continued)
PRODUCT & SPECIES CONVERTIBLE (Continued)
*****Note: As of 3rd quarter FY19, Volumes for Good Neighbor (GN) sales are included but values for GN sales are not included. Therefore total value and value/volume do not reflect true values. Do not use this report to determine unit values. *****
Page: Run Date:Filter:
Report Type:
Cut and Sold (New) - CUTS203S
7 of 08/11/2021 02:57 PM
Cumulative FY 2021 Q1 to FY 2021 Q4 as of 2021 3rd quarter
All Sales ,All Sales Quarterly 56
SpeciesCode Description Volume
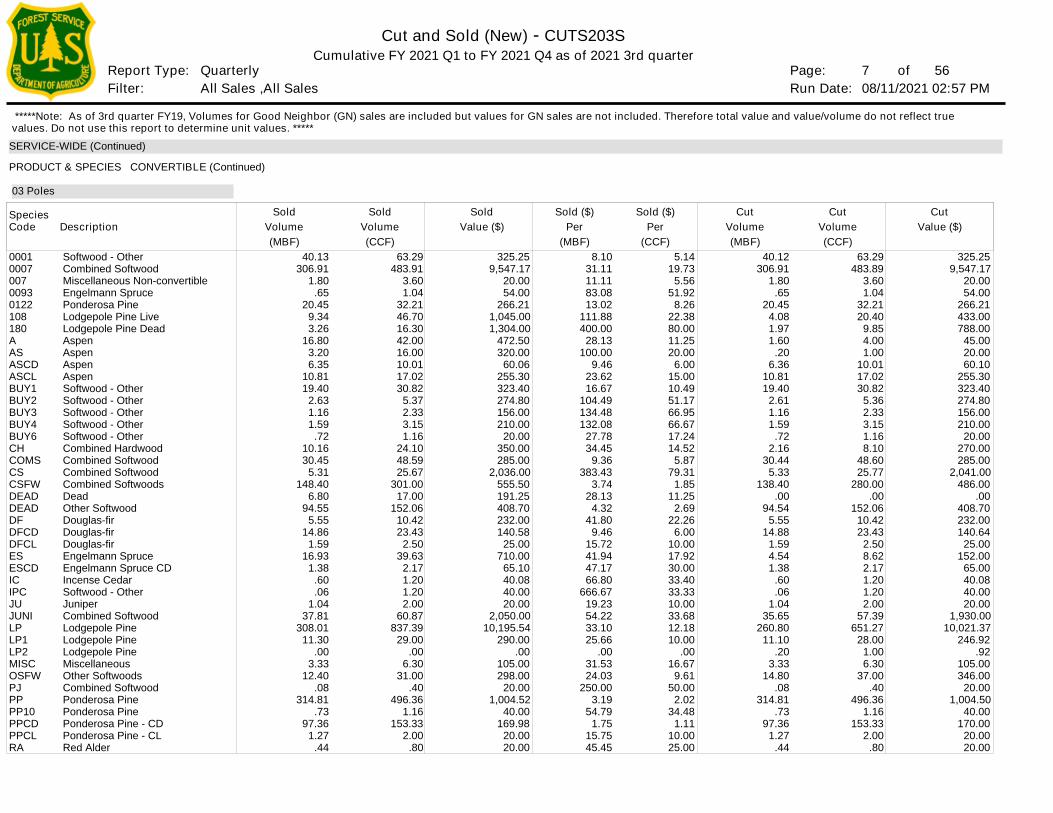
0001000700700930122108180AASASCDASCLBUY1BUY2BUY3BUY4BUY6CHCOMSCSCSFWDEADDEADDFDFCDDFCLESESCDICIPCJUJUNILPLP1LP2MISCOSFWPJPPPP10PPCDPPCLRA
Softwood - OtherCombined SoftwoodMiscellaneous Non-convertibleEngelmann SprucePonderosa PineLodgepole Pine LiveLodgepole Pine DeadAspenAspenAspenAspenSoftwood - OtherSoftwood - OtherSoftwood - OtherSoftwood - OtherSoftwood - OtherCombined HardwoodCombined SoftwoodCombined SoftwoodCombined SoftwoodsDeadOther SoftwoodDouglas-firDouglas-firDouglas-firEngelmann SpruceEngelmann Spruce CDIncense CedarSoftwood - OtherJuniperCombined SoftwoodLodgepole PineLodgepole PineLodgepole PineMiscellaneousOther SoftwoodsCombined SoftwoodPonderosa PinePonderosa PinePonderosa Pine - CDPonderosa Pine - CLRed Alder
325.25 9,547.17
20.00 54.00
266.21 433.00 788.00
45.00 20.00 60.10
255.30 323.40 274.80 156.00 210.00
20.00 270.00 285.00
2,041.00 486.00
.00 408.70 232.00 140.64
25.00 152.00
65.00 40.08 40.00 20.00
1,930.00 10,021.37
246.92 .92
105.00 346.00
20.00 1,004.50
40.00 170.00
20.00 20.00
63.29 483.89
3.60 1.04
32.21 20.40
9.85 4.00 1.00
10.01 17.02 30.82
5.36 2.33 3.15 1.16 8.10
48.60 25.77
280.00 .00
152.06 10.42 23.43
2.50 8.62 2.17 1.20 1.20 2.00
57.39 651.27
28.00 1.00 6.30
37.00 .40
496.36 1.16
153.33 2.00
.80
(CCF)(MBF) 40.12
306.91 1.80
.65 20.45
4.08 1.97 1.60
.20 6.36
10.81 19.40
2.61 1.16 1.59
.72 2.16
30.44 5.33
138.40 .00
94.54 5.55
14.88 1.59 4.54 1.38
.60 .06
1.04 35.65
260.80 11.10
.20 3.33
14.80 .08
314.81 .73
97.36 1.27
.44
CutVolume
CutValue ($)
Cut
325.25 9,547.17
20.00 54.00
266.21 1,045.00 1,304.00
472.50 320.00
60.06 255.30 323.40 274.80 156.00 210.00
20.00 350.00 285.00
2,036.00 555.50 191.25 408.70 232.00 140.58
25.00 710.00
65.10 40.08 40.00 20.00
2,050.00 10,195.54
290.00 .00
105.00 298.00
20.00 1,004.52
40.00 169.98
20.00 20.00
63.29 483.91
3.60 1.04
32.21 46.70 16.30 42.00 16.00 10.01 17.02 30.82
5.37 2.33 3.15 1.16
24.10 48.59 25.67
301.00 17.00
152.06 10.42 23.43
2.50 39.63
2.17 1.20 1.20 2.00
60.87 837.39
29.00 .00
6.30 31.00
.40 496.36
1.16 153.33
2.00 .80
40.13 306.91
1.80 .65
20.45 9.34 3.26
16.80 3.20 6.35
10.81 19.40
2.63 1.16 1.59
.72 10.16 30.45
5.31 148.40
6.80 94.55
5.55 14.86
1.59 16.93
1.38 .60 .06
1.04 37.81
308.01 11.30
.00 3.33
12.40 .08
314.81 .73
97.36 1.27
.44
Volume(CCF)(MBF)
SoldVolume
SoldValue ($)
Sold
03 Poles
Per(MBF)
Sold ($)Per
(CCF)
Sold ($)
8.10 31.11 11.11 83.08 13.02
111.88 400.00
28.13 100.00
9.46 23.62 16.67
104.49 134.48 132.08
27.78 34.45
9.36 383.43
3.74 28.13
4.32 41.80
9.46 15.72 41.94 47.17 66.80
666.67 19.23 54.22 33.10 25.66
.00 31.53 24.03
250.00 3.19
54.79 1.75
15.75 45.45
5.14 19.73
5.56 51.92
8.26 22.38 80.00 11.25 20.00
6.00 15.00 10.49 51.17 66.95 66.67 17.24 14.52
5.87 79.31
1.85 11.25
2.69 22.26
6.00 10.00 17.92 30.00 33.40 33.33 10.00 33.68 12.18 10.00
.00 16.67
9.61 50.00
2.02 34.48
1.11 10.00 25.00
SERVICE-WIDE (Continued)
PRODUCT & SPECIES CONVERTIBLE (Continued)
*****Note: As of 3rd quarter FY19, Volumes for Good Neighbor (GN) sales are included but values for GN sales are not included. Therefore total value and value/volume do not reflect true values. Do not use this report to determine unit values. *****
Page: Run Date:Filter:
Report Type:
Cut and Sold (New) - CUTS203S
8 of 08/11/2021 02:57 PM
Cumulative FY 2021 Q1 to FY 2021 Q4 as of 2021 3rd quarter
All Sales ,All Sales Quarterly 56
Species
Species
Species
Code
Code
Code
Description
Description
Description
Volume
Volume
Volume
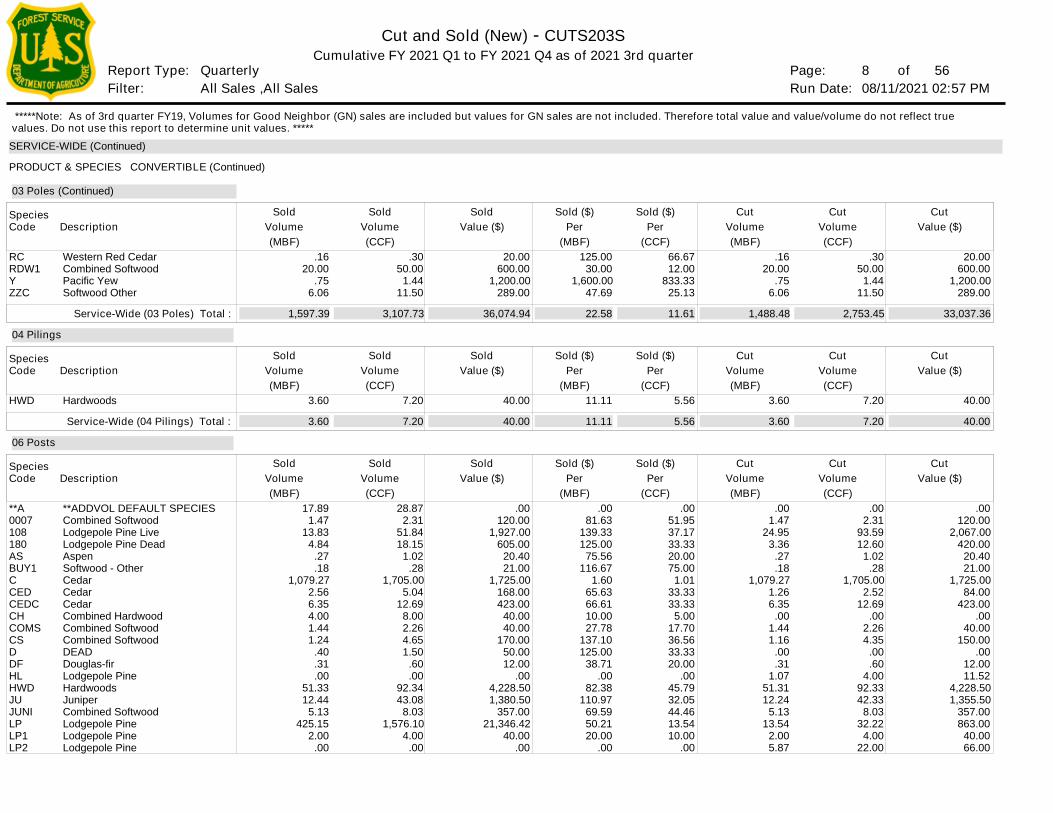
RCRDW1YZZC
HWD
**A0007108180ASBUY1CCEDCEDCCHCOMSCSDDFHLHWDJUJUNILPLP1LP2
Western Red CedarCombined SoftwoodPacific YewSoftwood Other
Hardwoods
**ADDVOL DEFAULT SPECIESCombined SoftwoodLodgepole Pine LiveLodgepole Pine DeadAspenSoftwood - OtherCedarCedarCedarCombined HardwoodCombined SoftwoodCombined SoftwoodDEADDouglas-firLodgepole PineHardwoodsJuniperCombined SoftwoodLodgepole PineLodgepole PineLodgepole Pine
20.00 600.00
1,200.00 289.00
40.00
.00 120.00
2,067.00 420.00
20.40 21.00
1,725.00 84.00
423.00 .00
40.00 150.00
.00 12.00 11.52
4,228.50 1,355.50
357.00 863.00
40.00 66.00
.30 50.00
1.44 11.50
7.20
.00 2.31
93.59 12.60
1.02 .28
1,705.00 2.52
12.69 .00
2.26 4.35
.00 .60
4.00 92.33 42.33
8.03 32.22
4.00 22.00
(CCF)
(CCF)
(CCF)
(MBF)
(MBF)
(MBF)
.16 20.00
.75 6.06
3.60
.00 1.47
24.95 3.36
.27 .18
1,079.27 1.26 6.35
.00 1.44 1.16
.00 .31
1.07 51.31 12.24
5.13 13.54
2.00 5.87
Service-Wide (03 Poles) Total :
Service-Wide (04 Pilings) Total :
Cut
Cut
Cut
Volume
Volume
Volume
Cut
Cut
Cut
Value ($)
Value ($)
Value ($)
Cut
Cut
Cut
20.00 600.00
1,200.00 289.00
40.00
.00 120.00
1,927.00 605.00
20.40 21.00
1,725.00 168.00 423.00
40.00 40.00
170.00 50.00 12.00
.00 4,228.50 1,380.50
357.00 21,346.42
40.00 .00
.30 50.00
1.44 11.50
7.20
28.87 2.31
51.84 18.15
1.02 .28
1,705.00 5.04
12.69 8.00 2.26 4.65 1.50
.60 .00
92.34 43.08
8.03 1,576.10
4.00 .00
.16 20.00
.75 6.06
3.60
17.89 1.47
13.83 4.84
.27 .18
1,079.27 2.56 6.35 4.00 1.44 1.24
.40 .31 .00
51.33 12.44
5.13 425.15
2.00 .00
Volume
Volume
Volume
(CCF)
(CCF)
(CCF)
(MBF)
(MBF)
(MBF)
Sold
Sold
Sold
Volume
Volume
Volume
Sold
Sold
Sold
Value ($)
Value ($)
Value ($)
Sold
Sold
Sold
1,597.39
3.60
3,107.73
7.20
36,074.94
40.00
1,488.48
3.60
2,753.45
7.20
33,037.36
40.00
03 Poles (Continued)
04 Pilings
06 Posts
Per
Per
Per
(MBF)
(MBF)
(MBF)
Sold ($)
Sold ($)
Sold ($)
Per
Per
Per
(CCF)
(CCF)
(CCF)
Sold ($)
Sold ($)
Sold ($)
125.00 30.00
1,600.00 47.69
11.11
.00 81.63
139.33 125.00
75.56 116.67
1.60 65.63 66.61 10.00 27.78
137.10 125.00
38.71 .00
82.38 110.97
69.59 50.21 20.00
.00
22.58
11.11
66.67 12.00
833.33 25.13
5.56
.00 51.95 37.17 33.33 20.00 75.00
1.01 33.33 33.33
5.00 17.70 36.56 33.33 20.00
.00 45.79 32.05 44.46 13.54 10.00
.00
11.61
5.56
SERVICE-WIDE (Continued)
PRODUCT & SPECIES CONVERTIBLE (Continued)
*****Note: As of 3rd quarter FY19, Volumes for Good Neighbor (GN) sales are included but values for GN sales are not included. Therefore total value and value/volume do not reflect true values. Do not use this report to determine unit values. *****
Page: Run Date:Filter:
Report Type:
Cut and Sold (New) - CUTS203S
9 of 08/11/2021 02:57 PM
Cumulative FY 2021 Q1 to FY 2021 Q4 as of 2021 3rd quarter
All Sales ,All Sales Quarterly 56
Species
Species
Code
Code
Description
Description
Volume
Volume
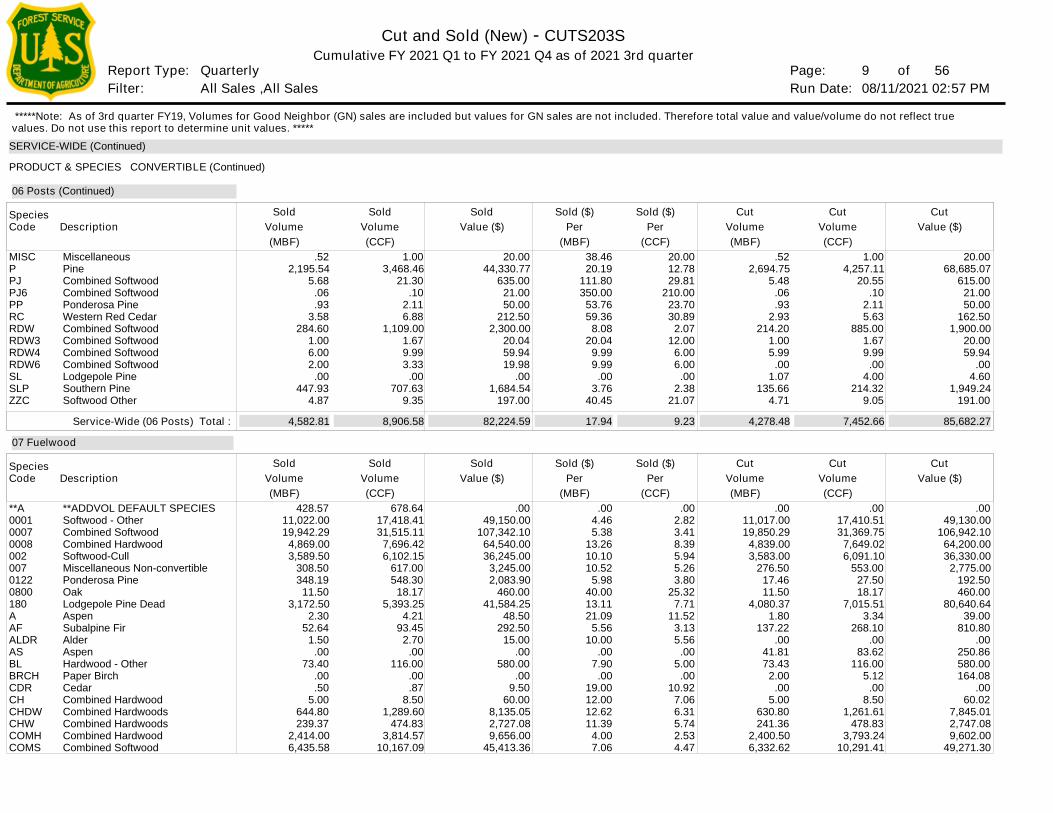
MISCPPJPJ6PPRCRDWRDW3RDW4RDW6SLSLPZZC
**A00010007000800200701220800180AAFALDRASBLBRCHCDRCHCHDWCHWCOMHCOMS
MiscellaneousPineCombined SoftwoodCombined SoftwoodPonderosa PineWestern Red CedarCombined SoftwoodCombined SoftwoodCombined SoftwoodCombined SoftwoodLodgepole PineSouthern PineSoftwood Other
**ADDVOL DEFAULT SPECIESSoftwood - OtherCombined SoftwoodCombined HardwoodSoftwood-CullMiscellaneous Non-convertiblePonderosa PineOakLodgepole Pine DeadAspenSubalpine FirAlderAspenHardwood - OtherPaper BirchCedarCombined HardwoodCombined HardwoodsCombined HardwoodsCombined HardwoodCombined Softwood
20.00 68,685.07
615.00 21.00 50.00
162.50 1,900.00
20.00 59.94
.00 4.60
1,949.24 191.00
.00 49,130.00
106,942.10 64,200.00 36,330.00
2,775.00 192.50 460.00
80,640.64 39.00
810.80 .00
250.86 580.00 164.08
.00 60.02
7,845.01 2,747.08 9,602.00
49,271.30
1.00 4,257.11
20.55 .10
2.11 5.63
885.00 1.67 9.99
.00 4.00
214.32 9.05
.00 17,410.51 31,369.75
7,649.02 6,091.10
553.00 27.50 18.17
7,015.51 3.34
268.10 .00
83.62 116.00
5.12 .00
8.50 1,261.61
478.83 3,793.24
10,291.41
(CCF)
(CCF)
(MBF)
(MBF)
.52 2,694.75
5.48 .06 .93
2.93 214.20
1.00 5.99
.00 1.07
135.66 4.71
.00 11,017.00 19,850.29
4,839.00 3,583.00
276.50 17.46 11.50
4,080.37 1.80
137.22 .00
41.81 73.43
2.00 .00
5.00 630.80 241.36
2,400.50 6,332.62
Service-Wide (06 Posts) Total :
Cut
Cut
Volume
Volume
Cut
Cut
Value ($)
Value ($)
Cut
Cut
20.00 44,330.77
635.00 21.00 50.00
212.50 2,300.00
20.04 59.94 19.98
.00 1,684.54
197.00
.00 49,150.00
107,342.10 64,540.00 36,245.00
3,245.00 2,083.90
460.00 41,584.25
48.50 292.50
15.00 .00
580.00 .00
9.50 60.00
8,135.05 2,727.08 9,656.00
45,413.36
1.00 3,468.46
21.30 .10
2.11 6.88
1,109.00 1.67 9.99 3.33
.00 707.63
9.35
678.64 17,418.41 31,515.11
7,696.42 6,102.15
617.00 548.30
18.17 5,393.25
4.21 93.45
2.70 .00
116.00 .00 .87
8.50 1,289.60
474.83 3,814.57
10,167.09
.52 2,195.54
5.68 .06 .93
3.58 284.60
1.00 6.00 2.00
.00 447.93
4.87
428.57 11,022.00 19,942.29
4,869.00 3,589.50
308.50 348.19
11.50 3,172.50
2.30 52.64
1.50 .00
73.40 .00 .50
5.00 644.80 239.37
2,414.00 6,435.58
Volume
Volume
(CCF)
(CCF)
(MBF)
(MBF)
Sold
Sold
Volume
Volume
Sold
Sold
Value ($)
Value ($)
Sold
Sold
4,582.81 8,906.58 82,224.59 4,278.48 7,452.66 85,682.27
06 Posts (Continued)
07 Fuelwood
Per
Per
(MBF)
(MBF)
Sold ($)
Sold ($)
Per
Per
(CCF)
(CCF)
Sold ($)
Sold ($)
38.46 20.19
111.80 350.00
53.76 59.36
8.08 20.04
9.99 9.99
.00 3.76
40.45
.00 4.46 5.38
13.26 10.10 10.52
5.98 40.00 13.11 21.09
5.56 10.00
.00 7.90
.00 19.00 12.00 12.62 11.39
4.00 7.06
17.94
20.00 12.78 29.81
210.00 23.70 30.89
2.07 12.00
6.00 6.00
.00 2.38
21.07
.00 2.82 3.41 8.39 5.94 5.26 3.80
25.32 7.71
11.52 3.13 5.56
.00 5.00
.00 10.92
7.06 6.31 5.74 2.53 4.47
9.23
SERVICE-WIDE (Continued)
PRODUCT & SPECIES CONVERTIBLE (Continued)
*****Note: As of 3rd quarter FY19, Volumes for Good Neighbor (GN) sales are included but values for GN sales are not included. Therefore total value and value/volume do not reflect true values. Do not use this report to determine unit values. *****
Page: Run Date:Filter:
Report Type:
Cut and Sold (New) - CUTS203S
10 of 08/11/2021 02:57 PM
Cumulative FY 2021 Q1 to FY 2021 Q4 as of 2021 3rd quarter
All Sales ,All Sales Quarterly 56
SpeciesCode Description Volume
CSCSFWDDEADDEADDEPDFESFWFWHHWDHWDCJPJPOKJUJUNILGHLPLP1MHMHMISCOOAOAKOAKODOHOKONDOSOSFWP912PFMHPJPJNDPPPP1PP2PPCDPS
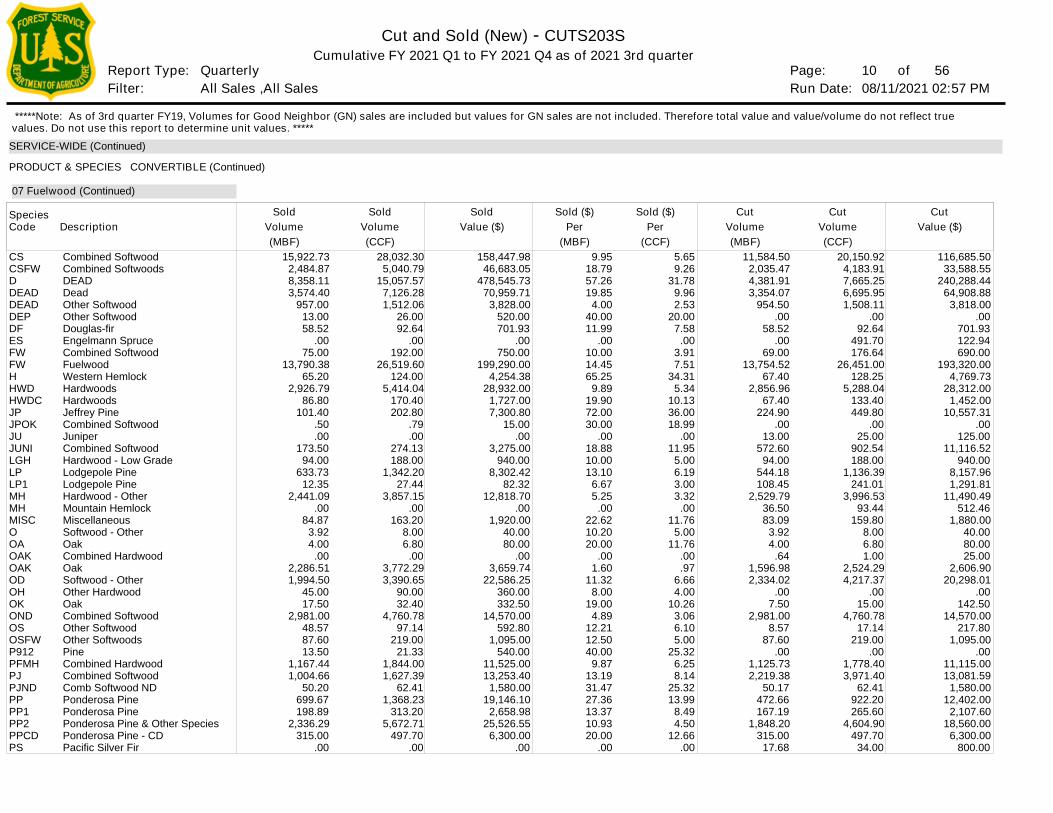
Combined SoftwoodCombined SoftwoodsDEADDeadOther SoftwoodOther SoftwoodDouglas-firEngelmann SpruceCombined SoftwoodFuelwoodWestern HemlockHardwoodsHardwoodsJeffrey PineCombined SoftwoodJuniperCombined SoftwoodHardwood - Low GradeLodgepole PineLodgepole PineHardwood - OtherMountain HemlockMiscellaneousSoftwood - OtherOakCombined HardwoodOakSoftwood - OtherOther HardwoodOakCombined SoftwoodOther SoftwoodOther SoftwoodsPineCombined HardwoodCombined SoftwoodComb Softwood NDPonderosa PinePonderosa PinePonderosa Pine & Other SpeciesPonderosa Pine - CDPacific Silver Fir
116,685.50 33,588.55
240,288.44 64,908.88
3,818.00 .00
701.93 122.94 690.00
193,320.00 4,769.73
28,312.00 1,452.00
10,557.31 .00
125.00 11,116.52
940.00 8,157.96 1,291.81
11,490.49 512.46
1,880.00 40.00 80.00 25.00
2,606.90 20,298.01
.00 142.50
14,570.00 217.80
1,095.00 .00
11,115.00 13,081.59
1,580.00 12,402.00
2,107.60 18,560.00
6,300.00 800.00
20,150.92 4,183.91 7,665.25 6,695.95 1,508.11
.00 92.64
491.70 176.64
26,451.00 128.25
5,288.04 133.40 449.80
.00 25.00
902.54 188.00
1,136.39 241.01
3,996.53 93.44
159.80 8.00 6.80 1.00
2,524.29 4,217.37
.00 15.00
4,760.78 17.14
219.00 .00
1,778.40 3,971.40
62.41 922.20 265.60
4,604.90 497.70
34.00
(CCF)(MBF) 11,584.50
2,035.47 4,381.91 3,354.07
954.50 .00
58.52 .00
69.00 13,754.52
67.40 2,856.96
67.40 224.90
.00 13.00
572.60 94.00
544.18 108.45
2,529.79 36.50 83.09
3.92 4.00
.64 1,596.98 2,334.02
.00 7.50
2,981.00 8.57
87.60 .00
1,125.73 2,219.38
50.17 472.66 167.19
1,848.20 315.00
17.68
CutVolume
CutValue ($)
Cut
158,447.98 46,683.05
478,545.73 70,959.71
3,828.00 520.00 701.93
.00 750.00
199,290.00 4,254.38
28,932.00 1,727.00 7,300.80
15.00 .00
3,275.00 940.00
8,302.42 82.32
12,818.70 .00
1,920.00 40.00 80.00
.00 3,659.74
22,586.25 360.00 332.50
14,570.00 592.80
1,095.00 540.00
11,525.00 13,253.40
1,580.00 19,146.10
2,658.98 25,526.55
6,300.00 .00
28,032.30 5,040.79
15,057.57 7,126.28 1,512.06
26.00 92.64
.00 192.00
26,519.60 124.00
5,414.04 170.40 202.80
.79 .00
274.13 188.00
1,342.20 27.44
3,857.15 .00
163.20 8.00 6.80
.00 3,772.29 3,390.65
90.00 32.40
4,760.78 97.14
219.00 21.33
1,844.00 1,627.39
62.41 1,368.23
313.20 5,672.71
497.70 .00
15,922.73 2,484.87 8,358.11 3,574.40
957.00 13.00 58.52
.00 75.00
13,790.38 65.20
2,926.79 86.80
101.40 .50 .00
173.50 94.00
633.73 12.35
2,441.09 .00
84.87 3.92 4.00
.00 2,286.51 1,994.50
45.00 17.50
2,981.00 48.57 87.60 13.50
1,167.44 1,004.66
50.20 699.67 198.89
2,336.29 315.00
.00
Volume(CCF)(MBF)
SoldVolume
SoldValue ($)
Sold
07 Fuelwood (Continued)
Per(MBF)
Sold ($)Per
(CCF)
Sold ($)
9.95 18.79 57.26 19.85
4.00 40.00 11.99
.00 10.00 14.45 65.25
9.89 19.90 72.00 30.00
.00 18.88 10.00 13.10
6.67 5.25
.00 22.62 10.20 20.00
.00 1.60
11.32 8.00
19.00 4.89
12.21 12.50 40.00
9.87 13.19 31.47 27.36 13.37 10.93 20.00
.00
5.65 9.26
31.78 9.96 2.53
20.00 7.58
.00 3.91 7.51
34.31 5.34
10.13 36.00 18.99
.00 11.95
5.00 6.19 3.00 3.32
.00 11.76
5.00 11.76
.00 .97
6.66 4.00
10.26 3.06 6.10 5.00
25.32 6.25 8.14
25.32 13.99
8.49 4.50
12.66 .00
SERVICE-WIDE (Continued)
PRODUCT & SPECIES CONVERTIBLE (Continued)
*****Note: As of 3rd quarter FY19, Volumes for Good Neighbor (GN) sales are included but values for GN sales are not included. Therefore total value and value/volume do not reflect true values. Do not use this report to determine unit values. *****
Page: Run Date:Filter:
Report Type:
Cut and Sold (New) - CUTS203S
11 of 08/11/2021 02:57 PM
Cumulative FY 2021 Q1 to FY 2021 Q4 as of 2021 3rd quarter
All Sales ,All Sales Quarterly 56
Species
Species
Code
Code
Description
Description
Volume
Volume
RCSSSSWDCWFXXYCZZC
**A0740108180AADDAFASBSCEDCOMSCSCSFWCSWDDEADDFDF1DFWESES1ESHFWHWDLGHLI
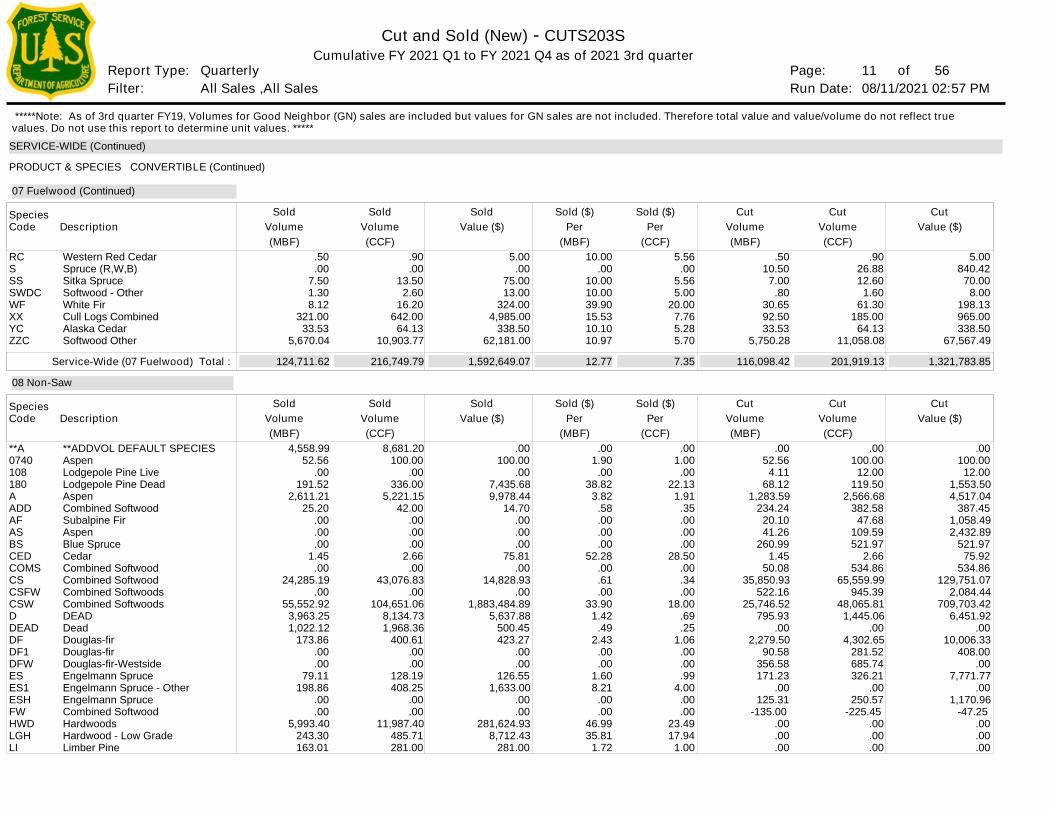
Western Red CedarSpruce (R,W,B)Sitka SpruceSoftwood - OtherWhite FirCull Logs CombinedAlaska CedarSoftwood Other
**ADDVOL DEFAULT SPECIESAspenLodgepole Pine LiveLodgepole Pine DeadAspenCombined SoftwoodSubalpine FirAspenBlue SpruceCedarCombined SoftwoodCombined SoftwoodCombined SoftwoodsCombined SoftwoodsDEADDeadDouglas-firDouglas-firDouglas-fir-WestsideEngelmann SpruceEngelmann Spruce - OtherEngelmann SpruceCombined SoftwoodHardwoodsHardwood - Low GradeLimber Pine
5.00 840.42
70.00 8.00
198.13 965.00 338.50
67,567.49
.00 100.00
12.00 1,553.50 4,517.04
387.45 1,058.49 2,432.89
521.97 75.92
534.86 129,751.07
2,084.44 709,703.42
6,451.92 .00
10,006.33 408.00
.00 7,771.77
.00 1,170.96
-47.25 .00 .00 .00
.90 26.88 12.60
1.60 61.30
185.00 64.13
11,058.08
.00 100.00
12.00 119.50
2,566.68 382.58
47.68 109.59 521.97
2.66 534.86
65,559.99 945.39
48,065.81 1,445.06
.00 4,302.65
281.52 685.74 326.21
.00 250.57
-225.45 .00 .00 .00
(CCF)
(CCF)
(MBF)
(MBF)
.50 10.50
7.00 .80
30.65 92.50 33.53
5,750.28
.00 52.56
4.11 68.12
1,283.59 234.24
20.10 41.26
260.99 1.45
50.08 35,850.93
522.16 25,746.52
795.93 .00
2,279.50 90.58
356.58 171.23
.00 125.31
-135.00 .00 .00 .00
Service-Wide (07 Fuelwood) Total :
Cut
Cut
Volume
Volume
Cut
Cut
Value ($)
Value ($)
Cut
Cut
5.00 .00
75.00 13.00
324.00 4,985.00
338.50 62,181.00
.00 100.00
.00 7,435.68 9,978.44
14.70 .00 .00 .00
75.81 .00
14,828.93 .00
1,883,484.89 5,637.88
500.45 423.27
.00 .00
126.55 1,633.00
.00 .00
281,624.93 8,712.43
281.00
.90 .00
13.50 2.60
16.20 642.00
64.13 10,903.77
8,681.20 100.00
.00 336.00
5,221.15 42.00
.00 .00 .00
2.66 .00
43,076.83 .00
104,651.06 8,134.73 1,968.36
400.61 .00 .00
128.19 408.25
.00 .00
11,987.40 485.71 281.00
.50 .00
7.50 1.30 8.12
321.00 33.53
5,670.04
4,558.99 52.56
.00 191.52
2,611.21 25.20
.00 .00 .00
1.45 .00
24,285.19 .00
55,552.92 3,963.25 1,022.12
173.86 .00 .00
79.11 198.86
.00 .00
5,993.40 243.30 163.01
Volume
Volume
(CCF)
(CCF)
(MBF)
(MBF)
Sold
Sold
Volume
Volume
Sold
Sold
Value ($)
Value ($)
Sold
Sold
124,711.62 216,749.79 1,592,649.07 116,098.42 201,919.13 1,321,783.85
07 Fuelwood (Continued)
08 Non-Saw
Per
Per
(MBF)
(MBF)
Sold ($)
Sold ($)
Per
Per
(CCF)
(CCF)
Sold ($)
Sold ($)
10.00 .00
10.00 10.00 39.90 15.53 10.10 10.97
.00 1.90
.00 38.82
3.82 .58 .00 .00 .00
52.28 .00 .61 .00
33.90 1.42
.49 2.43
.00 .00
1.60 8.21
.00 .00
46.99 35.81
1.72
12.77
5.56 .00
5.56 5.00
20.00 7.76 5.28 5.70
.00 1.00
.00 22.13
1.91 .35 .00 .00 .00
28.50 .00 .34 .00
18.00 .69 .25
1.06 .00 .00 .99
4.00 .00 .00
23.49 17.94
1.00
7.35
SERVICE-WIDE (Continued)
PRODUCT & SPECIES CONVERTIBLE (Continued)
*****Note: As of 3rd quarter FY19, Volumes for Good Neighbor (GN) sales are included but values for GN sales are not included. Therefore total value and value/volume do not reflect true values. Do not use this report to determine unit values. *****
Page: Run Date:Filter:
Report Type:
Cut and Sold (New) - CUTS203S
12 of 08/11/2021 02:57 PM
Cumulative FY 2021 Q1 to FY 2021 Q4 as of 2021 3rd quarter
All Sales ,All Sales Quarterly 56
Species
Species
Species
Code
Code
Code
Description
Description
Description
Volume
Volume
Volume
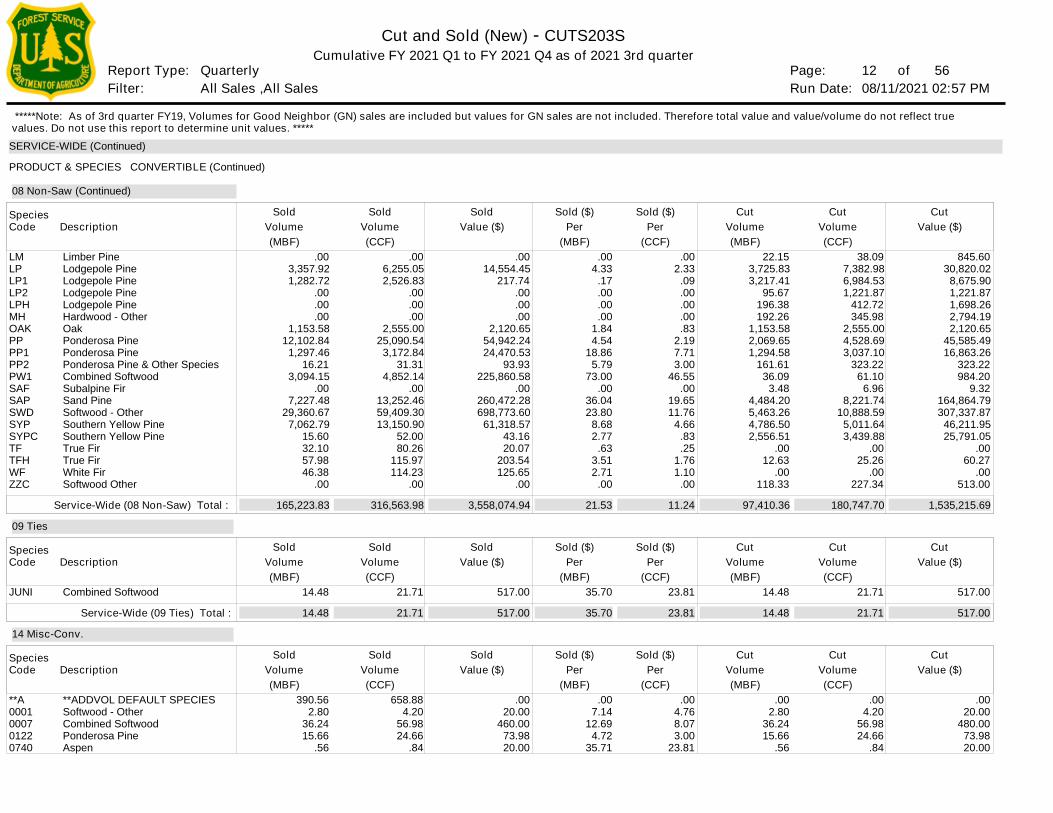
LMLPLP1LP2LPHMHOAKPPPP1PP2PW1SAFSAPSWDSYPSYPCTFTFHWFZZC
JUNI
**A0001000701220740
Limber PineLodgepole PineLodgepole PineLodgepole PineLodgepole PineHardwood - OtherOakPonderosa PinePonderosa PinePonderosa Pine & Other SpeciesCombined SoftwoodSubalpine FirSand PineSoftwood - OtherSouthern Yellow PineSouthern Yellow PineTrue FirTrue FirWhite FirSoftwood Other
Combined Softwood
**ADDVOL DEFAULT SPECIESSoftwood - OtherCombined SoftwoodPonderosa PineAspen
845.60 30,820.02
8,675.90 1,221.87 1,698.26 2,794.19 2,120.65
45,585.49 16,863.26
323.22 984.20
9.32 164,864.79 307,337.87
46,211.95 25,791.05
.00 60.27
.00 513.00
517.00
.00 20.00
480.00 73.98 20.00
38.09 7,382.98 6,984.53 1,221.87
412.72 345.98
2,555.00 4,528.69 3,037.10
323.22 61.10
6.96 8,221.74
10,888.59 5,011.64 3,439.88
.00 25.26
.00 227.34
21.71
.00 4.20
56.98 24.66
.84
(CCF)
(CCF)
(CCF)
(MBF)
(MBF)
(MBF)
22.15 3,725.83 3,217.41
95.67 196.38 192.26
1,153.58 2,069.65 1,294.58
161.61 36.09
3.48 4,484.20 5,463.26 4,786.50 2,556.51
.00 12.63
.00 118.33
14.48
.00 2.80
36.24 15.66
.56
Service-Wide (08 Non-Saw) Total :
Service-Wide (09 Ties) Total :
Cut
Cut
Cut
Volume
Volume
Volume
Cut
Cut
Cut
Value ($)
Value ($)
Value ($)
Cut
Cut
Cut
.00 14,554.45
217.74 .00 .00 .00
2,120.65 54,942.24 24,470.53
93.93 225,860.58
.00 260,472.28 698,773.60
61,318.57 43.16 20.07
203.54 125.65
.00
517.00
.00 20.00
460.00 73.98 20.00
.00 6,255.05 2,526.83
.00 .00 .00
2,555.00 25,090.54
3,172.84 31.31
4,852.14 .00
13,252.46 59,409.30 13,150.90
52.00 80.26
115.97 114.23
.00
21.71
658.88 4.20
56.98 24.66
.84
.00 3,357.92 1,282.72
.00 .00 .00
1,153.58 12,102.84
1,297.46 16.21
3,094.15 .00
7,227.48 29,360.67
7,062.79 15.60 32.10 57.98 46.38
.00
14.48
390.56 2.80
36.24 15.66
.56
Volume
Volume
Volume
(CCF)
(CCF)
(CCF)
(MBF)
(MBF)
(MBF)
Sold
Sold
Sold
Volume
Volume
Volume
Sold
Sold
Sold
Value ($)
Value ($)
Value ($)
Sold
Sold
Sold
165,223.83
14.48
316,563.98
21.71
3,558,074.94
517.00
97,410.36
14.48
180,747.70
21.71
1,535,215.69
517.00
08 Non-Saw (Continued)
09 Ties
14 Misc-Conv.
Per
Per
Per
(MBF)
(MBF)
(MBF)
Sold ($)
Sold ($)
Sold ($)
Per
Per
Per
(CCF)
(CCF)
(CCF)
Sold ($)
Sold ($)
Sold ($)
.00 4.33
.17 .00 .00 .00
1.84 4.54
18.86 5.79
73.00 .00
36.04 23.80
8.68 2.77
.63 3.51 2.71
.00
35.70
.00 7.14
12.69 4.72
35.71
21.53
35.70
.00 2.33
.09 .00 .00 .00 .83
2.19 7.71 3.00
46.55 .00
19.65 11.76
4.66 .83 .25
1.76 1.10
.00
23.81
.00 4.76 8.07 3.00
23.81
11.24
23.81
SERVICE-WIDE (Continued)
PRODUCT & SPECIES CONVERTIBLE (Continued)
*****Note: As of 3rd quarter FY19, Volumes for Good Neighbor (GN) sales are included but values for GN sales are not included. Therefore total value and value/volume do not reflect true values. Do not use this report to determine unit values. *****
Page: Run Date:Filter:
Report Type:
Cut and Sold (New) - CUTS203S
13 of 08/11/2021 02:57 PM
Cumulative FY 2021 Q1 to FY 2021 Q4 as of 2021 3rd quarter
All Sales ,All Sales Quarterly 56
Species
Species
Code
Code
Description
Description
Volume
Volume
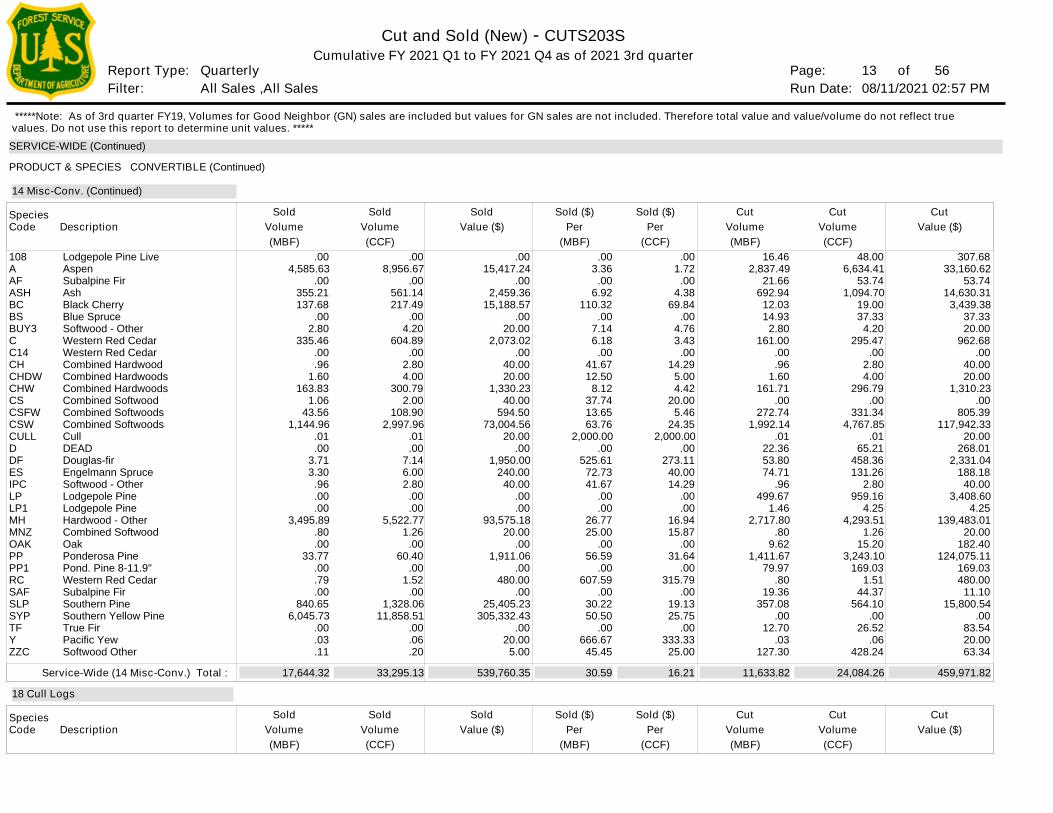
108AAFASHBCBSBUY3CC14CHCHDWCHWCSCSFWCSWCULLDDFESIPCLPLP1MHMNZOAKPPPP1RCSAFSLPSYPTFYZZC
Lodgepole Pine LiveAspenSubalpine FirAshBlack CherryBlue SpruceSoftwood - OtherWestern Red CedarWestern Red CedarCombined HardwoodCombined HardwoodsCombined HardwoodsCombined SoftwoodCombined SoftwoodsCombined SoftwoodsCullDEADDouglas-firEngelmann SpruceSoftwood - OtherLodgepole PineLodgepole PineHardwood - OtherCombined SoftwoodOakPonderosa PinePond. Pine 8-11.9"Western Red CedarSubalpine FirSouthern PineSouthern Yellow PineTrue FirPacific YewSoftwood Other
307.68 33,160.62
53.74 14,630.31
3,439.38 37.33 20.00
962.68 .00
40.00 20.00
1,310.23 .00
805.39 117,942.33
20.00 268.01
2,331.04 188.18
40.00 3,408.60
4.25 139,483.01
20.00 182.40
124,075.11 169.03 480.00
11.10 15,800.54
.00 83.54 20.00 63.34
48.00 6,634.41
53.74 1,094.70
19.00 37.33
4.20 295.47
.00 2.80 4.00
296.79 .00
331.34 4,767.85
.01 65.21
458.36 131.26
2.80 959.16
4.25 4,293.51
1.26 15.20
3,243.10 169.03
1.51 44.37
564.10 .00
26.52 .06
428.24
(CCF)
(CCF)
(MBF)
(MBF)
16.46 2,837.49
21.66 692.94
12.03 14.93
2.80 161.00
.00 .96
1.60 161.71
.00 272.74
1,992.14 .01
22.36 53.80 74.71
.96 499.67
1.46 2,717.80
.80 9.62
1,411.67 79.97
.80 19.36
357.08 .00
12.70 .03
127.30
Service-Wide (14 Misc-Conv.) Total :
Cut
Cut
Volume
Volume
Cut
Cut
Value ($)
Value ($)
Cut
Cut
.00 15,417.24
.00 2,459.36
15,188.57 .00
20.00 2,073.02
.00 40.00 20.00
1,330.23 40.00
594.50 73,004.56
20.00 .00
1,950.00 240.00
40.00 .00 .00
93,575.18 20.00
.00 1,911.06
.00 480.00
.00 25,405.23
305,332.43 .00
20.00 5.00
.00 8,956.67
.00 561.14 217.49
.00 4.20
604.89 .00
2.80 4.00
300.79 2.00
108.90 2,997.96
.01 .00
7.14 6.00 2.80
.00 .00
5,522.77 1.26
.00 60.40
.00 1.52
.00 1,328.06
11,858.51 .00 .06 .20
.00 4,585.63
.00 355.21 137.68
.00 2.80
335.46 .00 .96
1.60 163.83
1.06 43.56
1,144.96 .01 .00
3.71 3.30
.96 .00 .00
3,495.89 .80 .00
33.77 .00 .79 .00
840.65 6,045.73
.00 .03 .11
Volume
Volume
(CCF)
(CCF)
(MBF)
(MBF)
Sold
Sold
Volume
Volume
Sold
Sold
Value ($)
Value ($)
Sold
Sold
17,644.32 33,295.13 539,760.35 11,633.82 24,084.26 459,971.82
14 Misc-Conv. (Continued)
18 Cull Logs
Per
Per
(MBF)
(MBF)
Sold ($)
Sold ($)
Per
Per
(CCF)
(CCF)
Sold ($)
Sold ($)
.00 3.36
.00 6.92
110.32 .00
7.14 6.18
.00 41.67 12.50
8.12 37.74 13.65 63.76
2,000.00 .00
525.61 72.73 41.67
.00 .00
26.77 25.00
.00 56.59
.00 607.59
.00 30.22 50.50
.00 666.67
45.45
30.59
.00 1.72
.00 4.38
69.84 .00
4.76 3.43
.00 14.29
5.00 4.42
20.00 5.46
24.35 2,000.00
.00 273.11
40.00 14.29
.00 .00
16.94 15.87
.00 31.64
.00 315.79
.00 19.13 25.75
.00 333.33
25.00
16.21
SERVICE-WIDE (Continued)
PRODUCT & SPECIES CONVERTIBLE (Continued)
*****Note: As of 3rd quarter FY19, Volumes for Good Neighbor (GN) sales are included but values for GN sales are not included. Therefore total value and value/volume do not reflect true values. Do not use this report to determine unit values. *****
Page: Run Date:Filter:
Report Type:
Cut and Sold (New) - CUTS203S
14 of 08/11/2021 02:57 PM
Cumulative FY 2021 Q1 to FY 2021 Q4 as of 2021 3rd quarter
All Sales ,All Sales Quarterly 56
Species
Species
Code
Code
Description
Description
Volume
Volume
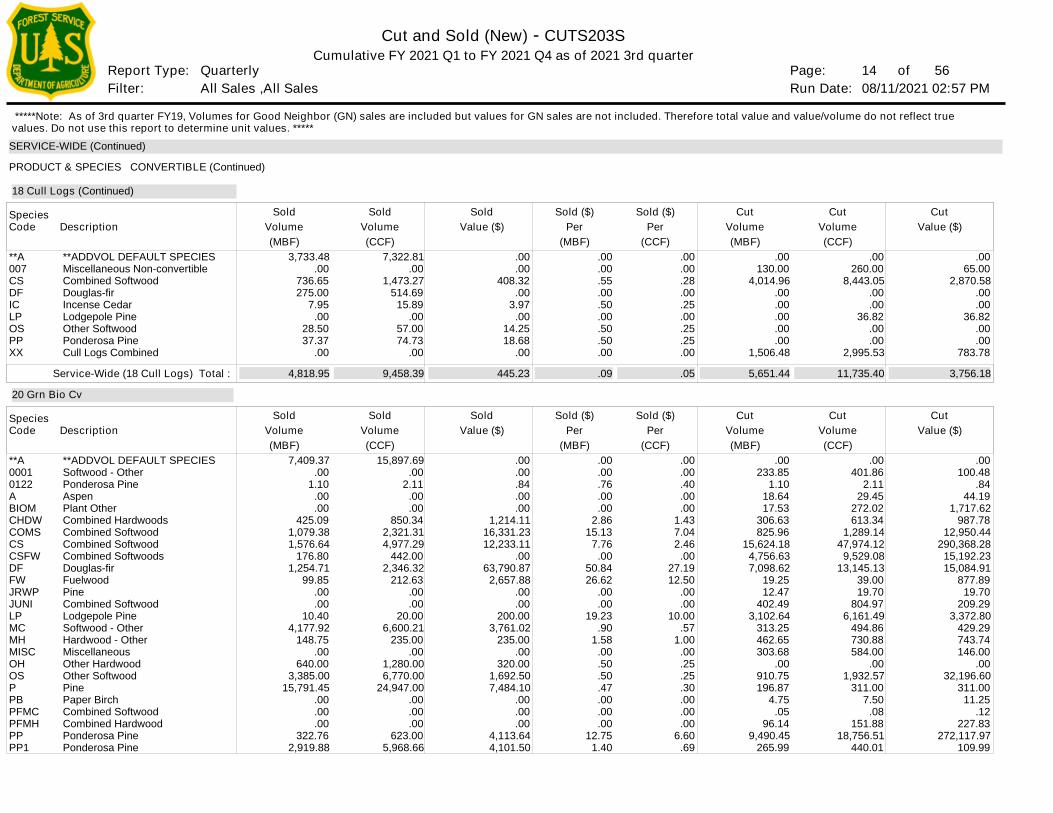
**A007CSDFICLPOSPPXX
**A00010122ABIOMCHDWCOMSCSCSFWDFFWJRWPJUNILPMCMHMISCOHOSPPBPFMCPFMHPPPP1
**ADDVOL DEFAULT SPECIESMiscellaneous Non-convertibleCombined SoftwoodDouglas-firIncense CedarLodgepole PineOther SoftwoodPonderosa PineCull Logs Combined
**ADDVOL DEFAULT SPECIESSoftwood - OtherPonderosa PineAspenPlant OtherCombined HardwoodsCombined SoftwoodCombined SoftwoodCombined SoftwoodsDouglas-firFuelwoodPineCombined SoftwoodLodgepole PineSoftwood - OtherHardwood - OtherMiscellaneousOther HardwoodOther SoftwoodPinePaper BirchCombined SoftwoodCombined HardwoodPonderosa PinePonderosa Pine
.00 65.00
2,870.58 .00 .00
36.82 .00 .00
783.78
.00 100.48
.84 44.19
1,717.62 987.78
12,950.44 290,368.28
15,192.23 15,084.91
877.89 19.70
209.29 3,372.80
429.29 743.74 146.00
.00 32,196.60
311.00 11.25
.12 227.83
272,117.97 109.99
.00 260.00
8,443.05 .00 .00
36.82 .00 .00
2,995.53
.00 401.86
2.11 29.45
272.02 613.34
1,289.14 47,974.12
9,529.08 13,145.13
39.00 19.70
804.97 6,161.49
494.86 730.88 584.00
.00 1,932.57
311.00 7.50
.08 151.88
18,756.51 440.01
(CCF)
(CCF)
(MBF)
(MBF)
.00 130.00
4,014.96 .00 .00 .00 .00 .00
1,506.48
.00 233.85
1.10 18.64 17.53
306.63 825.96
15,624.18 4,756.63 7,098.62
19.25 12.47
402.49 3,102.64
313.25 462.65 303.68
.00 910.75 196.87
4.75 .05
96.14 9,490.45
265.99
Service-Wide (18 Cull Logs) Total :
Cut
Cut
Volume
Volume
Cut
Cut
Value ($)
Value ($)
Cut
Cut
.00 .00
408.32 .00
3.97 .00
14.25 18.68
.00
.00 .00 .84 .00 .00
1,214.11 16,331.23 12,233.11
.00 63,790.87
2,657.88 .00 .00
200.00 3,761.02
235.00 .00
320.00 1,692.50 7,484.10
.00 .00 .00
4,113.64 4,101.50
7,322.81 .00
1,473.27 514.69
15.89 .00
57.00 74.73
.00
15,897.69 .00
2.11 .00 .00
850.34 2,321.31 4,977.29
442.00 2,346.32
212.63 .00 .00
20.00 6,600.21
235.00 .00
1,280.00 6,770.00
24,947.00 .00 .00 .00
623.00 5,968.66
3,733.48 .00
736.65 275.00
7.95 .00
28.50 37.37
.00
7,409.37 .00
1.10 .00 .00
425.09 1,079.38 1,576.64
176.80 1,254.71
99.85 .00 .00
10.40 4,177.92
148.75 .00
640.00 3,385.00
15,791.45 .00 .00 .00
322.76 2,919.88
Volume
Volume
(CCF)
(CCF)
(MBF)
(MBF)
Sold
Sold
Volume
Volume
Sold
Sold
Value ($)
Value ($)
Sold
Sold
4,818.95 9,458.39 445.23 5,651.44 11,735.40 3,756.18
18 Cull Logs (Continued)
20 Grn Bio Cv
Per
Per
(MBF)
(MBF)
Sold ($)
Sold ($)
Per
Per
(CCF)
(CCF)
Sold ($)
Sold ($)
.00 .00 .55 .00 .50 .00 .50 .50 .00
.00 .00 .76 .00 .00
2.86 15.13
7.76 .00
50.84 26.62
.00 .00
19.23 .90
1.58 .00 .50 .50 .47 .00 .00 .00
12.75 1.40
.09
.00 .00 .28 .00 .25 .00 .25 .25 .00
.00 .00 .40 .00 .00
1.43 7.04 2.46
.00 27.19 12.50
.00 .00
10.00 .57
1.00 .00 .25 .25 .30 .00 .00 .00
6.60 .69
.05
SERVICE-WIDE (Continued)
PRODUCT & SPECIES CONVERTIBLE (Continued)
*****Note: As of 3rd quarter FY19, Volumes for Good Neighbor (GN) sales are included but values for GN sales are not included. Therefore total value and value/volume do not reflect true values. Do not use this report to determine unit values. *****
Page: Run Date:Filter:
Report Type:
Cut and Sold (New) - CUTS203S
15 of 08/11/2021 02:57 PM
Cumulative FY 2021 Q1 to FY 2021 Q4 as of 2021 3rd quarter
All Sales ,All Sales Quarterly 56
SpeciesCode Description Volume
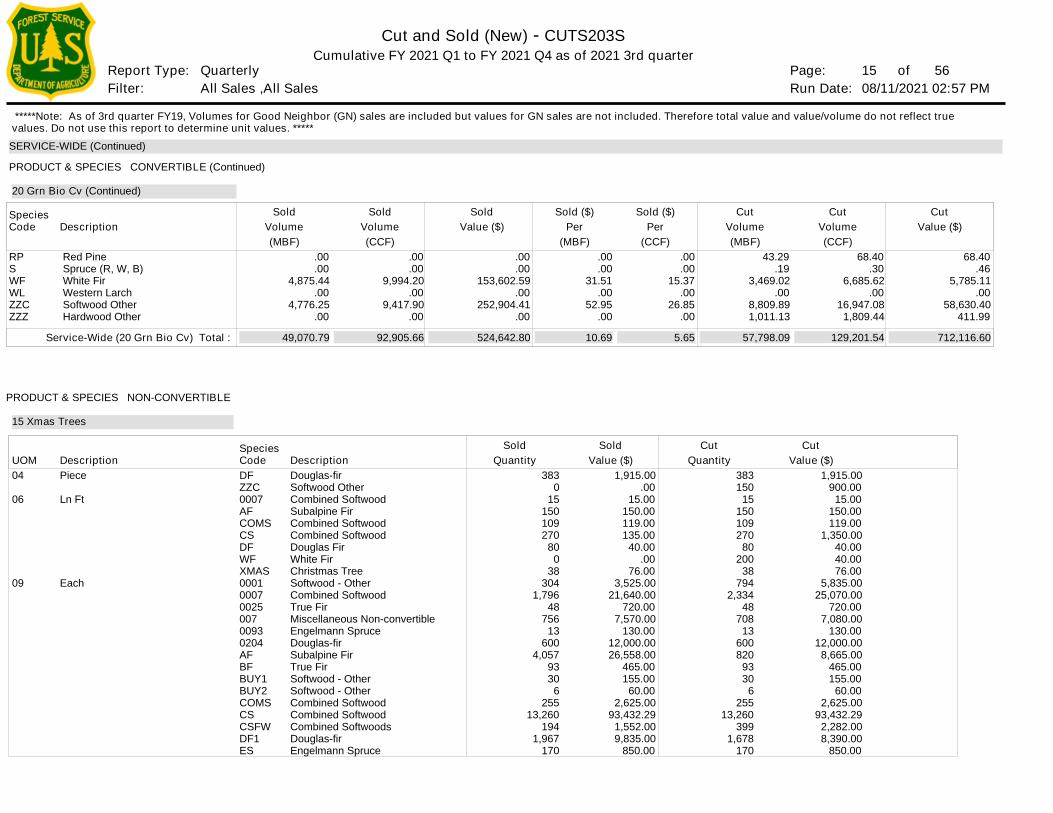
RPSWFWLZZCZZZ
Red PineSpruce (R, W, B)White FirWestern LarchSoftwood OtherHardwood Other
68.40 .46
5,785.11 .00
58,630.40 411.99
68.40 .30
6,685.62 .00
16,947.08 1,809.44
(CCF)(MBF) 43.29
.19 3,469.02
.00 8,809.89 1,011.13
Service-Wide (20 Grn Bio Cv) Total :
CutVolume
CutValue ($)
Cut
.00 .00
153,602.59 .00
252,904.41 .00
.00 .00
9,994.20 .00
9,417.90 .00
.00 .00
4,875.44 .00
4,776.25 .00
Volume(CCF)(MBF)
SoldVolume
SoldValue ($)
Sold
49,070.79 92,905.66 524,642.80 57,798.09 129,201.54 712,116.60
20 Grn Bio Cv (Continued)
Per(MBF)
Sold ($)Per
(CCF)
Sold ($)
.00 .00
31.51 .00
52.95 .00
10.69
.00 .00
15.37 .00
26.85 .00
5.65
SERVICE-WIDE (Continued)
PRODUCT & SPECIES CONVERTIBLE (Continued)
DescriptionDFZZC0007AFCOMSCSDFWFXMAS00010007002500700930204AFBFBUY1BUY2COMSCSCSFWDF1ES
Douglas-firSoftwood OtherCombined SoftwoodSubalpine FirCombined SoftwoodCombined SoftwoodDouglas FirWhite FirChristmas TreeSoftwood - OtherCombined SoftwoodTrue FirMiscellaneous Non-convertibleEngelmann SpruceDouglas-firSubalpine FirTrue FirSoftwood - OtherSoftwood - OtherCombined SoftwoodCombined SoftwoodCombined SoftwoodsDouglas-firEngelmann Spruce
1,915.00 900.00
15.00 150.00 119.00
1,350.00 40.00 40.00 76.00
5,835.00 25,070.00
720.00 7,080.00
130.00 12,000.00
8,665.00 465.00 155.00
60.00 2,625.00
93,432.29 2,282.00 8,390.00
850.00
383 150
15 150 109 270
80 200
38 794
2,334 48
708 13
600 820
93 30
6 255
13,260 399
1,678 170
QuantityCut
Value ($)Cut
1,915.00 .00
15.00 150.00 119.00 135.00
40.00 .00
76.00 3,525.00
21,640.00 720.00
7,570.00 130.00
12,000.00 26,558.00
465.00 155.00
60.00 2,625.00
93,432.29 1,552.00 9,835.00
850.00
383 0
15 150 109 270
80 0
38 304
1,796 48
756 13
600 4,057
93 30
6 255
13,260 194
1,967 170
QuantitySold
Value ($)Sold
15 Xmas Trees
PRODUCT & SPECIES NON-CONVERTIBLE
SpeciesCode
04
06
09
Piece
Ln Ft
Each
DescriptionUOM
*****Note: As of 3rd quarter FY19, Volumes for Good Neighbor (GN) sales are included but values for GN sales are not included. Therefore total value and value/volume do not reflect true values. Do not use this report to determine unit values. *****
Page: Run Date:Filter:
Report Type:
Cut and Sold (New) - CUTS203S
16 of 08/11/2021 02:57 PM
Cumulative FY 2021 Q1 to FY 2021 Q4 as of 2021 3rd quarter
All Sales ,All Sales Quarterly 56
SERVICE-WIDE (Continued)
Description
Description
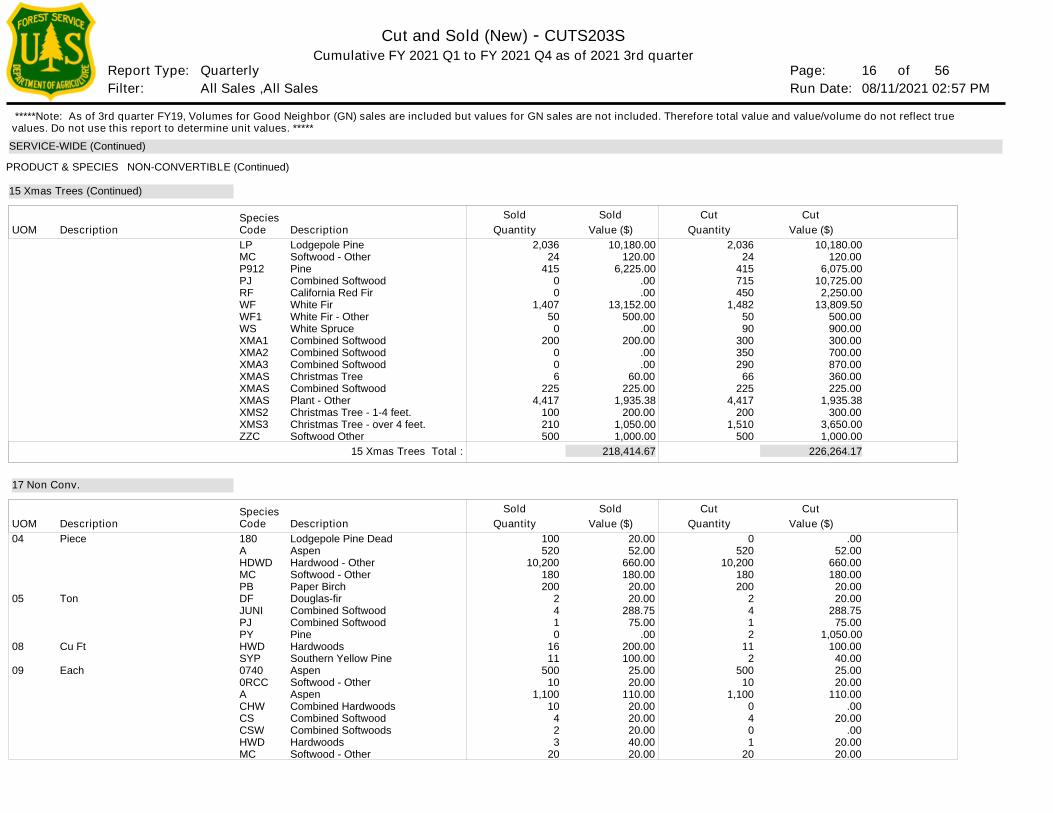
LPMCP912PJRFWFWF1WSXMA1XMA2XMA3XMASXMASXMASXMS2XMS3ZZC
180AHDWDMCPBDFJUNIPJPYHWDSYP07400RCCACHWCSCSWHWDMC
Lodgepole PineSoftwood - OtherPineCombined SoftwoodCalifornia Red FirWhite FirWhite Fir - OtherWhite SpruceCombined SoftwoodCombined SoftwoodCombined SoftwoodChristmas TreeCombined SoftwoodPlant - OtherChristmas Tree - 1-4 feet.Christmas Tree - over 4 feet.Softwood Other
Lodgepole Pine DeadAspenHardwood - OtherSoftwood - OtherPaper BirchDouglas-firCombined SoftwoodCombined SoftwoodPineHardwoodsSouthern Yellow PineAspenSoftwood - OtherAspenCombined HardwoodsCombined SoftwoodCombined SoftwoodsHardwoodsSoftwood - Other
10,180.00 120.00
6,075.00 10,725.00
2,250.00 13,809.50
500.00 900.00 300.00 700.00 870.00 360.00 225.00
1,935.38 300.00
3,650.00 1,000.00
.00 52.00
660.00 180.00
20.00 20.00
288.75 75.00
1,050.00 100.00
40.00 25.00 20.00
110.00 .00
20.00 .00
20.00 20.00
2,036 24
415 715 450
1,482 50 90
300 350 290
66 225
4,417 200
1,510 500
0 520
10,200 180 200
2 4 1 2
11 2
500 10
1,100 0 4 0 1
20
Quantity
Quantity
Cut
Cut
Value ($)
Value ($)
Cut
Cut
10,180.00 120.00
6,225.00 .00 .00
13,152.00 500.00
.00 200.00
.00 .00
60.00 225.00
1,935.38 200.00
1,050.00 1,000.00
20.00 52.00
660.00 180.00
20.00 20.00
288.75 75.00
.00 200.00 100.00
25.00 20.00
110.00 20.00 20.00 20.00 40.00 20.00
2,036 24
415 0 0
1,407 50
0 200
0 0 6
225 4,417
100 210 500
100 520
10,200 180 200
2 4 1 0
16 11
500 10
1,100 10
4 2 3
20
Quantity
Quantity
Sold
Sold
Value ($)
Value ($)
Sold
Sold
218,414.67 226,264.17
15 Xmas Trees (Continued)
17 Non Conv.
PRODUCT & SPECIES NON-CONVERTIBLE (Continued)
Species
Species
Code
Code04
05
08
09
Piece
Ton
Cu Ft
Each
Description
Description
UOM
UOM
15 Xmas Trees Total :
*****Note: As of 3rd quarter FY19, Volumes for Good Neighbor (GN) sales are included but values for GN sales are not included. Therefore total value and value/volume do not reflect true values. Do not use this report to determine unit values. *****
Page: Run Date:Filter:
Report Type:
Cut and Sold (New) - CUTS203S
17 of 08/11/2021 02:57 PM
Cumulative FY 2021 Q1 to FY 2021 Q4 as of 2021 3rd quarter
All Sales ,All Sales Quarterly 56
SERVICE-WIDE (Continued)
Description
Description
Description
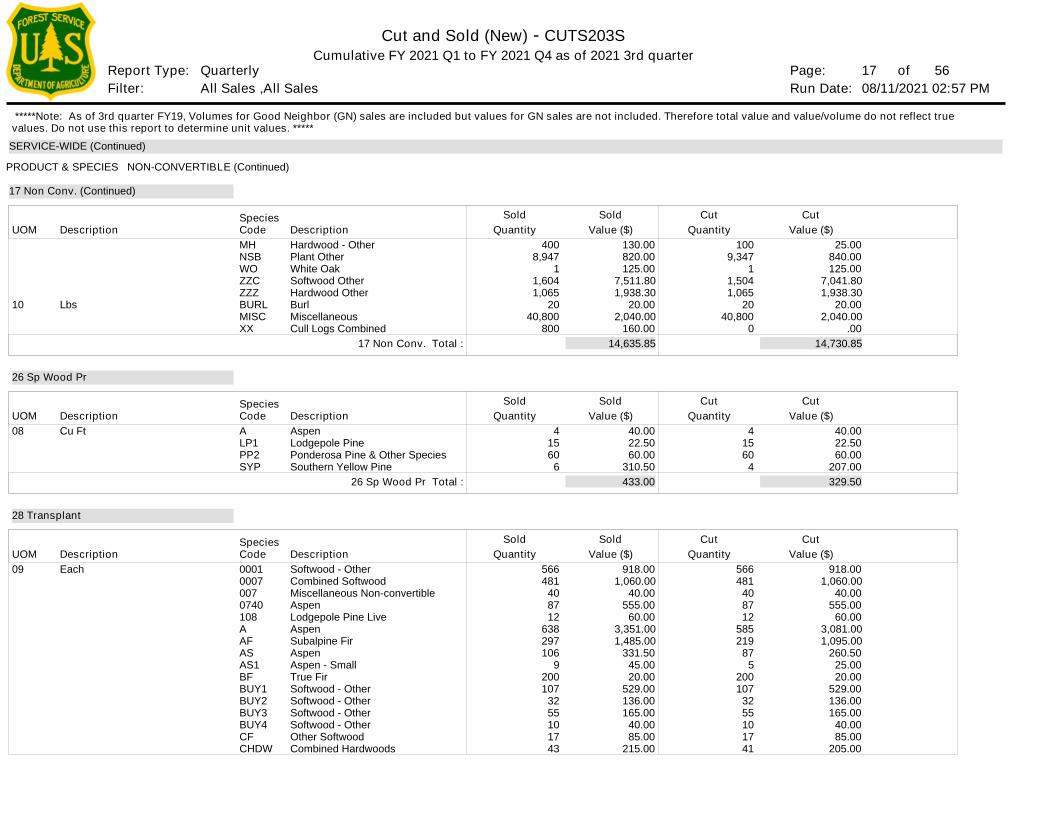
MHNSBWOZZCZZZBURLMISCXX
ALP1PP2SYP
000100070070740108AAFASAS1BFBUY1BUY2BUY3BUY4CFCHDW
Hardwood - OtherPlant OtherWhite OakSoftwood OtherHardwood OtherBurlMiscellaneousCull Logs Combined
AspenLodgepole PinePonderosa Pine & Other SpeciesSouthern Yellow Pine
Softwood - OtherCombined SoftwoodMiscellaneous Non-convertibleAspenLodgepole Pine LiveAspenSubalpine FirAspenAspen - SmallTrue FirSoftwood - OtherSoftwood - OtherSoftwood - OtherSoftwood - OtherOther SoftwoodCombined Hardwoods
25.00 840.00 125.00
7,041.80 1,938.30
20.00 2,040.00
.00
40.00 22.50 60.00
207.00
918.00 1,060.00
40.00 555.00
60.00 3,081.00 1,095.00
260.50 25.00 20.00
529.00 136.00 165.00
40.00 85.00
205.00
100 9,347
1 1,504 1,065
20 40,800
0
4 15 60
4
566 481
40 87 12
585 219
87 5
200 107
32 55 10 17 41
Quantity
Quantity
Quantity
Cut
Cut
Cut
Value ($)
Value ($)
Value ($)
Cut
Cut
Cut
130.00 820.00 125.00
7,511.80 1,938.30
20.00 2,040.00
160.00
40.00 22.50 60.00
310.50
918.00 1,060.00
40.00 555.00
60.00 3,351.00 1,485.00
331.50 45.00 20.00
529.00 136.00 165.00
40.00 85.00
215.00
400 8,947
1 1,604 1,065
20 40,800
800
4 15 60
6
566 481
40 87 12
638 297 106
9 200 107
32 55 10 17 43
Quantity
Quantity
Quantity
Sold
Sold
Sold
Value ($)
Value ($)
Value ($)
Sold
Sold
Sold
14,635.85
433.00
14,730.85
329.50
17 Non Conv. (Continued)
26 Sp Wood Pr
28 Transplant
PRODUCT & SPECIES NON-CONVERTIBLE (Continued)
Species
Species
Species
Code
Code
Code
10
08
09
Lbs
Cu Ft
Each
Description
Description
Description
UOM
UOM
UOM
17 Non Conv. Total :
26 Sp Wood Pr Total :
*****Note: As of 3rd quarter FY19, Volumes for Good Neighbor (GN) sales are included but values for GN sales are not included. Therefore total value and value/volume do not reflect true values. Do not use this report to determine unit values. *****
Page: Run Date:Filter:
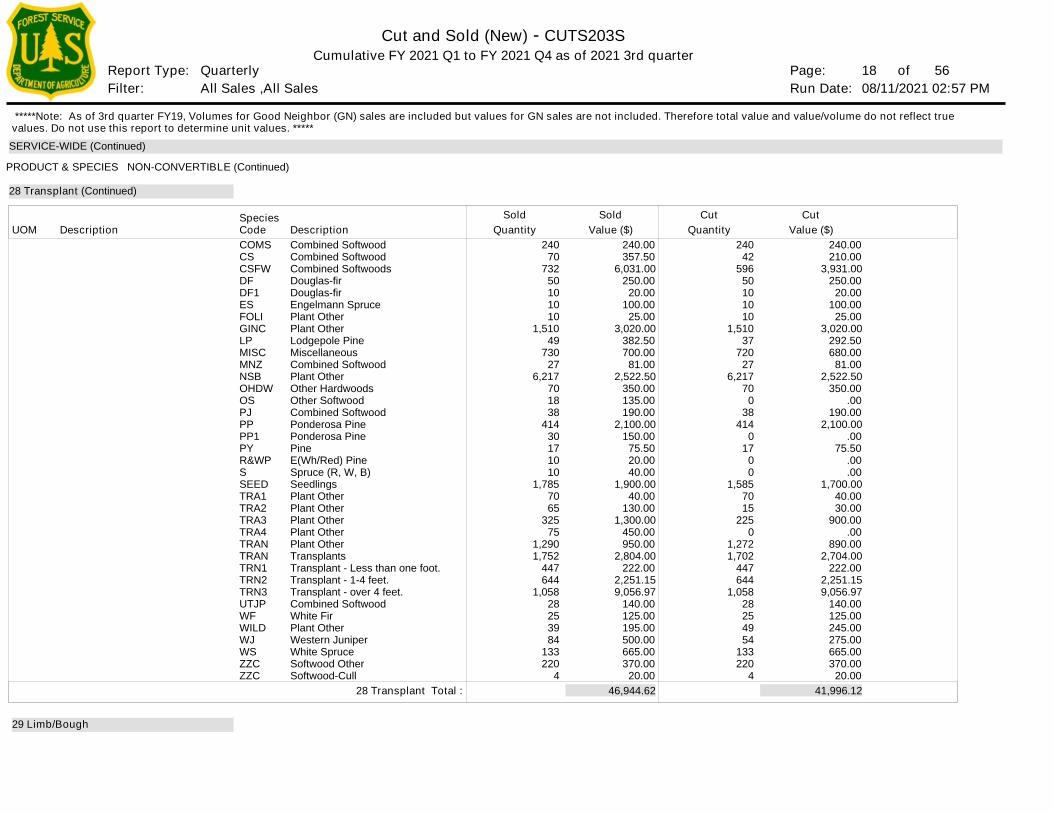
Report Type:
Cut and Sold (New) - CUTS203S
18 of 08/11/2021 02:57 PM
Cumulative FY 2021 Q1 to FY 2021 Q4 as of 2021 3rd quarter
All Sales ,All Sales Quarterly 56
SERVICE-WIDE (Continued)
DescriptionCOMSCSCSFWDFDF1ESFOLIGINCLPMISCMNZNSBOHDWOSPJPPPP1PYR&WPSSEEDTRA1TRA2TRA3TRA4TRANTRANTRN1TRN2TRN3UTJPWFWILDWJWSZZCZZC
Combined SoftwoodCombined SoftwoodCombined SoftwoodsDouglas-firDouglas-firEngelmann SprucePlant OtherPlant OtherLodgepole PineMiscellaneousCombined SoftwoodPlant OtherOther HardwoodsOther SoftwoodCombined SoftwoodPonderosa PinePonderosa PinePineE(Wh/Red) PineSpruce (R, W, B)SeedlingsPlant OtherPlant OtherPlant OtherPlant OtherPlant OtherTransplantsTransplant - Less than one foot.Transplant - 1-4 feet.Transplant - over 4 feet.Combined SoftwoodWhite FirPlant OtherWestern JuniperWhite SpruceSoftwood OtherSoftwood-Cull
240.00 210.00
3,931.00 250.00
20.00 100.00
25.00 3,020.00
292.50 680.00
81.00 2,522.50
350.00 .00
190.00 2,100.00
.00 75.50
.00 .00
1,700.00 40.00 30.00
900.00 .00
890.00 2,704.00
222.00 2,251.15 9,056.97
140.00 125.00 245.00 275.00 665.00 370.00
20.00
240 42
596 50 10 10 10
1,510 37
720 27
6,217 70
0 38
414 0
17 0 0
1,585 70 15
225 0
1,272 1,702
447 644
1,058 28 25 49 54
133 220
4
QuantityCut
Value ($)Cut
240.00 357.50
6,031.00 250.00
20.00 100.00
25.00 3,020.00
382.50 700.00
81.00 2,522.50
350.00 135.00 190.00
2,100.00 150.00
75.50 20.00 40.00
1,900.00 40.00
130.00 1,300.00
450.00 950.00
2,804.00 222.00
2,251.15 9,056.97
140.00 125.00 195.00 500.00 665.00 370.00
20.00
240 70
732 50 10 10 10
1,510 49
730 27
6,217 70 18 38
414 30 17 10 10
1,785 70 65
325 75
1,290 1,752
447 644
1,058 28 25 39 84
133 220
4
QuantitySold
Value ($)Sold
46,944.62 41,996.12
28 Transplant (Continued)
29 Limb/Bough
PRODUCT & SPECIES NON-CONVERTIBLE (Continued)
SpeciesCodeDescriptionUOM
28 Transplant Total :
*****Note: As of 3rd quarter FY19, Volumes for Good Neighbor (GN) sales are included but values for GN sales are not included. Therefore total value and value/volume do not reflect true values. Do not use this report to determine unit values. *****
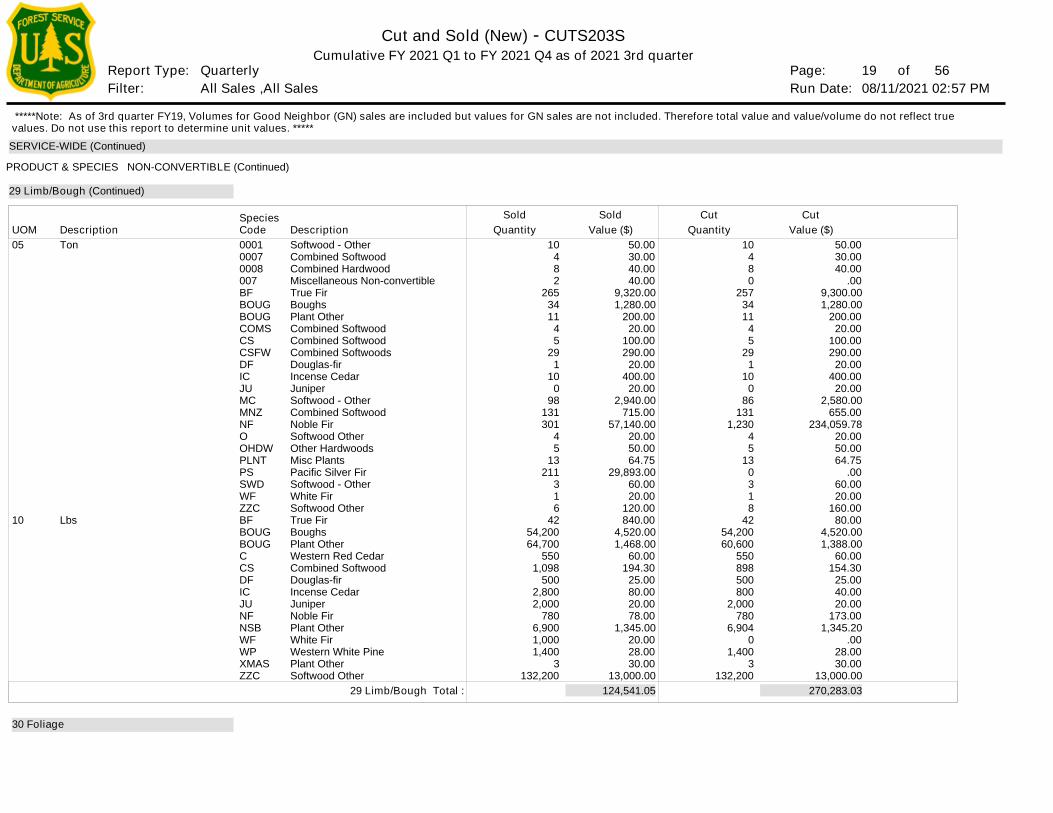
Page: Run Date:Filter:
Report Type:
Cut and Sold (New) - CUTS203S
19 of 08/11/2021 02:57 PM
Cumulative FY 2021 Q1 to FY 2021 Q4 as of 2021 3rd quarter
All Sales ,All Sales Quarterly 56
SERVICE-WIDE (Continued)
Description000100070008007BFBOUGBOUGCOMSCSCSFWDFICJUMCMNZNFOOHDWPLNTPSSWDWFZZCBFBOUGBOUGCCSDFICJUNFNSBWFWPXMASZZC
Softwood - OtherCombined SoftwoodCombined HardwoodMiscellaneous Non-convertibleTrue FirBoughsPlant OtherCombined SoftwoodCombined SoftwoodCombined SoftwoodsDouglas-firIncense CedarJuniperSoftwood - OtherCombined SoftwoodNoble FirSoftwood OtherOther HardwoodsMisc PlantsPacific Silver FirSoftwood - OtherWhite FirSoftwood OtherTrue FirBoughsPlant OtherWestern Red CedarCombined SoftwoodDouglas-firIncense CedarJuniperNoble FirPlant OtherWhite FirWestern White PinePlant OtherSoftwood Other
50.00 30.00 40.00
.00 9,300.00 1,280.00
200.00 20.00
100.00 290.00
20.00 400.00
20.00 2,580.00
655.00 234,059.78
20.00 50.00 64.75
.00 60.00 20.00
160.00 80.00
4,520.00 1,388.00
60.00 154.30
25.00 40.00 20.00
173.00 1,345.20
.00 28.00 30.00
13,000.00
10 4 8 0
257 34 11
4 5
29 1
10 0
86 131
1,230 4 5
13 0 3 1 8
42 54,200 60,600
550 898 500 800
2,000 780
6,904 0
1,400 3
132,200
QuantityCut
Value ($)Cut
50.00 30.00 40.00 40.00
9,320.00 1,280.00
200.00 20.00
100.00 290.00
20.00 400.00
20.00 2,940.00
715.00 57,140.00
20.00 50.00 64.75
29,893.00 60.00 20.00
120.00 840.00
4,520.00 1,468.00
60.00 194.30
25.00 80.00 20.00 78.00
1,345.00 20.00 28.00 30.00
13,000.00
10 4 8 2
265 34 11
4 5
29 1
10 0
98 131 301
4 5
13 211
3 1 6
42 54,200 64,700
550 1,098
500 2,800 2,000
780 6,900 1,000 1,400
3 132,200
QuantitySold
Value ($)Sold
124,541.05 270,283.03
29 Limb/Bough (Continued)
30 Foliage
PRODUCT & SPECIES NON-CONVERTIBLE (Continued)
SpeciesCode
05
10
Ton
Lbs
DescriptionUOM
29 Limb/Bough Total :
*****Note: As of 3rd quarter FY19, Volumes for Good Neighbor (GN) sales are included but values for GN sales are not included. Therefore total value and value/volume do not reflect true values. Do not use this report to determine unit values. *****
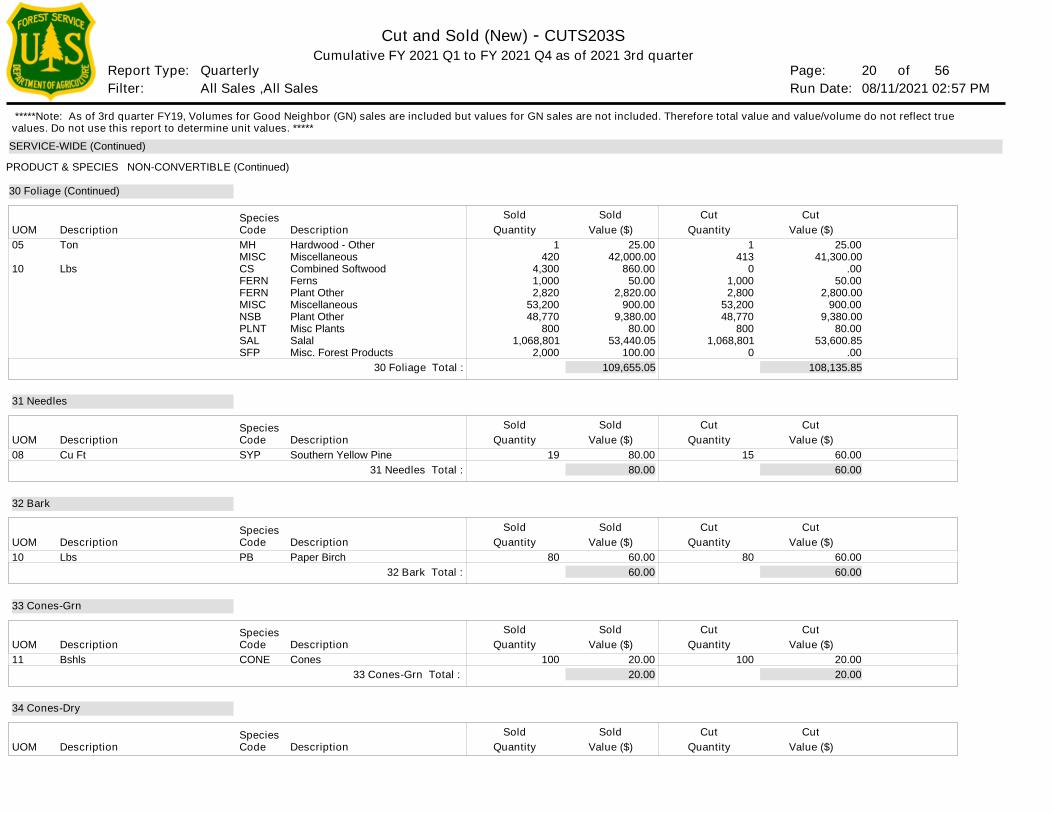
Page: Run Date:Filter:
Report Type:
Cut and Sold (New) - CUTS203S
20 of 08/11/2021 02:57 PM
Cumulative FY 2021 Q1 to FY 2021 Q4 as of 2021 3rd quarter
All Sales ,All Sales Quarterly 56
SERVICE-WIDE (Continued)
Description
Description
Description
Description
Description
MHMISCCSFERNFERNMISCNSBPLNTSALSFP
SYP
PB
CONE
Hardwood - OtherMiscellaneousCombined SoftwoodFernsPlant OtherMiscellaneousPlant OtherMisc PlantsSalalMisc. Forest Products
Southern Yellow Pine
Paper Birch
Cones
25.00 41,300.00
.00 50.00
2,800.00 900.00
9,380.00 80.00
53,600.85 .00
60.00
60.00
20.00
1 413
0 1,000 2,800
53,200 48,770
800 1,068,801
0
15
80
100
Quantity
Quantity
Quantity
Quantity
Quantity
Cut
Cut
Cut
Cut
Cut
Value ($)
Value ($)
Value ($)
Value ($)
Value ($)
Cut
Cut
Cut
Cut
Cut
25.00 42,000.00
860.00 50.00
2,820.00 900.00
9,380.00 80.00
53,440.05 100.00
80.00
60.00
20.00
1 420
4,300 1,000 2,820
53,200 48,770
800 1,068,801
2,000
19
80
100
Quantity
Quantity
Quantity
Quantity
Quantity
Sold
Sold
Sold
Sold
Sold
Value ($)
Value ($)
Value ($)
Value ($)
Value ($)
Sold
Sold
Sold
Sold
Sold
109,655.05
80.00
60.00
20.00
108,135.85
60.00
60.00
20.00
30 Foliage (Continued)
31 Needles
32 Bark
33 Cones-Grn
34 Cones-Dry
PRODUCT & SPECIES NON-CONVERTIBLE (Continued)
Species
Species
Species
Species
Species
Code
Code
Code
Code
Code
05
10
08
10
11
Ton
Lbs
Cu Ft
Lbs
Bshls
Description
Description
Description
Description
Description
UOM
UOM
UOM
UOM
UOM
30 Foliage Total :
31 Needles Total :
32 Bark Total :
33 Cones-Grn Total :
*****Note: As of 3rd quarter FY19, Volumes for Good Neighbor (GN) sales are included but values for GN sales are not included. Therefore total value and value/volume do not reflect true values. Do not use this report to determine unit values. *****
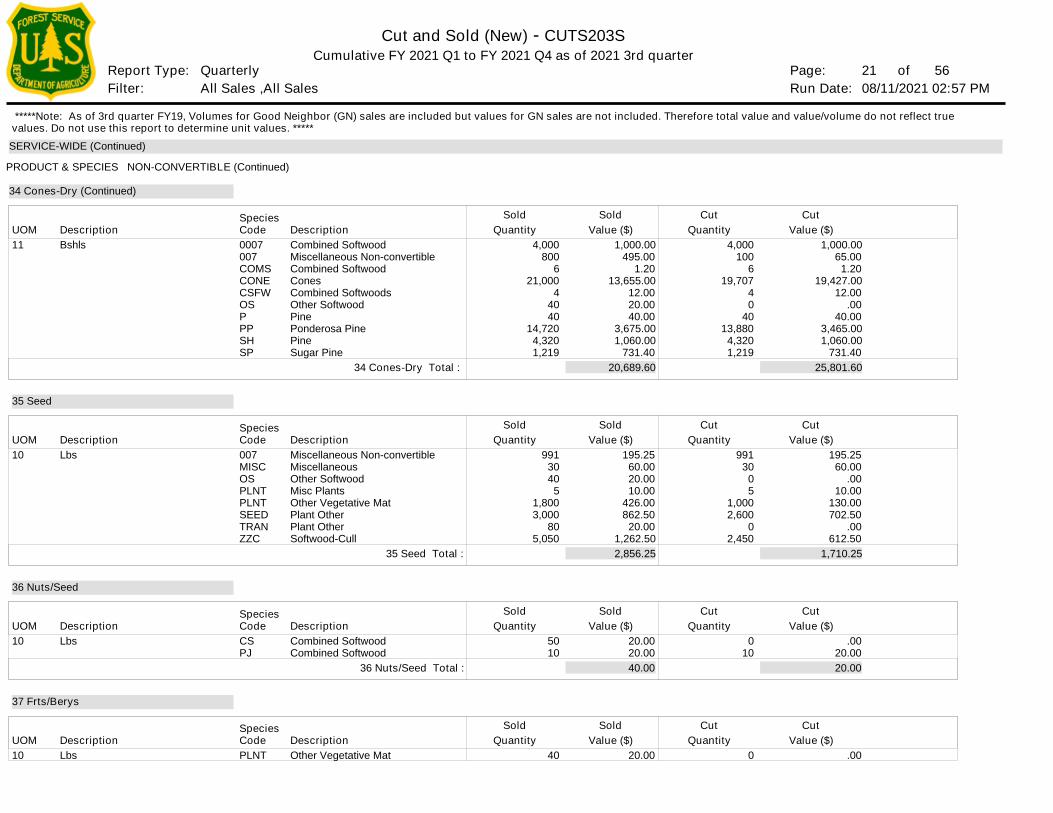
Page: Run Date:Filter:
Report Type:
Cut and Sold (New) - CUTS203S
21 of 08/11/2021 02:57 PM
Cumulative FY 2021 Q1 to FY 2021 Q4 as of 2021 3rd quarter
All Sales ,All Sales Quarterly 56
SERVICE-WIDE (Continued)
Description
Description
Description
Description
0007007COMSCONECSFWOSPPPSHSP
007MISCOSPLNTPLNTSEEDTRANZZC
CSPJ
PLNT
Combined SoftwoodMiscellaneous Non-convertibleCombined SoftwoodConesCombined SoftwoodsOther SoftwoodPinePonderosa PinePineSugar Pine
Miscellaneous Non-convertibleMiscellaneousOther SoftwoodMisc PlantsOther Vegetative MatPlant OtherPlant OtherSoftwood-Cull
Combined SoftwoodCombined Softwood
Other Vegetative Mat
1,000.00 65.00
1.20 19,427.00
12.00 .00
40.00 3,465.00 1,060.00
731.40
195.25 60.00
.00 10.00
130.00 702.50
.00 612.50
.00 20.00
.00
4,000 100
6 19,707
4 0
40 13,880
4,320 1,219
991 30
0 5
1,000 2,600
0 2,450
0 10
0
Quantity
Quantity
Quantity
Quantity
Cut
Cut
Cut
Cut
Value ($)
Value ($)
Value ($)
Value ($)
Cut
Cut
Cut
Cut
1,000.00 495.00
1.20 13,655.00
12.00 20.00 40.00
3,675.00 1,060.00
731.40
195.25 60.00 20.00 10.00
426.00 862.50
20.00 1,262.50
20.00 20.00
20.00
4,000 800
6 21,000
4 40 40
14,720 4,320 1,219
991 30 40
5 1,800 3,000
80 5,050
50 10
40
Quantity
Quantity
Quantity
Quantity
Sold
Sold
Sold
Sold
Value ($)
Value ($)
Value ($)
Value ($)
Sold
Sold
Sold
Sold
20,689.60
2,856.25
40.00
25,801.60
1,710.25
20.00
34 Cones-Dry (Continued)
35 Seed
36 Nuts/Seed
37 Frts/Berys
PRODUCT & SPECIES NON-CONVERTIBLE (Continued)
Species
Species
Species
Species
Code
Code
Code
Code
11
10
10
10
Bshls
Lbs
Lbs
Lbs
Description
Description
Description
Description
UOM
UOM
UOM
UOM
34 Cones-Dry Total :
35 Seed Total :
36 Nuts/Seed Total :
*****Note: As of 3rd quarter FY19, Volumes for Good Neighbor (GN) sales are included but values for GN sales are not included. Therefore total value and value/volume do not reflect true values. Do not use this report to determine unit values. *****
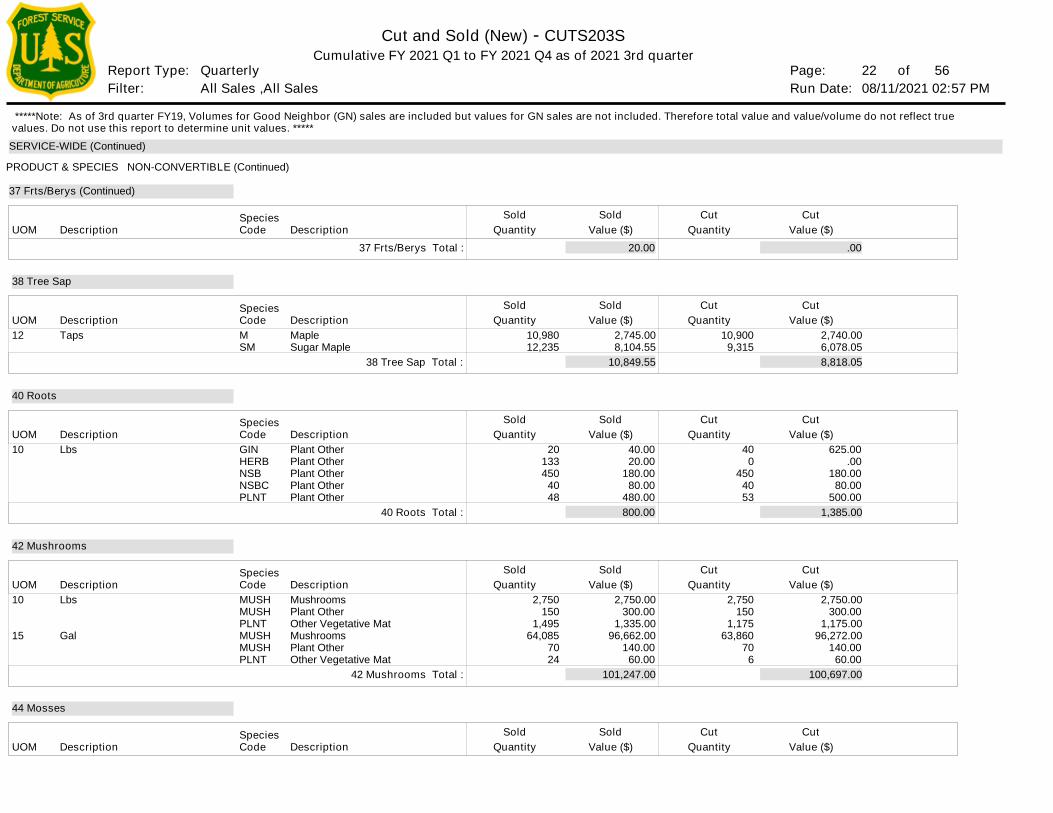
Page: Run Date:Filter:
Report Type:
Cut and Sold (New) - CUTS203S
22 of 08/11/2021 02:57 PM
Cumulative FY 2021 Q1 to FY 2021 Q4 as of 2021 3rd quarter
All Sales ,All Sales Quarterly 56
SERVICE-WIDE (Continued)
Description
Description
Description
Description
Description
MSM
GINHERBNSBNSBCPLNT
MUSHMUSHPLNTMUSHMUSHPLNT
MapleSugar Maple
Plant OtherPlant OtherPlant OtherPlant OtherPlant Other
MushroomsPlant OtherOther Vegetative MatMushroomsPlant OtherOther Vegetative Mat
2,740.00 6,078.05
625.00 .00
180.00 80.00
500.00
2,750.00 300.00
1,175.00 96,272.00
140.00 60.00
10,900 9,315
40 0
450 40 53
2,750 150
1,175 63,860
70 6
Quantity
Quantity
Quantity
Quantity
Quantity
Cut
Cut
Cut
Cut
Cut
Value ($)
Value ($)
Value ($)
Value ($)
Value ($)
Cut
Cut
Cut
Cut
Cut
2,745.00 8,104.55
40.00 20.00
180.00 80.00
480.00
2,750.00 300.00
1,335.00 96,662.00
140.00 60.00
10,980 12,235
20 133 450
40 48
2,750 150
1,495 64,085
70 24
Quantity
Quantity
Quantity
Quantity
Quantity
Sold
Sold
Sold
Sold
Sold
Value ($)
Value ($)
Value ($)
Value ($)
Value ($)
Sold
Sold
Sold
Sold
Sold
20.00
10,849.55
800.00
101,247.00
.00
8,818.05
1,385.00
100,697.00
37 Frts/Berys (Continued)
38 Tree Sap
40 Roots
42 Mushrooms
44 Mosses
PRODUCT & SPECIES NON-CONVERTIBLE (Continued)
Species
Species
Species
Species
Species
Code
Code
Code
Code
Code
12
10
10
15
Taps
Lbs
Lbs
Gal
Description
Description
Description
Description
Description
UOM
UOM
UOM
UOM
UOM
37 Frts/Berys Total :
38 Tree Sap Total :
40 Roots Total :
42 Mushrooms Total :
*****Note: As of 3rd quarter FY19, Volumes for Good Neighbor (GN) sales are included but values for GN sales are not included. Therefore total value and value/volume do not reflect true values. Do not use this report to determine unit values. *****
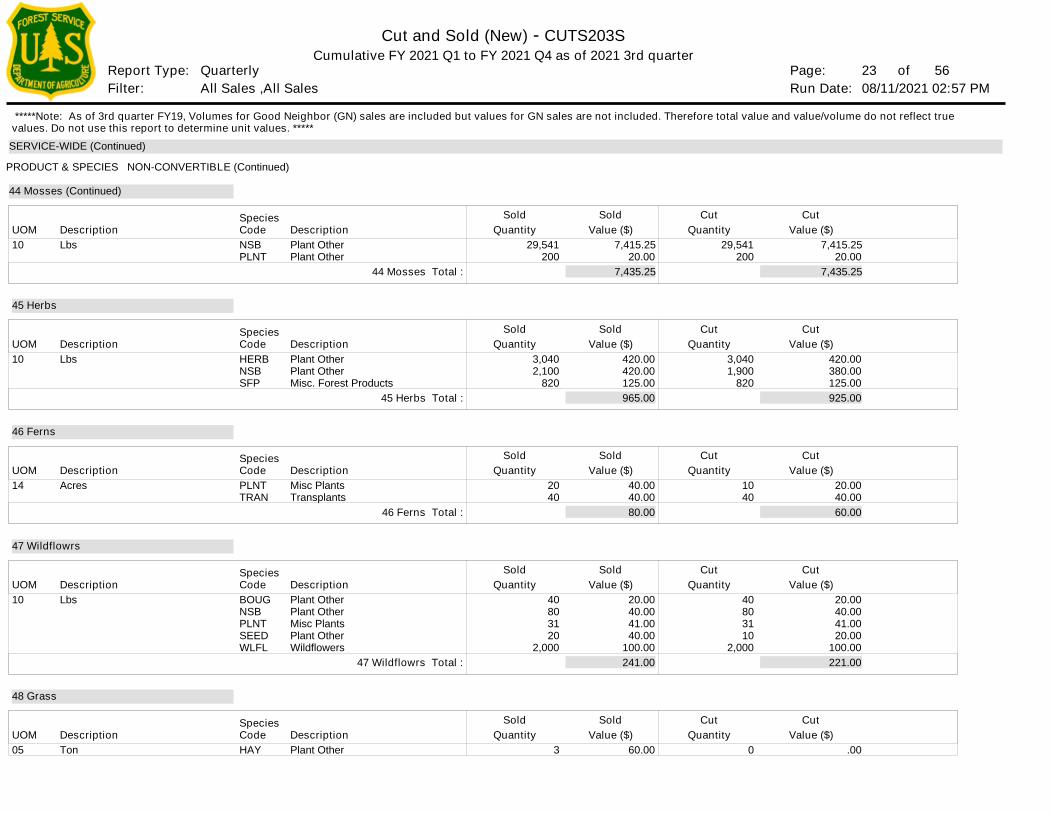
Page: Run Date:Filter:
Report Type:
Cut and Sold (New) - CUTS203S
23 of 08/11/2021 02:57 PM
Cumulative FY 2021 Q1 to FY 2021 Q4 as of 2021 3rd quarter
All Sales ,All Sales Quarterly 56
SERVICE-WIDE (Continued)
Description
Description
Description
Description
Description
NSBPLNT
HERBNSBSFP
PLNTTRAN
BOUGNSBPLNTSEEDWLFL
HAY
Plant OtherPlant Other
Plant OtherPlant OtherMisc. Forest Products
Misc PlantsTransplants
Plant OtherPlant OtherMisc PlantsPlant OtherWildflowers
Plant Other
7,415.25 20.00
420.00 380.00 125.00
20.00 40.00
20.00 40.00 41.00 20.00
100.00
.00
29,541 200
3,040 1,900
820
10 40
40 80 31 10
2,000
0
Quantity
Quantity
Quantity
Quantity
Quantity
Cut
Cut
Cut
Cut
Cut
Value ($)
Value ($)
Value ($)
Value ($)
Value ($)
Cut
Cut
Cut
Cut
Cut
7,415.25 20.00
420.00 420.00 125.00
40.00 40.00
20.00 40.00 41.00 40.00
100.00
60.00
29,541 200
3,040 2,100
820
20 40
40 80 31 20
2,000
3
Quantity
Quantity
Quantity
Quantity
Quantity
Sold
Sold
Sold
Sold
Sold
Value ($)
Value ($)
Value ($)
Value ($)
Value ($)
Sold
Sold
Sold
Sold
Sold
7,435.25
965.00
80.00
241.00
7,435.25
925.00
60.00
221.00
44 Mosses (Continued)
45 Herbs
46 Ferns
47 Wildflowrs
48 Grass
PRODUCT & SPECIES NON-CONVERTIBLE (Continued)
Species
Species
Species
Species
Species
Code
Code
Code
Code
Code
10
10
14
10
05
Lbs
Lbs
Acres
Lbs
Ton
Description
Description
Description
Description
Description
UOM
UOM
UOM
UOM
UOM
44 Mosses Total :
45 Herbs Total :
46 Ferns Total :
47 Wildflowrs Total :
*****Note: As of 3rd quarter FY19, Volumes for Good Neighbor (GN) sales are included but values for GN sales are not included. Therefore total value and value/volume do not reflect true values. Do not use this report to determine unit values. *****
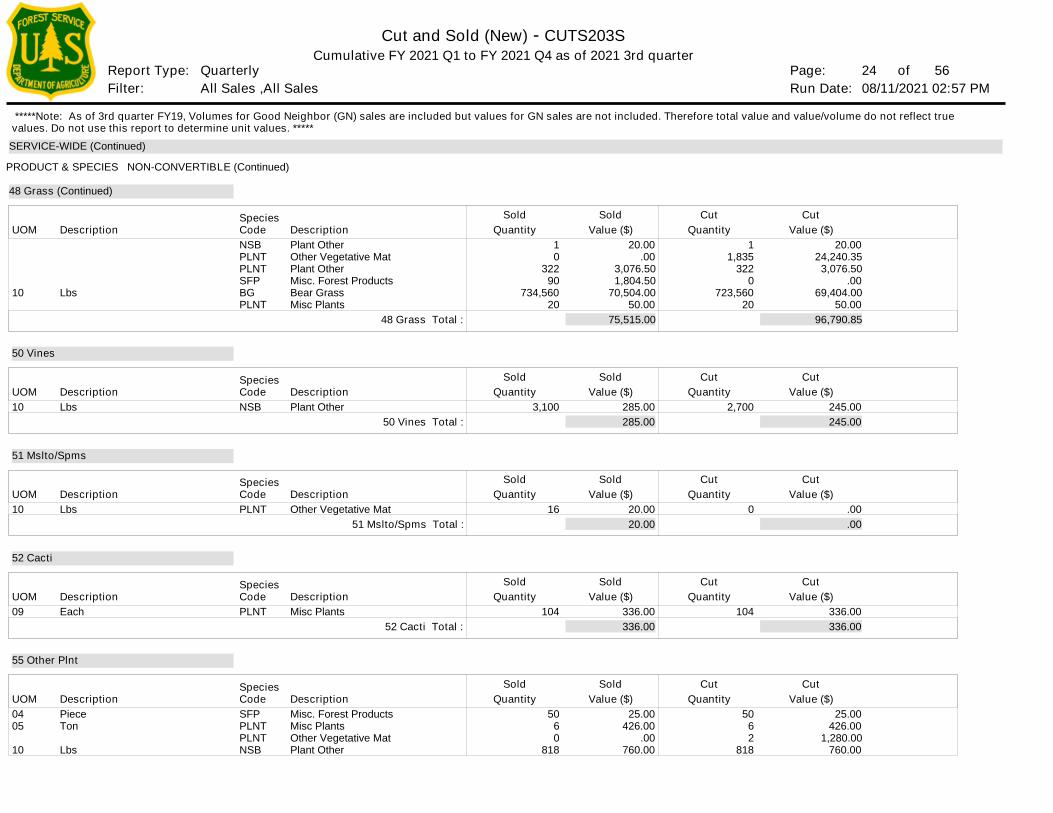
Page: Run Date:Filter:
Report Type:
Cut and Sold (New) - CUTS203S
24 of 08/11/2021 02:57 PM
Cumulative FY 2021 Q1 to FY 2021 Q4 as of 2021 3rd quarter
All Sales ,All Sales Quarterly 56
SERVICE-WIDE (Continued)
Description
Description
Description
Description
Description
NSBPLNTPLNTSFPBGPLNT
NSB
PLNT
PLNT
SFPPLNTPLNTNSB
Plant OtherOther Vegetative MatPlant OtherMisc. Forest ProductsBear GrassMisc Plants
Plant Other
Other Vegetative Mat
Misc Plants
Misc. Forest ProductsMisc PlantsOther Vegetative MatPlant Other
20.00 24,240.35
3,076.50 .00
69,404.00 50.00
245.00
.00
336.00
25.00 426.00
1,280.00 760.00
1 1,835
322 0
723,560 20
2,700
0
104
50 6 2
818
Quantity
Quantity
Quantity
Quantity
Quantity
Cut
Cut
Cut
Cut
Cut
Value ($)
Value ($)
Value ($)
Value ($)
Value ($)
Cut
Cut
Cut
Cut
Cut
20.00 .00
3,076.50 1,804.50
70,504.00 50.00
285.00
20.00
336.00
25.00 426.00
.00 760.00
1 0
322 90
734,560 20
3,100
16
104
50 6 0
818
Quantity
Quantity
Quantity
Quantity
Quantity
Sold
Sold
Sold
Sold
Sold
Value ($)
Value ($)
Value ($)
Value ($)
Value ($)
Sold
Sold
Sold
Sold
Sold
75,515.00
285.00
20.00
336.00
96,790.85
245.00
.00
336.00
48 Grass (Continued)
50 Vines
51 Mslto/Spms
52 Cacti
55 Other Plnt
PRODUCT & SPECIES NON-CONVERTIBLE (Continued)
Species
Species
Species
Species
Species
Code
Code
Code
Code
Code
10
10
10
09
0405
10
Lbs
Lbs
Lbs
Each
PieceTon
Lbs
Description
Description
Description
Description
Description
UOM
UOM
UOM
UOM
UOM
48 Grass Total :
50 Vines Total :
51 Mslto/Spms Total :
52 Cacti Total :
*****Note: As of 3rd quarter FY19, Volumes for Good Neighbor (GN) sales are included but values for GN sales are not included. Therefore total value and value/volume do not reflect true values. Do not use this report to determine unit values. *****
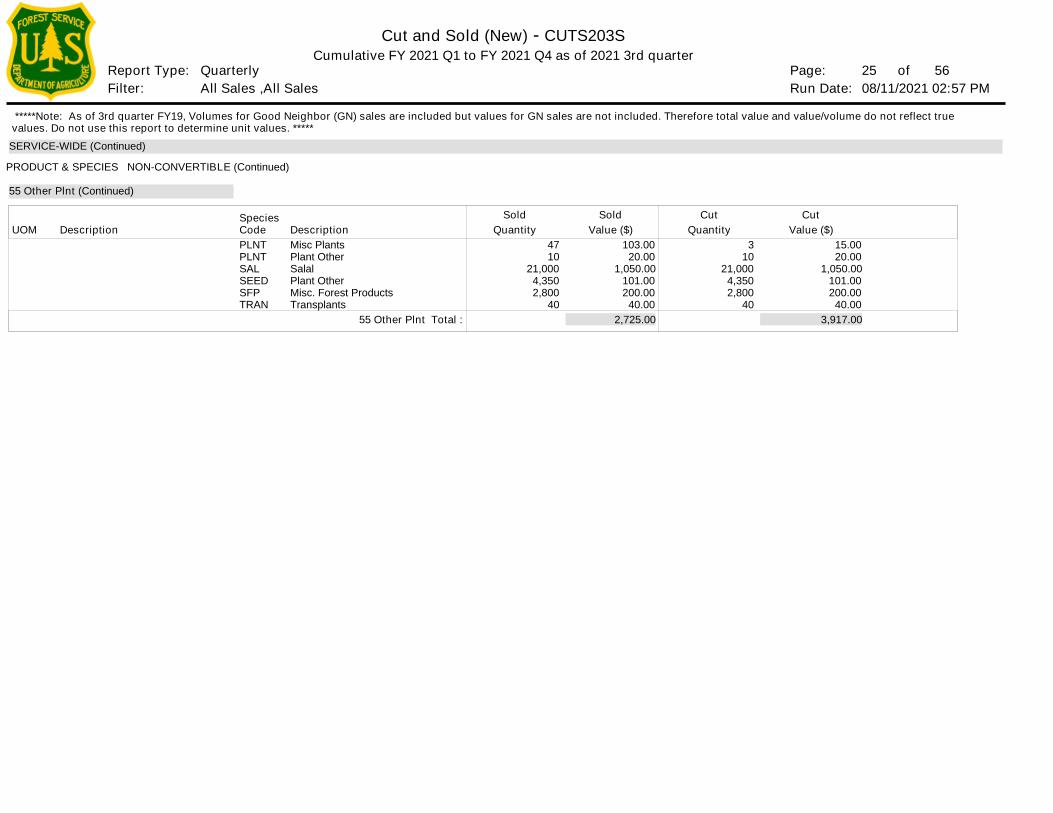
Page: Run Date:Filter:
Report Type:
Cut and Sold (New) - CUTS203S
25 of 08/11/2021 02:57 PM
Cumulative FY 2021 Q1 to FY 2021 Q4 as of 2021 3rd quarter
All Sales ,All Sales Quarterly 56
SERVICE-WIDE (Continued)
DescriptionPLNTPLNTSALSEEDSFPTRAN
Misc PlantsPlant OtherSalalPlant OtherMisc. Forest ProductsTransplants
15.00 20.00
1,050.00 101.00 200.00
40.00
3 10
21,000 4,350 2,800
40
QuantityCut
Value ($)Cut
103.00 20.00
1,050.00 101.00 200.00
40.00
47 10
21,000 4,350 2,800
40
QuantitySold
Value ($)Sold
2,725.00 3,917.00
55 Other Plnt (Continued)
PRODUCT & SPECIES NON-CONVERTIBLE (Continued)
SpeciesCodeDescriptionUOM
55 Other Plnt Total :
*****Note: As of 3rd quarter FY19, Volumes for Good Neighbor (GN) sales are included but values for GN sales are not included. Therefore total value and value/volume do not reflect true values. Do not use this report to determine unit values. *****
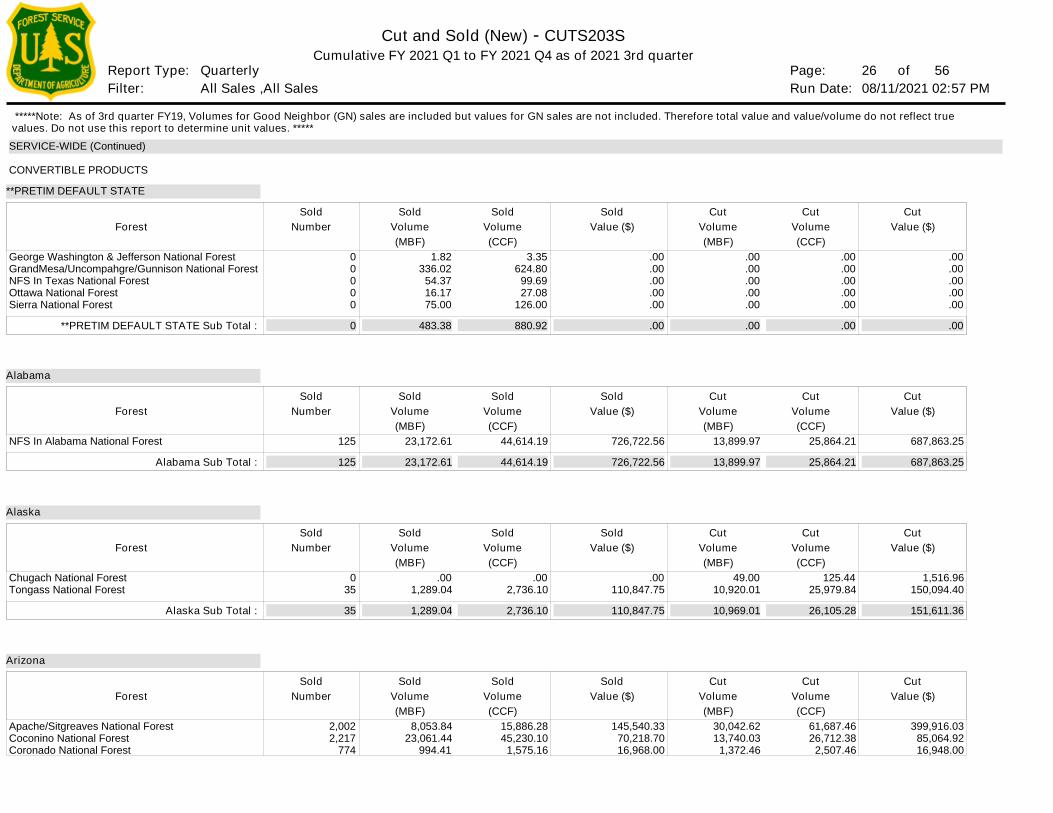
Page: Run Date:Filter:
Report Type:
Cut and Sold (New) - CUTS203S
26 of 08/11/2021 02:57 PM
Cumulative FY 2021 Q1 to FY 2021 Q4 as of 2021 3rd quarter
All Sales ,All Sales Quarterly 56
SERVICE-WIDE (Continued)
Forest
Forest
Forest
Forest
Volume
Volume
Volume
Volume
George Washington & Jefferson National ForestGrandMesa/Uncompahgre/Gunnison National ForestNFS In Texas National ForestOttawa National ForestSierra National Forest
NFS In Alabama National Forest
Chugach National ForestTongass National Forest
Apache/Sitgreaves National ForestCoconino National ForestCoronado National Forest
.00 .00 .00 .00 .00
687,863.25
1,516.96 150,094.40
399,916.03 85,064.92 16,948.00
.00 .00 .00 .00 .00
25,864.21
125.44 25,979.84
61,687.46 26,712.38
2,507.46
(CCF)
(CCF)
(CCF)
(CCF)
(MBF)
(MBF)
(MBF)
(MBF)
.00 .00 .00 .00 .00
13,899.97
49.00 10,920.01
30,042.62 13,740.03
1,372.46
**PRETIM DEFAULT STATE Sub Total :
Alabama Sub Total :
Alaska Sub Total :
Cut
Cut
Cut
Cut
Volume
Volume
Volume
Volume
Cut
Cut
Cut
Cut
Value ($)
Value ($)
Value ($)
Value ($)
Cut
Cut
Cut
Cut
.00 .00 .00 .00 .00
726,722.56
.00 110,847.75
145,540.33 70,218.70 16,968.00
3.35 624.80
99.69 27.08
126.00
44,614.19
.00 2,736.10
15,886.28 45,230.10
1,575.16
1.82 336.02
54.37 16.17 75.00
23,172.61
.00 1,289.04
8,053.84 23,061.44
994.41
Volume
Volume
Volume
Volume
(CCF)
(CCF)
(CCF)
(CCF)
(MBF)
(MBF)
(MBF)
(MBF)
Sold
Sold
Sold
Sold
Volume
Volume
Volume
Volume
Sold
Sold
Sold
Sold
Value ($)
Value ($)
Value ($)
Value ($)
Sold
Sold
Sold
Sold
Number
Number
Number
Number
0 0 0 0 0
125
0 35
2,002 2,217
774
0
125
35
483.38
23,172.61
1,289.04
880.92
44,614.19
2,736.10
.00
726,722.56
110,847.75
.00
13,899.97
10,969.01
.00
25,864.21
26,105.28
.00
687,863.25
151,611.36
**PRETIM DEFAULT STATE
Alabama
Alaska
Arizona
Sold
Sold
Sold
Sold
CONVERTIBLE PRODUCTS
*****Note: As of 3rd quarter FY19, Volumes for Good Neighbor (GN) sales are included but values for GN sales are not included. Therefore total value and value/volume do not reflect true values. Do not use this report to determine unit values. *****
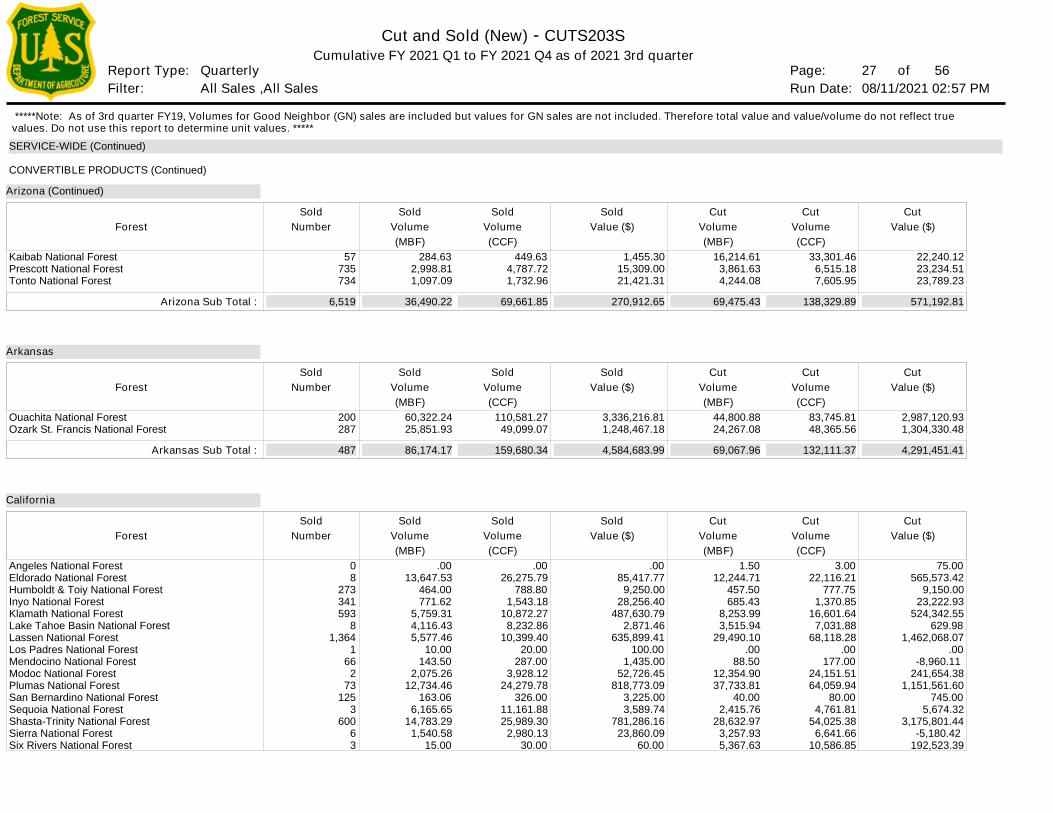
Page: Run Date:Filter:
Report Type:
Cut and Sold (New) - CUTS203S
27 of 08/11/2021 02:57 PM
Cumulative FY 2021 Q1 to FY 2021 Q4 as of 2021 3rd quarter
All Sales ,All Sales Quarterly 56
SERVICE-WIDE (Continued)
Forest
Forest
Forest
Volume
Volume
Volume
Kaibab National ForestPrescott National ForestTonto National Forest
Ouachita National ForestOzark St. Francis National Forest
Angeles National ForestEldorado National ForestHumboldt & Toiy National ForestInyo National ForestKlamath National ForestLake Tahoe Basin National ForestLassen National ForestLos Padres National ForestMendocino National ForestModoc National ForestPlumas National ForestSan Bernardino National ForestSequoia National ForestShasta-Trinity National ForestSierra National ForestSix Rivers National Forest
22,240.12 23,234.51 23,789.23
2,987,120.93 1,304,330.48
75.00 565,573.42
9,150.00 23,222.93
524,342.55 629.98
1,462,068.07 .00
-8,960.11 241,654.38
1,151,561.60 745.00
5,674.32 3,175,801.44
-5,180.42 192,523.39
33,301.46 6,515.18 7,605.95
83,745.81 48,365.56
3.00 22,116.21
777.75 1,370.85
16,601.64 7,031.88
68,118.28 .00
177.00 24,151.51 64,059.94
80.00 4,761.81
54,025.38 6,641.66
10,586.85
(CCF)
(CCF)
(CCF)
(MBF)
(MBF)
(MBF)
16,214.61 3,861.63 4,244.08
44,800.88 24,267.08
1.50 12,244.71
457.50 685.43
8,253.99 3,515.94
29,490.10 .00
88.50 12,354.90 37,733.81
40.00 2,415.76
28,632.97 3,257.93 5,367.63
Arizona Sub Total :
Arkansas Sub Total :
Cut
Cut
Cut
Volume
Volume
Volume
Cut
Cut
Cut
Value ($)
Value ($)
Value ($)
Cut
Cut
Cut
1,455.30 15,309.00 21,421.31
3,336,216.81 1,248,467.18
.00 85,417.77
9,250.00 28,256.40
487,630.79 2,871.46
635,899.41 100.00
1,435.00 52,726.45
818,773.09 3,225.00 3,589.74
781,286.16 23,860.09
60.00
449.63 4,787.72 1,732.96
110,581.27 49,099.07
.00 26,275.79
788.80 1,543.18
10,872.27 8,232.86
10,399.40 20.00
287.00 3,928.12
24,279.78 326.00
11,161.88 25,989.30
2,980.13 30.00
284.63 2,998.81 1,097.09
60,322.24 25,851.93
.00 13,647.53
464.00 771.62
5,759.31 4,116.43 5,577.46
10.00 143.50
2,075.26 12,734.46
163.06 6,165.65
14,783.29 1,540.58
15.00
Volume
Volume
Volume
(CCF)
(CCF)
(CCF)
(MBF)
(MBF)
(MBF)
Sold
Sold
Sold
Volume
Volume
Volume
Sold
Sold
Sold
Value ($)
Value ($)
Value ($)
Sold
Sold
Sold
Number
Number
Number
57 735 734
200 287
0 8
273 341 593
8 1,364
1 66
2 73
125 3
600 6 3
6,519
487
36,490.22
86,174.17
69,661.85
159,680.34
270,912.65
4,584,683.99
69,475.43
69,067.96
138,329.89
132,111.37
571,192.81
4,291,451.41
Arkansas
California
Arizona (Continued)
Sold
Sold
Sold
CONVERTIBLE PRODUCTS (Continued)
*****Note: As of 3rd quarter FY19, Volumes for Good Neighbor (GN) sales are included but values for GN sales are not included. Therefore total value and value/volume do not reflect true values. Do not use this report to determine unit values. *****
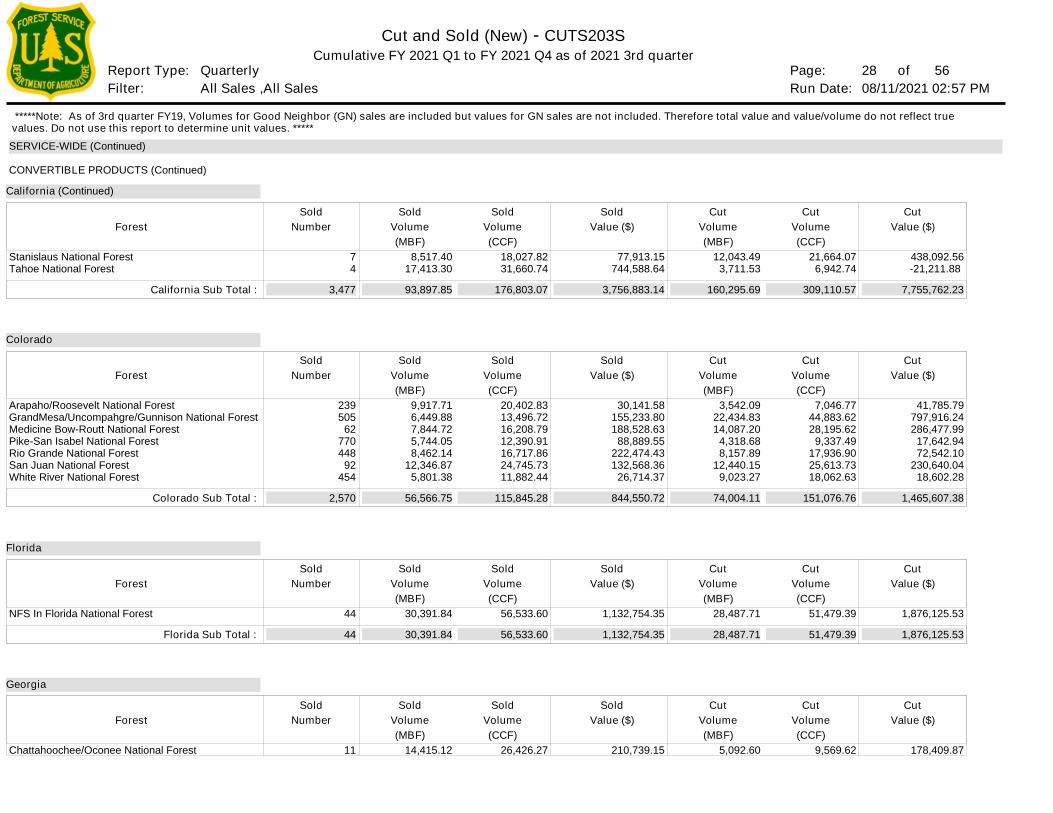
Page: Run Date:Filter:
Report Type:
Cut and Sold (New) - CUTS203S
28 of 08/11/2021 02:57 PM
Cumulative FY 2021 Q1 to FY 2021 Q4 as of 2021 3rd quarter
All Sales ,All Sales Quarterly 56
SERVICE-WIDE (Continued)
Forest
Forest
Forest
Forest
Volume
Volume
Volume
Volume
Stanislaus National ForestTahoe National Forest
Arapaho/Roosevelt National ForestGrandMesa/Uncompahgre/Gunnison National ForestMedicine Bow-Routt National ForestPike-San Isabel National ForestRio Grande National ForestSan Juan National ForestWhite River National Forest
NFS In Florida National Forest
Chattahoochee/Oconee National Forest
438,092.56-21,211.88
41,785.79 797,916.24 286,477.99
17,642.94 72,542.10
230,640.04 18,602.28
1,876,125.53
178,409.87
21,664.07 6,942.74
7,046.77 44,883.62 28,195.62
9,337.49 17,936.90 25,613.73 18,062.63
51,479.39
9,569.62
(CCF)
(CCF)
(CCF)
(CCF)
(MBF)
(MBF)
(MBF)
(MBF)
12,043.49 3,711.53
3,542.09 22,434.83 14,087.20
4,318.68 8,157.89
12,440.15 9,023.27
28,487.71
5,092.60
California Sub Total :
Colorado Sub Total :
Florida Sub Total :
Cut
Cut
Cut
Cut
Volume
Volume
Volume
Volume
Cut
Cut
Cut
Cut
Value ($)
Value ($)
Value ($)
Value ($)
Cut
Cut
Cut
Cut
77,913.15 744,588.64
30,141.58 155,233.80 188,528.63
88,889.55 222,474.43 132,568.36
26,714.37
1,132,754.35
210,739.15
18,027.82 31,660.74
20,402.83 13,496.72 16,208.79 12,390.91 16,717.86 24,745.73 11,882.44
56,533.60
26,426.27
8,517.40 17,413.30
9,917.71 6,449.88 7,844.72 5,744.05 8,462.14
12,346.87 5,801.38
30,391.84
14,415.12
Volume
Volume
Volume
Volume
(CCF)
(CCF)
(CCF)
(CCF)
(MBF)
(MBF)
(MBF)
(MBF)
Sold
Sold
Sold
Sold
Volume
Volume
Volume
Volume
Sold
Sold
Sold
Sold
Value ($)
Value ($)
Value ($)
Value ($)
Sold
Sold
Sold
Sold
Number
Number
Number
Number
7 4
239 505
62 770 448
92 454
44
11
3,477
2,570
44
93,897.85
56,566.75
30,391.84
176,803.07
115,845.28
56,533.60
3,756,883.14
844,550.72
1,132,754.35
160,295.69
74,004.11
28,487.71
309,110.57
151,076.76
51,479.39
7,755,762.23
1,465,607.38
1,876,125.53
Colorado
Florida
Georgia
California (Continued)
Sold
Sold
Sold
Sold
CONVERTIBLE PRODUCTS (Continued)
*****Note: As of 3rd quarter FY19, Volumes for Good Neighbor (GN) sales are included but values for GN sales are not included. Therefore total value and value/volume do not reflect true values. Do not use this report to determine unit values. *****
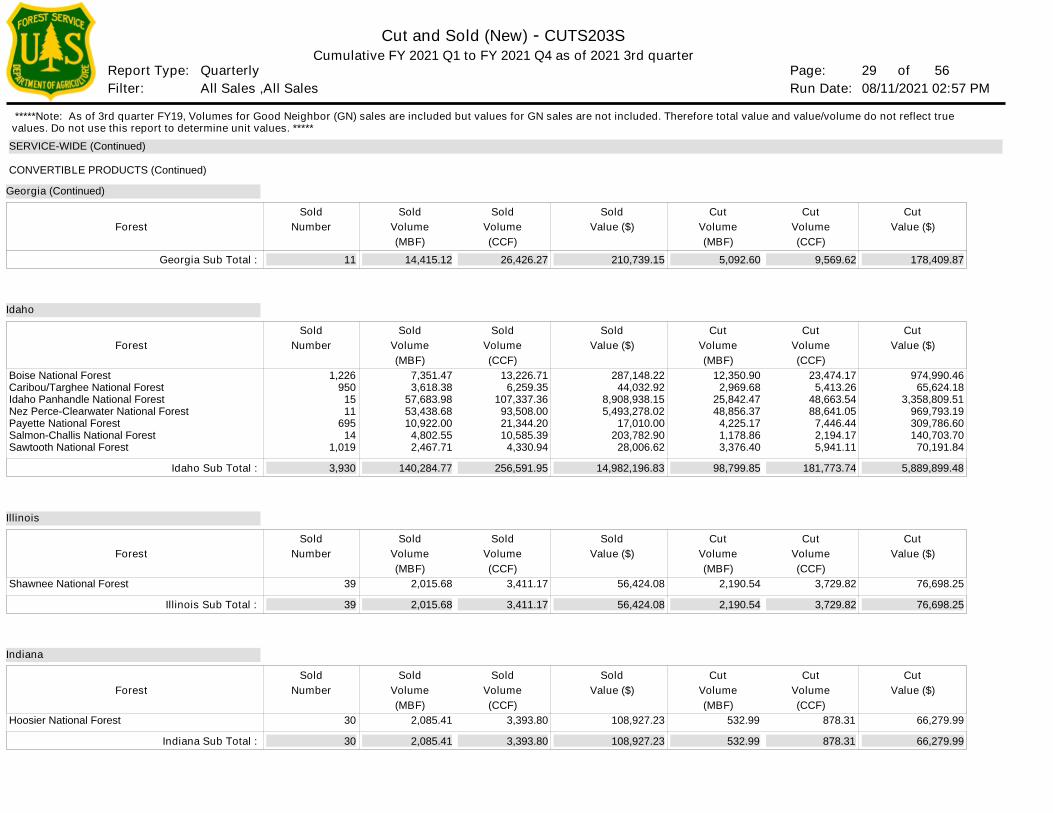
Page: Run Date:Filter:
Report Type:
Cut and Sold (New) - CUTS203S
29 of 08/11/2021 02:57 PM
Cumulative FY 2021 Q1 to FY 2021 Q4 as of 2021 3rd quarter
All Sales ,All Sales Quarterly 56
SERVICE-WIDE (Continued)
Forest
Forest
Forest
Forest
Volume
Volume
Volume
Volume
Boise National ForestCaribou/Targhee National ForestIdaho Panhandle National ForestNez Perce-Clearwater National ForestPayette National ForestSalmon-Challis National ForestSawtooth National Forest
Shawnee National Forest
Hoosier National Forest
974,990.46 65,624.18
3,358,809.51 969,793.19 309,786.60 140,703.70
70,191.84
76,698.25
66,279.99
23,474.17 5,413.26
48,663.54 88,641.05
7,446.44 2,194.17 5,941.11
3,729.82
878.31
(CCF)
(CCF)
(CCF)
(CCF)
(MBF)
(MBF)
(MBF)
(MBF)
12,350.90 2,969.68
25,842.47 48,856.37
4,225.17 1,178.86 3,376.40
2,190.54
532.99
Georgia Sub Total :
Idaho Sub Total :
Illinois Sub Total :
Indiana Sub Total :
Cut
Cut
Cut
Cut
Volume
Volume
Volume
Volume
Cut
Cut
Cut
Cut
Value ($)
Value ($)
Value ($)
Value ($)
Cut
Cut
Cut
Cut
287,148.22 44,032.92
8,908,938.15 5,493,278.02
17,010.00 203,782.90
28,006.62
56,424.08
108,927.23
13,226.71 6,259.35
107,337.36 93,508.00 21,344.20 10,585.39
4,330.94
3,411.17
3,393.80
7,351.47 3,618.38
57,683.98 53,438.68 10,922.00
4,802.55 2,467.71
2,015.68
2,085.41
Volume
Volume
Volume
Volume
(CCF)
(CCF)
(CCF)
(CCF)
(MBF)
(MBF)
(MBF)
(MBF)
Sold
Sold
Sold
Sold
Volume
Volume
Volume
Volume
Sold
Sold
Sold
Sold
Value ($)
Value ($)
Value ($)
Value ($)
Sold
Sold
Sold
Sold
Number
Number
Number
Number
1,226 950
15 11
695 14
1,019
39
30
11
3,930
39
30
14,415.12
140,284.77
2,015.68
2,085.41
26,426.27
256,591.95
3,411.17
3,393.80
210,739.15
14,982,196.83
56,424.08
108,927.23
5,092.60
98,799.85
2,190.54
532.99
9,569.62
181,773.74
3,729.82
878.31
178,409.87
5,889,899.48
76,698.25
66,279.99
Idaho
Illinois
Indiana
Georgia (Continued)
Sold
Sold
Sold
Sold
CONVERTIBLE PRODUCTS (Continued)
*****Note: As of 3rd quarter FY19, Volumes for Good Neighbor (GN) sales are included but values for GN sales are not included. Therefore total value and value/volume do not reflect true values. Do not use this report to determine unit values. *****
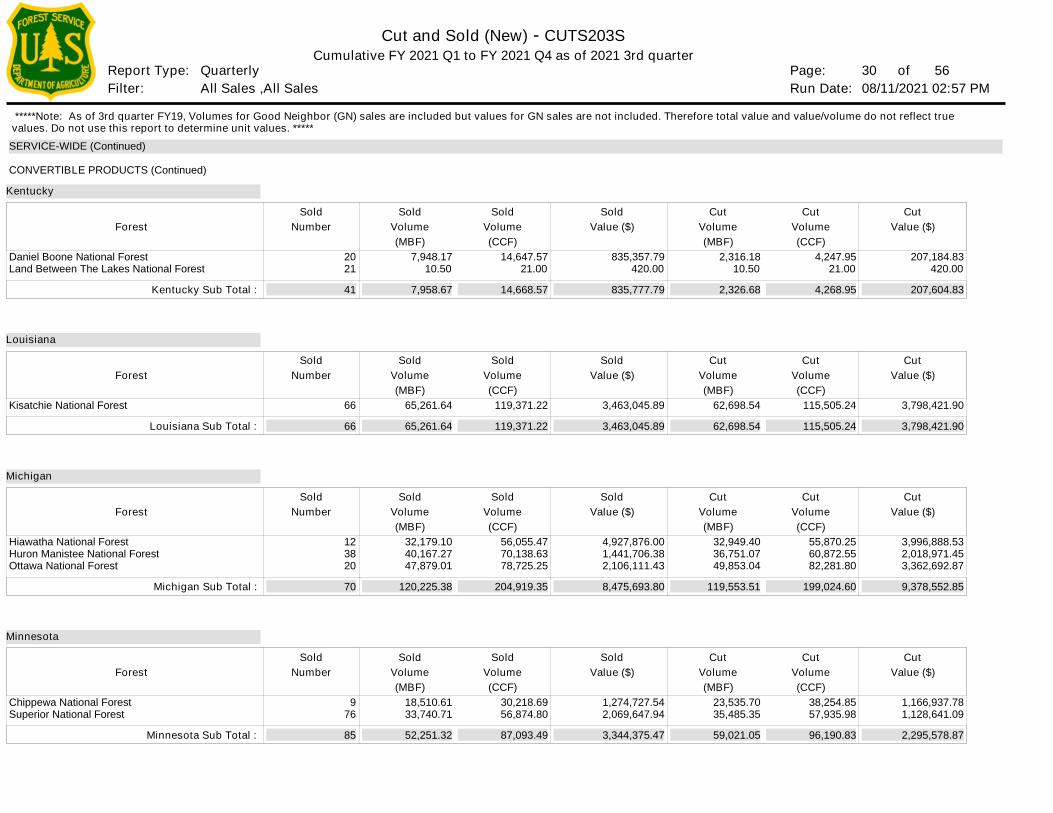
Page: Run Date:Filter:
Report Type:
Cut and Sold (New) - CUTS203S
30 of 08/11/2021 02:57 PM
Cumulative FY 2021 Q1 to FY 2021 Q4 as of 2021 3rd quarter
All Sales ,All Sales Quarterly 56
SERVICE-WIDE (Continued)
Forest
Forest
Forest
Forest
Volume
Volume
Volume
Volume
Daniel Boone National ForestLand Between The Lakes National Forest
Kisatchie National Forest
Hiawatha National ForestHuron Manistee National ForestOttawa National Forest
Chippewa National ForestSuperior National Forest
207,184.83 420.00
3,798,421.90
3,996,888.53 2,018,971.45 3,362,692.87
1,166,937.78 1,128,641.09
4,247.95 21.00
115,505.24
55,870.25 60,872.55 82,281.80
38,254.85 57,935.98
(CCF)
(CCF)
(CCF)
(CCF)
(MBF)
(MBF)
(MBF)
(MBF)
2,316.18 10.50
62,698.54
32,949.40 36,751.07 49,853.04
23,535.70 35,485.35
Kentucky Sub Total :
Louisiana Sub Total :
Michigan Sub Total :
Minnesota Sub Total :
Cut
Cut
Cut
Cut
Volume
Volume
Volume
Volume
Cut
Cut
Cut
Cut
Value ($)
Value ($)
Value ($)
Value ($)
Cut
Cut
Cut
Cut
835,357.79 420.00
3,463,045.89
4,927,876.00 1,441,706.38 2,106,111.43
1,274,727.54 2,069,647.94
14,647.57 21.00
119,371.22
56,055.47 70,138.63 78,725.25
30,218.69 56,874.80
7,948.17 10.50
65,261.64
32,179.10 40,167.27 47,879.01
18,510.61 33,740.71
Volume
Volume
Volume
Volume
(CCF)
(CCF)
(CCF)
(CCF)
(MBF)
(MBF)
(MBF)
(MBF)
Sold
Sold
Sold
Sold
Volume
Volume
Volume
Volume
Sold
Sold
Sold
Sold
Value ($)
Value ($)
Value ($)
Value ($)
Sold
Sold
Sold
Sold
Number
Number
Number
Number
20 21
66
12 38 20
9 76
41
66
70
85
7,958.67
65,261.64
120,225.38
52,251.32
14,668.57
119,371.22
204,919.35
87,093.49
835,777.79
3,463,045.89
8,475,693.80
3,344,375.47
2,326.68
62,698.54
119,553.51
59,021.05
4,268.95
115,505.24
199,024.60
96,190.83
207,604.83
3,798,421.90
9,378,552.85
2,295,578.87
Kentucky
Louisiana
Michigan
Minnesota
Sold
Sold
Sold
Sold
CONVERTIBLE PRODUCTS (Continued)
*****Note: As of 3rd quarter FY19, Volumes for Good Neighbor (GN) sales are included but values for GN sales are not included. Therefore total value and value/volume do not reflect true values. Do not use this report to determine unit values. *****
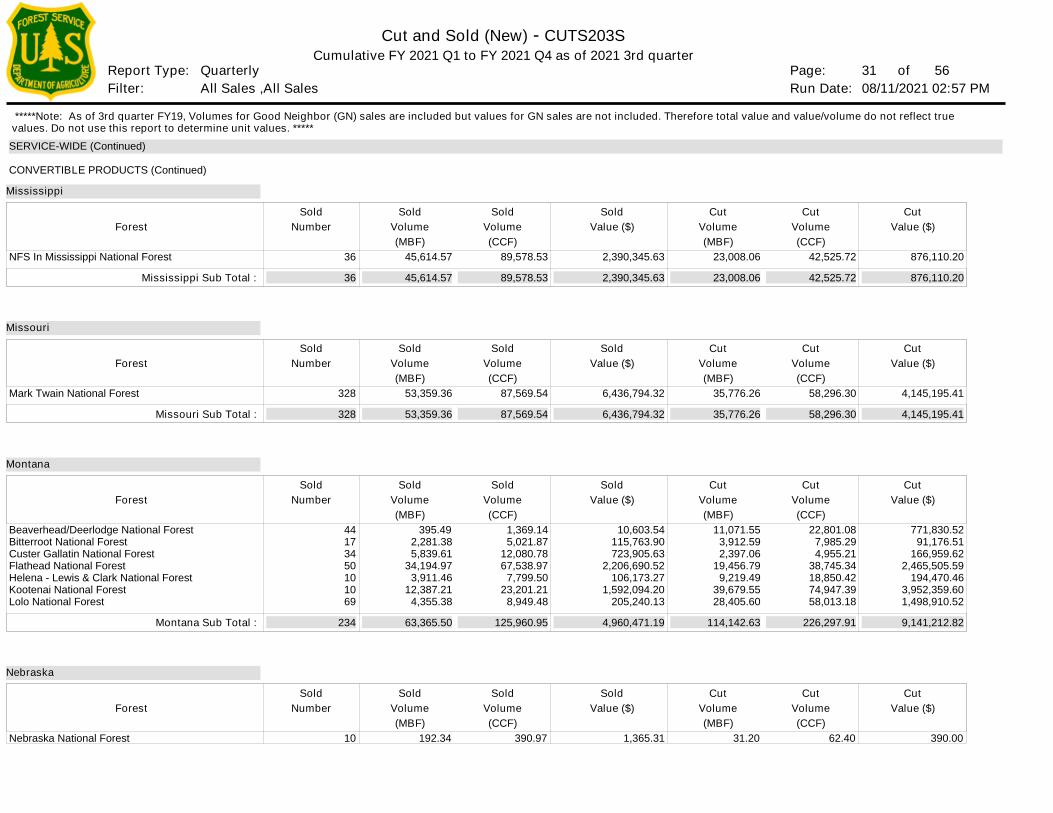
Page: Run Date:Filter:
Report Type:
Cut and Sold (New) - CUTS203S
31 of 08/11/2021 02:57 PM
Cumulative FY 2021 Q1 to FY 2021 Q4 as of 2021 3rd quarter
All Sales ,All Sales Quarterly 56
SERVICE-WIDE (Continued)
Forest
Forest
Forest
Forest
Volume
Volume
Volume
Volume
NFS In Mississippi National Forest
Mark Twain National Forest
Beaverhead/Deerlodge National ForestBitterroot National ForestCuster Gallatin National ForestFlathead National ForestHelena - Lewis & Clark National ForestKootenai National ForestLolo National Forest
Nebraska National Forest
876,110.20
4,145,195.41
771,830.52 91,176.51
166,959.62 2,465,505.59
194,470.46 3,952,359.60 1,498,910.52
390.00
42,525.72
58,296.30
22,801.08 7,985.29 4,955.21
38,745.34 18,850.42 74,947.39 58,013.18
62.40
(CCF)
(CCF)
(CCF)
(CCF)
(MBF)
(MBF)
(MBF)
(MBF)
23,008.06
35,776.26
11,071.55 3,912.59 2,397.06
19,456.79 9,219.49
39,679.55 28,405.60
31.20
Mississippi Sub Total :
Missouri Sub Total :
Montana Sub Total :
Cut
Cut
Cut
Cut
Volume
Volume
Volume
Volume
Cut
Cut
Cut
Cut
Value ($)
Value ($)
Value ($)
Value ($)
Cut
Cut
Cut
Cut
2,390,345.63
6,436,794.32
10,603.54 115,763.90 723,905.63
2,206,690.52 106,173.27
1,592,094.20 205,240.13
1,365.31
89,578.53
87,569.54
1,369.14 5,021.87
12,080.78 67,538.97
7,799.50 23,201.21
8,949.48
390.97
45,614.57
53,359.36
395.49 2,281.38 5,839.61
34,194.97 3,911.46
12,387.21 4,355.38
192.34
Volume
Volume
Volume
Volume
(CCF)
(CCF)
(CCF)
(CCF)
(MBF)
(MBF)
(MBF)
(MBF)
Sold
Sold
Sold
Sold
Volume
Volume
Volume
Volume
Sold
Sold
Sold
Sold
Value ($)
Value ($)
Value ($)
Value ($)
Sold
Sold
Sold
Sold
Number
Number
Number
Number
36
328
44 17 34 50 10 10 69
10
36
328
234
45,614.57
53,359.36
63,365.50
89,578.53
87,569.54
125,960.95
2,390,345.63
6,436,794.32
4,960,471.19
23,008.06
35,776.26
114,142.63
42,525.72
58,296.30
226,297.91
876,110.20
4,145,195.41
9,141,212.82
Mississippi
Missouri
Montana
Nebraska
Sold
Sold
Sold
Sold
CONVERTIBLE PRODUCTS (Continued)
*****Note: As of 3rd quarter FY19, Volumes for Good Neighbor (GN) sales are included but values for GN sales are not included. Therefore total value and value/volume do not reflect true values. Do not use this report to determine unit values. *****
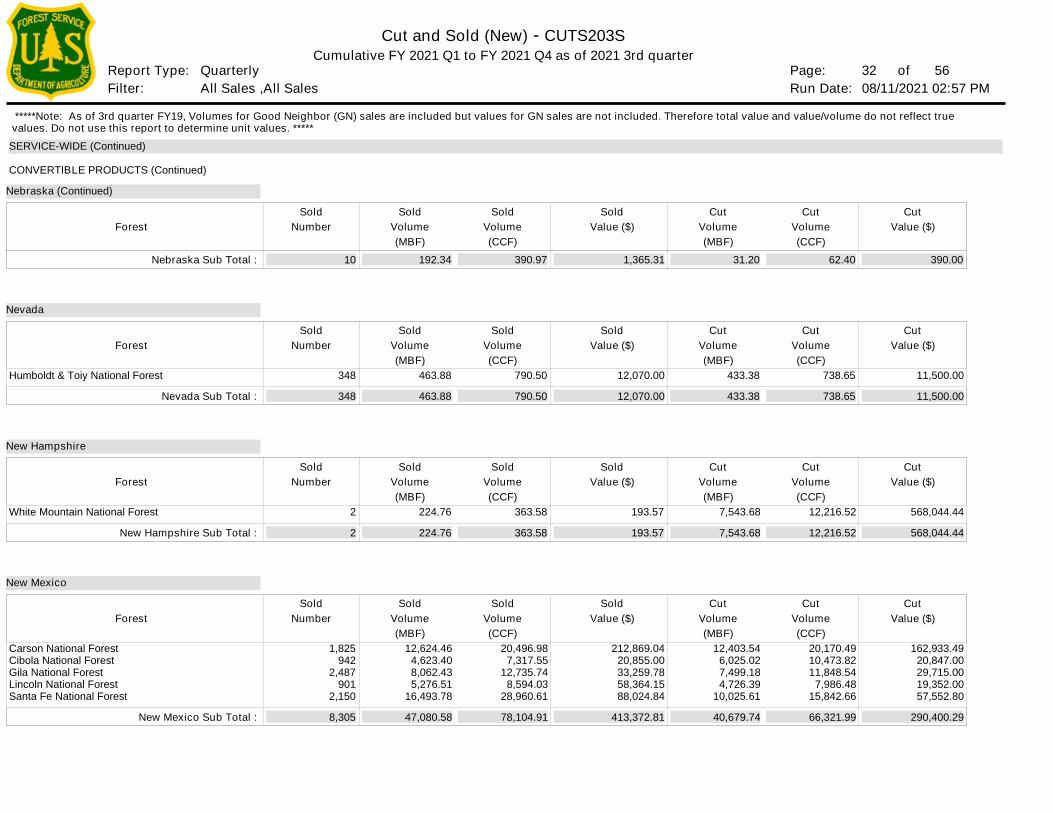
Page: Run Date:Filter:
Report Type:
Cut and Sold (New) - CUTS203S
32 of 08/11/2021 02:57 PM
Cumulative FY 2021 Q1 to FY 2021 Q4 as of 2021 3rd quarter
All Sales ,All Sales Quarterly 56
SERVICE-WIDE (Continued)
Forest
Forest
Forest
Forest
Volume
Volume
Volume
Volume
Humboldt & Toiy National Forest
White Mountain National Forest
Carson National ForestCibola National ForestGila National ForestLincoln National ForestSanta Fe National Forest
11,500.00
568,044.44
162,933.49 20,847.00 29,715.00 19,352.00 57,552.80
738.65
12,216.52
20,170.49 10,473.82 11,848.54
7,986.48 15,842.66
(CCF)
(CCF)
(CCF)
(CCF)
(MBF)
(MBF)
(MBF)
(MBF)
433.38
7,543.68
12,403.54 6,025.02 7,499.18 4,726.39
10,025.61
Nebraska Sub Total :
Nevada Sub Total :
New Hampshire Sub Total :
New Mexico Sub Total :
Cut
Cut
Cut
Cut
Volume
Volume
Volume
Volume
Cut
Cut
Cut
Cut
Value ($)
Value ($)
Value ($)
Value ($)
Cut
Cut
Cut
Cut
12,070.00
193.57
212,869.04 20,855.00 33,259.78 58,364.15 88,024.84
790.50
363.58
20,496.98 7,317.55
12,735.74 8,594.03
28,960.61
463.88
224.76
12,624.46 4,623.40 8,062.43 5,276.51
16,493.78
Volume
Volume
Volume
Volume
(CCF)
(CCF)
(CCF)
(CCF)
(MBF)
(MBF)
(MBF)
(MBF)
Sold
Sold
Sold
Sold
Volume
Volume
Volume
Volume
Sold
Sold
Sold
Sold
Value ($)
Value ($)
Value ($)
Value ($)
Sold
Sold
Sold
Sold
Number
Number
Number
Number
348
2
1,825 942
2,487 901
2,150
10
348
2
8,305
192.34
463.88
224.76
47,080.58
390.97
790.50
363.58
78,104.91
1,365.31
12,070.00
193.57
413,372.81
31.20
433.38
7,543.68
40,679.74
62.40
738.65
12,216.52
66,321.99
390.00
11,500.00
568,044.44
290,400.29
Nevada
New Hampshire
New Mexico
Nebraska (Continued)
Sold
Sold
Sold
Sold
CONVERTIBLE PRODUCTS (Continued)
*****Note: As of 3rd quarter FY19, Volumes for Good Neighbor (GN) sales are included but values for GN sales are not included. Therefore total value and value/volume do not reflect true values. Do not use this report to determine unit values. *****
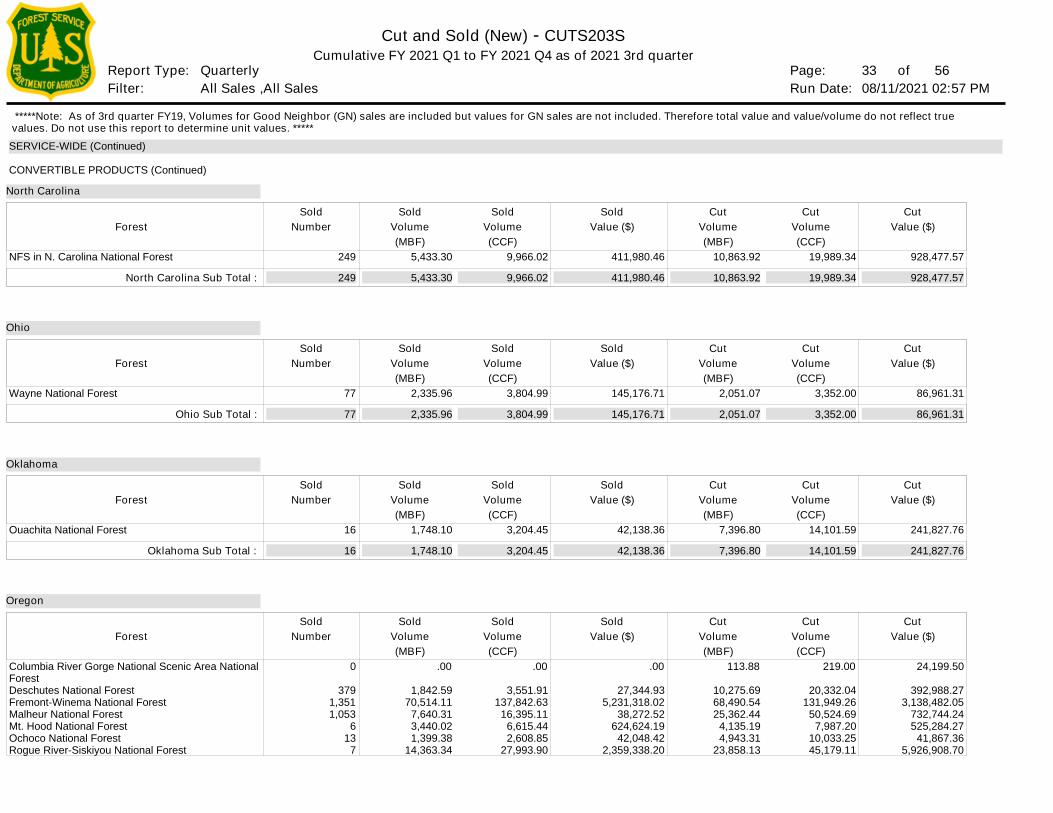
Page: Run Date:Filter:
Report Type:
Cut and Sold (New) - CUTS203S
33 of 08/11/2021 02:57 PM
Cumulative FY 2021 Q1 to FY 2021 Q4 as of 2021 3rd quarter
All Sales ,All Sales Quarterly 56
SERVICE-WIDE (Continued)
Forest
Forest
Forest
Forest
Volume
Volume
Volume
Volume
NFS in N. Carolina National Forest
Wayne National Forest
Ouachita National Forest
Columbia River Gorge National Scenic Area NationalForestDeschutes National ForestFremont-Winema National ForestMalheur National ForestMt. Hood National ForestOchoco National ForestRogue River-Siskiyou National Forest
928,477.57
86,961.31
241,827.76
24,199.50
392,988.27 3,138,482.05
732,744.24 525,284.27
41,867.36 5,926,908.70
19,989.34
3,352.00
14,101.59
219.00
20,332.04 131,949.26
50,524.69 7,987.20
10,033.25 45,179.11
(CCF)
(CCF)
(CCF)
(CCF)
(MBF)
(MBF)
(MBF)
(MBF)
10,863.92
2,051.07
7,396.80
113.88
10,275.69 68,490.54 25,362.44
4,135.19 4,943.31
23,858.13
North Carolina Sub Total :
Ohio Sub Total :
Oklahoma Sub Total :
Cut
Cut
Cut
Cut
Volume
Volume
Volume
Volume
Cut
Cut
Cut
Cut
Value ($)
Value ($)
Value ($)
Value ($)
Cut
Cut
Cut
Cut
411,980.46
145,176.71
42,138.36
.00
27,344.93 5,231,318.02
38,272.52 624,624.19
42,048.42 2,359,338.20
9,966.02
3,804.99
3,204.45
.00
3,551.91 137,842.63
16,395.11 6,615.44 2,608.85
27,993.90
5,433.30
2,335.96
1,748.10
.00
1,842.59 70,514.11
7,640.31 3,440.02 1,399.38
14,363.34
Volume
Volume
Volume
Volume
(CCF)
(CCF)
(CCF)
(CCF)
(MBF)
(MBF)
(MBF)
(MBF)
Sold
Sold
Sold
Sold
Volume
Volume
Volume
Volume
Sold
Sold
Sold
Sold
Value ($)
Value ($)
Value ($)
Value ($)
Sold
Sold
Sold
Sold
Number
Number
Number
Number
249
77
16
0
379 1,351 1,053
6 13
7
249
77
16
5,433.30
2,335.96
1,748.10
9,966.02
3,804.99
3,204.45
411,980.46
145,176.71
42,138.36
10,863.92
2,051.07
7,396.80
19,989.34
3,352.00
14,101.59
928,477.57
86,961.31
241,827.76
North Carolina
Ohio
Oklahoma
Oregon
Sold
Sold
Sold
Sold
CONVERTIBLE PRODUCTS (Continued)
*****Note: As of 3rd quarter FY19, Volumes for Good Neighbor (GN) sales are included but values for GN sales are not included. Therefore total value and value/volume do not reflect true values. Do not use this report to determine unit values. *****
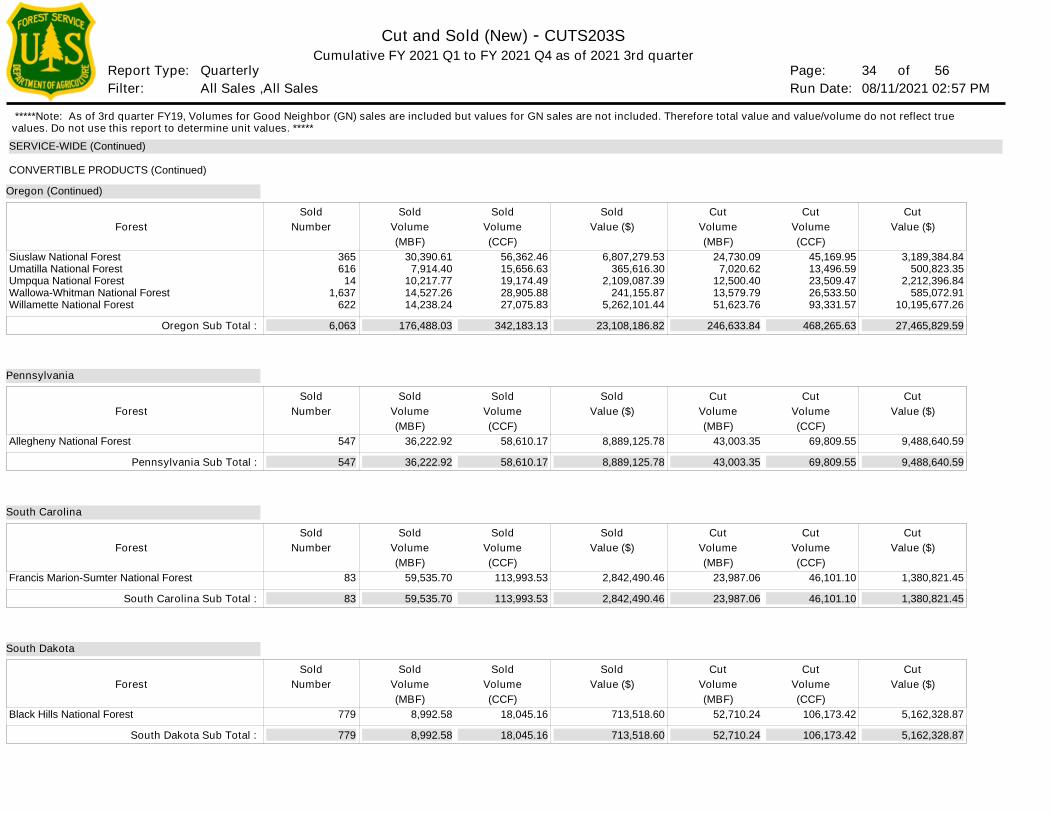
Page: Run Date:Filter:
Report Type:
Cut and Sold (New) - CUTS203S
34 of 08/11/2021 02:57 PM
Cumulative FY 2021 Q1 to FY 2021 Q4 as of 2021 3rd quarter
All Sales ,All Sales Quarterly 56
SERVICE-WIDE (Continued)
Forest
Forest
Forest
Forest
Volume
Volume
Volume
Volume
Siuslaw National ForestUmatilla National ForestUmpqua National ForestWallowa-Whitman National ForestWillamette National Forest
Allegheny National Forest
Francis Marion-Sumter National Forest
Black Hills National Forest
3,189,384.84 500,823.35
2,212,396.84 585,072.91
10,195,677.26
9,488,640.59
1,380,821.45
5,162,328.87
45,169.95 13,496.59 23,509.47 26,533.50 93,331.57
69,809.55
46,101.10
106,173.42
(CCF)
(CCF)
(CCF)
(CCF)
(MBF)
(MBF)
(MBF)
(MBF)
24,730.09 7,020.62
12,500.40 13,579.79 51,623.76
43,003.35
23,987.06
52,710.24
Oregon Sub Total :
Pennsylvania Sub Total :
South Carolina Sub Total :
South Dakota Sub Total :
Cut
Cut
Cut
Cut
Volume
Volume
Volume
Volume
Cut
Cut
Cut
Cut
Value ($)
Value ($)
Value ($)
Value ($)
Cut
Cut
Cut
Cut
6,807,279.53 365,616.30
2,109,087.39 241,155.87
5,262,101.44
8,889,125.78
2,842,490.46
713,518.60
56,362.46 15,656.63 19,174.49 28,905.88 27,075.83
58,610.17
113,993.53
18,045.16
30,390.61 7,914.40
10,217.77 14,527.26 14,238.24
36,222.92
59,535.70
8,992.58
Volume
Volume
Volume
Volume
(CCF)
(CCF)
(CCF)
(CCF)
(MBF)
(MBF)
(MBF)
(MBF)
Sold
Sold
Sold
Sold
Volume
Volume
Volume
Volume
Sold
Sold
Sold
Sold
Value ($)
Value ($)
Value ($)
Value ($)
Sold
Sold
Sold
Sold
Number
Number
Number
Number
365 616
14 1,637
622
547
83
779
6,063
547
83
779
176,488.03
36,222.92
59,535.70
8,992.58
342,183.13
58,610.17
113,993.53
18,045.16
23,108,186.82
8,889,125.78
2,842,490.46
713,518.60
246,633.84
43,003.35
23,987.06
52,710.24
468,265.63
69,809.55
46,101.10
106,173.42
27,465,829.59
9,488,640.59
1,380,821.45
5,162,328.87
Pennsylvania
South Carolina
South Dakota
Oregon (Continued)
Sold
Sold
Sold
Sold
CONVERTIBLE PRODUCTS (Continued)
*****Note: As of 3rd quarter FY19, Volumes for Good Neighbor (GN) sales are included but values for GN sales are not included. Therefore total value and value/volume do not reflect true values. Do not use this report to determine unit values. *****
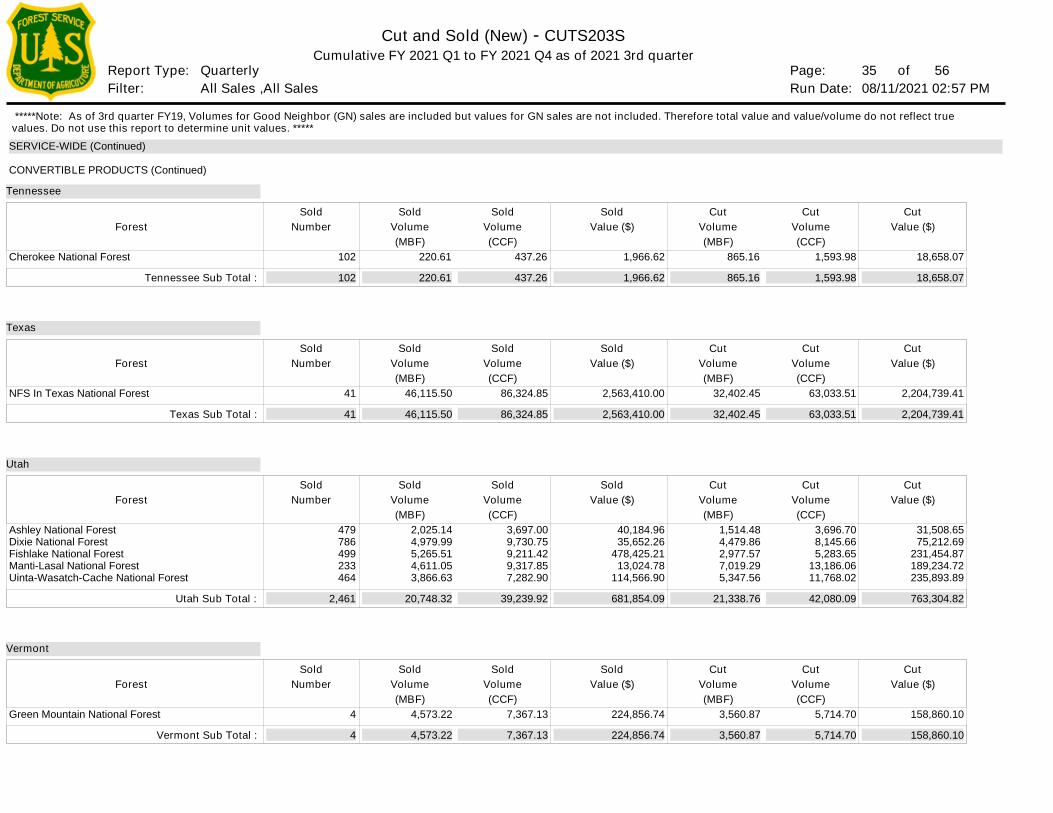
Page: Run Date:Filter:
Report Type:
Cut and Sold (New) - CUTS203S
35 of 08/11/2021 02:57 PM
Cumulative FY 2021 Q1 to FY 2021 Q4 as of 2021 3rd quarter
All Sales ,All Sales Quarterly 56
SERVICE-WIDE (Continued)
Forest
Forest
Forest
Forest
Volume
Volume
Volume
Volume
Cherokee National Forest
NFS In Texas National Forest
Ashley National ForestDixie National ForestFishlake National ForestManti-Lasal National ForestUinta-Wasatch-Cache National Forest
Green Mountain National Forest
18,658.07
2,204,739.41
31,508.65 75,212.69
231,454.87 189,234.72 235,893.89
158,860.10
1,593.98
63,033.51
3,696.70 8,145.66 5,283.65
13,186.06 11,768.02
5,714.70
(CCF)
(CCF)
(CCF)
(CCF)
(MBF)
(MBF)
(MBF)
(MBF)
865.16
32,402.45
1,514.48 4,479.86 2,977.57 7,019.29 5,347.56
3,560.87
Tennessee Sub Total :
Texas Sub Total :
Utah Sub Total :
Vermont Sub Total :
Cut
Cut
Cut
Cut
Volume
Volume
Volume
Volume
Cut
Cut
Cut
Cut
Value ($)
Value ($)
Value ($)
Value ($)
Cut
Cut
Cut
Cut
1,966.62
2,563,410.00
40,184.96 35,652.26
478,425.21 13,024.78
114,566.90
224,856.74
437.26
86,324.85
3,697.00 9,730.75 9,211.42 9,317.85 7,282.90
7,367.13
220.61
46,115.50
2,025.14 4,979.99 5,265.51 4,611.05 3,866.63
4,573.22
Volume
Volume
Volume
Volume
(CCF)
(CCF)
(CCF)
(CCF)
(MBF)
(MBF)
(MBF)
(MBF)
Sold
Sold
Sold
Sold
Volume
Volume
Volume
Volume
Sold
Sold
Sold
Sold
Value ($)
Value ($)
Value ($)
Value ($)
Sold
Sold
Sold
Sold
Number
Number
Number
Number
102
41
479 786 499 233 464
4
102
41
2,461
4
220.61
46,115.50
20,748.32
4,573.22
437.26
86,324.85
39,239.92
7,367.13
1,966.62
2,563,410.00
681,854.09
224,856.74
865.16
32,402.45
21,338.76
3,560.87
1,593.98
63,033.51
42,080.09
5,714.70
18,658.07
2,204,739.41
763,304.82
158,860.10
Tennessee
Texas
Utah
Vermont
Sold
Sold
Sold
Sold
CONVERTIBLE PRODUCTS (Continued)
*****Note: As of 3rd quarter FY19, Volumes for Good Neighbor (GN) sales are included but values for GN sales are not included. Therefore total value and value/volume do not reflect true values. Do not use this report to determine unit values. *****
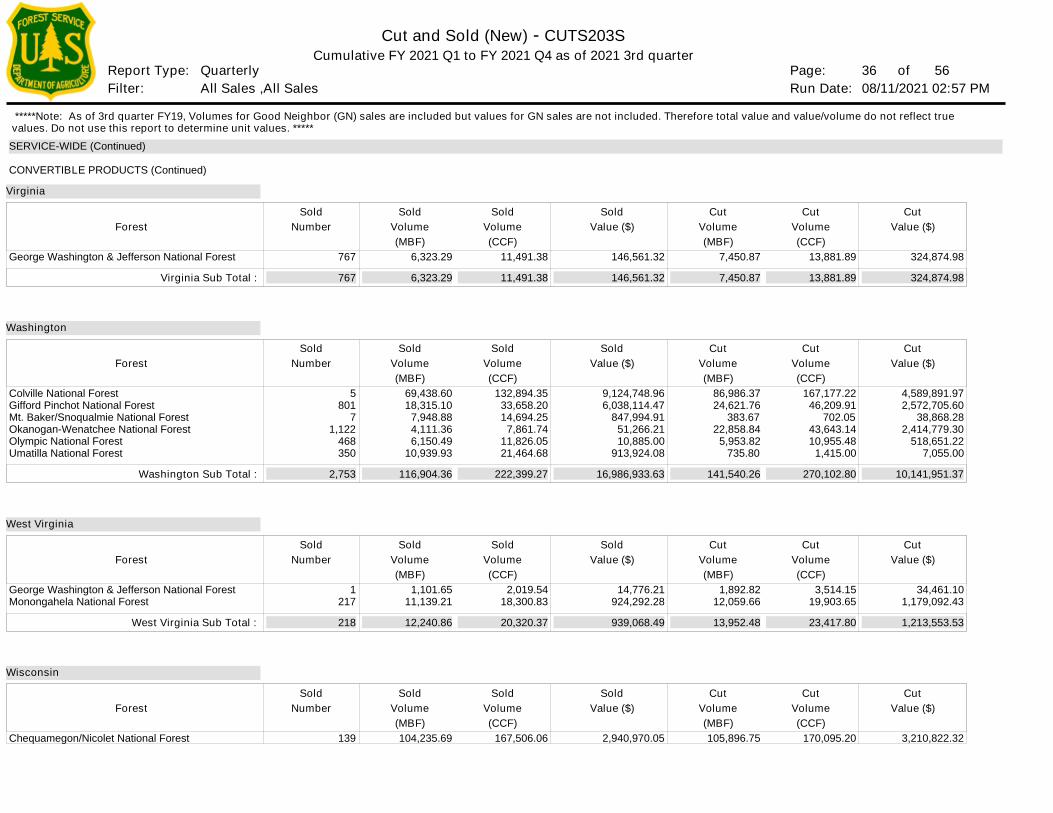
Page: Run Date:Filter:
Report Type:
Cut and Sold (New) - CUTS203S
36 of 08/11/2021 02:57 PM
Cumulative FY 2021 Q1 to FY 2021 Q4 as of 2021 3rd quarter
All Sales ,All Sales Quarterly 56
SERVICE-WIDE (Continued)
Forest
Forest
Forest
Forest
Volume
Volume
Volume
Volume
George Washington & Jefferson National Forest
Colville National ForestGifford Pinchot National ForestMt. Baker/Snoqualmie National ForestOkanogan-Wenatchee National ForestOlympic National ForestUmatilla National Forest
George Washington & Jefferson National ForestMonongahela National Forest
Chequamegon/Nicolet National Forest
324,874.98
4,589,891.97 2,572,705.60
38,868.28 2,414,779.30
518,651.22 7,055.00
34,461.10 1,179,092.43
3,210,822.32
13,881.89
167,177.22 46,209.91
702.05 43,643.14 10,955.48
1,415.00
3,514.15 19,903.65
170,095.20
(CCF)
(CCF)
(CCF)
(CCF)
(MBF)
(MBF)
(MBF)
(MBF)
7,450.87
86,986.37 24,621.76
383.67 22,858.84
5,953.82 735.80
1,892.82 12,059.66
105,896.75
Virginia Sub Total :
Washington Sub Total :
West Virginia Sub Total :
Cut
Cut
Cut
Cut
Volume
Volume
Volume
Volume
Cut
Cut
Cut
Cut
Value ($)
Value ($)
Value ($)
Value ($)
Cut
Cut
Cut
Cut
146,561.32
9,124,748.96 6,038,114.47
847,994.91 51,266.21 10,885.00
913,924.08
14,776.21 924,292.28
2,940,970.05
11,491.38
132,894.35 33,658.20 14,694.25
7,861.74 11,826.05 21,464.68
2,019.54 18,300.83
167,506.06
6,323.29
69,438.60 18,315.10
7,948.88 4,111.36 6,150.49
10,939.93
1,101.65 11,139.21
104,235.69
Volume
Volume
Volume
Volume
(CCF)
(CCF)
(CCF)
(CCF)
(MBF)
(MBF)
(MBF)
(MBF)
Sold
Sold
Sold
Sold
Volume
Volume
Volume
Volume
Sold
Sold
Sold
Sold
Value ($)
Value ($)
Value ($)
Value ($)
Sold
Sold
Sold
Sold
Number
Number
Number
Number
767
5 801
7 1,122
468 350
1 217
139
767
2,753
218
6,323.29
116,904.36
12,240.86
11,491.38
222,399.27
20,320.37
146,561.32
16,986,933.63
939,068.49
7,450.87
141,540.26
13,952.48
13,881.89
270,102.80
23,417.80
324,874.98
10,141,951.37
1,213,553.53
Virginia
Washington
West Virginia
Wisconsin
Sold
Sold
Sold
Sold
CONVERTIBLE PRODUCTS (Continued)
*****Note: As of 3rd quarter FY19, Volumes for Good Neighbor (GN) sales are included but values for GN sales are not included. Therefore total value and value/volume do not reflect true values. Do not use this report to determine unit values. *****
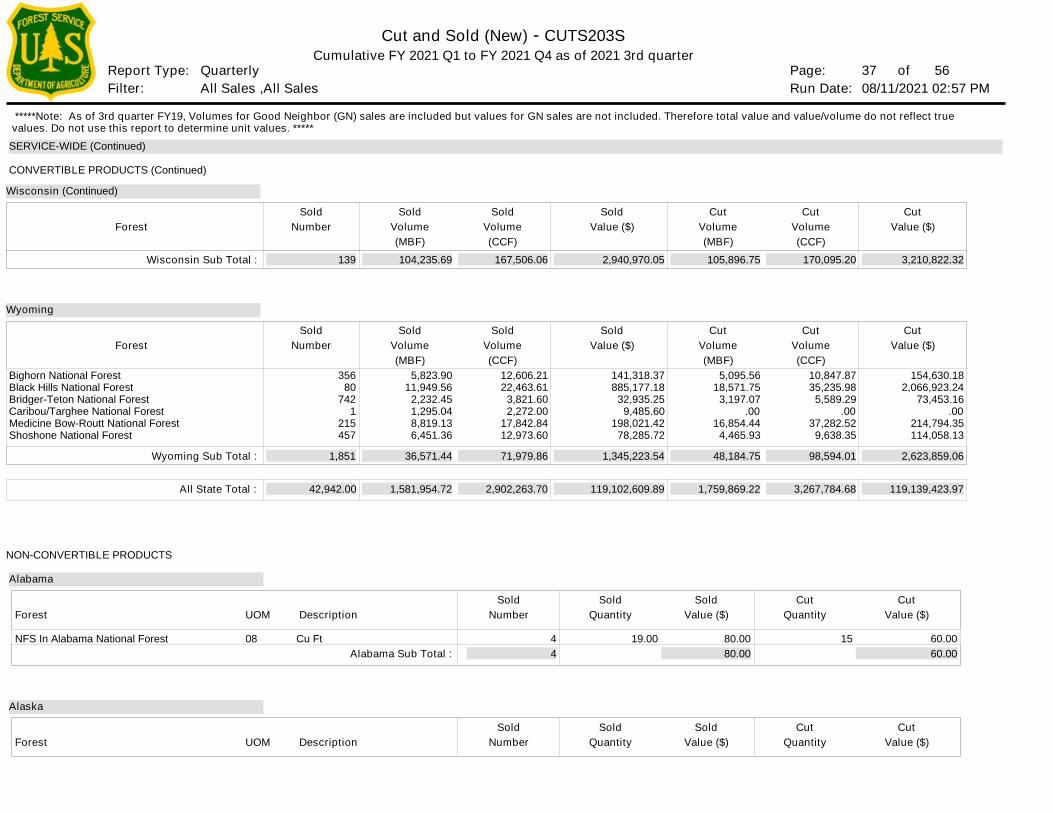
Page: Run Date:Filter:
Report Type:
Cut and Sold (New) - CUTS203S
37 of 08/11/2021 02:57 PM
Cumulative FY 2021 Q1 to FY 2021 Q4 as of 2021 3rd quarter
All Sales ,All Sales Quarterly 56
SERVICE-WIDE (Continued)
Description
Description
08 Cu Ft 60.00 15
Quantity
Quantity
Cut
Cut
Value ($)
Value ($)
Cut
Cut
80.00 19.00
Quantity
Quantity
Sold
Sold
Value ($)
Value ($)
Sold
Sold
80.00 60.00NFS In Alabama National Forest
UOM
UOM
NON-CONVERTIBLE PRODUCTS
Alabama
Alaska
Alabama Sub Total :
Forest
Forest
Number
Number
4 4
Sold
Sold
Forest
Forest
Volume
Volume
Bighorn National ForestBlack Hills National ForestBridger-Teton National ForestCaribou/Targhee National ForestMedicine Bow-Routt National ForestShoshone National Forest
154,630.18 2,066,923.24
73,453.16 .00
214,794.35 114,058.13
10,847.87 35,235.98
5,589.29 .00
37,282.52 9,638.35
(CCF)
(CCF)
(MBF)
(MBF) 5,095.56
18,571.75 3,197.07
.00 16,854.44
4,465.93
Wisconsin Sub Total :
Wyoming Sub Total :
Cut
Cut
Volume
Volume
Cut
Cut
Value ($)
Value ($)
Cut
Cut
141,318.37 885,177.18
32,935.25 9,485.60
198,021.42 78,285.72
12,606.21 22,463.61
3,821.60 2,272.00
17,842.84 12,973.60
5,823.90 11,949.56
2,232.45 1,295.04 8,819.13 6,451.36
Volume
Volume
(CCF)
(CCF)
(MBF)
(MBF)
Sold
Sold
Volume
Volume
Sold
Sold
Value ($)
Value ($)
Sold
Sold
Number
Number
356 80
742 1
215 457
139
1,851
104,235.69
36,571.44
167,506.06
71,979.86
2,940,970.05
1,345,223.54
105,896.75
48,184.75
170,095.20
98,594.01
3,210,822.32
2,623,859.06
Wyoming
Wisconsin (Continued)
Sold
Sold
CONVERTIBLE PRODUCTS (Continued)
All State Total : 42,942.00 1,581,954.72 2,902,263.70 119,102,609.89 1,759,869.22 3,267,784.68 119,139,423.97
*****Note: As of 3rd quarter FY19, Volumes for Good Neighbor (GN) sales are included but values for GN sales are not included. Therefore total value and value/volume do not reflect true values. Do not use this report to determine unit values. *****
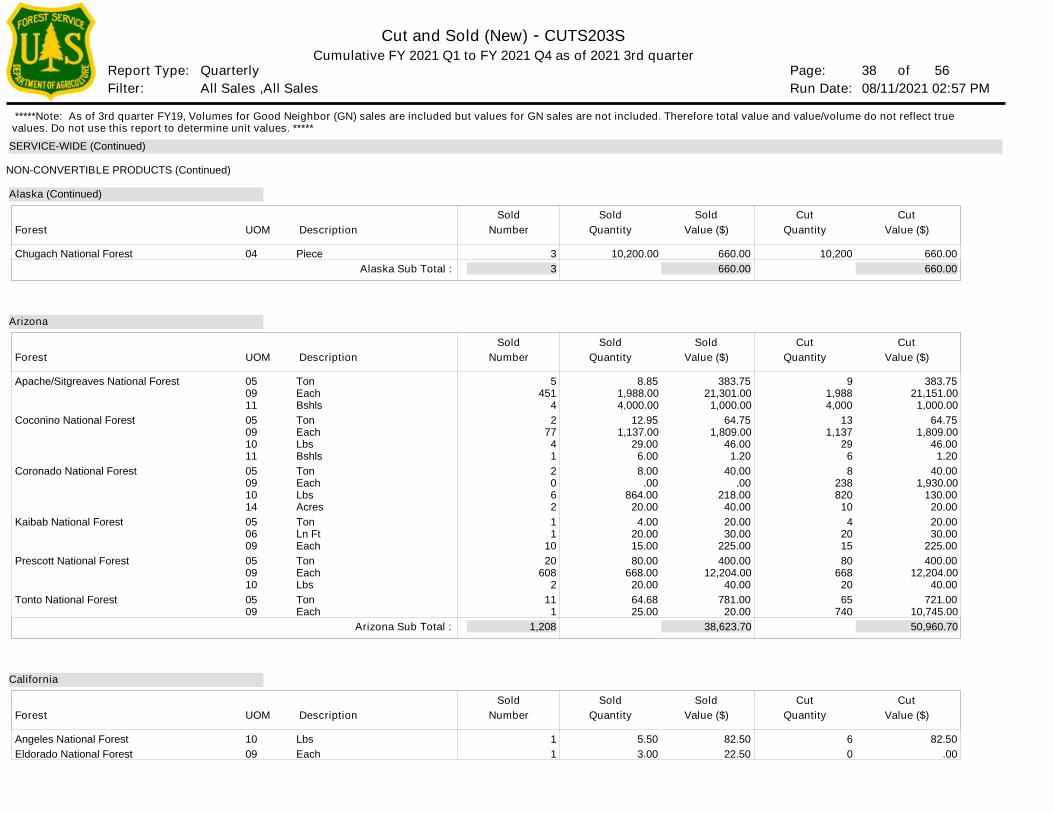
Page: Run Date:Filter:
Report Type:
Cut and Sold (New) - CUTS203S
38 of 08/11/2021 02:57 PM
Cumulative FY 2021 Q1 to FY 2021 Q4 as of 2021 3rd quarter
All Sales ,All Sales Quarterly 56
SERVICE-WIDE (Continued)
Description
Description
Description
04
05091105091011050910140506090509100509
1009
Piece
TonEachBshlsTonEachLbsBshlsTonEachLbsAcresTonLn FtEachTonEachLbsTonEach
LbsEach
660.00
383.75 21,151.00
1,000.00 64.75
1,809.00 46.00
1.20 40.00
1,930.00 130.00
20.00 20.00 30.00
225.00 400.00
12,204.00 40.00
721.00 10,745.00
82.50 .00
10,200
9 1,988 4,000
13 1,137
29 6 8
238 820
10 4
20 15 80
668 20 65
740
6 0
Quantity
Quantity
Quantity
Cut
Cut
Cut
Value ($)
Value ($)
Value ($)
Cut
Cut
Cut
660.00
383.75 21,301.00
1,000.00 64.75
1,809.00 46.00
1.20 40.00
.00 218.00
40.00 20.00 30.00
225.00 400.00
12,204.00 40.00
781.00 20.00
82.50 22.50
10,200.00
8.85 1,988.00 4,000.00
12.95 1,137.00
29.00 6.00 8.00
.00 864.00
20.00 4.00
20.00 15.00 80.00
668.00 20.00 64.68 25.00
5.50 3.00
Quantity
Quantity
Quantity
Sold
Sold
Sold
Value ($)
Value ($)
Value ($)
Sold
Sold
Sold
660.00
38,623.70
660.00
50,960.70
Chugach National Forest
Apache/Sitgreaves National Forest
Coconino National Forest
Coronado National Forest
Kaibab National Forest
Prescott National Forest
Tonto National Forest
Angeles National ForestEldorado National Forest
UOM
UOM
UOM
NON-CONVERTIBLE PRODUCTS (Continued)
Arizona
California
Alaska (Continued)
Alaska Sub Total :
Arizona Sub Total :
Forest
Forest
Forest
Number
Number
Number
3
5 451
4 2
77 4 1 2 0 6 2 1 1
10 20
608 2
11 1
1 1
3
1,208
Sold
Sold
Sold
*****Note: As of 3rd quarter FY19, Volumes for Good Neighbor (GN) sales are included but values for GN sales are not included. Therefore total value and value/volume do not reflect true values. Do not use this report to determine unit values. *****
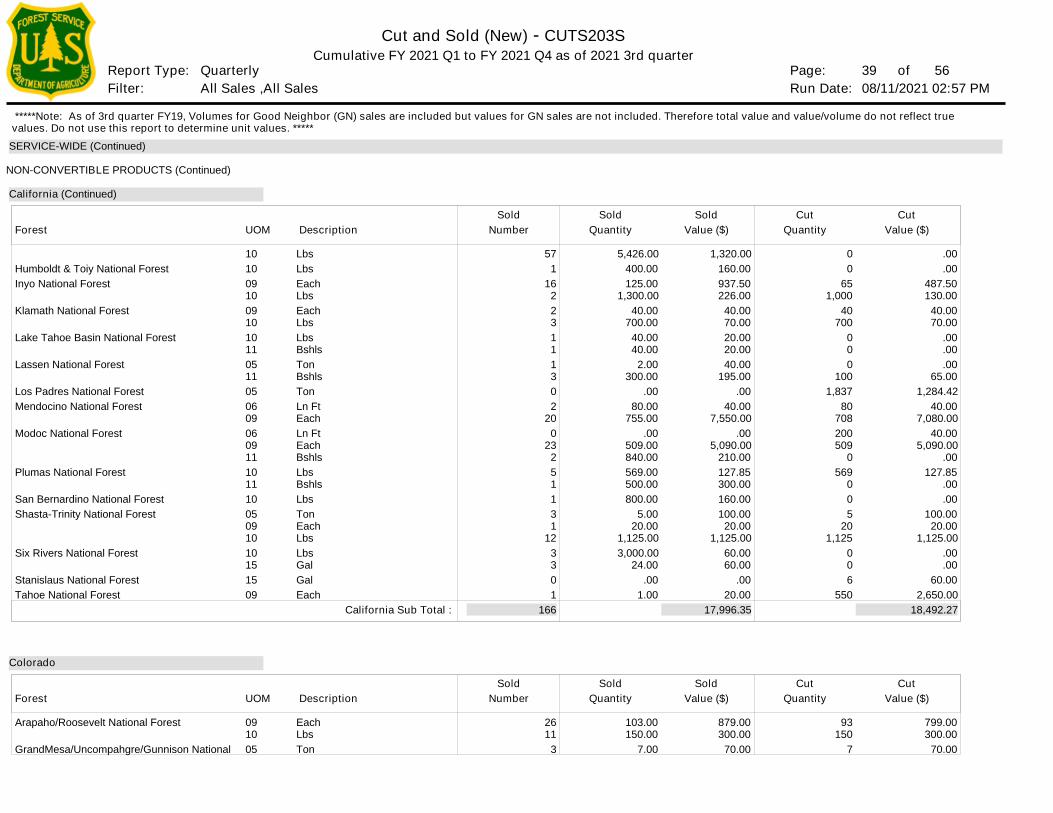
Page: Run Date:Filter:
Report Type:
Cut and Sold (New) - CUTS203S
39 of 08/11/2021 02:57 PM
Cumulative FY 2021 Q1 to FY 2021 Q4 as of 2021 3rd quarter
All Sales ,All Sales Quarterly 56
SERVICE-WIDE (Continued)
Description
Description
1010091009101011051105060906091110111005091010151509
091005
LbsLbsEachLbsEachLbsLbsBshlsTonBshlsTonLn FtEachLn FtEachBshlsLbsBshlsLbsTonEachLbsLbsGalGalEach
EachLbsTon
.00 .00
487.50 130.00
40.00 70.00
.00 .00 .00
65.00 1,284.42
40.00 7,080.00
40.00 5,090.00
.00 127.85
.00 .00
100.00 20.00
1,125.00 .00 .00
60.00 2,650.00
799.00 300.00
70.00
0 0
65 1,000
40 700
0 0 0
100 1,837
80 708 200 509
0 569
0 0 5
20 1,125
0 0 6
550
93 150
7
Quantity
Quantity
Cut
Cut
Value ($)
Value ($)
Cut
Cut
1,320.00 160.00 937.50 226.00
40.00 70.00 20.00 20.00 40.00
195.00 .00
40.00 7,550.00
.00 5,090.00
210.00 127.85 300.00 160.00 100.00
20.00 1,125.00
60.00 60.00
.00 20.00
879.00 300.00
70.00
5,426.00 400.00 125.00
1,300.00 40.00
700.00 40.00 40.00
2.00 300.00
.00 80.00
755.00 .00
509.00 840.00 569.00 500.00 800.00
5.00 20.00
1,125.00 3,000.00
24.00 .00
1.00
103.00 150.00
7.00
Quantity
Quantity
Sold
Sold
Value ($)
Value ($)
Sold
Sold
17,996.35 18,492.27
Humboldt & Toiy National ForestInyo National Forest
Klamath National Forest
Lake Tahoe Basin National Forest
Lassen National Forest
Los Padres National ForestMendocino National Forest
Modoc National Forest
Plumas National Forest
San Bernardino National ForestShasta-Trinity National Forest
Six Rivers National Forest
Stanislaus National ForestTahoe National Forest
Arapaho/Roosevelt National Forest
GrandMesa/Uncompahgre/Gunnison National
UOM
UOM
NON-CONVERTIBLE PRODUCTS (Continued)
Colorado
California (Continued)
California Sub Total :
Forest
Forest
Number
Number
57 1
16 2 2 3 1 1 1 3 0 2
20 0
23 2 5 1 1 3 1
12 3 3 0 1
26 11
3
166
Sold
Sold
*****Note: As of 3rd quarter FY19, Volumes for Good Neighbor (GN) sales are included but values for GN sales are not included. Therefore total value and value/volume do not reflect true values. Do not use this report to determine unit values. *****
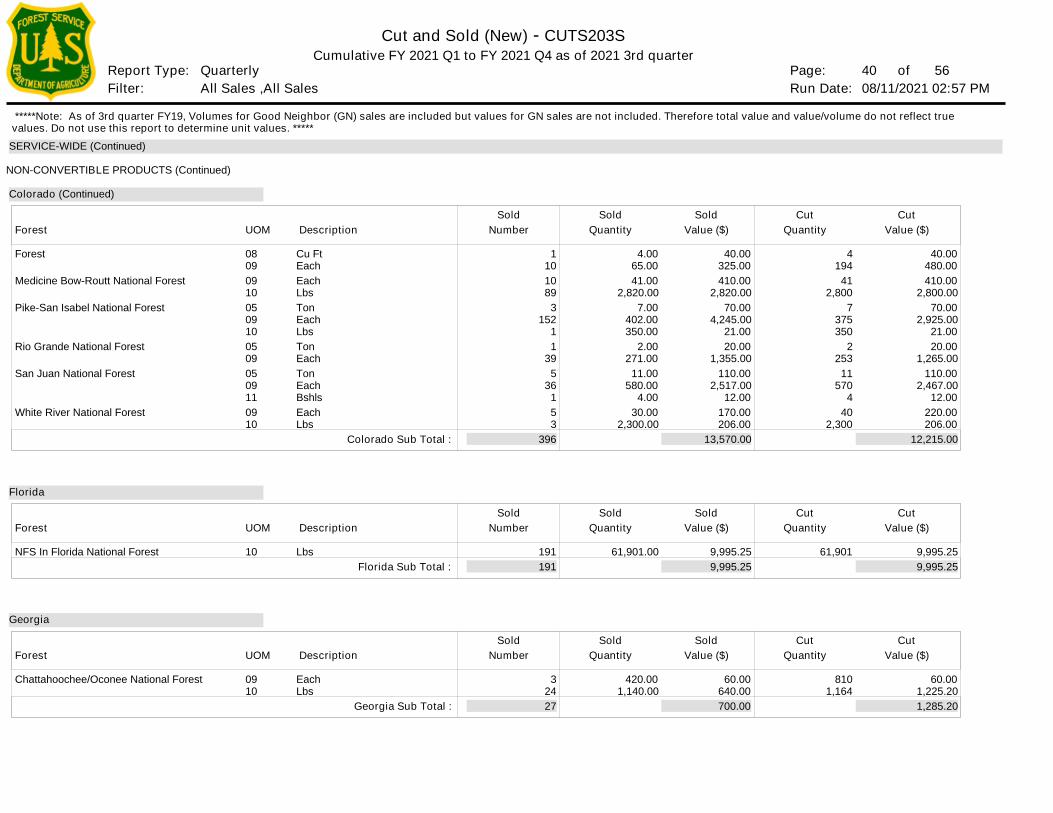
Page: Run Date:Filter:
Report Type:
Cut and Sold (New) - CUTS203S
40 of 08/11/2021 02:57 PM
Cumulative FY 2021 Q1 to FY 2021 Q4 as of 2021 3rd quarter
All Sales ,All Sales Quarterly 56
SERVICE-WIDE (Continued)
Description
Description
Description
0809091005091005090509110910
10
0910
Cu FtEachEachLbsTonEachLbsTonEachTonEachBshlsEachLbs
Lbs
EachLbs
40.00 480.00 410.00
2,800.00 70.00
2,925.00 21.00 20.00
1,265.00 110.00
2,467.00 12.00
220.00 206.00
9,995.25
60.00 1,225.20
4 194
41 2,800
7 375 350
2 253
11 570
4 40
2,300
61,901
810 1,164
Quantity
Quantity
Quantity
Cut
Cut
Cut
Value ($)
Value ($)
Value ($)
Cut
Cut
Cut
40.00 325.00 410.00
2,820.00 70.00
4,245.00 21.00 20.00
1,355.00 110.00
2,517.00 12.00
170.00 206.00
9,995.25
60.00 640.00
4.00 65.00 41.00
2,820.00 7.00
402.00 350.00
2.00 271.00
11.00 580.00
4.00 30.00
2,300.00
61,901.00
420.00 1,140.00
Quantity
Quantity
Quantity
Sold
Sold
Sold
Value ($)
Value ($)
Value ($)
Sold
Sold
Sold
13,570.00
9,995.25
700.00
12,215.00
9,995.25
1,285.20
Forest
Medicine Bow-Routt National Forest
Pike-San Isabel National Forest
Rio Grande National Forest
San Juan National Forest
White River National Forest
NFS In Florida National Forest
Chattahoochee/Oconee National Forest
UOM
UOM
UOM
NON-CONVERTIBLE PRODUCTS (Continued)
Florida
Georgia
Colorado (Continued)
Colorado Sub Total :
Florida Sub Total :
Georgia Sub Total :
Forest
Forest
Forest
Number
Number
Number
1 10 10 89
3 152
1 1
39 5
36 1 5 3
191
3 24
396
191
27
Sold
Sold
Sold
*****Note: As of 3rd quarter FY19, Volumes for Good Neighbor (GN) sales are included but values for GN sales are not included. Therefore total value and value/volume do not reflect true values. Do not use this report to determine unit values. *****
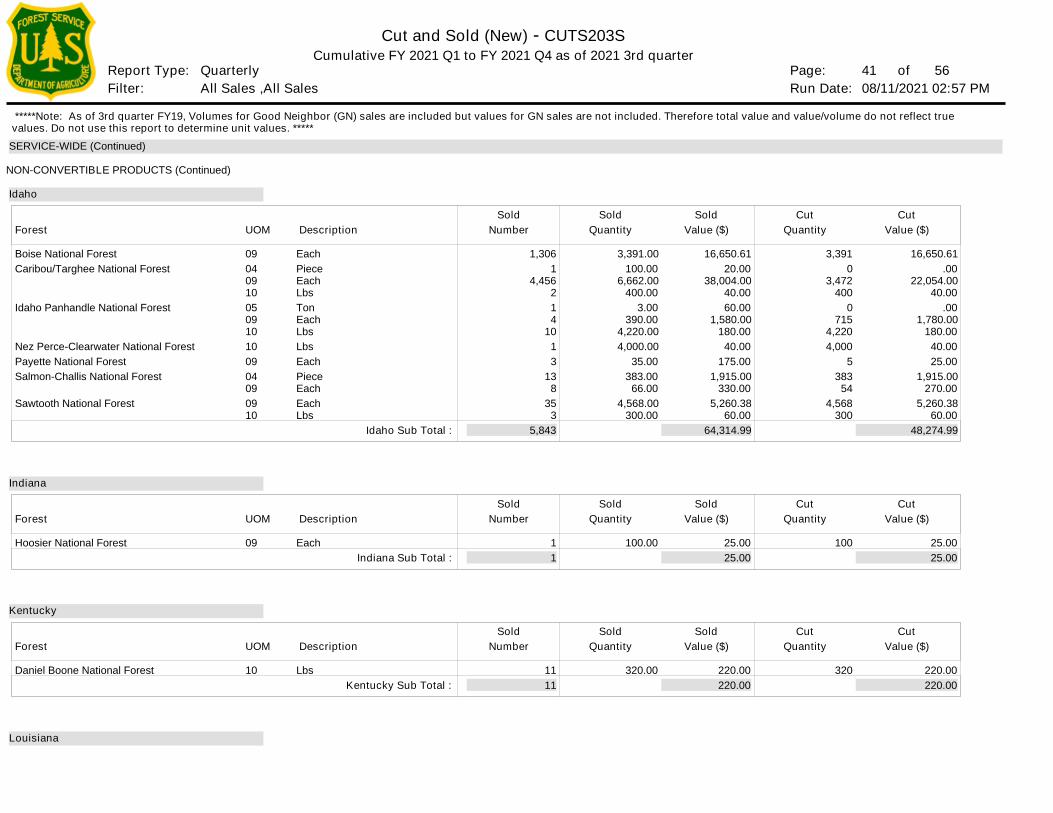
Page: Run Date:Filter:
Report Type:
Cut and Sold (New) - CUTS203S
41 of 08/11/2021 02:57 PM
Cumulative FY 2021 Q1 to FY 2021 Q4 as of 2021 3rd quarter
All Sales ,All Sales Quarterly 56
SERVICE-WIDE (Continued)
Description
Description
Description
09040910050910100904090910
09
10
EachPieceEachLbsTonEachLbsLbsEachPieceEachEachLbs
Each
Lbs
16,650.61 .00
22,054.00 40.00
.00 1,780.00
180.00 40.00 25.00
1,915.00 270.00
5,260.38 60.00
25.00
220.00
3,391 0
3,472 400
0 715
4,220 4,000
5 383
54 4,568
300
100
320
Quantity
Quantity
Quantity
Cut
Cut
Cut
Value ($)
Value ($)
Value ($)
Cut
Cut
Cut
16,650.61 20.00
38,004.00 40.00 60.00
1,580.00 180.00
40.00 175.00
1,915.00 330.00
5,260.38 60.00
25.00
220.00
3,391.00 100.00
6,662.00 400.00
3.00 390.00
4,220.00 4,000.00
35.00 383.00
66.00 4,568.00
300.00
100.00
320.00
Quantity
Quantity
Quantity
Sold
Sold
Sold
Value ($)
Value ($)
Value ($)
Sold
Sold
Sold
64,314.99
25.00
220.00
48,274.99
25.00
220.00
Boise National ForestCaribou/Targhee National Forest
Idaho Panhandle National Forest
Nez Perce-Clearwater National ForestPayette National ForestSalmon-Challis National Forest
Sawtooth National Forest
Hoosier National Forest
Daniel Boone National Forest
UOM
UOM
UOM
NON-CONVERTIBLE PRODUCTS (Continued)
Idaho
Indiana
Kentucky
Louisiana
Idaho Sub Total :
Indiana Sub Total :
Kentucky Sub Total :
Forest
Forest
Forest
Number
Number
Number
1,306 1
4,456 2 1 4
10 1 3
13 8
35 3
1
11
5,843
1
11
Sold
Sold
Sold
*****Note: As of 3rd quarter FY19, Volumes for Good Neighbor (GN) sales are included but values for GN sales are not included. Therefore total value and value/volume do not reflect true values. Do not use this report to determine unit values. *****
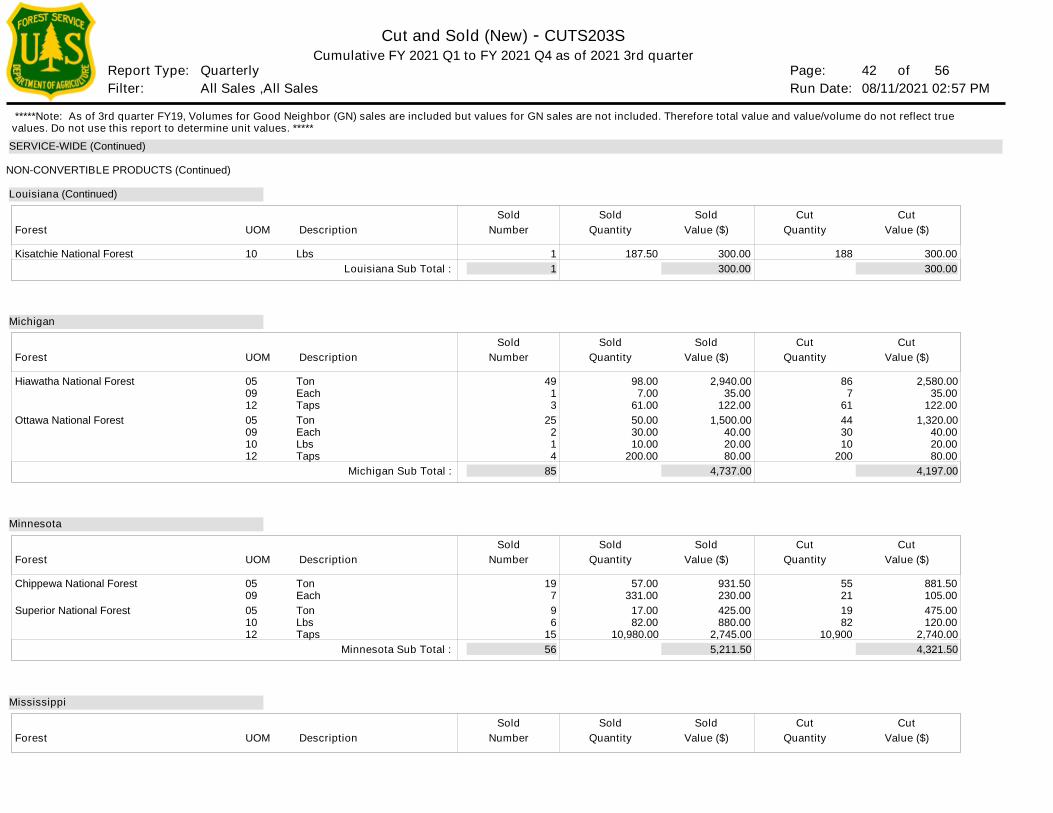
Page: Run Date:Filter:
Report Type:
Cut and Sold (New) - CUTS203S
42 of 08/11/2021 02:57 PM
Cumulative FY 2021 Q1 to FY 2021 Q4 as of 2021 3rd quarter
All Sales ,All Sales Quarterly 56
SERVICE-WIDE (Continued)
Description
Description
Description
Description
10
05091205091012
0509051012
Lbs
TonEachTapsTonEachLbsTaps
TonEachTonLbsTaps
300.00
2,580.00 35.00
122.00 1,320.00
40.00 20.00 80.00
881.50 105.00 475.00 120.00
2,740.00
188
86 7
61 44 30 10
200
55 21 19 82
10,900
Quantity
Quantity
Quantity
Quantity
Cut
Cut
Cut
Cut
Value ($)
Value ($)
Value ($)
Value ($)
Cut
Cut
Cut
Cut
300.00
2,940.00 35.00
122.00 1,500.00
40.00 20.00 80.00
931.50 230.00 425.00 880.00
2,745.00
187.50
98.00 7.00
61.00 50.00 30.00 10.00
200.00
57.00 331.00
17.00 82.00
10,980.00
Quantity
Quantity
Quantity
Quantity
Sold
Sold
Sold
Sold
Value ($)
Value ($)
Value ($)
Value ($)
Sold
Sold
Sold
Sold
300.00
4,737.00
5,211.50
300.00
4,197.00
4,321.50
Kisatchie National Forest
Hiawatha National Forest
Ottawa National Forest
Chippewa National Forest
Superior National Forest
UOM
UOM
UOM
UOM
NON-CONVERTIBLE PRODUCTS (Continued)
Michigan
Minnesota
Mississippi
Louisiana (Continued)
Louisiana Sub Total :
Michigan Sub Total :
Minnesota Sub Total :
Forest
Forest
Forest
Forest
Number
Number
Number
Number
1
49 1 3
25 2 1 4
19 7 9 6
15
1
85
56
Sold
Sold
Sold
Sold
*****Note: As of 3rd quarter FY19, Volumes for Good Neighbor (GN) sales are included but values for GN sales are not included. Therefore total value and value/volume do not reflect true values. Do not use this report to determine unit values. *****
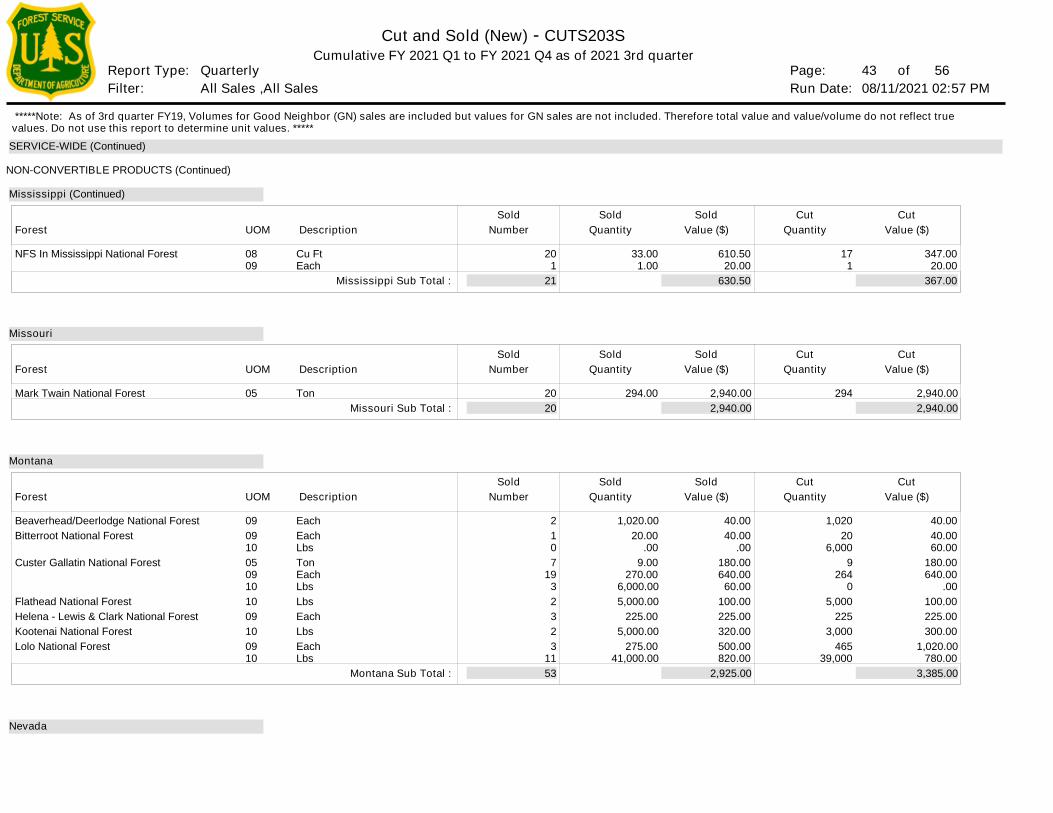
Page: Run Date:Filter:
Report Type:
Cut and Sold (New) - CUTS203S
43 of 08/11/2021 02:57 PM
Cumulative FY 2021 Q1 to FY 2021 Q4 as of 2021 3rd quarter
All Sales ,All Sales Quarterly 56
SERVICE-WIDE (Continued)
Description
Description
Description
0809
05
0909100509101009100910
Cu FtEach
Ton
EachEachLbsTonEachLbsLbsEachLbsEachLbs
347.00 20.00
2,940.00
40.00 40.00 60.00
180.00 640.00
.00 100.00 225.00 300.00
1,020.00 780.00
17 1
294
1,020 20
6,000 9
264 0
5,000 225
3,000 465
39,000
Quantity
Quantity
Quantity
Cut
Cut
Cut
Value ($)
Value ($)
Value ($)
Cut
Cut
Cut
610.50 20.00
2,940.00
40.00 40.00
.00 180.00 640.00
60.00 100.00 225.00 320.00 500.00 820.00
33.00 1.00
294.00
1,020.00 20.00
.00 9.00
270.00 6,000.00 5,000.00
225.00 5,000.00
275.00 41,000.00
Quantity
Quantity
Quantity
Sold
Sold
Sold
Value ($)
Value ($)
Value ($)
Sold
Sold
Sold
630.50
2,940.00
2,925.00
367.00
2,940.00
3,385.00
NFS In Mississippi National Forest
Mark Twain National Forest
Beaverhead/Deerlodge National ForestBitterroot National Forest
Custer Gallatin National Forest
Flathead National ForestHelena - Lewis & Clark National ForestKootenai National ForestLolo National Forest
UOM
UOM
UOM
NON-CONVERTIBLE PRODUCTS (Continued)
Missouri
Montana
Nevada
Mississippi (Continued)
Mississippi Sub Total :
Missouri Sub Total :
Montana Sub Total :
Forest
Forest
Forest
Number
Number
Number
20 1
20
2 1 0 7
19 3 2 3 2 3
11
21
20
53
Sold
Sold
Sold
*****Note: As of 3rd quarter FY19, Volumes for Good Neighbor (GN) sales are included but values for GN sales are not included. Therefore total value and value/volume do not reflect true values. Do not use this report to determine unit values. *****
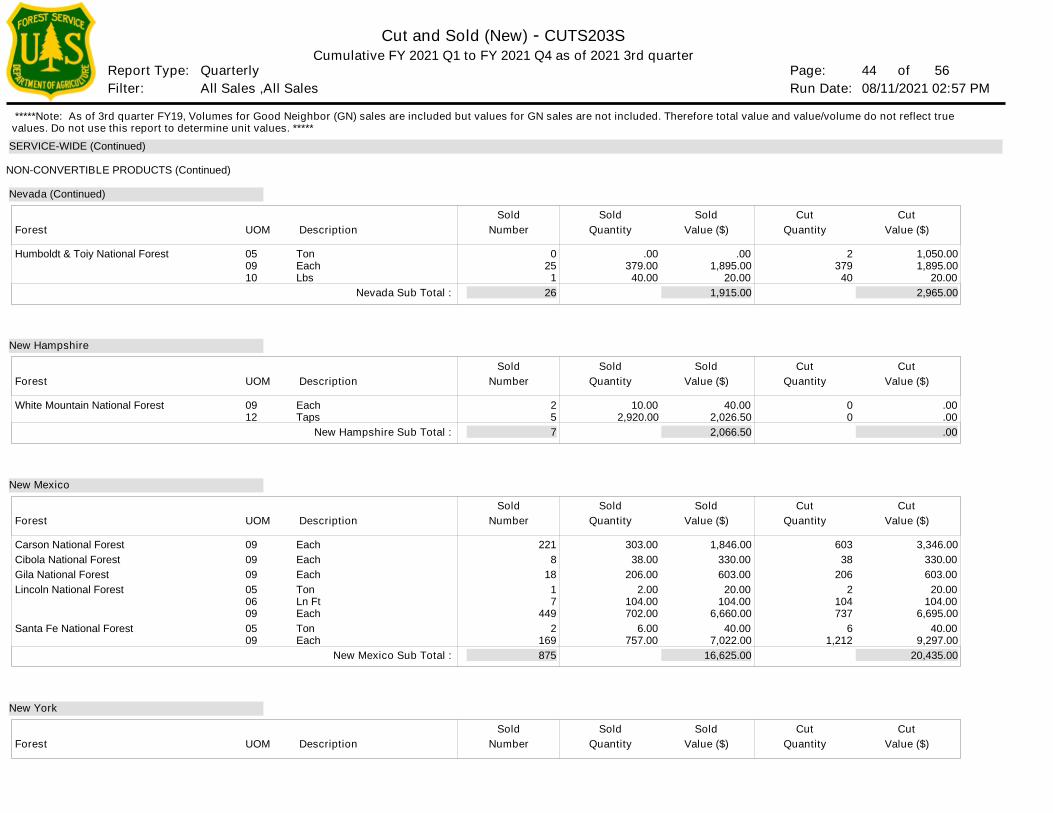
Page: Run Date:Filter:
Report Type:
Cut and Sold (New) - CUTS203S
44 of 08/11/2021 02:57 PM
Cumulative FY 2021 Q1 to FY 2021 Q4 as of 2021 3rd quarter
All Sales ,All Sales Quarterly 56
SERVICE-WIDE (Continued)
Description
Description
Description
Description
050910
0912
0909090506090509
TonEachLbs
EachTaps
EachEachEachTonLn FtEachTonEach
1,050.00 1,895.00
20.00
.00 .00
3,346.00 330.00 603.00
20.00 104.00
6,695.00 40.00
9,297.00
2 379
40
0 0
603 38
206 2
104 737
6 1,212
Quantity
Quantity
Quantity
Quantity
Cut
Cut
Cut
Cut
Value ($)
Value ($)
Value ($)
Value ($)
Cut
Cut
Cut
Cut
.00 1,895.00
20.00
40.00 2,026.50
1,846.00 330.00 603.00
20.00 104.00
6,660.00 40.00
7,022.00
.00 379.00
40.00
10.00 2,920.00
303.00 38.00
206.00 2.00
104.00 702.00
6.00 757.00
Quantity
Quantity
Quantity
Quantity
Sold
Sold
Sold
Sold
Value ($)
Value ($)
Value ($)
Value ($)
Sold
Sold
Sold
Sold
1,915.00
2,066.50
16,625.00
2,965.00
.00
20,435.00
Humboldt & Toiy National Forest
White Mountain National Forest
Carson National ForestCibola National ForestGila National ForestLincoln National Forest
Santa Fe National Forest
UOM
UOM
UOM
UOM
NON-CONVERTIBLE PRODUCTS (Continued)
New Hampshire
New Mexico
New York
Nevada (Continued)
Nevada Sub Total :
New Hampshire Sub Total :
New Mexico Sub Total :
Forest
Forest
Forest
Forest
Number
Number
Number
Number
0 25
1
2 5
221 8
18 1 7
449 2
169
26
7
875
Sold
Sold
Sold
Sold
*****Note: As of 3rd quarter FY19, Volumes for Good Neighbor (GN) sales are included but values for GN sales are not included. Therefore total value and value/volume do not reflect true values. Do not use this report to determine unit values. *****
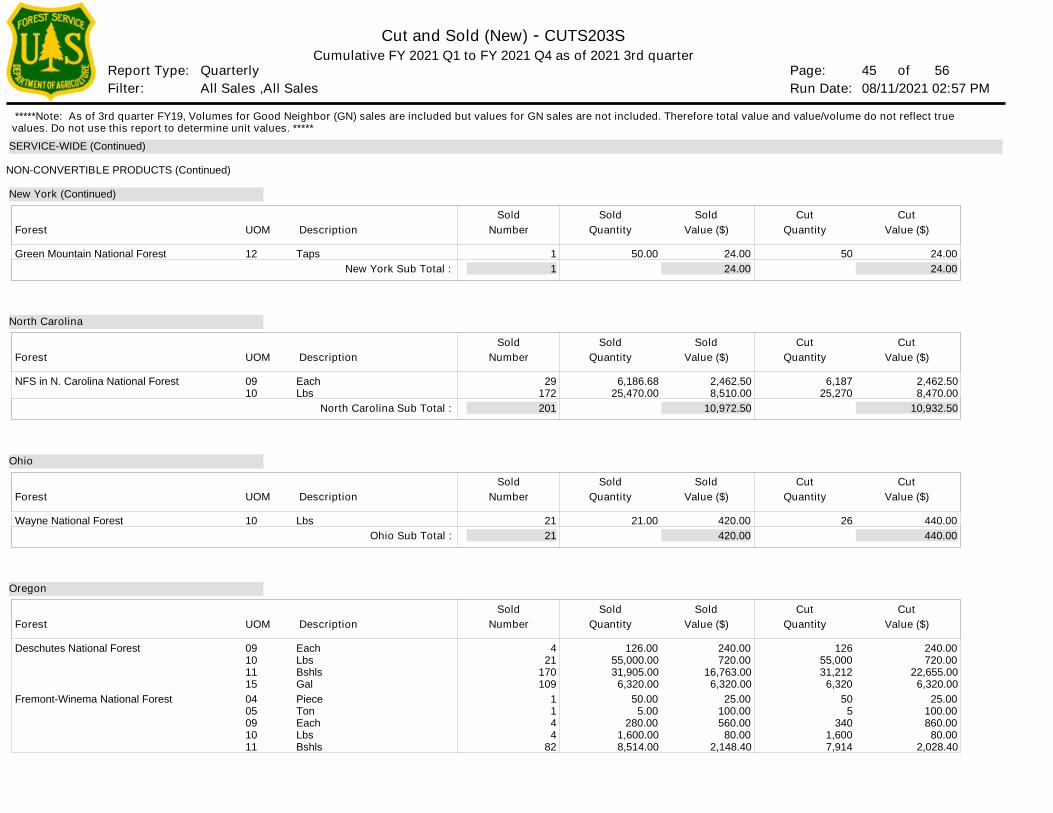
Page: Run Date:Filter:
Report Type:
Cut and Sold (New) - CUTS203S
45 of 08/11/2021 02:57 PM
Cumulative FY 2021 Q1 to FY 2021 Q4 as of 2021 3rd quarter
All Sales ,All Sales Quarterly 56
SERVICE-WIDE (Continued)
Description
Description
Description
Description
12
0910
10
091011150405091011
Taps
EachLbs
Lbs
EachLbsBshlsGalPieceTonEachLbsBshls
24.00
2,462.50 8,470.00
440.00
240.00 720.00
22,655.00 6,320.00
25.00 100.00 860.00
80.00 2,028.40
50
6,187 25,270
26
126 55,000 31,212
6,320 50
5 340
1,600 7,914
Quantity
Quantity
Quantity
Quantity
Cut
Cut
Cut
Cut
Value ($)
Value ($)
Value ($)
Value ($)
Cut
Cut
Cut
Cut
24.00
2,462.50 8,510.00
420.00
240.00 720.00
16,763.00 6,320.00
25.00 100.00 560.00
80.00 2,148.40
50.00
6,186.68 25,470.00
21.00
126.00 55,000.00 31,905.00
6,320.00 50.00
5.00 280.00
1,600.00 8,514.00
Quantity
Quantity
Quantity
Quantity
Sold
Sold
Sold
Sold
Value ($)
Value ($)
Value ($)
Value ($)
Sold
Sold
Sold
Sold
24.00
10,972.50
420.00
24.00
10,932.50
440.00
Green Mountain National Forest
NFS in N. Carolina National Forest
Wayne National Forest
Deschutes National Forest
Fremont-Winema National Forest
UOM
UOM
UOM
UOM
NON-CONVERTIBLE PRODUCTS (Continued)
North Carolina
Ohio
Oregon
New York (Continued)
New York Sub Total :
North Carolina Sub Total :
Ohio Sub Total :
Forest
Forest
Forest
Forest
Number
Number
Number
Number
1
29 172
21
4 21
170 109
1 1 4 4
82
1
201
21
Sold
Sold
Sold
Sold
*****Note: As of 3rd quarter FY19, Volumes for Good Neighbor (GN) sales are included but values for GN sales are not included. Therefore total value and value/volume do not reflect true values. Do not use this report to determine unit values. *****
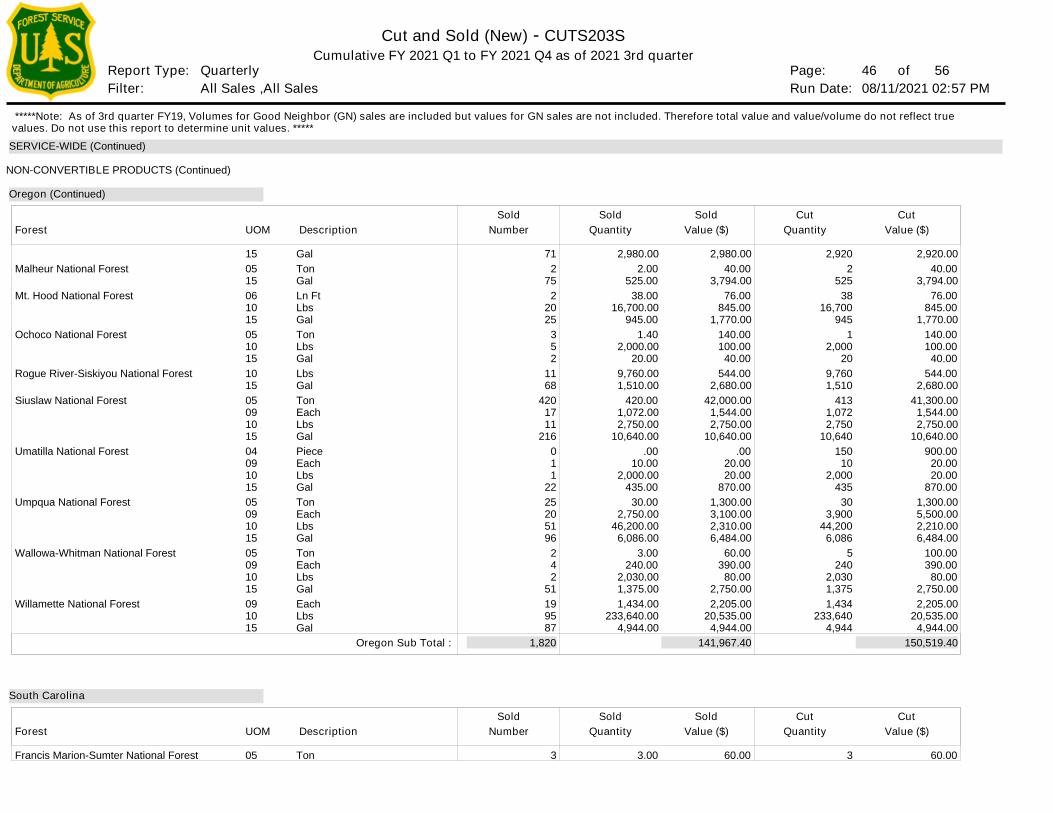
Page: Run Date:Filter:
Report Type:
Cut and Sold (New) - CUTS203S
46 of 08/11/2021 02:57 PM
Cumulative FY 2021 Q1 to FY 2021 Q4 as of 2021 3rd quarter
All Sales ,All Sales Quarterly 56
SERVICE-WIDE (Continued)
Description
Description
150515061015051015101505091015040910150509101505091015091015
05
GalTonGalLn FtLbsGalTonLbsGalLbsGalTonEachLbsGalPieceEachLbsGalTonEachLbsGalTonEachLbsGalEachLbsGal
Ton
2,920.00 40.00
3,794.00 76.00
845.00 1,770.00
140.00 100.00
40.00 544.00
2,680.00 41,300.00
1,544.00 2,750.00
10,640.00 900.00
20.00 20.00
870.00 1,300.00 5,500.00 2,210.00 6,484.00
100.00 390.00
80.00 2,750.00 2,205.00
20,535.00 4,944.00
60.00
2,920 2
525 38
16,700 945
1 2,000
20 9,760 1,510
413 1,072 2,750
10,640 150
10 2,000
435 30
3,900 44,200
6,086 5
240 2,030 1,375 1,434
233,640 4,944
3
Quantity
Quantity
Cut
Cut
Value ($)
Value ($)
Cut
Cut
2,980.00 40.00
3,794.00 76.00
845.00 1,770.00
140.00 100.00
40.00 544.00
2,680.00 42,000.00
1,544.00 2,750.00
10,640.00 .00
20.00 20.00
870.00 1,300.00 3,100.00 2,310.00 6,484.00
60.00 390.00
80.00 2,750.00 2,205.00
20,535.00 4,944.00
60.00
2,980.00 2.00
525.00 38.00
16,700.00 945.00
1.40 2,000.00
20.00 9,760.00 1,510.00
420.00 1,072.00 2,750.00
10,640.00 .00
10.00 2,000.00
435.00 30.00
2,750.00 46,200.00
6,086.00 3.00
240.00 2,030.00 1,375.00 1,434.00
233,640.00 4,944.00
3.00
Quantity
Quantity
Sold
Sold
Value ($)
Value ($)
Sold
Sold
141,967.40 150,519.40
Malheur National Forest
Mt. Hood National Forest
Ochoco National Forest
Rogue River-Siskiyou National Forest
Siuslaw National Forest
Umatilla National Forest
Umpqua National Forest
Wallowa-Whitman National Forest
Willamette National Forest
Francis Marion-Sumter National Forest
UOM
UOM
NON-CONVERTIBLE PRODUCTS (Continued)
South Carolina
Oregon (Continued)
Oregon Sub Total :
Forest
Forest
Number
Number
71 2
75 2
20 25
3 5 2
11 68
420 17 11
216 0 1 1
22 25 20 51 96
2 4 2
51 19 95 87
3
1,820
Sold
Sold
*****Note: As of 3rd quarter FY19, Volumes for Good Neighbor (GN) sales are included but values for GN sales are not included. Therefore total value and value/volume do not reflect true values. Do not use this report to determine unit values. *****
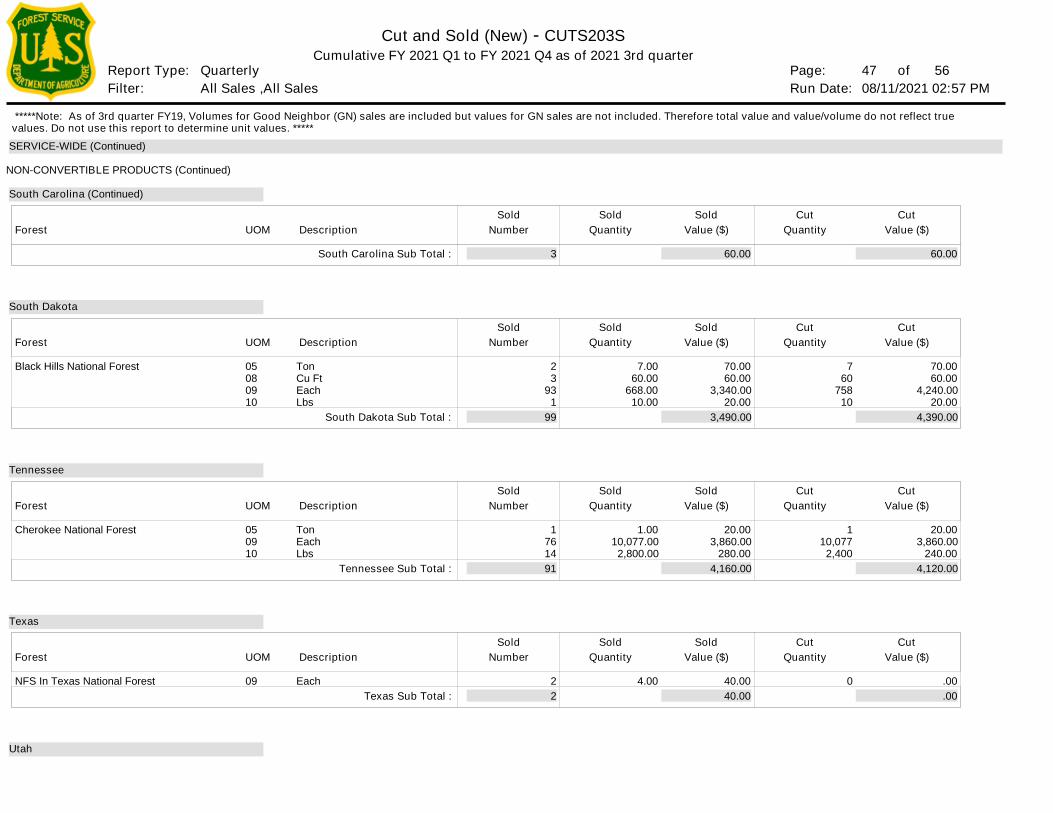
Page: Run Date:Filter:
Report Type:
Cut and Sold (New) - CUTS203S
47 of 08/11/2021 02:57 PM
Cumulative FY 2021 Q1 to FY 2021 Q4 as of 2021 3rd quarter
All Sales ,All Sales Quarterly 56
SERVICE-WIDE (Continued)
Description
Description
Description
Description
05080910
050910
09
TonCu FtEachLbs
TonEachLbs
Each
70.00 60.00
4,240.00 20.00
20.00 3,860.00
240.00
.00
7 60
758 10
1 10,077
2,400
0
Quantity
Quantity
Quantity
Quantity
Cut
Cut
Cut
Cut
Value ($)
Value ($)
Value ($)
Value ($)
Cut
Cut
Cut
Cut
70.00 60.00
3,340.00 20.00
20.00 3,860.00
280.00
40.00
7.00 60.00
668.00 10.00
1.00 10,077.00
2,800.00
4.00
Quantity
Quantity
Quantity
Quantity
Sold
Sold
Sold
Sold
Value ($)
Value ($)
Value ($)
Value ($)
Sold
Sold
Sold
Sold
60.00
3,490.00
4,160.00
40.00
60.00
4,390.00
4,120.00
.00
Black Hills National Forest
Cherokee National Forest
NFS In Texas National Forest
UOM
UOM
UOM
UOM
NON-CONVERTIBLE PRODUCTS (Continued)
South Dakota
Tennessee
Texas
Utah
South Carolina (Continued)
South Carolina Sub Total :
South Dakota Sub Total :
Tennessee Sub Total :
Texas Sub Total :
Forest
Forest
Forest
Forest
Number
Number
Number
Number
2 3
93 1
1 76 14
2
3
99
91
2
Sold
Sold
Sold
Sold
*****Note: As of 3rd quarter FY19, Volumes for Good Neighbor (GN) sales are included but values for GN sales are not included. Therefore total value and value/volume do not reflect true values. Do not use this report to determine unit values. *****
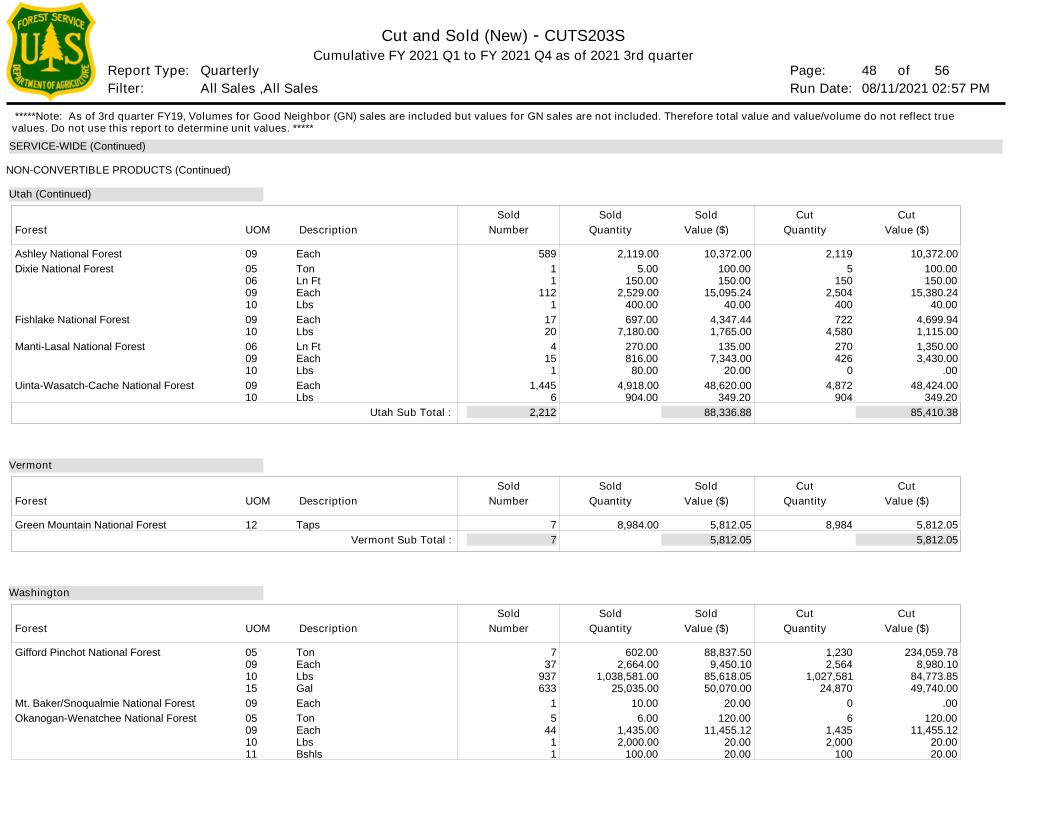
Page: Run Date:Filter:
Report Type:
Cut and Sold (New) - CUTS203S
48 of 08/11/2021 02:57 PM
Cumulative FY 2021 Q1 to FY 2021 Q4 as of 2021 3rd quarter
All Sales ,All Sales Quarterly 56
SERVICE-WIDE (Continued)
Description
Description
Description
090506091009100609100910
12
050910150905091011
EachTonLn FtEachLbsEachLbsLn FtEachLbsEachLbs
Taps
TonEachLbsGalEachTonEachLbsBshls
10,372.00 100.00 150.00
15,380.24 40.00
4,699.94 1,115.00 1,350.00 3,430.00
.00 48,424.00
349.20
5,812.05
234,059.78 8,980.10
84,773.85 49,740.00
.00 120.00
11,455.12 20.00 20.00
2,119 5
150 2,504
400 722
4,580 270 426
0 4,872
904
8,984
1,230 2,564
1,027,581 24,870
0 6
1,435 2,000
100
Quantity
Quantity
Quantity
Cut
Cut
Cut
Value ($)
Value ($)
Value ($)
Cut
Cut
Cut
10,372.00 100.00 150.00
15,095.24 40.00
4,347.44 1,765.00
135.00 7,343.00
20.00 48,620.00
349.20
5,812.05
88,837.50 9,450.10
85,618.05 50,070.00
20.00 120.00
11,455.12 20.00 20.00
2,119.00 5.00
150.00 2,529.00
400.00 697.00
7,180.00 270.00 816.00
80.00 4,918.00
904.00
8,984.00
602.00 2,664.00
1,038,581.00 25,035.00
10.00 6.00
1,435.00 2,000.00
100.00
Quantity
Quantity
Quantity
Sold
Sold
Sold
Value ($)
Value ($)
Value ($)
Sold
Sold
Sold
88,336.88
5,812.05
85,410.38
5,812.05
Ashley National ForestDixie National Forest
Fishlake National Forest
Manti-Lasal National Forest
Uinta-Wasatch-Cache National Forest
Green Mountain National Forest
Gifford Pinchot National Forest
Mt. Baker/Snoqualmie National ForestOkanogan-Wenatchee National Forest
UOM
UOM
UOM
NON-CONVERTIBLE PRODUCTS (Continued)
Vermont
Washington
Utah (Continued)
Utah Sub Total :
Vermont Sub Total :
Forest
Forest
Forest
Number
Number
Number
589 1 1
112 1
17 20
4 15
1 1,445
6
7
7 37
937 633
1 5
44 1 1
2,212
7
Sold
Sold
Sold
*****Note: As of 3rd quarter FY19, Volumes for Good Neighbor (GN) sales are included but values for GN sales are not included. Therefore total value and value/volume do not reflect true values. Do not use this report to determine unit values. *****
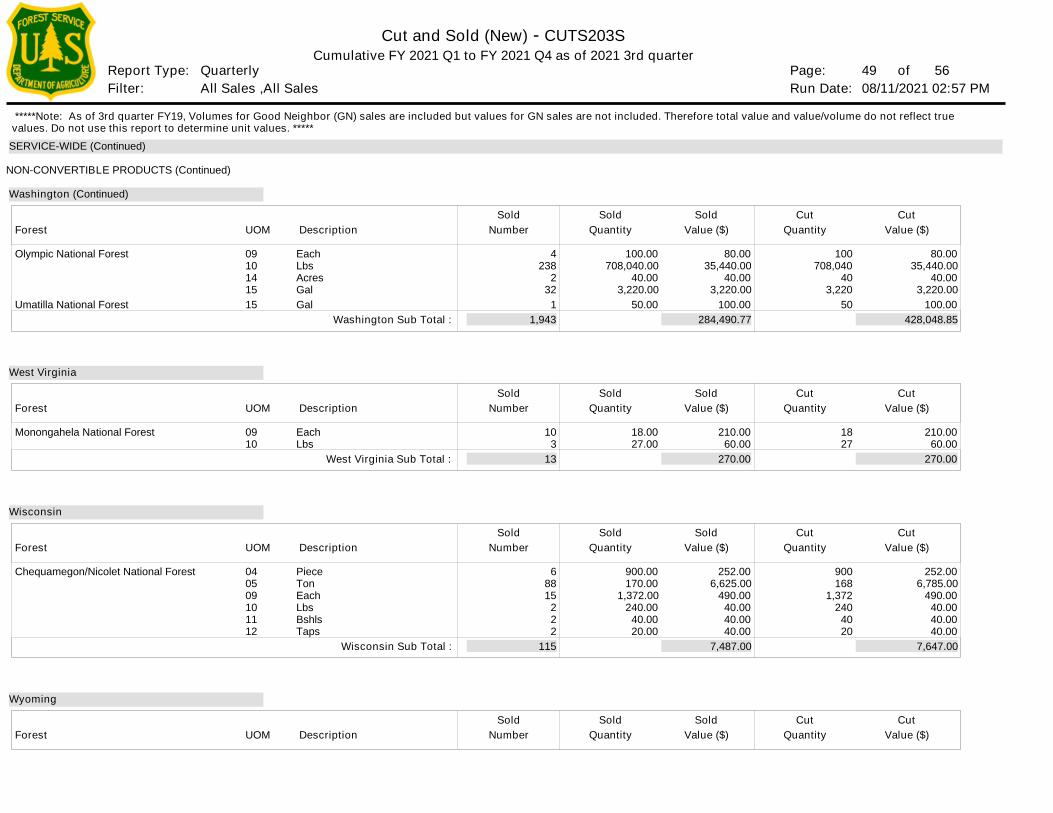
Page: Run Date:Filter:
Report Type:
Cut and Sold (New) - CUTS203S
49 of 08/11/2021 02:57 PM
Cumulative FY 2021 Q1 to FY 2021 Q4 as of 2021 3rd quarter
All Sales ,All Sales Quarterly 56
SERVICE-WIDE (Continued)
Description
Description
Description
Description
0910141515
0910
040509101112
EachLbsAcresGalGal
EachLbs
PieceTonEachLbsBshlsTaps
80.00 35,440.00
40.00 3,220.00
100.00
210.00 60.00
252.00 6,785.00
490.00 40.00 40.00 40.00
100 708,040
40 3,220
50
18 27
900 168
1,372 240
40 20
Quantity
Quantity
Quantity
Quantity
Cut
Cut
Cut
Cut
Value ($)
Value ($)
Value ($)
Value ($)
Cut
Cut
Cut
Cut
80.00 35,440.00
40.00 3,220.00
100.00
210.00 60.00
252.00 6,625.00
490.00 40.00 40.00 40.00
100.00 708,040.00
40.00 3,220.00
50.00
18.00 27.00
900.00 170.00
1,372.00 240.00
40.00 20.00
Quantity
Quantity
Quantity
Quantity
Sold
Sold
Sold
Sold
Value ($)
Value ($)
Value ($)
Value ($)
Sold
Sold
Sold
Sold
284,490.77
270.00
7,487.00
428,048.85
270.00
7,647.00
Olympic National Forest
Umatilla National Forest
Monongahela National Forest
Chequamegon/Nicolet National Forest
UOM
UOM
UOM
UOM
NON-CONVERTIBLE PRODUCTS (Continued)
West Virginia
Wisconsin
Wyoming
Washington (Continued)
Washington Sub Total :
West Virginia Sub Total :
Wisconsin Sub Total :
Forest
Forest
Forest
Forest
Number
Number
Number
Number
4 238
2 32
1
10 3
6 88 15
2 2 2
1,943
13
115
Sold
Sold
Sold
Sold
*****Note: As of 3rd quarter FY19, Volumes for Good Neighbor (GN) sales are included but values for GN sales are not included. Therefore total value and value/volume do not reflect true values. Do not use this report to determine unit values. *****
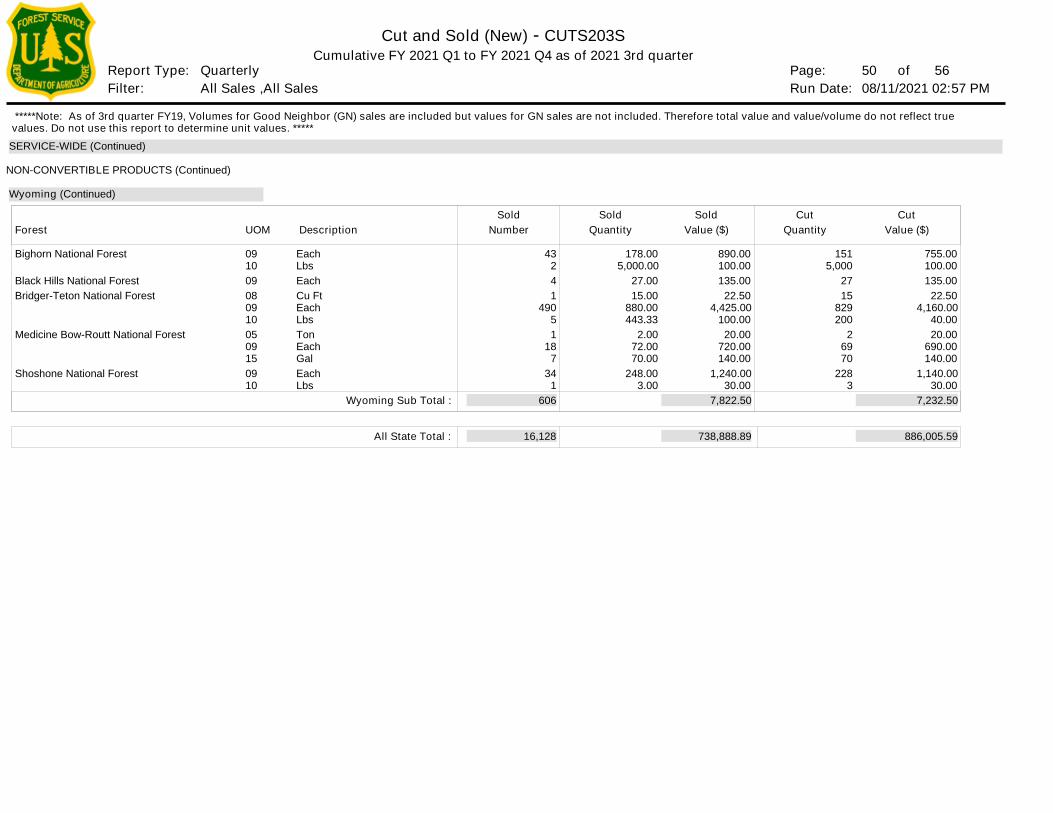
Page: Run Date:Filter:
Report Type:
Cut and Sold (New) - CUTS203S
50 of 08/11/2021 02:57 PM
Cumulative FY 2021 Q1 to FY 2021 Q4 as of 2021 3rd quarter
All Sales ,All Sales Quarterly 56
SERVICE-WIDE (Continued)
Description
0910090809100509150910
EachLbsEachCu FtEachLbsTonEachGalEachLbs
755.00 100.00 135.00
22.50 4,160.00
40.00 20.00
690.00 140.00
1,140.00 30.00
151 5,000
27 15
829 200
2 69 70
228 3
QuantityCut
Value ($)Cut
890.00 100.00 135.00
22.50 4,425.00
100.00 20.00
720.00 140.00
1,240.00 30.00
178.00 5,000.00
27.00 15.00
880.00 443.33
2.00 72.00 70.00
248.00 3.00
QuantitySold
Value ($)Sold
7,822.50 7,232.50
Bighorn National Forest
Black Hills National ForestBridger-Teton National Forest
Medicine Bow-Routt National Forest
Shoshone National Forest
UOM
NON-CONVERTIBLE PRODUCTS (Continued)
Wyoming (Continued)
Wyoming Sub Total :
Forest Number
43 2 4 1
490 5 1
18 7
34 1
606
Sold
738,888.89 886,005.59All State Total : 16,128
*****Note: As of 3rd quarter FY19, Volumes for Good Neighbor (GN) sales are included but values for GN sales are not included. Therefore total value and value/volume do not reflect true values. Do not use this report to determine unit values. *****
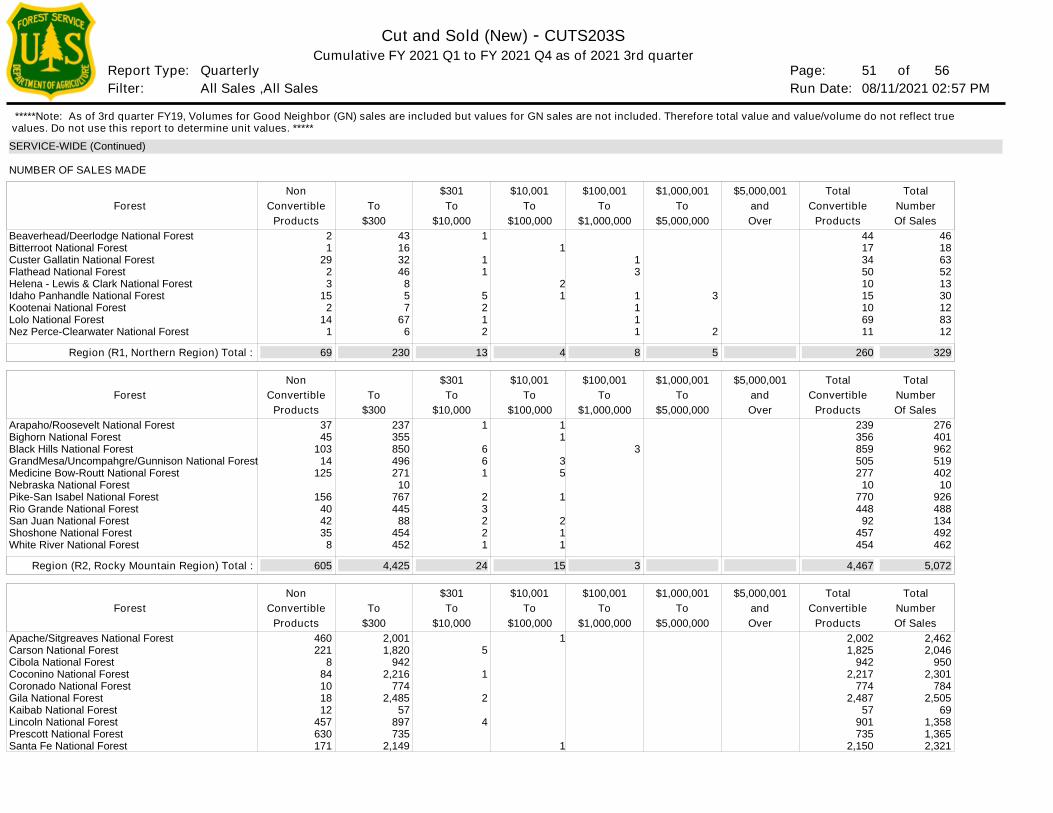
Page: Run Date:Filter:
Report Type:
Cut and Sold (New) - CUTS203S
51 of 08/11/2021 02:57 PM
Cumulative FY 2021 Q1 to FY 2021 Q4 as of 2021 3rd quarter
All Sales ,All Sales Quarterly 56
SERVICE-WIDE (Continued)
Forest
Forest
Forest
and
and
and
Beaverhead/Deerlodge National ForestBitterroot National ForestCuster Gallatin National ForestFlathead National ForestHelena - Lewis & Clark National ForestIdaho Panhandle National ForestKootenai National ForestLolo National ForestNez Perce-Clearwater National Forest
Arapaho/Roosevelt National ForestBighorn National ForestBlack Hills National ForestGrandMesa/Uncompahgre/Gunnison National ForestMedicine Bow-Routt National ForestNebraska National ForestPike-San Isabel National ForestRio Grande National ForestSan Juan National ForestShoshone National ForestWhite River National Forest
Apache/Sitgreaves National ForestCarson National ForestCibola National ForestCoconino National ForestCoronado National ForestGila National ForestKaibab National ForestLincoln National ForestPrescott National ForestSanta Fe National Forest
46 18 63 52 13 30 12 83 12
276 401 962 519 402
10 926 488 134 492 462
2,462 2,046
950 2,301
784 2,505
69 1,358 1,365 2,321
44 17 34 50 10 15 10 69 11
239 356 859 505 277
10 770 448
92 457 454
2,002 1,825
942 2,217
774 2,487
57 901 735
2,150
Products
Products
Products
Over
Over
Over
Region (R1, Northern Region) Total :
Region (R2, Rocky Mountain Region) Total :
$5,000,001
$5,000,001
$5,000,001
Convertible
Convertible
Convertible
Total
Total
Total
Number
Number
Number
Total
Total
Total
260
4,467
329
5,072
Of Sales
Of Sales
Of Sales
To
To
To
$5,000,000
$5,000,000
$5,000,000
3
2
$1,000,001
$1,000,001
$1,000,001
5
To
To
To
$1,000,000
$1,000,000
$1,000,000
1 3
1 1 1 1
3
$100,001
$100,001
$100,001
8
3
To
To
To
$100,000
$100,000
$100,000
1
2 1
1 1
3 5
1
2 1 1
1
1
$10,001
$10,001
$10,001
4
15
To
To
To
$10,000
$10,000
$10,000
1
1 1
5 2 1 2
1
6 6 1
2 3 2 2 1
5
1
2
4
$301
$301
$301
13
24
To
To
To
$300
$300
$300
43 16 32 46
8 5 7
67 6
237 355 850 496 271
10 767 445
88 454 452
2,001 1,820
942 2,216
774 2,485
57 897 735
2,149
230
4,425
Convertible
Convertible
Convertible
Products
Products
Products
2 1
29 2 3
15 2
14 1
37 45
103 14
125
156 40 42 35
8
460 221
8 84 10 18 12
457 630 171
Non
Non
Non
69
605
NUMBER OF SALES MADE
*****Note: As of 3rd quarter FY19, Volumes for Good Neighbor (GN) sales are included but values for GN sales are not included. Therefore total value and value/volume do not reflect true values. Do not use this report to determine unit values. *****
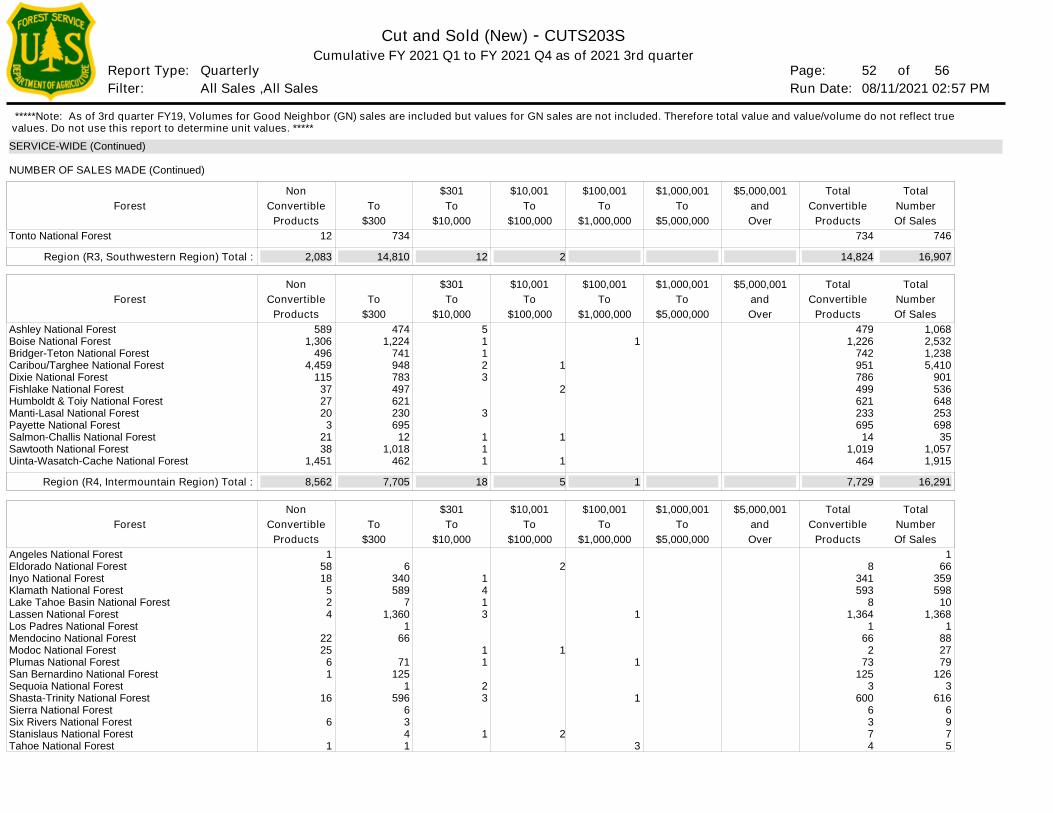
Page: Run Date:Filter:
Report Type:
Cut and Sold (New) - CUTS203S
52 of 08/11/2021 02:57 PM
Cumulative FY 2021 Q1 to FY 2021 Q4 as of 2021 3rd quarter
All Sales ,All Sales Quarterly 56
SERVICE-WIDE (Continued)
Forest
Forest
Forest
and
and
and
Tonto National Forest
Ashley National ForestBoise National ForestBridger-Teton National ForestCaribou/Targhee National ForestDixie National ForestFishlake National ForestHumboldt & Toiy National ForestManti-Lasal National ForestPayette National ForestSalmon-Challis National ForestSawtooth National ForestUinta-Wasatch-Cache National Forest
Angeles National ForestEldorado National ForestInyo National ForestKlamath National ForestLake Tahoe Basin National ForestLassen National ForestLos Padres National ForestMendocino National ForestModoc National ForestPlumas National ForestSan Bernardino National ForestSequoia National ForestShasta-Trinity National ForestSierra National ForestSix Rivers National ForestStanislaus National ForestTahoe National Forest
746
1,068 2,532 1,238 5,410
901 536 648 253 698
35 1,057 1,915
1 66
359 598
10 1,368
1 88 27 79
126 3
616 6 9 7 5
734
479 1,226
742 951 786 499 621 233 695
14 1,019
464
8
341 593
8 1,364
1 66
2 73
125 3
600 6 3 7 4
Products
Products
Products
Over
Over
Over
Region (R3, Southwestern Region) Total :
Region (R4, Intermountain Region) Total :
$5,000,001
$5,000,001
$5,000,001
Convertible
Convertible
Convertible
Total
Total
Total
Number
Number
Number
Total
Total
Total
14,824
7,729
16,907
16,291
Of Sales
Of Sales
Of Sales
To
To
To
$5,000,000
$5,000,000
$5,000,000
$1,000,001
$1,000,001
$1,000,001
To
To
To
$1,000,000
$1,000,000
$1,000,000
1
1
1
1
3
$100,001
$100,001
$100,001
1
To
To
To
$100,000
$100,000
$100,000
1
2
1
1
2
1
2
$10,001
$10,001
$10,001
2
5
To
To
To
$10,000
$10,000
$10,000
5 1 1 2 3
3
1 1 1
1 4 1 3
1 1
2 3
1
$301
$301
$301
12
18
To
To
To
$300
$300
$300
734
474 1,224
741 948 783 497 621 230 695
12 1,018
462
6 340 589
7 1,360
1 66
71 125
1 596
6 3 4 1
14,810
7,705
Convertible
Convertible
Convertible
Products
Products
Products
12
589 1,306
496 4,459
115 37 27 20
3 21 38
1,451
1 58 18
5 2 4
22 25
6 1
16
6
1
Non
Non
Non
2,083
8,562
NUMBER OF SALES MADE (Continued)
*****Note: As of 3rd quarter FY19, Volumes for Good Neighbor (GN) sales are included but values for GN sales are not included. Therefore total value and value/volume do not reflect true values. Do not use this report to determine unit values. *****
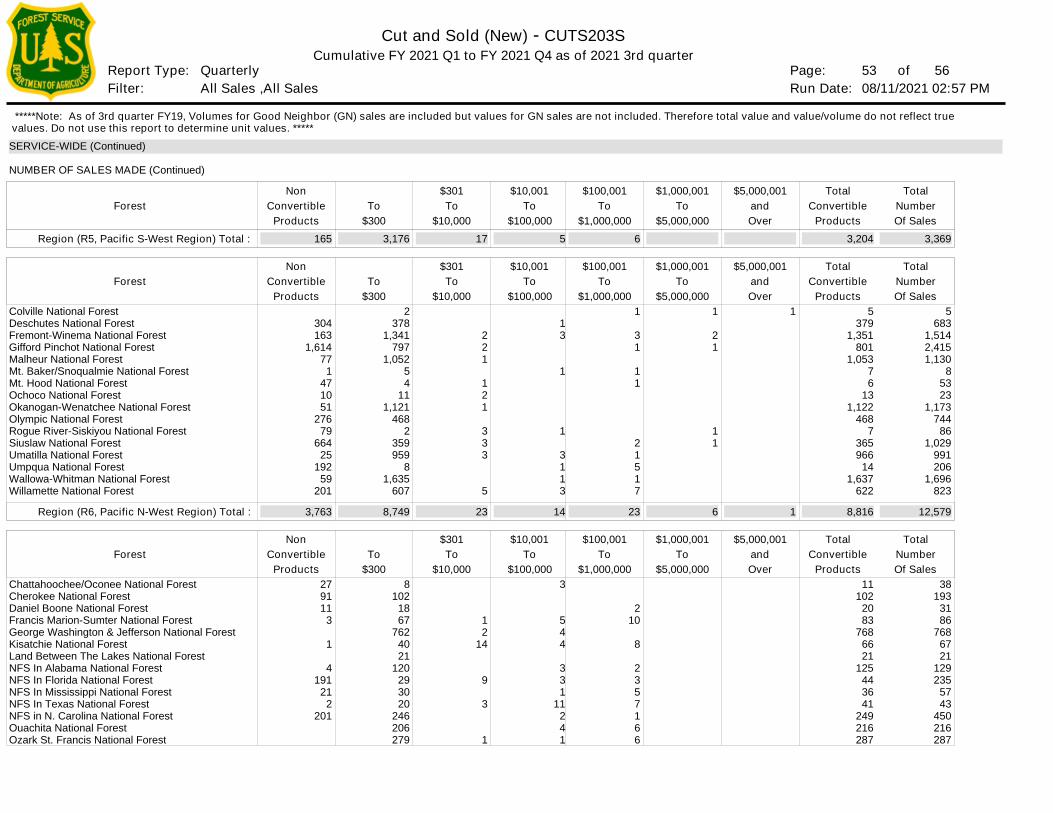
Page: Run Date:Filter:
Report Type:
Cut and Sold (New) - CUTS203S
53 of 08/11/2021 02:57 PM
Cumulative FY 2021 Q1 to FY 2021 Q4 as of 2021 3rd quarter
All Sales ,All Sales Quarterly 56
SERVICE-WIDE (Continued)
Forest
Forest
Forest
and
and
and
Colville National ForestDeschutes National ForestFremont-Winema National ForestGifford Pinchot National ForestMalheur National ForestMt. Baker/Snoqualmie National ForestMt. Hood National ForestOchoco National ForestOkanogan-Wenatchee National ForestOlympic National ForestRogue River-Siskiyou National ForestSiuslaw National ForestUmatilla National ForestUmpqua National ForestWallowa-Whitman National ForestWillamette National Forest
Chattahoochee/Oconee National ForestCherokee National ForestDaniel Boone National ForestFrancis Marion-Sumter National ForestGeorge Washington & Jefferson National ForestKisatchie National ForestLand Between The Lakes National ForestNFS In Alabama National ForestNFS In Florida National ForestNFS In Mississippi National ForestNFS In Texas National ForestNFS in N. Carolina National ForestOuachita National ForestOzark St. Francis National Forest
5 683
1,514 2,415 1,130
8 53 23
1,173 744
86 1,029
991 206
1,696 823
38 193
31 86
768 67 21
129 235
57 43
450 216 287
5 379
1,351 801
1,053 7 6
13 1,122
468 7
365 966
14 1,637
622
11 102
20 83
768 66 21
125 44 36 41
249 216 287
Products
Products
Products
Over
Over
Over
1
Region (R5, Pacific S-West Region) Total :
Region (R6, Pacific N-West Region) Total :
$5,000,001
$5,000,001
$5,000,001
Convertible
Convertible
Convertible
Total
Total
Total
Number
Number
Number
Total
Total
Total
1
3,204
8,816
3,369
12,579
Of Sales
Of Sales
Of Sales
To
To
To
$5,000,000
$5,000,000
$5,000,000
1
2 1
1 1
$1,000,001
$1,000,001
$1,000,001
6
To
To
To
$1,000,000
$1,000,000
$1,000,000
1
3 1
1 1
2 1 5 1 7
2 10
8
2 3 5 7 1 6 6
$100,001
$100,001
$100,001
6
23
To
To
To
$100,000
$100,000
$100,000
1 3
1
1
3 1 1 3
3
5 4 4
3 3 1
11 2 4 1
$10,001
$10,001
$10,001
5
14
To
To
To
$10,000
$10,000
$10,000
2 2 1
1 2 1
3 3 3
5
1 2
14
9
3
1
$301
$301
$301
17
23
To
To
To
$300
$300
$300
2 378
1,341 797
1,052 5 4
11 1,121
468 2
359 959
8 1,635
607
8 102
18 67
762 40 21
120 29 30 20
246 206 279
3,176
8,749
Convertible
Convertible
Convertible
Products
Products
Products
304 163
1,614 77
1 47 10 51
276 79
664 25
192 59
201
27 91 11
3
1
4 191
21 2
201
Non
Non
Non
165
3,763
NUMBER OF SALES MADE (Continued)
*****Note: As of 3rd quarter FY19, Volumes for Good Neighbor (GN) sales are included but values for GN sales are not included. Therefore total value and value/volume do not reflect true values. Do not use this report to determine unit values. *****
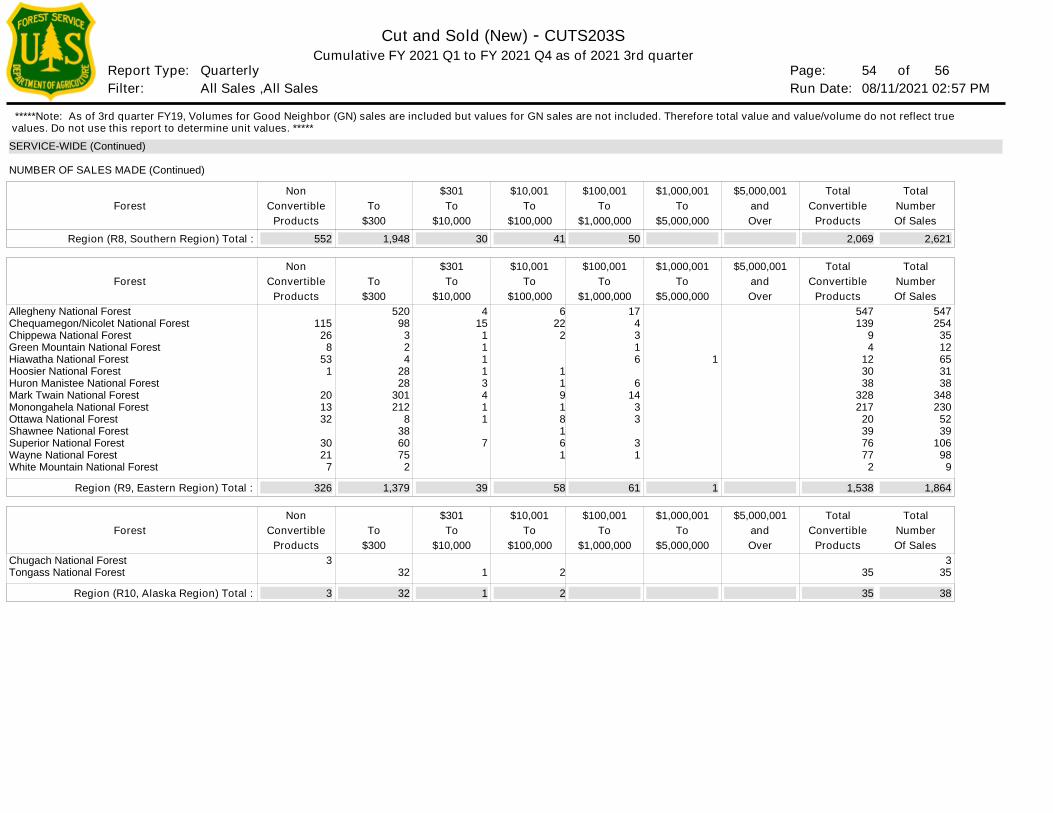
Page: Run Date:Filter:
Report Type:
Cut and Sold (New) - CUTS203S
54 of 08/11/2021 02:57 PM
Cumulative FY 2021 Q1 to FY 2021 Q4 as of 2021 3rd quarter
All Sales ,All Sales Quarterly 56
SERVICE-WIDE (Continued)
Forest
Forest
Forest
and
and
and
Allegheny National ForestChequamegon/Nicolet National ForestChippewa National ForestGreen Mountain National ForestHiawatha National ForestHoosier National ForestHuron Manistee National ForestMark Twain National ForestMonongahela National ForestOttawa National ForestShawnee National ForestSuperior National ForestWayne National ForestWhite Mountain National Forest
Chugach National ForestTongass National Forest
547 254
35 12 65 31 38
348 230
52 39
106 98
9
3 35
547 139
9 4
12 30 38
328 217
20 39 76 77
2
35
Products
Products
Products
Over
Over
Over
Region (R8, Southern Region) Total :
Region (R9, Eastern Region) Total :
Region (R10, Alaska Region) Total :
$5,000,001
$5,000,001
$5,000,001
Convertible
Convertible
Convertible
Total
Total
Total
Number
Number
Number
Total
Total
Total
2,069
1,538
35
2,621
1,864
38
Of Sales
Of Sales
Of Sales
To
To
To
$5,000,000
$5,000,000
$5,000,000
1
$1,000,001
$1,000,001
$1,000,001
1
To
To
To
$1,000,000
$1,000,000
$1,000,000
17 4 3 1 6
6 14
3 3
3 1
$100,001
$100,001
$100,001
50
61
To
To
To
$100,000
$100,000
$100,000
6 22
2
1 1 9 1 8 1 6 1
2
$10,001
$10,001
$10,001
41
58
2
To
To
To
$10,000
$10,000
$10,000
4 15
1 1 1 1 3 4 1 1
7
1
$301
$301
$301
30
39
1
To
To
To
$300
$300
$300
520 98
3 2 4
28 28
301 212
8 38 60 75
2
32
1,948
1,379
32
Convertible
Convertible
Convertible
Products
Products
Products
115 26
8 53
1
20 13 32
30 21
7
3
Non
Non
Non
552
326
3
NUMBER OF SALES MADE (Continued)
*****Note: As of 3rd quarter FY19, Volumes for Good Neighbor (GN) sales are included but values for GN sales are not included. Therefore total value and value/volume do not reflect true values. Do not use this report to determine unit values. *****
Page: Run Date:Filter:
Report Type:
Cut and Sold (New) - CUTS203S
55 of 08/11/2021 02:57 PM
Cumulative FY 2021 Q1 to FY 2021 Q4 as of 2021 3rd quarter
All Sales ,All Sales Quarterly 56
*** Legend for CUTS203 is Under Construction ***
REPORT LEGENDConvertible Products
*****Note: As of 3rd quarter FY19, Volumes for Good Neighbor (GN) sales are included but values for GN sales are not included. Therefore total value and value/volume do not reflect true values. Do not use this report to determine unit values. *****
Page: Run Date:Filter:
Report Type:
Cut and Sold (New) - CUTS203S
56 of 08/11/2021 02:57 PM
Cumulative FY 2021 Q1 to FY 2021 Q4 as of 2021 3rd quarter
All Sales ,All Sales Quarterly 56
Where (report_date between to_date('10/01/2020 00:00:00','mm/dd/yyyy hh24:mi:ss') and to_date('09/30/2021 23:59:59','mm/dd/yyyy hh24:mi:ss')) and 1=1 and stewardship_indicator in ('N','Y') and good_neighbor_auth_indicator in ('N','Y') and (SNAPSHOT_FISCAL_YEAR = '2021' AND SNAPSHOT_QUARTER = '3')
Where Clause:
Sorting Criteria:
End of Report
*****Note: As of 3rd quarter FY19, Volumes for Good Neighbor (GN) sales are included but values for GN sales are not included. Therefore total value and value/volume do not reflect true values. Do not use this report to determine unit values. *****